Zip Codes with the Highest Percentage of Population Employed in Administrative & Support Services in Chambersburg, PA
RELATED REPORTS & OPTIONS
Administrative & Support Services
Chambersburg
Compare Zip Codes
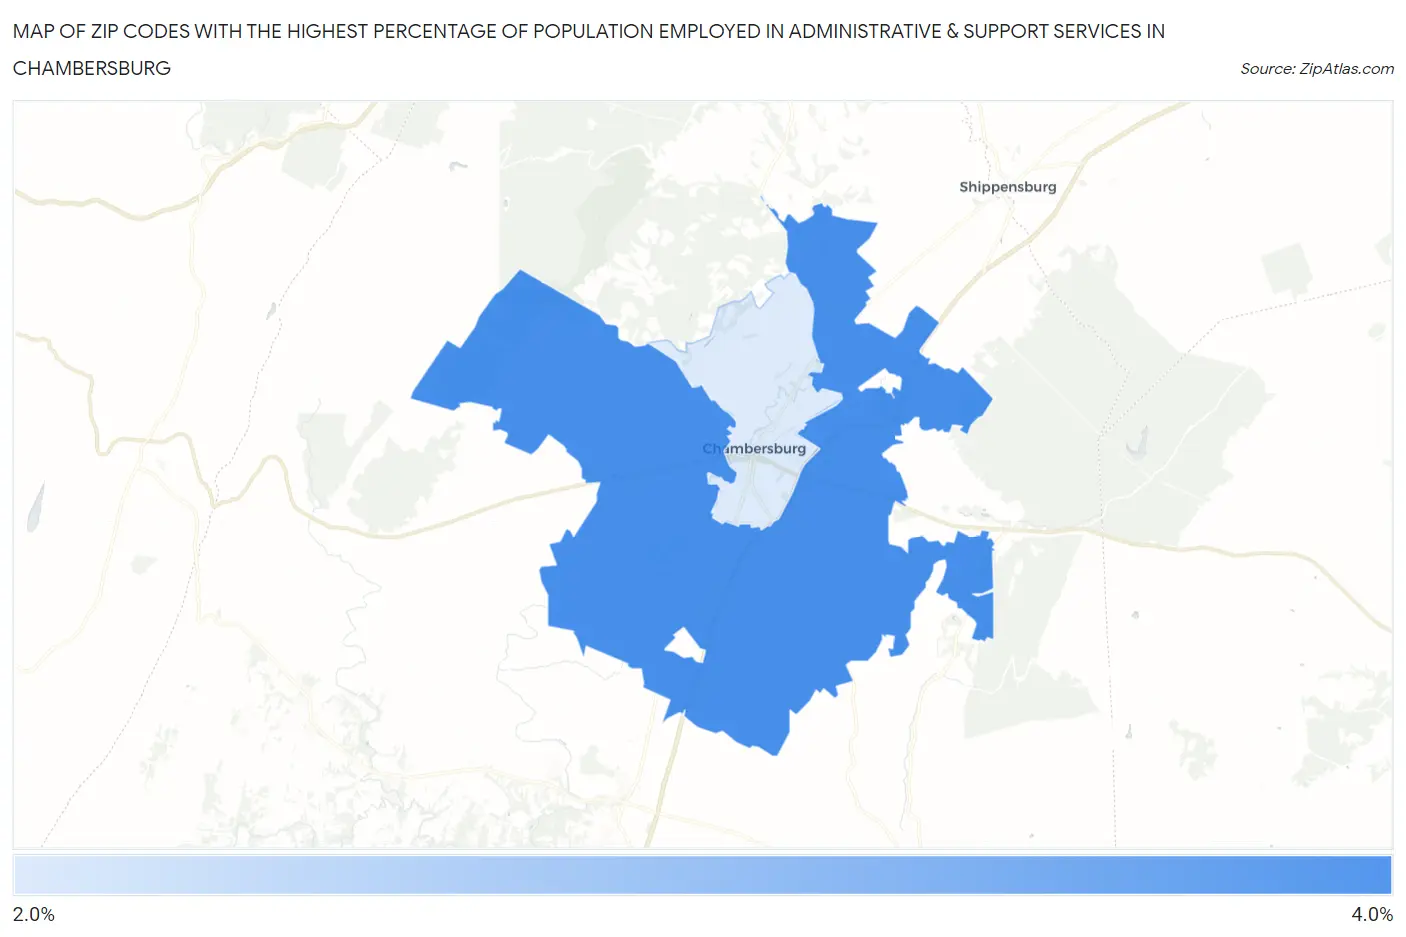
Map of Zip Codes with the Highest Percentage of Population Employed in Administrative & Support Services in Chambersburg
2.9%
4.0%
Zip Codes with the Highest Percentage of Population Employed in Administrative & Support Services in Chambersburg, PA
| Zip Code | % Employed | vs State | vs National | |
| 1. | 17202 | 4.0% | 3.6%(+0.368)#518 | 4.1%(-0.197)#10,885 |
| 2. | 17201 | 2.9% | 3.6%(-0.710)#844 | 4.1%(-1.27)#16,119 |
1
Common Questions
What are the Top Zip Codes with the Highest Percentage of Population Employed in Administrative & Support Services in Chambersburg, PA?
Top Zip Codes with the Highest Percentage of Population Employed in Administrative & Support Services in Chambersburg, PA are:
What zip code has the Highest Percentage of Population Employed in Administrative & Support Services in Chambersburg, PA?
17202 has the Highest Percentage of Population Employed in Administrative & Support Services in Chambersburg, PA with 4.0%.
What is the Percentage of Population Employed in Administrative & Support Services in Pennsylvania?
Percentage of Population Employed in Administrative & Support Services in Pennsylvania is 3.6%.
What is the Percentage of Population Employed in Administrative & Support Services in the United States?
Percentage of Population Employed in Administrative & Support Services in the United States is 4.1%.