Cities with the Highest Percentage of Population Employed in Administrative & Support Services in Montana
RELATED REPORTS & OPTIONS
Administrative & Support Services
Montana
Compare Cities
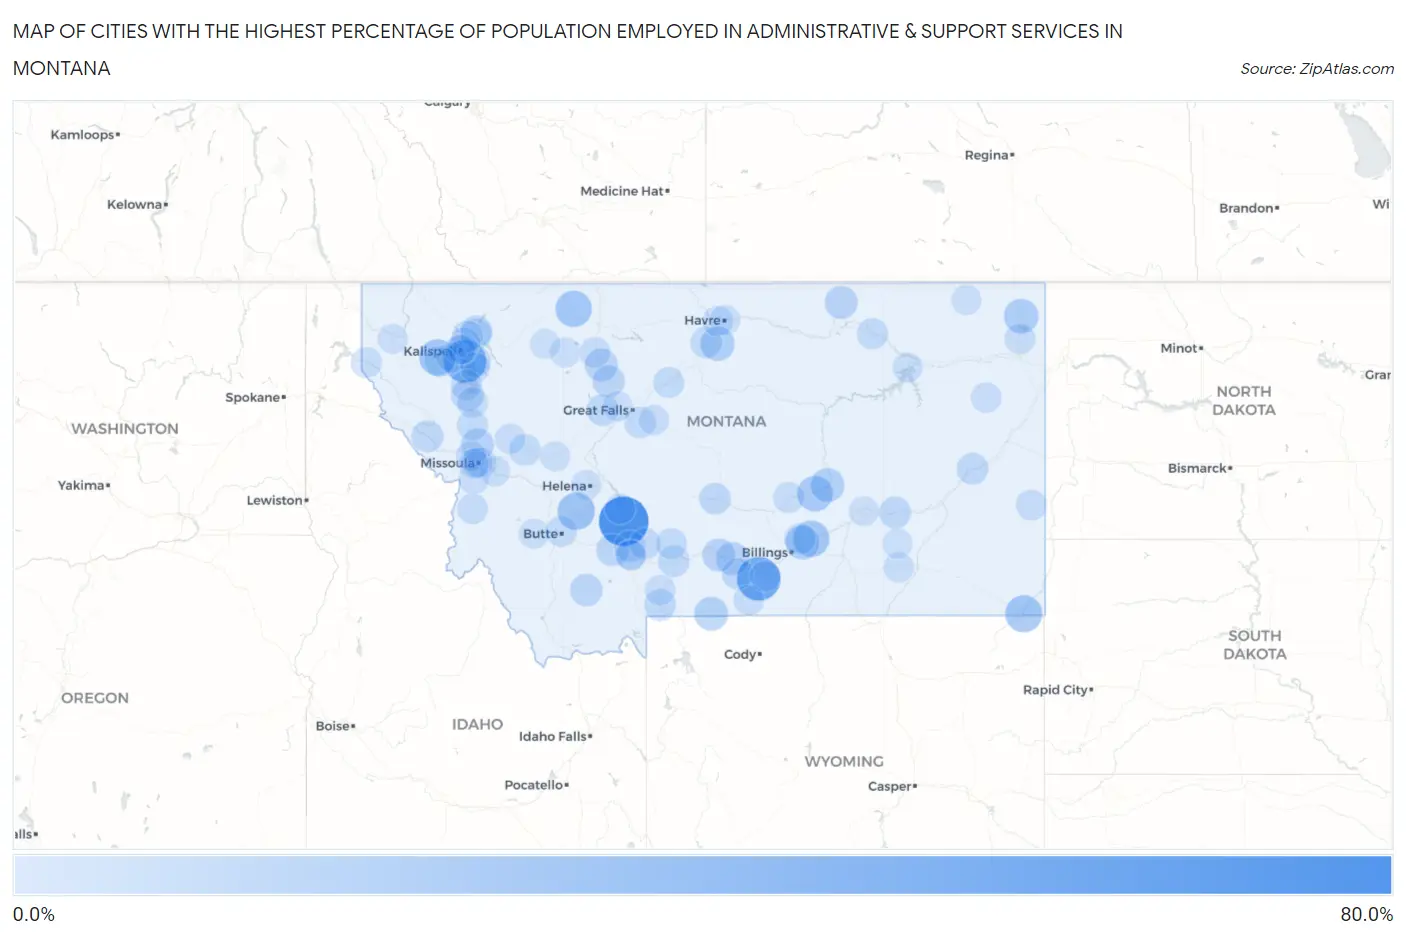
Map of Cities with the Highest Percentage of Population Employed in Administrative & Support Services in Montana
0.0%
80.0%
Cities with the Highest Percentage of Population Employed in Administrative & Support Services in Montana
| City | % Employed | vs State | vs National | |
| 1. | Toston | 77.1% | 3.3%(+73.9)#1 | 4.1%(+73.0)#17 |
| 2. | Boyd | 54.5% | 3.3%(+51.3)#2 | 4.1%(+50.4)#42 |
| 3. | Somers | 50.0% | 3.3%(+46.7)#3 | 4.1%(+45.9)#56 |
| 4. | Pendroy | 42.9% | 3.3%(+39.6)#4 | 4.1%(+38.7)#90 |
| 5. | Jackson | 40.0% | 3.3%(+36.7)#5 | 4.1%(+35.9)#109 |
| 6. | Basin | 30.0% | 3.3%(+26.7)#6 | 4.1%(+25.9)#184 |
| 7. | Alzada | 28.6% | 3.3%(+25.3)#7 | 4.1%(+24.4)#218 |
| 8. | Little Bitterroot Lake | 26.9% | 3.3%(+23.7)#8 | 4.1%(+22.8)#239 |
| 9. | Santa Rita | 26.3% | 3.3%(+23.0)#9 | 4.1%(+22.2)#254 |
| 10. | Ballantine | 26.3% | 3.3%(+23.0)#10 | 4.1%(+22.1)#256 |
| 11. | Montaqua | 24.6% | 3.3%(+21.3)#11 | 4.1%(+20.4)#296 |
| 12. | Hall | 23.1% | 3.3%(+19.8)#12 | 4.1%(+18.9)#341 |
| 13. | Musselshell | 23.1% | 3.3%(+19.8)#13 | 4.1%(+18.9)#342 |
| 14. | Reserve | 20.0% | 3.3%(+16.7)#14 | 4.1%(+15.9)#442 |
| 15. | Rimini | 18.9% | 3.3%(+15.6)#15 | 4.1%(+14.7)#491 |
| 16. | Sangrey | 18.2% | 3.3%(+14.9)#16 | 4.1%(+14.0)#530 |
| 17. | Huntley | 18.0% | 3.3%(+14.8)#17 | 4.1%(+13.9)#542 |
| 18. | Cooke City | 17.4% | 3.3%(+14.1)#18 | 4.1%(+13.2)#584 |
| 19. | Melstone | 17.1% | 3.3%(+13.8)#19 | 4.1%(+12.9)#603 |
| 20. | Reed Point | 15.1% | 3.3%(+11.9)#20 | 4.1%(+11.0)#780 |
| 21. | Evaro | 14.5% | 3.3%(+11.2)#21 | 4.1%(+10.3)#863 |
| 22. | Brady | 14.0% | 3.3%(+10.7)#22 | 4.1%(+9.80)#952 |
| 23. | Greycliff | 13.8% | 3.3%(+10.5)#23 | 4.1%(+9.60)#984 |
| 24. | Whitewater | 13.5% | 3.3%(+10.2)#24 | 4.1%(+9.31)#1,041 |
| 25. | Unionville | 12.5% | 3.3%(+9.23)#25 | 4.1%(+8.35)#1,205 |
| 26. | Alder | 12.3% | 3.3%(+9.01)#26 | 4.1%(+8.13)#1,249 |
| 27. | Willow Creek | 12.2% | 3.3%(+8.98)#27 | 4.1%(+8.10)#1,256 |
| 28. | Kerr | 12.1% | 3.3%(+8.82)#28 | 4.1%(+7.94)#1,294 |
| 29. | Dutton | 11.3% | 3.3%(+8.02)#29 | 4.1%(+7.14)#1,468 |
| 30. | Essex | 10.3% | 3.3%(+7.08)#30 | 4.1%(+6.20)#1,769 |
| 31. | Forsyth | 10.2% | 3.3%(+6.95)#31 | 4.1%(+6.07)#1,810 |
| 32. | Superior | 10.1% | 3.3%(+6.84)#32 | 4.1%(+5.95)#1,855 |
| 33. | Coram | 9.8% | 3.3%(+6.54)#33 | 4.1%(+5.65)#1,989 |
| 34. | Fort Shaw | 9.7% | 3.3%(+6.41)#34 | 4.1%(+5.53)#2,044 |
| 35. | Terry | 9.5% | 3.3%(+6.26)#35 | 4.1%(+5.37)#2,106 |
| 36. | Harlowton | 9.5% | 3.3%(+6.23)#36 | 4.1%(+5.35)#2,124 |
| 37. | Corwin Springs | 9.3% | 3.3%(+6.06)#37 | 4.1%(+5.17)#2,202 |
| 38. | Rocky Boy West | 9.1% | 3.3%(+5.82)#38 | 4.1%(+4.94)#2,311 |
| 39. | Livingston | 9.0% | 3.3%(+5.77)#39 | 4.1%(+4.88)#2,359 |
| 40. | Rockvale | 9.0% | 3.3%(+5.74)#40 | 4.1%(+4.86)#2,373 |
| 41. | Ovando | 8.7% | 3.3%(+5.43)#41 | 4.1%(+4.55)#2,562 |
| 42. | Bigfork | 8.6% | 3.3%(+5.36)#42 | 4.1%(+4.47)#2,605 |
| 43. | Manhattan | 8.3% | 3.3%(+4.99)#43 | 4.1%(+4.10)#2,832 |
| 44. | Absarokee | 8.2% | 3.3%(+4.93)#44 | 4.1%(+4.05)#2,873 |
| 45. | Springhill | 8.1% | 3.3%(+4.80)#45 | 4.1%(+3.91)#2,955 |
| 46. | Stockett | 7.9% | 3.3%(+4.67)#46 | 4.1%(+3.79)#3,043 |
| 47. | Hinsdale | 7.9% | 3.3%(+4.65)#47 | 4.1%(+3.76)#3,058 |
| 48. | Marion | 7.9% | 3.3%(+4.63)#48 | 4.1%(+3.75)#3,064 |
| 49. | Clyde Park | 7.9% | 3.3%(+4.61)#49 | 4.1%(+3.73)#3,086 |
| 50. | Shepherd | 7.9% | 3.3%(+4.59)#50 | 4.1%(+3.71)#3,107 |
| 51. | Walkerville | 7.4% | 3.3%(+4.18)#51 | 4.1%(+3.29)#3,458 |
| 52. | St. Mary | 7.4% | 3.3%(+4.14)#52 | 4.1%(+3.26)#3,491 |
| 53. | St Ignatius | 7.4% | 3.3%(+4.10)#53 | 4.1%(+3.21)#3,533 |
| 54. | Martin City | 7.4% | 3.3%(+4.10)#54 | 4.1%(+3.21)#3,534 |
| 55. | Columbia Falls | 7.1% | 3.3%(+3.82)#55 | 4.1%(+2.93)#3,809 |
| 56. | Fort Benton | 6.8% | 3.3%(+3.56)#56 | 4.1%(+2.67)#4,071 |
| 57. | Roundup | 6.7% | 3.3%(+3.43)#57 | 4.1%(+2.55)#4,191 |
| 58. | Lindisfarne | 6.7% | 3.3%(+3.42)#58 | 4.1%(+2.54)#4,198 |
| 59. | Heron | 6.2% | 3.3%(+2.98)#59 | 4.1%(+2.10)#4,764 |
| 60. | Conrad | 6.1% | 3.3%(+2.84)#60 | 4.1%(+1.96)#4,962 |
| 61. | Baker | 6.1% | 3.3%(+2.81)#61 | 4.1%(+1.92)#5,019 |
| 62. | York | 6.0% | 3.3%(+2.69)#62 | 4.1%(+1.80)#5,228 |
| 63. | Corvallis | 5.8% | 3.3%(+2.55)#63 | 4.1%(+1.67)#5,426 |
| 64. | Joliet | 5.8% | 3.3%(+2.54)#64 | 4.1%(+1.66)#5,447 |
| 65. | East Missoula | 5.8% | 3.3%(+2.49)#65 | 4.1%(+1.60)#5,530 |
| 66. | Pablo | 5.6% | 3.3%(+2.34)#66 | 4.1%(+1.46)#5,780 |
| 67. | Froid | 5.6% | 3.3%(+2.34)#67 | 4.1%(+1.46)#5,783 |
| 68. | Red Lodge | 5.6% | 3.3%(+2.32)#68 | 4.1%(+1.44)#5,826 |
| 69. | South Glastonbury | 5.5% | 3.3%(+2.19)#69 | 4.1%(+1.30)#6,088 |
| 70. | Carlton | 5.4% | 3.3%(+2.13)#70 | 4.1%(+1.24)#6,205 |
| 71. | Townsend | 5.1% | 3.3%(+1.88)#71 | 4.1%(+1.000)#6,712 |
| 72. | Amsterdam | 5.0% | 3.3%(+1.73)#72 | 4.1%(+0.850)#7,061 |
| 73. | Richey | 5.0% | 3.3%(+1.70)#73 | 4.1%(+0.815)#7,135 |
| 74. | Missoula | 4.9% | 3.3%(+1.62)#74 | 4.1%(+0.735)#7,318 |
| 75. | Wye | 4.7% | 3.3%(+1.44)#75 | 4.1%(+0.558)#7,762 |
| 76. | Beaver Creek | 4.6% | 3.3%(+1.31)#76 | 4.1%(+0.430)#8,088 |
| 77. | Belt | 4.6% | 3.3%(+1.30)#77 | 4.1%(+0.412)#8,140 |
| 78. | Fort Peck | 4.5% | 3.3%(+1.24)#78 | 4.1%(+0.355)#8,291 |
| 79. | Churchill | 4.5% | 3.3%(+1.19)#79 | 4.1%(+0.311)#8,411 |
| 80. | Kila | 4.4% | 3.3%(+1.15)#80 | 4.1%(+0.262)#8,553 |
| 81. | Lame Deer | 4.4% | 3.3%(+1.14)#81 | 4.1%(+0.259)#8,571 |
| 82. | Seeley Lake | 4.3% | 3.3%(+1.04)#82 | 4.1%(+0.151)#8,922 |
| 83. | Clinton | 4.2% | 3.3%(+0.978)#83 | 4.1%(+0.094)#9,091 |
| 84. | Lincoln | 4.2% | 3.3%(+0.953)#84 | 4.1%(+0.070)#9,167 |
| 85. | Orchard Homes | 4.2% | 3.3%(+0.923)#85 | 4.1%(+0.039)#9,258 |
| 86. | Havre North | 4.1% | 3.3%(+0.809)#86 | 4.1%(-0.075)#9,604 |
| 87. | Vaughn | 4.0% | 3.3%(+0.768)#87 | 4.1%(-0.116)#9,731 |
| 88. | Dupuyer | 4.0% | 3.3%(+0.734)#88 | 4.1%(-0.150)#9,866 |
| 89. | Heart Butte | 3.9% | 3.3%(+0.681)#89 | 4.1%(-0.202)#10,034 |
| 90. | Helena Flats | 3.9% | 3.3%(+0.677)#90 | 4.1%(-0.207)#10,049 |
| 91. | Anaconda Deer Lodge County | 3.9% | 3.3%(+0.656)#91 | 4.1%(-0.228)#10,104 |
| 92. | Hysham | 3.9% | 3.3%(+0.617)#92 | 4.1%(-0.266)#10,234 |
| 93. | Woods Bay | 3.8% | 3.3%(+0.553)#93 | 4.1%(-0.331)#10,449 |
| 94. | White Haven | 3.8% | 3.3%(+0.527)#94 | 4.1%(-0.357)#10,538 |
| 95. | Pine Creek | 3.7% | 3.3%(+0.484)#95 | 4.1%(-0.400)#10,702 |
| 96. | Evergreen | 3.7% | 3.3%(+0.478)#96 | 4.1%(-0.406)#10,716 |
| 97. | Scobey | 3.7% | 3.3%(+0.475)#97 | 4.1%(-0.409)#10,725 |
| 98. | Kalispell | 3.7% | 3.3%(+0.444)#98 | 4.1%(-0.440)#10,831 |
| 99. | Helena West Side | 3.7% | 3.3%(+0.438)#99 | 4.1%(-0.446)#10,848 |
| 100. | Colstrip | 3.7% | 3.3%(+0.415)#100 | 4.1%(-0.468)#10,937 |
Common Questions
What are the Top 10 Cities with the Highest Percentage of Population Employed in Administrative & Support Services in Montana?
Top 10 Cities with the Highest Percentage of Population Employed in Administrative & Support Services in Montana are:
#1
77.1%
#2
54.5%
#3
50.0%
#4
30.0%
#5
28.6%
#6
26.9%
#7
26.3%
#8
26.3%
#9
23.1%
#10
20.0%
What city has the Highest Percentage of Population Employed in Administrative & Support Services in Montana?
Toston has the Highest Percentage of Population Employed in Administrative & Support Services in Montana with 77.1%.
What is the Percentage of Population Employed in Administrative & Support Services in the State of Montana?
Percentage of Population Employed in Administrative & Support Services in Montana is 3.3%.
What is the Percentage of Population Employed in Administrative & Support Services in the United States?
Percentage of Population Employed in Administrative & Support Services in the United States is 4.1%.