Wesleyville borough, PA Map & Demographics
Wesleyville borough Overview
$25,255
PER CAPITA INCOME
$55,607
AVG FAMILY INCOME
$44,417
AVG HOUSEHOLD INCOME
16.9%
WAGE / INCOME GAP [ % ]
83.1¢/ $1
WAGE / INCOME GAP [ $ ]
$9,852
FAMILY INCOME DEFICIT
0.45
INEQUALITY / GINI INDEX
3,209
TOTAL POPULATION
1,562
MALE POPULATION
1,647
FEMALE POPULATION
94.84
MALES / 100 FEMALES
105.44
FEMALES / 100 MALES
36.9
MEDIAN AGE
3.2
AVG FAMILY SIZE
2.4
AVG HOUSEHOLD SIZE
1,634
LABOR FORCE [ PEOPLE ]
65.3%
PERCENT IN LABOR FORCE
7.8%
UNEMPLOYMENT RATE
Income in Wesleyville borough
Income Overview in Wesleyville borough
Per Capita Income in Wesleyville borough is $25,255, while median incomes of families and households are $55,607 and $44,417 respectively.
| Characteristic | Number | Measure |
| Per Capita Income | 3,209 | $25,255 |
| Median Family Income | 797 | $55,607 |
| Mean Family Income | 797 | $58,268 |
| Median Household Income | 1,336 | $44,417 |
| Mean Household Income | 1,336 | $60,082 |
| Income Deficit | 797 | $9,852 |
| Wage / Income Gap (%) | 3,209 | 16.94% |
| Wage / Income Gap ($) | 3,209 | 83.06¢ per $1 |
| Gini / Inequality Index | 3,209 | 0.45 |
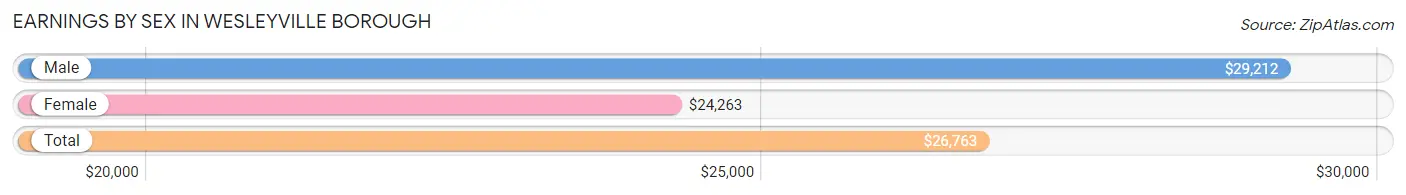
Earnings by Sex in Wesleyville borough
Average Earnings in Wesleyville borough are $26,763, $29,212 for men and $24,263 for women, a difference of 16.9%.
| Sex | Number | Average Earnings |
| Male | 937 (55.0%) | $29,212 |
| Female | 767 (45.0%) | $24,263 |
| Total | 1,704 (100.0%) | $26,763 |
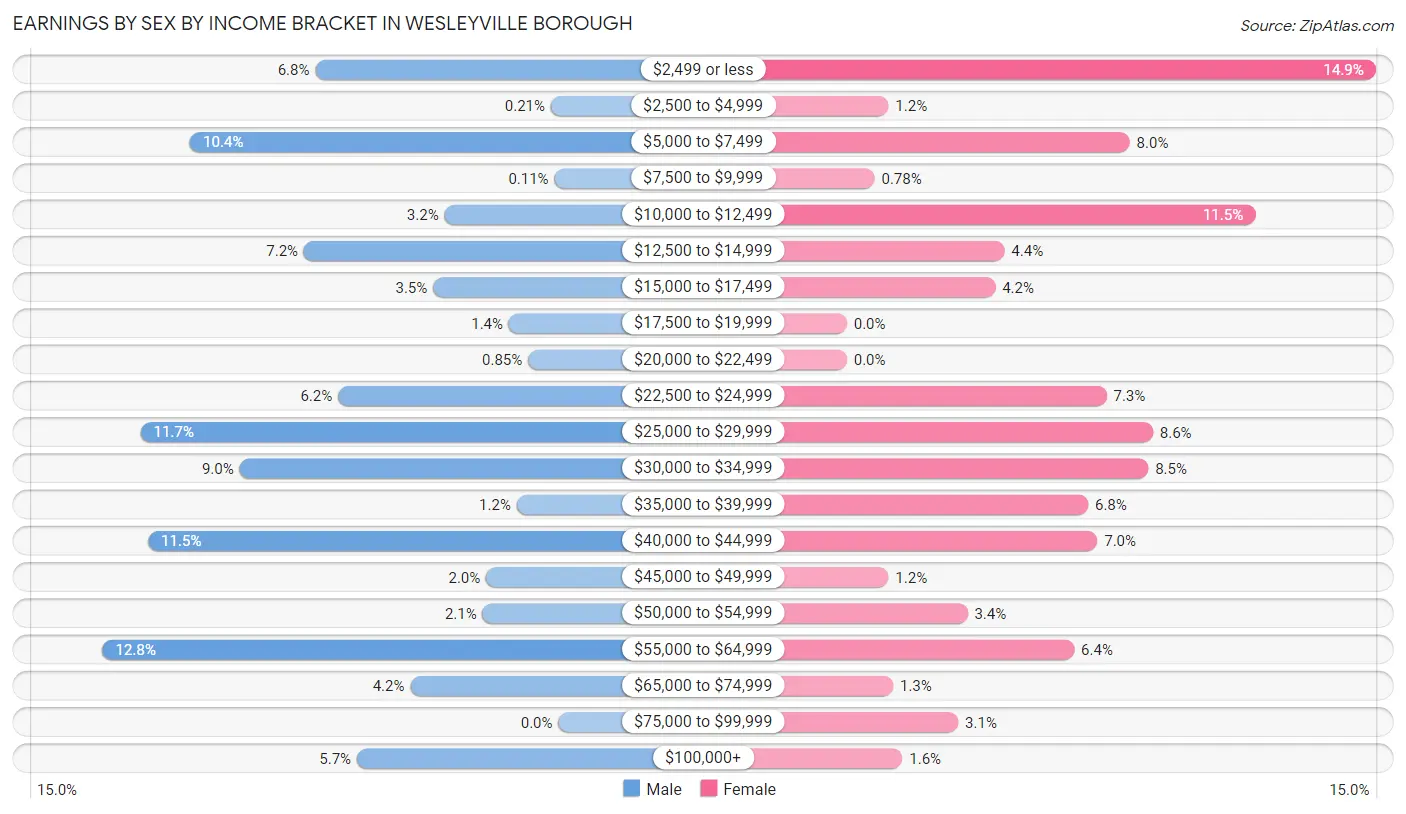
Earnings by Sex by Income Bracket in Wesleyville borough
The most common earnings brackets in Wesleyville borough are $55,000 to $64,999 for men (120 | 12.8%) and $2,499 or less for women (114 | 14.9%).
| Income | Male | Female |
| $2,499 or less | 64 (6.8%) | 114 (14.9%) |
| $2,500 to $4,999 | 2 (0.2%) | 9 (1.2%) |
| $5,000 to $7,499 | 97 (10.3%) | 61 (8.0%) |
| $7,500 to $9,999 | 1 (0.1%) | 6 (0.8%) |
| $10,000 to $12,499 | 30 (3.2%) | 88 (11.5%) |
| $12,500 to $14,999 | 67 (7.1%) | 34 (4.4%) |
| $15,000 to $17,499 | 33 (3.5%) | 32 (4.2%) |
| $17,500 to $19,999 | 13 (1.4%) | 0 (0.0%) |
| $20,000 to $22,499 | 8 (0.9%) | 0 (0.0%) |
| $22,500 to $24,999 | 58 (6.2%) | 56 (7.3%) |
| $25,000 to $29,999 | 110 (11.7%) | 66 (8.6%) |
| $30,000 to $34,999 | 84 (9.0%) | 65 (8.5%) |
| $35,000 to $39,999 | 11 (1.2%) | 52 (6.8%) |
| $40,000 to $44,999 | 108 (11.5%) | 54 (7.0%) |
| $45,000 to $49,999 | 19 (2.0%) | 9 (1.2%) |
| $50,000 to $54,999 | 20 (2.1%) | 26 (3.4%) |
| $55,000 to $64,999 | 120 (12.8%) | 49 (6.4%) |
| $65,000 to $74,999 | 39 (4.2%) | 10 (1.3%) |
| $75,000 to $99,999 | 0 (0.0%) | 24 (3.1%) |
| $100,000+ | 53 (5.7%) | 12 (1.6%) |
| Total | 937 (100.0%) | 767 (100.0%) |
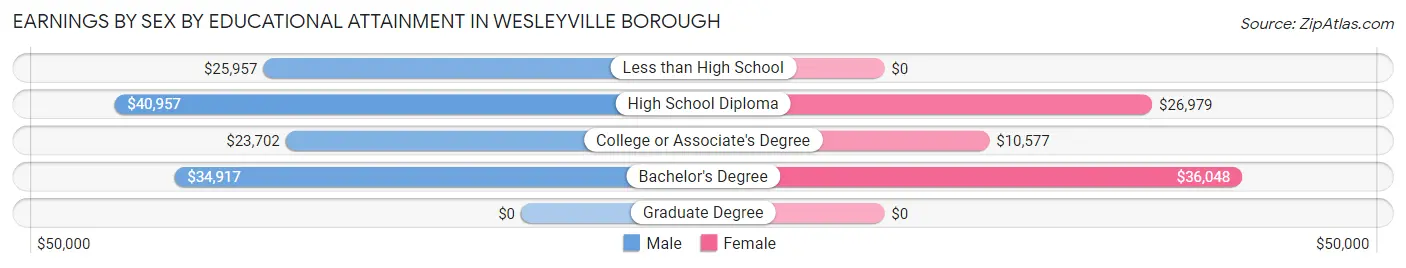
Earnings by Sex by Educational Attainment in Wesleyville borough
Average earnings in Wesleyville borough are $33,015 for men and $27,986 for women, a difference of 15.2%. Men with an educational attainment of high school diploma enjoy the highest average annual earnings of $40,957, while those with college or associate's degree education earn the least with $23,702. Women with an educational attainment of bachelor's degree earn the most with the average annual earnings of $36,048, while those with college or associate's degree education have the smallest earnings of $10,577.
| Educational Attainment | Male Income | Female Income |
| Less than High School | $25,957 | $0 |
| High School Diploma | $40,957 | $26,979 |
| College or Associate's Degree | $23,702 | $10,577 |
| Bachelor's Degree | $34,917 | $36,048 |
| Graduate Degree | - | - |
| Total | $33,015 | $27,986 |
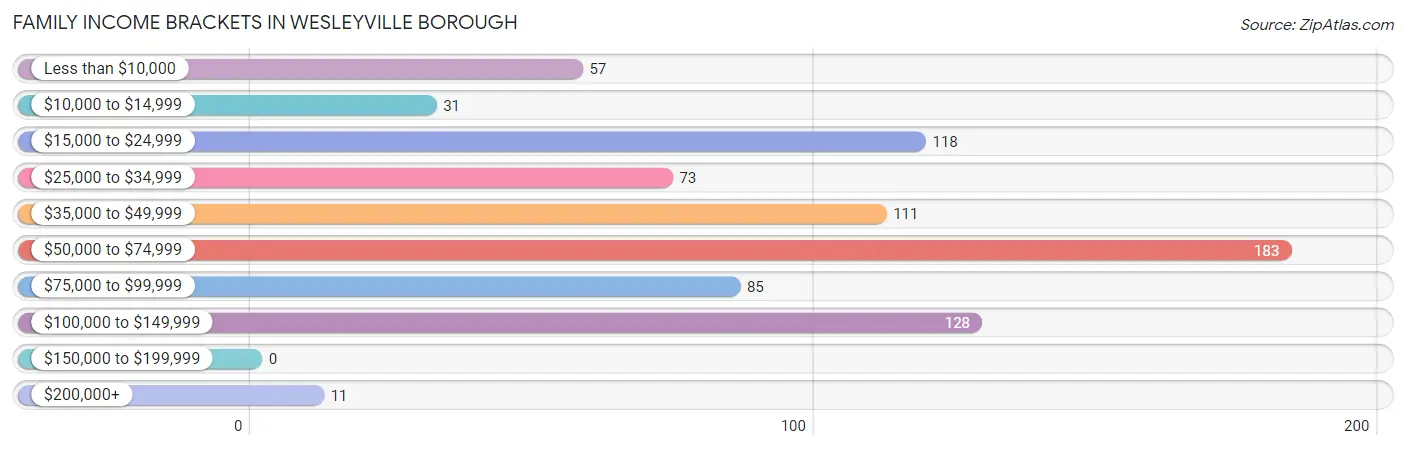
Family Income in Wesleyville borough
Family Income Brackets in Wesleyville borough
According to the Wesleyville borough family income data, there are 183 families falling into the $50,000 to $74,999 income range, which is the most common income bracket and makes up 23.0% of all families.
| Income Bracket | # Families | % Families |
| Less than $10,000 | 57 | 7.2% |
| $10,000 to $14,999 | 31 | 3.9% |
| $15,000 to $24,999 | 118 | 14.8% |
| $25,000 to $34,999 | 73 | 9.2% |
| $35,000 to $49,999 | 111 | 13.9% |
| $50,000 to $74,999 | 183 | 23.0% |
| $75,000 to $99,999 | 85 | 10.7% |
| $100,000 to $149,999 | 128 | 16.1% |
| $150,000 to $199,999 | 0 | 0.0% |
| $200,000+ | 11 | 1.4% |
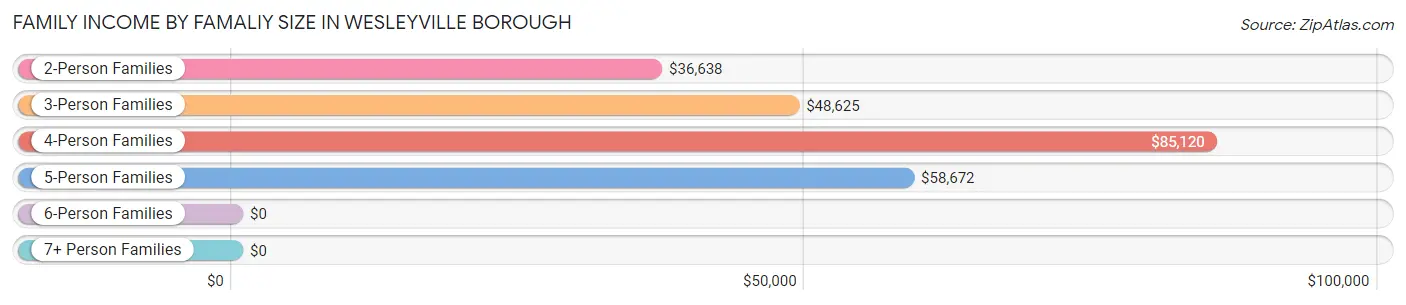
Family Income by Famaliy Size in Wesleyville borough
4-person families (157 | 19.7%) account for the highest median family income in Wesleyville borough with $85,120 per family, while 4-person families (157 | 19.7%) have the highest median income of $21,280 per family member.
| Income Bracket | # Families | Median Income |
| 2-Person Families | 368 (46.2%) | $36,638 |
| 3-Person Families | 105 (13.2%) | $48,625 |
| 4-Person Families | 157 (19.7%) | $85,120 |
| 5-Person Families | 151 (19.0%) | $58,672 |
| 6-Person Families | 0 (0.0%) | $0 |
| 7+ Person Families | 16 (2.0%) | $0 |
| Total | 797 (100.0%) | $55,607 |
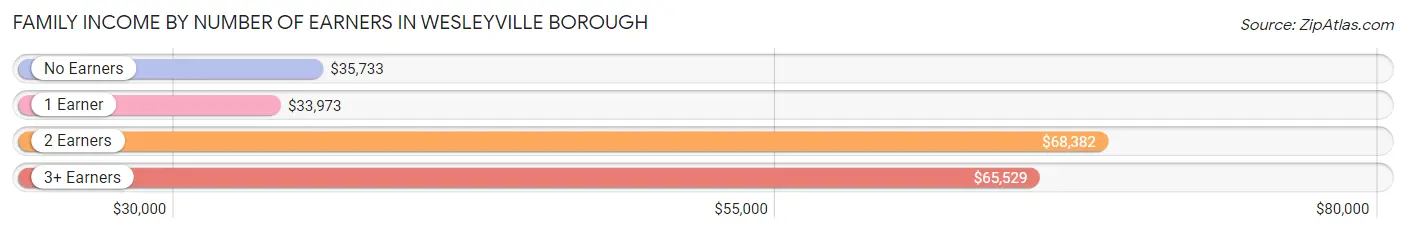
Family Income by Number of Earners in Wesleyville borough
The median family income in Wesleyville borough is $55,607, with families comprising 2 earners (252) having the highest median family income of $68,382, while families with 1 earner (331) have the lowest median family income of $33,973, accounting for 31.6% and 41.5% of families, respectively.
| Number of Earners | # Families | Median Income |
| No Earners | 107 (13.4%) | $35,733 |
| 1 Earner | 331 (41.5%) | $33,973 |
| 2 Earners | 252 (31.6%) | $68,382 |
| 3+ Earners | 107 (13.4%) | $65,529 |
| Total | 797 (100.0%) | $55,607 |
Household Income in Wesleyville borough
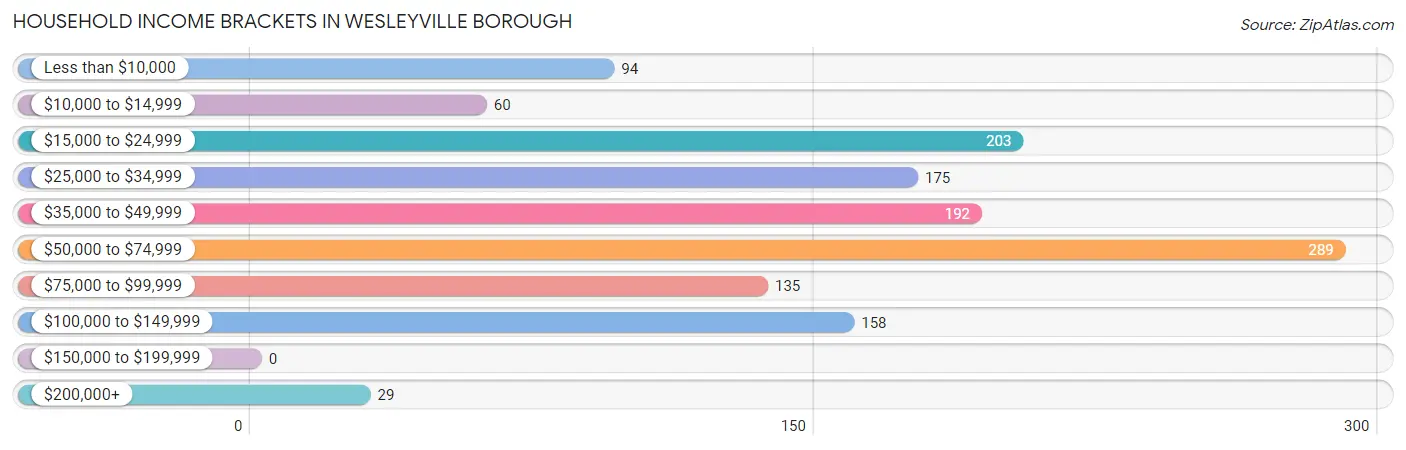
Household Income Brackets in Wesleyville borough
With 289 households falling in the category, the $50,000 to $74,999 income range is the most frequent in Wesleyville borough, accounting for 21.6% of all households.
| Income Bracket | # Households | % Households |
| Less than $10,000 | 94 | 7.0% |
| $10,000 to $14,999 | 60 | 4.5% |
| $15,000 to $24,999 | 203 | 15.2% |
| $25,000 to $34,999 | 175 | 13.1% |
| $35,000 to $49,999 | 192 | 14.4% |
| $50,000 to $74,999 | 289 | 21.6% |
| $75,000 to $99,999 | 135 | 10.1% |
| $100,000 to $149,999 | 158 | 11.8% |
| $150,000 to $199,999 | 0 | 0.0% |
| $200,000+ | 29 | 2.2% |
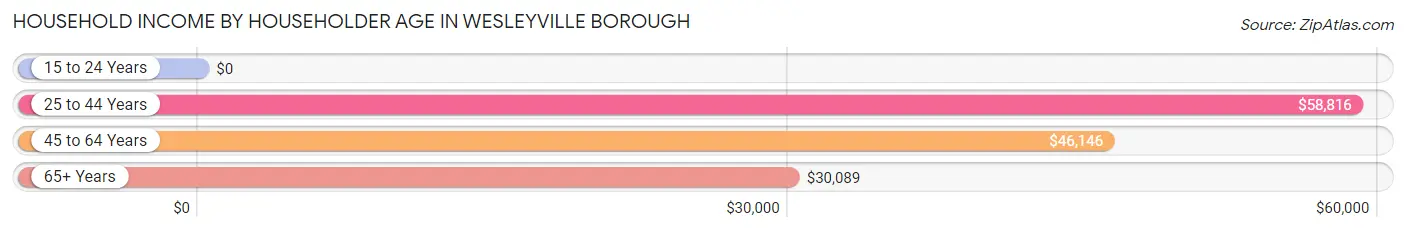
Household Income by Householder Age in Wesleyville borough
The median household income in Wesleyville borough is $44,417, with the highest median household income of $58,816 found in the 25 to 44 years age bracket for the primary householder. A total of 460 households (34.4%) fall into this category. Meanwhile, the 15 to 24 years age bracket for the primary householder has the lowest median household income of $0, with 70 households (5.2%) in this group.
| Income Bracket | # Households | Median Income |
| 15 to 24 Years | 70 (5.2%) | $0 |
| 25 to 44 Years | 460 (34.4%) | $58,816 |
| 45 to 64 Years | 523 (39.2%) | $46,146 |
| 65+ Years | 283 (21.2%) | $30,089 |
| Total | 1,336 (100.0%) | $44,417 |
Poverty in Wesleyville borough
Income Below Poverty by Sex and Age in Wesleyville borough
With 9.9% poverty level for males and 28.3% for females among the residents of Wesleyville borough, 55 to 64 year old males and 16 and 17 year old females are the most vulnerable to poverty, with 50 males (21.7%) and 80 females (89.9%) in their respective age groups living below the poverty level.
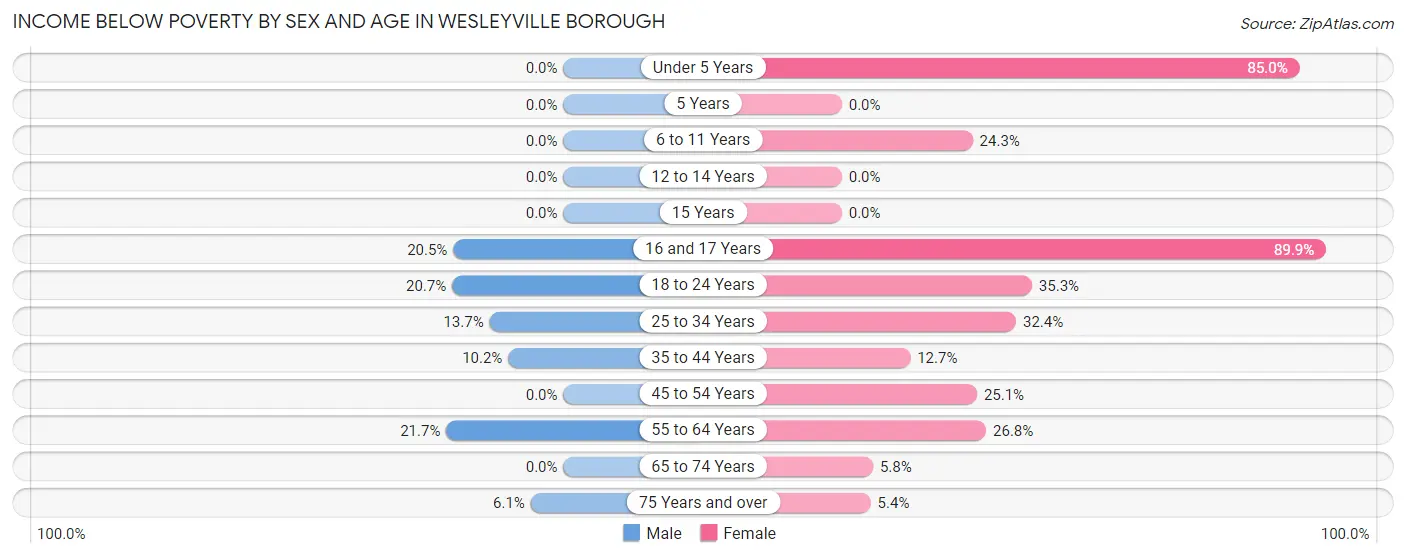
| Age Bracket | Male | Female |
| Under 5 Years | 0 (0.0%) | 96 (85.0%) |
| 5 Years | 0 (0.0%) | 0 (0.0%) |
| 6 to 11 Years | 0 (0.0%) | 51 (24.3%) |
| 12 to 14 Years | 0 (0.0%) | 0 (0.0%) |
| 15 Years | 0 (0.0%) | 0 (0.0%) |
| 16 and 17 Years | 9 (20.4%) | 80 (89.9%) |
| 18 to 24 Years | 25 (20.7%) | 48 (35.3%) |
| 25 to 34 Years | 34 (13.7%) | 33 (32.4%) |
| 35 to 44 Years | 30 (10.2%) | 32 (12.7%) |
| 45 to 54 Years | 0 (0.0%) | 69 (25.1%) |
| 55 to 64 Years | 50 (21.7%) | 45 (26.8%) |
| 65 to 74 Years | 0 (0.0%) | 7 (5.8%) |
| 75 Years and over | 6 (6.1%) | 6 (5.4%) |
| Total | 154 (9.9%) | 467 (28.3%) |
Income Above Poverty by Sex and Age in Wesleyville borough
According to the poverty statistics in Wesleyville borough, males aged under 5 years and females aged 12 to 14 years are the age groups that are most secure financially, with 100.0% of males and 100.0% of females in these age groups living above the poverty line.
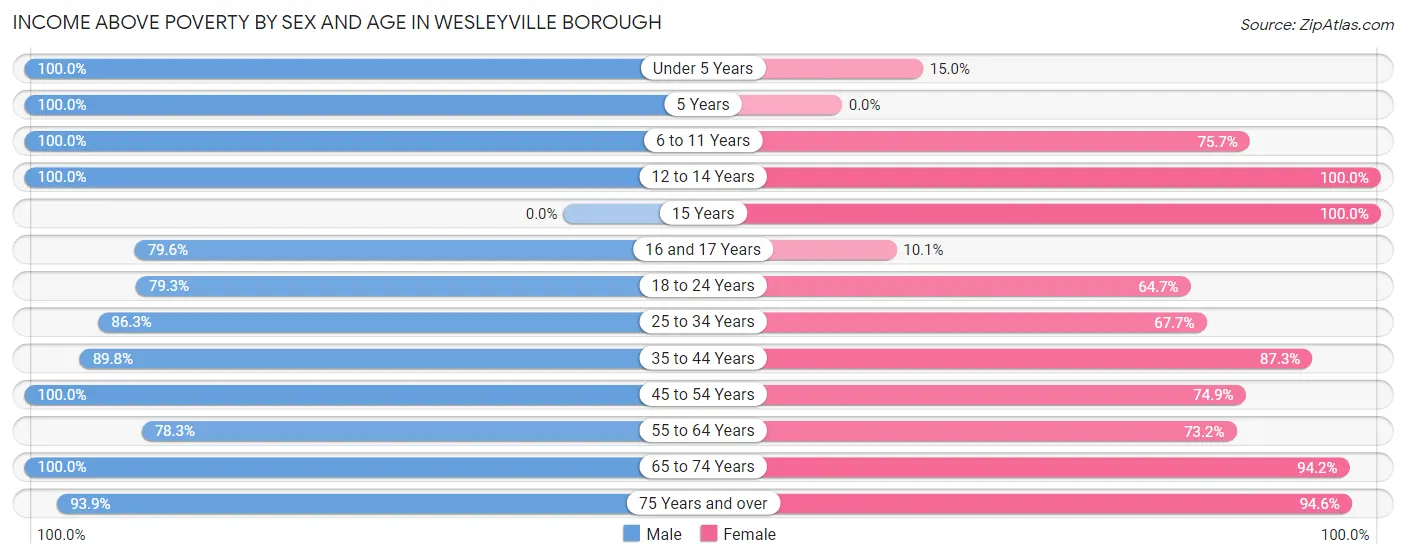
| Age Bracket | Male | Female |
| Under 5 Years | 90 (100.0%) | 17 (15.0%) |
| 5 Years | 8 (100.0%) | 0 (0.0%) |
| 6 to 11 Years | 152 (100.0%) | 159 (75.7%) |
| 12 to 14 Years | 65 (100.0%) | 18 (100.0%) |
| 15 Years | 0 (0.0%) | 51 (100.0%) |
| 16 and 17 Years | 35 (79.5%) | 9 (10.1%) |
| 18 to 24 Years | 96 (79.3%) | 88 (64.7%) |
| 25 to 34 Years | 214 (86.3%) | 69 (67.6%) |
| 35 to 44 Years | 263 (89.8%) | 220 (87.3%) |
| 45 to 54 Years | 151 (100.0%) | 206 (74.9%) |
| 55 to 64 Years | 180 (78.3%) | 123 (73.2%) |
| 65 to 74 Years | 53 (100.0%) | 114 (94.2%) |
| 75 Years and over | 93 (93.9%) | 106 (94.6%) |
| Total | 1,400 (90.1%) | 1,180 (71.7%) |
Income Below Poverty Among Married-Couple Families in Wesleyville borough
The poverty statistics for married-couple families in Wesleyville borough show that 9.7% or 48 of the total 494 families live below the poverty line. Families with 3 or 4 children have the highest poverty rate of 61.0%, comprising of 25 families. On the other hand, families with 1 or 2 children have the lowest poverty rate of 0.0%, which includes 0 families.
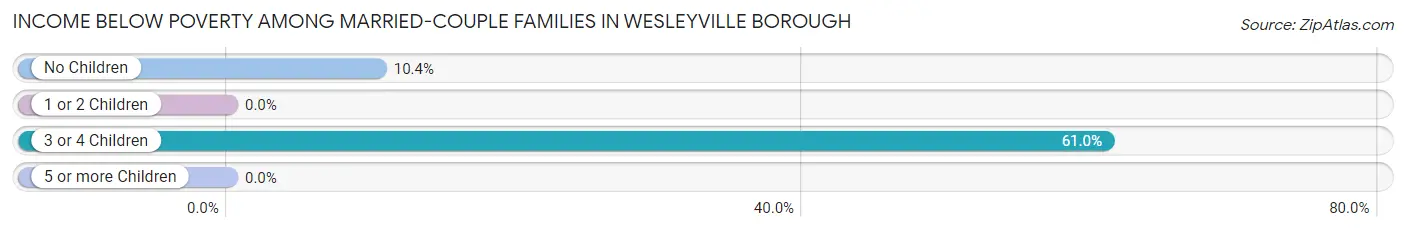
| Children | Above Poverty | Below Poverty |
| No Children | 199 (89.6%) | 23 (10.4%) |
| 1 or 2 Children | 231 (100.0%) | 0 (0.0%) |
| 3 or 4 Children | 16 (39.0%) | 25 (61.0%) |
| 5 or more Children | 0 (0.0%) | 0 (0.0%) |
| Total | 446 (90.3%) | 48 (9.7%) |
Income Below Poverty Among Single-Parent Households in Wesleyville borough
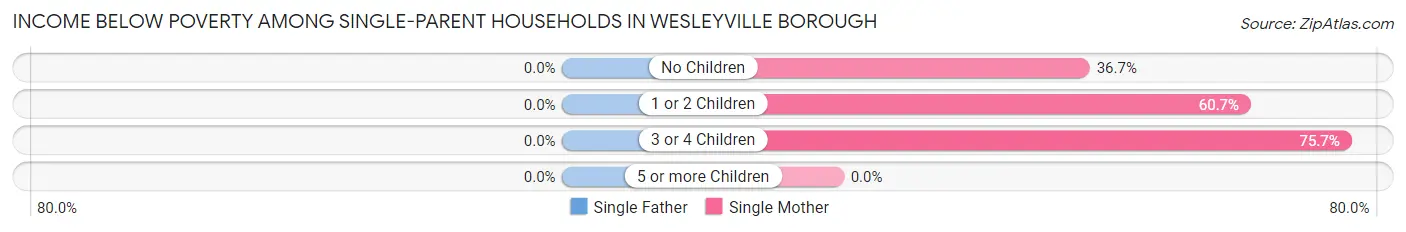
| Children | Single Father | Single Mother |
| No Children | 0 (0.0%) | 44 (36.7%) |
| 1 or 2 Children | 0 (0.0%) | 54 (60.7%) |
| 3 or 4 Children | 0 (0.0%) | 28 (75.7%) |
| 5 or more Children | 0 (0.0%) | 0 (0.0%) |
| Total | 0 (0.0%) | 126 (51.2%) |
Income Below Poverty Among Married-Couple vs Single-Parent Households in Wesleyville borough
The poverty data for Wesleyville borough shows that 48 of the married-couple family households (9.7%) and 126 of the single-parent households (41.6%) are living below the poverty level. Within the married-couple family households, those with 3 or 4 children have the highest poverty rate, with 25 households (61.0%) falling below the poverty line. Among the single-parent households, those with 3 or 4 children have the highest poverty rate, with 28 household (75.7%) living below poverty.
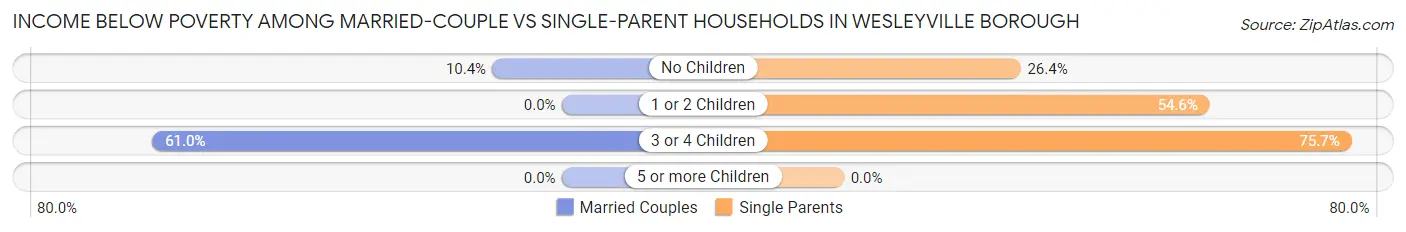
| Children | Married-Couple Families | Single-Parent Households |
| No Children | 23 (10.4%) | 44 (26.4%) |
| 1 or 2 Children | 0 (0.0%) | 54 (54.5%) |
| 3 or 4 Children | 25 (61.0%) | 28 (75.7%) |
| 5 or more Children | 0 (0.0%) | 0 (0.0%) |
| Total | 48 (9.7%) | 126 (41.6%) |
Race in Wesleyville borough
The most populous races in Wesleyville borough are White / Caucasian (2,766 | 86.2%), Two or more Races (286 | 8.9%), and Hispanic or Latino (175 | 5.4%).
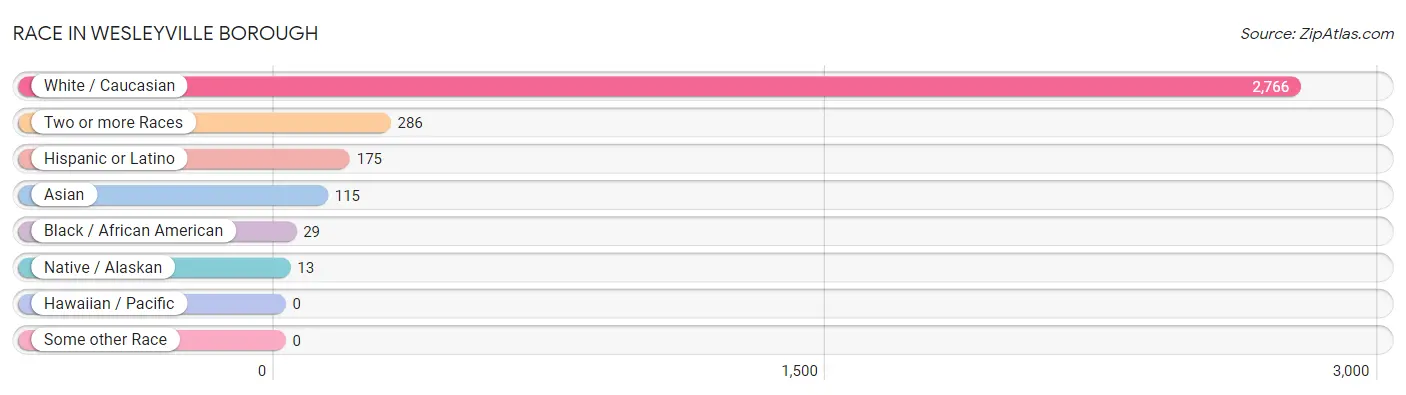
| Race | # Population | % Population |
| Asian | 115 | 3.6% |
| Black / African American | 29 | 0.9% |
| Hawaiian / Pacific | 0 | 0.0% |
| Hispanic or Latino | 175 | 5.4% |
| Native / Alaskan | 13 | 0.4% |
| White / Caucasian | 2,766 | 86.2% |
| Two or more Races | 286 | 8.9% |
| Some other Race | 0 | 0.0% |
| Total | 3,209 | 100.0% |
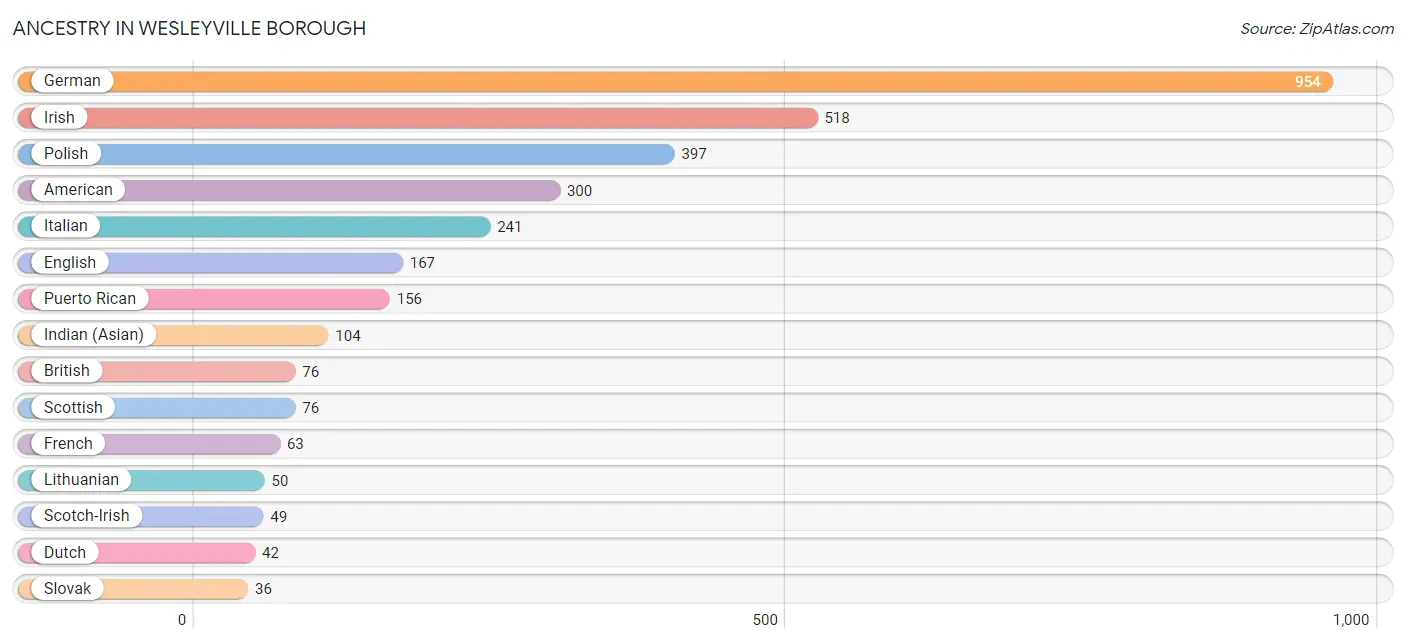
Ancestry in Wesleyville borough
The most populous ancestries reported in Wesleyville borough are German (954 | 29.7%), Irish (518 | 16.1%), Polish (397 | 12.4%), American (300 | 9.3%), and Italian (241 | 7.5%), together accounting for 75.1% of all Wesleyville borough residents.
| Ancestry | # Population | % Population |
| American | 300 | 9.3% |
| British | 76 | 2.4% |
| Burmese | 23 | 0.7% |
| Cambodian | 1 | 0.0% |
| Czech | 24 | 0.7% |
| Dutch | 42 | 1.3% |
| Eastern European | 12 | 0.4% |
| English | 167 | 5.2% |
| European | 31 | 1.0% |
| Finnish | 32 | 1.0% |
| French | 63 | 2.0% |
| German | 954 | 29.7% |
| Hungarian | 7 | 0.2% |
| Indian (Asian) | 104 | 3.2% |
| Irish | 518 | 16.1% |
| Italian | 241 | 7.5% |
| Korean | 22 | 0.7% |
| Lithuanian | 50 | 1.6% |
| Mexican | 19 | 0.6% |
| Mongolian | 1 | 0.0% |
| Norwegian | 17 | 0.5% |
| Pennsylvania German | 12 | 0.4% |
| Polish | 397 | 12.4% |
| Puerto Rican | 156 | 4.9% |
| Romanian | 11 | 0.3% |
| Russian | 34 | 1.1% |
| Scotch-Irish | 49 | 1.5% |
| Scottish | 76 | 2.4% |
| Sioux | 13 | 0.4% |
| Slovak | 36 | 1.1% |
| Swedish | 33 | 1.0% | View All 31 Rows |
Immigrants in Wesleyville borough
The most numerous immigrant groups reported in Wesleyville borough came from Asia (115 | 3.6%), Eastern Asia (105 | 3.3%), China (104 | 3.2%), Philippines (10 | 0.3%), and South Eastern Asia (10 | 0.3%), together accounting for 10.7% of all Wesleyville borough residents.
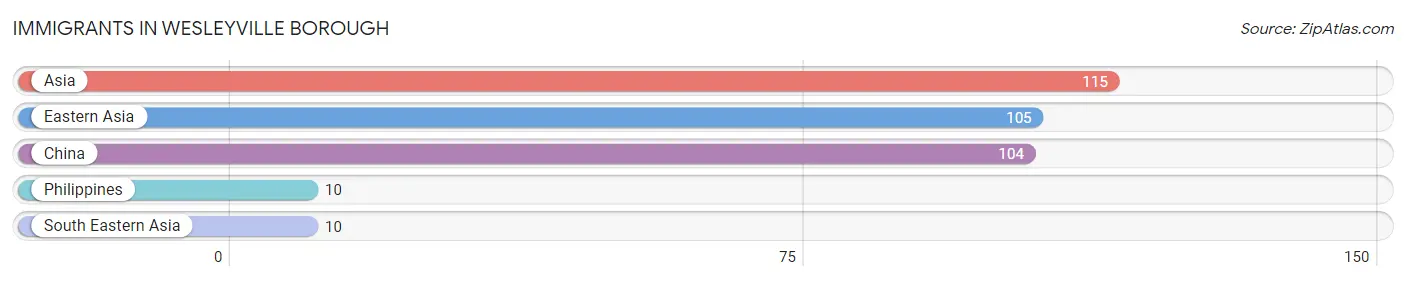
| Immigration Origin | # Population | % Population |
| Asia | 115 | 3.6% |
| China | 104 | 3.2% |
| Eastern Asia | 105 | 3.3% |
| Philippines | 10 | 0.3% |
| South Eastern Asia | 10 | 0.3% | View All 5 Rows |
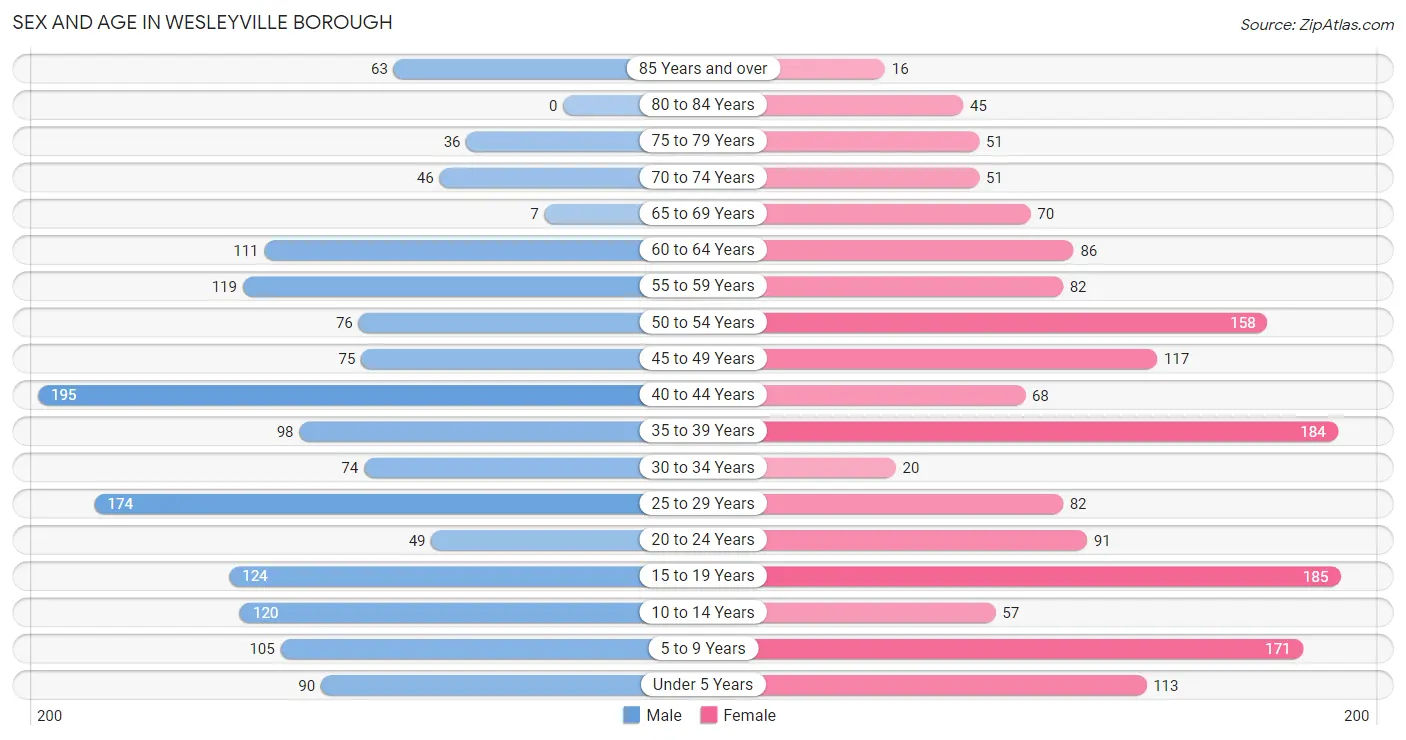
Sex and Age in Wesleyville borough
Sex and Age in Wesleyville borough
The most populous age groups in Wesleyville borough are 40 to 44 Years (195 | 12.5%) for men and 15 to 19 Years (185 | 11.2%) for women.
| Age Bracket | Male | Female |
| Under 5 Years | 90 (5.8%) | 113 (6.9%) |
| 5 to 9 Years | 105 (6.7%) | 171 (10.4%) |
| 10 to 14 Years | 120 (7.7%) | 57 (3.5%) |
| 15 to 19 Years | 124 (7.9%) | 185 (11.2%) |
| 20 to 24 Years | 49 (3.1%) | 91 (5.5%) |
| 25 to 29 Years | 174 (11.1%) | 82 (5.0%) |
| 30 to 34 Years | 74 (4.7%) | 20 (1.2%) |
| 35 to 39 Years | 98 (6.3%) | 184 (11.2%) |
| 40 to 44 Years | 195 (12.5%) | 68 (4.1%) |
| 45 to 49 Years | 75 (4.8%) | 117 (7.1%) |
| 50 to 54 Years | 76 (4.9%) | 158 (9.6%) |
| 55 to 59 Years | 119 (7.6%) | 82 (5.0%) |
| 60 to 64 Years | 111 (7.1%) | 86 (5.2%) |
| 65 to 69 Years | 7 (0.4%) | 70 (4.3%) |
| 70 to 74 Years | 46 (2.9%) | 51 (3.1%) |
| 75 to 79 Years | 36 (2.3%) | 51 (3.1%) |
| 80 to 84 Years | 0 (0.0%) | 45 (2.7%) |
| 85 Years and over | 63 (4.0%) | 16 (1.0%) |
| Total | 1,562 (100.0%) | 1,647 (100.0%) |
Families and Households in Wesleyville borough
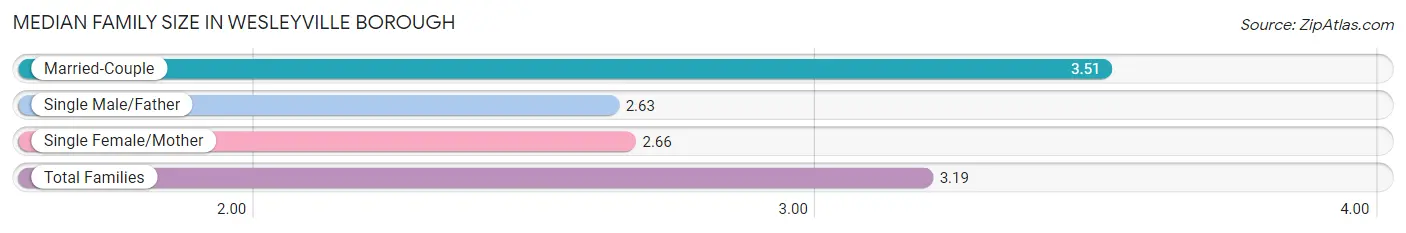
Median Family Size in Wesleyville borough
The median family size in Wesleyville borough is 3.19 persons per family, with married-couple families (494 | 62.0%) accounting for the largest median family size of 3.51 persons per family. On the other hand, single male/father families (57 | 7.1%) represent the smallest median family size with 2.63 persons per family.
| Family Type | # Families | Family Size |
| Married-Couple | 494 (62.0%) | 3.51 |
| Single Male/Father | 57 (7.1%) | 2.63 |
| Single Female/Mother | 246 (30.9%) | 2.66 |
| Total Families | 797 (100.0%) | 3.19 |
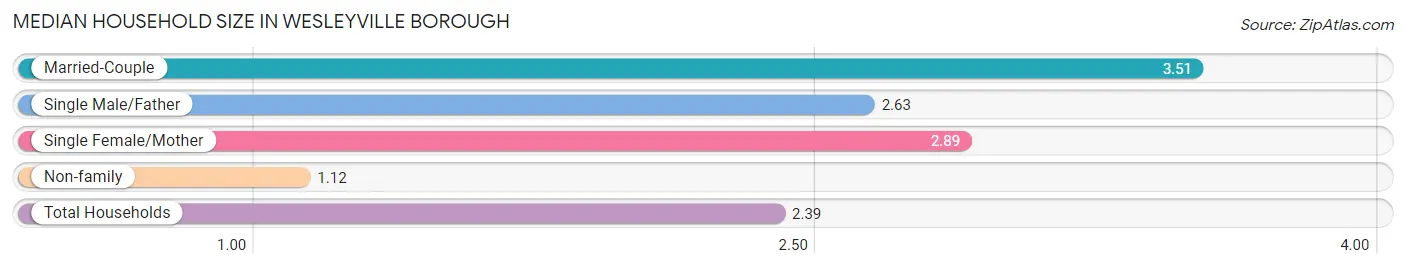
Median Household Size in Wesleyville borough
The median household size in Wesleyville borough is 2.39 persons per household, with married-couple households (494 | 37.0%) accounting for the largest median household size of 3.51 persons per household. non-family households (539 | 40.3%) represent the smallest median household size with 1.12 persons per household.
| Household Type | # Households | Household Size |
| Married-Couple | 494 (37.0%) | 3.51 |
| Single Male/Father | 57 (4.3%) | 2.63 |
| Single Female/Mother | 246 (18.4%) | 2.89 |
| Non-family | 539 (40.3%) | 1.12 |
| Total Households | 1,336 (100.0%) | 2.39 |
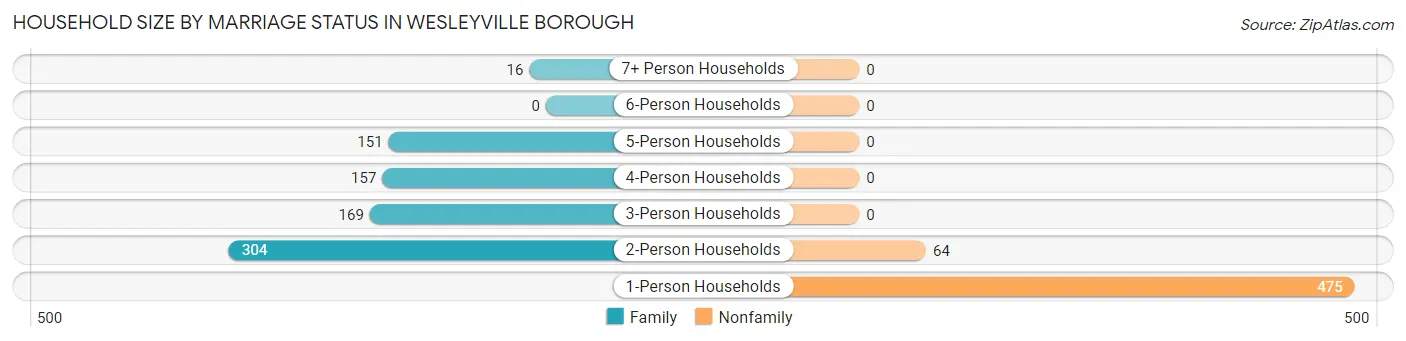
Household Size by Marriage Status in Wesleyville borough
Out of a total of 1,336 households in Wesleyville borough, 797 (59.7%) are family households, while 539 (40.3%) are nonfamily households. The most numerous type of family households are 2-person households, comprising 304, and the most common type of nonfamily households are 1-person households, comprising 475.
| Household Size | Family Households | Nonfamily Households |
| 1-Person Households | - | 475 (35.5%) |
| 2-Person Households | 304 (22.8%) | 64 (4.8%) |
| 3-Person Households | 169 (12.7%) | 0 (0.0%) |
| 4-Person Households | 157 (11.7%) | 0 (0.0%) |
| 5-Person Households | 151 (11.3%) | 0 (0.0%) |
| 6-Person Households | 0 (0.0%) | 0 (0.0%) |
| 7+ Person Households | 16 (1.2%) | 0 (0.0%) |
| Total | 797 (59.7%) | 539 (40.3%) |
Female Fertility in Wesleyville borough
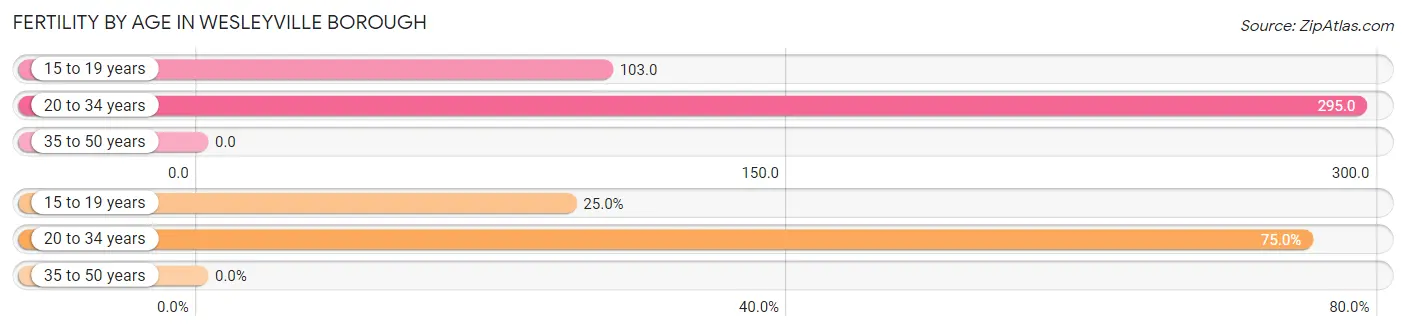
Fertility by Age in Wesleyville borough
Average fertility rate in Wesleyville borough is 100.0 births per 1,000 women. Women in the age bracket of 20 to 34 years have the highest fertility rate with 295.0 births per 1,000 women. Women in the age bracket of 20 to 34 years acount for 75.0% of all women with births.
| Age Bracket | Women with Births | Births / 1,000 Women |
| 15 to 19 years | 19 (25.0%) | 103.0 |
| 20 to 34 years | 57 (75.0%) | 295.0 |
| 35 to 50 years | 0 (0.0%) | 0.0 |
| Total | 76 (100.0%) | 100.0 |
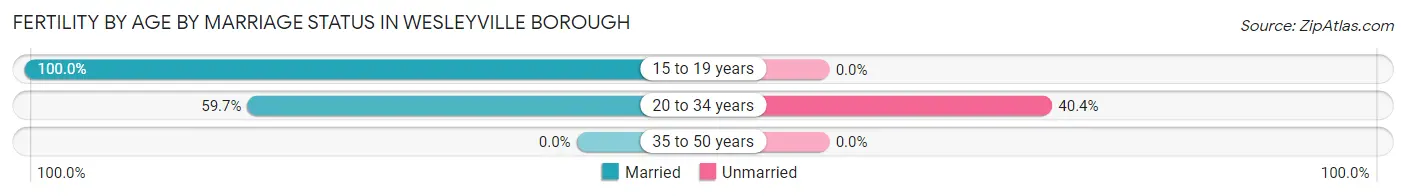
Fertility by Age by Marriage Status in Wesleyville borough
69.7% of women with births (76) in Wesleyville borough are married. The highest percentage of unmarried women with births falls into 20 to 34 years age bracket with 40.4% of them unmarried at the time of birth, while the lowest percentage of unmarried women with births belong to 15 to 19 years age bracket with 0.0% of them unmarried.
| Age Bracket | Married | Unmarried |
| 15 to 19 years | 19 (100.0%) | 0 (0.0%) |
| 20 to 34 years | 34 (59.7%) | 23 (40.4%) |
| 35 to 50 years | 0 (0.0%) | 0 (0.0%) |
| Total | 53 (69.7%) | 23 (30.3%) |
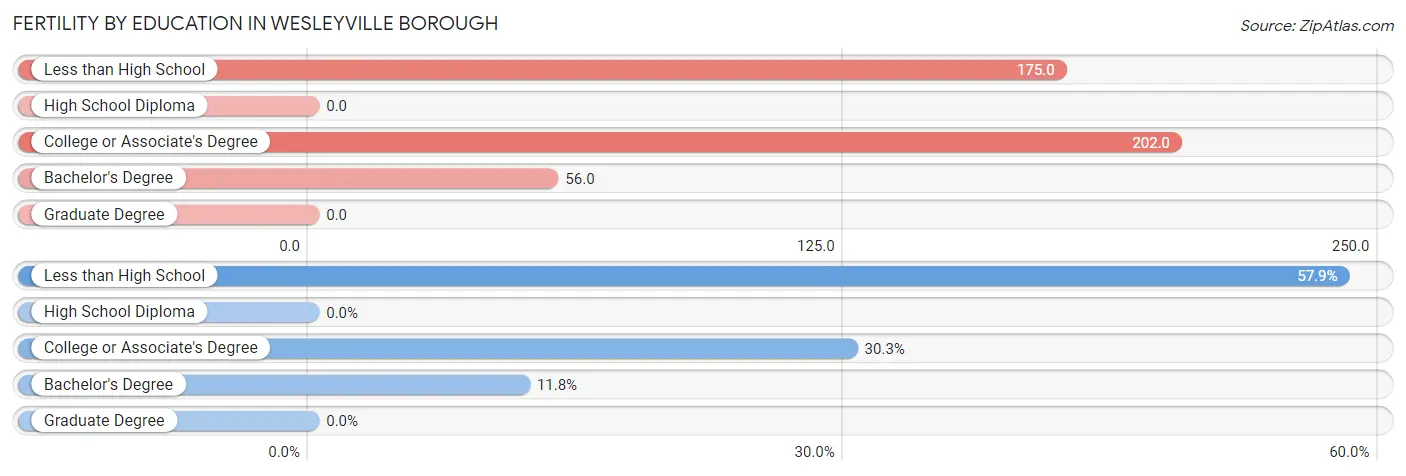
Fertility by Education in Wesleyville borough
| Educational Attainment | Women with Births | Births / 1,000 Women |
| Less than High School | 44 (57.9%) | 175.0 |
| High School Diploma | 0 (0.0%) | 0.0 |
| College or Associate's Degree | 23 (30.3%) | 202.0 |
| Bachelor's Degree | 9 (11.8%) | 56.0 |
| Graduate Degree | 0 (0.0%) | 0.0 |
| Total | 76 (100.0%) | 100.0 |
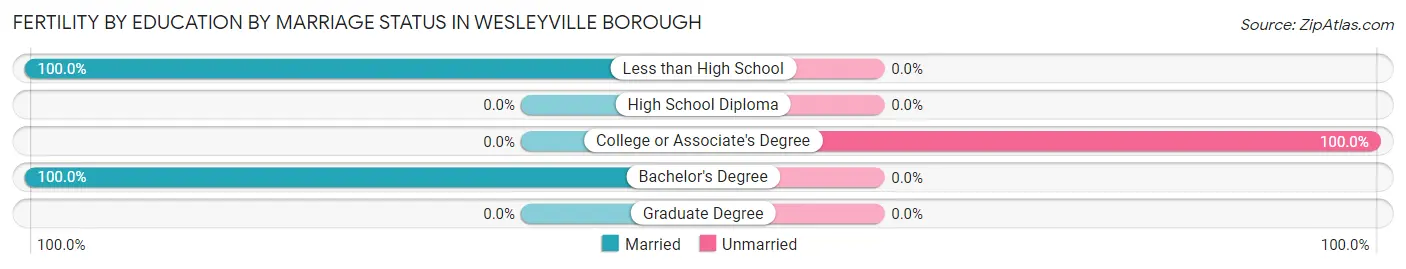
Fertility by Education by Marriage Status in Wesleyville borough
30.3% of women with births in Wesleyville borough are unmarried. Women with the educational attainment of less than high school are most likely to be married with 100.0% of them married at childbirth, while women with the educational attainment of college or associate's degree are least likely to be married with 100.0% of them unmarried at childbirth.
| Educational Attainment | Married | Unmarried |
| Less than High School | 44 (100.0%) | 0 (0.0%) |
| High School Diploma | 0 (0.0%) | 0 (0.0%) |
| College or Associate's Degree | 0 (0.0%) | 23 (100.0%) |
| Bachelor's Degree | 9 (100.0%) | 0 (0.0%) |
| Graduate Degree | 0 (0.0%) | 0 (0.0%) |
| Total | 53 (69.7%) | 23 (30.3%) |
Employment Characteristics in Wesleyville borough
Employment by Class of Employer in Wesleyville borough
Among the 1,486 employed individuals in Wesleyville borough, private company employees (1,153 | 77.6%), not-for-profit organizations (89 | 6.0%), and self-employed (not incorporated) (77 | 5.2%) make up the most common classes of employment.
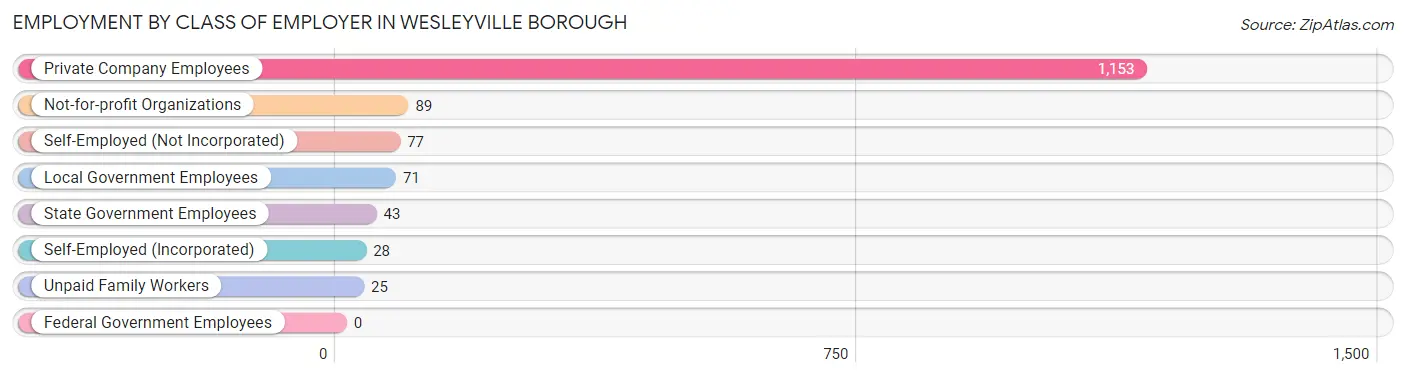
| Employer Class | # Employees | % Employees |
| Private Company Employees | 1,153 | 77.6% |
| Self-Employed (Incorporated) | 28 | 1.9% |
| Self-Employed (Not Incorporated) | 77 | 5.2% |
| Not-for-profit Organizations | 89 | 6.0% |
| Local Government Employees | 71 | 4.8% |
| State Government Employees | 43 | 2.9% |
| Federal Government Employees | 0 | 0.0% |
| Unpaid Family Workers | 25 | 1.7% |
| Total | 1,486 | 100.0% |
Employment Status by Age in Wesleyville borough
According to the labor force statistics for Wesleyville borough, out of the total population over 16 years of age (2,502), 65.3% or 1,634 individuals are in the labor force, with 7.8% or 127 of them unemployed. The age group with the highest labor force participation rate is 25 to 29 years, with 94.5% or 242 individuals in the labor force. Within the labor force, the 30 to 34 years age range has the highest percentage of unemployed individuals, with 25.3% or 19 of them being unemployed.
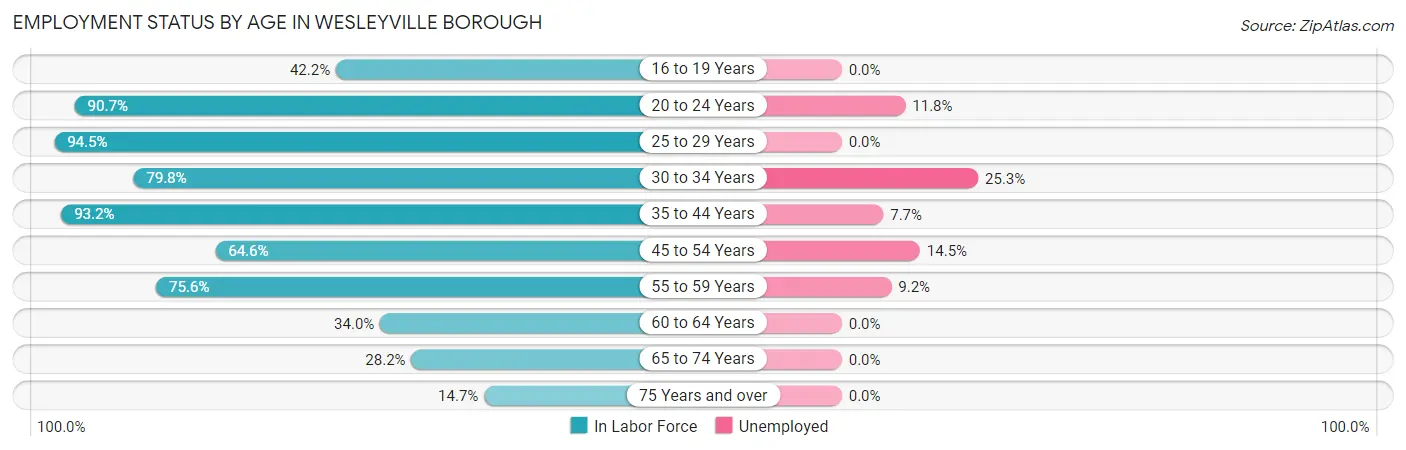
| Age Bracket | In Labor Force | Unemployed |
| 16 to 19 Years | 109 (42.2%) | 0 (0.0%) |
| 20 to 24 Years | 127 (90.7%) | 15 (11.8%) |
| 25 to 29 Years | 242 (94.5%) | 0 (0.0%) |
| 30 to 34 Years | 75 (79.8%) | 19 (25.3%) |
| 35 to 44 Years | 508 (93.2%) | 39 (7.7%) |
| 45 to 54 Years | 275 (64.6%) | 40 (14.5%) |
| 55 to 59 Years | 152 (75.6%) | 14 (9.2%) |
| 60 to 64 Years | 67 (34.0%) | 0 (0.0%) |
| 65 to 74 Years | 49 (28.2%) | 0 (0.0%) |
| 75 Years and over | 31 (14.7%) | 0 (0.0%) |
| Total | 1,634 (65.3%) | 127 (7.8%) |
Employment Status by Educational Attainment in Wesleyville borough
According to labor force statistics for Wesleyville borough, 76.7% of individuals (1,318) out of the total population between 25 and 64 years of age (1,719) are in the labor force, with 8.5% or 112 of them being unemployed. The group with the highest labor force participation rate are those with the educational attainment of bachelor's degree or higher, with 84.5% or 250 individuals in the labor force. Within the labor force, individuals with college / associate degree education have the highest percentage of unemployment, with 18.4% or 49 of them being unemployed.
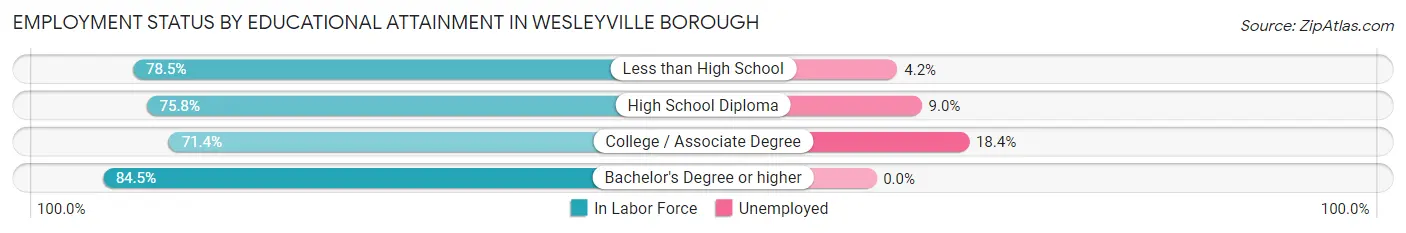
| Educational Attainment | In Labor Force | Unemployed |
| Less than High School | 190 (78.5%) | 10 (4.2%) |
| High School Diploma | 612 (75.8%) | 73 (9.0%) |
| College / Associate Degree | 267 (71.4%) | 69 (18.4%) |
| Bachelor's Degree or higher | 250 (84.5%) | 0 (0.0%) |
| Total | 1,318 (76.7%) | 146 (8.5%) |
Employment Occupations by Sex in Wesleyville borough
Management, Business, Science and Arts Occupations
The most common Management, Business, Science and Arts occupations in Wesleyville borough are Computers, Engineering & Science (95 | 6.3%), Health Diagnosing & Treating (77 | 5.1%), Architecture & Engineering (50 | 3.3%), Community & Social Service (48 | 3.2%), and Management (47 | 3.1%).
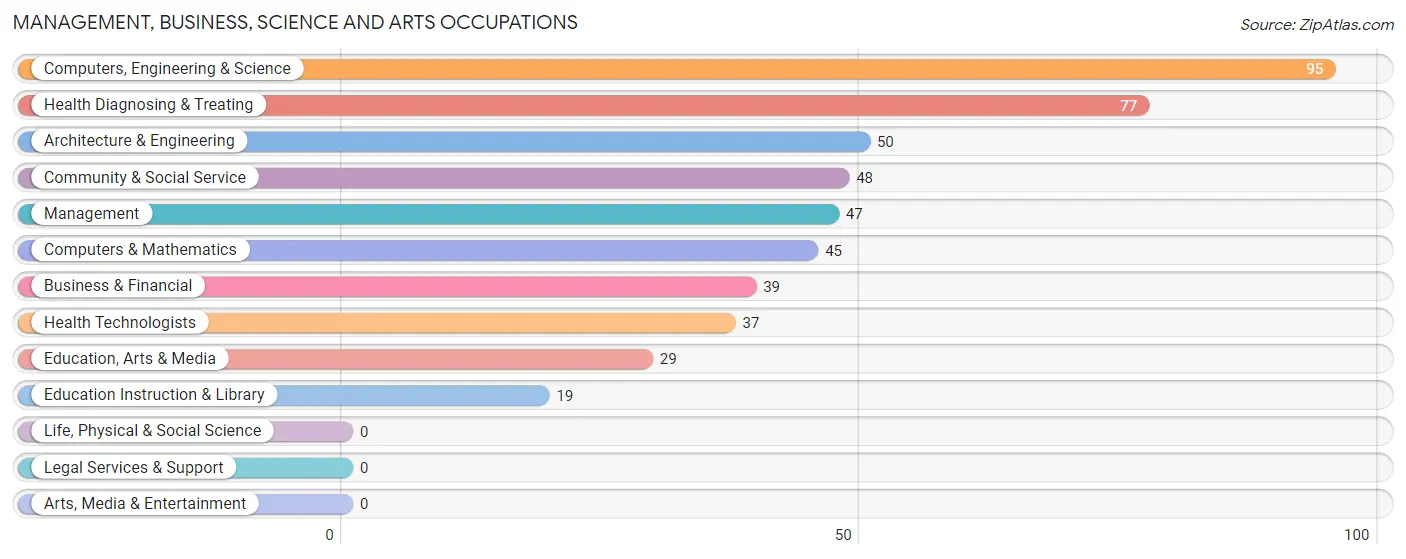
Management, Business, Science and Arts Occupations by Sex
Within the Management, Business, Science and Arts occupations in Wesleyville borough, the most male-oriented occupations are Architecture & Engineering (100.0%), Computers, Engineering & Science (80.0%), and Computers & Mathematics (57.8%), while the most female-oriented occupations are Community & Social Service (100.0%), Education, Arts & Media (100.0%), and Education Instruction & Library (100.0%).
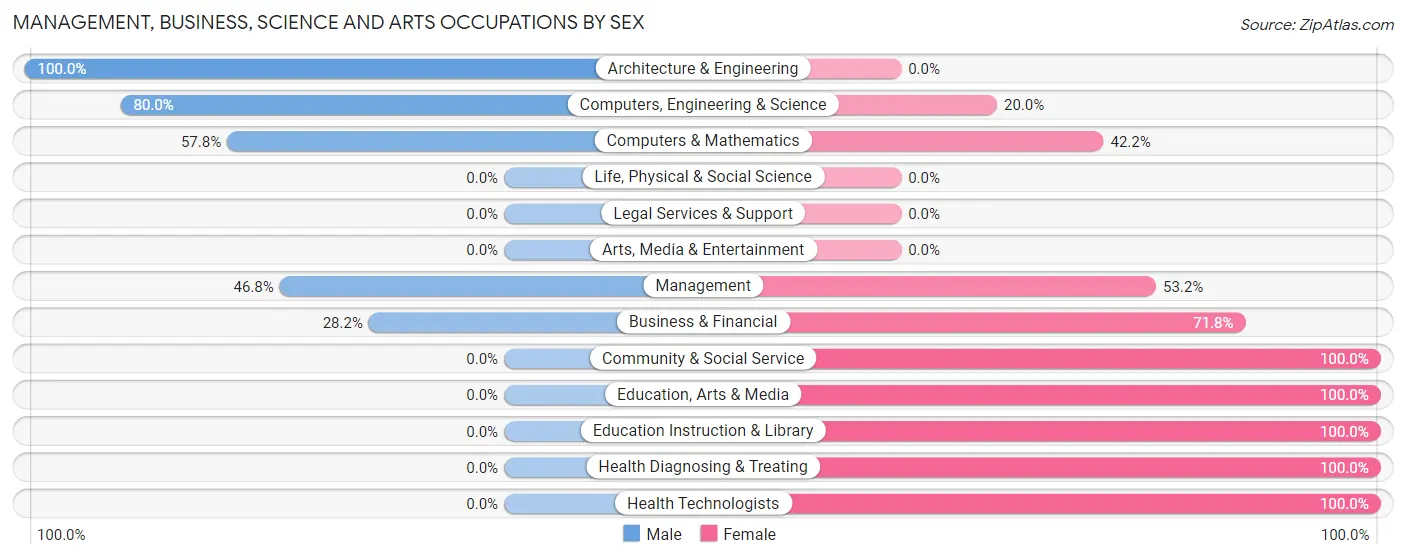
| Occupation | Male | Female |
| Management | 22 (46.8%) | 25 (53.2%) |
| Business & Financial | 11 (28.2%) | 28 (71.8%) |
| Computers, Engineering & Science | 76 (80.0%) | 19 (20.0%) |
| Computers & Mathematics | 26 (57.8%) | 19 (42.2%) |
| Architecture & Engineering | 50 (100.0%) | 0 (0.0%) |
| Life, Physical & Social Science | 0 (0.0%) | 0 (0.0%) |
| Community & Social Service | 0 (0.0%) | 48 (100.0%) |
| Education, Arts & Media | 0 (0.0%) | 29 (100.0%) |
| Legal Services & Support | 0 (0.0%) | 0 (0.0%) |
| Education Instruction & Library | 0 (0.0%) | 19 (100.0%) |
| Arts, Media & Entertainment | 0 (0.0%) | 0 (0.0%) |
| Health Diagnosing & Treating | 0 (0.0%) | 77 (100.0%) |
| Health Technologists | 0 (0.0%) | 37 (100.0%) |
| Total (Category) | 109 (35.6%) | 197 (64.4%) |
| Total (Overall) | 834 (55.3%) | 674 (44.7%) |
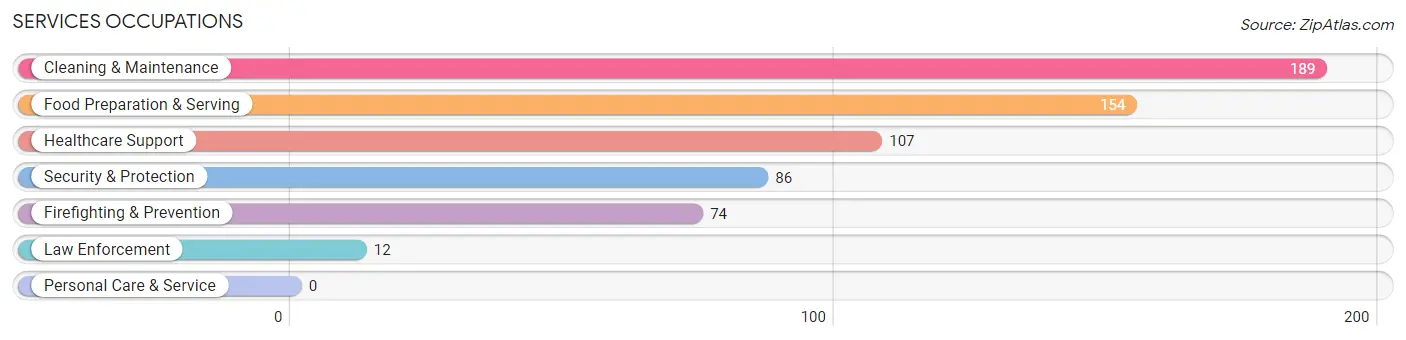
Services Occupations
The most common Services occupations in Wesleyville borough are Cleaning & Maintenance (189 | 12.5%), Food Preparation & Serving (154 | 10.2%), Healthcare Support (107 | 7.1%), Security & Protection (86 | 5.7%), and Firefighting & Prevention (74 | 4.9%).
Services Occupations by Sex
Within the Services occupations in Wesleyville borough, the most male-oriented occupations are Security & Protection (100.0%), Firefighting & Prevention (100.0%), and Law Enforcement (100.0%), while the most female-oriented occupations are Healthcare Support (100.0%), Food Preparation & Serving (59.7%), and Cleaning & Maintenance (43.9%).
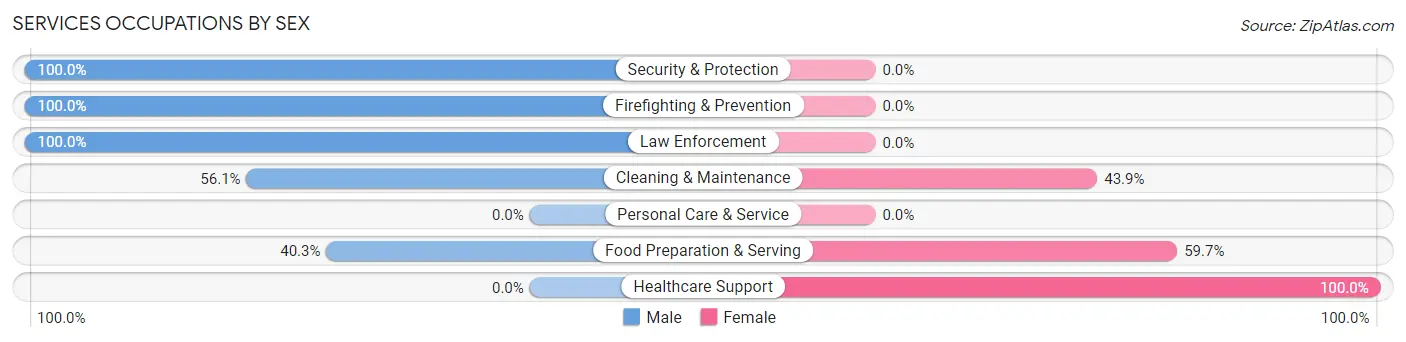
| Occupation | Male | Female |
| Healthcare Support | 0 (0.0%) | 107 (100.0%) |
| Security & Protection | 86 (100.0%) | 0 (0.0%) |
| Firefighting & Prevention | 74 (100.0%) | 0 (0.0%) |
| Law Enforcement | 12 (100.0%) | 0 (0.0%) |
| Food Preparation & Serving | 62 (40.3%) | 92 (59.7%) |
| Cleaning & Maintenance | 106 (56.1%) | 83 (43.9%) |
| Personal Care & Service | 0 (0.0%) | 0 (0.0%) |
| Total (Category) | 254 (47.4%) | 282 (52.6%) |
| Total (Overall) | 834 (55.3%) | 674 (44.7%) |
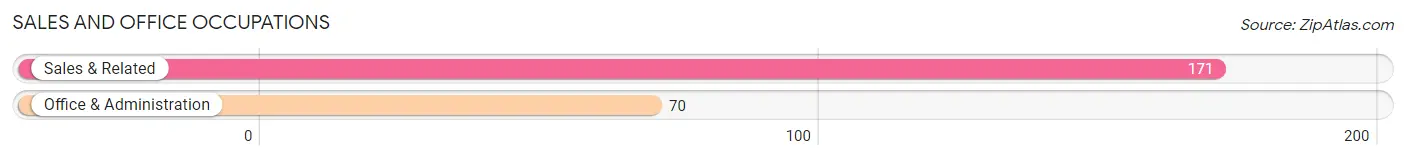
Sales and Office Occupations
The most common Sales and Office occupations in Wesleyville borough are Sales & Related (171 | 11.3%), and Office & Administration (70 | 4.6%).
Sales and Office Occupations by Sex
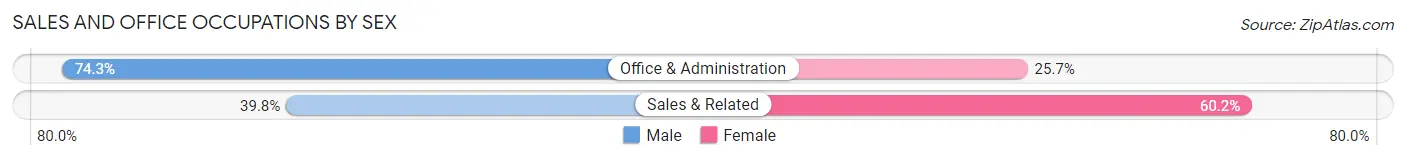
| Occupation | Male | Female |
| Sales & Related | 68 (39.8%) | 103 (60.2%) |
| Office & Administration | 52 (74.3%) | 18 (25.7%) |
| Total (Category) | 120 (49.8%) | 121 (50.2%) |
| Total (Overall) | 834 (55.3%) | 674 (44.7%) |
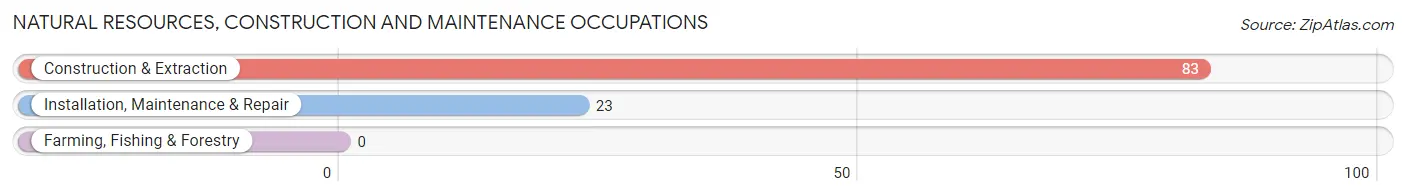
Natural Resources, Construction and Maintenance Occupations
The most common Natural Resources, Construction and Maintenance occupations in Wesleyville borough are Construction & Extraction (83 | 5.5%), and Installation, Maintenance & Repair (23 | 1.5%).
Natural Resources, Construction and Maintenance Occupations by Sex
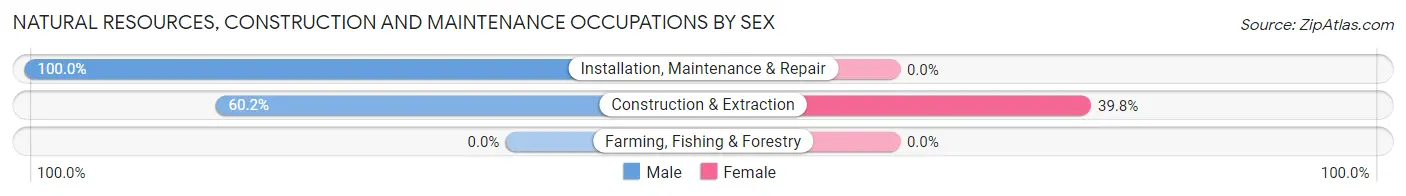
| Occupation | Male | Female |
| Farming, Fishing & Forestry | 0 (0.0%) | 0 (0.0%) |
| Construction & Extraction | 50 (60.2%) | 33 (39.8%) |
| Installation, Maintenance & Repair | 23 (100.0%) | 0 (0.0%) |
| Total (Category) | 73 (68.9%) | 33 (31.1%) |
| Total (Overall) | 834 (55.3%) | 674 (44.7%) |
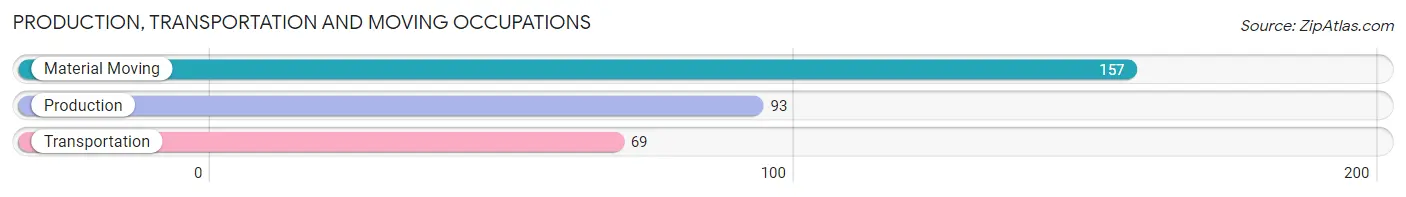
Production, Transportation and Moving Occupations
The most common Production, Transportation and Moving occupations in Wesleyville borough are Material Moving (157 | 10.4%), Production (93 | 6.2%), and Transportation (69 | 4.6%).
Production, Transportation and Moving Occupations by Sex
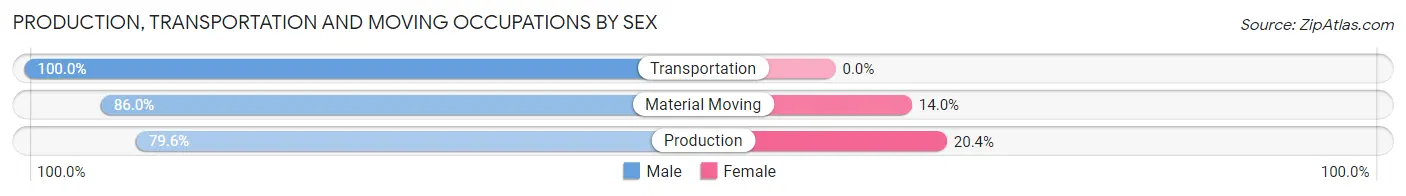
| Occupation | Male | Female |
| Production | 74 (79.6%) | 19 (20.4%) |
| Transportation | 69 (100.0%) | 0 (0.0%) |
| Material Moving | 135 (86.0%) | 22 (14.0%) |
| Total (Category) | 278 (87.2%) | 41 (12.9%) |
| Total (Overall) | 834 (55.3%) | 674 (44.7%) |
Employment Industries by Sex in Wesleyville borough
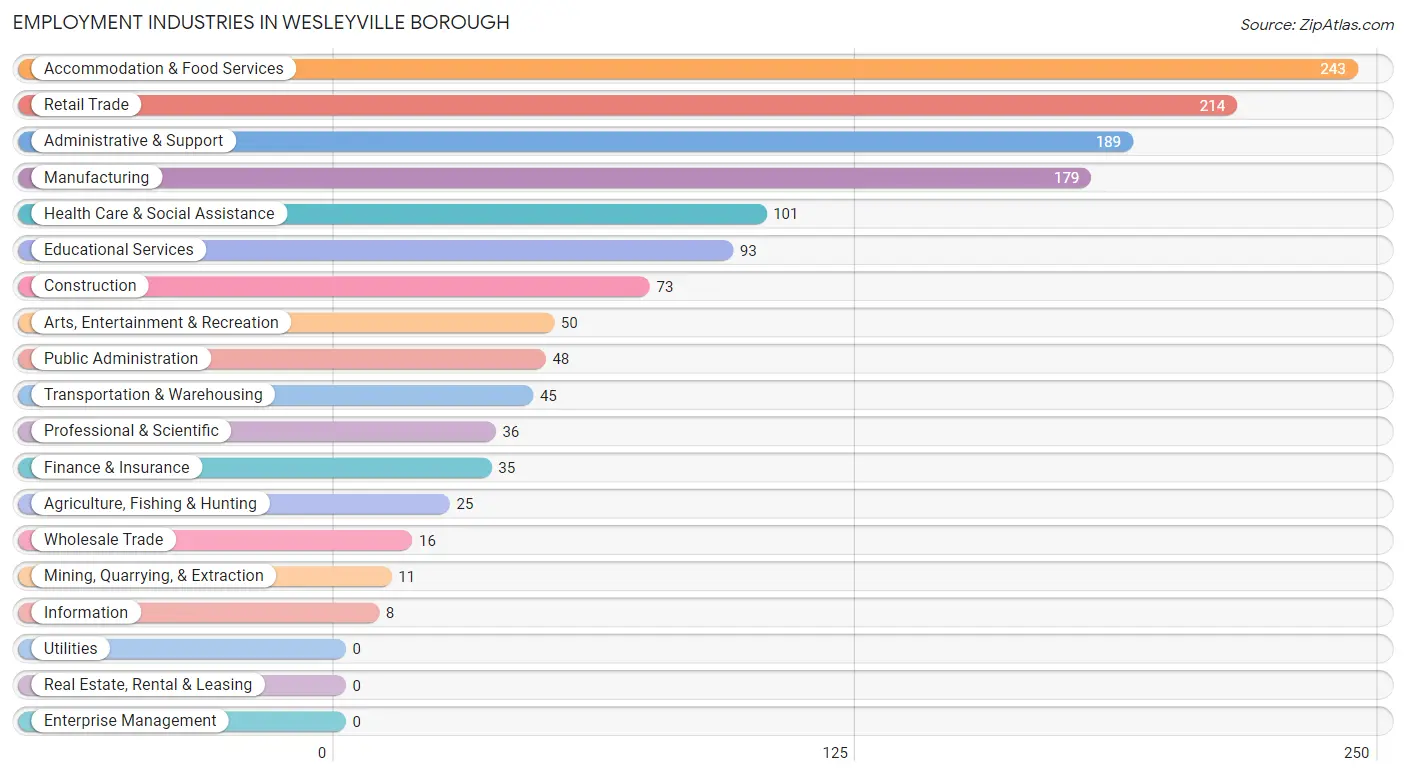
Employment Industries in Wesleyville borough
The major employment industries in Wesleyville borough include Accommodation & Food Services (243 | 16.1%), Retail Trade (214 | 14.2%), Administrative & Support (189 | 12.5%), Manufacturing (179 | 11.9%), and Health Care & Social Assistance (101 | 6.7%).
Employment Industries by Sex in Wesleyville borough
The Wesleyville borough industries that see more men than women are Mining, Quarrying, & Extraction (100.0%), Wholesale Trade (100.0%), and Professional & Scientific (100.0%), whereas the industries that tend to have a higher number of women are Agriculture, Fishing & Hunting (100.0%), Information (100.0%), and Health Care & Social Assistance (99.0%).
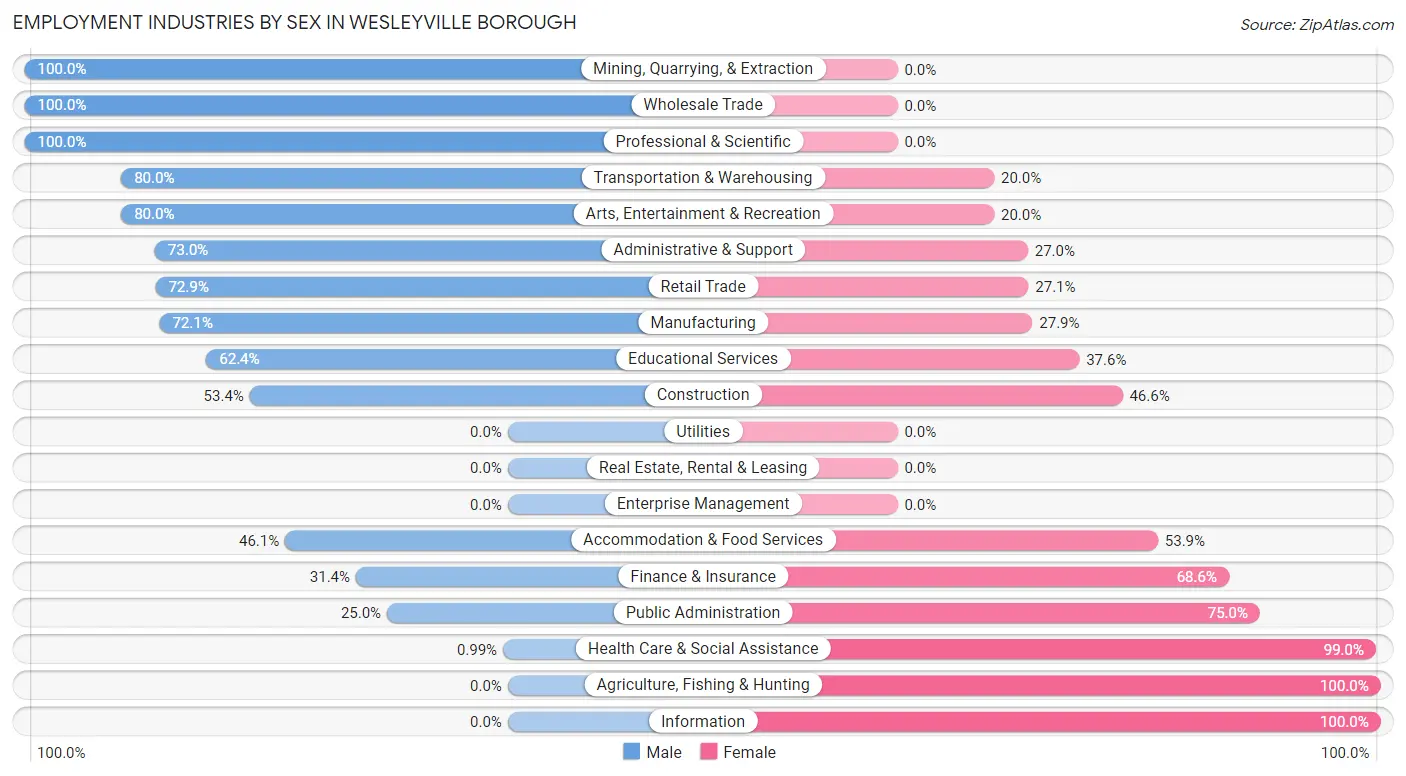
| Industry | Male | Female |
| Agriculture, Fishing & Hunting | 0 (0.0%) | 25 (100.0%) |
| Mining, Quarrying, & Extraction | 11 (100.0%) | 0 (0.0%) |
| Construction | 39 (53.4%) | 34 (46.6%) |
| Manufacturing | 129 (72.1%) | 50 (27.9%) |
| Wholesale Trade | 16 (100.0%) | 0 (0.0%) |
| Retail Trade | 156 (72.9%) | 58 (27.1%) |
| Transportation & Warehousing | 36 (80.0%) | 9 (20.0%) |
| Utilities | 0 (0.0%) | 0 (0.0%) |
| Information | 0 (0.0%) | 8 (100.0%) |
| Finance & Insurance | 11 (31.4%) | 24 (68.6%) |
| Real Estate, Rental & Leasing | 0 (0.0%) | 0 (0.0%) |
| Professional & Scientific | 36 (100.0%) | 0 (0.0%) |
| Enterprise Management | 0 (0.0%) | 0 (0.0%) |
| Administrative & Support | 138 (73.0%) | 51 (27.0%) |
| Educational Services | 58 (62.4%) | 35 (37.6%) |
| Health Care & Social Assistance | 1 (1.0%) | 100 (99.0%) |
| Arts, Entertainment & Recreation | 40 (80.0%) | 10 (20.0%) |
| Accommodation & Food Services | 112 (46.1%) | 131 (53.9%) |
| Public Administration | 12 (25.0%) | 36 (75.0%) |
| Total | 834 (55.3%) | 674 (44.7%) |
Education in Wesleyville borough
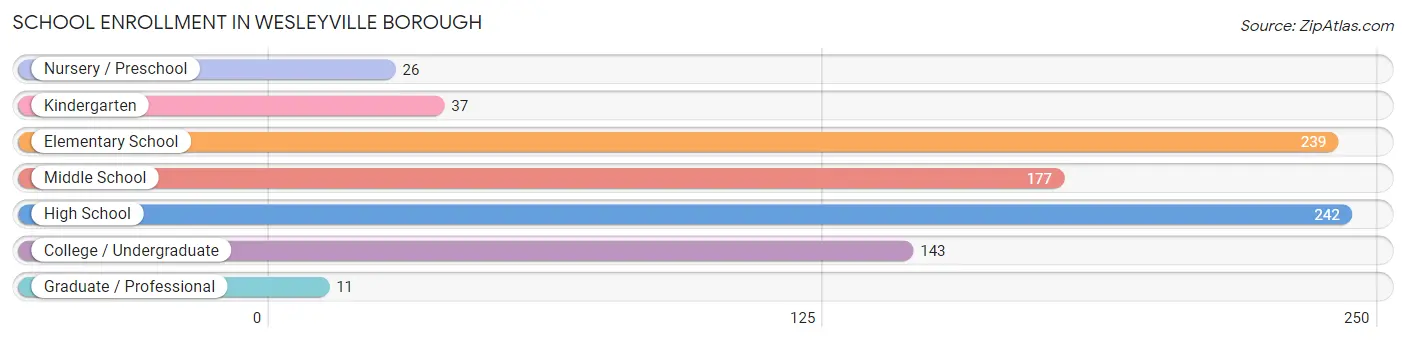
School Enrollment in Wesleyville borough
The most common levels of schooling among the 875 students in Wesleyville borough are high school (242 | 27.7%), elementary school (239 | 27.3%), and middle school (177 | 20.2%).
| School Level | # Students | % Students |
| Nursery / Preschool | 26 | 3.0% |
| Kindergarten | 37 | 4.2% |
| Elementary School | 239 | 27.3% |
| Middle School | 177 | 20.2% |
| High School | 242 | 27.7% |
| College / Undergraduate | 143 | 16.3% |
| Graduate / Professional | 11 | 1.3% |
| Total | 875 | 100.0% |
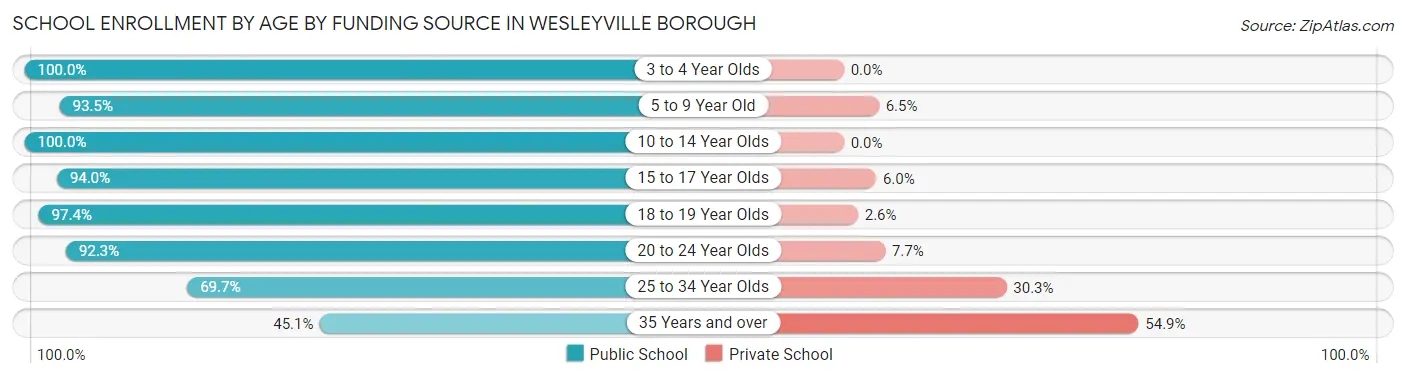
School Enrollment by Age by Funding Source in Wesleyville borough
Out of a total of 875 students who are enrolled in schools in Wesleyville borough, 114 (13.0%) attend a private institution, while the remaining 761 (87.0%) are enrolled in public schools. The age group of 35 years and over has the highest likelihood of being enrolled in private schools, with 73 (54.9% in the age bracket) enrolled. Conversely, the age group of 3 to 4 year olds has the lowest likelihood of being enrolled in a private school, with 26 (100.0% in the age bracket) attending a public institution.
| Age Bracket | Public School | Private School |
| 3 to 4 Year Olds | 26 (100.0%) | 0 (0.0%) |
| 5 to 9 Year Old | 258 (93.5%) | 18 (6.5%) |
| 10 to 14 Year Olds | 177 (100.0%) | 0 (0.0%) |
| 15 to 17 Year Olds | 156 (94.0%) | 10 (6.0%) |
| 18 to 19 Year Olds | 37 (97.4%) | 1 (2.6%) |
| 20 to 24 Year Olds | 24 (92.3%) | 2 (7.7%) |
| 25 to 34 Year Olds | 23 (69.7%) | 10 (30.3%) |
| 35 Years and over | 60 (45.1%) | 73 (54.9%) |
| Total | 761 (87.0%) | 114 (13.0%) |
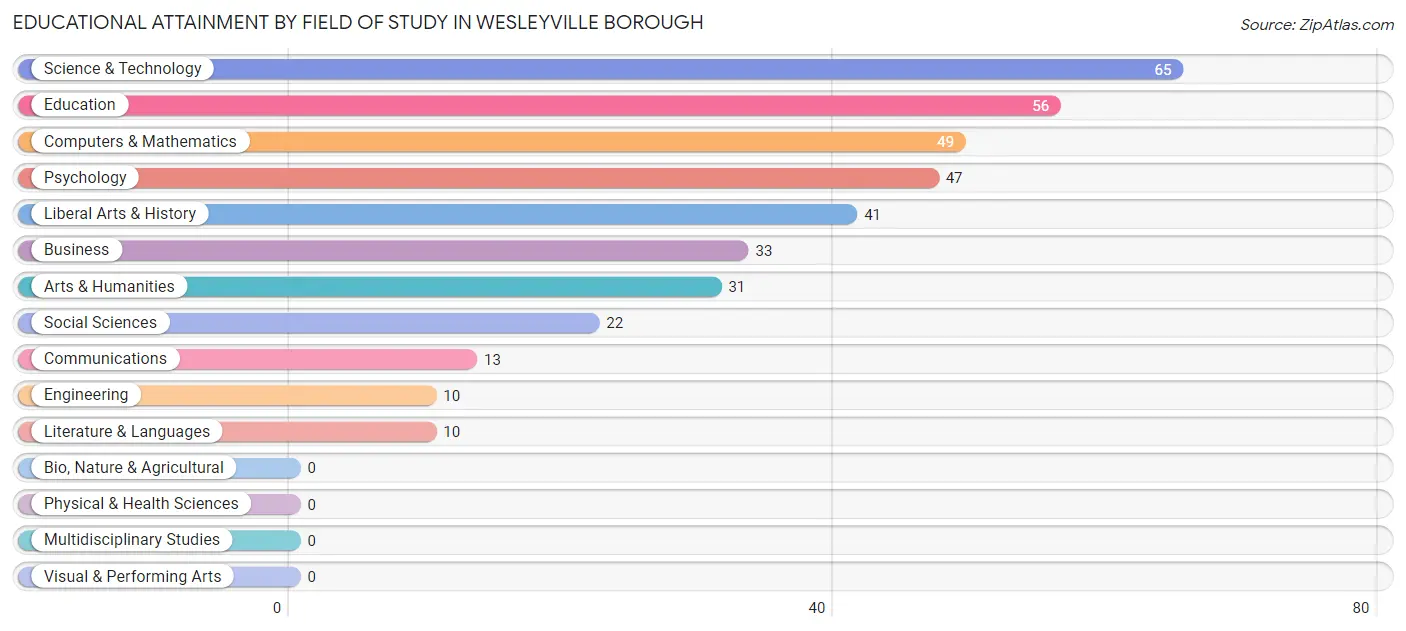
Educational Attainment by Field of Study in Wesleyville borough
Science & technology (65 | 17.2%), education (56 | 14.8%), computers & mathematics (49 | 13.0%), psychology (47 | 12.5%), and liberal arts & history (41 | 10.9%) are the most common fields of study among 377 individuals in Wesleyville borough who have obtained a bachelor's degree or higher.
| Field of Study | # Graduates | % Graduates |
| Computers & Mathematics | 49 | 13.0% |
| Bio, Nature & Agricultural | 0 | 0.0% |
| Physical & Health Sciences | 0 | 0.0% |
| Psychology | 47 | 12.5% |
| Social Sciences | 22 | 5.8% |
| Engineering | 10 | 2.6% |
| Multidisciplinary Studies | 0 | 0.0% |
| Science & Technology | 65 | 17.2% |
| Business | 33 | 8.7% |
| Education | 56 | 14.8% |
| Literature & Languages | 10 | 2.6% |
| Liberal Arts & History | 41 | 10.9% |
| Visual & Performing Arts | 0 | 0.0% |
| Communications | 13 | 3.5% |
| Arts & Humanities | 31 | 8.2% |
| Total | 377 | 100.0% |
Transportation & Commute in Wesleyville borough
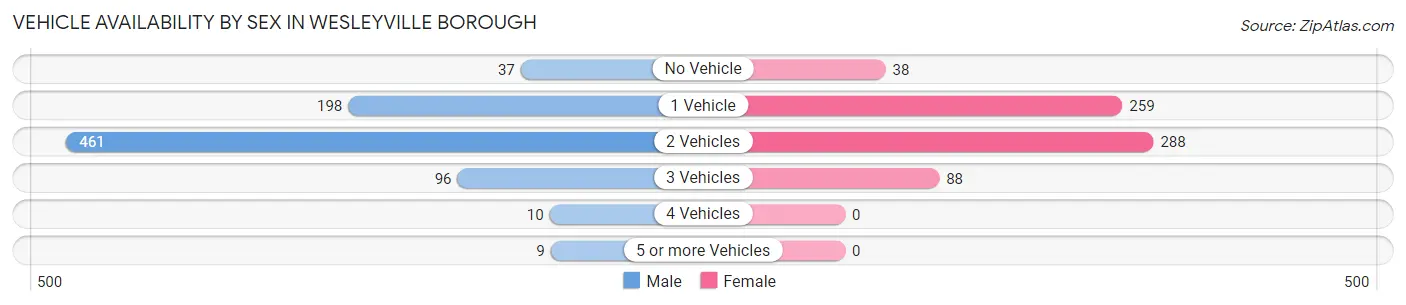
Vehicle Availability by Sex in Wesleyville borough
The most prevalent vehicle ownership categories in Wesleyville borough are males with 2 vehicles (461, accounting for 56.8%) and females with 2 vehicles (288, making up 68.5%).
| Vehicles Available | Male | Female |
| No Vehicle | 37 (4.6%) | 38 (5.7%) |
| 1 Vehicle | 198 (24.4%) | 259 (38.5%) |
| 2 Vehicles | 461 (56.8%) | 288 (42.8%) |
| 3 Vehicles | 96 (11.8%) | 88 (13.1%) |
| 4 Vehicles | 10 (1.2%) | 0 (0.0%) |
| 5 or more Vehicles | 9 (1.1%) | 0 (0.0%) |
| Total | 811 (100.0%) | 673 (100.0%) |
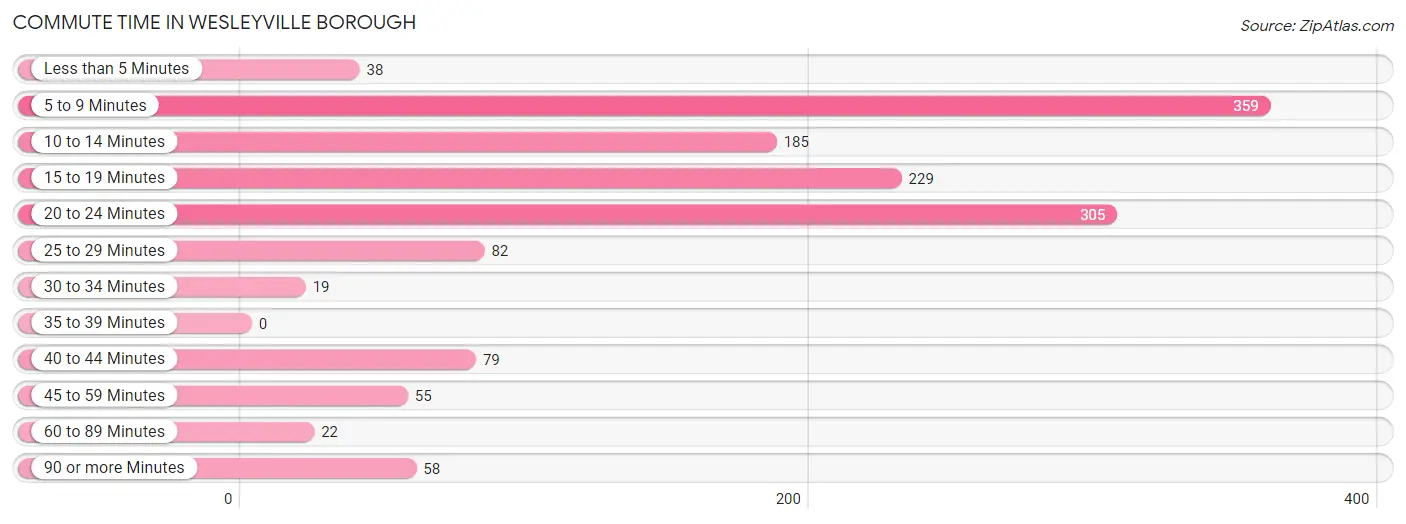
Commute Time in Wesleyville borough
The most frequently occuring commute durations in Wesleyville borough are 5 to 9 minutes (359 commuters, 25.1%), 20 to 24 minutes (305 commuters, 21.3%), and 15 to 19 minutes (229 commuters, 16.0%).
| Commute Time | # Commuters | % Commuters |
| Less than 5 Minutes | 38 | 2.7% |
| 5 to 9 Minutes | 359 | 25.1% |
| 10 to 14 Minutes | 185 | 12.9% |
| 15 to 19 Minutes | 229 | 16.0% |
| 20 to 24 Minutes | 305 | 21.3% |
| 25 to 29 Minutes | 82 | 5.7% |
| 30 to 34 Minutes | 19 | 1.3% |
| 35 to 39 Minutes | 0 | 0.0% |
| 40 to 44 Minutes | 79 | 5.5% |
| 45 to 59 Minutes | 55 | 3.8% |
| 60 to 89 Minutes | 22 | 1.5% |
| 90 or more Minutes | 58 | 4.1% |
Commute Time by Sex in Wesleyville borough
The most common commute times in Wesleyville borough are 20 to 24 minutes (195 commuters, 24.9%) for males and 5 to 9 minutes (203 commuters, 31.4%) for females.
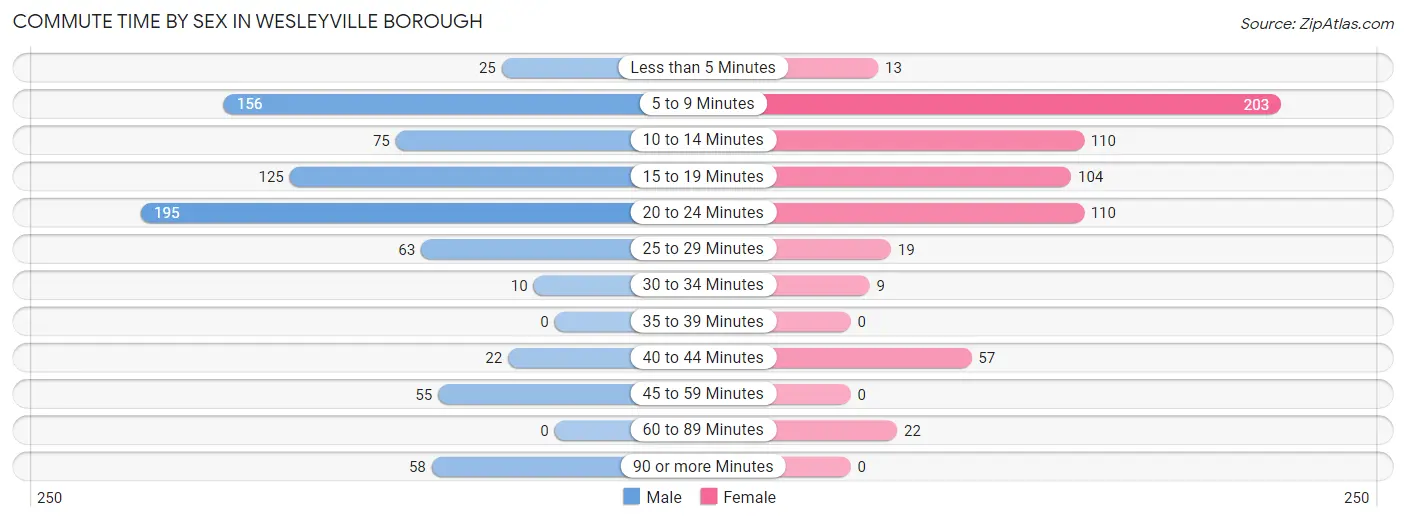
| Commute Time | Male | Female |
| Less than 5 Minutes | 25 (3.2%) | 13 (2.0%) |
| 5 to 9 Minutes | 156 (19.9%) | 203 (31.4%) |
| 10 to 14 Minutes | 75 (9.6%) | 110 (17.0%) |
| 15 to 19 Minutes | 125 (15.9%) | 104 (16.1%) |
| 20 to 24 Minutes | 195 (24.9%) | 110 (17.0%) |
| 25 to 29 Minutes | 63 (8.0%) | 19 (2.9%) |
| 30 to 34 Minutes | 10 (1.3%) | 9 (1.4%) |
| 35 to 39 Minutes | 0 (0.0%) | 0 (0.0%) |
| 40 to 44 Minutes | 22 (2.8%) | 57 (8.8%) |
| 45 to 59 Minutes | 55 (7.0%) | 0 (0.0%) |
| 60 to 89 Minutes | 0 (0.0%) | 22 (3.4%) |
| 90 or more Minutes | 58 (7.4%) | 0 (0.0%) |
Time of Departure to Work by Sex in Wesleyville borough
The most frequent times of departure to work in Wesleyville borough are 12:00 PM to 3:59 PM (157, 20.0%) for males and 6:00 AM to 6:29 AM (140, 21.6%) for females.
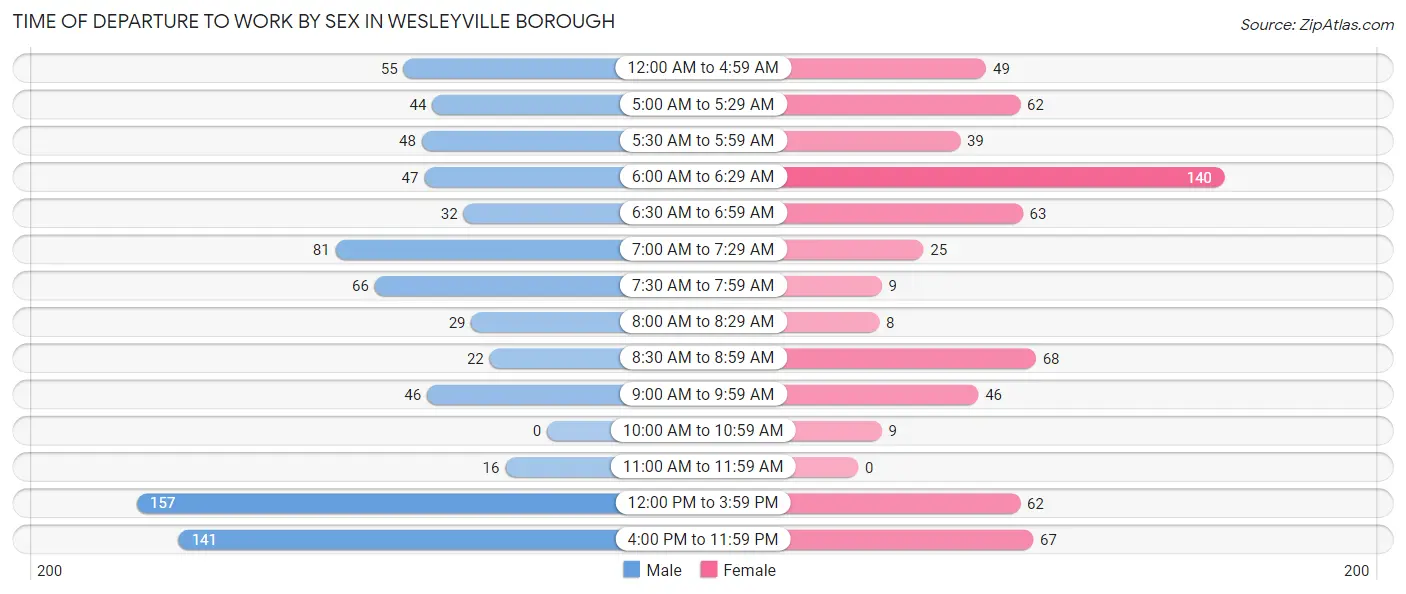
| Time of Departure | Male | Female |
| 12:00 AM to 4:59 AM | 55 (7.0%) | 49 (7.6%) |
| 5:00 AM to 5:29 AM | 44 (5.6%) | 62 (9.6%) |
| 5:30 AM to 5:59 AM | 48 (6.1%) | 39 (6.0%) |
| 6:00 AM to 6:29 AM | 47 (6.0%) | 140 (21.6%) |
| 6:30 AM to 6:59 AM | 32 (4.1%) | 63 (9.7%) |
| 7:00 AM to 7:29 AM | 81 (10.3%) | 25 (3.9%) |
| 7:30 AM to 7:59 AM | 66 (8.4%) | 9 (1.4%) |
| 8:00 AM to 8:29 AM | 29 (3.7%) | 8 (1.2%) |
| 8:30 AM to 8:59 AM | 22 (2.8%) | 68 (10.5%) |
| 9:00 AM to 9:59 AM | 46 (5.9%) | 46 (7.1%) |
| 10:00 AM to 10:59 AM | 0 (0.0%) | 9 (1.4%) |
| 11:00 AM to 11:59 AM | 16 (2.0%) | 0 (0.0%) |
| 12:00 PM to 3:59 PM | 157 (20.0%) | 62 (9.6%) |
| 4:00 PM to 11:59 PM | 141 (18.0%) | 67 (10.4%) |
| Total | 784 (100.0%) | 647 (100.0%) |
Housing Occupancy in Wesleyville borough
Occupancy by Ownership in Wesleyville borough
Of the total 1,336 dwellings in Wesleyville borough, owner-occupied units account for 945 (70.7%), while renter-occupied units make up 391 (29.3%).
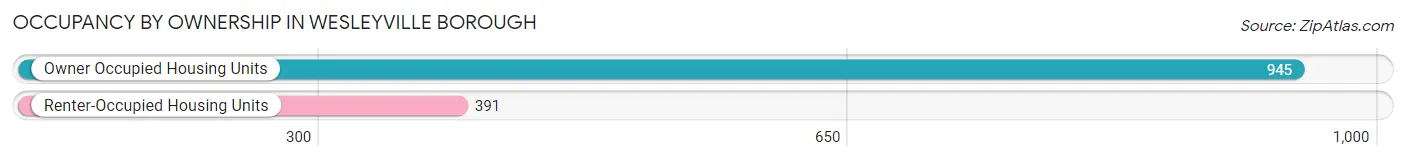
| Occupancy | # Housing Units | % Housing Units |
| Owner Occupied Housing Units | 945 | 70.7% |
| Renter-Occupied Housing Units | 391 | 29.3% |
| Total Occupied Housing Units | 1,336 | 100.0% |
Occupancy by Household Size in Wesleyville borough
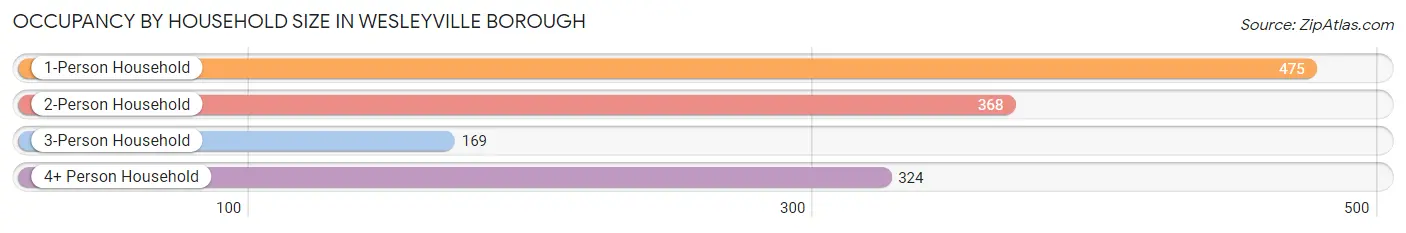
| Household Size | # Housing Units | % Housing Units |
| 1-Person Household | 475 | 35.5% |
| 2-Person Household | 368 | 27.5% |
| 3-Person Household | 169 | 12.7% |
| 4+ Person Household | 324 | 24.2% |
| Total Housing Units | 1,336 | 100.0% |
Occupancy by Ownership by Household Size in Wesleyville borough
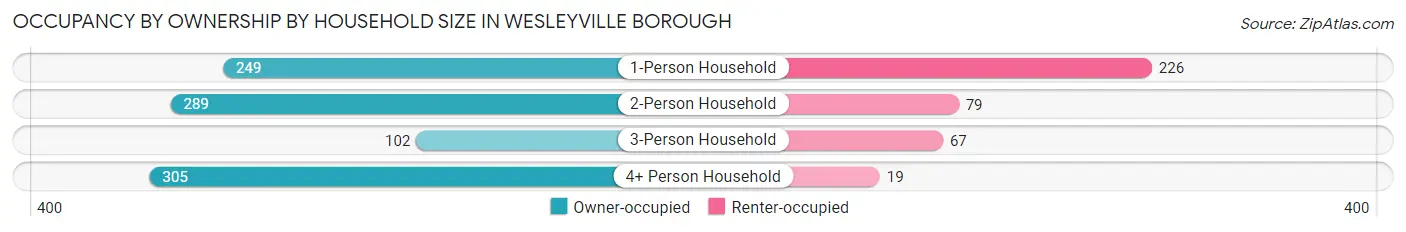
| Household Size | Owner-occupied | Renter-occupied |
| 1-Person Household | 249 (52.4%) | 226 (47.6%) |
| 2-Person Household | 289 (78.5%) | 79 (21.5%) |
| 3-Person Household | 102 (60.4%) | 67 (39.6%) |
| 4+ Person Household | 305 (94.1%) | 19 (5.9%) |
| Total Housing Units | 945 (70.7%) | 391 (29.3%) |
Occupancy by Educational Attainment in Wesleyville borough
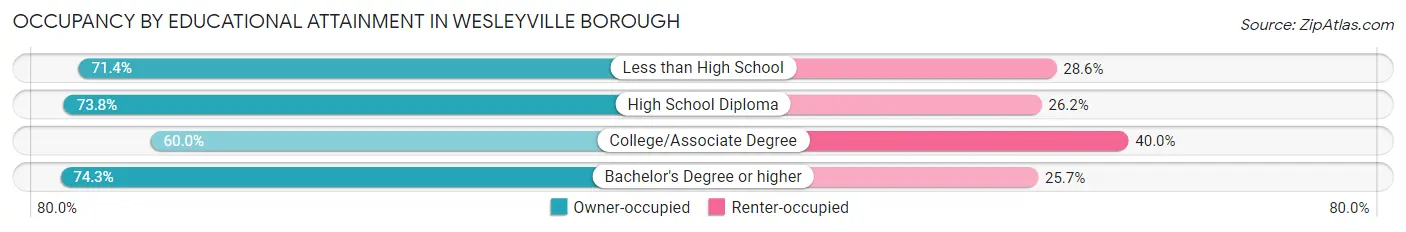
| Household Size | Owner-occupied | Renter-occupied |
| Less than High School | 105 (71.4%) | 42 (28.6%) |
| High School Diploma | 481 (73.8%) | 171 (26.2%) |
| College/Associate Degree | 168 (60.0%) | 112 (40.0%) |
| Bachelor's Degree or higher | 191 (74.3%) | 66 (25.7%) |
Occupancy by Age of Householder in Wesleyville borough
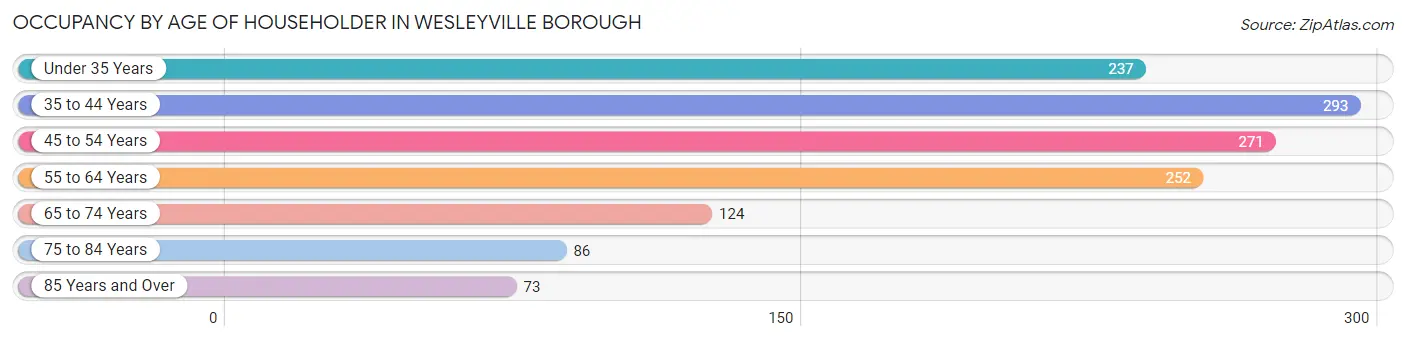
| Age Bracket | # Households | % Households |
| Under 35 Years | 237 | 17.7% |
| 35 to 44 Years | 293 | 21.9% |
| 45 to 54 Years | 271 | 20.3% |
| 55 to 64 Years | 252 | 18.9% |
| 65 to 74 Years | 124 | 9.3% |
| 75 to 84 Years | 86 | 6.4% |
| 85 Years and Over | 73 | 5.5% |
| Total | 1,336 | 100.0% |
Housing Finances in Wesleyville borough
Median Income by Occupancy in Wesleyville borough
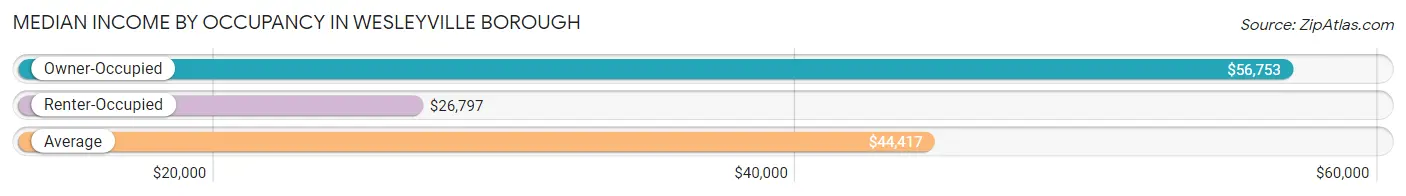
| Occupancy Type | # Households | Median Income |
| Owner-Occupied | 945 (70.7%) | $56,753 |
| Renter-Occupied | 391 (29.3%) | $26,797 |
| Average | 1,336 (100.0%) | $44,417 |
Occupancy by Householder Income Bracket in Wesleyville borough
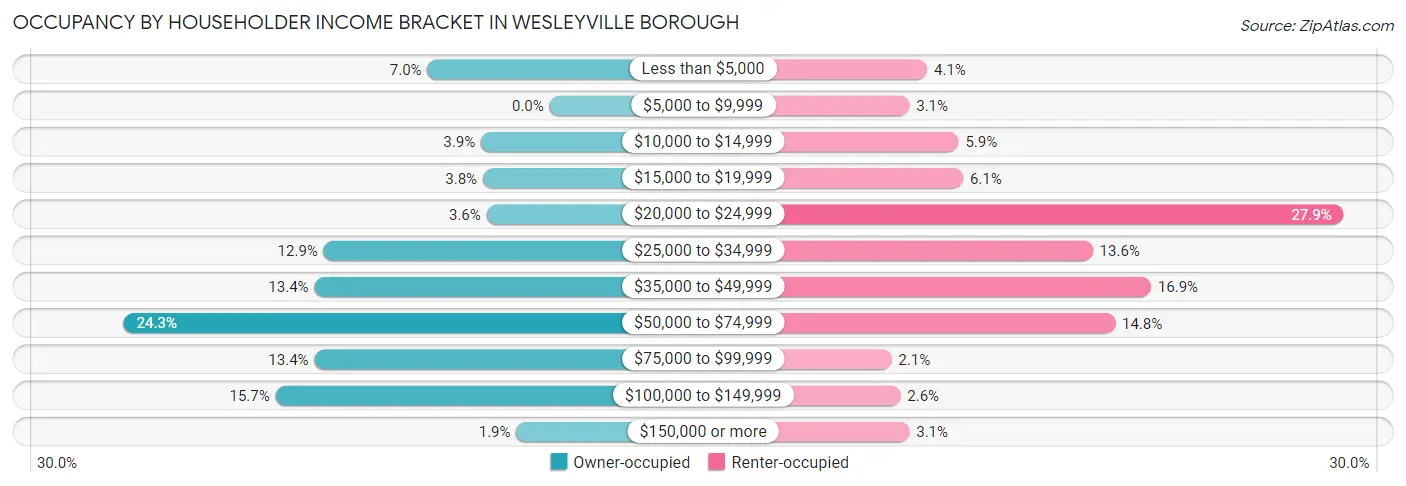
| Income Bracket | Owner-occupied | Renter-occupied |
| Less than $5,000 | 66 (7.0%) | 16 (4.1%) |
| $5,000 to $9,999 | 0 (0.0%) | 12 (3.1%) |
| $10,000 to $14,999 | 37 (3.9%) | 23 (5.9%) |
| $15,000 to $19,999 | 36 (3.8%) | 24 (6.1%) |
| $20,000 to $24,999 | 34 (3.6%) | 109 (27.9%) |
| $25,000 to $34,999 | 122 (12.9%) | 53 (13.6%) |
| $35,000 to $49,999 | 127 (13.4%) | 66 (16.9%) |
| $50,000 to $74,999 | 230 (24.3%) | 58 (14.8%) |
| $75,000 to $99,999 | 127 (13.4%) | 8 (2.1%) |
| $100,000 to $149,999 | 148 (15.7%) | 10 (2.6%) |
| $150,000 or more | 18 (1.9%) | 12 (3.1%) |
| Total | 945 (100.0%) | 391 (100.0%) |
Monthly Housing Cost Tiers in Wesleyville borough
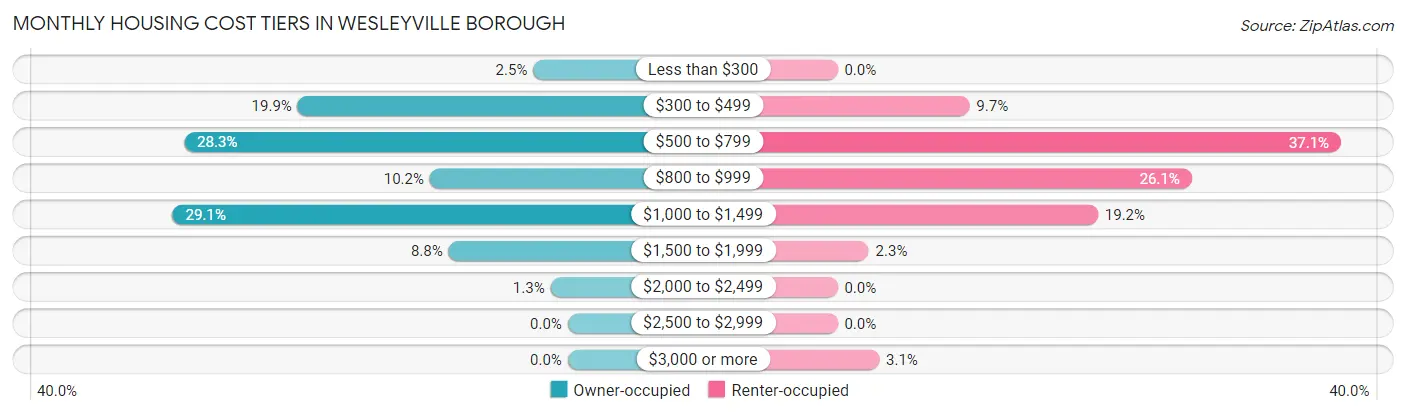
| Monthly Cost | Owner-occupied | Renter-occupied |
| Less than $300 | 24 (2.5%) | 0 (0.0%) |
| $300 to $499 | 188 (19.9%) | 38 (9.7%) |
| $500 to $799 | 267 (28.2%) | 145 (37.1%) |
| $800 to $999 | 96 (10.2%) | 102 (26.1%) |
| $1,000 to $1,499 | 275 (29.1%) | 75 (19.2%) |
| $1,500 to $1,999 | 83 (8.8%) | 9 (2.3%) |
| $2,000 to $2,499 | 12 (1.3%) | 0 (0.0%) |
| $2,500 to $2,999 | 0 (0.0%) | 0 (0.0%) |
| $3,000 or more | 0 (0.0%) | 12 (3.1%) |
| Total | 945 (100.0%) | 391 (100.0%) |
Physical Housing Characteristics in Wesleyville borough
Housing Structures in Wesleyville borough
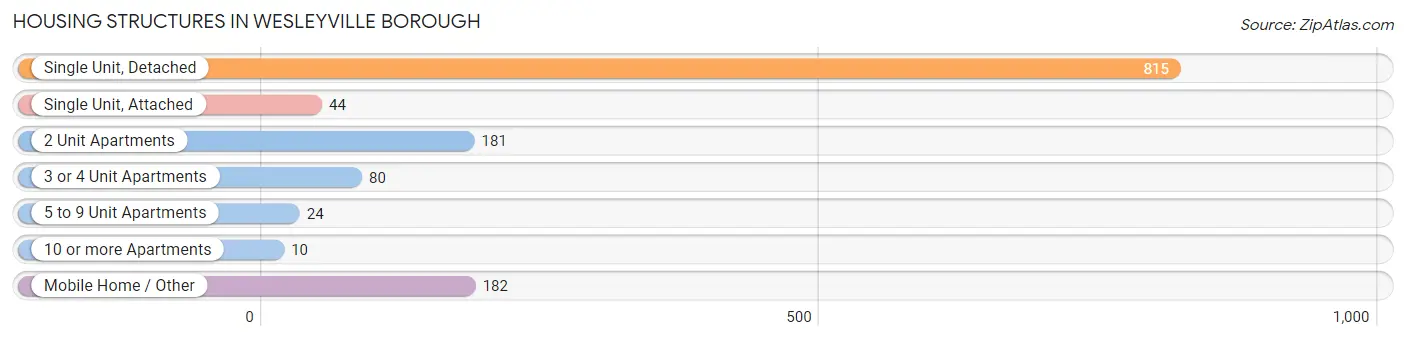
| Structure Type | # Housing Units | % Housing Units |
| Single Unit, Detached | 815 | 61.0% |
| Single Unit, Attached | 44 | 3.3% |
| 2 Unit Apartments | 181 | 13.6% |
| 3 or 4 Unit Apartments | 80 | 6.0% |
| 5 to 9 Unit Apartments | 24 | 1.8% |
| 10 or more Apartments | 10 | 0.7% |
| Mobile Home / Other | 182 | 13.6% |
| Total | 1,336 | 100.0% |
Housing Structures by Occupancy in Wesleyville borough
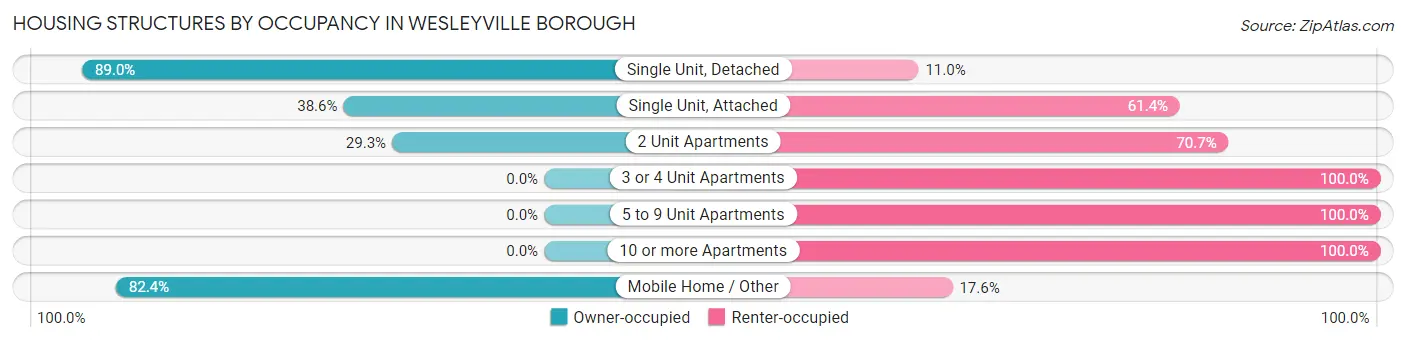
| Structure Type | Owner-occupied | Renter-occupied |
| Single Unit, Detached | 725 (89.0%) | 90 (11.0%) |
| Single Unit, Attached | 17 (38.6%) | 27 (61.4%) |
| 2 Unit Apartments | 53 (29.3%) | 128 (70.7%) |
| 3 or 4 Unit Apartments | 0 (0.0%) | 80 (100.0%) |
| 5 to 9 Unit Apartments | 0 (0.0%) | 24 (100.0%) |
| 10 or more Apartments | 0 (0.0%) | 10 (100.0%) |
| Mobile Home / Other | 150 (82.4%) | 32 (17.6%) |
| Total | 945 (70.7%) | 391 (29.3%) |
Housing Structures by Number of Rooms in Wesleyville borough
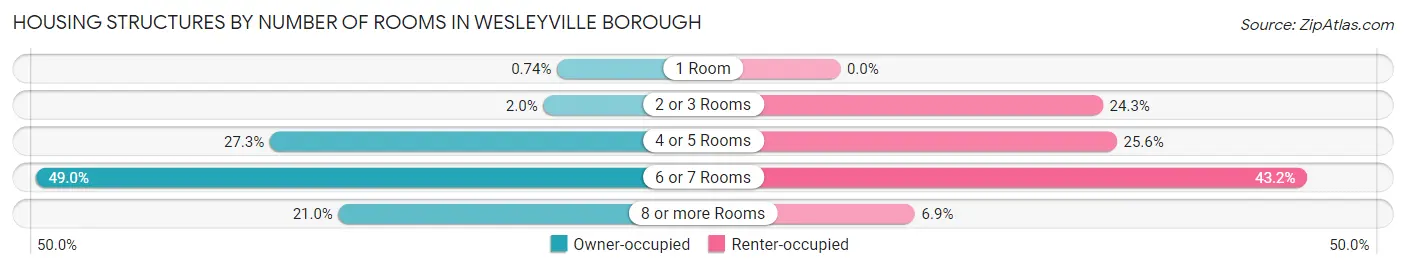
| Number of Rooms | Owner-occupied | Renter-occupied |
| 1 Room | 7 (0.7%) | 0 (0.0%) |
| 2 or 3 Rooms | 19 (2.0%) | 95 (24.3%) |
| 4 or 5 Rooms | 258 (27.3%) | 100 (25.6%) |
| 6 or 7 Rooms | 463 (49.0%) | 169 (43.2%) |
| 8 or more Rooms | 198 (20.9%) | 27 (6.9%) |
| Total | 945 (100.0%) | 391 (100.0%) |
Housing Structure by Heating Type in Wesleyville borough
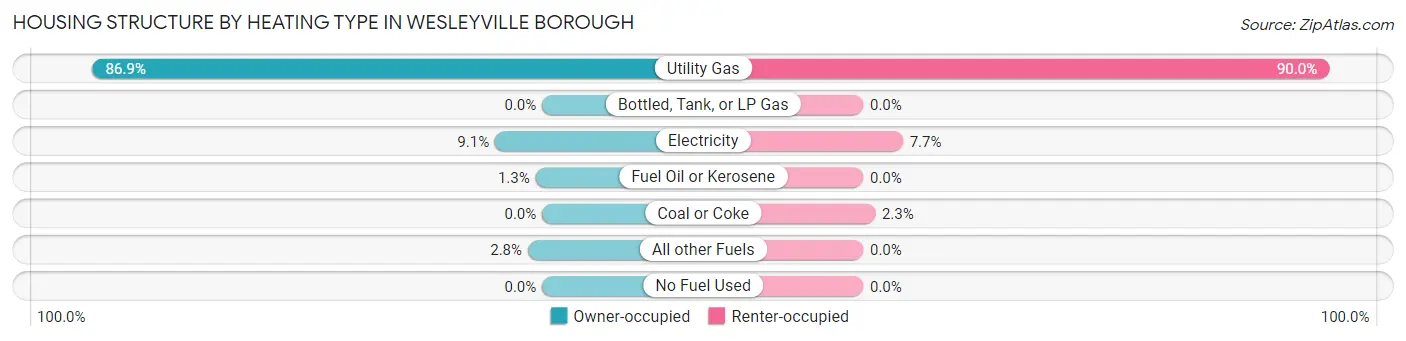
| Heating Type | Owner-occupied | Renter-occupied |
| Utility Gas | 821 (86.9%) | 352 (90.0%) |
| Bottled, Tank, or LP Gas | 0 (0.0%) | 0 (0.0%) |
| Electricity | 86 (9.1%) | 30 (7.7%) |
| Fuel Oil or Kerosene | 12 (1.3%) | 0 (0.0%) |
| Coal or Coke | 0 (0.0%) | 9 (2.3%) |
| All other Fuels | 26 (2.8%) | 0 (0.0%) |
| No Fuel Used | 0 (0.0%) | 0 (0.0%) |
| Total | 945 (100.0%) | 391 (100.0%) |
Household Vehicle Usage in Wesleyville borough
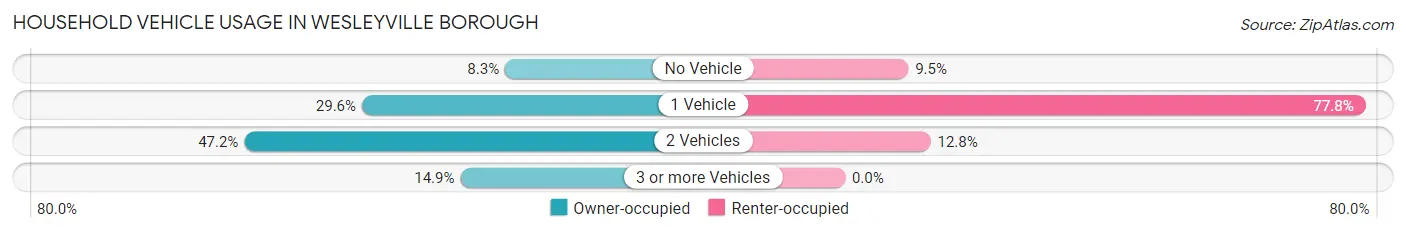
| Vehicles per Household | Owner-occupied | Renter-occupied |
| No Vehicle | 78 (8.3%) | 37 (9.5%) |
| 1 Vehicle | 280 (29.6%) | 304 (77.7%) |
| 2 Vehicles | 446 (47.2%) | 50 (12.8%) |
| 3 or more Vehicles | 141 (14.9%) | 0 (0.0%) |
| Total | 945 (100.0%) | 391 (100.0%) |
Real Estate & Mortgages in Wesleyville borough
Real Estate and Mortgage Overview in Wesleyville borough
| Characteristic | Without Mortgage | With Mortgage |
| Housing Units | 345 | 600 |
| Median Property Value | $70,700 | $99,800 |
| Median Household Income | $39,018 | $11 |
| Monthly Housing Costs | $475 | $0 |
| Real Estate Taxes | $1,536 | $52 |
Property Value by Mortgage Status in Wesleyville borough
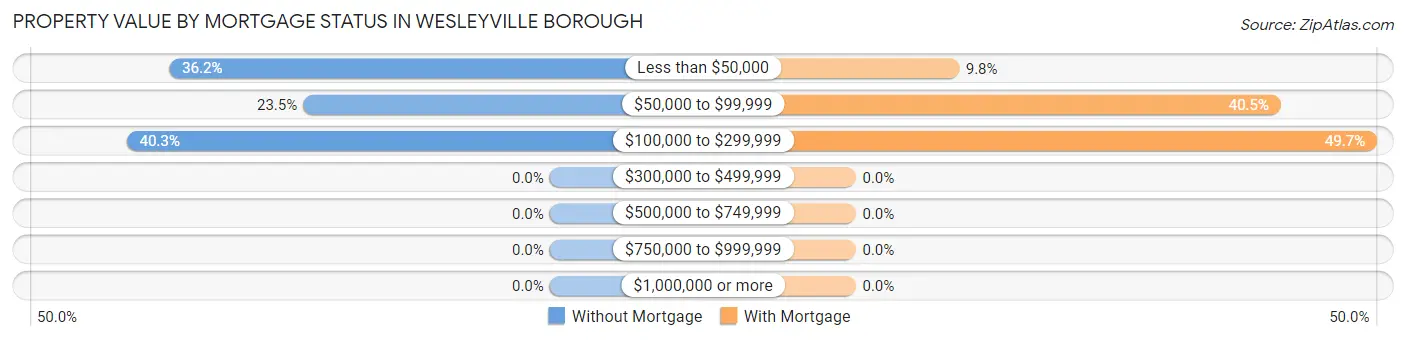
| Property Value | Without Mortgage | With Mortgage |
| Less than $50,000 | 125 (36.2%) | 59 (9.8%) |
| $50,000 to $99,999 | 81 (23.5%) | 243 (40.5%) |
| $100,000 to $299,999 | 139 (40.3%) | 298 (49.7%) |
| $300,000 to $499,999 | 0 (0.0%) | 0 (0.0%) |
| $500,000 to $749,999 | 0 (0.0%) | 0 (0.0%) |
| $750,000 to $999,999 | 0 (0.0%) | 0 (0.0%) |
| $1,000,000 or more | 0 (0.0%) | 0 (0.0%) |
| Total | 345 (100.0%) | 600 (100.0%) |
Household Income by Mortgage Status in Wesleyville borough
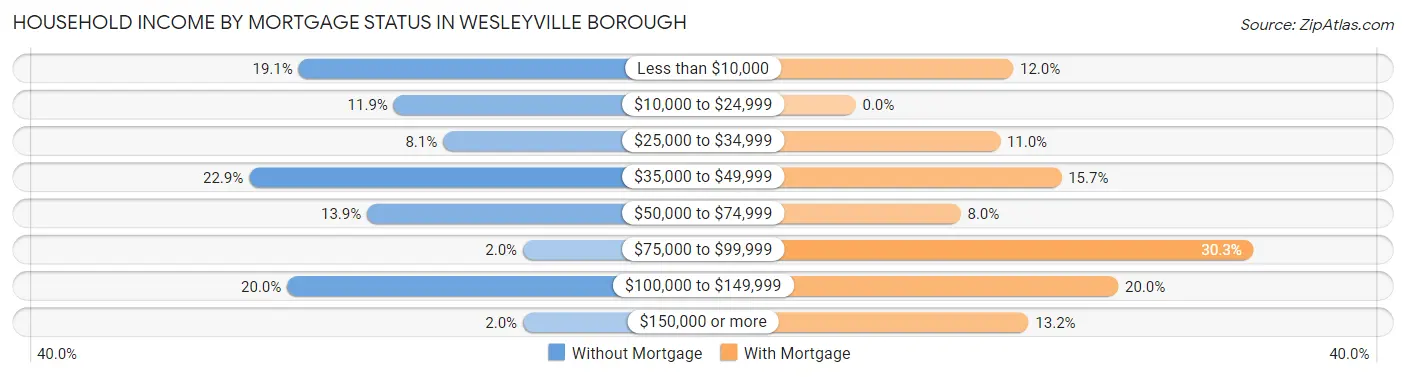
| Household Income | Without Mortgage | With Mortgage |
| Less than $10,000 | 66 (19.1%) | 72 (12.0%) |
| $10,000 to $24,999 | 41 (11.9%) | 0 (0.0%) |
| $25,000 to $34,999 | 28 (8.1%) | 66 (11.0%) |
| $35,000 to $49,999 | 79 (22.9%) | 94 (15.7%) |
| $50,000 to $74,999 | 48 (13.9%) | 48 (8.0%) |
| $75,000 to $99,999 | 7 (2.0%) | 182 (30.3%) |
| $100,000 to $149,999 | 69 (20.0%) | 120 (20.0%) |
| $150,000 or more | 7 (2.0%) | 79 (13.2%) |
| Total | 345 (100.0%) | 600 (100.0%) |
Property Value to Household Income Ratio in Wesleyville borough
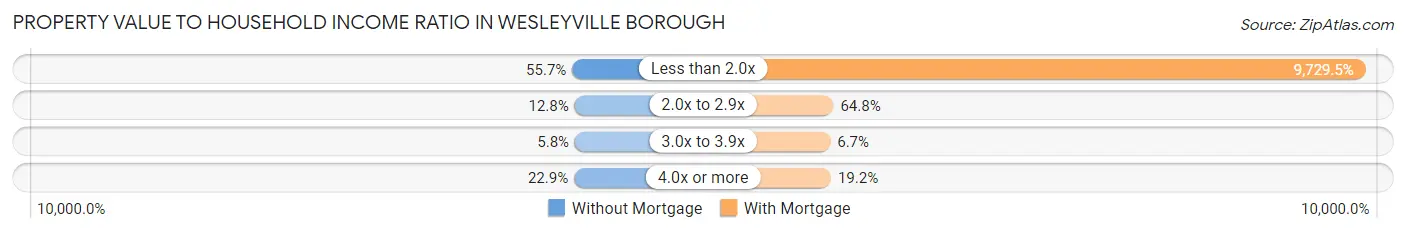
| Value-to-Income Ratio | Without Mortgage | With Mortgage |
| Less than 2.0x | 192 (55.6%) | 58,377 (9,729.5%) |
| 2.0x to 2.9x | 44 (12.8%) | 389 (64.8%) |
| 3.0x to 3.9x | 20 (5.8%) | 40 (6.7%) |
| 4.0x or more | 79 (22.9%) | 115 (19.2%) |
| Total | 345 (100.0%) | 600 (100.0%) |
Real Estate Taxes by Mortgage Status in Wesleyville borough
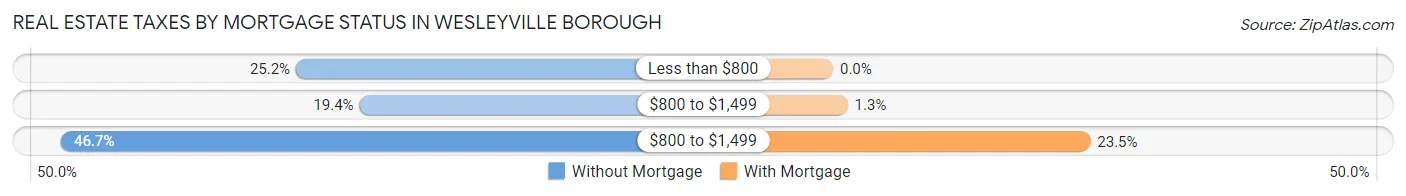
| Property Taxes | Without Mortgage | With Mortgage |
| Less than $800 | 87 (25.2%) | 0 (0.0%) |
| $800 to $1,499 | 67 (19.4%) | 8 (1.3%) |
| $800 to $1,499 | 161 (46.7%) | 141 (23.5%) |
| Total | 345 (100.0%) | 600 (100.0%) |
Health & Disability in Wesleyville borough
Health Insurance Coverage by Age in Wesleyville borough
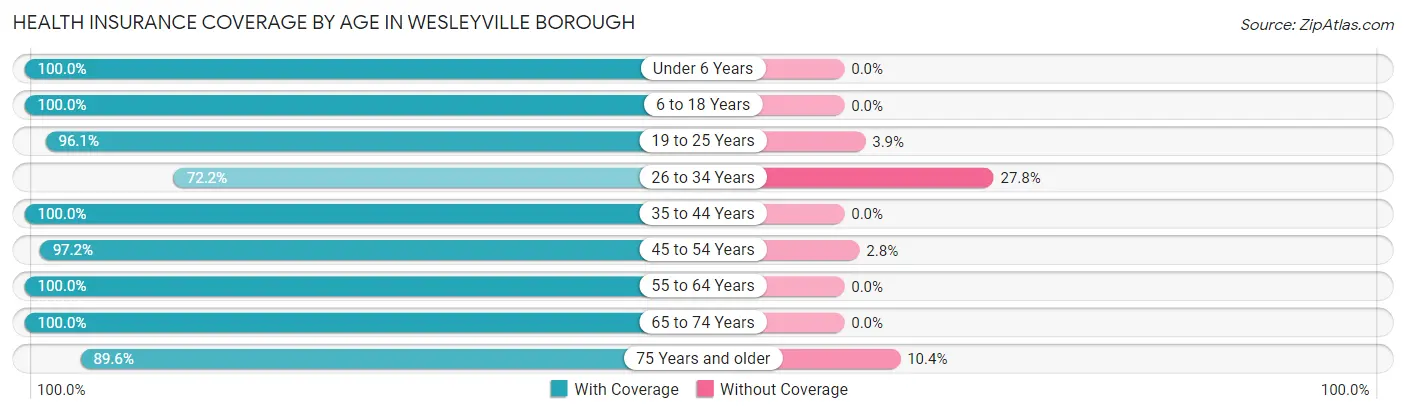
| Age Bracket | With Coverage | Without Coverage |
| Under 6 Years | 211 (100.0%) | 0 (0.0%) |
| 6 to 18 Years | 697 (100.0%) | 0 (0.0%) |
| 19 to 25 Years | 246 (96.1%) | 10 (3.9%) |
| 26 to 34 Years | 210 (72.2%) | 81 (27.8%) |
| 35 to 44 Years | 545 (100.0%) | 0 (0.0%) |
| 45 to 54 Years | 414 (97.2%) | 12 (2.8%) |
| 55 to 64 Years | 398 (100.0%) | 0 (0.0%) |
| 65 to 74 Years | 174 (100.0%) | 0 (0.0%) |
| 75 Years and older | 189 (89.6%) | 22 (10.4%) |
| Total | 3,084 (96.1%) | 125 (3.9%) |
Health Insurance Coverage by Citizenship Status in Wesleyville borough
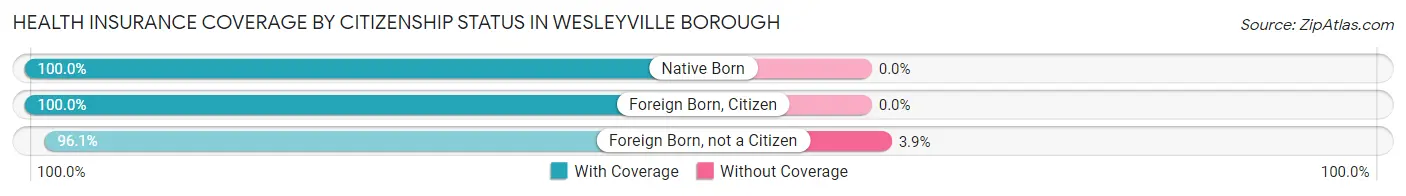
| Citizenship Status | With Coverage | Without Coverage |
| Native Born | 211 (100.0%) | 0 (0.0%) |
| Foreign Born, Citizen | 697 (100.0%) | 0 (0.0%) |
| Foreign Born, not a Citizen | 246 (96.1%) | 10 (3.9%) |
Health Insurance Coverage by Household Income in Wesleyville borough
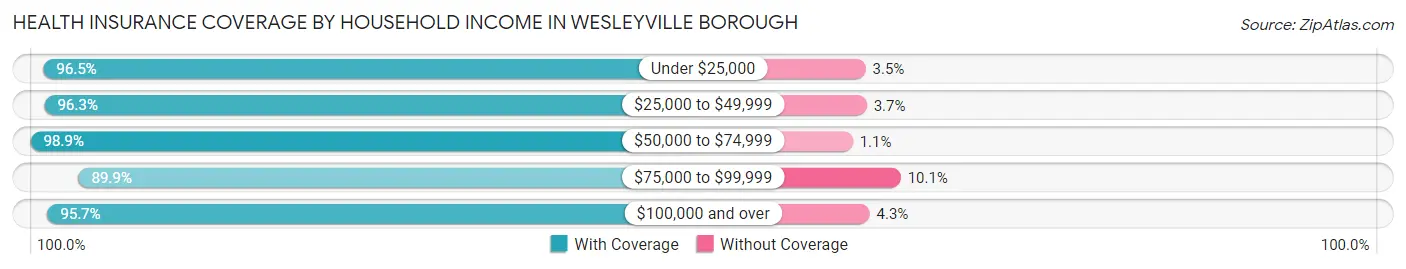
| Household Income | With Coverage | Without Coverage |
| Under $25,000 | 601 (96.5%) | 22 (3.5%) |
| $25,000 to $49,999 | 774 (96.3%) | 30 (3.7%) |
| $50,000 to $74,999 | 802 (98.9%) | 9 (1.1%) |
| $75,000 to $99,999 | 356 (89.9%) | 40 (10.1%) |
| $100,000 and over | 538 (95.7%) | 24 (4.3%) |
Public vs Private Health Insurance Coverage by Age in Wesleyville borough
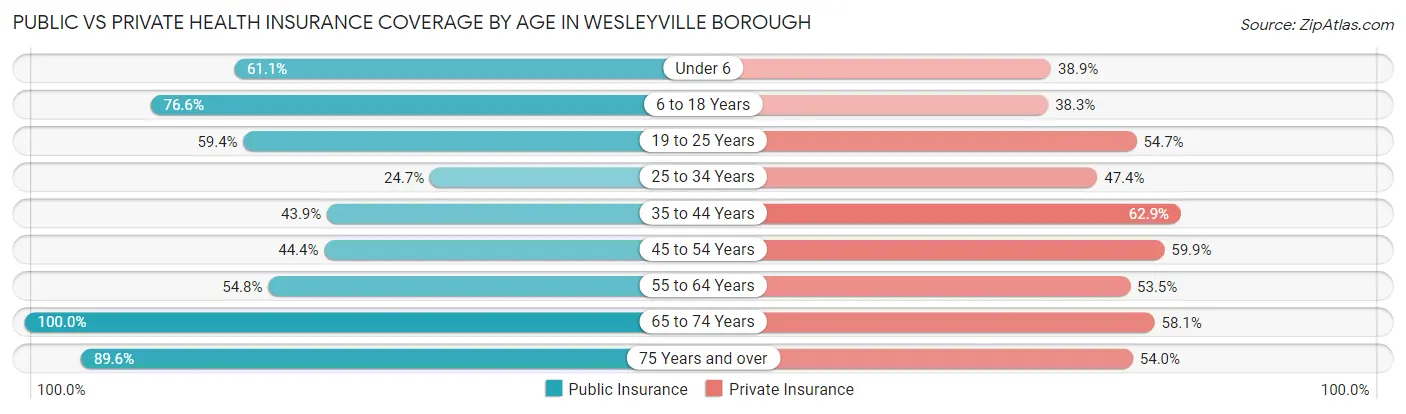
| Age Bracket | Public Insurance | Private Insurance |
| Under 6 | 129 (61.1%) | 82 (38.9%) |
| 6 to 18 Years | 534 (76.6%) | 267 (38.3%) |
| 19 to 25 Years | 152 (59.4%) | 140 (54.7%) |
| 25 to 34 Years | 72 (24.7%) | 138 (47.4%) |
| 35 to 44 Years | 239 (43.9%) | 343 (62.9%) |
| 45 to 54 Years | 189 (44.4%) | 255 (59.9%) |
| 55 to 64 Years | 218 (54.8%) | 213 (53.5%) |
| 65 to 74 Years | 174 (100.0%) | 101 (58.1%) |
| 75 Years and over | 189 (89.6%) | 114 (54.0%) |
| Total | 1,896 (59.1%) | 1,653 (51.5%) |
Disability Status by Sex by Age in Wesleyville borough
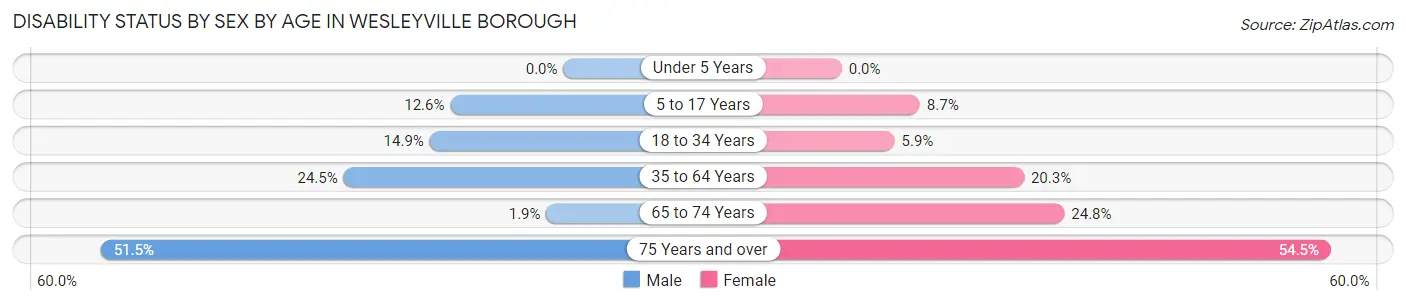
| Age Bracket | Male | Female |
| Under 5 Years | 0 (0.0%) | 0 (0.0%) |
| 5 to 17 Years | 34 (12.6%) | 32 (8.7%) |
| 18 to 34 Years | 56 (14.9%) | 14 (5.9%) |
| 35 to 64 Years | 165 (24.5%) | 141 (20.3%) |
| 65 to 74 Years | 1 (1.9%) | 30 (24.8%) |
| 75 Years and over | 51 (51.5%) | 61 (54.5%) |
Disability Class by Sex by Age in Wesleyville borough
Disability Class: Hearing Difficulty
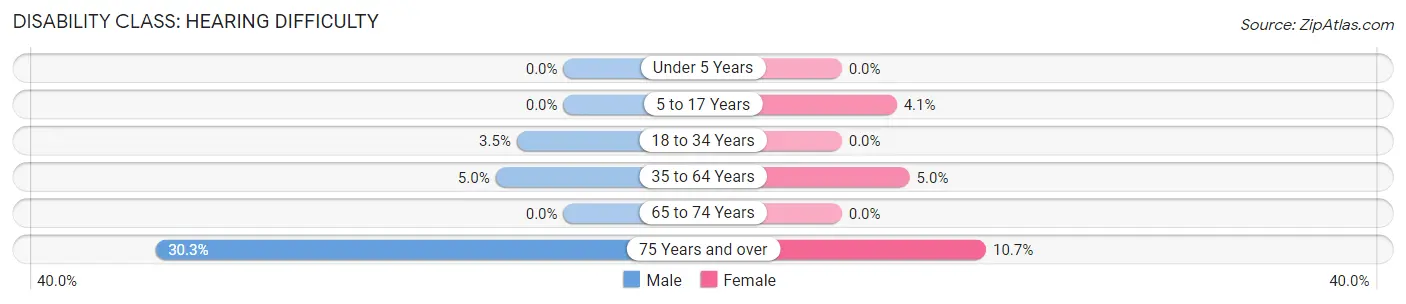
| Age Bracket | Male | Female |
| Under 5 Years | 0 (0.0%) | 0 (0.0%) |
| 5 to 17 Years | 0 (0.0%) | 15 (4.1%) |
| 18 to 34 Years | 13 (3.5%) | 0 (0.0%) |
| 35 to 64 Years | 34 (5.0%) | 35 (5.0%) |
| 65 to 74 Years | 0 (0.0%) | 0 (0.0%) |
| 75 Years and over | 30 (30.3%) | 12 (10.7%) |
Disability Class: Vision Difficulty
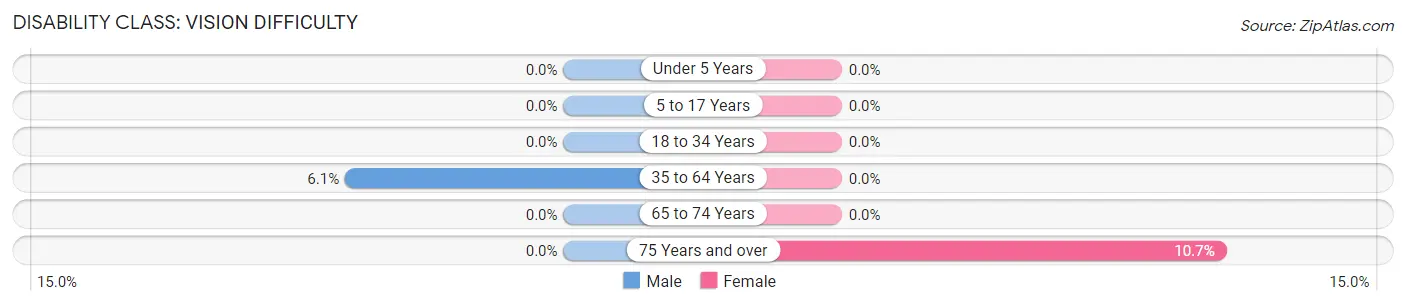
| Age Bracket | Male | Female |
| Under 5 Years | 0 (0.0%) | 0 (0.0%) |
| 5 to 17 Years | 0 (0.0%) | 0 (0.0%) |
| 18 to 34 Years | 0 (0.0%) | 0 (0.0%) |
| 35 to 64 Years | 41 (6.1%) | 0 (0.0%) |
| 65 to 74 Years | 0 (0.0%) | 0 (0.0%) |
| 75 Years and over | 0 (0.0%) | 12 (10.7%) |
Disability Class: Cognitive Difficulty
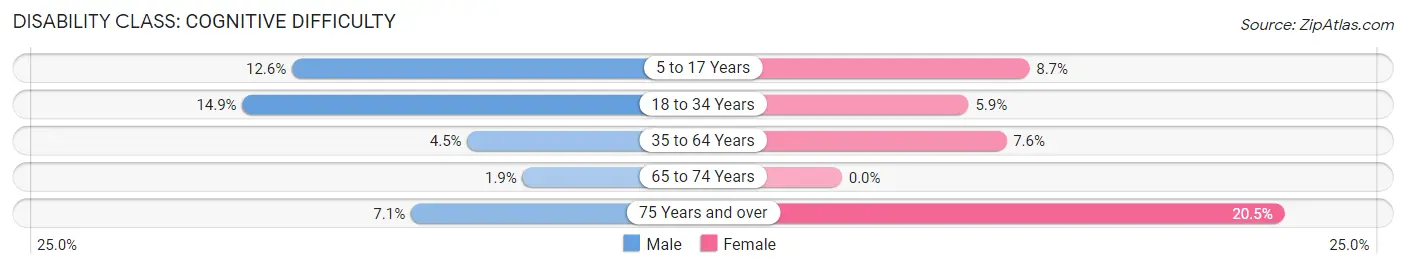
| Age Bracket | Male | Female |
| 5 to 17 Years | 34 (12.6%) | 32 (8.7%) |
| 18 to 34 Years | 56 (14.9%) | 14 (5.9%) |
| 35 to 64 Years | 30 (4.4%) | 53 (7.6%) |
| 65 to 74 Years | 1 (1.9%) | 0 (0.0%) |
| 75 Years and over | 7 (7.1%) | 23 (20.5%) |
Disability Class: Ambulatory Difficulty
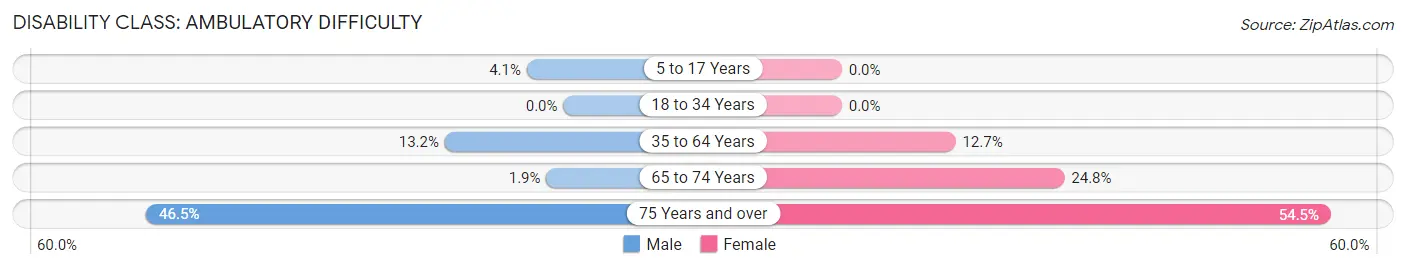
| Age Bracket | Male | Female |
| 5 to 17 Years | 11 (4.1%) | 0 (0.0%) |
| 18 to 34 Years | 0 (0.0%) | 0 (0.0%) |
| 35 to 64 Years | 89 (13.2%) | 88 (12.7%) |
| 65 to 74 Years | 1 (1.9%) | 30 (24.8%) |
| 75 Years and over | 46 (46.5%) | 61 (54.5%) |
Disability Class: Self-Care Difficulty
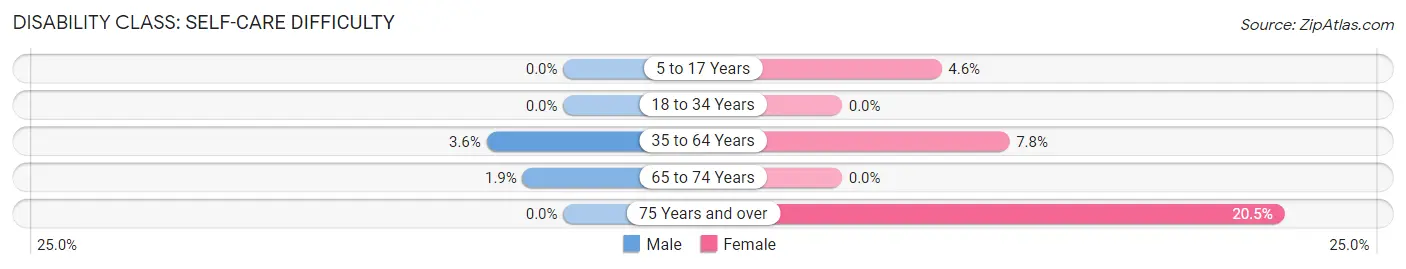
| Age Bracket | Male | Female |
| 5 to 17 Years | 0 (0.0%) | 17 (4.6%) |
| 18 to 34 Years | 0 (0.0%) | 0 (0.0%) |
| 35 to 64 Years | 24 (3.6%) | 54 (7.8%) |
| 65 to 74 Years | 1 (1.9%) | 0 (0.0%) |
| 75 Years and over | 0 (0.0%) | 23 (20.5%) |
Technology Access in Wesleyville borough
Computing Device Access in Wesleyville borough
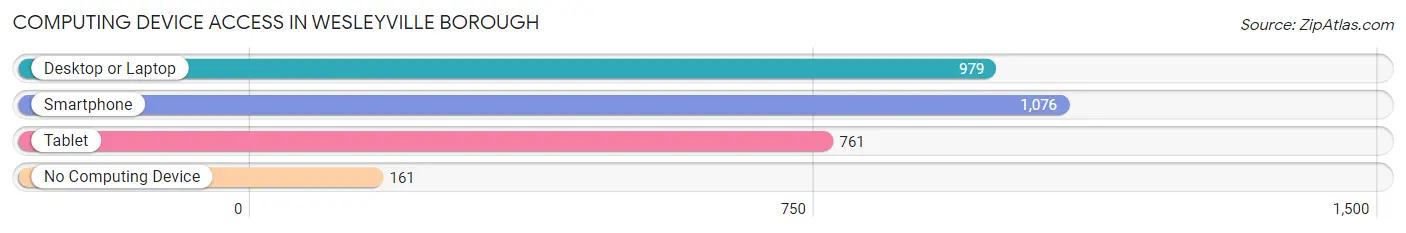
| Device Type | # Households | % Households |
| Desktop or Laptop | 979 | 73.3% |
| Smartphone | 1,076 | 80.5% |
| Tablet | 761 | 57.0% |
| No Computing Device | 161 | 12.0% |
| Total | 1,336 | 100.0% |
Internet Access in Wesleyville borough
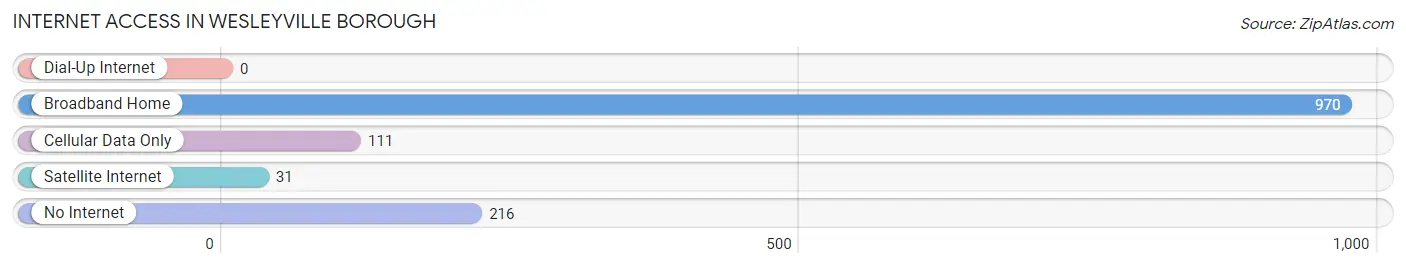
| Internet Type | # Households | % Households |
| Dial-Up Internet | 0 | 0.0% |
| Broadband Home | 970 | 72.6% |
| Cellular Data Only | 111 | 8.3% |
| Satellite Internet | 31 | 2.3% |
| No Internet | 216 | 16.2% |
| Total | 1,336 | 100.0% |
Wesleyville borough Summary
Wesleyville Borough is a small borough located in Erie County, Pennsylvania. It is situated on the eastern shore of Lake Erie, approximately 8 miles northeast of the city of Erie. The borough was incorporated in 1891 and has a population of approximately 2,000 people.
History
The area that is now Wesleyville Borough was originally inhabited by the Eriez Indians. The first settlers in the area were the French, who arrived in the late 1700s. The area was then part of the Connecticut Western Reserve, and was known as “Wesleyville” after the Methodist minister, Rev. John Wesley. The first post office in the area was established in 1837.
In 1891, the area was incorporated as a borough. The first mayor of Wesleyville was William H. Smith. The borough was named after Rev. John Wesley, and the streets were named after prominent Methodist ministers.
Geography
Wesleyville Borough is located in the northwest corner of Erie County, Pennsylvania. It is situated on the eastern shore of Lake Erie, approximately 8 miles northeast of the city of Erie. The borough is bordered by Harborcreek Township to the north, Lawrence Park Township to the east, and Millcreek Township to the south and west.
The borough has a total area of 1.2 square miles, all of which is land. The terrain is generally flat, with some rolling hills. The highest point in the borough is located at the intersection of West Lake Road and East Lake Road, which is approximately 500 feet above sea level.
Economy
The economy of Wesleyville Borough is largely based on tourism and manufacturing. The borough is home to several small businesses, including restaurants, retail stores, and service providers. The borough also has a number of manufacturing companies, including a plastics manufacturer and a metal fabrication company.
The borough is also home to a number of recreational activities, including fishing, boating, and swimming. The borough is also home to a number of parks, including the Wesleyville Borough Park, which features a playground, picnic area, and basketball court.
Demographics
As of the 2010 census, the population of Wesleyville Borough was 2,039. The racial makeup of the borough was 97.2% White, 0.9% African American, 0.3% Native American, 0.4% Asian, 0.1% Pacific Islander, 0.2% from other races, and 0.9% from two or more races. Hispanic or Latino of any race were 1.2% of the population.
The median income for a household in the borough was $41,944, and the median income for a family was $50,000. The per capita income for the borough was $20,945. About 8.2% of families and 10.2% of the population were below the poverty line, including 14.2% of those under age 18 and 5.2% of those age 65 or over.
Common Questions
What is Per Capita Income in Wesleyville borough?
Per Capita income in Wesleyville borough is $25,255.
What is the Median Family Income in Wesleyville borough?
Median Family Income in Wesleyville borough is $55,607.
What is the Median Household income in Wesleyville borough?
Median Household Income in Wesleyville borough is $44,417.
What is Income or Wage Gap in Wesleyville borough?
Income or Wage Gap in Wesleyville borough is 16.9%.
Women in Wesleyville borough earn 83.1 cents for every dollar earned by a man.
What is Family Income Deficit in Wesleyville borough?
Family Income Deficit in Wesleyville borough is $9,852.
Families that are below poverty line in Wesleyville borough earn $9,852 less on average than the poverty threshold level.
What is Inequality or Gini Index in Wesleyville borough?
Inequality or Gini Index in Wesleyville borough is 0.45.
What is the Total Population of Wesleyville borough?
Total Population of Wesleyville borough is 3,209.
What is the Total Male Population of Wesleyville borough?
Total Male Population of Wesleyville borough is 1,562.
What is the Total Female Population of Wesleyville borough?
Total Female Population of Wesleyville borough is 1,647.
What is the Ratio of Males per 100 Females in Wesleyville borough?
There are 94.84 Males per 100 Females in Wesleyville borough.
What is the Ratio of Females per 100 Males in Wesleyville borough?
There are 105.44 Females per 100 Males in Wesleyville borough.
What is the Median Population Age in Wesleyville borough?
Median Population Age in Wesleyville borough is 36.9 Years.
What is the Average Family Size in Wesleyville borough
Average Family Size in Wesleyville borough is 3.2 People.
What is the Average Household Size in Wesleyville borough
Average Household Size in Wesleyville borough is 2.4 People.
How Large is the Labor Force in Wesleyville borough?
There are 1,634 People in the Labor Forcein in Wesleyville borough.
What is the Percentage of People in the Labor Force in Wesleyville borough?
65.3% of People are in the Labor Force in Wesleyville borough.
What is the Unemployment Rate in Wesleyville borough?
Unemployment Rate in Wesleyville borough is 7.8%.