Zip Codes with the Highest Percentage of Population Employed in Administrative & Support Services in Pittston, PA
RELATED REPORTS & OPTIONS
Administrative & Support Services
Pittston
Compare Zip Codes
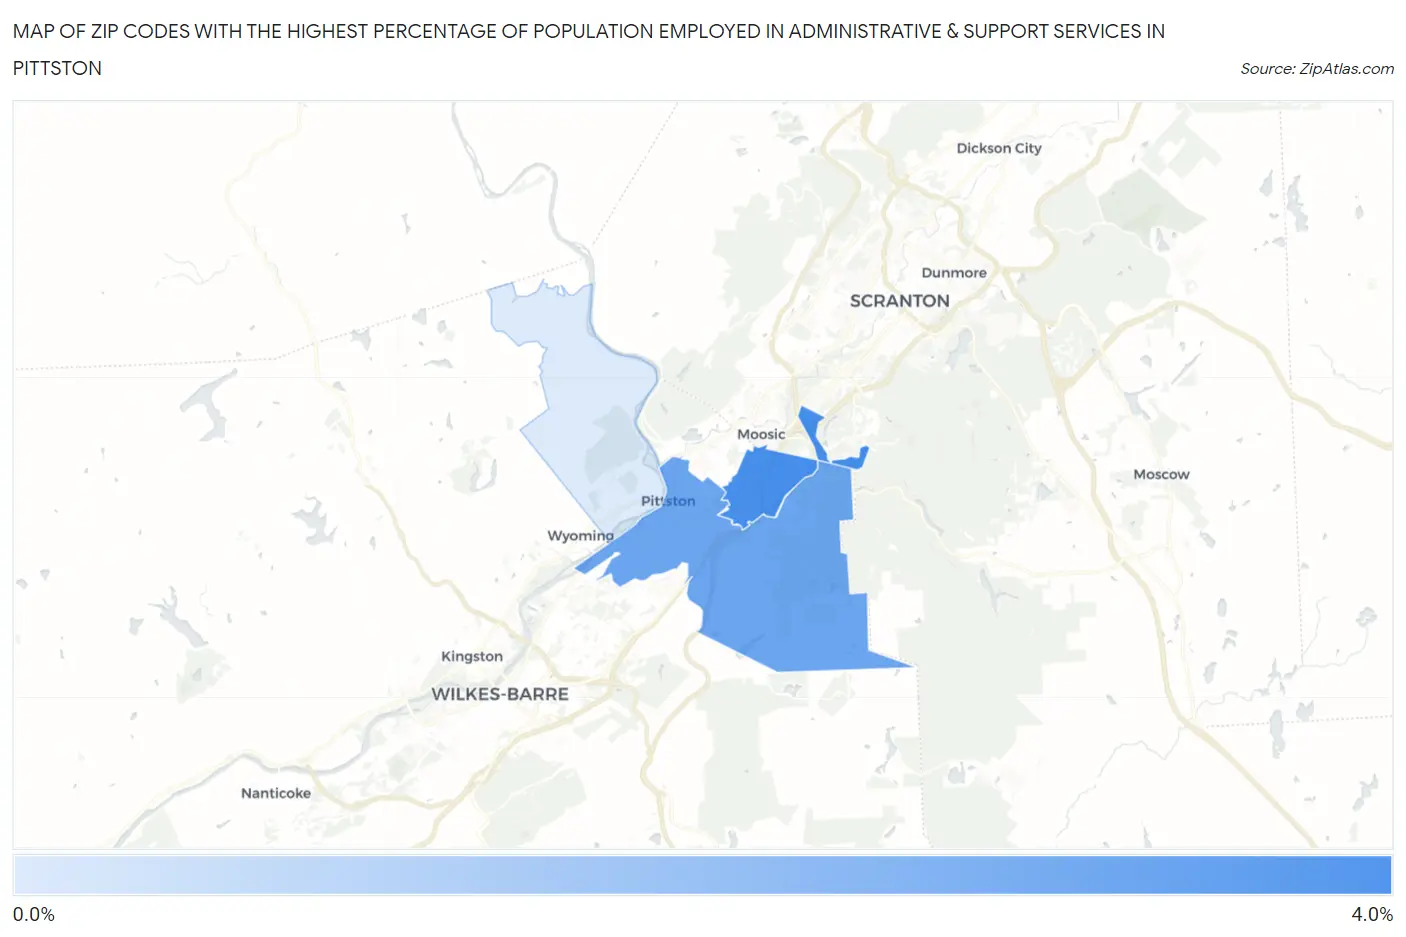
Map of Zip Codes with the Highest Percentage of Population Employed in Administrative & Support Services in Pittston
0.90%
3.7%
Zip Codes with the Highest Percentage of Population Employed in Administrative & Support Services in Pittston, PA
| Zip Code | % Employed | vs State | vs National | |
| 1. | 18641 | 3.7% | 3.6%(+0.111)#588 | 4.1%(-0.454)#12,012 |
| 2. | 18640 | 3.0% | 3.6%(-0.596)#800 | 4.1%(-1.16)#15,529 |
| 3. | 18643 | 0.90% | 3.6%(-2.68)#1,341 | 4.1%(-3.25)#24,819 |
1
Common Questions
What are the Top Zip Codes with the Highest Percentage of Population Employed in Administrative & Support Services in Pittston, PA?
Top Zip Codes with the Highest Percentage of Population Employed in Administrative & Support Services in Pittston, PA are:
What zip code has the Highest Percentage of Population Employed in Administrative & Support Services in Pittston, PA?
18641 has the Highest Percentage of Population Employed in Administrative & Support Services in Pittston, PA with 3.7%.
What is the Percentage of Population Employed in Administrative & Support Services in Pittston, PA?
Percentage of Population Employed in Administrative & Support Services in Pittston is 3.3%.
What is the Percentage of Population Employed in Administrative & Support Services in Pennsylvania?
Percentage of Population Employed in Administrative & Support Services in Pennsylvania is 3.6%.
What is the Percentage of Population Employed in Administrative & Support Services in the United States?
Percentage of Population Employed in Administrative & Support Services in the United States is 4.1%.