Cities with the Highest Percentage of Population Employed in Administrative & Support Services in Alabama
RELATED REPORTS & OPTIONS
Administrative & Support Services
Alabama
Compare Cities
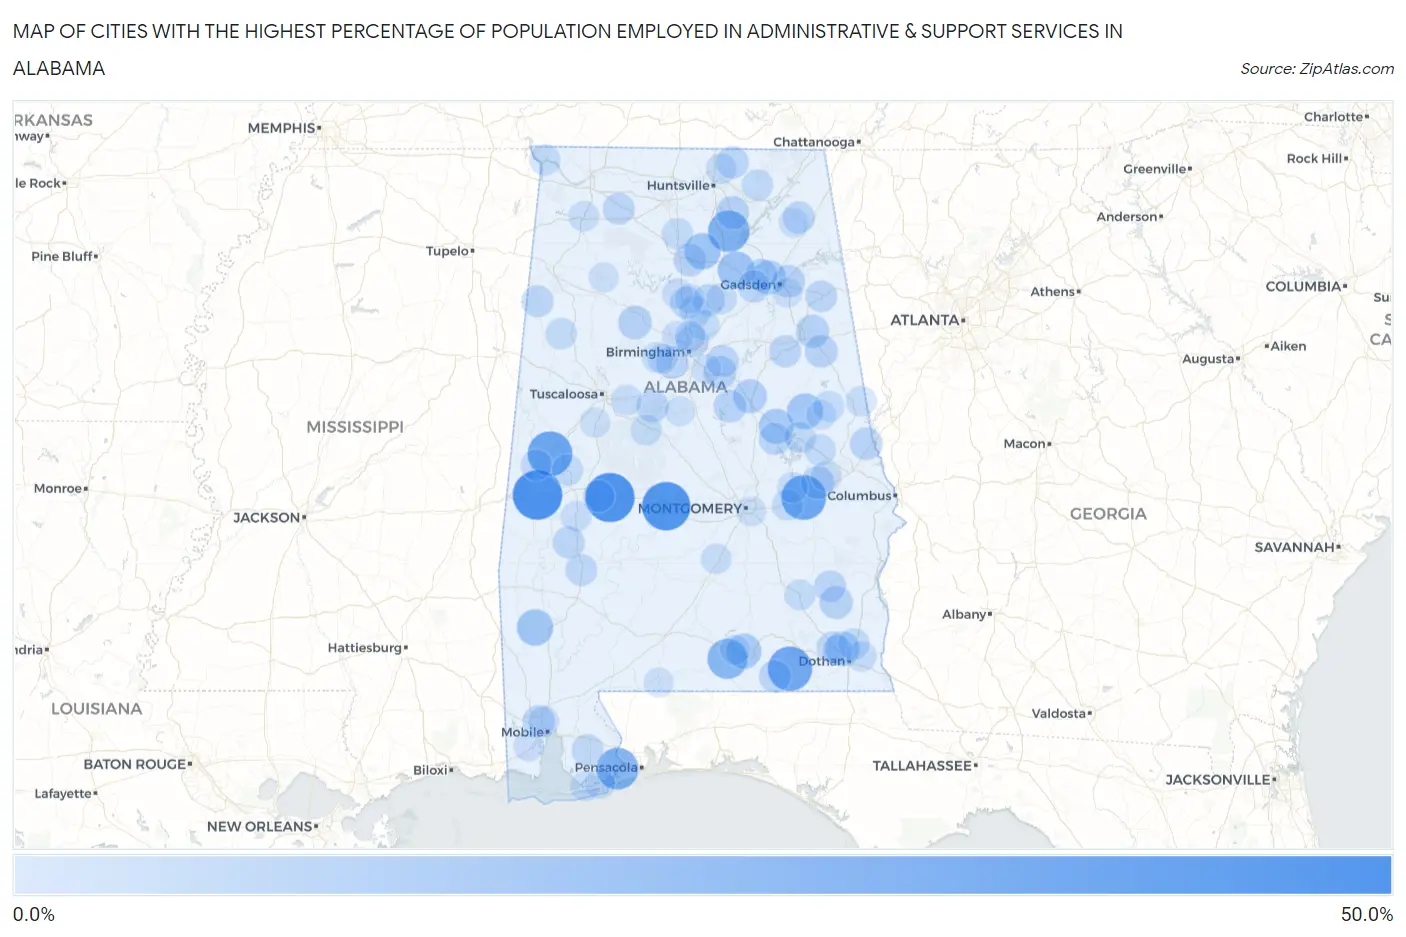
Map of Cities with the Highest Percentage of Population Employed in Administrative & Support Services in Alabama
0.0%
50.0%
Cities with the Highest Percentage of Population Employed in Administrative & Support Services in Alabama
| City | % Employed | vs State | vs National | |
| 1. | Bellamy | 40.7% | 4.0%(+36.8)#1 | 4.1%(+36.6)#104 |
| 2. | Uniontown | 40.2% | 4.0%(+36.3)#2 | 4.1%(+36.1)#106 |
| 3. | Selmont West Selmont | 38.8% | 4.0%(+34.9)#3 | 4.1%(+34.7)#112 |
| 4. | Franklin | 31.9% | 4.0%(+27.9)#4 | 4.1%(+27.8)#158 |
| 5. | Boligee | 31.9% | 4.0%(+27.9)#5 | 4.1%(+27.8)#159 |
| 6. | Coffee Springs | 31.2% | 4.0%(+27.2)#6 | 4.1%(+27.0)#170 |
| 7. | Lillian | 26.7% | 4.0%(+22.7)#7 | 4.1%(+22.5)#245 |
| 8. | Union Grove | 26.1% | 4.0%(+22.1)#8 | 4.1%(+21.9)#258 |
| 9. | Libertyville | 23.7% | 4.0%(+19.8)#9 | 4.1%(+19.6)#314 |
| 10. | Snead | 18.2% | 4.0%(+14.2)#10 | 4.1%(+14.0)#538 |
| 11. | Hobson | 16.8% | 4.0%(+12.9)#11 | 4.1%(+12.7)#619 |
| 12. | Fairview | 16.8% | 4.0%(+12.8)#12 | 4.1%(+12.7)#623 |
| 13. | Goldville | 16.2% | 4.0%(+12.2)#13 | 4.1%(+12.1)#673 |
| 14. | Babbie | 15.0% | 4.0%(+11.0)#14 | 4.1%(+10.9)#790 |
| 15. | Kellyton | 14.6% | 4.0%(+10.6)#15 | 4.1%(+10.5)#849 |
| 16. | Napier Field | 13.6% | 4.0%(+9.62)#16 | 4.1%(+9.44)#1,020 |
| 17. | Ridgeville | 13.3% | 4.0%(+9.36)#17 | 4.1%(+9.18)#1,056 |
| 18. | Mignon | 13.0% | 4.0%(+9.01)#18 | 4.1%(+8.83)#1,122 |
| 19. | Equality | 12.2% | 4.0%(+8.23)#19 | 4.1%(+8.05)#1,271 |
| 20. | Parrish | 12.1% | 4.0%(+8.10)#20 | 4.1%(+7.92)#1,298 |
| 21. | New Hope | 11.5% | 4.0%(+7.52)#21 | 4.1%(+7.34)#1,426 |
| 22. | Choccolocco | 11.5% | 4.0%(+7.51)#22 | 4.1%(+7.33)#1,427 |
| 23. | Blue Springs | 11.4% | 4.0%(+7.40)#23 | 4.1%(+7.21)#1,454 |
| 24. | Notasulga | 11.3% | 4.0%(+7.30)#24 | 4.1%(+7.11)#1,472 |
| 25. | Westover | 11.2% | 4.0%(+7.21)#25 | 4.1%(+7.03)#1,495 |
| 26. | East Point | 10.9% | 4.0%(+6.94)#26 | 4.1%(+6.76)#1,581 |
| 27. | Hollis Crossroads | 10.9% | 4.0%(+6.91)#27 | 4.1%(+6.73)#1,592 |
| 28. | Tidmore Bend | 10.8% | 4.0%(+6.81)#28 | 4.1%(+6.63)#1,621 |
| 29. | Talladega Springs | 10.7% | 4.0%(+6.70)#29 | 4.1%(+6.52)#1,642 |
| 30. | Huguley | 10.6% | 4.0%(+6.61)#30 | 4.1%(+6.43)#1,672 |
| 31. | Brighton | 10.4% | 4.0%(+6.46)#31 | 4.1%(+6.28)#1,728 |
| 32. | Egypt | 10.2% | 4.0%(+6.20)#32 | 4.1%(+6.02)#1,827 |
| 33. | West Blocton | 10.1% | 4.0%(+6.13)#33 | 4.1%(+5.95)#1,857 |
| 34. | New Market | 10.1% | 4.0%(+6.13)#34 | 4.1%(+5.95)#1,859 |
| 35. | Gallant | 10.1% | 4.0%(+6.12)#35 | 4.1%(+5.94)#1,863 |
| 36. | Ray | 10.0% | 4.0%(+6.07)#36 | 4.1%(+5.89)#1,884 |
| 37. | Vandiver | 10.0% | 4.0%(+6.06)#37 | 4.1%(+5.88)#1,888 |
| 38. | Tarrant | 10.0% | 4.0%(+6.03)#38 | 4.1%(+5.85)#1,894 |
| 39. | Samson | 9.9% | 4.0%(+5.92)#39 | 4.1%(+5.73)#1,958 |
| 40. | Prichard | 9.8% | 4.0%(+5.85)#40 | 4.1%(+5.67)#1,982 |
| 41. | Locust Fork | 9.7% | 4.0%(+5.75)#41 | 4.1%(+5.57)#2,028 |
| 42. | Sweet Water | 9.7% | 4.0%(+5.74)#42 | 4.1%(+5.56)#2,031 |
| 43. | Sulligent | 9.6% | 4.0%(+5.62)#43 | 4.1%(+5.44)#2,083 |
| 44. | Munford | 9.6% | 4.0%(+5.59)#44 | 4.1%(+5.40)#2,097 |
| 45. | Rainsville | 9.5% | 4.0%(+5.54)#45 | 4.1%(+5.36)#2,120 |
| 46. | Louisville | 9.5% | 4.0%(+5.50)#46 | 4.1%(+5.32)#2,136 |
| 47. | Hatton | 9.5% | 4.0%(+5.49)#47 | 4.1%(+5.31)#2,142 |
| 48. | Smoke Rise | 9.4% | 4.0%(+5.41)#48 | 4.1%(+5.23)#2,180 |
| 49. | Piedmont | 9.3% | 4.0%(+5.33)#49 | 4.1%(+5.15)#2,213 |
| 50. | Robertsdale | 9.1% | 4.0%(+5.17)#50 | 4.1%(+4.99)#2,289 |
| 51. | Pinckard | 9.1% | 4.0%(+5.15)#51 | 4.1%(+4.97)#2,304 |
| 52. | Thomasville | 9.1% | 4.0%(+5.14)#52 | 4.1%(+4.96)#2,306 |
| 53. | Faunsdale | 9.1% | 4.0%(+5.12)#53 | 4.1%(+4.94)#2,324 |
| 54. | Jacksons Gap | 9.0% | 4.0%(+5.07)#54 | 4.1%(+4.89)#2,357 |
| 55. | Camp Hill | 8.7% | 4.0%(+4.75)#55 | 4.1%(+4.56)#2,544 |
| 56. | Pleasant Groves | 8.7% | 4.0%(+4.75)#56 | 4.1%(+4.56)#2,545 |
| 57. | Falkville | 8.6% | 4.0%(+4.61)#57 | 4.1%(+4.43)#2,629 |
| 58. | Epes | 8.6% | 4.0%(+4.58)#58 | 4.1%(+4.40)#2,650 |
| 59. | Belk | 8.5% | 4.0%(+4.52)#59 | 4.1%(+4.34)#2,687 |
| 60. | Trafford | 8.5% | 4.0%(+4.51)#60 | 4.1%(+4.32)#2,693 |
| 61. | Forkland | 8.4% | 4.0%(+4.41)#61 | 4.1%(+4.23)#2,748 |
| 62. | Headland | 8.3% | 4.0%(+4.29)#62 | 4.1%(+4.11)#2,826 |
| 63. | Shorter | 8.2% | 4.0%(+4.25)#63 | 4.1%(+4.07)#2,859 |
| 64. | Pea Ridge | 8.1% | 4.0%(+4.17)#64 | 4.1%(+3.99)#2,902 |
| 65. | Waterloo | 8.0% | 4.0%(+4.03)#65 | 4.1%(+3.85)#2,992 |
| 66. | Wadley | 8.0% | 4.0%(+3.99)#66 | 4.1%(+3.80)#3,023 |
| 67. | Allgood | 7.9% | 4.0%(+3.96)#67 | 4.1%(+3.78)#3,046 |
| 68. | Brent | 7.9% | 4.0%(+3.91)#68 | 4.1%(+3.73)#3,082 |
| 69. | Pinson | 7.9% | 4.0%(+3.90)#69 | 4.1%(+3.72)#3,098 |
| 70. | Rock Creek | 7.8% | 4.0%(+3.83)#70 | 4.1%(+3.65)#3,145 |
| 71. | Moores Mill | 7.6% | 4.0%(+3.63)#71 | 4.1%(+3.45)#3,308 |
| 72. | Brundidge | 7.6% | 4.0%(+3.60)#72 | 4.1%(+3.42)#3,325 |
| 73. | Coaling | 7.4% | 4.0%(+3.48)#73 | 4.1%(+3.30)#3,451 |
| 74. | Tallassee | 7.4% | 4.0%(+3.48)#74 | 4.1%(+3.30)#3,456 |
| 75. | Colony | 7.4% | 4.0%(+3.41)#75 | 4.1%(+3.23)#3,520 |
| 76. | Brookside | 7.3% | 4.0%(+3.37)#76 | 4.1%(+3.19)#3,550 |
| 77. | Fultondale | 7.3% | 4.0%(+3.32)#77 | 4.1%(+3.13)#3,603 |
| 78. | Linden | 7.3% | 4.0%(+3.30)#78 | 4.1%(+3.12)#3,616 |
| 79. | Russellville | 7.2% | 4.0%(+3.25)#79 | 4.1%(+3.07)#3,666 |
| 80. | Webb | 7.2% | 4.0%(+3.21)#80 | 4.1%(+3.03)#3,698 |
| 81. | Fort Deposit | 7.2% | 4.0%(+3.21)#81 | 4.1%(+3.02)#3,706 |
| 82. | Loachapoka | 7.1% | 4.0%(+3.12)#82 | 4.1%(+2.94)#3,807 |
| 83. | Chickasaw | 7.0% | 4.0%(+3.07)#83 | 4.1%(+2.89)#3,861 |
| 84. | Rock Mills | 7.0% | 4.0%(+3.06)#84 | 4.1%(+2.88)#3,881 |
| 85. | Tillmans Corner | 6.9% | 4.0%(+2.90)#85 | 4.1%(+2.72)#4,027 |
| 86. | Orange Beach | 6.6% | 4.0%(+2.67)#86 | 4.1%(+2.49)#4,270 |
| 87. | Concord | 6.6% | 4.0%(+2.63)#87 | 4.1%(+2.45)#4,318 |
| 88. | Midland City | 6.6% | 4.0%(+2.61)#88 | 4.1%(+2.43)#4,355 |
| 89. | Daviston | 6.4% | 4.0%(+2.41)#89 | 4.1%(+2.23)#4,583 |
| 90. | Gulf Shores | 6.3% | 4.0%(+2.36)#90 | 4.1%(+2.18)#4,652 |
| 91. | Montgomery | 6.3% | 4.0%(+2.36)#91 | 4.1%(+2.18)#4,664 |
| 92. | Glencoe | 6.3% | 4.0%(+2.35)#92 | 4.1%(+2.17)#4,676 |
| 93. | Lynn | 6.2% | 4.0%(+2.26)#93 | 4.1%(+2.08)#4,795 |
| 94. | Hayden | 6.2% | 4.0%(+2.24)#94 | 4.1%(+2.06)#4,818 |
| 95. | Moundville | 6.2% | 4.0%(+2.22)#95 | 4.1%(+2.04)#4,848 |
| 96. | Wilton | 6.2% | 4.0%(+2.22)#96 | 4.1%(+2.04)#4,852 |
| 97. | Sanford | 6.2% | 4.0%(+2.20)#97 | 4.1%(+2.02)#4,875 |
| 98. | Shiloh | 6.2% | 4.0%(+2.20)#98 | 4.1%(+2.01)#4,888 |
| 99. | Riverview | 6.1% | 4.0%(+2.15)#99 | 4.1%(+1.97)#4,948 |
| 100. | Highland Lakes | 6.1% | 4.0%(+2.15)#100 | 4.1%(+1.97)#4,955 |
Common Questions
What are the Top 10 Cities with the Highest Percentage of Population Employed in Administrative & Support Services in Alabama?
Top 10 Cities with the Highest Percentage of Population Employed in Administrative & Support Services in Alabama are:
#1
40.7%
#2
40.2%
#3
38.8%
#4
31.9%
#5
31.9%
#6
31.2%
#7
26.7%
#8
26.1%
#9
23.7%
#10
18.2%
What city has the Highest Percentage of Population Employed in Administrative & Support Services in Alabama?
Bellamy has the Highest Percentage of Population Employed in Administrative & Support Services in Alabama with 40.7%.
What is the Percentage of Population Employed in Administrative & Support Services in the State of Alabama?
Percentage of Population Employed in Administrative & Support Services in Alabama is 4.0%.
What is the Percentage of Population Employed in Administrative & Support Services in the United States?
Percentage of Population Employed in Administrative & Support Services in the United States is 4.1%.