Area Code 609 Map & Demographics
Area Code 609 Map
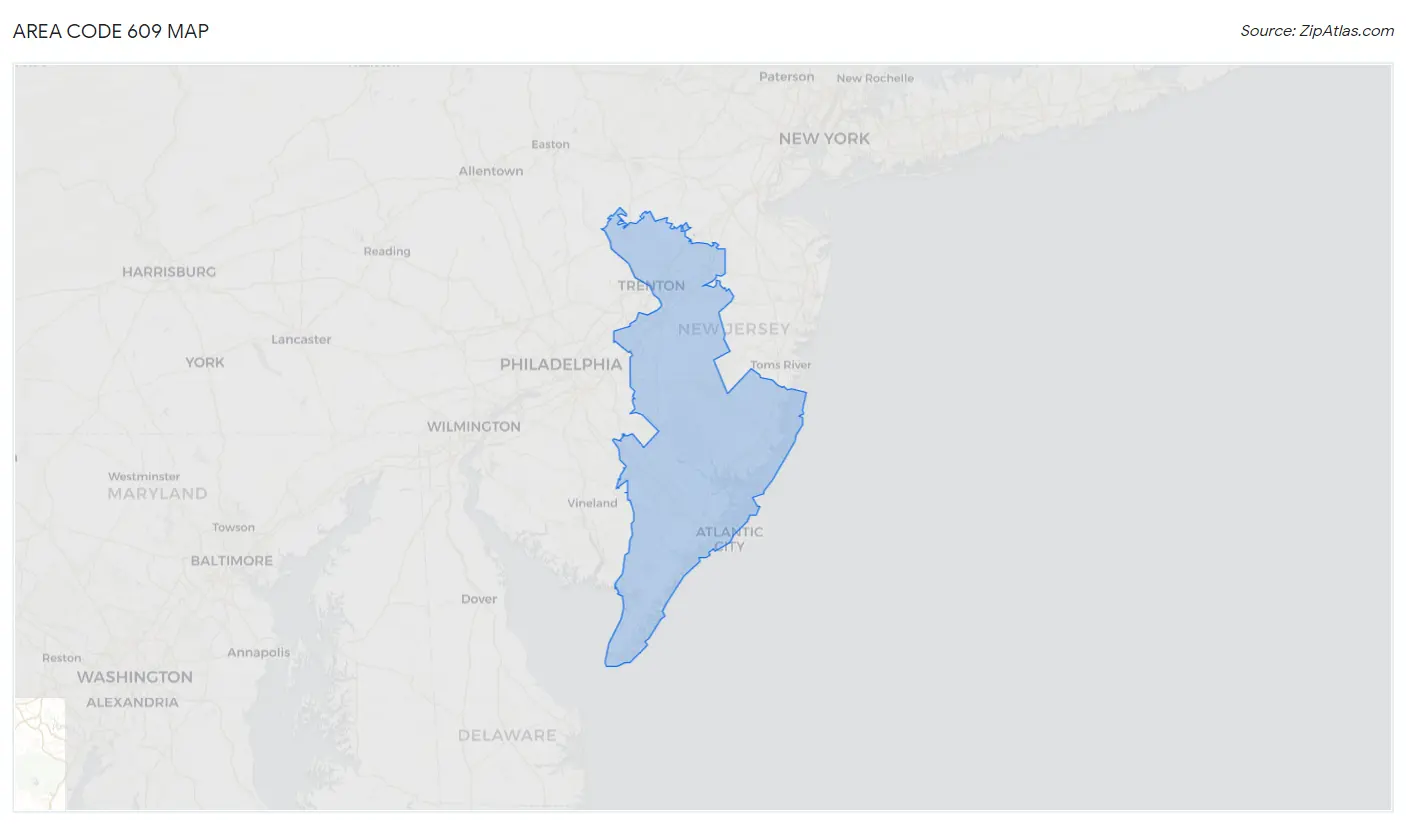
Area Code 609 Overview
$50,585
PER CAPITA INCOME
$116,846
AVG FAMILY INCOME
$96,262
AVG HOUSEHOLD INCOME
26.9%
WAGE / INCOME GAP [ % ]
73.1¢/ $1
WAGE / INCOME GAP [ $ ]
$10,410
FAMILY INCOME DEFICIT
39.38
INEQUALITY / GINI INDEX
1,467,888
TOTAL POPULATION
724,584
MALE POPULATION
743,304
FEMALE POPULATION
97.48
MALES / 100 FEMALES
102.58
FEMALES / 100 MALES
44.3
MEDIAN AGE
3.0
AVG FAMILY SIZE
2.5
AVG HOUSEHOLD SIZE
716,872
LABOR FORCE [ PEOPLE ]
60.0%
PERCENT IN LABOR FORCE
7.0%
UNEMPLOYMENT RATE
Income in Area Code 609
Income Overview in Area Code 609
Per Capita Income in Area Code 609 is $50,585, while median incomes of families and households are $116,846 and $96,262 respectively.
| Characteristic | Number | Measure |
| Per Capita Income | 1,467,888 | $50,585 |
| Median Family Income | 370,458 | $116,846 |
| Mean Family Income | 370,458 | $13,138,170 |
| Median Household Income | 554,685 | $96,262 |
| Mean Household Income | 554,685 | $11,222,446 |
| Income Deficit | 370,458 | $10,410 |
| Wage / Income Gap (%) | 1,467,888 | 26.86% |
| Wage / Income Gap ($) | 1,467,888 | 73.13¢ per $1 |
| Gini / Inequality Index | 1,467,888 | 39.38 |
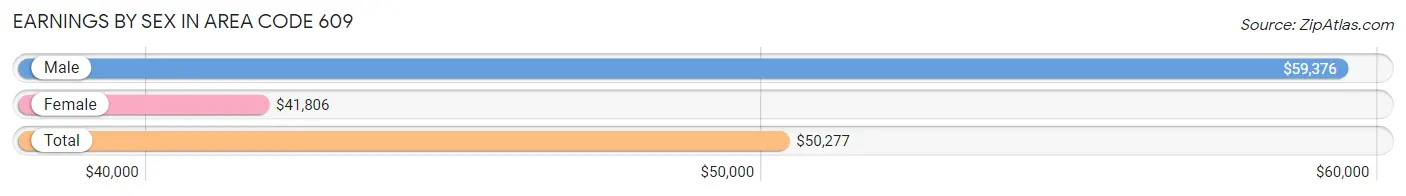
Earnings by Sex in Area Code 609
Average Earnings in Area Code 609 are $50,277, $59,376 for men and $41,806 for women, a difference of 29.6%.
| Sex | Number | Average Earnings |
| Male | 409,516 (52.3%) | $59,376 |
| Female | 373,273 (47.7%) | $41,806 |
| Total | 782,789 (100.0%) | $50,277 |
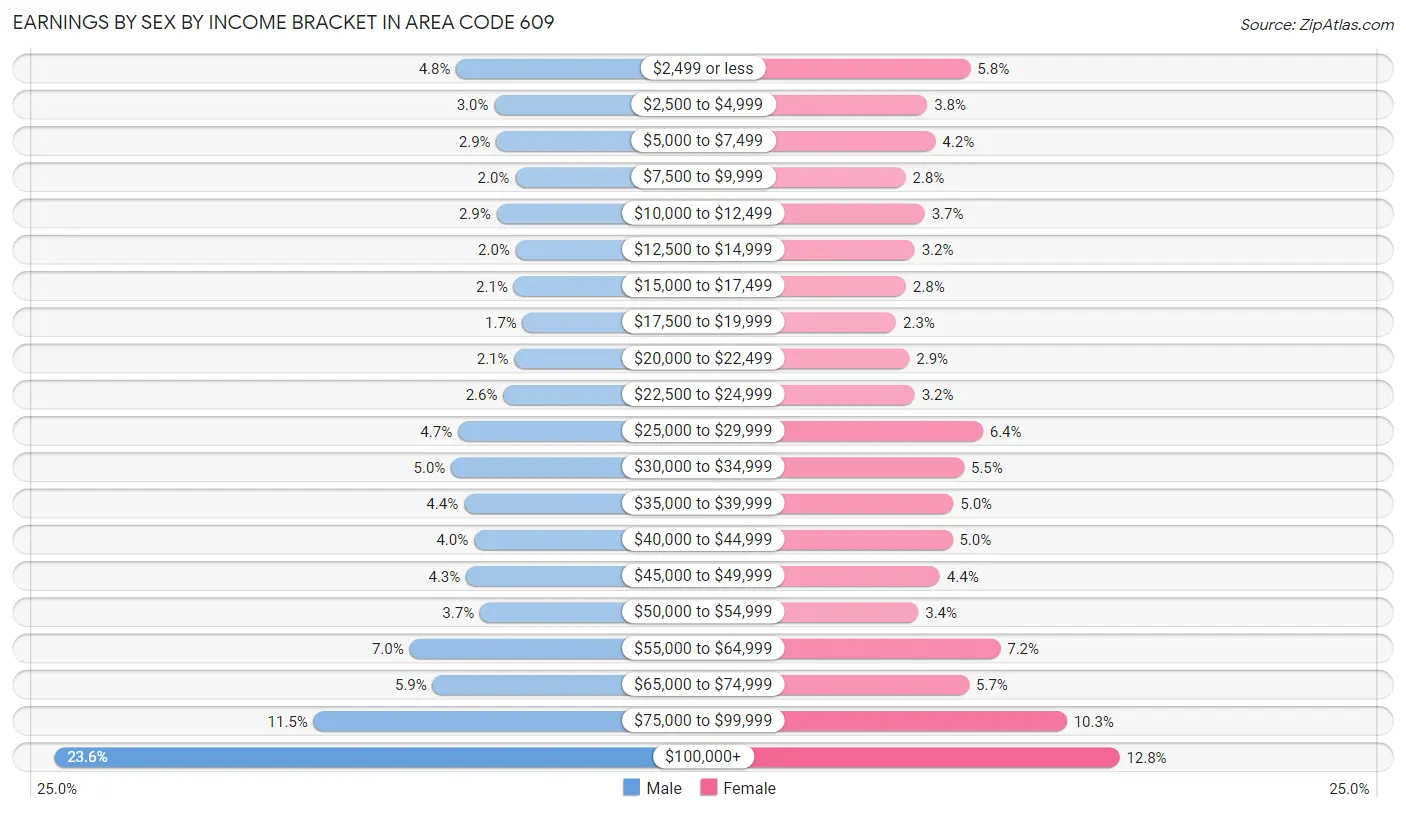
Earnings by Sex by Income Bracket in Area Code 609
The most common earnings brackets in Area Code 609 are $100,000+ for men (96,678 | 23.6%) and $100,000+ for women (47,662 | 12.8%).
| Income | Male | Female |
| $2,499 or less | 19,565 (4.8%) | 21,613 (5.8%) |
| $2,500 to $4,999 | 12,271 (3.0%) | 14,080 (3.8%) |
| $5,000 to $7,499 | 11,879 (2.9%) | 15,493 (4.2%) |
| $7,500 to $9,999 | 8,259 (2.0%) | 10,278 (2.8%) |
| $10,000 to $12,499 | 11,835 (2.9%) | 13,634 (3.6%) |
| $12,500 to $14,999 | 8,172 (2.0%) | 11,865 (3.2%) |
| $15,000 to $17,499 | 8,578 (2.1%) | 10,345 (2.8%) |
| $17,500 to $19,999 | 6,836 (1.7%) | 8,635 (2.3%) |
| $20,000 to $22,499 | 8,443 (2.1%) | 10,921 (2.9%) |
| $22,500 to $24,999 | 10,578 (2.6%) | 11,881 (3.2%) |
| $25,000 to $29,999 | 19,262 (4.7%) | 23,788 (6.4%) |
| $30,000 to $34,999 | 20,538 (5.0%) | 20,498 (5.5%) |
| $35,000 to $39,999 | 18,117 (4.4%) | 18,641 (5.0%) |
| $40,000 to $44,999 | 16,164 (4.0%) | 18,486 (5.0%) |
| $45,000 to $49,999 | 17,709 (4.3%) | 16,271 (4.4%) |
| $50,000 to $54,999 | 15,043 (3.7%) | 12,523 (3.4%) |
| $55,000 to $64,999 | 28,542 (7.0%) | 26,834 (7.2%) |
| $65,000 to $74,999 | 24,131 (5.9%) | 21,379 (5.7%) |
| $75,000 to $99,999 | 46,916 (11.5%) | 38,446 (10.3%) |
| $100,000+ | 96,678 (23.6%) | 47,662 (12.8%) |
| Total | 409,516 (100.0%) | 373,273 (100.0%) |
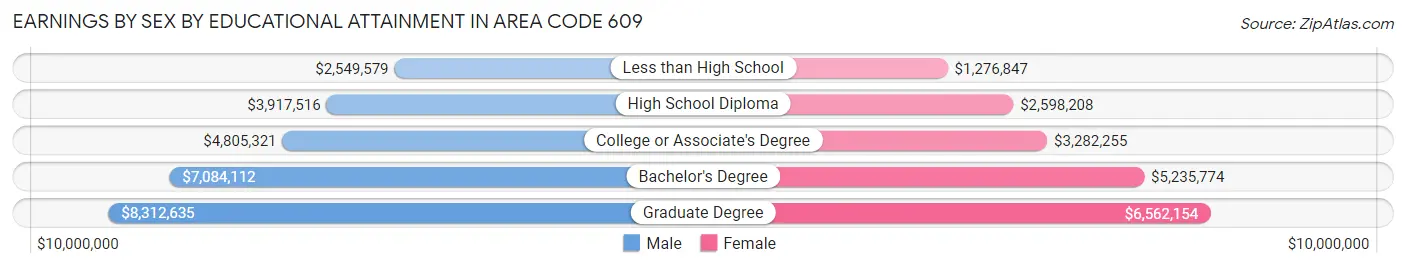
Earnings by Sex by Educational Attainment in Area Code 609
Average earnings in Area Code 609 are $6,114,918 for men and $4,087,233 for women, a difference of 33.2%. Men with an educational attainment of graduate degree enjoy the highest average annual earnings of $8,312,635, while those with less than high school education earn the least with $2,549,579. Women with an educational attainment of graduate degree earn the most with the average annual earnings of $6,562,154, while those with less than high school education have the smallest earnings of $1,276,847.
| Educational Attainment | Male Income | Female Income |
| Less than High School | $2,549,579 | $1,276,847 |
| High School Diploma | $3,917,516 | $2,598,208 |
| College or Associate's Degree | $4,805,321 | $3,282,255 |
| Bachelor's Degree | $7,084,112 | $5,235,774 |
| Graduate Degree | $8,312,635 | $6,562,154 |
| Total | $6,114,918 | $4,087,233 |
Family Income in Area Code 609
Family Income Brackets in Area Code 609
According to the Area Code 609 family income data, there are 7,082,416 families falling into the $200,000+ income range, which is the most common income bracket and makes up 1,911.8% of all families. Conversely, the $10,000 to $14,999 income bracket is the least frequent group with only 557,539 families (150.5%) belonging to this category.
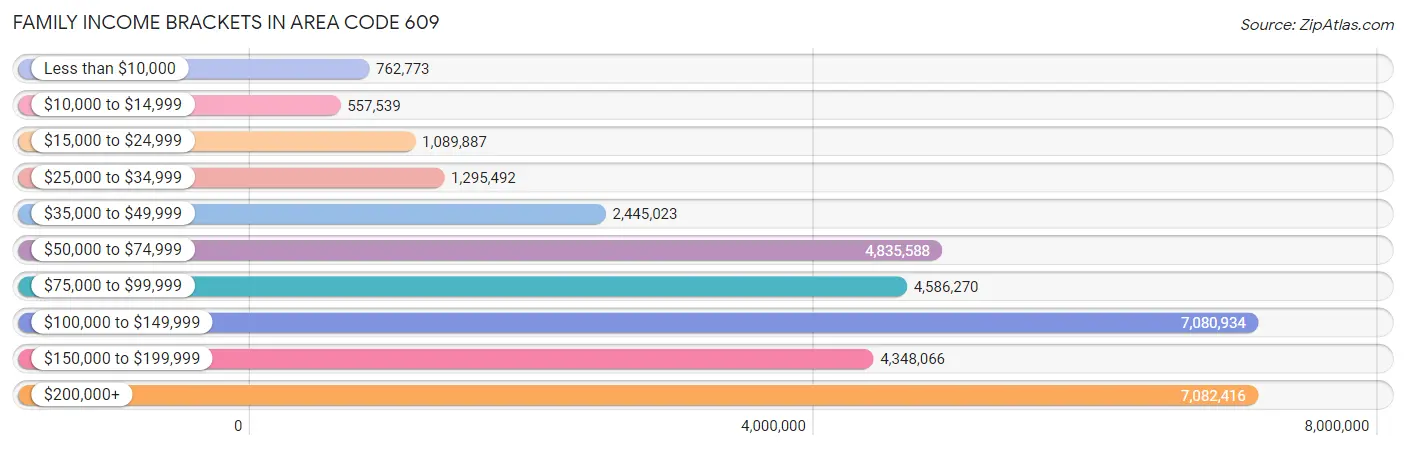
| Income Bracket | # Families | % Families |
| Less than $10,000 | 762,773 | 205.9% |
| $10,000 to $14,999 | 557,539 | 150.5% |
| $15,000 to $24,999 | 1,089,887 | 294.2% |
| $25,000 to $34,999 | 1,295,492 | 349.7% |
| $35,000 to $49,999 | 2,445,023 | 660.0% |
| $50,000 to $74,999 | 4,835,588 | 1,305.3% |
| $75,000 to $99,999 | 4,586,270 | 1,238.0% |
| $100,000 to $149,999 | 7,080,934 | 1,911.4% |
| $150,000 to $199,999 | 4,348,066 | 1,173.7% |
| $200,000+ | 7,082,416 | 1,911.8% |
Family Income by Famaliy Size in Area Code 609
6-person families (10,701 | 2.9%) account for the highest median family income in Area Code 609 with $150,584 per family, while 2-person families (166,116 | 44.8%) have the highest median income of $50,173 per family member.
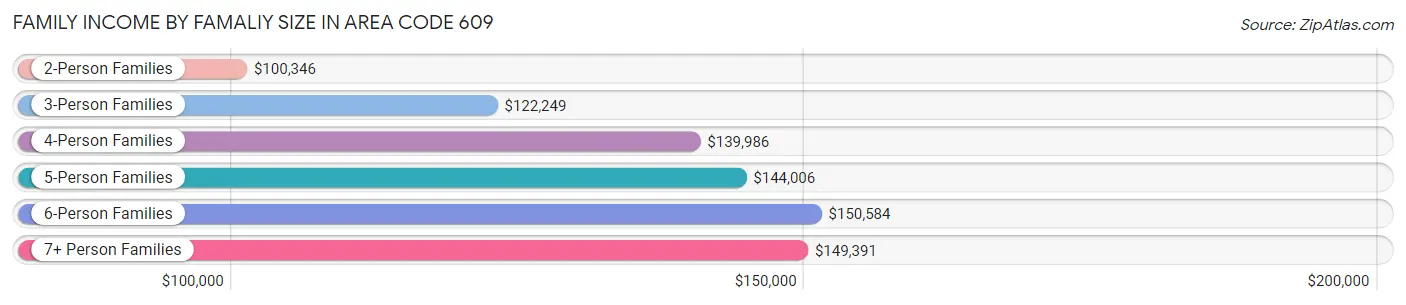
| Income Bracket | # Families | Median Income |
| 2-Person Families | 166,116 (44.8%) | $100,346 |
| 3-Person Families | 85,039 (23.0%) | $122,249 |
| 4-Person Families | 76,043 (20.5%) | $139,986 |
| 5-Person Families | 27,122 (7.3%) | $144,006 |
| 6-Person Families | 10,701 (2.9%) | $150,584 |
| 7+ Person Families | 5,437 (1.5%) | $149,391 |
| Total | 370,458 (100.0%) | $116,846 |
Family Income by Number of Earners in Area Code 609
The median family income in Area Code 609 is $116,846, with families comprising 3+ earners (52,859) having the highest median family income of $172,612, while families with no earners (52,528) have the lowest median family income of $69,124, accounting for 14.3% and 14.2% of families, respectively.
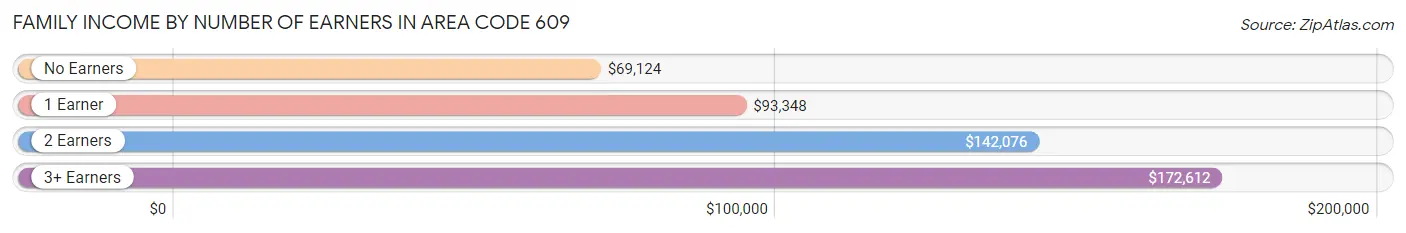
| Number of Earners | # Families | Median Income |
| No Earners | 52,528 (14.2%) | $69,124 |
| 1 Earner | 114,561 (30.9%) | $93,348 |
| 2 Earners | 150,510 (40.6%) | $142,076 |
| 3+ Earners | 52,859 (14.3%) | $172,612 |
| Total | 370,458 (100.0%) | $116,846 |
Household Income in Area Code 609
Household Income Brackets in Area Code 609
With 9,233,287 households falling in the category, the $100,000 to $149,999 income range is the most frequent in Area Code 609, accounting for 1,664.6% of all households. In contrast, only 1,605,258 households (289.4%) fall into the $10,000 to $14,999 income bracket, making it the least populous group.
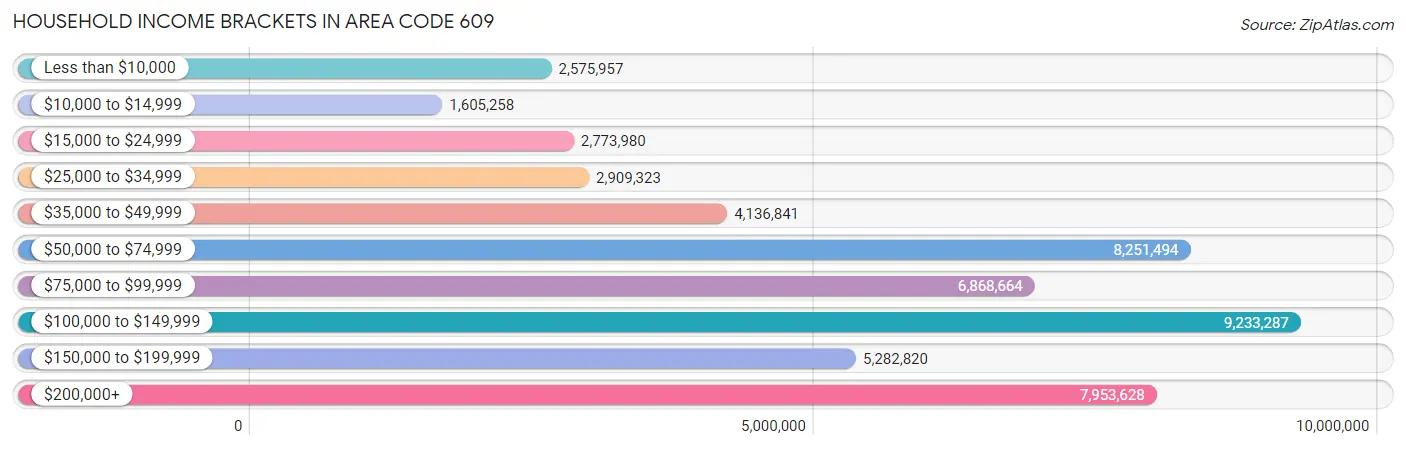
| Income Bracket | # Households | % Households |
| Less than $10,000 | 2,575,957 | 464.4% |
| $10,000 to $14,999 | 1,605,258 | 289.4% |
| $15,000 to $24,999 | 2,773,980 | 500.1% |
| $25,000 to $34,999 | 2,909,323 | 524.5% |
| $35,000 to $49,999 | 4,136,841 | 745.8% |
| $50,000 to $74,999 | 8,251,494 | 1,487.6% |
| $75,000 to $99,999 | 6,868,664 | 1,238.3% |
| $100,000 to $149,999 | 9,233,287 | 1,664.6% |
| $150,000 to $199,999 | 5,282,820 | 952.4% |
| $200,000+ | 7,953,628 | 1,433.9% |
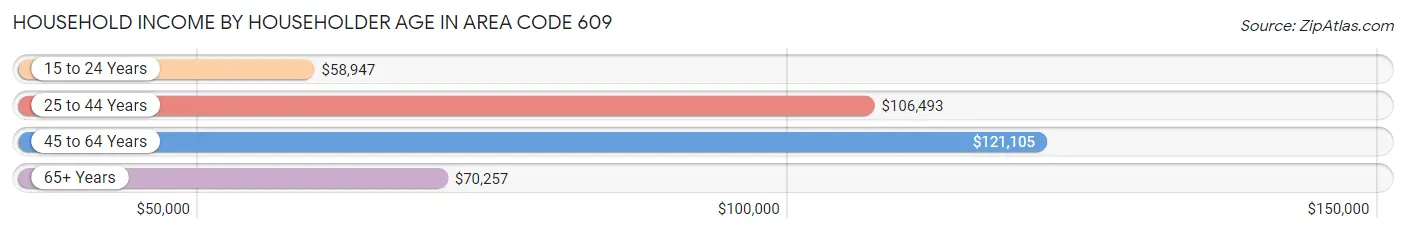
Household Income by Householder Age in Area Code 609
The median household income in Area Code 609 is $96,262, with the highest median household income of $121,105 found in the 45 to 64 years age bracket for the primary householder. A total of 223,182 households (40.2%) fall into this category. Meanwhile, the 15 to 24 years age bracket for the primary householder has the lowest median household income of $58,947, with 11,825 households (2.1%) in this group.
| Income Bracket | # Households | Median Income |
| 15 to 24 Years | 11,825 (2.1%) | $58,947 |
| 25 to 44 Years | 155,041 (28.0%) | $106,493 |
| 45 to 64 Years | 223,182 (40.2%) | $121,105 |
| 65+ Years | 164,637 (29.7%) | $70,257 |
| Total | 554,685 (100.0%) | $96,262 |
Poverty in Area Code 609
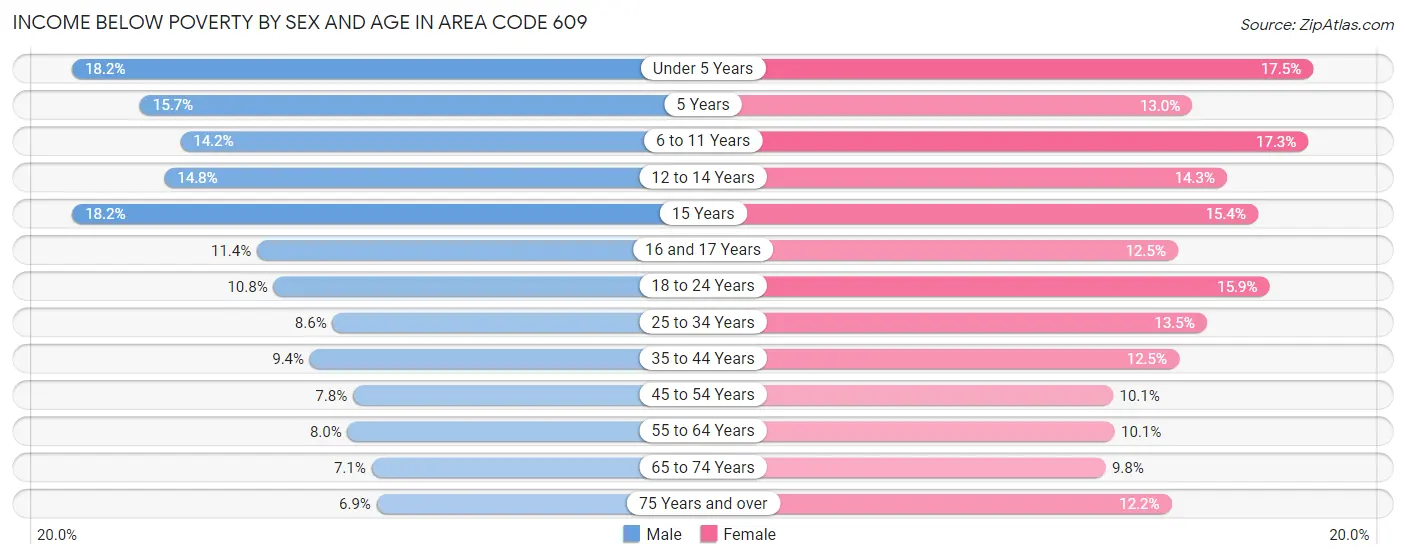
Income Below Poverty by Sex and Age in Area Code 609
With 10.0% poverty level for males and 12.6% for females among the residents of Area Code 609, under 5 year old males and under 5 year old females are the most vulnerable to poverty, with 7,193 males (18.2%) and 6,544 females (17.5%) in their respective age groups living below the poverty level.
| Age Bracket | Male | Female |
| Under 5 Years | 7,193 (18.2%) | 6,544 (17.5%) |
| 5 Years | 1,315 (15.7%) | 967 (13.0%) |
| 6 to 11 Years | 7,773 (14.2%) | 8,726 (17.3%) |
| 12 to 14 Years | 3,920 (14.8%) | 3,940 (14.3%) |
| 15 Years | 1,651 (18.2%) | 1,457 (15.4%) |
| 16 and 17 Years | 2,240 (11.4%) | 2,276 (12.5%) |
| 18 to 24 Years | 6,447 (10.8%) | 8,830 (15.9%) |
| 25 to 34 Years | 7,426 (8.6%) | 11,816 (13.5%) |
| 35 to 44 Years | 8,169 (9.4%) | 11,027 (12.5%) |
| 45 to 54 Years | 7,343 (7.8%) | 9,652 (10.1%) |
| 55 to 64 Years | 7,914 (8.0%) | 10,772 (10.1%) |
| 65 to 74 Years | 5,021 (7.1%) | 7,901 (9.8%) |
| 75 Years and over | 3,019 (6.9%) | 7,521 (12.2%) |
| Total | 69,431 (10.0%) | 91,429 (12.6%) |
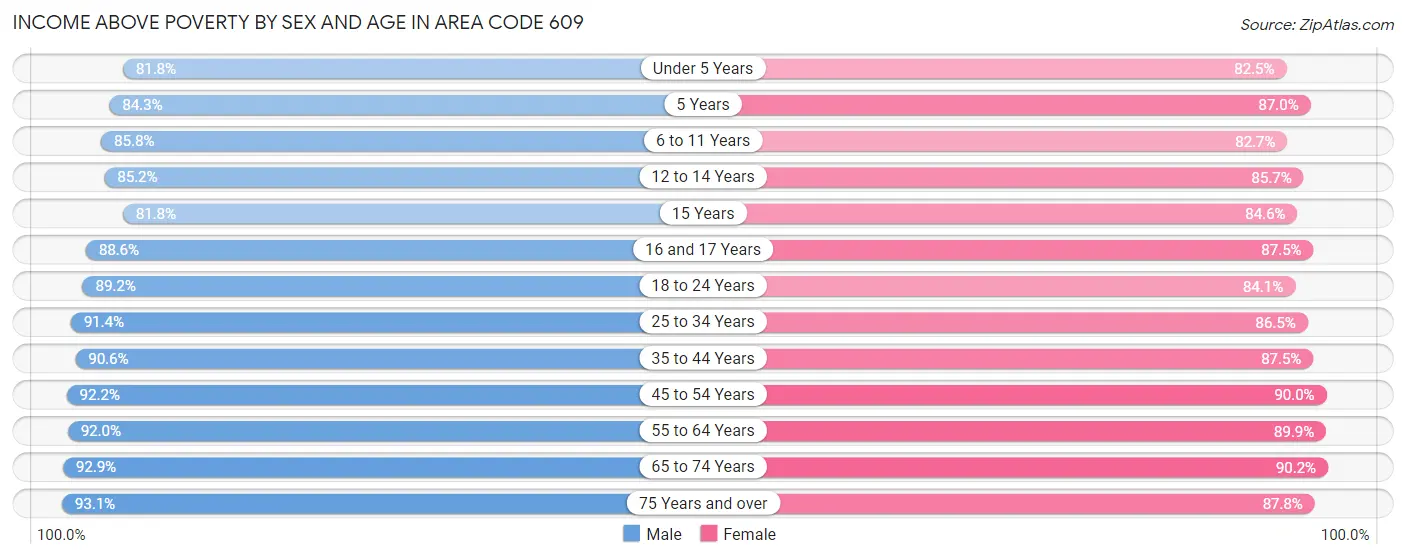
Income Above Poverty by Sex and Age in Area Code 609
According to the poverty statistics in Area Code 609, males aged 75 years and over and females aged 65 to 74 years are the age groups that are most secure financially, with 93.1% of males and 90.2% of females in these age groups living above the poverty line.
| Age Bracket | Male | Female |
| Under 5 Years | 32,234 (81.8%) | 30,869 (82.5%) |
| 5 Years | 7,050 (84.3%) | 6,472 (87.0%) |
| 6 to 11 Years | 46,873 (85.8%) | 41,673 (82.7%) |
| 12 to 14 Years | 22,540 (85.2%) | 23,633 (85.7%) |
| 15 Years | 7,407 (81.8%) | 7,981 (84.6%) |
| 16 and 17 Years | 17,456 (88.6%) | 15,979 (87.5%) |
| 18 to 24 Years | 53,472 (89.2%) | 46,826 (84.1%) |
| 25 to 34 Years | 79,209 (91.4%) | 75,465 (86.5%) |
| 35 to 44 Years | 78,640 (90.6%) | 77,086 (87.5%) |
| 45 to 54 Years | 86,667 (92.2%) | 86,410 (89.9%) |
| 55 to 64 Years | 90,930 (92.0%) | 95,746 (89.9%) |
| 65 to 74 Years | 65,457 (92.9%) | 72,961 (90.2%) |
| 75 Years and over | 40,515 (93.1%) | 53,977 (87.8%) |
| Total | 628,450 (90.0%) | 635,078 (87.4%) |
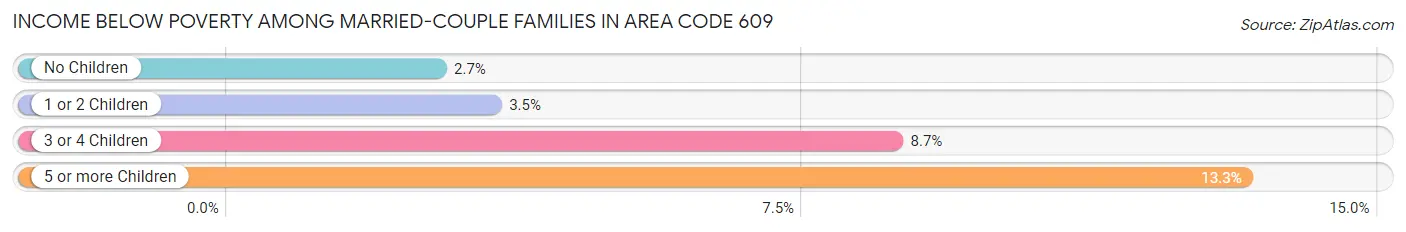
Income Below Poverty Among Married-Couple Families in Area Code 609
The poverty statistics for married-couple families in Area Code 609 show that 3.4% or 9,112 of the total 267,204 families live below the poverty line. Families with 5 or more children have the highest poverty rate of 13.3%, comprising of 141 families. On the other hand, families with no children have the lowest poverty rate of 2.7%, which includes 4,361 families.
| Children | Above Poverty | Below Poverty |
| No Children | 155,381 (97.3%) | 4,361 (2.7%) |
| 1 or 2 Children | 85,491 (96.6%) | 3,058 (3.5%) |
| 3 or 4 Children | 16,298 (91.3%) | 1,552 (8.7%) |
| 5 or more Children | 922 (86.7%) | 141 (13.3%) |
| Total | 258,092 (96.6%) | 9,112 (3.4%) |
Income Below Poverty Among Single-Parent Households in Area Code 609
According to the poverty data in Area Code 609, 11.3% or 3,299 single-father households and 22.9% or 16,962 single-mother households are living below the poverty line. Among single-father households, those with 5 or more children have the highest poverty rate, with 72 households (29.6%) experiencing poverty. Likewise, among single-mother households, those with 3 or 4 children have the highest poverty rate, with 3,724 households (52.1%) falling below the poverty line.
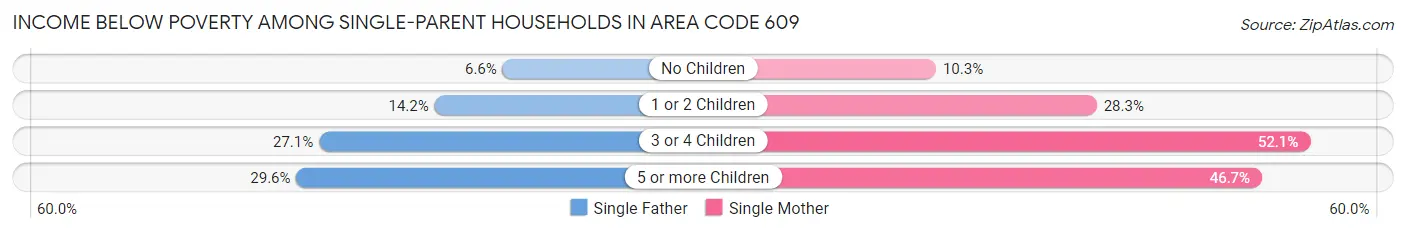
| Children | Single Father | Single Mother |
| No Children | 957 (6.6%) | 3,336 (10.3%) |
| 1 or 2 Children | 1,791 (14.2%) | 9,616 (28.3%) |
| 3 or 4 Children | 479 (27.1%) | 3,724 (52.1%) |
| 5 or more Children | 72 (29.6%) | 286 (46.7%) |
| Total | 3,299 (11.3%) | 16,962 (22.9%) |
Income Below Poverty Among Married-Couple vs Single-Parent Households in Area Code 609
The poverty data for Area Code 609 shows that 9,112 of the married-couple family households (3.4%) and 20,261 of the single-parent households (19.6%) are living below the poverty level. Within the married-couple family households, those with 5 or more children have the highest poverty rate, with 141 households (13.3%) falling below the poverty line. Among the single-parent households, those with 3 or 4 children have the highest poverty rate, with 4,203 household (47.2%) living below poverty.
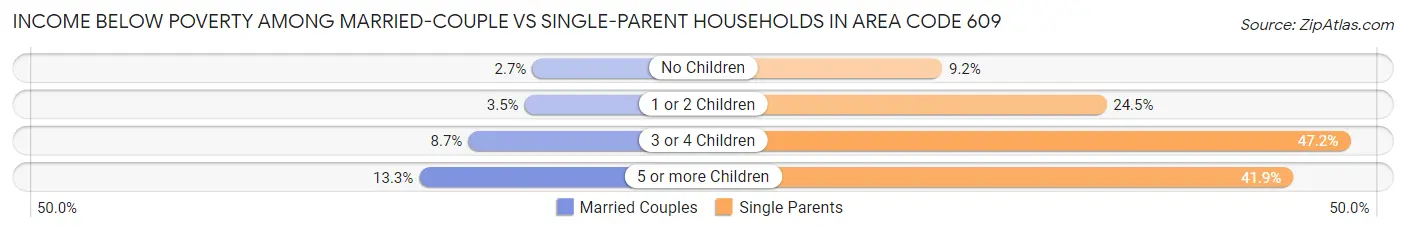
| Children | Married-Couple Families | Single-Parent Households |
| No Children | 4,361 (2.7%) | 4,293 (9.2%) |
| 1 or 2 Children | 3,058 (3.5%) | 11,407 (24.5%) |
| 3 or 4 Children | 1,552 (8.7%) | 4,203 (47.2%) |
| 5 or more Children | 141 (13.3%) | 358 (41.9%) |
| Total | 9,112 (3.4%) | 20,261 (19.6%) |
Race in Area Code 609
The most populous races in Area Code 609 are White / Caucasian (901,435 | 61.4%), Hispanic or Latino (270,081 | 18.4%), and Black / African American (229,319 | 15.6%).
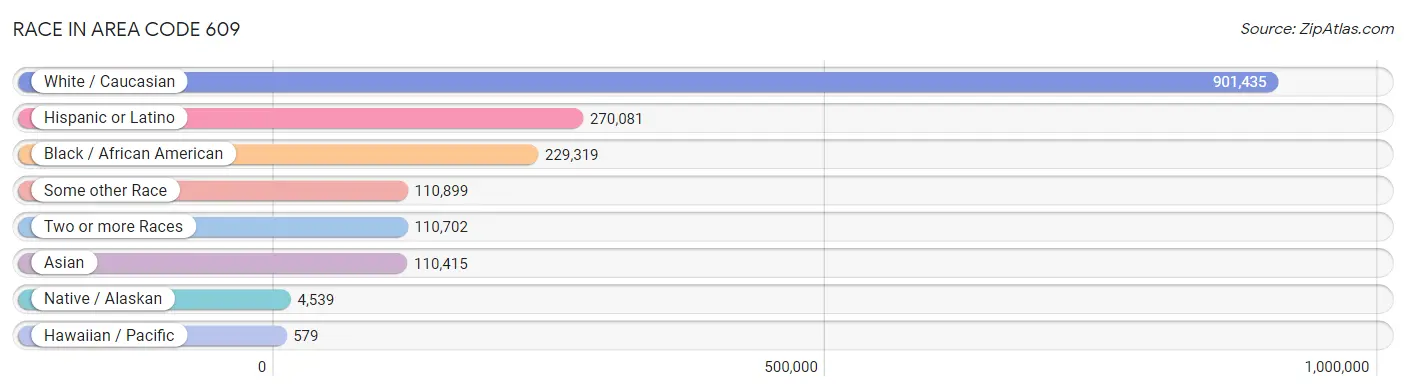
| Race | # Population | % Population |
| Asian | 110,415 | 7.5% |
| Black / African American | 229,319 | 15.6% |
| Hawaiian / Pacific | 579 | 0.0% |
| Hispanic or Latino | 270,081 | 18.4% |
| Native / Alaskan | 4,539 | 0.3% |
| White / Caucasian | 901,435 | 61.4% |
| Two or more Races | 110,702 | 7.5% |
| Some other Race | 110,899 | 7.6% |
| Total | 1,467,888 | 100.0% |
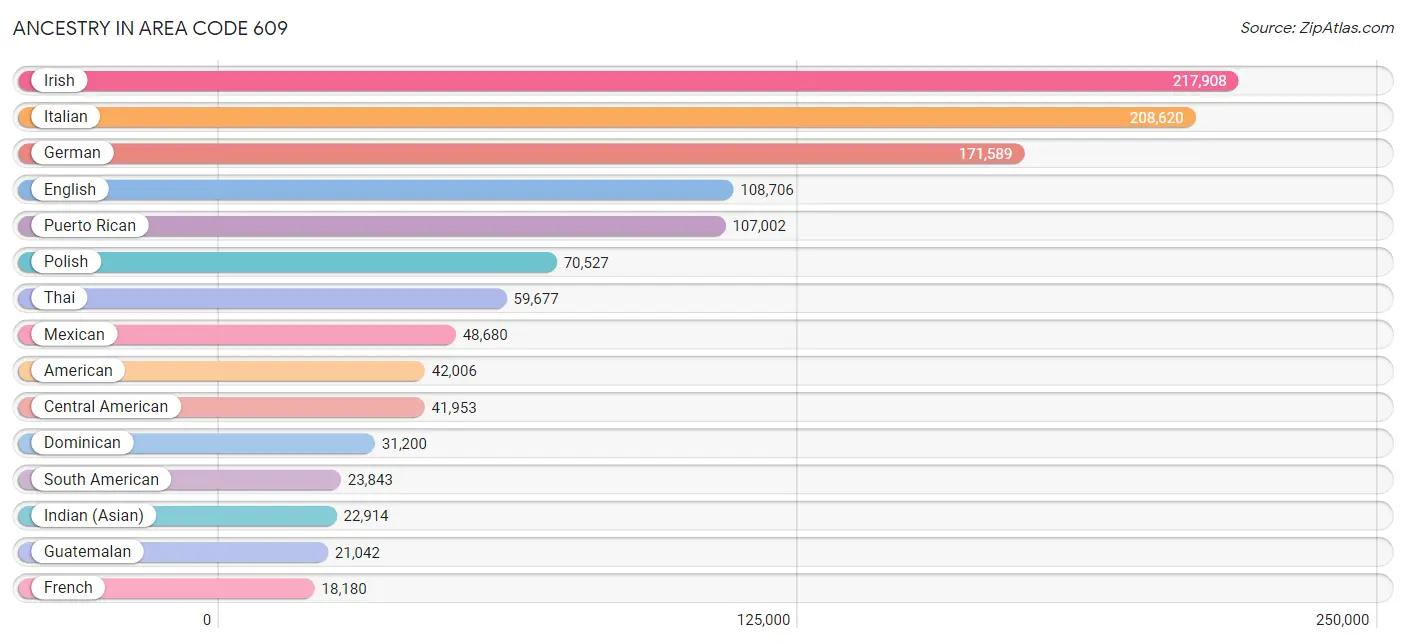
Ancestry in Area Code 609
The most populous ancestries reported in Area Code 609 are Irish (217,908 | 14.8%), Italian (208,620 | 14.2%), German (171,589 | 11.7%), English (108,706 | 7.4%), and Puerto Rican (107,002 | 7.3%), together accounting for 55.4% of all Area Code 609 residents.
| Ancestry | # Population | % Population |
| Afghan | 112 | 0.0% |
| African | 6,736 | 0.5% |
| Alaska Native | 16 | 0.0% |
| Albanian | 799 | 0.1% |
| Alsatian | 21 | 0.0% |
| American | 42,006 | 2.9% |
| Apache | 192 | 0.0% |
| Arab | 7,161 | 0.5% |
| Argentinean | 1,030 | 0.1% |
| Armenian | 1,560 | 0.1% |
| Assyrian / Chaldean / Syriac | 11 | 0.0% |
| Australian | 427 | 0.0% |
| Austrian | 3,655 | 0.3% |
| Bahamian | 49 | 0.0% |
| Bangladeshi | 11 | 0.0% |
| Barbadian | 506 | 0.0% |
| Basque | 57 | 0.0% |
| Belgian | 782 | 0.1% |
| Belizean | 190 | 0.0% |
| Bermudan | 171 | 0.0% |
| Bhutanese | 3,860 | 0.3% |
| Blackfeet | 794 | 0.1% |
| Bolivian | 307 | 0.0% |
| Brazilian | 1,655 | 0.1% |
| British | 5,083 | 0.4% |
| British West Indian | 517 | 0.0% |
| Bulgarian | 1,115 | 0.1% |
| Burmese | 8,656 | 0.6% |
| Cajun | 78 | 0.0% |
| Cambodian | 139 | 0.0% |
| Canadian | 1,422 | 0.1% |
| Cape Verdean | 62 | 0.0% |
| Carpatho Rusyn | 51 | 0.0% |
| Celtic | 151 | 0.0% |
| Central American | 41,953 | 2.9% |
| Central American Indian | 2,129 | 0.2% |
| Cherokee | 2,268 | 0.2% |
| Cheyenne | 1 | 0.0% |
| Chickasaw | 1 | 0.0% |
| Chilean | 771 | 0.1% |
| Chinese | 2 | 0.0% |
| Chippewa | 69 | 0.0% |
| Choctaw | 50 | 0.0% |
| Colombian | 7,574 | 0.5% |
| Costa Rican | 3,090 | 0.2% |
| Cree | 22 | 0.0% |
| Creek | 60 | 0.0% |
| Croatian | 1,042 | 0.1% |
| Cuban | 4,746 | 0.3% |
| Cypriot | 15 | 0.0% |
| Czech | 3,164 | 0.2% |
| Czechoslovakian | 1,087 | 0.1% |
| Danish | 2,423 | 0.2% |
| Delaware | 1,185 | 0.1% |
| Dominican | 31,200 | 2.1% |
| Dutch | 10,603 | 0.7% |
| Dutch West Indian | 12 | 0.0% |
| Eastern European | 6,593 | 0.4% |
| Ecuadorian | 7,990 | 0.5% |
| Egyptian | 2,734 | 0.2% |
| English | 108,706 | 7.4% |
| Estonian | 248 | 0.0% |
| Ethiopian | 398 | 0.0% |
| European | 11,891 | 0.8% |
| Filipino | 1,202 | 0.1% |
| Finnish | 751 | 0.1% |
| French | 18,180 | 1.2% |
| French American Indian | 30 | 0.0% |
| French Canadian | 3,944 | 0.3% |
| German | 171,589 | 11.7% |
| German Russian | 88 | 0.0% |
| Ghanaian | 1,768 | 0.1% |
| Greek | 6,704 | 0.5% |
| Guamanian / Chamorro | 494 | 0.0% |
| Guatemalan | 21,042 | 1.4% |
| Guyanese | 1,374 | 0.1% |
| Haitian | 8,871 | 0.6% |
| Hmong | 36 | 0.0% |
| Honduran | 7,658 | 0.5% |
| Hungarian | 13,913 | 0.9% |
| Icelander | 48 | 0.0% |
| Indian (Asian) | 22,914 | 1.6% |
| Indonesian | 811 | 0.1% |
| Inupiat | 2 | 0.0% |
| Iranian | 688 | 0.1% |
| Iraqi | 200 | 0.0% |
| Irish | 217,908 | 14.8% |
| Iroquois | 360 | 0.0% |
| Israeli | 669 | 0.1% |
| Italian | 208,620 | 14.2% |
| Jamaican | 7,230 | 0.5% |
| Japanese | 1,251 | 0.1% |
| Jordanian | 227 | 0.0% |
| Kenyan | 407 | 0.0% |
| Korean | 13,860 | 0.9% |
| Laotian | 72 | 0.0% |
| Latvian | 631 | 0.0% |
| Lebanese | 1,132 | 0.1% |
| Liberian | 3,243 | 0.2% |
| Lithuanian | 4,868 | 0.3% |
| Lumbee | 32 | 0.0% |
| Luxembourger | 51 | 0.0% |
| Macedonian | 333 | 0.0% |
| Malaysian | 132 | 0.0% |
| Maltese | 86 | 0.0% |
| Mexican | 48,680 | 3.3% |
| Mexican American Indian | 1,069 | 0.1% |
| Mongolian | 78 | 0.0% |
| Moroccan | 637 | 0.0% |
| Native Hawaiian | 654 | 0.0% |
| Navajo | 202 | 0.0% |
| New Zealander | 19 | 0.0% |
| Nicaraguan | 2,366 | 0.2% |
| Nigerian | 3,602 | 0.3% |
| Northern European | 1,056 | 0.1% |
| Norwegian | 6,923 | 0.5% |
| Okinawan | 91 | 0.0% |
| Osage | 8 | 0.0% |
| Pakistani | 827 | 0.1% |
| Palestinian | 777 | 0.1% |
| Panamanian | 1,531 | 0.1% |
| Paraguayan | 21 | 0.0% |
| Pennsylvania German | 1,746 | 0.1% |
| Peruvian | 4,400 | 0.3% |
| Polish | 70,527 | 4.8% |
| Portuguese | 3,808 | 0.3% |
| Potawatomi | 4 | 0.0% |
| Pueblo | 8 | 0.0% |
| Puerto Rican | 107,002 | 7.3% |
| Romanian | 2,623 | 0.2% |
| Russian | 17,392 | 1.2% |
| Salvadoran | 6,022 | 0.4% |
| Samoan | 220 | 0.0% |
| Scandinavian | 1,833 | 0.1% |
| Scotch-Irish | 6,534 | 0.4% |
| Scottish | 15,585 | 1.1% |
| Seminole | 19 | 0.0% |
| Senegalese | 170 | 0.0% |
| Serbian | 642 | 0.0% |
| Sierra Leonean | 891 | 0.1% |
| Sioux | 102 | 0.0% |
| Slavic | 1,093 | 0.1% |
| Slovak | 4,523 | 0.3% |
| Slovene | 333 | 0.0% |
| Somali | 11 | 0.0% |
| South African | 131 | 0.0% |
| South American | 23,843 | 1.6% |
| South American Indian | 402 | 0.0% |
| Spaniard | 2,726 | 0.2% |
| Spanish | 1,795 | 0.1% |
| Spanish American | 254 | 0.0% |
| Spanish American Indian | 20 | 0.0% |
| Sri Lankan | 6,874 | 0.5% |
| Subsaharan African | 18,062 | 1.2% |
| Sudanese | 95 | 0.0% |
| Swedish | 7,698 | 0.5% |
| Swiss | 1,705 | 0.1% |
| Syrian | 519 | 0.0% |
| Thai | 59,677 | 4.1% |
| Tongan | 33 | 0.0% |
| Trinidadian and Tobagonian | 2,146 | 0.2% |
| Turkish | 3,264 | 0.2% |
| U.S. Virgin Islander | 217 | 0.0% |
| Ugandan | 8 | 0.0% |
| Ukrainian | 9,745 | 0.7% |
| Uruguayan | 221 | 0.0% |
| Ute | 4 | 0.0% |
| Venezuelan | 1,282 | 0.1% |
| Vietnamese | 1,890 | 0.1% |
| Welsh | 7,048 | 0.5% |
| West Indian | 2,136 | 0.2% |
| Yaqui | 3 | 0.0% |
| Yugoslavian | 774 | 0.1% |
| Zimbabwean | 135 | 0.0% | View All 174 Rows |
Immigrants in Area Code 609
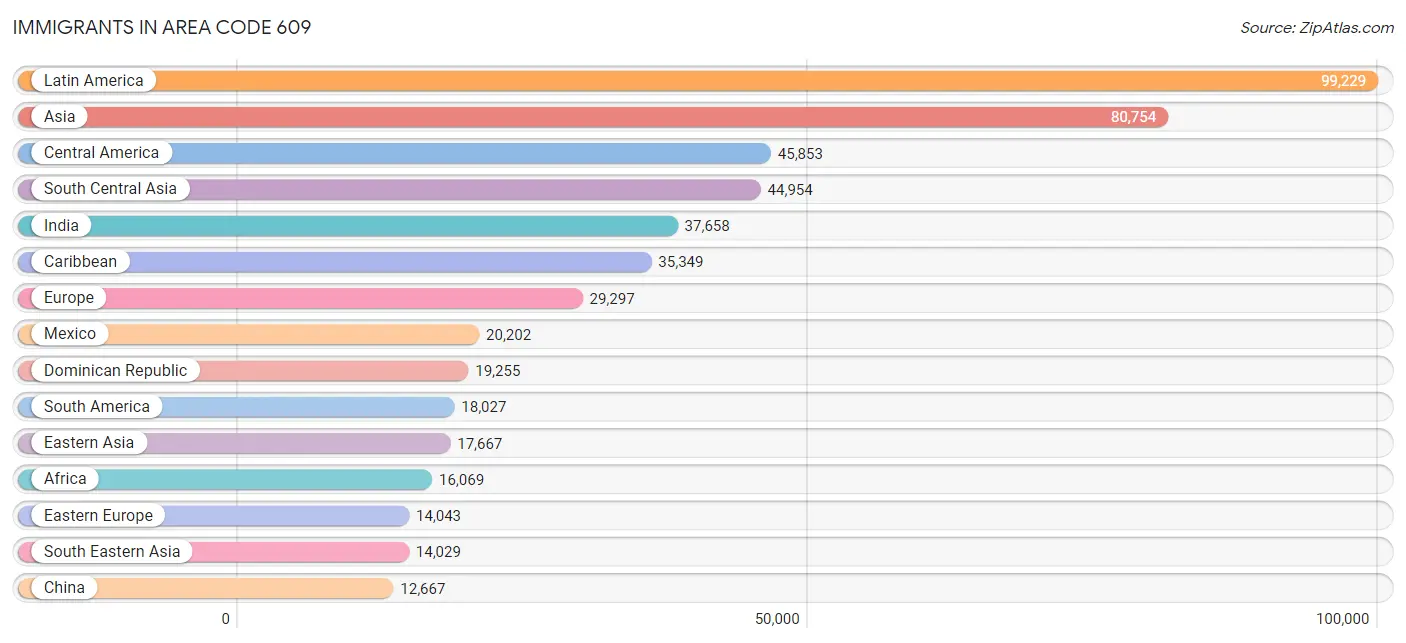
The most numerous immigrant groups reported in Area Code 609 came from Latin America (99,229 | 6.8%), Asia (80,754 | 5.5%), Central America (45,853 | 3.1%), South Central Asia (44,954 | 3.1%), and India (37,658 | 2.6%), together accounting for 21.0% of all Area Code 609 residents.
| Immigration Origin | # Population | % Population |
| Afghanistan | 126 | 0.0% |
| Africa | 16,069 | 1.1% |
| Albania | 404 | 0.0% |
| Argentina | 563 | 0.0% |
| Armenia | 39 | 0.0% |
| Asia | 80,754 | 5.5% |
| Australia | 331 | 0.0% |
| Austria | 169 | 0.0% |
| Bahamas | 56 | 0.0% |
| Bangladesh | 2,701 | 0.2% |
| Barbados | 312 | 0.0% |
| Belarus | 338 | 0.0% |
| Belgium | 123 | 0.0% |
| Belize | 91 | 0.0% |
| Bolivia | 260 | 0.0% |
| Bosnia and Herzegovina | 91 | 0.0% |
| Brazil | 1,577 | 0.1% |
| Bulgaria | 884 | 0.1% |
| Cabo Verde | 48 | 0.0% |
| Cambodia | 358 | 0.0% |
| Cameroon | 209 | 0.0% |
| Canada | 1,805 | 0.1% |
| Caribbean | 35,349 | 2.4% |
| Central America | 45,853 | 3.1% |
| Chile | 481 | 0.0% |
| China | 12,667 | 0.9% |
| Colombia | 4,821 | 0.3% |
| Congo | 14 | 0.0% |
| Costa Rica | 1,891 | 0.1% |
| Croatia | 164 | 0.0% |
| Cuba | 1,531 | 0.1% |
| Czechoslovakia | 367 | 0.0% |
| Denmark | 182 | 0.0% |
| Dominica | 165 | 0.0% |
| Dominican Republic | 19,255 | 1.3% |
| Eastern Africa | 1,482 | 0.1% |
| Eastern Asia | 17,667 | 1.2% |
| Eastern Europe | 14,043 | 1.0% |
| Ecuador | 5,038 | 0.3% |
| Egypt | 1,950 | 0.1% |
| El Salvador | 3,825 | 0.3% |
| England | 1,643 | 0.1% |
| Eritrea | 136 | 0.0% |
| Ethiopia | 193 | 0.0% |
| Europe | 29,297 | 2.0% |
| France | 1,041 | 0.1% |
| Germany | 3,593 | 0.2% |
| Ghana | 1,985 | 0.1% |
| Greece | 719 | 0.1% |
| Grenada | 132 | 0.0% |
| Guatemala | 12,366 | 0.8% |
| Guyana | 1,428 | 0.1% |
| Haiti | 6,410 | 0.4% |
| Honduras | 5,802 | 0.4% |
| Hong Kong | 1,026 | 0.1% |
| Hungary | 523 | 0.0% |
| India | 37,658 | 2.6% |
| Indonesia | 212 | 0.0% |
| Iran | 387 | 0.0% |
| Iraq | 190 | 0.0% |
| Ireland | 589 | 0.0% |
| Israel | 614 | 0.0% |
| Italy | 3,149 | 0.2% |
| Jamaica | 5,017 | 0.3% |
| Japan | 1,009 | 0.1% |
| Jordan | 210 | 0.0% |
| Kazakhstan | 89 | 0.0% |
| Kenya | 519 | 0.0% |
| Korea | 3,991 | 0.3% |
| Kuwait | 30 | 0.0% |
| Laos | 19 | 0.0% |
| Latin America | 99,229 | 6.8% |
| Latvia | 91 | 0.0% |
| Lebanon | 328 | 0.0% |
| Liberia | 4,977 | 0.3% |
| Lithuania | 89 | 0.0% |
| Malaysia | 455 | 0.0% |
| Mexico | 20,202 | 1.4% |
| Middle Africa | 233 | 0.0% |
| Moldova | 204 | 0.0% |
| Morocco | 290 | 0.0% |
| Nepal | 178 | 0.0% |
| Netherlands | 350 | 0.0% |
| Nicaragua | 1,097 | 0.1% |
| Nigeria | 2,456 | 0.2% |
| North Macedonia | 223 | 0.0% |
| Northern Africa | 2,608 | 0.2% |
| Northern Europe | 4,559 | 0.3% |
| Norway | 108 | 0.0% |
| Oceania | 417 | 0.0% |
| Pakistan | 3,206 | 0.2% |
| Panama | 448 | 0.0% |
| Peru | 2,513 | 0.2% |
| Philippines | 7,606 | 0.5% |
| Poland | 4,643 | 0.3% |
| Portugal | 772 | 0.1% |
| Romania | 950 | 0.1% |
| Russia | 2,233 | 0.2% |
| Saudi Arabia | 153 | 0.0% |
| Scotland | 285 | 0.0% |
| Senegal | 229 | 0.0% |
| Serbia | 156 | 0.0% |
| Sierra Leone | 705 | 0.1% |
| Singapore | 430 | 0.0% |
| South Africa | 114 | 0.0% |
| South America | 18,027 | 1.2% |
| South Central Asia | 44,954 | 3.1% |
| South Eastern Asia | 14,029 | 1.0% |
| Southern Europe | 5,169 | 0.4% |
| Spain | 504 | 0.0% |
| Sri Lanka | 220 | 0.0% |
| St. Vincent and the Grenadines | 50 | 0.0% |
| Sudan | 230 | 0.0% |
| Sweden | 234 | 0.0% |
| Switzerland | 148 | 0.0% |
| Syria | 104 | 0.0% |
| Taiwan | 1,606 | 0.1% |
| Thailand | 367 | 0.0% |
| Trinidad and Tobago | 1,515 | 0.1% |
| Turkey | 1,755 | 0.1% |
| Uganda | 220 | 0.0% |
| Ukraine | 1,985 | 0.1% |
| Uruguay | 60 | 0.0% |
| Uzbekistan | 202 | 0.0% |
| Venezuela | 1,113 | 0.1% |
| Vietnam | 4,156 | 0.3% |
| West Indies | 21 | 0.0% |
| Western Africa | 10,939 | 0.7% |
| Western Asia | 3,962 | 0.3% |
| Western Europe | 5,450 | 0.4% |
| Yemen | 105 | 0.0% |
| Zaire | 10 | 0.0% |
| Zimbabwe | 62 | 0.0% | View All 133 Rows |
Sex and Age in Area Code 609
Sex and Age in Area Code 609
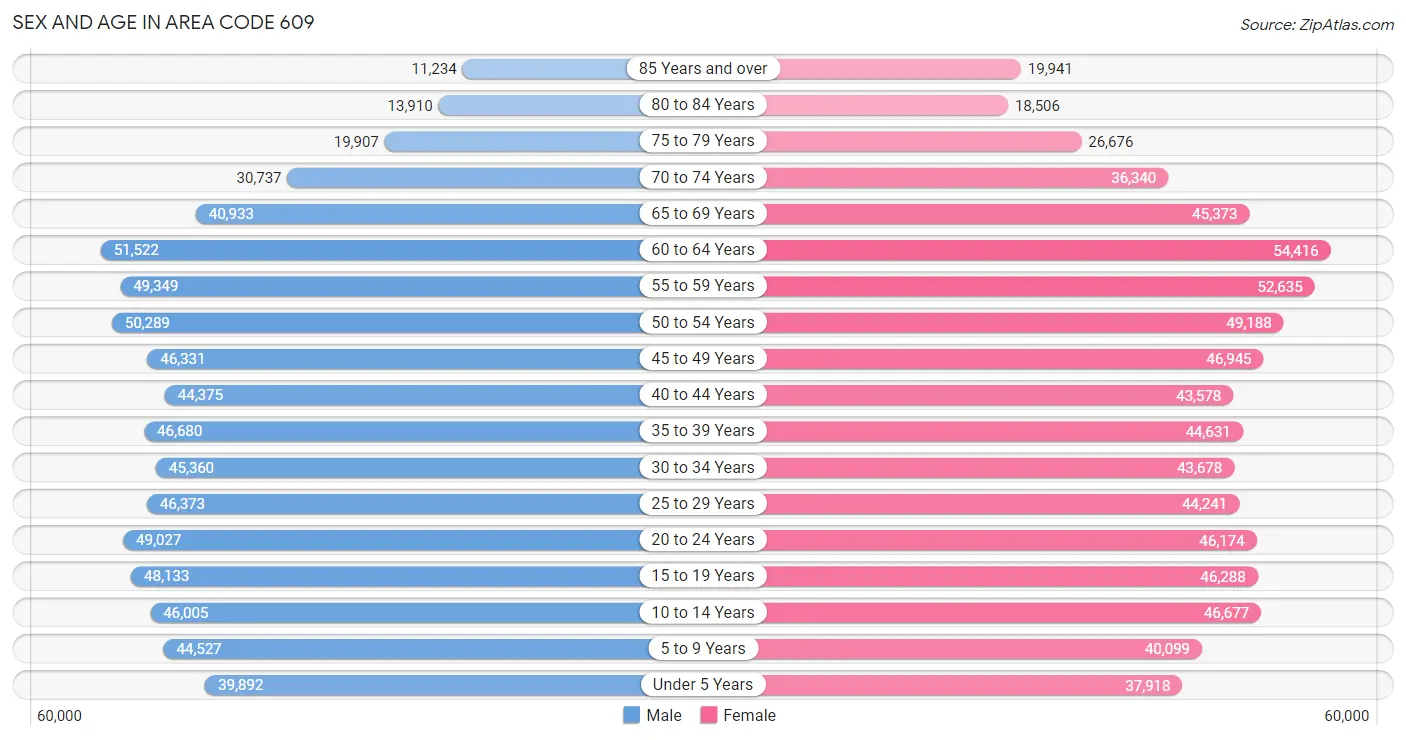
The most populous age groups in Area Code 609 are 60 to 64 Years (51,522 | 7.1%) for men and 60 to 64 Years (54,416 | 7.3%) for women.
| Age Bracket | Male | Female |
| Under 5 Years | 39,892 (5.5%) | 37,918 (5.1%) |
| 5 to 9 Years | 44,527 (6.1%) | 40,099 (5.4%) |
| 10 to 14 Years | 46,005 (6.4%) | 46,677 (6.3%) |
| 15 to 19 Years | 48,133 (6.6%) | 46,288 (6.2%) |
| 20 to 24 Years | 49,027 (6.8%) | 46,174 (6.2%) |
| 25 to 29 Years | 46,373 (6.4%) | 44,241 (5.9%) |
| 30 to 34 Years | 45,360 (6.3%) | 43,678 (5.9%) |
| 35 to 39 Years | 46,680 (6.4%) | 44,631 (6.0%) |
| 40 to 44 Years | 44,375 (6.1%) | 43,578 (5.9%) |
| 45 to 49 Years | 46,331 (6.4%) | 46,945 (6.3%) |
| 50 to 54 Years | 50,289 (6.9%) | 49,188 (6.6%) |
| 55 to 59 Years | 49,349 (6.8%) | 52,635 (7.1%) |
| 60 to 64 Years | 51,522 (7.1%) | 54,416 (7.3%) |
| 65 to 69 Years | 40,933 (5.7%) | 45,373 (6.1%) |
| 70 to 74 Years | 30,737 (4.2%) | 36,340 (4.9%) |
| 75 to 79 Years | 19,907 (2.8%) | 26,676 (3.6%) |
| 80 to 84 Years | 13,910 (1.9%) | 18,506 (2.5%) |
| 85 Years and over | 11,234 (1.5%) | 19,941 (2.7%) |
| Total | 724,584 (100.0%) | 743,304 (100.0%) |
Families and Households in Area Code 609
Median Family Size in Area Code 609
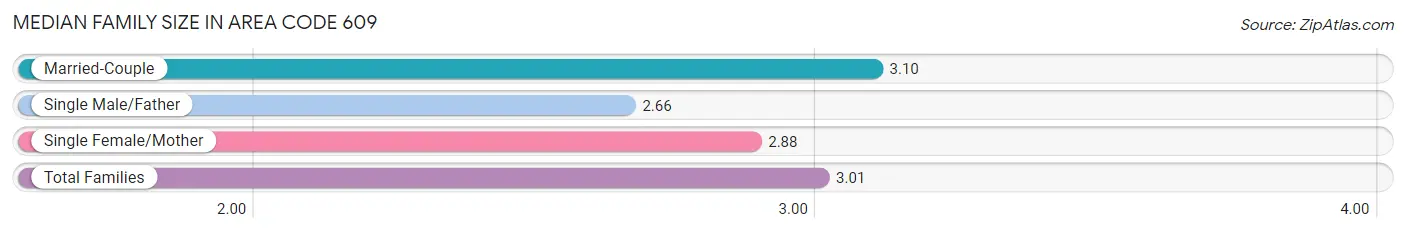
The median family size in Area Code 609 is 3.01 persons per family, with married-couple families (267,204 | 72.1%) accounting for the largest median family size of 3.10065 persons per family. On the other hand, single male/father families (29,174 | 7.9%) represent the smallest median family size with 2.66 persons per family.
| Family Type | # Families | Family Size |
| Married-Couple | 267,204 (72.1%) | 3.10 |
| Single Male/Father | 29,174 (7.9%) | 2.66 |
| Single Female/Mother | 74,080 (20.0%) | 2.88 |
| Total Families | 370,458 (100.0%) | 3.01 |
Median Household Size in Area Code 609
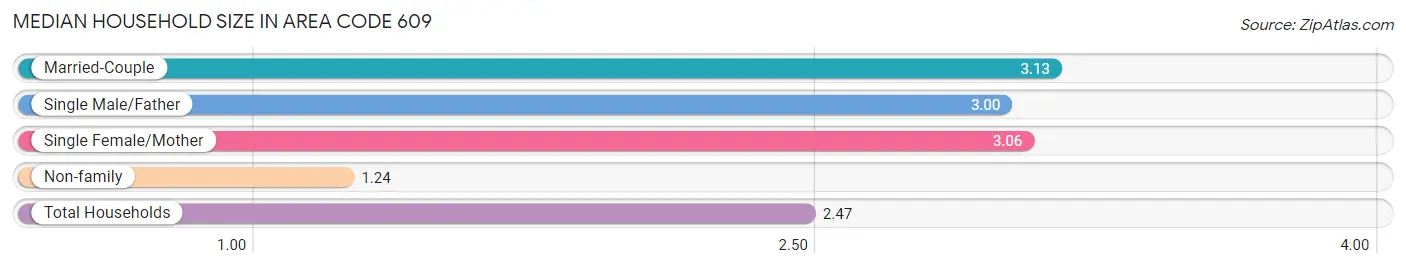
The median household size in Area Code 609 is 2.47 persons per household, with married-couple households (267,204 | 48.2%) accounting for the largest median household size of 3.12978 persons per household. non-family households (184,227 | 33.2%) represent the smallest median household size with 1.24 persons per household.
| Household Type | # Households | Household Size |
| Married-Couple | 267,204 (48.2%) | 3.13 |
| Single Male/Father | 29,174 (5.3%) | 3.00 |
| Single Female/Mother | 74,080 (13.4%) | 3.06 |
| Non-family | 184,227 (33.2%) | 1.24 |
| Total Households | 554,685 (100.0%) | 2.47 |
Household Size by Marriage Status in Area Code 609
Out of a total of 554,685 households in Area Code 609, 370,458 (66.8%) are family households, while 184,227 (33.2%) are nonfamily households. The most numerous type of family households are 2-person households, comprising 155,642, and the most common type of nonfamily households are 1-person households, comprising 153,057.
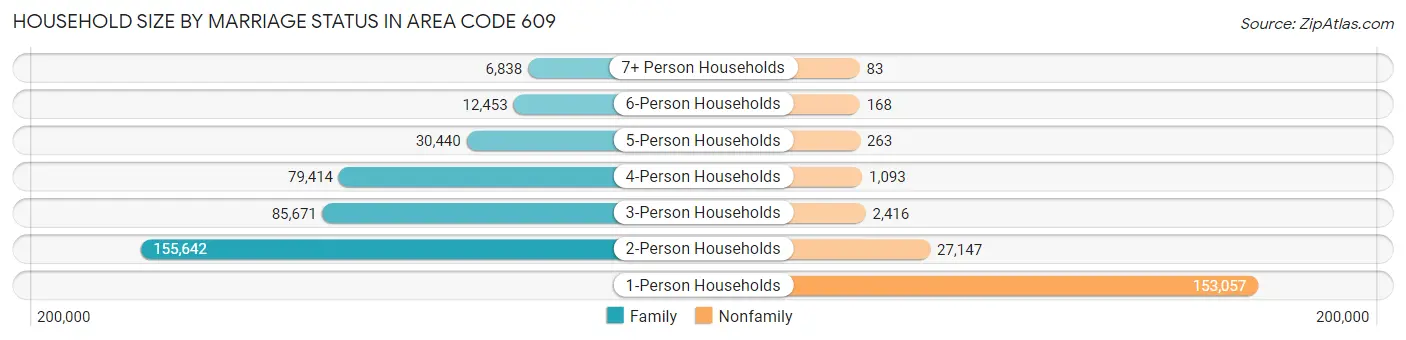
| Household Size | Family Households | Nonfamily Households |
| 1-Person Households | - | 153,057 (27.6%) |
| 2-Person Households | 155,642 (28.1%) | 27,147 (4.9%) |
| 3-Person Households | 85,671 (15.4%) | 2,416 (0.4%) |
| 4-Person Households | 79,414 (14.3%) | 1,093 (0.2%) |
| 5-Person Households | 30,440 (5.5%) | 263 (0.1%) |
| 6-Person Households | 12,453 (2.2%) | 168 (0.0%) |
| 7+ Person Households | 6,838 (1.2%) | 83 (0.0%) |
| Total | 370,458 (66.8%) | 184,227 (33.2%) |
Female Fertility in Area Code 609
Fertility by Age in Area Code 609
Average fertility rate in Area Code 609 is 52.0 births per 1,000 women. Women in the age bracket of 20 to 34 years have the highest fertility rate with 91.0 births per 1,000 women. Women in the age bracket of 20 to 34 years acount for 70.6% of all women with births.
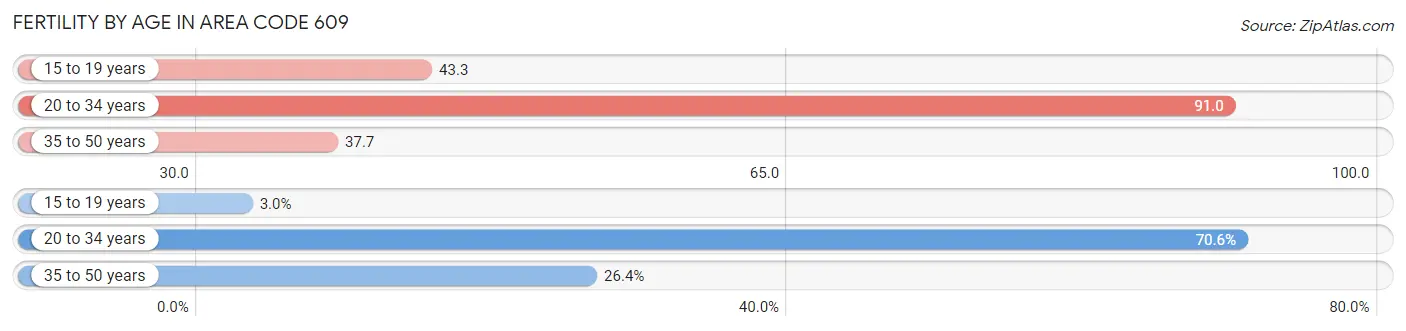
| Age Bracket | Women with Births | Births / 1,000 Women |
| 15 to 19 years | 474 (3.0%) | 43.3 |
| 20 to 34 years | 11,043 (70.6%) | 91.0 |
| 35 to 50 years | 4,134 (26.4%) | 37.7 |
| Total | 15,651 (100.0%) | 52.0 |
Fertility by Age by Marriage Status in Area Code 609
59.0% of women with births (15,651) in Area Code 609 are married. The highest percentage of unmarried women with births falls into 15 to 19 years age bracket with 93.5% of them unmarried at the time of birth, while the lowest percentage of unmarried women with births belong to 20 to 34 years age bracket with 47.7% of them unmarried.
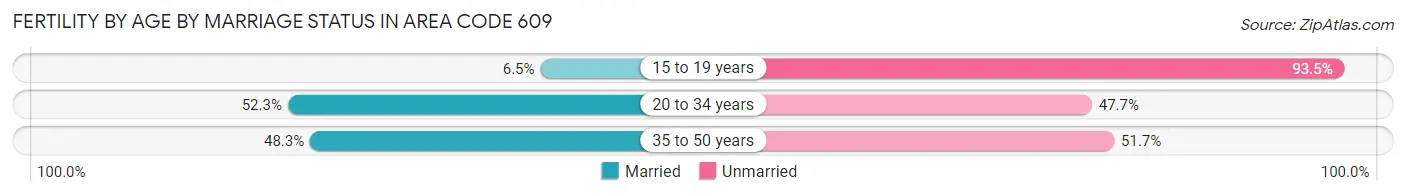
| Age Bracket | Married | Unmarried |
| 15 to 19 years | 31 (6.5%) | 443 (93.5%) |
| 20 to 34 years | 5,778 (52.3%) | 5,265 (47.7%) |
| 35 to 50 years | 1,996 (48.3%) | 2,138 (51.7%) |
| Total | 9,231 (59.0%) | 6,420 (41.0%) |
Fertility by Education in Area Code 609
Average fertility rate in Area Code 609 is 52.0 births per 1,000 women. Women with the education attainment of graduate degree have the highest fertility rate of 80.2 births per 1,000 women, while women with the education attainment of less than high school have the lowest fertility at 48.8 births per 1,000 women. Women with the education attainment of college or associate's degree represent 28.8% of all women with births.
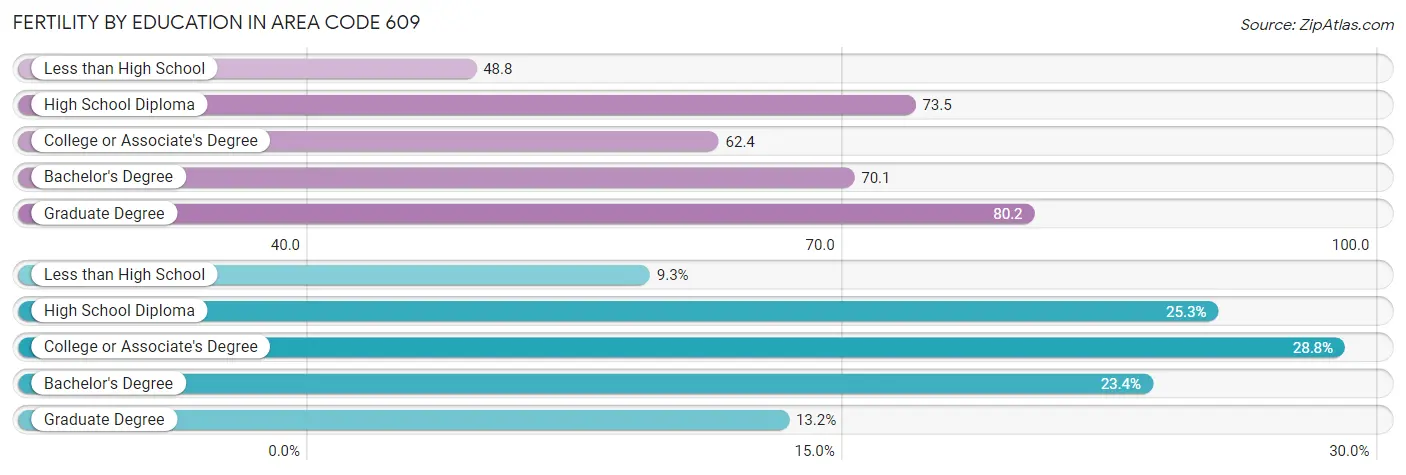
| Educational Attainment | Women with Births | Births / 1,000 Women |
| Less than High School | 1,454 (9.3%) | 48.8 |
| High School Diploma | 3,954 (25.3%) | 73.5 |
| College or Associate's Degree | 4,511 (28.8%) | 62.4 |
| Bachelor's Degree | 3,666 (23.4%) | 70.1 |
| Graduate Degree | 2,066 (13.2%) | 80.2 |
| Total | 15,651 (100.0%) | 52.0 |
Fertility by Education by Marriage Status in Area Code 609
41.0% of women with births in Area Code 609 are unmarried. Women with the educational attainment of bachelor's degree are most likely to be married with 56.4% of them married at childbirth, while women with the educational attainment of college or associate's degree are least likely to be married with 75.7% of them unmarried at childbirth.
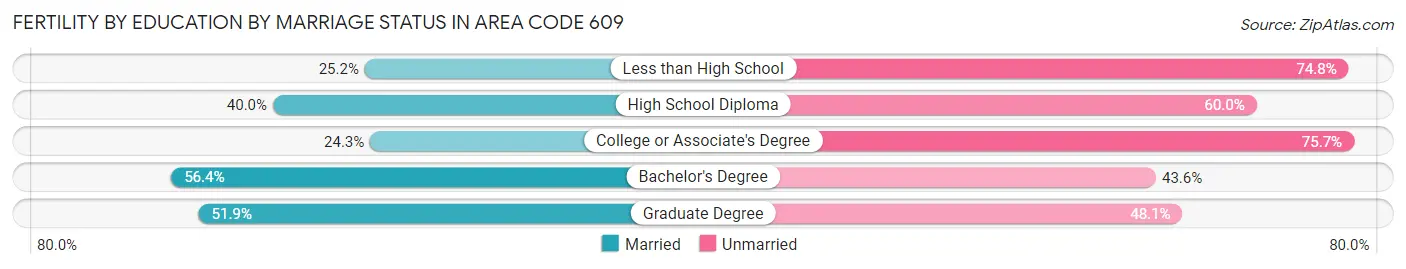
| Educational Attainment | Married | Unmarried |
| Less than High School | 366 (25.2%) | 1,088 (74.8%) |
| High School Diploma | 1,581 (40.0%) | 2,373 (60.0%) |
| College or Associate's Degree | 1,096 (24.3%) | 3,415 (75.7%) |
| Bachelor's Degree | 2,066 (56.4%) | 1,600 (43.6%) |
| Graduate Degree | 1,073 (51.9%) | 993 (48.1%) |
| Total | 9,231 (59.0%) | 6,420 (41.0%) |
Employment Characteristics in Area Code 609
Employment by Class of Employer in Area Code 609
Among the 681,958 employed individuals in Area Code 609, private company employees (451,651 | 66.2%), local government employees (60,826 | 8.9%), and not-for-profit organizations (56,836 | 8.3%) make up the most common classes of employment.
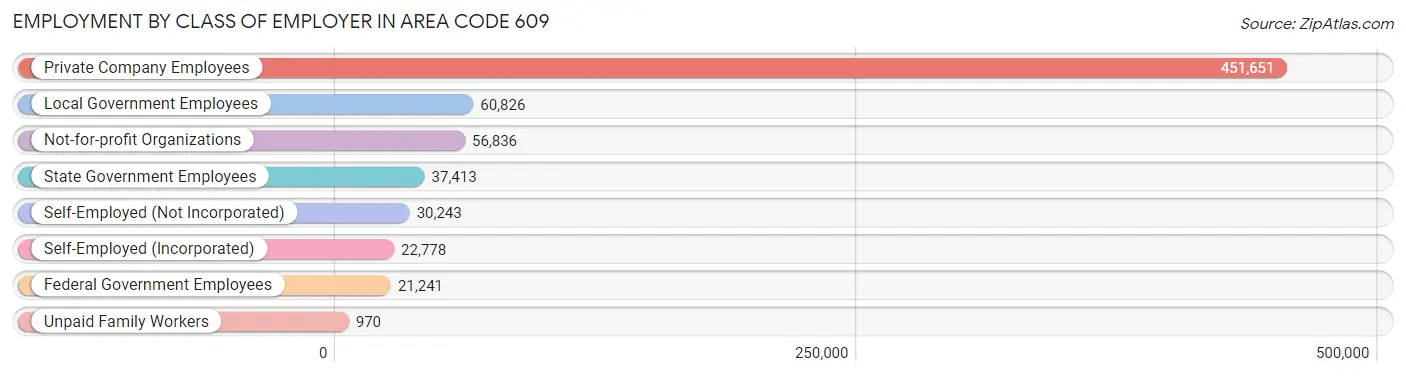
| Employer Class | # Employees | % Employees |
| Private Company Employees | 451,651 | 66.2% |
| Self-Employed (Incorporated) | 22,778 | 3.3% |
| Self-Employed (Not Incorporated) | 30,243 | 4.4% |
| Not-for-profit Organizations | 56,836 | 8.3% |
| Local Government Employees | 60,826 | 8.9% |
| State Government Employees | 37,413 | 5.5% |
| Federal Government Employees | 21,241 | 3.1% |
| Unpaid Family Workers | 970 | 0.1% |
| Total | 681,958 | 100.0% |
Employment Status by Age in Area Code 609
According to the labor force statistics for Area Code 609, out of the total population over 16 years of age (1,194,231), 60.0% or 716,897 individuals are in the labor force, with 7.0% or 50,326 of them unemployed. The age group with the highest labor force participation rate is 25 to 29 years, with 84.8% or 76,868 individuals in the labor force. Within the labor force, the 16 to 19 years age range has the highest percentage of unemployed individuals, with 1,084.3% or 309,448 of them being unemployed.
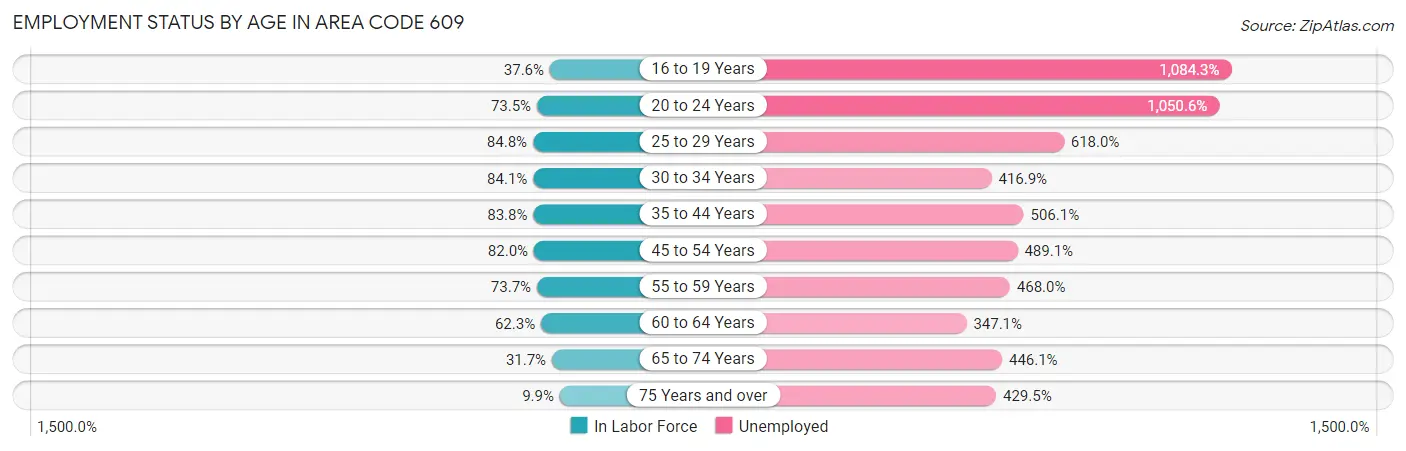
| Age Bracket | In Labor Force | Unemployed |
| 16 to 19 Years | 28,541 (37.6%) | 309,448 (1,084.3%) |
| 20 to 24 Years | 70,004 (73.5%) | 735,431 (1,050.6%) |
| 25 to 29 Years | 76,871 (84.8%) | 475,044 (618.0%) |
| 30 to 34 Years | 74,849 (84.1%) | 312,029 (416.9%) |
| 35 to 44 Years | 150,136 (83.8%) | 759,828 (506.1%) |
| 45 to 54 Years | 158,036 (82.0%) | 772,964 (489.1%) |
| 55 to 59 Years | 75,123 (73.7%) | 351,566 (468.0%) |
| 60 to 64 Years | 66,013 (62.3%) | 229,121 (347.1%) |
| 65 to 74 Years | 48,657 (31.7%) | 217,041 (446.1%) |
| 75 Years and over | 10,926 (9.9%) | 46,940 (429.5%) |
| Total | 716,872 (60.0%) | 50,294 (7.0%) |
Employment Status by Educational Attainment in Area Code 609
According to labor force statistics for Area Code 609, 77.8% of individuals (591,190) out of the total population between 25 and 64 years of age (759,591) are in the labor force, with 534.3% or 3,158,728 of them being unemployed. The group with the highest labor force participation rate are those with the educational attainment of bachelor's degree or higher, with 86.1% or 245,659 individuals in the labor force. Within the labor force, individuals with less than high school education have the highest percentage of unemployment, with 753.8% or 335,471 of them being unemployed.
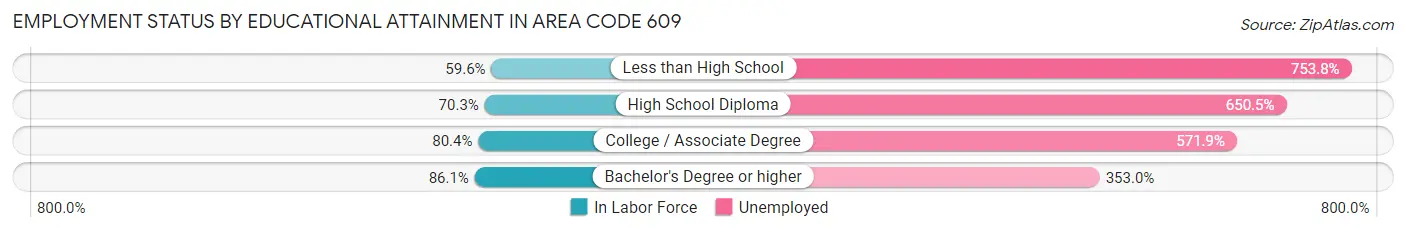
| Educational Attainment | In Labor Force | Unemployed |
| Less than High School | 44,506 (59.6%) | 563,247 (753.8%) |
| High School Diploma | 148,680 (70.3%) | 1,376,100 (650.5%) |
| College / Associate Degree | 150,975 (80.3%) | 1,074,640 (571.9%) |
| Bachelor's Degree or higher | 245,664 (86.1%) | 1,007,526 (353.0%) |
| Total | 591,168 (77.8%) | 4,058,495 (534.3%) |
Employment Occupations by Sex in Area Code 609
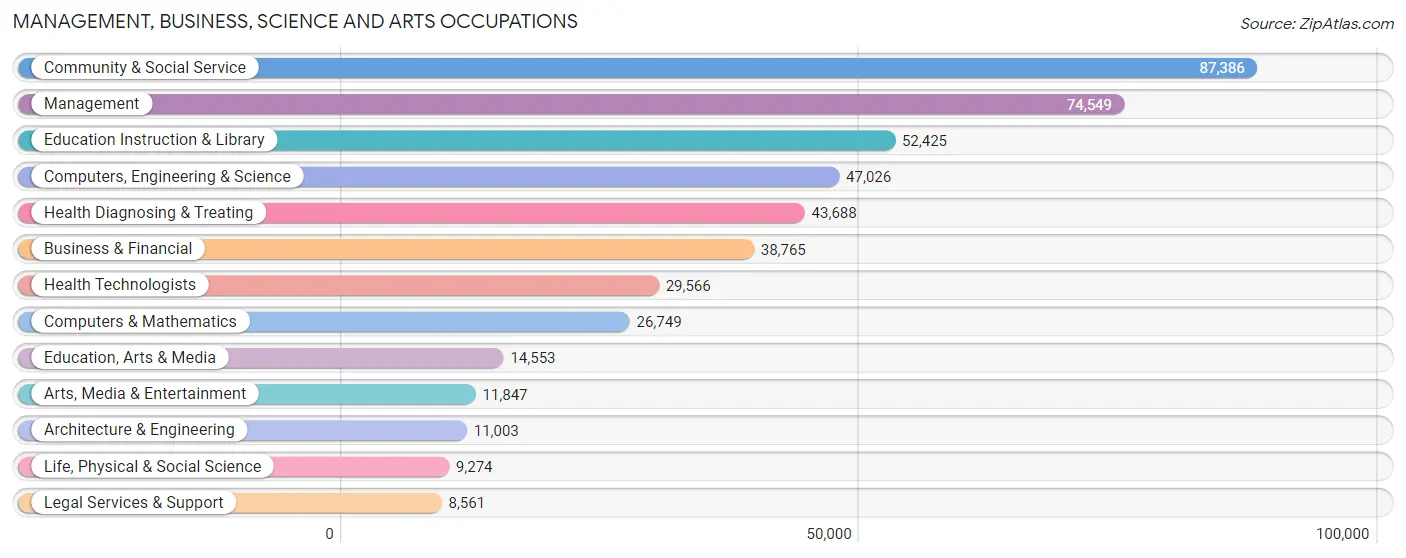
Management, Business, Science and Arts Occupations
The most common Management, Business, Science and Arts occupations in Area Code 609 are Community & Social Service (87,386 | 12.6%), Management (74,549 | 10.7%), Education Instruction & Library (52,425 | 7.5%), Computers, Engineering & Science (47,026 | 6.8%), and Health Diagnosing & Treating (43,688 | 6.3%).
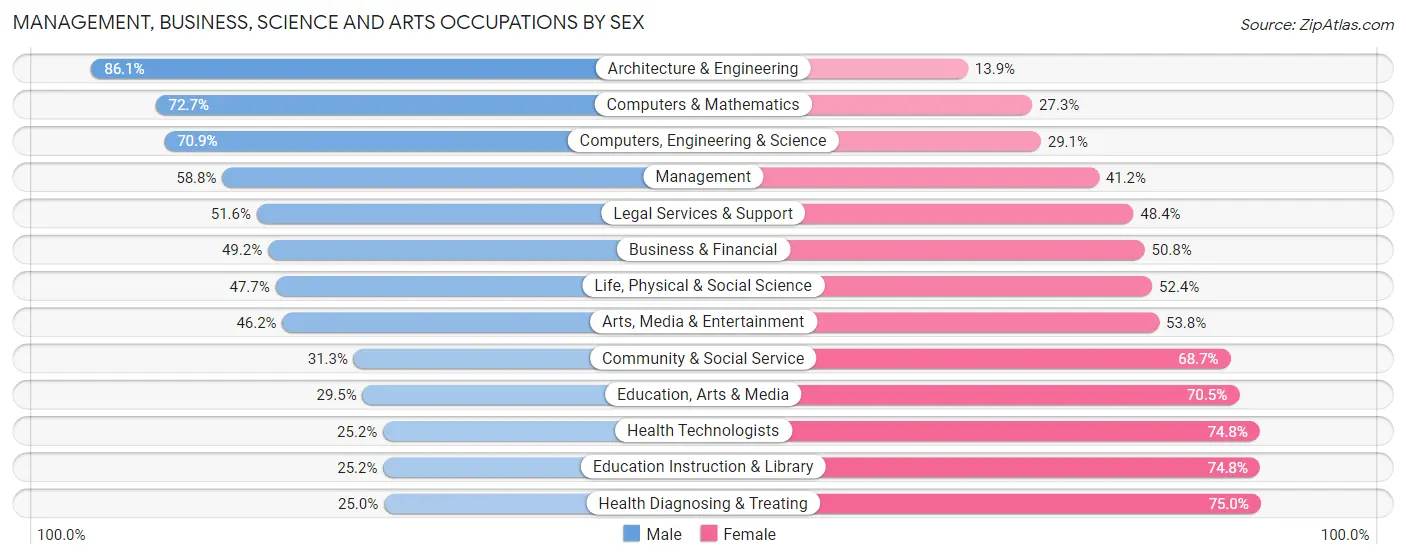
Management, Business, Science and Arts Occupations by Sex
Within the Management, Business, Science and Arts occupations in Area Code 609, the most male-oriented occupations are Architecture & Engineering (86.1%), Computers & Mathematics (72.7%), and Computers, Engineering & Science (70.9%), while the most female-oriented occupations are Health Diagnosing & Treating (75.0%), Education Instruction & Library (74.8%), and Health Technologists (74.8%).
| Occupation | Male | Female |
| Management | 43,803 (58.8%) | 30,746 (41.2%) |
| Business & Financial | 19,085 (49.2%) | 19,680 (50.8%) |
| Computers, Engineering & Science | 33,328 (70.9%) | 13,698 (29.1%) |
| Computers & Mathematics | 19,438 (72.7%) | 7,311 (27.3%) |
| Architecture & Engineering | 9,471 (86.1%) | 1,532 (13.9%) |
| Life, Physical & Social Science | 4,419 (47.6%) | 4,855 (52.3%) |
| Community & Social Service | 27,380 (31.3%) | 60,006 (68.7%) |
| Education, Arts & Media | 4,294 (29.5%) | 10,259 (70.5%) |
| Legal Services & Support | 4,414 (51.6%) | 4,147 (48.4%) |
| Education Instruction & Library | 13,198 (25.2%) | 39,227 (74.8%) |
| Arts, Media & Entertainment | 5,474 (46.2%) | 6,373 (53.8%) |
| Health Diagnosing & Treating | 10,926 (25.0%) | 32,762 (75.0%) |
| Health Technologists | 7,458 (25.2%) | 22,108 (74.8%) |
| Total (Category) | 134,522 (46.2%) | 156,892 (53.8%) |
| Total (Overall) | 360,261 (51.9%) | 334,391 (48.1%) |
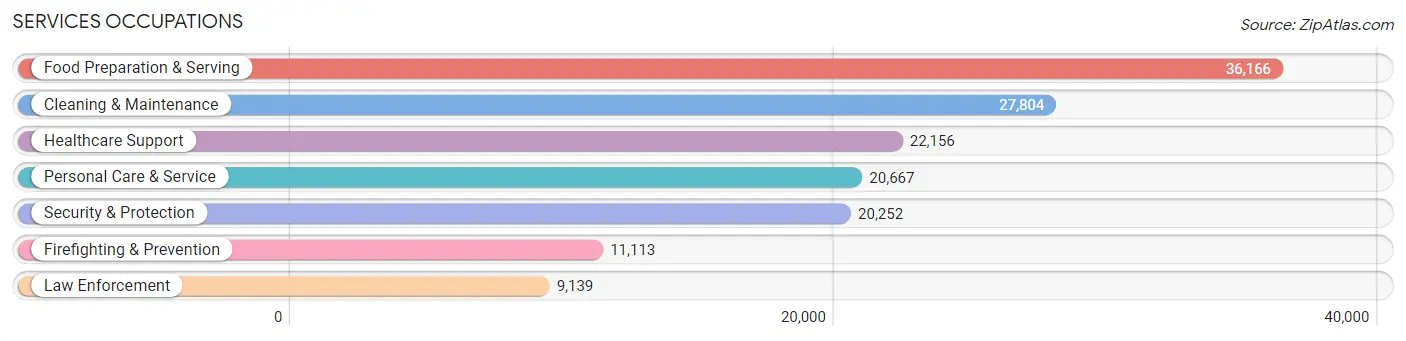
Services Occupations
The most common Services occupations in Area Code 609 are Food Preparation & Serving (36,166 | 5.2%), Cleaning & Maintenance (27,804 | 4.0%), Healthcare Support (22,156 | 3.2%), Personal Care & Service (20,667 | 3.0%), and Security & Protection (20,252 | 2.9%).
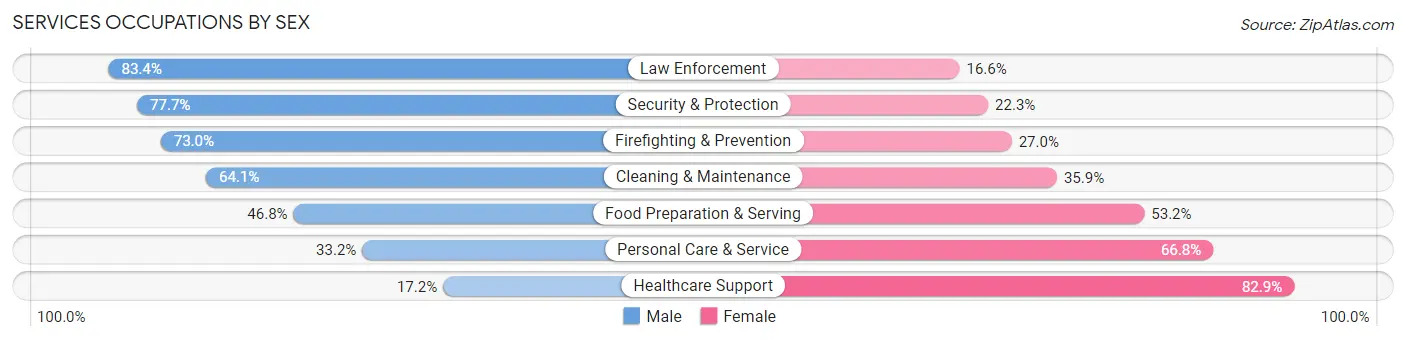
Services Occupations by Sex
Within the Services occupations in Area Code 609, the most male-oriented occupations are Law Enforcement (83.4%), Security & Protection (77.7%), and Firefighting & Prevention (73.0%), while the most female-oriented occupations are Healthcare Support (82.9%), Personal Care & Service (66.8%), and Food Preparation & Serving (53.2%).
| Occupation | Male | Female |
| Healthcare Support | 3,799 (17.2%) | 18,357 (82.9%) |
| Security & Protection | 15,735 (77.7%) | 4,517 (22.3%) |
| Firefighting & Prevention | 8,116 (73.0%) | 2,997 (27.0%) |
| Law Enforcement | 7,619 (83.4%) | 1,520 (16.6%) |
| Food Preparation & Serving | 16,916 (46.8%) | 19,250 (53.2%) |
| Cleaning & Maintenance | 17,815 (64.1%) | 9,989 (35.9%) |
| Personal Care & Service | 6,854 (33.2%) | 13,813 (66.8%) |
| Total (Category) | 61,119 (48.1%) | 65,926 (51.9%) |
| Total (Overall) | 360,261 (51.9%) | 334,391 (48.1%) |
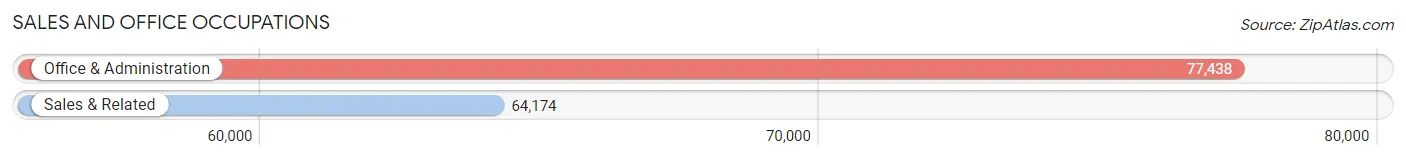
Sales and Office Occupations
The most common Sales and Office occupations in Area Code 609 are Office & Administration (77,438 | 11.2%), and Sales & Related (64,174 | 9.2%).
Sales and Office Occupations by Sex
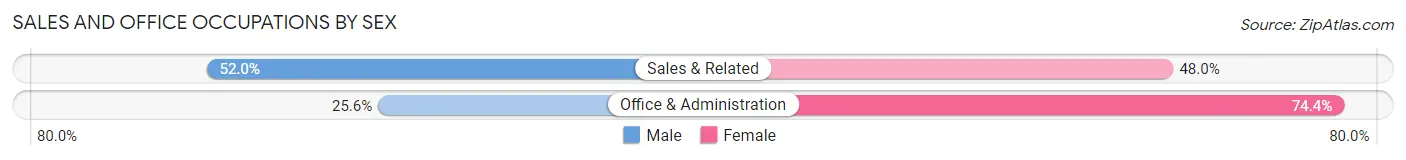
| Occupation | Male | Female |
| Sales & Related | 33,374 (52.0%) | 30,800 (48.0%) |
| Office & Administration | 19,850 (25.6%) | 57,588 (74.4%) |
| Total (Category) | 53,224 (37.6%) | 88,388 (62.4%) |
| Total (Overall) | 360,261 (51.9%) | 334,391 (48.1%) |
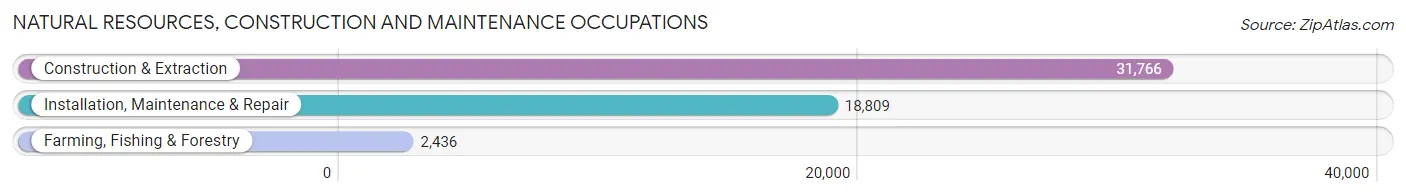
Natural Resources, Construction and Maintenance Occupations
The most common Natural Resources, Construction and Maintenance occupations in Area Code 609 are Construction & Extraction (31,766 | 4.6%), Installation, Maintenance & Repair (18,809 | 2.7%), and Farming, Fishing & Forestry (2,436 | 0.4%).
Natural Resources, Construction and Maintenance Occupations by Sex
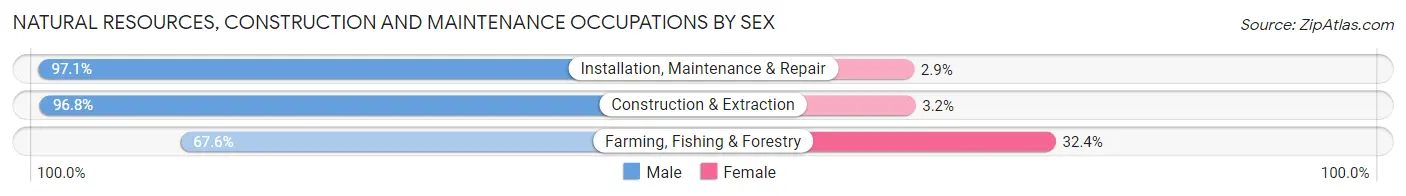
| Occupation | Male | Female |
| Farming, Fishing & Forestry | 1,647 (67.6%) | 789 (32.4%) |
| Construction & Extraction | 30,750 (96.8%) | 1,016 (3.2%) |
| Installation, Maintenance & Repair | 18,261 (97.1%) | 548 (2.9%) |
| Total (Category) | 50,658 (95.6%) | 2,353 (4.4%) |
| Total (Overall) | 360,261 (51.9%) | 334,391 (48.1%) |
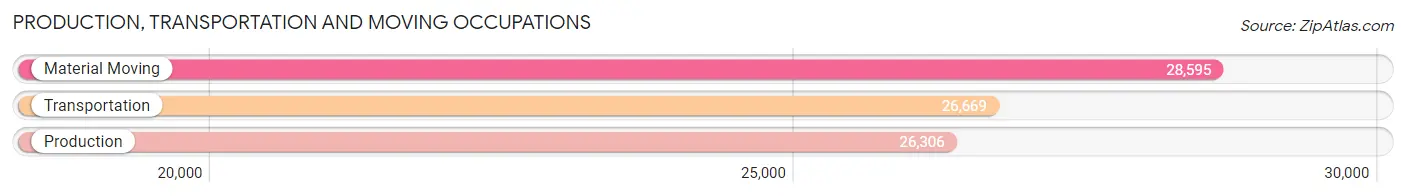
Production, Transportation and Moving Occupations
The most common Production, Transportation and Moving occupations in Area Code 609 are Material Moving (28,595 | 4.1%), Transportation (26,669 | 3.8%), and Production (26,306 | 3.8%).
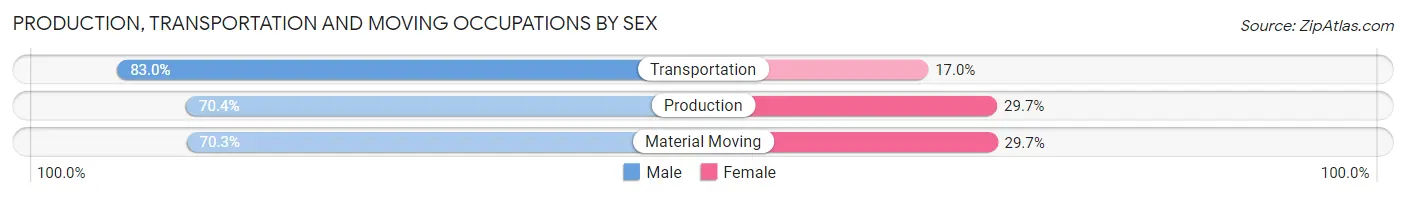
Production, Transportation and Moving Occupations by Sex
| Occupation | Male | Female |
| Production | 18,507 (70.4%) | 7,799 (29.6%) |
| Transportation | 22,136 (83.0%) | 4,533 (17.0%) |
| Material Moving | 20,095 (70.3%) | 8,500 (29.7%) |
| Total (Category) | 60,738 (74.5%) | 20,832 (25.5%) |
| Total (Overall) | 360,261 (51.9%) | 334,391 (48.1%) |
Employment Industries by Sex in Area Code 609
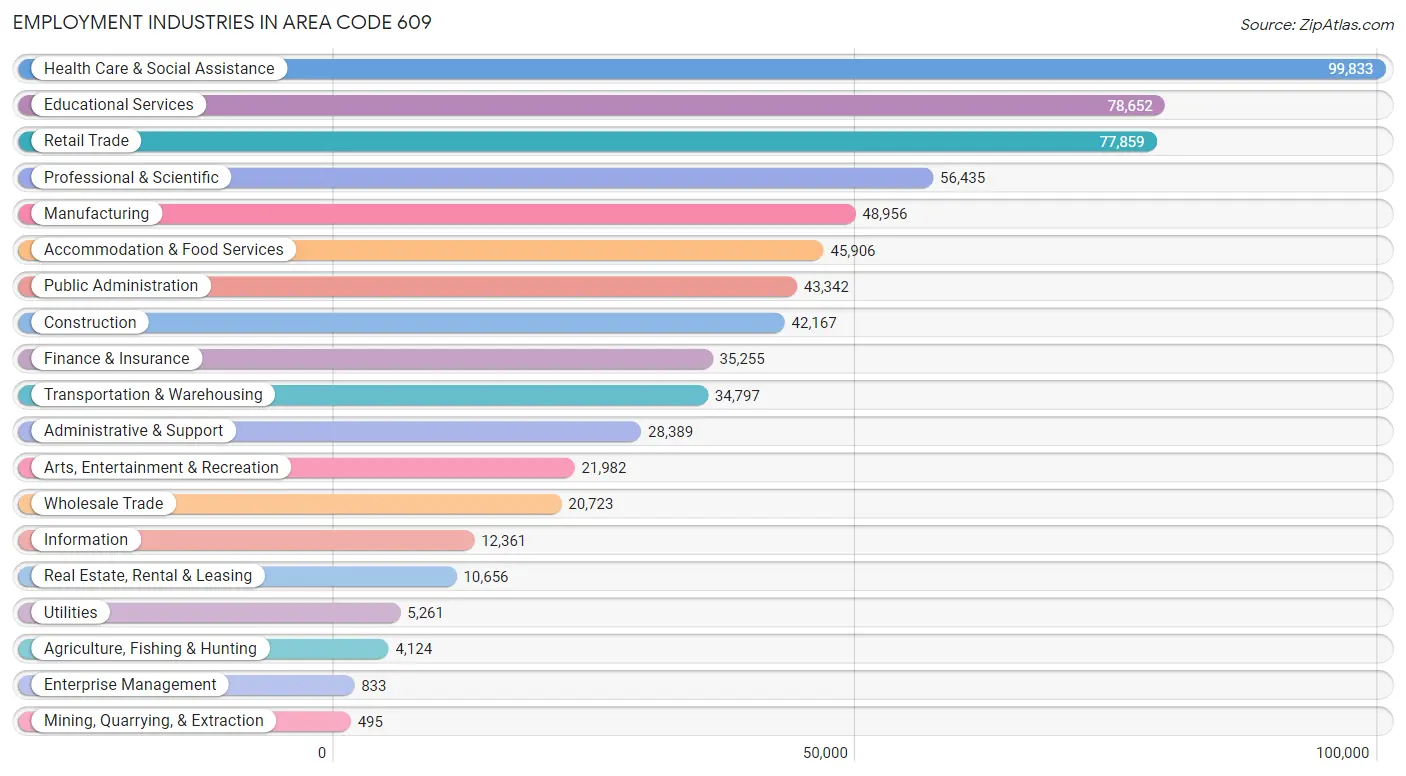
Employment Industries in Area Code 609
The major employment industries in Area Code 609 include Health Care & Social Assistance (99,833 | 14.4%), Educational Services (78,652 | 11.3%), Retail Trade (77,859 | 11.2%), Professional & Scientific (56,435 | 8.1%), and Manufacturing (48,956 | 7.0%).
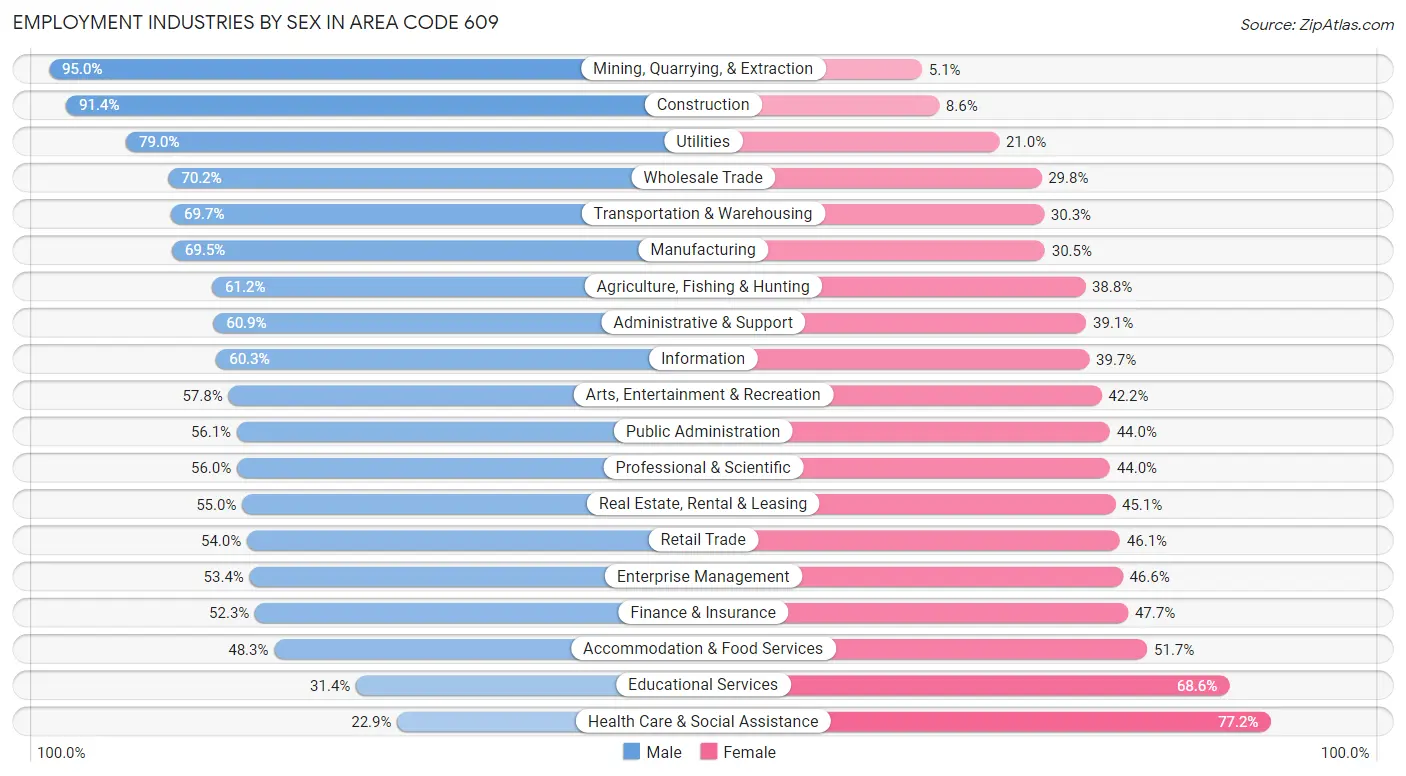
Employment Industries by Sex in Area Code 609
The Area Code 609 industries that see more men than women are Mining, Quarrying, & Extraction (95.0%), Construction (91.4%), and Utilities (79.0%), whereas the industries that tend to have a higher number of women are Health Care & Social Assistance (77.1%), Educational Services (68.6%), and Accommodation & Food Services (51.7%).
| Industry | Male | Female |
| Agriculture, Fishing & Hunting | 2,523 (61.2%) | 1,601 (38.8%) |
| Mining, Quarrying, & Extraction | 470 (95.0%) | 25 (5.1%) |
| Construction | 38,544 (91.4%) | 3,623 (8.6%) |
| Manufacturing | 34,024 (69.5%) | 14,932 (30.5%) |
| Wholesale Trade | 14,553 (70.2%) | 6,170 (29.8%) |
| Retail Trade | 42,006 (53.9%) | 35,853 (46.1%) |
| Transportation & Warehousing | 24,247 (69.7%) | 10,550 (30.3%) |
| Utilities | 4,155 (79.0%) | 1,106 (21.0%) |
| Information | 7,456 (60.3%) | 4,905 (39.7%) |
| Finance & Insurance | 18,432 (52.3%) | 16,823 (47.7%) |
| Real Estate, Rental & Leasing | 5,855 (54.9%) | 4,801 (45.1%) |
| Professional & Scientific | 31,614 (56.0%) | 24,821 (44.0%) |
| Enterprise Management | 445 (53.4%) | 388 (46.6%) |
| Administrative & Support | 17,301 (60.9%) | 11,088 (39.1%) |
| Educational Services | 24,670 (31.4%) | 53,982 (68.6%) |
| Health Care & Social Assistance | 22,815 (22.9%) | 77,018 (77.1%) |
| Arts, Entertainment & Recreation | 12,705 (57.8%) | 9,277 (42.2%) |
| Accommodation & Food Services | 22,180 (48.3%) | 23,726 (51.7%) |
| Public Administration | 24,294 (56.0%) | 19,048 (44.0%) |
| Total | 360,261 (51.9%) | 334,391 (48.1%) |
Education in Area Code 609
School Enrollment in Area Code 609
The most common levels of schooling among the 352,900 students in Area Code 609 are college / undergraduate (76,143 | 21.6%), high school (76,059 | 21.5%), and middle school (73,258 | 20.8%).
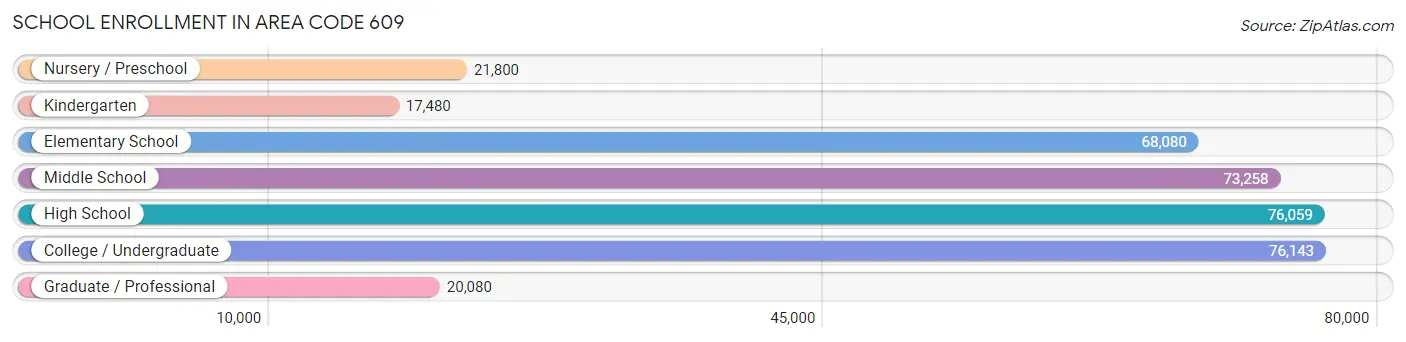
| School Level | # Students | % Students |
| Nursery / Preschool | 21,800 | 6.2% |
| Kindergarten | 17,480 | 5.0% |
| Elementary School | 68,080 | 19.3% |
| Middle School | 73,258 | 20.8% |
| High School | 76,059 | 21.5% |
| College / Undergraduate | 76,143 | 21.6% |
| Graduate / Professional | 20,080 | 5.7% |
| Total | 352,900 | 100.0% |
School Enrollment by Age by Funding Source in Area Code 609
Out of a total of 352,900 students who are enrolled in schools in Area Code 609, 61,505 (17.4%) attend a private institution, while the remaining 291,395 (82.6%) are enrolled in public schools. The age group of 35 years and over has the highest likelihood of being enrolled in private schools, with 6,265 (34.0% in the age bracket) enrolled. Conversely, the age group of 10 to 14 year olds has the lowest likelihood of being enrolled in a private school, with 83,838 (91.9% in the age bracket) attending a public institution.
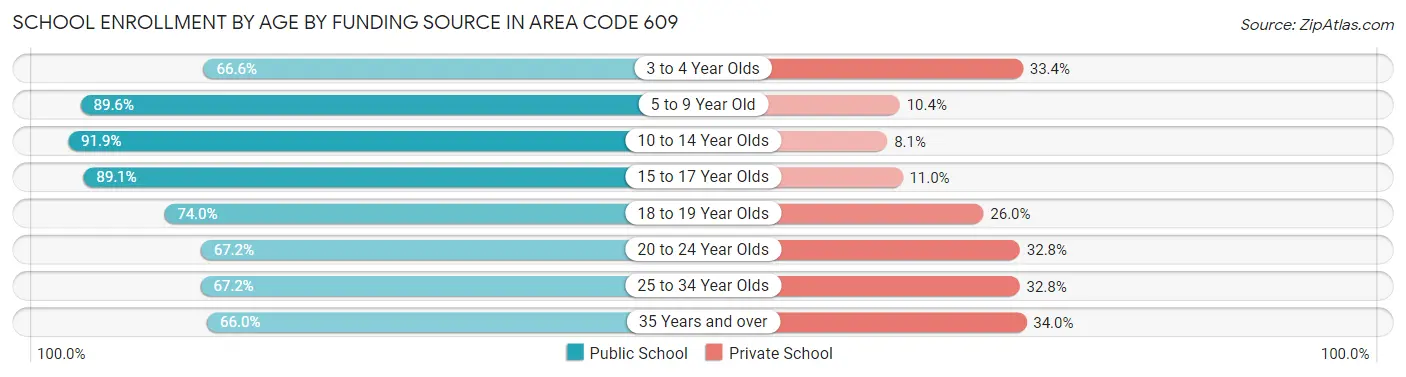
| Age Bracket | Public School | Private School |
| 3 to 4 Year Olds | 11,922 (66.6%) | 5,968 (33.4%) |
| 5 to 9 Year Old | 72,143 (89.6%) | 8,409 (10.4%) |
| 10 to 14 Year Olds | 83,838 (91.9%) | 7,397 (8.1%) |
| 15 to 17 Year Olds | 49,220 (89.0%) | 6,050 (11.0%) |
| 18 to 19 Year Olds | 21,410 (74.0%) | 7,531 (26.0%) |
| 20 to 24 Year Olds | 27,766 (67.2%) | 13,567 (32.8%) |
| 25 to 34 Year Olds | 12,947 (67.2%) | 6,309 (32.8%) |
| 35 Years and over | 12,158 (66.0%) | 6,265 (34.0%) |
| Total | 291,395 (82.6%) | 61,505 (17.4%) |
Educational Attainment by Field of Study in Area Code 609
Business (74,539 | 18.8%), education (48,445 | 12.2%), science & technology (35,589 | 9.0%), social sciences (32,647 | 8.3%), and engineering (28,675 | 7.2%) are the most common fields of study among 395,878 individuals in Area Code 609 who have obtained a bachelor's degree or higher.
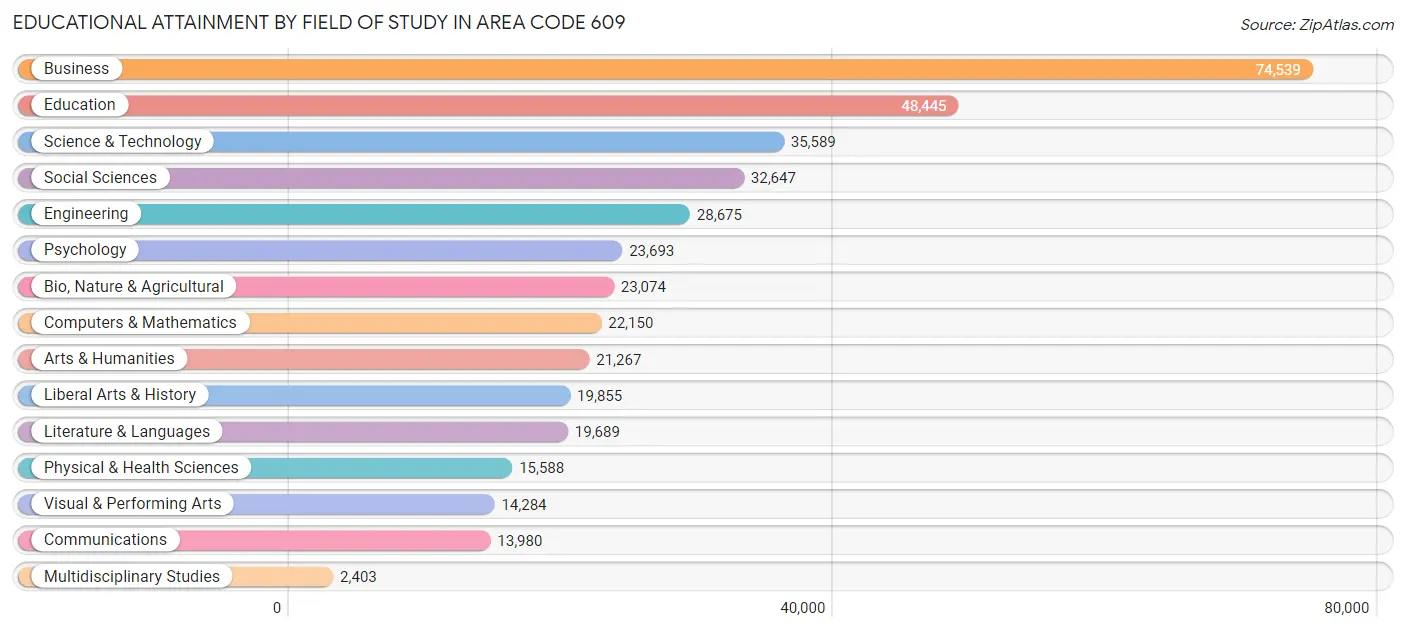
| Field of Study | # Graduates | % Graduates |
| Computers & Mathematics | 22,150 | 5.6% |
| Bio, Nature & Agricultural | 23,074 | 5.8% |
| Physical & Health Sciences | 15,588 | 3.9% |
| Psychology | 23,693 | 6.0% |
| Social Sciences | 32,647 | 8.3% |
| Engineering | 28,675 | 7.2% |
| Multidisciplinary Studies | 2,403 | 0.6% |
| Science & Technology | 35,589 | 9.0% |
| Business | 74,539 | 18.8% |
| Education | 48,445 | 12.2% |
| Literature & Languages | 19,689 | 5.0% |
| Liberal Arts & History | 19,855 | 5.0% |
| Visual & Performing Arts | 14,284 | 3.6% |
| Communications | 13,980 | 3.5% |
| Arts & Humanities | 21,267 | 5.4% |
| Total | 395,878 | 100.0% |
Transportation & Commute in Area Code 609
Vehicle Availability by Sex in Area Code 609
The most prevalent vehicle ownership categories in Area Code 609 are males with 2 vehicles (145,707, accounting for 41.2%) and females with 2 vehicles (128,813, making up 45.4%).
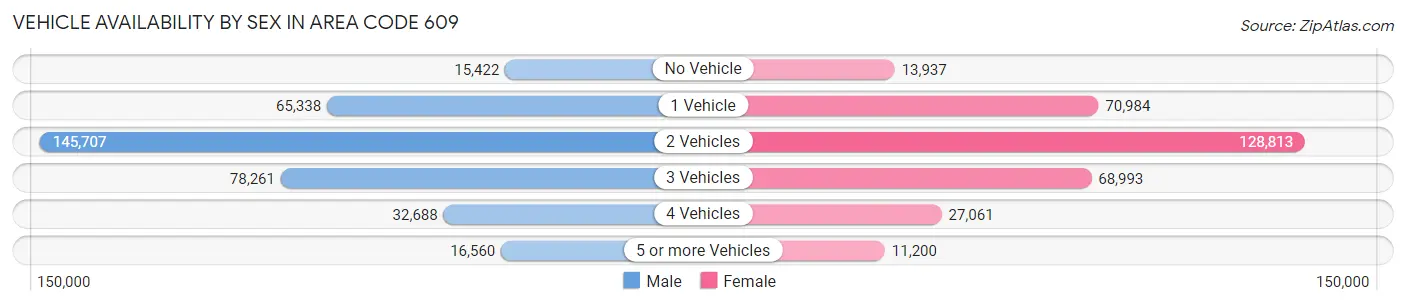
| Vehicles Available | Male | Female |
| No Vehicle | 15,422 (4.4%) | 13,937 (4.3%) |
| 1 Vehicle | 65,338 (18.5%) | 70,984 (22.1%) |
| 2 Vehicles | 145,707 (41.2%) | 128,813 (40.1%) |
| 3 Vehicles | 78,261 (22.1%) | 68,993 (21.5%) |
| 4 Vehicles | 32,688 (9.2%) | 27,061 (8.4%) |
| 5 or more Vehicles | 16,560 (4.7%) | 11,200 (3.5%) |
| Total | 353,976 (100.0%) | 320,988 (100.0%) |
Commute Time in Area Code 609
The most frequently occuring commute durations in Area Code 609 are 15 to 19 minutes (95,264 commuters, 15.8%), 20 to 24 minutes (86,538 commuters, 14.3%), and 10 to 14 minutes (81,266 commuters, 13.5%).
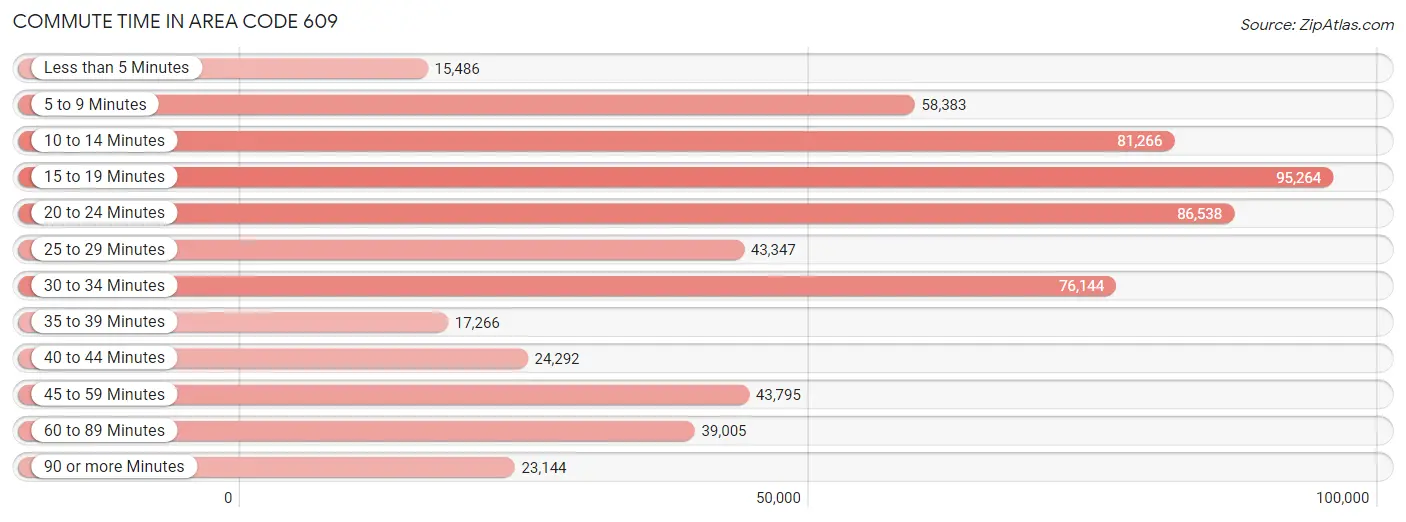
| Commute Time | # Commuters | % Commuters |
| Less than 5 Minutes | 15,486 | 2.6% |
| 5 to 9 Minutes | 58,383 | 9.7% |
| 10 to 14 Minutes | 81,266 | 13.5% |
| 15 to 19 Minutes | 95,264 | 15.8% |
| 20 to 24 Minutes | 86,538 | 14.3% |
| 25 to 29 Minutes | 43,347 | 7.2% |
| 30 to 34 Minutes | 76,144 | 12.6% |
| 35 to 39 Minutes | 17,266 | 2.9% |
| 40 to 44 Minutes | 24,292 | 4.0% |
| 45 to 59 Minutes | 43,795 | 7.2% |
| 60 to 89 Minutes | 39,005 | 6.5% |
| 90 or more Minutes | 23,144 | 3.8% |
Commute Time by Sex in Area Code 609
The most common commute times in Area Code 609 are 15 to 19 minutes (48,304 commuters, 15.1%) for males and 15 to 19 minutes (46,960 commuters, 16.5%) for females.
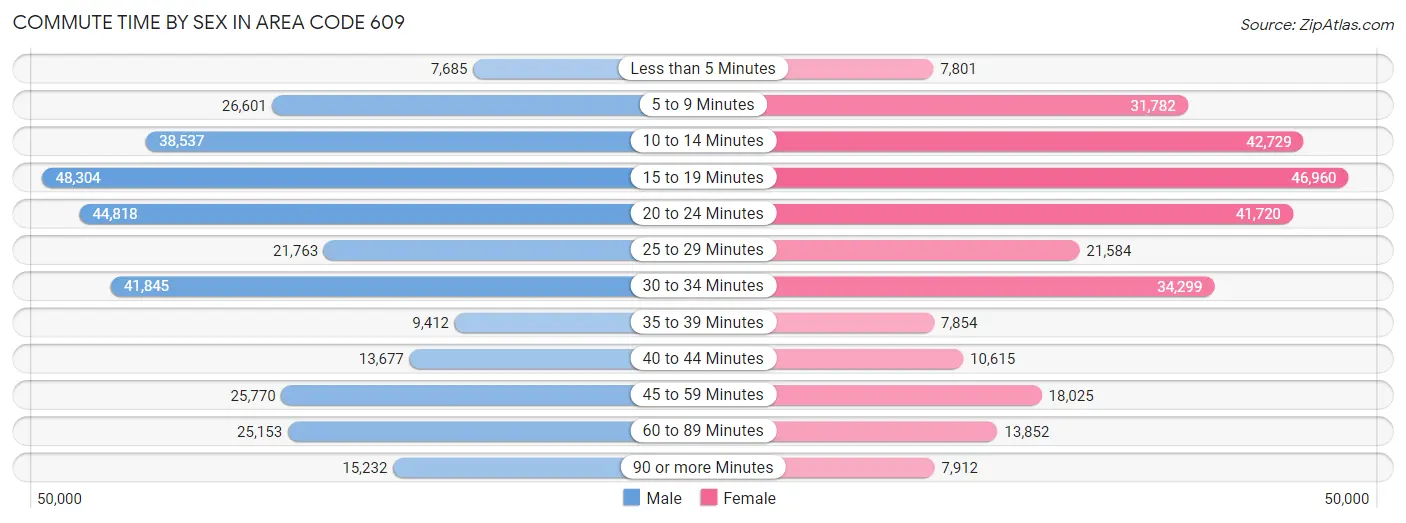
| Commute Time | Male | Female |
| Less than 5 Minutes | 7,685 (2.4%) | 7,801 (2.7%) |
| 5 to 9 Minutes | 26,601 (8.3%) | 31,782 (11.2%) |
| 10 to 14 Minutes | 38,537 (12.1%) | 42,729 (15.0%) |
| 15 to 19 Minutes | 48,304 (15.1%) | 46,960 (16.5%) |
| 20 to 24 Minutes | 44,818 (14.1%) | 41,720 (14.6%) |
| 25 to 29 Minutes | 21,763 (6.8%) | 21,584 (7.6%) |
| 30 to 34 Minutes | 41,845 (13.1%) | 34,299 (12.0%) |
| 35 to 39 Minutes | 9,412 (2.9%) | 7,854 (2.8%) |
| 40 to 44 Minutes | 13,677 (4.3%) | 10,615 (3.7%) |
| 45 to 59 Minutes | 25,770 (8.1%) | 18,025 (6.3%) |
| 60 to 89 Minutes | 25,153 (7.9%) | 13,852 (4.9%) |
| 90 or more Minutes | 15,232 (4.8%) | 7,912 (2.8%) |
Time of Departure to Work by Sex in Area Code 609
The most frequent times of departure to work in Area Code 609 are 7:00 AM to 7:29 AM (44,264, 13.9%) for males and 8:00 AM to 8:29 AM (44,350, 15.5%) for females.
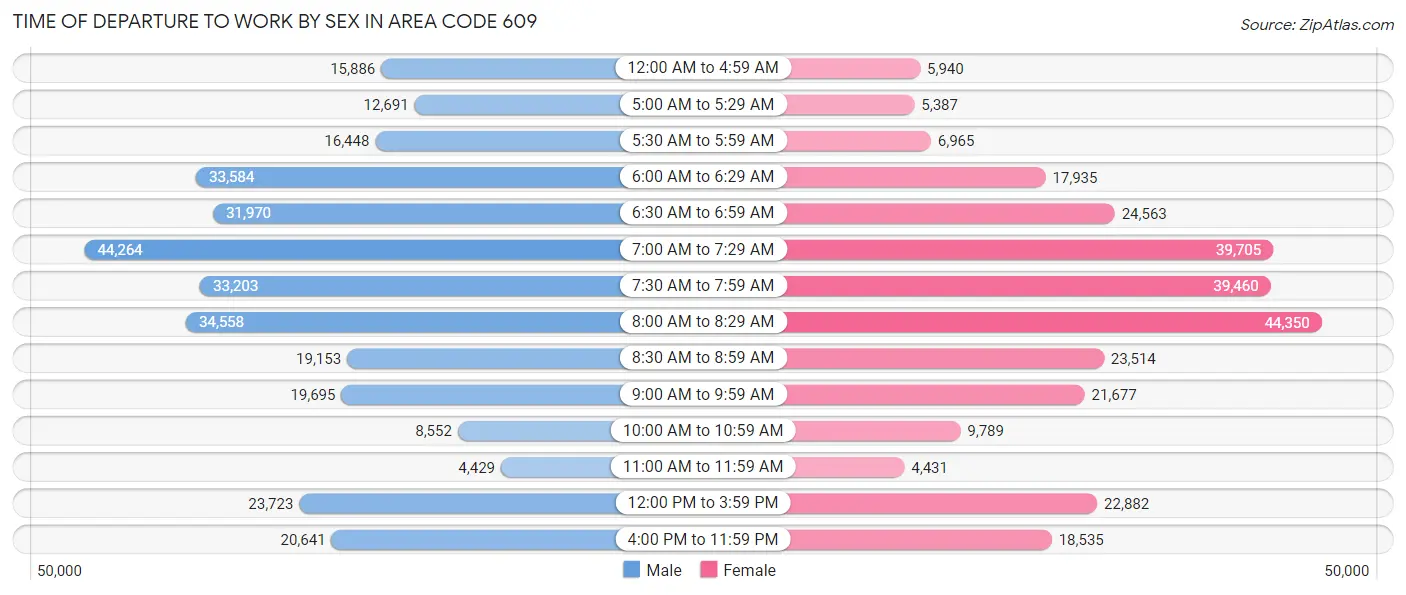
| Time of Departure | Male | Female |
| 12:00 AM to 4:59 AM | 15,886 (5.0%) | 5,940 (2.1%) |
| 5:00 AM to 5:29 AM | 12,691 (4.0%) | 5,387 (1.9%) |
| 5:30 AM to 5:59 AM | 16,448 (5.2%) | 6,965 (2.4%) |
| 6:00 AM to 6:29 AM | 33,584 (10.5%) | 17,935 (6.3%) |
| 6:30 AM to 6:59 AM | 31,970 (10.0%) | 24,563 (8.6%) |
| 7:00 AM to 7:29 AM | 44,264 (13.9%) | 39,705 (13.9%) |
| 7:30 AM to 7:59 AM | 33,203 (10.4%) | 39,460 (13.8%) |
| 8:00 AM to 8:29 AM | 34,558 (10.8%) | 44,350 (15.5%) |
| 8:30 AM to 8:59 AM | 19,153 (6.0%) | 23,514 (8.3%) |
| 9:00 AM to 9:59 AM | 19,695 (6.2%) | 21,677 (7.6%) |
| 10:00 AM to 10:59 AM | 8,552 (2.7%) | 9,789 (3.4%) |
| 11:00 AM to 11:59 AM | 4,429 (1.4%) | 4,431 (1.5%) |
| 12:00 PM to 3:59 PM | 23,723 (7.4%) | 22,882 (8.0%) |
| 4:00 PM to 11:59 PM | 20,641 (6.5%) | 18,535 (6.5%) |
| Total | 318,797 (100.0%) | 285,133 (100.0%) |
Housing Occupancy in Area Code 609
Occupancy by Ownership in Area Code 609
Of the total 554,685 dwellings in Area Code 609, owner-occupied units account for 381,967 (68.9%), while renter-occupied units make up 172,718 (31.1%).
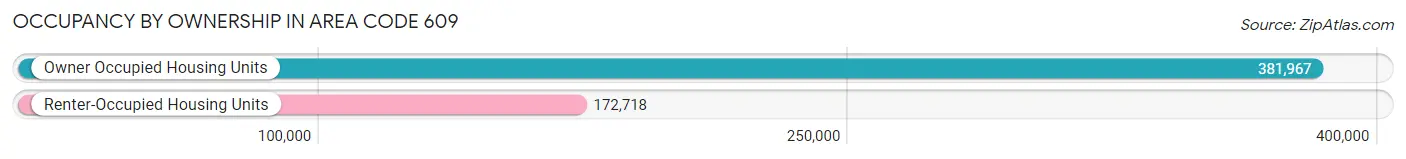
| Occupancy | # Housing Units | % Housing Units |
| Owner Occupied Housing Units | 381,967 | 68.9% |
| Renter-Occupied Housing Units | 172,718 | 31.1% |
| Total Occupied Housing Units | 554,685 | 100.0% |
Occupancy by Household Size in Area Code 609
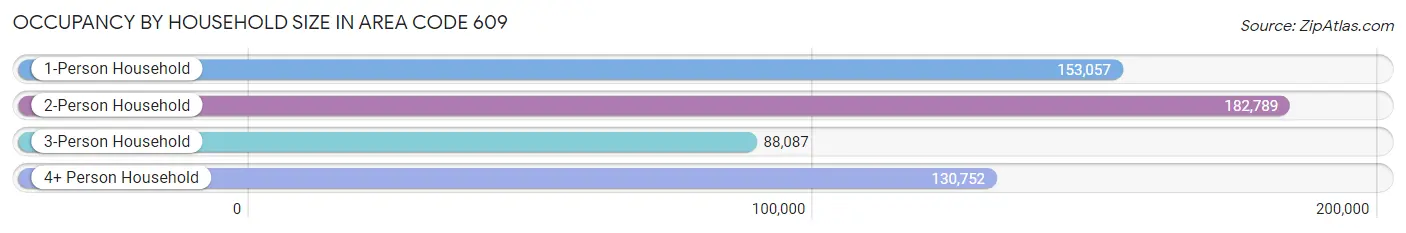
| Household Size | # Housing Units | % Housing Units |
| 1-Person Household | 153,057 | 27.6% |
| 2-Person Household | 182,789 | 33.0% |
| 3-Person Household | 88,087 | 15.9% |
| 4+ Person Household | 130,752 | 23.6% |
| Total Housing Units | 554,685 | 100.0% |
Occupancy by Ownership by Household Size in Area Code 609
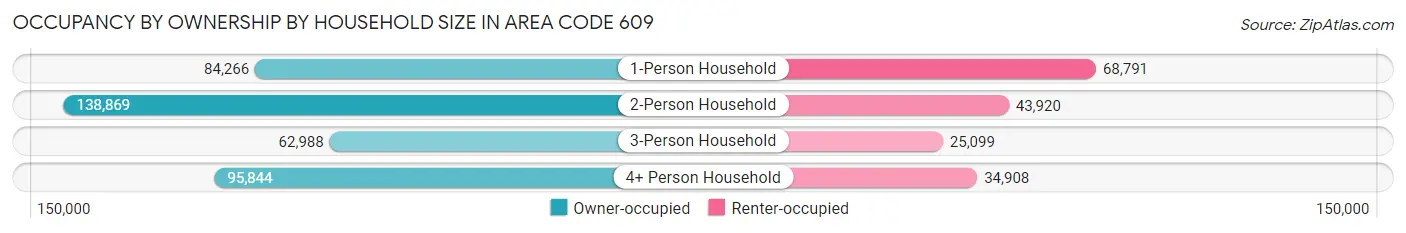
| Household Size | Owner-occupied | Renter-occupied |
| 1-Person Household | 84,266 (55.1%) | 68,791 (44.9%) |
| 2-Person Household | 138,869 (76.0%) | 43,920 (24.0%) |
| 3-Person Household | 62,988 (71.5%) | 25,099 (28.5%) |
| 4+ Person Household | 95,844 (73.3%) | 34,908 (26.7%) |
| Total Housing Units | 381,967 (68.9%) | 172,718 (31.1%) |
Occupancy by Educational Attainment in Area Code 609
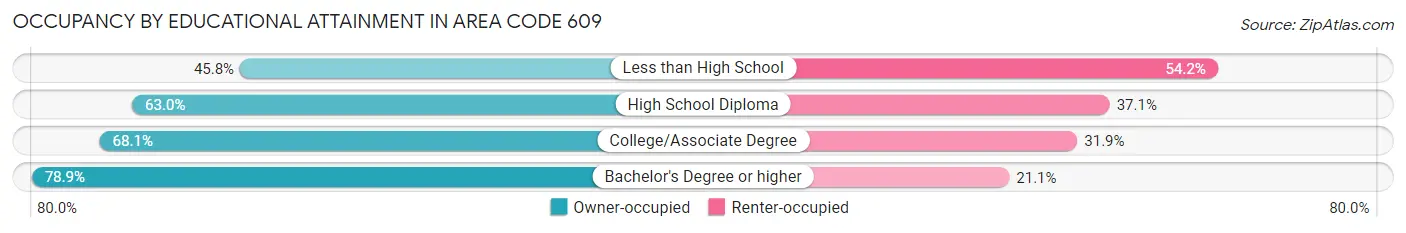
| Household Size | Owner-occupied | Renter-occupied |
| Less than High School | 23,100 (45.8%) | 27,291 (54.2%) |
| High School Diploma | 92,442 (62.9%) | 54,416 (37.0%) |
| College/Associate Degree | 97,828 (68.1%) | 45,855 (31.9%) |
| Bachelor's Degree or higher | 168,597 (78.9%) | 45,156 (21.1%) |
Occupancy by Age of Householder in Area Code 609
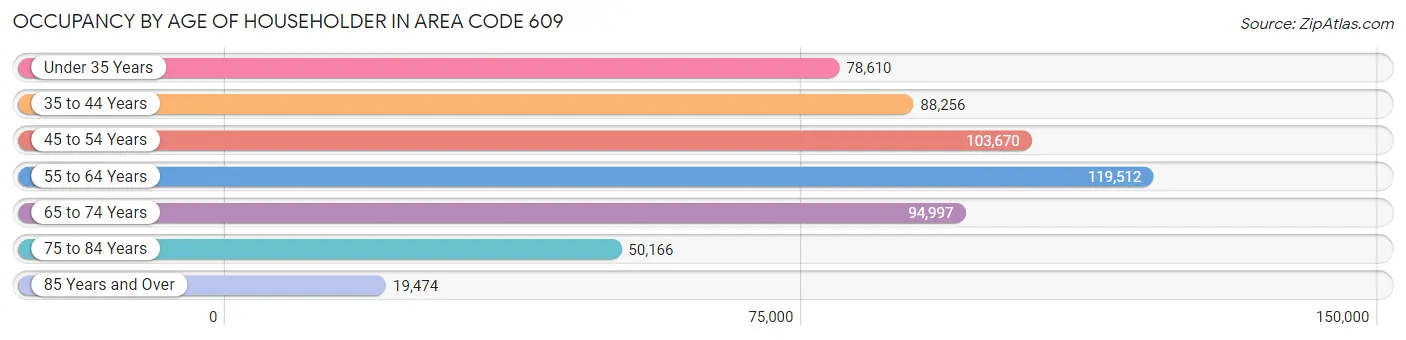
| Age Bracket | # Households | % Households |
| Under 35 Years | 78,610 | 14.2% |
| 35 to 44 Years | 88,256 | 15.9% |
| 45 to 54 Years | 103,670 | 18.7% |
| 55 to 64 Years | 119,512 | 21.5% |
| 65 to 74 Years | 94,997 | 17.1% |
| 75 to 84 Years | 50,166 | 9.0% |
| 85 Years and Over | 19,474 | 3.5% |
| Total | 554,685 | 100.0% |
Housing Finances in Area Code 609
Median Income by Occupancy in Area Code 609
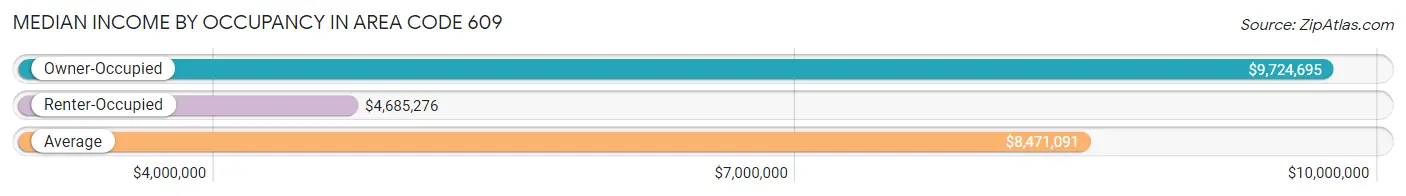
| Occupancy Type | # Households | Median Income |
| Owner-Occupied | 381,967 (68.9%) | $9,724,695 |
| Renter-Occupied | 172,718 (31.1%) | $4,685,276 |
| Average | 554,685 (100.0%) | $8,471,091 |
Occupancy by Householder Income Bracket in Area Code 609
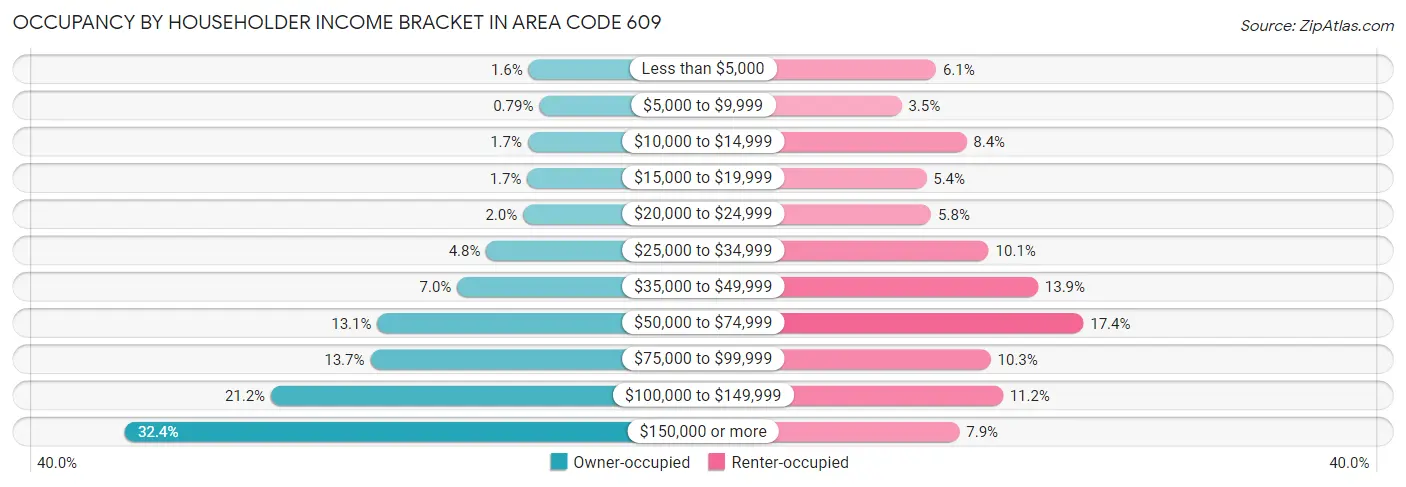
| Income Bracket | Owner-occupied | Renter-occupied |
| Less than $5,000 | 6,098 (1.6%) | 10,581 (6.1%) |
| $5,000 to $9,999 | 3,023 (0.8%) | 6,053 (3.5%) |
| $10,000 to $14,999 | 6,341 (1.7%) | 14,572 (8.4%) |
| $15,000 to $19,999 | 6,504 (1.7%) | 9,303 (5.4%) |
| $20,000 to $24,999 | 7,721 (2.0%) | 9,956 (5.8%) |
| $25,000 to $34,999 | 18,393 (4.8%) | 17,507 (10.1%) |
| $35,000 to $49,999 | 26,899 (7.0%) | 23,988 (13.9%) |
| $50,000 to $74,999 | 50,147 (13.1%) | 29,970 (17.3%) |
| $75,000 to $99,999 | 52,175 (13.7%) | 17,778 (10.3%) |
| $100,000 to $149,999 | 81,092 (21.2%) | 19,356 (11.2%) |
| $150,000 or more | 123,574 (32.4%) | 13,654 (7.9%) |
| Total | 381,967 (100.0%) | 172,718 (100.0%) |
Monthly Housing Cost Tiers in Area Code 609
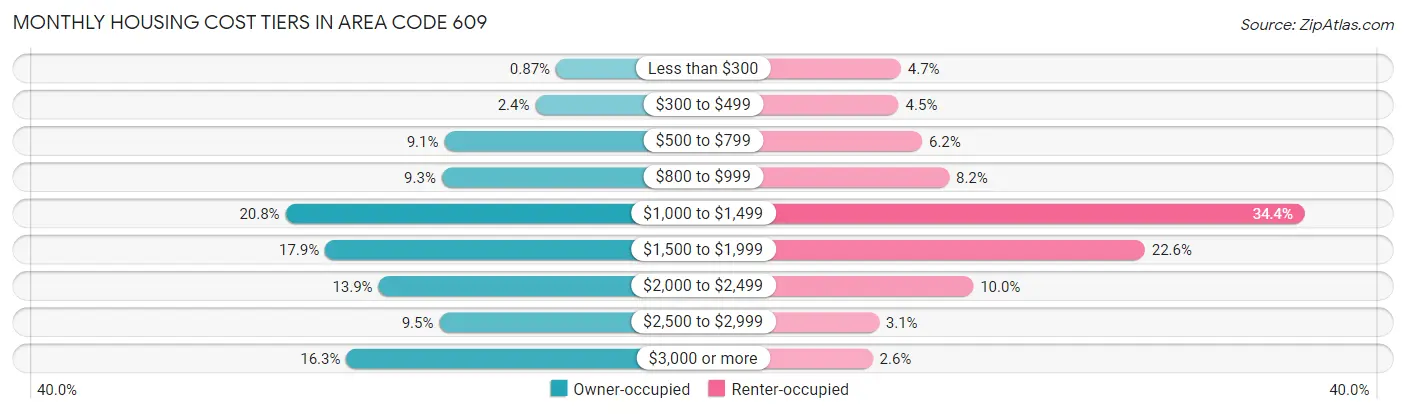
| Monthly Cost | Owner-occupied | Renter-occupied |
| Less than $300 | 3,332 (0.9%) | 8,059 (4.7%) |
| $300 to $499 | 9,117 (2.4%) | 7,794 (4.5%) |
| $500 to $799 | 34,702 (9.1%) | 10,758 (6.2%) |
| $800 to $999 | 35,445 (9.3%) | 14,189 (8.2%) |
| $1,000 to $1,499 | 79,428 (20.8%) | 59,455 (34.4%) |
| $1,500 to $1,999 | 68,272 (17.9%) | 39,100 (22.6%) |
| $2,000 to $2,499 | 53,236 (13.9%) | 17,264 (10.0%) |
| $2,500 to $2,999 | 36,126 (9.5%) | 5,263 (3.0%) |
| $3,000 or more | 62,309 (16.3%) | 4,479 (2.6%) |
| Total | 381,967 (100.0%) | 172,718 (100.0%) |
Physical Housing Characteristics in Area Code 609
Housing Structures in Area Code 609
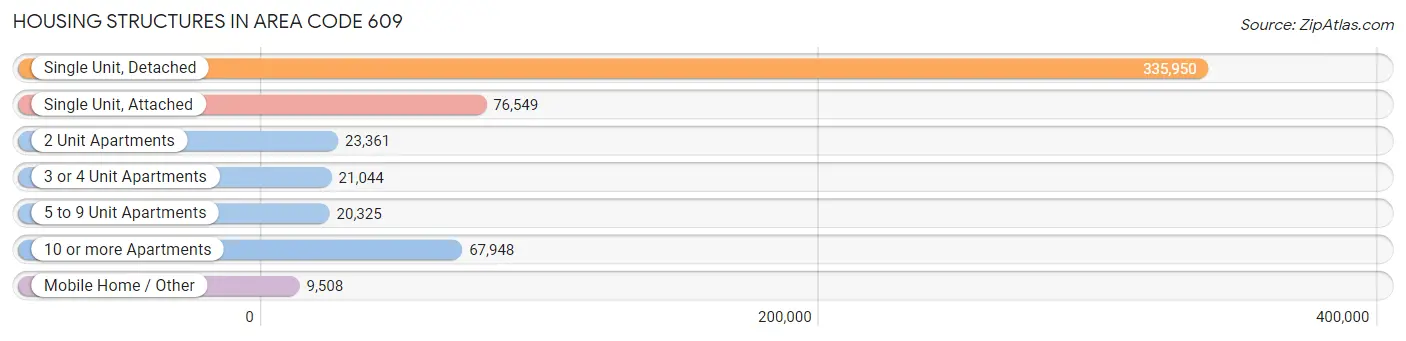
| Structure Type | # Housing Units | % Housing Units |
| Single Unit, Detached | 335,950 | 60.6% |
| Single Unit, Attached | 76,549 | 13.8% |
| 2 Unit Apartments | 23,361 | 4.2% |
| 3 or 4 Unit Apartments | 21,044 | 3.8% |
| 5 to 9 Unit Apartments | 20,325 | 3.7% |
| 10 or more Apartments | 67,948 | 12.2% |
| Mobile Home / Other | 9,508 | 1.7% |
| Total | 554,685 | 100.0% |
Housing Structures by Occupancy in Area Code 609
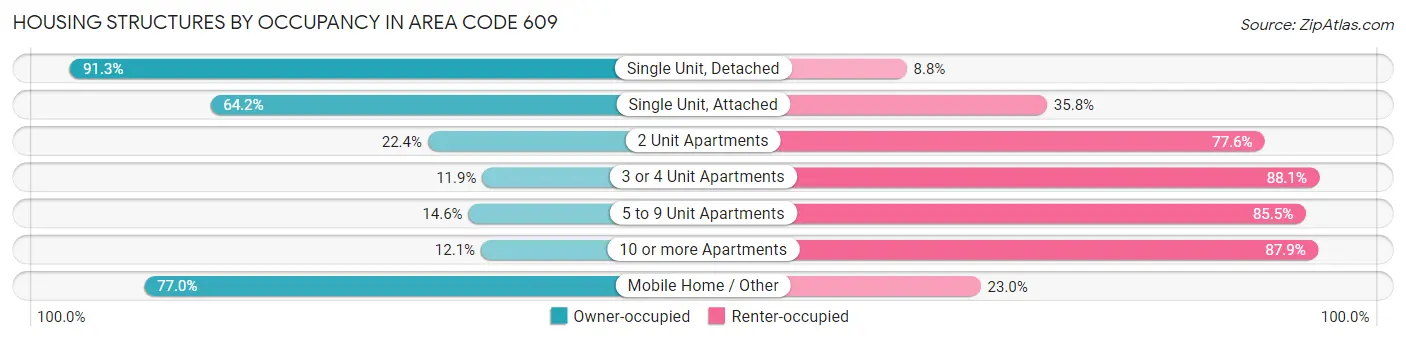
| Structure Type | Owner-occupied | Renter-occupied |
| Single Unit, Detached | 306,541 (91.2%) | 29,409 (8.7%) |
| Single Unit, Attached | 49,174 (64.2%) | 27,375 (35.8%) |
| 2 Unit Apartments | 5,225 (22.4%) | 18,136 (77.6%) |
| 3 or 4 Unit Apartments | 2,503 (11.9%) | 18,541 (88.1%) |
| 5 to 9 Unit Apartments | 2,957 (14.5%) | 17,368 (85.5%) |
| 10 or more Apartments | 8,246 (12.1%) | 59,702 (87.9%) |
| Mobile Home / Other | 7,321 (77.0%) | 2,187 (23.0%) |
| Total | 381,967 (68.9%) | 172,718 (31.1%) |
Housing Structures by Number of Rooms in Area Code 609
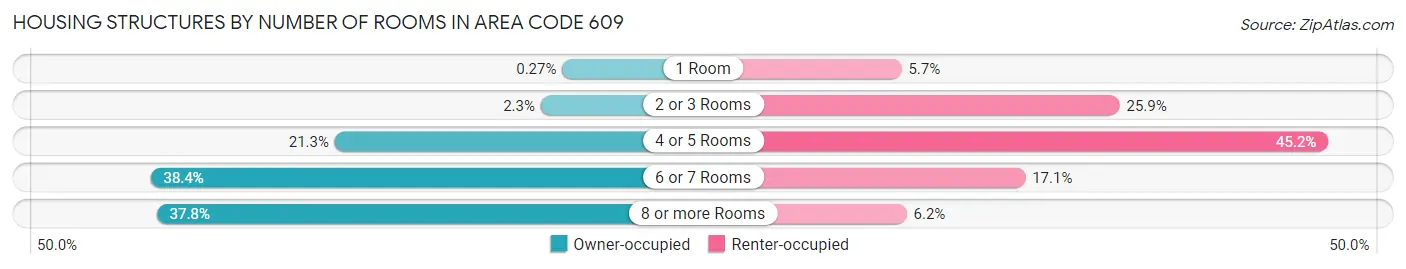
| Number of Rooms | Owner-occupied | Renter-occupied |
| 1 Room | 1,046 (0.3%) | 9,827 (5.7%) |
| 2 or 3 Rooms | 8,634 (2.3%) | 44,664 (25.9%) |
| 4 or 5 Rooms | 81,410 (21.3%) | 77,977 (45.2%) |
| 6 or 7 Rooms | 146,538 (38.4%) | 29,598 (17.1%) |
| 8 or more Rooms | 144,339 (37.8%) | 10,652 (6.2%) |
| Total | 381,967 (100.0%) | 172,718 (100.0%) |
Housing Structure by Heating Type in Area Code 609
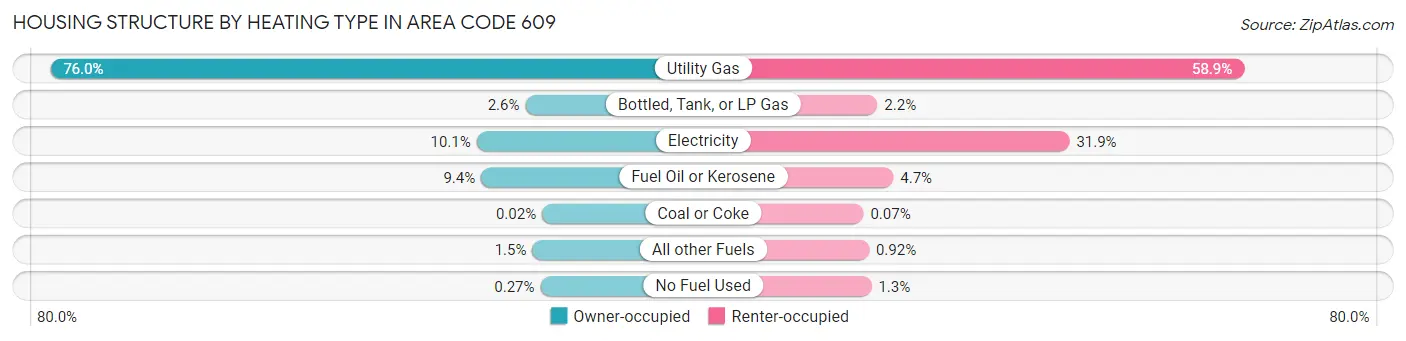
| Heating Type | Owner-occupied | Renter-occupied |
| Utility Gas | 290,433 (76.0%) | 101,716 (58.9%) |
| Bottled, Tank, or LP Gas | 9,943 (2.6%) | 3,840 (2.2%) |
| Electricity | 38,685 (10.1%) | 55,121 (31.9%) |
| Fuel Oil or Kerosene | 36,044 (9.4%) | 8,089 (4.7%) |
| Coal or Coke | 89 (0.0%) | 122 (0.1%) |
| All other Fuels | 5,753 (1.5%) | 1,585 (0.9%) |
| No Fuel Used | 1,020 (0.3%) | 2,245 (1.3%) |
| Total | 381,967 (100.0%) | 172,718 (100.0%) |
Household Vehicle Usage in Area Code 609
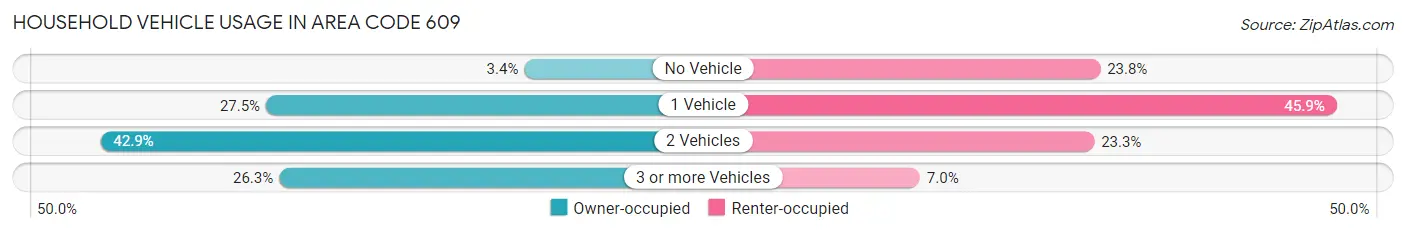
| Vehicles per Household | Owner-occupied | Renter-occupied |
| No Vehicle | 12,844 (3.4%) | 41,153 (23.8%) |
| 1 Vehicle | 104,913 (27.5%) | 79,278 (45.9%) |
| 2 Vehicles | 163,928 (42.9%) | 40,190 (23.3%) |
| 3 or more Vehicles | 100,282 (26.3%) | 12,097 (7.0%) |
| Total | 381,967 (100.0%) | 172,718 (100.0%) |
Real Estate & Mortgages in Area Code 609
Real Estate and Mortgage Overview in Area Code 609
| Characteristic | Without Mortgage | With Mortgage |
| Housing Units | 142,577 | 239,390 |
| Median Property Value | $31,580,100 | $33,834,200 |
| Median Household Income | $7,476,183 | $90,573 |
| Monthly Housing Costs | $87,300 | $60,178 |
| Real Estate Taxes | $572,227 | $4,848 |
Property Value by Mortgage Status in Area Code 609
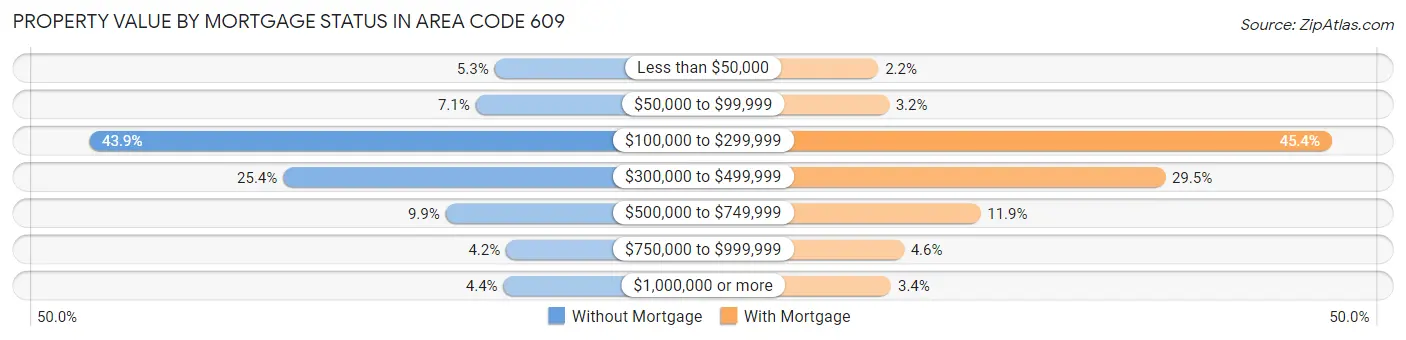
| Property Value | Without Mortgage | With Mortgage |
| Less than $50,000 | 7,488 (5.2%) | 5,162 (2.2%) |
| $50,000 to $99,999 | 10,056 (7.0%) | 7,570 (3.2%) |
| $100,000 to $299,999 | 62,534 (43.9%) | 108,568 (45.4%) |
| $300,000 to $499,999 | 36,186 (25.4%) | 70,551 (29.5%) |
| $500,000 to $749,999 | 14,127 (9.9%) | 28,447 (11.9%) |
| $750,000 to $999,999 | 5,919 (4.2%) | 10,997 (4.6%) |
| $1,000,000 or more | 6,267 (4.4%) | 8,095 (3.4%) |
| Total | 142,577 (100.0%) | 239,390 (100.0%) |
Household Income by Mortgage Status in Area Code 609
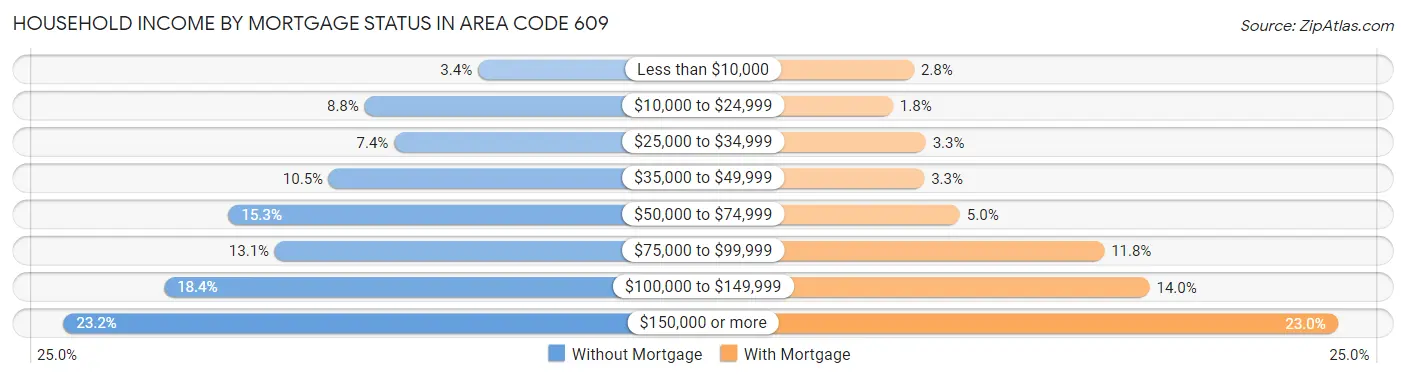
| Household Income | Without Mortgage | With Mortgage |
| Less than $10,000 | 4,860 (3.4%) | 6,664 (2.8%) |
| $10,000 to $24,999 | 12,559 (8.8%) | 4,261 (1.8%) |
| $25,000 to $34,999 | 10,556 (7.4%) | 8,007 (3.3%) |
| $35,000 to $49,999 | 14,991 (10.5%) | 7,837 (3.3%) |
| $50,000 to $74,999 | 21,799 (15.3%) | 11,908 (5.0%) |
| $75,000 to $99,999 | 18,650 (13.1%) | 28,348 (11.8%) |
| $100,000 to $149,999 | 26,161 (18.3%) | 33,525 (14.0%) |
| $150,000 or more | 33,001 (23.2%) | 54,931 (23.0%) |
| Total | 142,577 (100.0%) | 239,390 (100.0%) |
Property Value to Household Income Ratio in Area Code 609
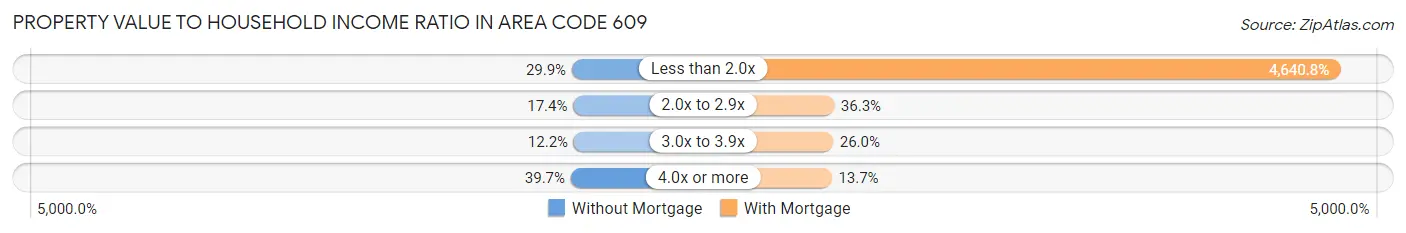
| Value-to-Income Ratio | Without Mortgage | With Mortgage |
| Less than 2.0x | 42,557 (29.8%) | 11,109,608 (4,640.8%) |
| 2.0x to 2.9x | 24,806 (17.4%) | 86,856 (36.3%) |
| 3.0x to 3.9x | 17,372 (12.2%) | 62,221 (26.0%) |
| 4.0x or more | 56,616 (39.7%) | 32,720 (13.7%) |
| Total | 142,577 (100.0%) | 239,390 (100.0%) |
Real Estate Taxes by Mortgage Status in Area Code 609
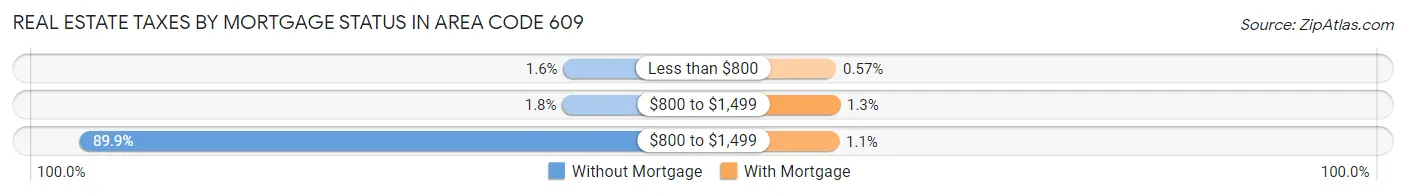
| Property Taxes | Without Mortgage | With Mortgage |
| Less than $800 | 2,261 (1.6%) | 1,374 (0.6%) |
| $800 to $1,499 | 2,534 (1.8%) | 3,061 (1.3%) |
| $800 to $1,499 | 128,139 (89.9%) | 2,628 (1.1%) |
| Total | 142,577 (100.0%) | 239,390 (100.0%) |
Health & Disability in Area Code 609
Health Insurance Coverage by Age in Area Code 609
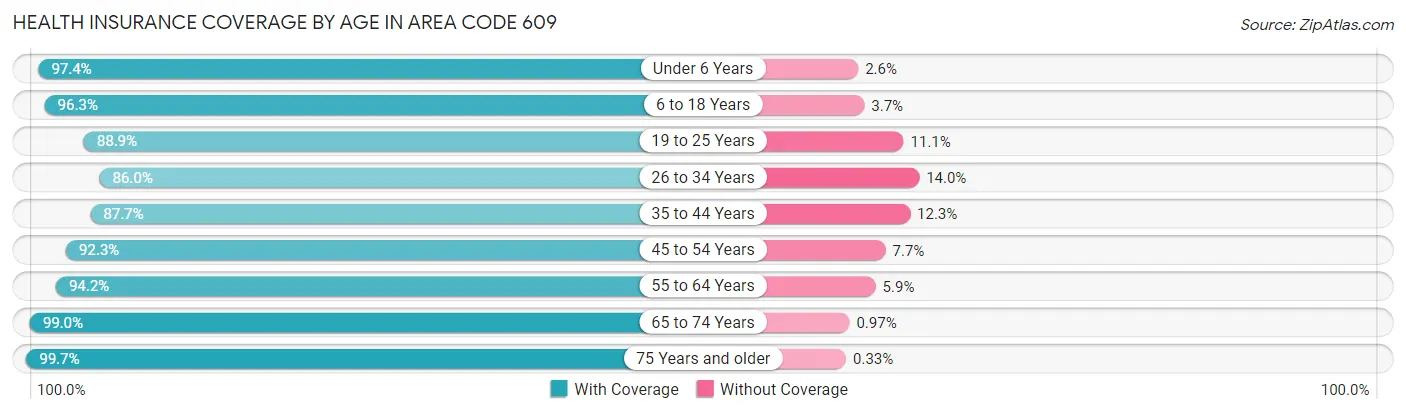
| Age Bracket | With Coverage | Without Coverage |
| Under 6 Years | 91,381 (97.4%) | 2,433 (2.6%) |
| 6 to 18 Years | 228,202 (96.3%) | 8,869 (3.7%) |
| 19 to 25 Years | 112,925 (88.9%) | 14,036 (11.1%) |
| 26 to 34 Years | 133,933 (86.0%) | 21,745 (14.0%) |
| 35 to 44 Years | 152,041 (87.7%) | 21,270 (12.3%) |
| 45 to 54 Years | 175,028 (92.3%) | 14,627 (7.7%) |
| 55 to 64 Years | 193,297 (94.2%) | 12,019 (5.9%) |
| 65 to 74 Years | 149,877 (99.0%) | 1,463 (1.0%) |
| 75 Years and older | 104,684 (99.7%) | 348 (0.3%) |
| Total | 1,341,368 (93.3%) | 96,810 (6.7%) |
Health Insurance Coverage by Citizenship Status in Area Code 609
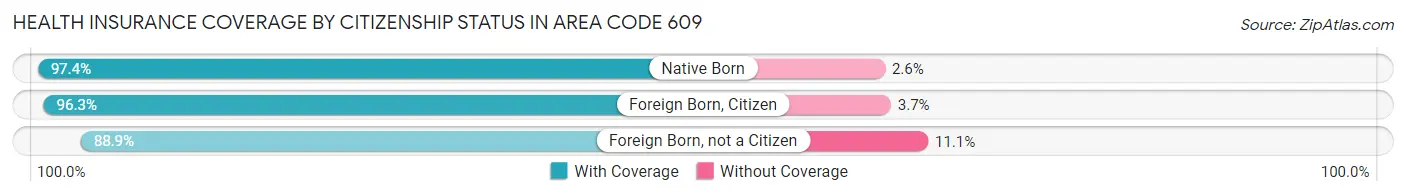
| Citizenship Status | With Coverage | Without Coverage |
| Native Born | 91,381 (97.4%) | 2,433 (2.6%) |
| Foreign Born, Citizen | 228,202 (96.3%) | 8,869 (3.7%) |
| Foreign Born, not a Citizen | 112,925 (88.9%) | 14,036 (11.1%) |
Health Insurance Coverage by Household Income in Area Code 609
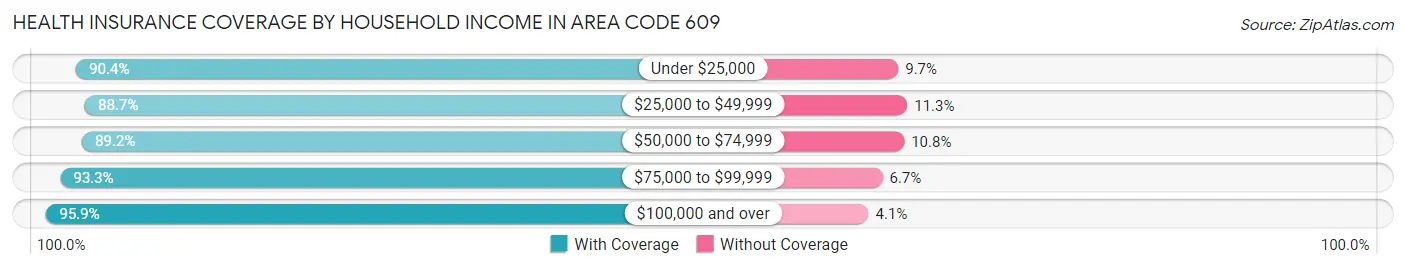
| Household Income | With Coverage | Without Coverage |
| Under $25,000 | 125,099 (90.3%) | 13,357 (9.7%) |
| $25,000 to $49,999 | 162,956 (88.7%) | 20,830 (11.3%) |
| $50,000 to $74,999 | 165,607 (89.2%) | 19,959 (10.8%) |
| $75,000 to $99,999 | 165,847 (93.3%) | 11,899 (6.7%) |
| $100,000 and over | 700,747 (95.9%) | 29,773 (4.1%) |
Public vs Private Health Insurance Coverage by Age in Area Code 609
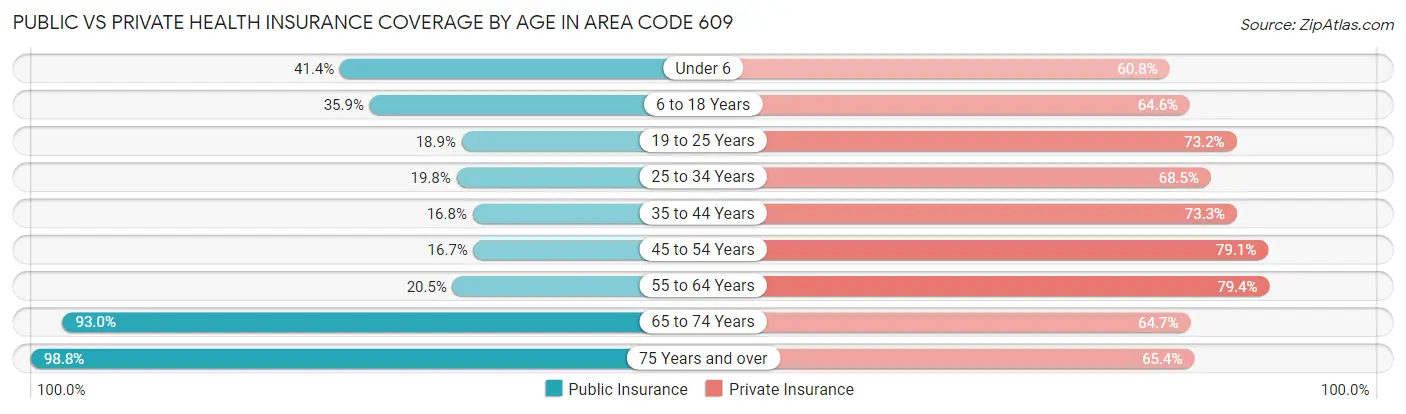
| Age Bracket | Public Insurance | Private Insurance |
| Under 6 | 38,872 (41.4%) | 57,061 (60.8%) |
| 6 to 18 Years | 85,197 (35.9%) | 153,169 (64.6%) |
| 19 to 25 Years | 23,939 (18.9%) | 92,988 (73.2%) |
| 25 to 34 Years | 30,852 (19.8%) | 106,615 (68.5%) |
| 35 to 44 Years | 29,148 (16.8%) | 127,093 (73.3%) |
| 45 to 54 Years | 31,581 (16.7%) | 150,052 (79.1%) |
| 55 to 64 Years | 42,163 (20.5%) | 162,964 (79.4%) |
| 65 to 74 Years | 140,672 (92.9%) | 97,886 (64.7%) |
| 75 Years and over | 103,793 (98.8%) | 68,697 (65.4%) |
| Total | 526,217 (36.6%) | 1,016,525 (70.7%) |
Disability Status by Sex by Age in Area Code 609
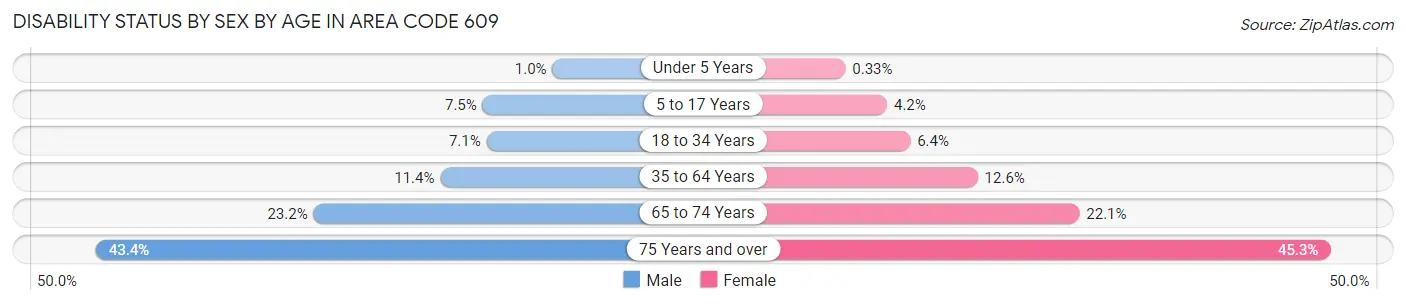
| Age Bracket | Male | Female |
| Under 5 Years | 402 (1.0%) | 125 (0.3%) |
| 5 to 17 Years | 8,939 (7.5%) | 4,812 (4.2%) |
| 18 to 34 Years | 10,724 (7.1%) | 9,616 (6.4%) |
| 35 to 64 Years | 31,732 (11.4%) | 36,622 (12.6%) |
| 65 to 74 Years | 16,347 (23.2%) | 17,834 (22.1%) |
| 75 Years and over | 18,884 (43.4%) | 27,868 (45.3%) |
Disability Class by Sex by Age in Area Code 609
Disability Class: Hearing Difficulty
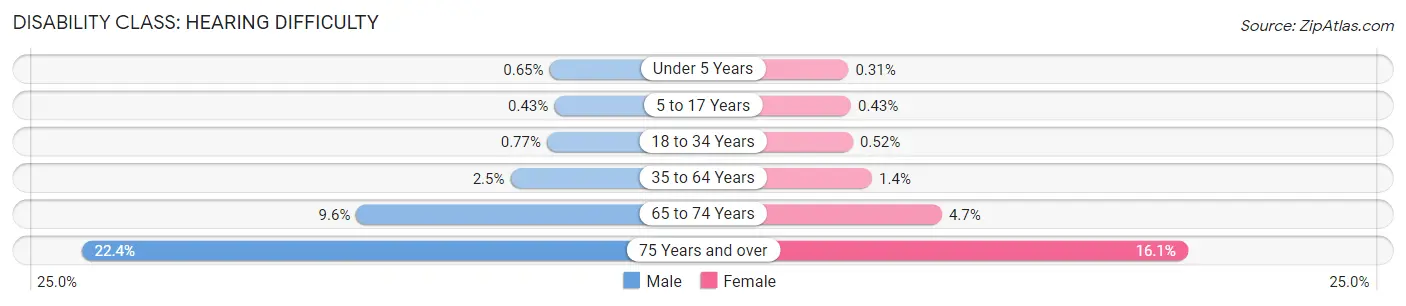
| Age Bracket | Male | Female |
| Under 5 Years | 260 (0.6%) | 116 (0.3%) |
| 5 to 17 Years | 509 (0.4%) | 494 (0.4%) |
| 18 to 34 Years | 1,160 (0.8%) | 782 (0.5%) |
| 35 to 64 Years | 6,824 (2.5%) | 4,085 (1.4%) |
| 65 to 74 Years | 6,776 (9.6%) | 3,759 (4.6%) |
| 75 Years and over | 9,732 (22.4%) | 9,872 (16.1%) |
Disability Class: Vision Difficulty
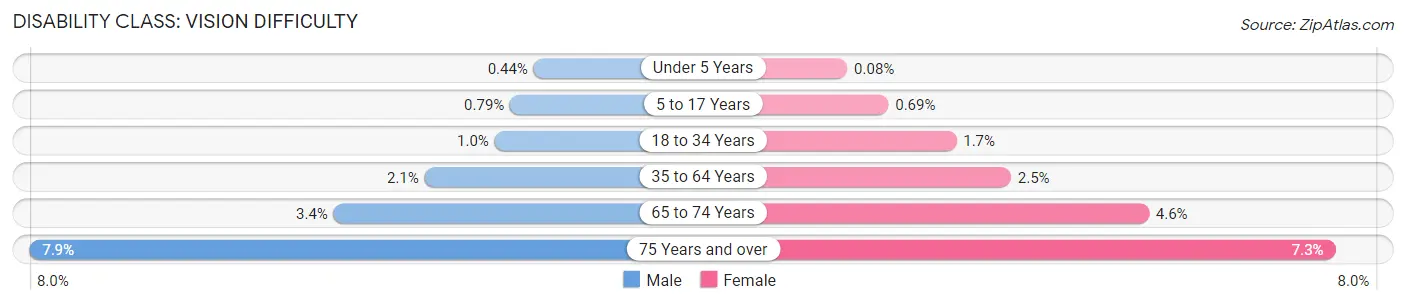
| Age Bracket | Male | Female |
| Under 5 Years | 176 (0.4%) | 29 (0.1%) |
| 5 to 17 Years | 938 (0.8%) | 790 (0.7%) |
| 18 to 34 Years | 1,530 (1.0%) | 2,571 (1.7%) |
| 35 to 64 Years | 5,729 (2.1%) | 7,298 (2.5%) |
| 65 to 74 Years | 2,400 (3.4%) | 3,689 (4.6%) |
| 75 Years and over | 3,454 (7.9%) | 4,506 (7.3%) |
Disability Class: Cognitive Difficulty
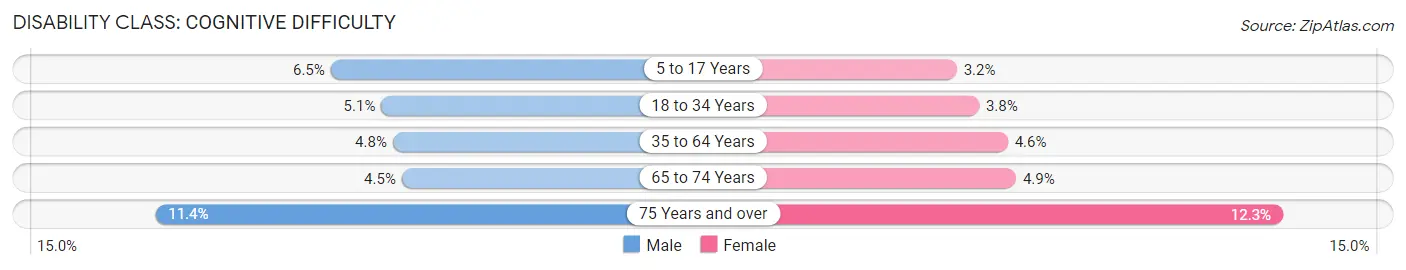
| Age Bracket | Male | Female |
| 5 to 17 Years | 7,728 (6.5%) | 3,661 (3.2%) |
| 18 to 34 Years | 7,629 (5.1%) | 5,791 (3.8%) |
| 35 to 64 Years | 13,211 (4.8%) | 13,410 (4.6%) |
| 65 to 74 Years | 3,169 (4.5%) | 3,925 (4.9%) |
| 75 Years and over | 4,947 (11.4%) | 7,550 (12.3%) |
Disability Class: Ambulatory Difficulty
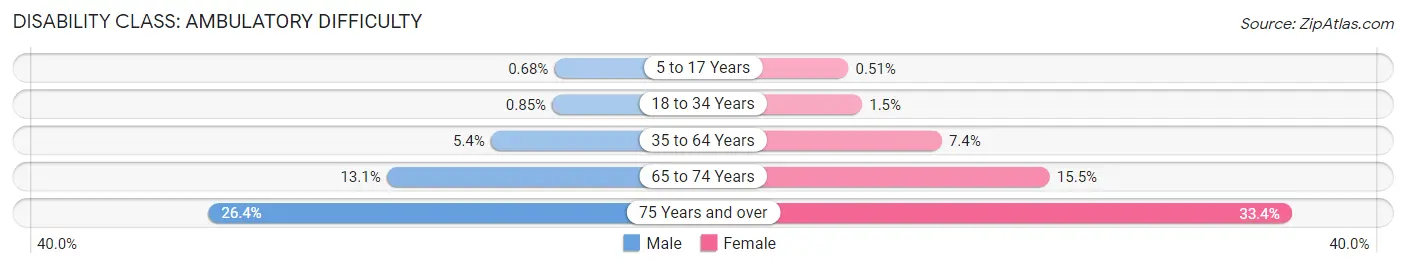
| Age Bracket | Male | Female |
| 5 to 17 Years | 812 (0.7%) | 584 (0.5%) |
| 18 to 34 Years | 1,282 (0.9%) | 2,299 (1.5%) |
| 35 to 64 Years | 15,015 (5.4%) | 21,620 (7.4%) |
| 65 to 74 Years | 9,251 (13.1%) | 12,491 (15.4%) |
| 75 Years and over | 11,472 (26.4%) | 20,533 (33.4%) |
Disability Class: Self-Care Difficulty
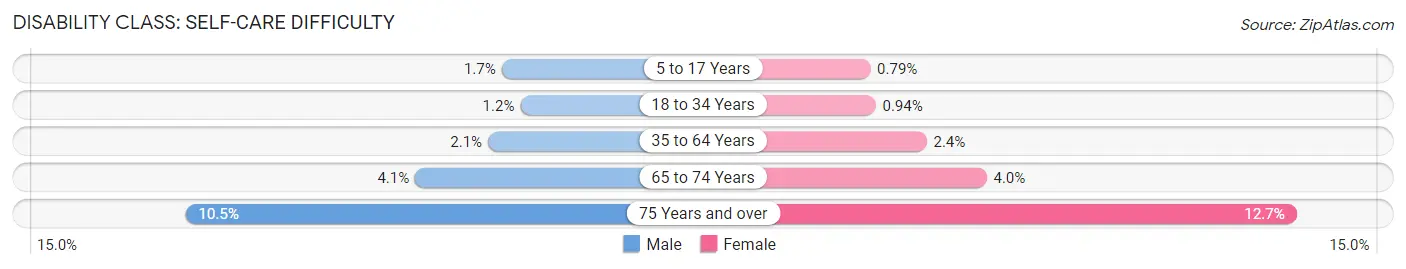
| Age Bracket | Male | Female |
| 5 to 17 Years | 2,051 (1.7%) | 909 (0.8%) |
| 18 to 34 Years | 1,811 (1.2%) | 1,425 (0.9%) |
| 35 to 64 Years | 5,830 (2.1%) | 6,841 (2.4%) |
| 65 to 74 Years | 2,909 (4.1%) | 3,262 (4.0%) |
| 75 Years and over | 4,579 (10.5%) | 7,786 (12.7%) |
Technology Access in Area Code 609
Computing Device Access in Area Code 609
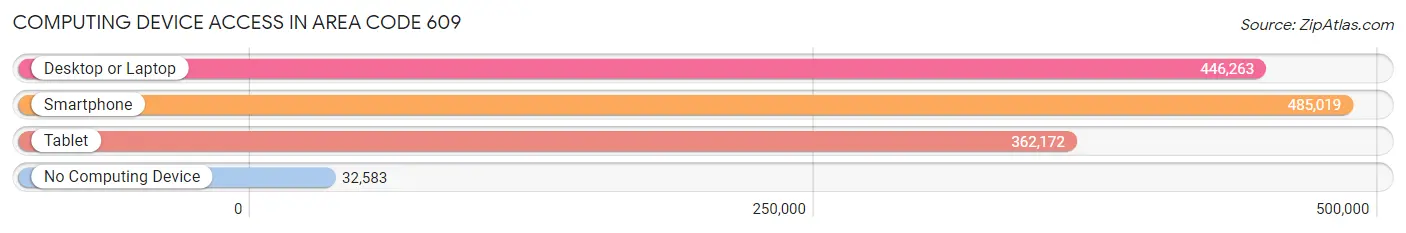
| Device Type | # Households | % Households |
| Desktop or Laptop | 446,263 | 80.4% |
| Smartphone | 485,019 | 87.4% |
| Tablet | 362,172 | 65.3% |
| No Computing Device | 32,583 | 5.9% |
| Total | 554,685 | 100.0% |
Internet Access in Area Code 609
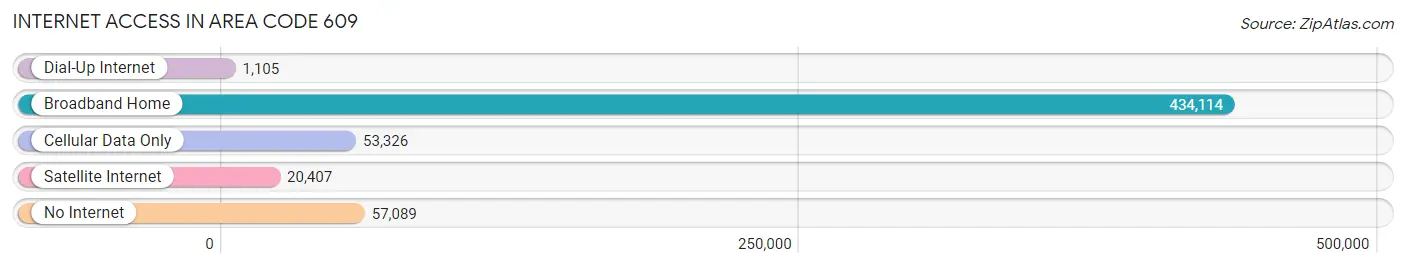
| Internet Type | # Households | % Households |
| Dial-Up Internet | 1,105 | 0.2% |
| Broadband Home | 434,114 | 78.3% |
| Cellular Data Only | 53,326 | 9.6% |
| Satellite Internet | 20,407 | 3.7% |
| No Internet | 57,089 | 10.3% |
| Total | 554,685 | 100.0% |
Area Code 609 Summary
Geography
Area code 609 is located in the state of New Jersey. It covers the entire state, including the cities of Trenton, Atlantic City, and Camden. It is bordered by Pennsylvania to the north, Delaware to the east, and the Atlantic Ocean to the south and east.
Social
Area code 609 is home to a diverse population of people from all walks of life. The area is known for its vibrant nightlife, with a variety of bars, clubs, and restaurants. It is also home to a number of cultural attractions, including the Atlantic City Boardwalk, the New Jersey State Aquarium, and the Atlantic City Convention Center.
Economics
Area code 609 is an important economic hub for the state of New Jersey. It is home to a number of major corporations, including Atlantic City Electric, NJ Transit, and the Atlantic City International Airport. It is also home to a number of casinos, which bring in millions of dollars in revenue each year.
Demographics
Area code 609 is home to a population of over 1.5 million people. The population is diverse, with a mix of races and ethnicities. The median household income is around $50,000, and the unemployment rate is around 5%. The area is also home to a number of colleges and universities, including Rutgers University and Stockton University.
Common Questions
What is Per Capita Income in Area Code 609?
Per Capita income in Area Code 609 is $50,585.
What is the Median Family Income in Area Code 609?
Median Family Income in Area Code 609 is $116,846.
What is the Median Household income in Area Code 609?
Median Household Income in Area Code 609 is $96,262.
What is Income or Wage Gap in Area Code 609?
Income or Wage Gap in Area Code 609 is 26.9%.
Women in Area Code 609 earn 73.1 cents for every dollar earned by a man.
What is Family Income Deficit in Area Code 609?
Family Income Deficit in Area Code 609 is $10,410.
Families that are below poverty line in Area Code 609 earn $10,410 less on average than the poverty threshold level.
What is Inequality or Gini Index in Area Code 609?
Inequality or Gini Index in Area Code 609 is 39.38.
What is the Total Population of Area Code 609?
Total Population of Area Code 609 is 1,467,888.
What is the Total Male Population of Area Code 609?
Total Male Population of Area Code 609 is 724,584.
What is the Total Female Population of Area Code 609?
Total Female Population of Area Code 609 is 743,304.
What is the Ratio of Males per 100 Females in Area Code 609?
There are 97.48 Males per 100 Females in Area Code 609.
What is the Ratio of Females per 100 Males in Area Code 609?
There are 102.58 Females per 100 Males in Area Code 609.
What is the Median Population Age in Area Code 609?
Median Population Age in Area Code 609 is 44.3 Years.
What is the Average Family Size in Area Code 609
Average Family Size in Area Code 609 is 3.0 People.
What is the Average Household Size in Area Code 609
Average Household Size in Area Code 609 is 2.5 People.
How Large is the Labor Force in Area Code 609?
There are 716,872 People in the Labor Forcein in Area Code 609.
What is the Percentage of People in the Labor Force in Area Code 609?
60.0% of People are in the Labor Force in Area Code 609.
What is the Unemployment Rate in Area Code 609?
Unemployment Rate in Area Code 609 is 7.0%.