Atlantic County, NJ Map & Demographics
Atlantic County Overview
$39,699
PER CAPITA INCOME
$91,891
AVG FAMILY INCOME
$73,113
AVG HOUSEHOLD INCOME
26.4%
WAGE / INCOME GAP [ % ]
73.6¢/ $1
WAGE / INCOME GAP [ $ ]
$9,364
FAMILY INCOME DEFICIT
0.48
INEQUALITY / GINI INDEX
274,339
TOTAL POPULATION
133,897
MALE POPULATION
140,442
FEMALE POPULATION
95.34
MALES / 100 FEMALES
104.89
FEMALES / 100 MALES
42.0
MEDIAN AGE
3.1
AVG FAMILY SIZE
2.5
AVG HOUSEHOLD SIZE
141,815
LABOR FORCE [ PEOPLE ]
63.3%
PERCENT IN LABOR FORCE
8.3%
UNEMPLOYMENT RATE
Atlantic County Area Codes
Income in Atlantic County
Income Overview in Atlantic County
Per Capita Income in Atlantic County is $39,699, while median incomes of families and households are $91,891 and $73,113 respectively.
| Characteristic | Number | Measure |
| Per Capita Income | 274,339 | $39,699 |
| Median Family Income | 69,510 | $91,891 |
| Mean Family Income | 69,510 | $120,051 |
| Median Household Income | 106,640 | $73,113 |
| Mean Household Income | 106,640 | $101,941 |
| Income Deficit | 69,510 | $9,364 |
| Wage / Income Gap (%) | 274,339 | 26.37% |
| Wage / Income Gap ($) | 274,339 | 73.63¢ per $1 |
| Gini / Inequality Index | 274,339 | 0.48 |
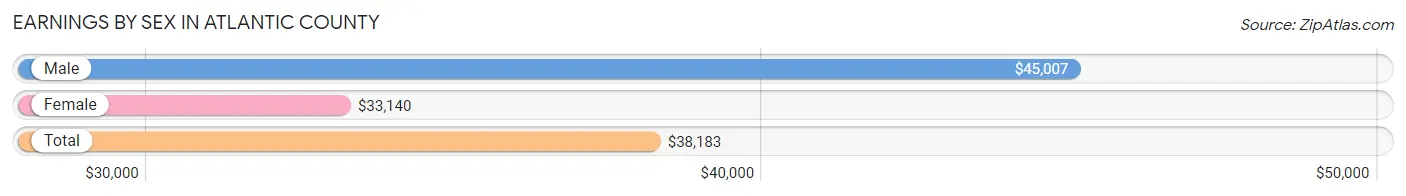
Earnings by Sex in Atlantic County
Average Earnings in Atlantic County are $38,183, $45,007 for men and $33,140 for women, a difference of 26.4%.
| Sex | Number | Average Earnings |
| Male | 74,790 (51.2%) | $45,007 |
| Female | 71,279 (48.8%) | $33,140 |
| Total | 146,069 (100.0%) | $38,183 |
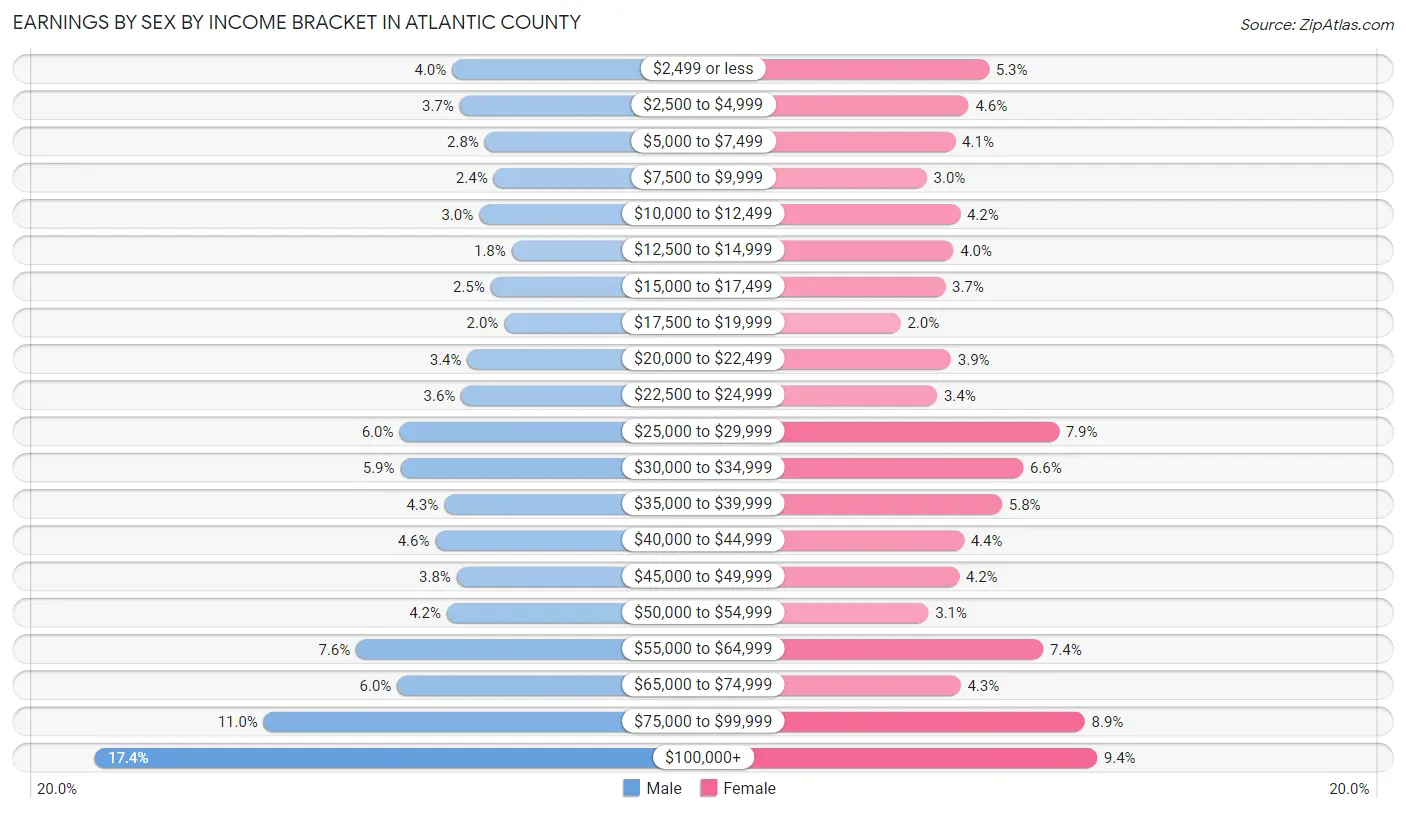
Earnings by Sex by Income Bracket in Atlantic County
The most common earnings brackets in Atlantic County are $100,000+ for men (12,987 | 17.4%) and $100,000+ for women (6,680 | 9.4%).
| Income | Male | Female |
| $2,499 or less | 2,977 (4.0%) | 3,793 (5.3%) |
| $2,500 to $4,999 | 2,767 (3.7%) | 3,247 (4.6%) |
| $5,000 to $7,499 | 2,063 (2.8%) | 2,897 (4.1%) |
| $7,500 to $9,999 | 1,814 (2.4%) | 2,132 (3.0%) |
| $10,000 to $12,499 | 2,224 (3.0%) | 3,021 (4.2%) |
| $12,500 to $14,999 | 1,310 (1.8%) | 2,844 (4.0%) |
| $15,000 to $17,499 | 1,902 (2.5%) | 2,624 (3.7%) |
| $17,500 to $19,999 | 1,521 (2.0%) | 1,433 (2.0%) |
| $20,000 to $22,499 | 2,550 (3.4%) | 2,780 (3.9%) |
| $22,500 to $24,999 | 2,726 (3.6%) | 2,410 (3.4%) |
| $25,000 to $29,999 | 4,459 (6.0%) | 5,661 (7.9%) |
| $30,000 to $34,999 | 4,424 (5.9%) | 4,701 (6.6%) |
| $35,000 to $39,999 | 3,204 (4.3%) | 4,139 (5.8%) |
| $40,000 to $44,999 | 3,449 (4.6%) | 3,124 (4.4%) |
| $45,000 to $49,999 | 2,848 (3.8%) | 2,995 (4.2%) |
| $50,000 to $54,999 | 3,125 (4.2%) | 2,175 (3.0%) |
| $55,000 to $64,999 | 5,667 (7.6%) | 5,237 (7.3%) |
| $65,000 to $74,999 | 4,518 (6.0%) | 3,038 (4.3%) |
| $75,000 to $99,999 | 8,255 (11.0%) | 6,348 (8.9%) |
| $100,000+ | 12,987 (17.4%) | 6,680 (9.4%) |
| Total | 74,790 (100.0%) | 71,279 (100.0%) |
Earnings by Sex by Educational Attainment in Atlantic County
Average earnings in Atlantic County are $53,442 for men and $38,004 for women, a difference of 28.9%. Men with an educational attainment of graduate degree enjoy the highest average annual earnings of $95,546, while those with less than high school education earn the least with $33,055. Women with an educational attainment of graduate degree earn the most with the average annual earnings of $74,380, while those with less than high school education have the smallest earnings of $22,618.

| Educational Attainment | Male Income | Female Income |
| Less than High School | $33,055 | $22,618 |
| High School Diploma | $40,696 | $28,743 |
| College or Associate's Degree | $52,634 | $36,189 |
| Bachelor's Degree | $74,095 | $54,206 |
| Graduate Degree | $95,546 | $74,380 |
| Total | $53,442 | $38,004 |
Family Income in Atlantic County
Family Income Brackets in Atlantic County
According to the Atlantic County family income data, there are 14,945 families falling into the $100,000 to $149,999 income range, which is the most common income bracket and makes up 21.5% of all families. Conversely, the $10,000 to $14,999 income bracket is the least frequent group with only 973 families (1.4%) belonging to this category.

| Income Bracket | # Families | % Families |
| Less than $10,000 | 2,224 | 3.2% |
| $10,000 to $14,999 | 973 | 1.4% |
| $15,000 to $24,999 | 3,823 | 5.5% |
| $25,000 to $34,999 | 4,032 | 5.8% |
| $35,000 to $49,999 | 6,951 | 10.0% |
| $50,000 to $74,999 | 10,426 | 15.0% |
| $75,000 to $99,999 | 9,245 | 13.3% |
| $100,000 to $149,999 | 14,945 | 21.5% |
| $150,000 to $199,999 | 7,994 | 11.5% |
| $200,000+ | 8,897 | 12.8% |
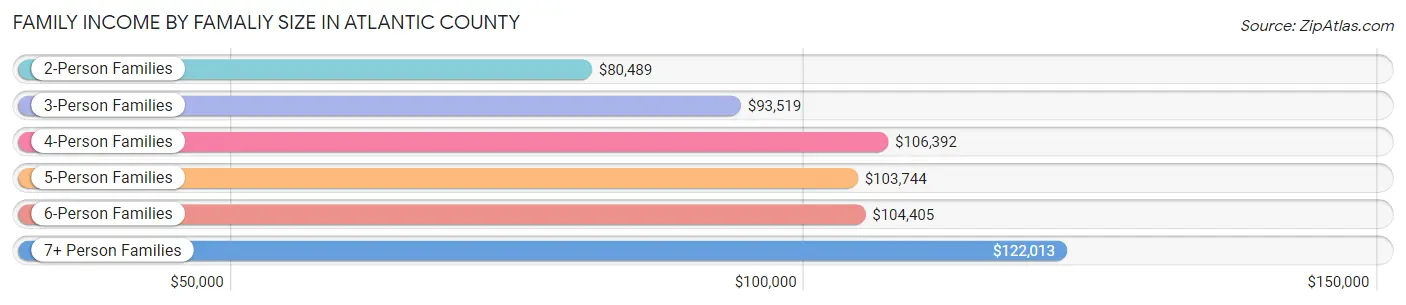
Family Income by Famaliy Size in Atlantic County
7+ person families (1,149 | 1.7%) account for the highest median family income in Atlantic County with $122,013 per family, while 2-person families (31,834 | 45.8%) have the highest median income of $40,244 per family member.
| Income Bracket | # Families | Median Income |
| 2-Person Families | 31,834 (45.8%) | $80,489 |
| 3-Person Families | 16,044 (23.1%) | $93,519 |
| 4-Person Families | 12,972 (18.7%) | $106,392 |
| 5-Person Families | 5,225 (7.5%) | $103,744 |
| 6-Person Families | 2,286 (3.3%) | $104,405 |
| 7+ Person Families | 1,149 (1.7%) | $122,013 |
| Total | 69,510 (100.0%) | $91,891 |
Family Income by Number of Earners in Atlantic County
The median family income in Atlantic County is $91,891, with families comprising 3+ earners (9,316) having the highest median family income of $142,365, while families with no earners (10,184) have the lowest median family income of $50,232, accounting for 13.4% and 14.6% of families, respectively.

| Number of Earners | # Families | Median Income |
| No Earners | 10,184 (14.6%) | $50,232 |
| 1 Earner | 21,261 (30.6%) | $59,957 |
| 2 Earners | 28,749 (41.4%) | $113,999 |
| 3+ Earners | 9,316 (13.4%) | $142,365 |
| Total | 69,510 (100.0%) | $91,891 |
Household Income in Atlantic County
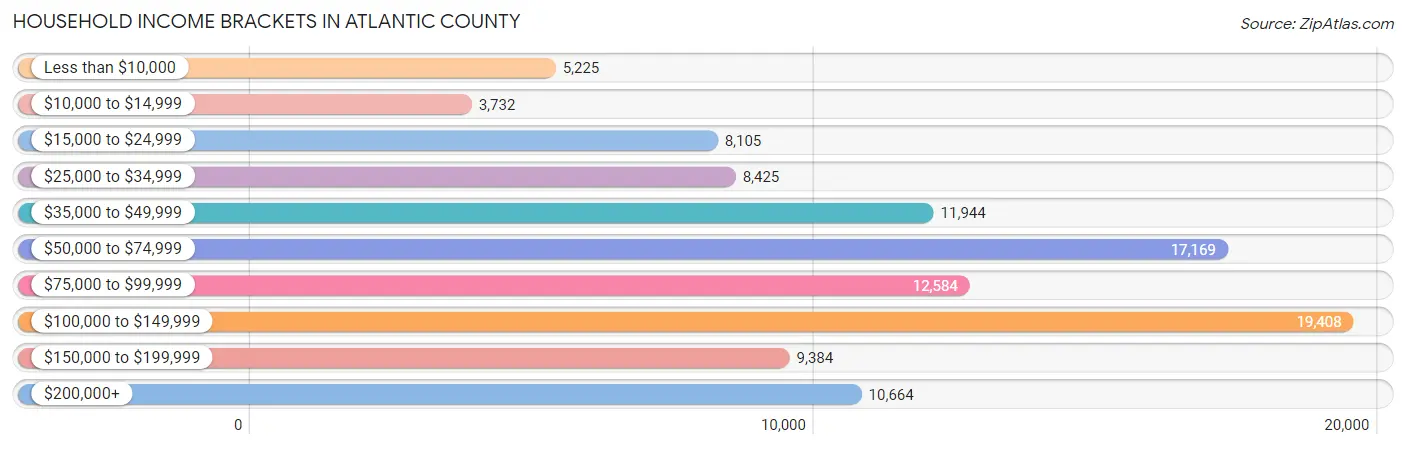
Household Income Brackets in Atlantic County
With 19,408 households falling in the category, the $100,000 to $149,999 income range is the most frequent in Atlantic County, accounting for 18.2% of all households. In contrast, only 3,732 households (3.5%) fall into the $10,000 to $14,999 income bracket, making it the least populous group.
| Income Bracket | # Households | % Households |
| Less than $10,000 | 5,225 | 4.9% |
| $10,000 to $14,999 | 3,732 | 3.5% |
| $15,000 to $24,999 | 8,105 | 7.6% |
| $25,000 to $34,999 | 8,425 | 7.9% |
| $35,000 to $49,999 | 11,944 | 11.2% |
| $50,000 to $74,999 | 17,169 | 16.1% |
| $75,000 to $99,999 | 12,584 | 11.8% |
| $100,000 to $149,999 | 19,408 | 18.2% |
| $150,000 to $199,999 | 9,384 | 8.8% |
| $200,000+ | 10,664 | 10.0% |
Household Income by Householder Age in Atlantic County
The median household income in Atlantic County is $73,113, with the highest median household income of $87,886 found in the 45 to 64 years age bracket for the primary householder. A total of 44,447 households (41.7%) fall into this category. Meanwhile, the 15 to 24 years age bracket for the primary householder has the lowest median household income of $42,842, with 2,576 households (2.4%) in this group.

| Income Bracket | # Households | Median Income |
| 15 to 24 Years | 2,576 (2.4%) | $42,842 |
| 25 to 44 Years | 27,438 (25.7%) | $80,598 |
| 45 to 64 Years | 44,447 (41.7%) | $87,886 |
| 65+ Years | 32,179 (30.2%) | $58,990 |
| Total | 106,640 (100.0%) | $73,113 |
Poverty in Atlantic County
Income Below Poverty by Sex and Age in Atlantic County
With 11.5% poverty level for males and 14.5% for females among the residents of Atlantic County, under 5 year old males and 15 year old females are the most vulnerable to poverty, with 1,656 males (22.7%) and 414 females (24.1%) in their respective age groups living below the poverty level.
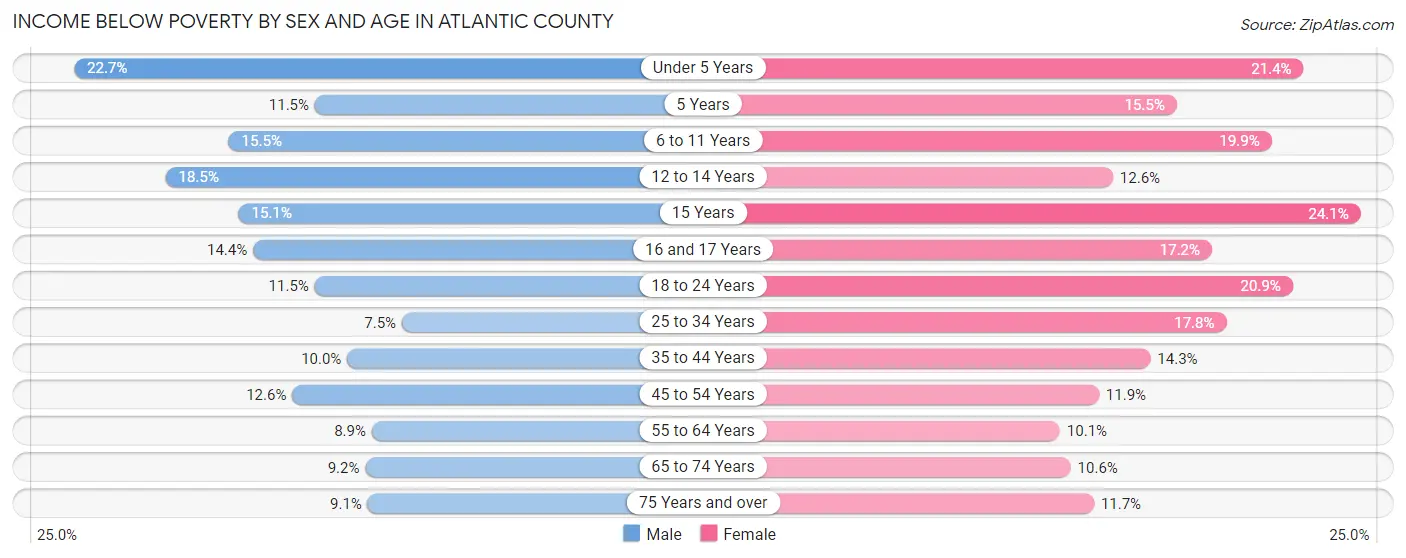
| Age Bracket | Male | Female |
| Under 5 Years | 1,656 (22.7%) | 1,472 (21.4%) |
| 5 Years | 185 (11.5%) | 224 (15.5%) |
| 6 to 11 Years | 1,546 (15.5%) | 1,845 (19.9%) |
| 12 to 14 Years | 907 (18.5%) | 602 (12.6%) |
| 15 Years | 214 (15.1%) | 414 (24.1%) |
| 16 and 17 Years | 560 (14.4%) | 569 (17.2%) |
| 18 to 24 Years | 1,342 (11.5%) | 2,246 (20.9%) |
| 25 to 34 Years | 1,224 (7.5%) | 2,880 (17.8%) |
| 35 to 44 Years | 1,498 (10.0%) | 2,235 (14.3%) |
| 45 to 54 Years | 2,124 (12.6%) | 2,193 (11.9%) |
| 55 to 64 Years | 1,763 (8.9%) | 2,153 (10.1%) |
| 65 to 74 Years | 1,312 (9.2%) | 1,685 (10.6%) |
| 75 Years and over | 764 (9.1%) | 1,376 (11.7%) |
| Total | 15,095 (11.5%) | 19,894 (14.5%) |
Income Above Poverty by Sex and Age in Atlantic County
According to the poverty statistics in Atlantic County, males aged 25 to 34 years and females aged 55 to 64 years are the age groups that are most secure financially, with 92.5% of males and 89.9% of females in these age groups living above the poverty line.

| Age Bracket | Male | Female |
| Under 5 Years | 5,640 (77.3%) | 5,399 (78.6%) |
| 5 Years | 1,419 (88.5%) | 1,217 (84.5%) |
| 6 to 11 Years | 8,409 (84.5%) | 7,409 (80.1%) |
| 12 to 14 Years | 4,005 (81.5%) | 4,185 (87.4%) |
| 15 Years | 1,206 (84.9%) | 1,306 (75.9%) |
| 16 and 17 Years | 3,329 (85.6%) | 2,744 (82.8%) |
| 18 to 24 Years | 10,290 (88.5%) | 8,488 (79.1%) |
| 25 to 34 Years | 15,122 (92.5%) | 13,259 (82.2%) |
| 35 to 44 Years | 13,439 (90.0%) | 13,369 (85.7%) |
| 45 to 54 Years | 14,764 (87.4%) | 16,193 (88.1%) |
| 55 to 64 Years | 18,072 (91.1%) | 19,123 (89.9%) |
| 65 to 74 Years | 12,966 (90.8%) | 14,182 (89.4%) |
| 75 Years and over | 7,646 (90.9%) | 10,381 (88.3%) |
| Total | 116,307 (88.5%) | 117,255 (85.5%) |
Income Below Poverty Among Married-Couple Families in Atlantic County
The poverty statistics for married-couple families in Atlantic County show that 4.8% or 2,288 of the total 48,182 families live below the poverty line. Families with 3 or 4 children have the highest poverty rate of 8.9%, comprising of 307 families. On the other hand, families with 5 or more children have the lowest poverty rate of 1.8%, which includes 4 families.
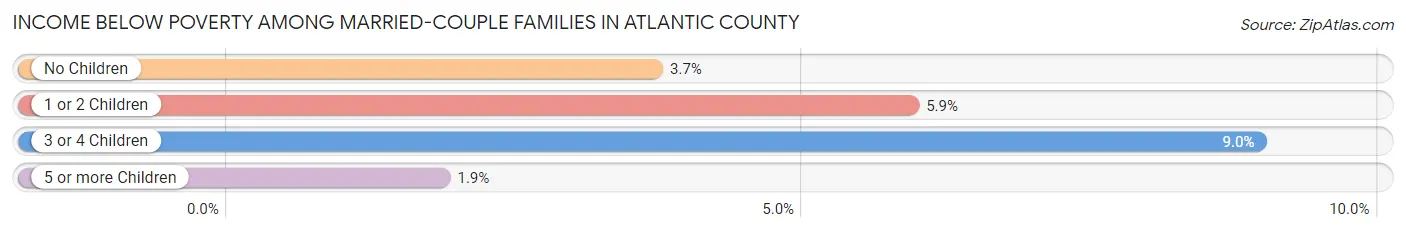
| Children | Above Poverty | Below Poverty |
| No Children | 28,641 (96.3%) | 1,099 (3.7%) |
| 1 or 2 Children | 13,916 (94.1%) | 878 (5.9%) |
| 3 or 4 Children | 3,125 (91.0%) | 307 (8.9%) |
| 5 or more Children | 212 (98.2%) | 4 (1.8%) |
| Total | 45,894 (95.3%) | 2,288 (4.8%) |
Income Below Poverty Among Single-Parent Households in Atlantic County
According to the poverty data in Atlantic County, 13.9% or 871 single-father households and 24.8% or 3,737 single-mother households are living below the poverty line. Among single-father households, those with 3 or 4 children have the highest poverty rate, with 96 households (29.8%) experiencing poverty. Likewise, among single-mother households, those with 3 or 4 children have the highest poverty rate, with 610 households (52.0%) falling below the poverty line.
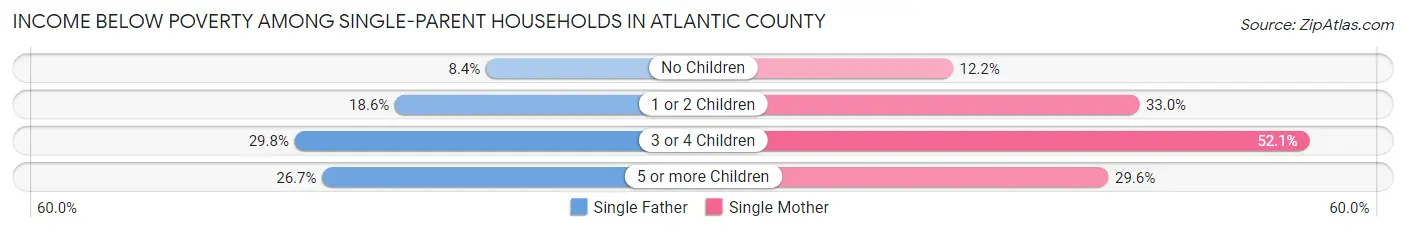
| Children | Single Father | Single Mother |
| No Children | 281 (8.4%) | 845 (12.2%) |
| 1 or 2 Children | 467 (18.6%) | 2,217 (33.0%) |
| 3 or 4 Children | 96 (29.8%) | 610 (52.0%) |
| 5 or more Children | 27 (26.7%) | 65 (29.5%) |
| Total | 871 (13.9%) | 3,737 (24.8%) |
Income Below Poverty Among Married-Couple vs Single-Parent Households in Atlantic County
The poverty data for Atlantic County shows that 2,288 of the married-couple family households (4.8%) and 4,608 of the single-parent households (21.6%) are living below the poverty level. Within the married-couple family households, those with 3 or 4 children have the highest poverty rate, with 307 households (8.9%) falling below the poverty line. Among the single-parent households, those with 3 or 4 children have the highest poverty rate, with 706 household (47.3%) living below poverty.

| Children | Married-Couple Families | Single-Parent Households |
| No Children | 1,099 (3.7%) | 1,126 (11.0%) |
| 1 or 2 Children | 878 (5.9%) | 2,684 (29.1%) |
| 3 or 4 Children | 307 (8.9%) | 706 (47.3%) |
| 5 or more Children | 4 (1.8%) | 92 (28.7%) |
| Total | 2,288 (4.8%) | 4,608 (21.6%) |
Race in Atlantic County
The most populous races in Atlantic County are White / Caucasian (164,950 | 60.1%), Hispanic or Latino (54,178 | 19.8%), and Black / African American (37,060 | 13.5%).
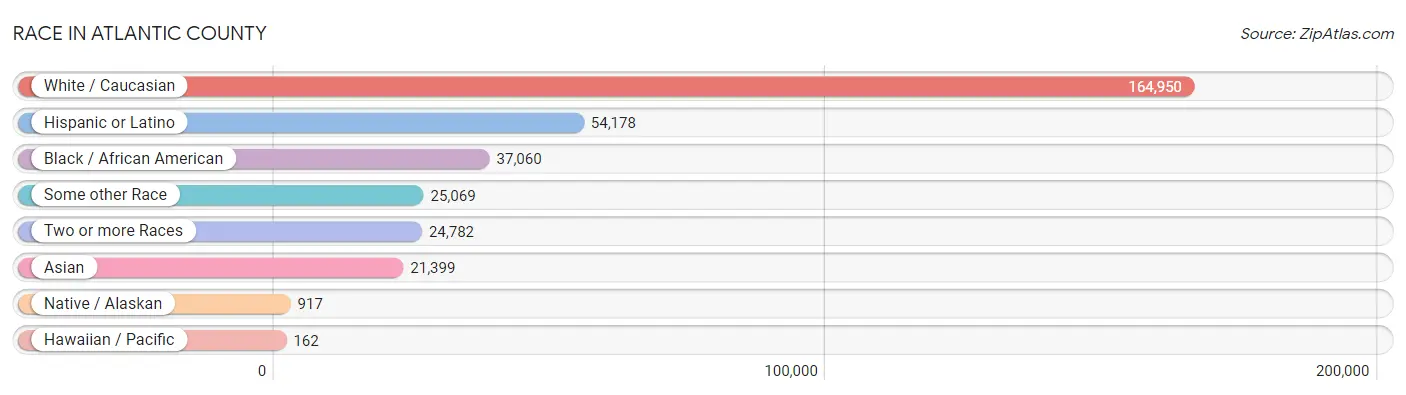
| Race | # Population | % Population |
| Asian | 21,399 | 7.8% |
| Black / African American | 37,060 | 13.5% |
| Hawaiian / Pacific | 162 | 0.1% |
| Hispanic or Latino | 54,178 | 19.8% |
| Native / Alaskan | 917 | 0.3% |
| White / Caucasian | 164,950 | 60.1% |
| Two or more Races | 24,782 | 9.0% |
| Some other Race | 25,069 | 9.1% |
| Total | 274,339 | 100.0% |
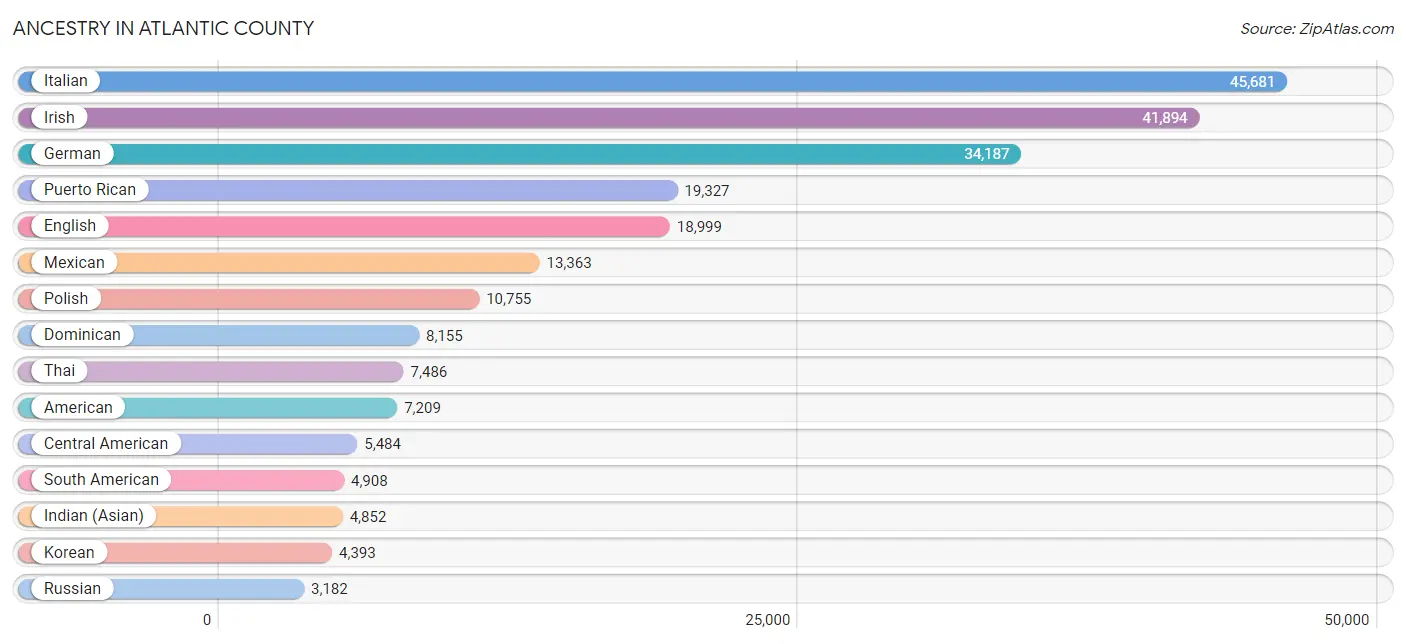
Ancestry in Atlantic County
The most populous ancestries reported in Atlantic County are Italian (45,681 | 16.7%), Irish (41,894 | 15.3%), German (34,187 | 12.5%), Puerto Rican (19,327 | 7.0%), and English (18,999 | 6.9%), together accounting for 58.4% of all Atlantic County residents.
| Ancestry | # Population | % Population |
| Afghan | 98 | 0.0% |
| African | 809 | 0.3% |
| Albanian | 408 | 0.2% |
| Alsatian | 25 | 0.0% |
| American | 7,209 | 2.6% |
| Apache | 36 | 0.0% |
| Arab | 1,014 | 0.4% |
| Argentinean | 135 | 0.1% |
| Armenian | 280 | 0.1% |
| Australian | 47 | 0.0% |
| Austrian | 750 | 0.3% |
| Bahamian | 13 | 0.0% |
| Barbadian | 229 | 0.1% |
| Belgian | 22 | 0.0% |
| Bermudan | 41 | 0.0% |
| Bhutanese | 705 | 0.3% |
| Blackfeet | 96 | 0.0% |
| Bolivian | 25 | 0.0% |
| Brazilian | 77 | 0.0% |
| British | 480 | 0.2% |
| British West Indian | 64 | 0.0% |
| Bulgarian | 467 | 0.2% |
| Burmese | 1,939 | 0.7% |
| Cajun | 11 | 0.0% |
| Cambodian | 4 | 0.0% |
| Canadian | 187 | 0.1% |
| Celtic | 3 | 0.0% |
| Central American | 5,484 | 2.0% |
| Central American Indian | 275 | 0.1% |
| Cherokee | 713 | 0.3% |
| Chilean | 95 | 0.0% |
| Chippewa | 16 | 0.0% |
| Choctaw | 28 | 0.0% |
| Colombian | 2,335 | 0.9% |
| Costa Rican | 150 | 0.1% |
| Croatian | 120 | 0.0% |
| Cuban | 1,280 | 0.5% |
| Cypriot | 8 | 0.0% |
| Czech | 202 | 0.1% |
| Czechoslovakian | 158 | 0.1% |
| Danish | 208 | 0.1% |
| Delaware | 312 | 0.1% |
| Dominican | 8,155 | 3.0% |
| Dutch | 1,706 | 0.6% |
| Eastern European | 1,147 | 0.4% |
| Ecuadorian | 495 | 0.2% |
| Egyptian | 428 | 0.2% |
| English | 18,999 | 6.9% |
| Estonian | 84 | 0.0% |
| European | 2,811 | 1.0% |
| Filipino | 38 | 0.0% |
| Finnish | 153 | 0.1% |
| French | 2,903 | 1.1% |
| French American Indian | 12 | 0.0% |
| French Canadian | 709 | 0.3% |
| German | 34,187 | 12.5% |
| Ghanaian | 335 | 0.1% |
| Greek | 1,284 | 0.5% |
| Guamanian / Chamorro | 68 | 0.0% |
| Guatemalan | 719 | 0.3% |
| Guyanese | 58 | 0.0% |
| Haitian | 1,442 | 0.5% |
| Honduran | 2,653 | 1.0% |
| Hungarian | 1,495 | 0.5% |
| Indian (Asian) | 4,852 | 1.8% |
| Indonesian | 92 | 0.0% |
| Inupiat | 2 | 0.0% |
| Iranian | 116 | 0.0% |
| Irish | 41,894 | 15.3% |
| Iroquois | 144 | 0.1% |
| Israeli | 41 | 0.0% |
| Italian | 45,681 | 16.7% |
| Jamaican | 566 | 0.2% |
| Japanese | 12 | 0.0% |
| Jordanian | 79 | 0.0% |
| Kenyan | 152 | 0.1% |
| Korean | 4,393 | 1.6% |
| Latvian | 76 | 0.0% |
| Lebanese | 221 | 0.1% |
| Liberian | 70 | 0.0% |
| Lithuanian | 755 | 0.3% |
| Luxembourger | 35 | 0.0% |
| Macedonian | 3 | 0.0% |
| Malaysian | 107 | 0.0% |
| Maltese | 10 | 0.0% |
| Mexican | 13,363 | 4.9% |
| Mexican American Indian | 541 | 0.2% |
| Moroccan | 111 | 0.0% |
| Native Hawaiian | 69 | 0.0% |
| Navajo | 43 | 0.0% |
| Nicaraguan | 507 | 0.2% |
| Nigerian | 250 | 0.1% |
| Northern European | 173 | 0.1% |
| Norwegian | 1,076 | 0.4% |
| Osage | 28 | 0.0% |
| Pakistani | 404 | 0.2% |
| Palestinian | 53 | 0.0% |
| Panamanian | 187 | 0.1% |
| Pennsylvania German | 685 | 0.3% |
| Peruvian | 1,630 | 0.6% |
| Polish | 10,755 | 3.9% |
| Portuguese | 572 | 0.2% |
| Potawatomi | 2 | 0.0% |
| Puerto Rican | 19,327 | 7.0% |
| Romanian | 491 | 0.2% |
| Russian | 3,182 | 1.2% |
| Salvadoran | 1,268 | 0.5% |
| Samoan | 15 | 0.0% |
| Scandinavian | 226 | 0.1% |
| Scotch-Irish | 1,500 | 0.5% |
| Scottish | 2,465 | 0.9% |
| Serbian | 109 | 0.0% |
| Sioux | 24 | 0.0% |
| Slavic | 51 | 0.0% |
| Slovak | 538 | 0.2% |
| Slovene | 36 | 0.0% |
| South African | 3 | 0.0% |
| South American | 4,908 | 1.8% |
| South American Indian | 102 | 0.0% |
| Spaniard | 596 | 0.2% |
| Spanish | 263 | 0.1% |
| Spanish American | 6 | 0.0% |
| Spanish American Indian | 5 | 0.0% |
| Sri Lankan | 2,934 | 1.1% |
| Subsaharan African | 1,599 | 0.6% |
| Swedish | 1,024 | 0.4% |
| Swiss | 195 | 0.1% |
| Syrian | 71 | 0.0% |
| Thai | 7,486 | 2.7% |
| Trinidadian and Tobagonian | 121 | 0.0% |
| Turkish | 134 | 0.1% |
| U.S. Virgin Islander | 50 | 0.0% |
| Ukrainian | 1,775 | 0.6% |
| Ute | 4 | 0.0% |
| Venezuelan | 178 | 0.1% |
| Vietnamese | 1,379 | 0.5% |
| Welsh | 1,151 | 0.4% |
| West Indian | 249 | 0.1% |
| Yugoslavian | 129 | 0.1% | View All 139 Rows |
Immigrants in Atlantic County
The most numerous immigrant groups reported in Atlantic County came from Latin America (20,846 | 7.6%), Asia (15,275 | 5.6%), Central America (9,877 | 3.6%), Caribbean (7,881 | 2.9%), and South Central Asia (7,035 | 2.6%), together accounting for 22.2% of all Atlantic County residents.

| Immigration Origin | # Population | % Population |
| Afghanistan | 98 | 0.0% |
| Africa | 1,680 | 0.6% |
| Albania | 272 | 0.1% |
| Argentina | 107 | 0.0% |
| Asia | 15,275 | 5.6% |
| Australia | 10 | 0.0% |
| Austria | 11 | 0.0% |
| Bahamas | 23 | 0.0% |
| Bangladesh | 1,943 | 0.7% |
| Barbados | 185 | 0.1% |
| Belarus | 22 | 0.0% |
| Belgium | 6 | 0.0% |
| Belize | 5 | 0.0% |
| Bolivia | 25 | 0.0% |
| Brazil | 296 | 0.1% |
| Bulgaria | 453 | 0.2% |
| Cambodia | 8 | 0.0% |
| Canada | 175 | 0.1% |
| Caribbean | 7,881 | 2.9% |
| Central America | 9,877 | 3.6% |
| Chile | 38 | 0.0% |
| China | 2,247 | 0.8% |
| Colombia | 1,238 | 0.4% |
| Congo | 14 | 0.0% |
| Costa Rica | 116 | 0.0% |
| Croatia | 12 | 0.0% |
| Cuba | 400 | 0.2% |
| Czechoslovakia | 9 | 0.0% |
| Denmark | 6 | 0.0% |
| Dominica | 41 | 0.0% |
| Dominican Republic | 5,098 | 1.9% |
| Eastern Africa | 118 | 0.0% |
| Eastern Asia | 3,354 | 1.2% |
| Eastern Europe | 2,557 | 0.9% |
| Ecuador | 222 | 0.1% |
| Egypt | 344 | 0.1% |
| El Salvador | 927 | 0.3% |
| England | 308 | 0.1% |
| Europe | 5,305 | 1.9% |
| France | 25 | 0.0% |
| Germany | 730 | 0.3% |
| Ghana | 478 | 0.2% |
| Greece | 159 | 0.1% |
| Grenada | 10 | 0.0% |
| Guatemala | 245 | 0.1% |
| Guyana | 96 | 0.0% |
| Haiti | 1,381 | 0.5% |
| Honduras | 2,306 | 0.8% |
| Hong Kong | 211 | 0.1% |
| Hungary | 64 | 0.0% |
| India | 3,834 | 1.4% |
| Indonesia | 30 | 0.0% |
| Iran | 130 | 0.1% |
| Ireland | 144 | 0.1% |
| Israel | 49 | 0.0% |
| Italy | 720 | 0.3% |
| Jamaica | 289 | 0.1% |
| Japan | 140 | 0.1% |
| Jordan | 8 | 0.0% |
| Kenya | 37 | 0.0% |
| Korea | 967 | 0.4% |
| Kuwait | 6 | 0.0% |
| Laos | 19 | 0.0% |
| Latin America | 20,846 | 7.6% |
| Latvia | 16 | 0.0% |
| Lebanon | 39 | 0.0% |
| Liberia | 285 | 0.1% |
| Malaysia | 138 | 0.1% |
| Mexico | 5,991 | 2.2% |
| Middle Africa | 14 | 0.0% |
| Moldova | 51 | 0.0% |
| Morocco | 68 | 0.0% |
| Nepal | 9 | 0.0% |
| Netherlands | 39 | 0.0% |
| Nicaragua | 190 | 0.1% |
| Nigeria | 150 | 0.1% |
| North Macedonia | 22 | 0.0% |
| Northern Africa | 412 | 0.2% |
| Northern Europe | 819 | 0.3% |
| Oceania | 30 | 0.0% |
| Pakistan | 773 | 0.3% |
| Panama | 97 | 0.0% |
| Peru | 820 | 0.3% |
| Philippines | 2,653 | 1.0% |
| Poland | 769 | 0.3% |
| Portugal | 135 | 0.1% |
| Romania | 258 | 0.1% |
| Russia | 268 | 0.1% |
| Saudi Arabia | 69 | 0.0% |
| Scotland | 50 | 0.0% |
| Serbia | 20 | 0.0% |
| South America | 3,088 | 1.1% |
| South Central Asia | 7,035 | 2.6% |
| South Eastern Asia | 4,598 | 1.7% |
| Southern Europe | 1,044 | 0.4% |
| Spain | 20 | 0.0% |
| Sri Lanka | 77 | 0.0% |
| Sweden | 41 | 0.0% |
| Switzerland | 46 | 0.0% |
| Syria | 27 | 0.0% |
| Taiwan | 225 | 0.1% |
| Thailand | 83 | 0.0% |
| Trinidad and Tobago | 214 | 0.1% |
| Turkey | 90 | 0.0% |
| Uganda | 73 | 0.0% |
| Ukraine | 302 | 0.1% |
| Uzbekistan | 23 | 0.0% |
| Venezuela | 159 | 0.1% |
| Vietnam | 1,620 | 0.6% |
| Western Africa | 913 | 0.3% |
| Western Asia | 288 | 0.1% |
| Western Europe | 857 | 0.3% | View All 112 Rows |
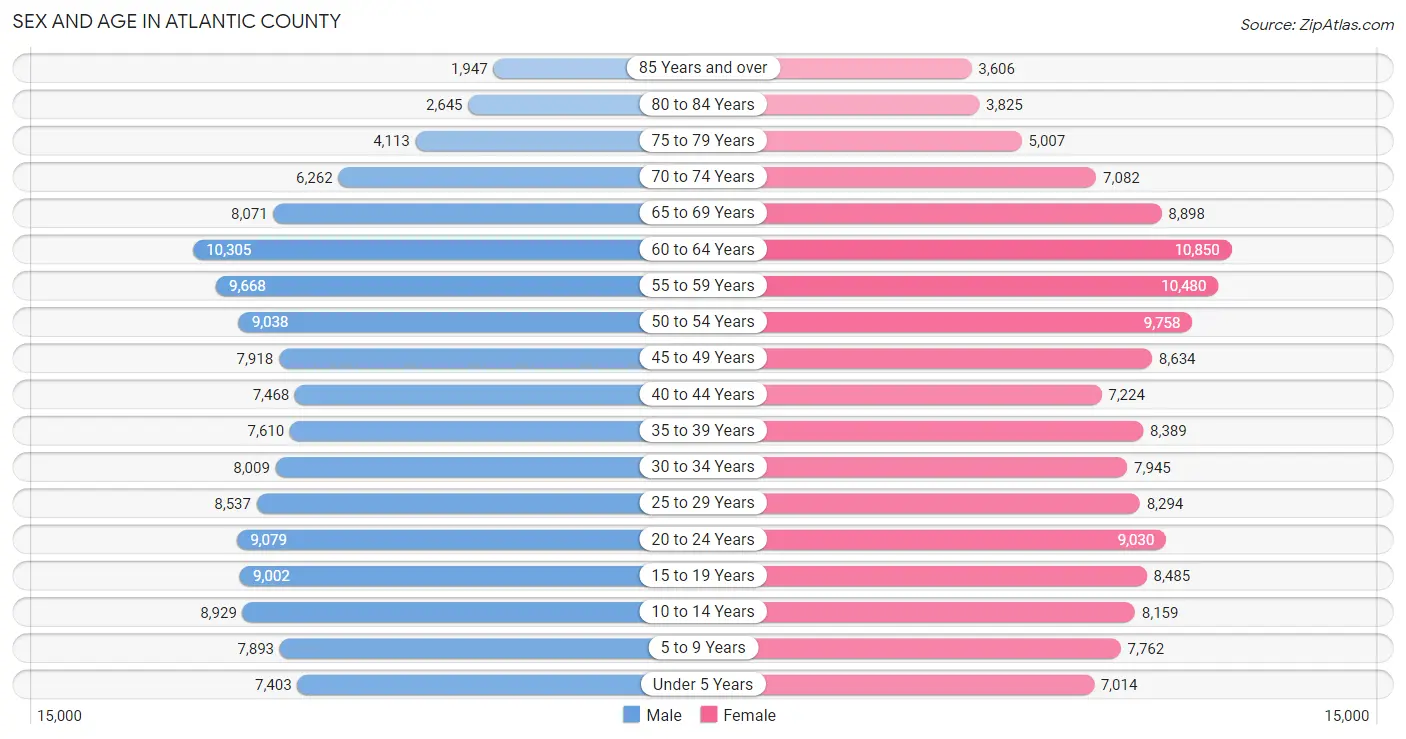
Sex and Age in Atlantic County
Sex and Age in Atlantic County
The most populous age groups in Atlantic County are 60 to 64 Years (10,305 | 7.7%) for men and 60 to 64 Years (10,850 | 7.7%) for women.
| Age Bracket | Male | Female |
| Under 5 Years | 7,403 (5.5%) | 7,014 (5.0%) |
| 5 to 9 Years | 7,893 (5.9%) | 7,762 (5.5%) |
| 10 to 14 Years | 8,929 (6.7%) | 8,159 (5.8%) |
| 15 to 19 Years | 9,002 (6.7%) | 8,485 (6.0%) |
| 20 to 24 Years | 9,079 (6.8%) | 9,030 (6.4%) |
| 25 to 29 Years | 8,537 (6.4%) | 8,294 (5.9%) |
| 30 to 34 Years | 8,009 (6.0%) | 7,945 (5.7%) |
| 35 to 39 Years | 7,610 (5.7%) | 8,389 (6.0%) |
| 40 to 44 Years | 7,468 (5.6%) | 7,224 (5.1%) |
| 45 to 49 Years | 7,918 (5.9%) | 8,634 (6.1%) |
| 50 to 54 Years | 9,038 (6.8%) | 9,758 (7.0%) |
| 55 to 59 Years | 9,668 (7.2%) | 10,480 (7.5%) |
| 60 to 64 Years | 10,305 (7.7%) | 10,850 (7.7%) |
| 65 to 69 Years | 8,071 (6.0%) | 8,898 (6.3%) |
| 70 to 74 Years | 6,262 (4.7%) | 7,082 (5.0%) |
| 75 to 79 Years | 4,113 (3.1%) | 5,007 (3.6%) |
| 80 to 84 Years | 2,645 (2.0%) | 3,825 (2.7%) |
| 85 Years and over | 1,947 (1.5%) | 3,606 (2.6%) |
| Total | 133,897 (100.0%) | 140,442 (100.0%) |
Families and Households in Atlantic County
Median Family Size in Atlantic County
The median family size in Atlantic County is 3.10 persons per family, with married-couple families (48,182 | 69.3%) accounting for the largest median family size of 3.19 persons per family. On the other hand, single male/father families (6,271 | 9.0%) represent the smallest median family size with 2.78 persons per family.

| Family Type | # Families | Family Size |
| Married-Couple | 48,182 (69.3%) | 3.19 |
| Single Male/Father | 6,271 (9.0%) | 2.78 |
| Single Female/Mother | 15,057 (21.7%) | 2.96 |
| Total Families | 69,510 (100.0%) | 3.10 |
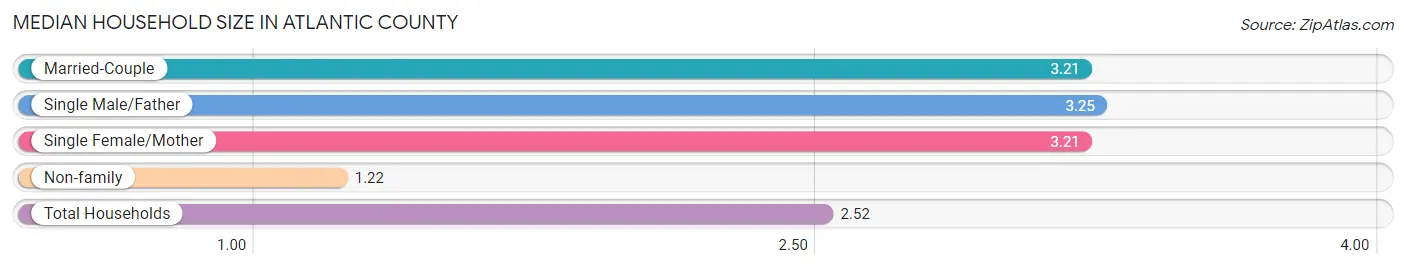
Median Household Size in Atlantic County
The median household size in Atlantic County is 2.52 persons per household, with single male/father households (6,271 | 5.9%) accounting for the largest median household size of 3.25 persons per household. non-family households (37,130 | 34.8%) represent the smallest median household size with 1.22 persons per household.
| Household Type | # Households | Household Size |
| Married-Couple | 48,182 (45.2%) | 3.21 |
| Single Male/Father | 6,271 (5.9%) | 3.25 |
| Single Female/Mother | 15,057 (14.1%) | 3.21 |
| Non-family | 37,130 (34.8%) | 1.22 |
| Total Households | 106,640 (100.0%) | 2.52 |
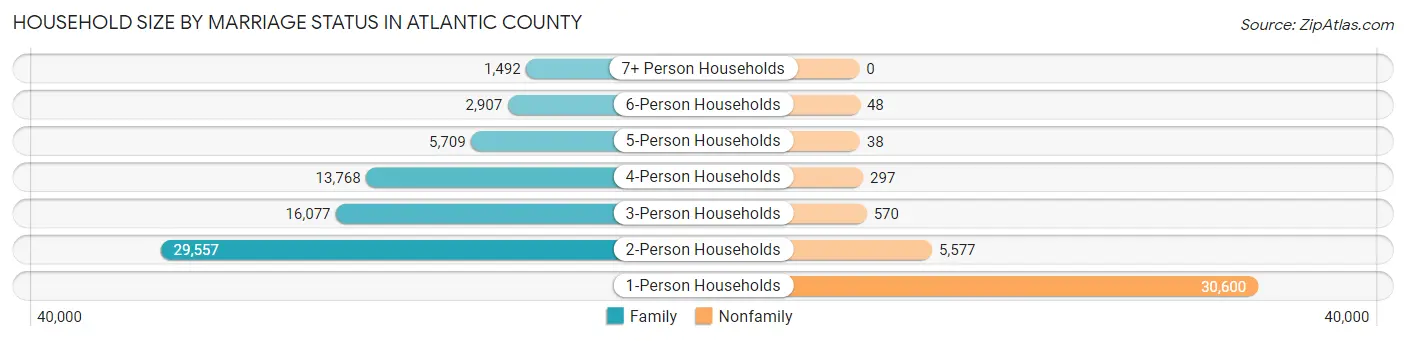
Household Size by Marriage Status in Atlantic County
Out of a total of 106,640 households in Atlantic County, 69,510 (65.2%) are family households, while 37,130 (34.8%) are nonfamily households. The most numerous type of family households are 2-person households, comprising 29,557, and the most common type of nonfamily households are 1-person households, comprising 30,600.
| Household Size | Family Households | Nonfamily Households |
| 1-Person Households | - | 30,600 (28.7%) |
| 2-Person Households | 29,557 (27.7%) | 5,577 (5.2%) |
| 3-Person Households | 16,077 (15.1%) | 570 (0.5%) |
| 4-Person Households | 13,768 (12.9%) | 297 (0.3%) |
| 5-Person Households | 5,709 (5.3%) | 38 (0.0%) |
| 6-Person Households | 2,907 (2.7%) | 48 (0.1%) |
| 7+ Person Households | 1,492 (1.4%) | 0 (0.0%) |
| Total | 69,510 (65.2%) | 37,130 (34.8%) |
Female Fertility in Atlantic County
Fertility by Age in Atlantic County
Average fertility rate in Atlantic County is 61.0 births per 1,000 women. Women in the age bracket of 20 to 34 years have the highest fertility rate with 107.0 births per 1,000 women. Women in the age bracket of 20 to 34 years acount for 73.3% of all women with births.
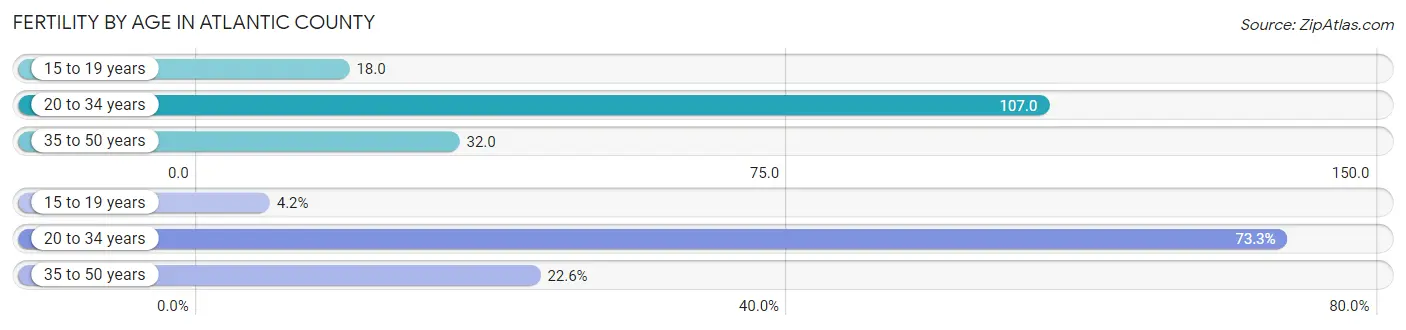
| Age Bracket | Women with Births | Births / 1,000 Women |
| 15 to 19 years | 154 (4.2%) | 18.0 |
| 20 to 34 years | 2,692 (73.3%) | 107.0 |
| 35 to 50 years | 829 (22.6%) | 32.0 |
| Total | 3,675 (100.0%) | 61.0 |
Fertility by Age by Marriage Status in Atlantic County
63.7% of women with births (3,675) in Atlantic County are married. The highest percentage of unmarried women with births falls into 15 to 19 years age bracket with 100.0% of them unmarried at the time of birth, while the lowest percentage of unmarried women with births belong to 35 to 50 years age bracket with 16.9% of them unmarried.
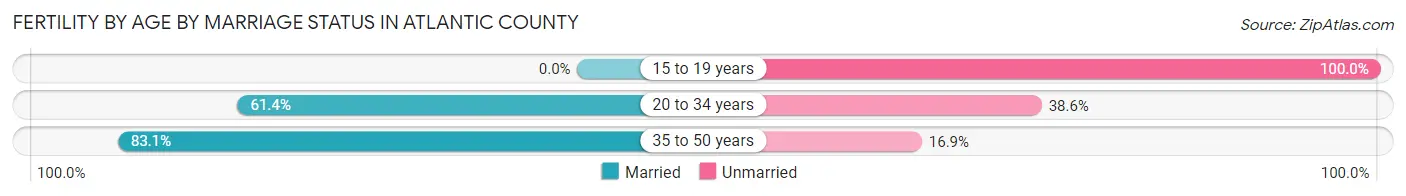
| Age Bracket | Married | Unmarried |
| 15 to 19 years | 0 (0.0%) | 154 (100.0%) |
| 20 to 34 years | 1,653 (61.4%) | 1,039 (38.6%) |
| 35 to 50 years | 689 (83.1%) | 140 (16.9%) |
| Total | 2,341 (63.7%) | 1,334 (36.3%) |
Fertility by Education in Atlantic County
Average fertility rate in Atlantic County is 61.0 births per 1,000 women. Women with the education attainment of high school diploma have the highest fertility rate of 79.0 births per 1,000 women, while women with the education attainment of less than high school have the lowest fertility at 36.0 births per 1,000 women. Women with the education attainment of college or associate's degree represent 30.4% of all women with births.
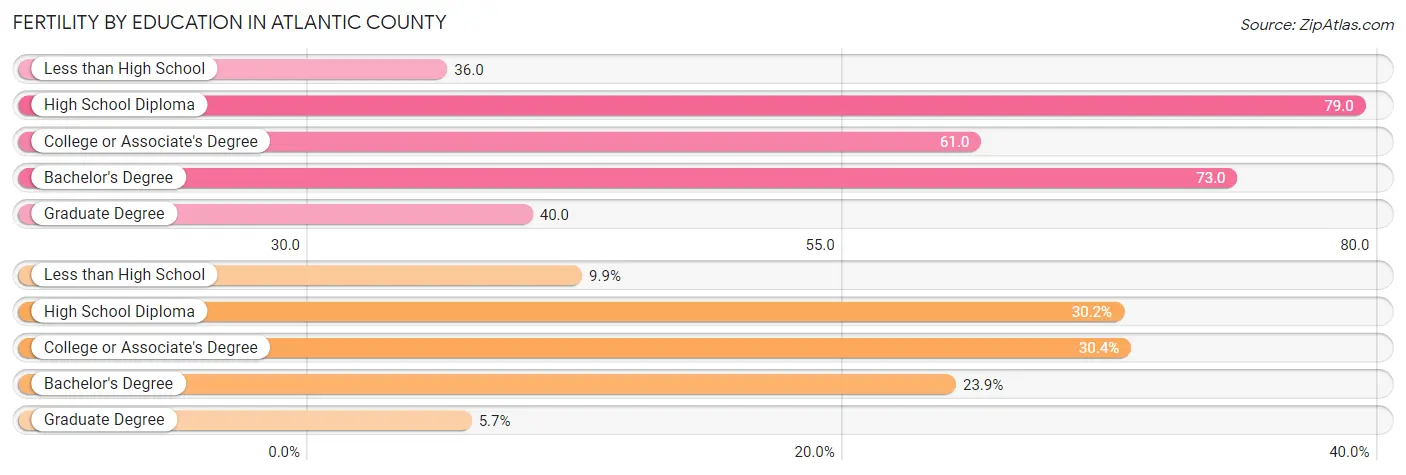
| Educational Attainment | Women with Births | Births / 1,000 Women |
| Less than High School | 362 (9.9%) | 36.0 |
| High School Diploma | 1,108 (30.1%) | 79.0 |
| College or Associate's Degree | 1,118 (30.4%) | 61.0 |
| Bachelor's Degree | 877 (23.9%) | 73.0 |
| Graduate Degree | 210 (5.7%) | 40.0 |
| Total | 3,675 (100.0%) | 61.0 |
Fertility by Education by Marriage Status in Atlantic County
36.3% of women with births in Atlantic County are unmarried. Women with the educational attainment of graduate degree are most likely to be married with 100.0% of them married at childbirth, while women with the educational attainment of high school diploma are least likely to be married with 54.6% of them unmarried at childbirth.
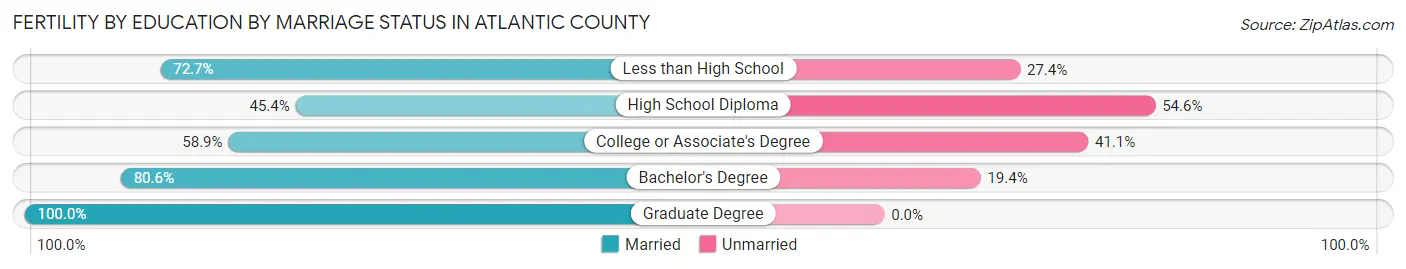
| Educational Attainment | Married | Unmarried |
| Less than High School | 263 (72.7%) | 99 (27.4%) |
| High School Diploma | 503 (45.4%) | 605 (54.6%) |
| College or Associate's Degree | 659 (58.9%) | 459 (41.1%) |
| Bachelor's Degree | 707 (80.6%) | 170 (19.4%) |
| Graduate Degree | 210 (100.0%) | 0 (0.0%) |
| Total | 2,341 (63.7%) | 1,334 (36.3%) |
Employment Characteristics in Atlantic County
Employment by Class of Employer in Atlantic County
Among the 126,468 employed individuals in Atlantic County, private company employees (86,404 | 68.3%), local government employees (12,220 | 9.7%), and not-for-profit organizations (8,944 | 7.1%) make up the most common classes of employment.
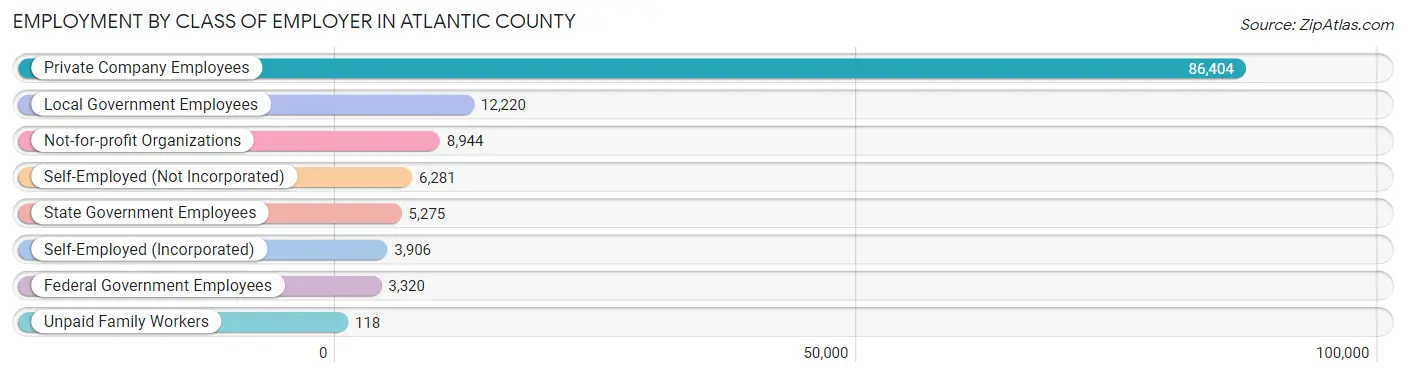
| Employer Class | # Employees | % Employees |
| Private Company Employees | 86,404 | 68.3% |
| Self-Employed (Incorporated) | 3,906 | 3.1% |
| Self-Employed (Not Incorporated) | 6,281 | 5.0% |
| Not-for-profit Organizations | 8,944 | 7.1% |
| Local Government Employees | 12,220 | 9.7% |
| State Government Employees | 5,275 | 4.2% |
| Federal Government Employees | 3,320 | 2.6% |
| Unpaid Family Workers | 118 | 0.1% |
| Total | 126,468 | 100.0% |
Employment Status by Age in Atlantic County
According to the labor force statistics for Atlantic County, out of the total population over 16 years of age (224,036), 63.3% or 141,815 individuals are in the labor force, with 8.3% or 11,771 of them unemployed. The age group with the highest labor force participation rate is 30 to 34 years, with 87.9% or 14,024 individuals in the labor force. Within the labor force, the 16 to 19 years age range has the highest percentage of unemployed individuals, with 18.9% or 1,220 of them being unemployed.
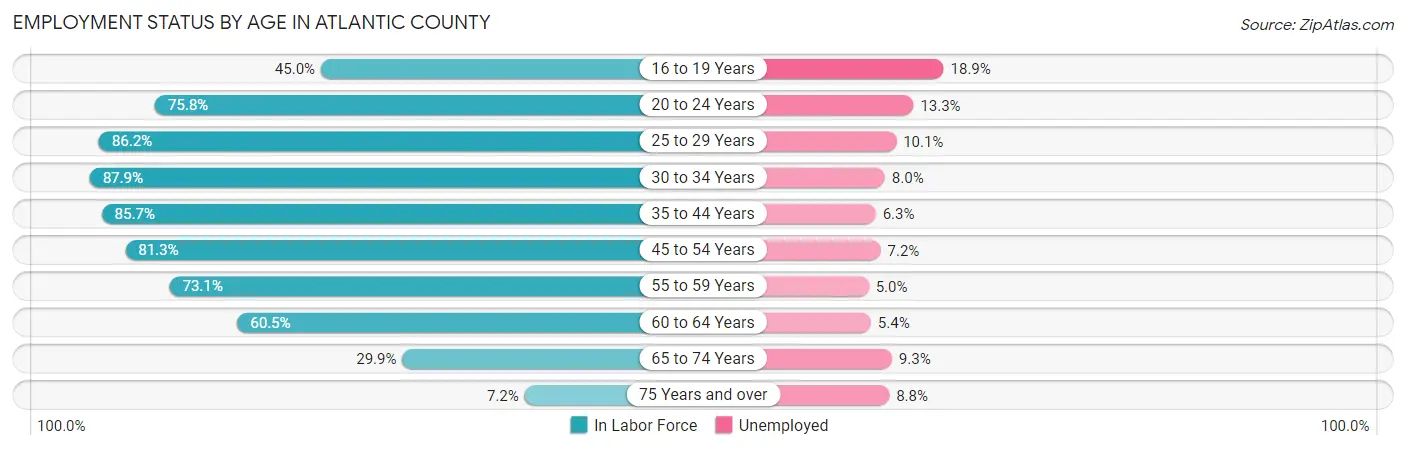
| Age Bracket | In Labor Force | Unemployed |
| 16 to 19 Years | 6,455 (45.0%) | 1,220 (18.9%) |
| 20 to 24 Years | 13,727 (75.8%) | 1,826 (13.3%) |
| 25 to 29 Years | 14,508 (86.2%) | 1,465 (10.1%) |
| 30 to 34 Years | 14,024 (87.9%) | 1,122 (8.0%) |
| 35 to 44 Years | 26,302 (85.7%) | 1,657 (6.3%) |
| 45 to 54 Years | 28,738 (81.3%) | 2,069 (7.2%) |
| 55 to 59 Years | 14,728 (73.1%) | 736 (5.0%) |
| 60 to 64 Years | 12,799 (60.5%) | 691 (5.4%) |
| 65 to 74 Years | 9,064 (29.9%) | 843 (9.3%) |
| 75 Years and over | 1,522 (7.2%) | 134 (8.8%) |
| Total | 141,815 (63.3%) | 11,771 (8.3%) |
Employment Status by Educational Attainment in Atlantic County
According to labor force statistics for Atlantic County, 79.3% of individuals (111,121) out of the total population between 25 and 64 years of age (140,127) are in the labor force, with 7.0% or 7,778 of them being unemployed. The group with the highest labor force participation rate are those with the educational attainment of bachelor's degree or higher, with 87.0% or 38,339 individuals in the labor force. Within the labor force, individuals with less than high school education have the highest percentage of unemployment, with 9.9% or 968 of them being unemployed.
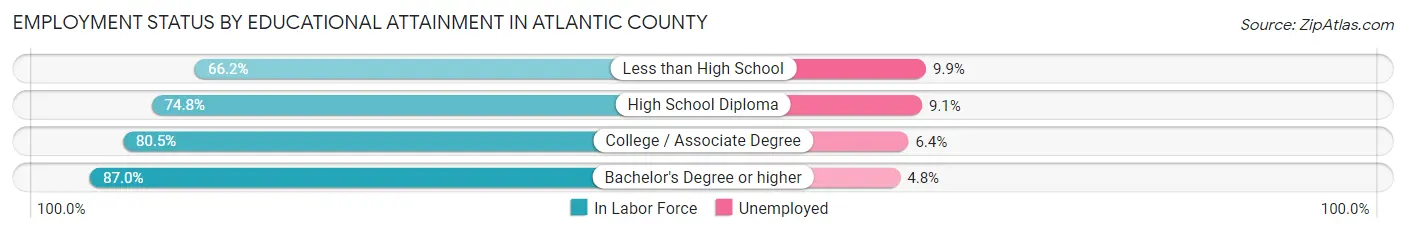
| Educational Attainment | In Labor Force | Unemployed |
| Less than High School | 9,774 (66.2%) | 1,462 (9.9%) |
| High School Diploma | 32,860 (74.8%) | 3,998 (9.1%) |
| College / Associate Degree | 30,078 (80.5%) | 2,391 (6.4%) |
| Bachelor's Degree or higher | 38,339 (87.0%) | 2,115 (4.8%) |
| Total | 111,121 (79.3%) | 9,809 (7.0%) |
Employment Occupations by Sex in Atlantic County
Management, Business, Science and Arts Occupations
The most common Management, Business, Science and Arts occupations in Atlantic County are Community & Social Service (15,149 | 11.7%), Management (10,938 | 8.4%), Education Instruction & Library (9,528 | 7.3%), Health Diagnosing & Treating (9,512 | 7.3%), and Health Technologists (6,121 | 4.7%).
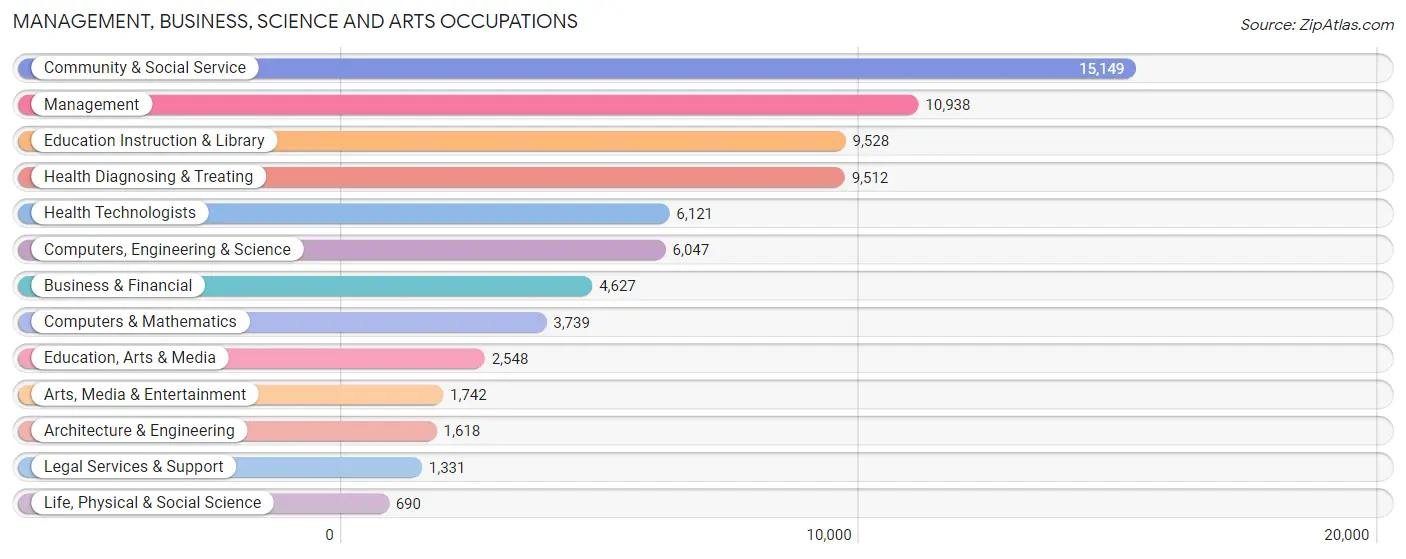
Management, Business, Science and Arts Occupations by Sex
Within the Management, Business, Science and Arts occupations in Atlantic County, the most male-oriented occupations are Architecture & Engineering (88.1%), Computers, Engineering & Science (75.5%), and Computers & Mathematics (73.6%), while the most female-oriented occupations are Education Instruction & Library (76.4%), Health Technologists (73.0%), and Health Diagnosing & Treating (72.1%).

| Occupation | Male | Female |
| Management | 6,357 (58.1%) | 4,581 (41.9%) |
| Business & Financial | 2,032 (43.9%) | 2,595 (56.1%) |
| Computers, Engineering & Science | 4,566 (75.5%) | 1,481 (24.5%) |
| Computers & Mathematics | 2,751 (73.6%) | 988 (26.4%) |
| Architecture & Engineering | 1,425 (88.1%) | 193 (11.9%) |
| Life, Physical & Social Science | 390 (56.5%) | 300 (43.5%) |
| Community & Social Service | 4,885 (32.3%) | 10,264 (67.7%) |
| Education, Arts & Media | 839 (32.9%) | 1,709 (67.1%) |
| Legal Services & Support | 768 (57.7%) | 563 (42.3%) |
| Education Instruction & Library | 2,244 (23.5%) | 7,284 (76.4%) |
| Arts, Media & Entertainment | 1,034 (59.4%) | 708 (40.6%) |
| Health Diagnosing & Treating | 2,653 (27.9%) | 6,859 (72.1%) |
| Health Technologists | 1,651 (27.0%) | 4,470 (73.0%) |
| Total (Category) | 20,493 (44.3%) | 25,780 (55.7%) |
| Total (Overall) | 66,613 (51.4%) | 62,998 (48.6%) |
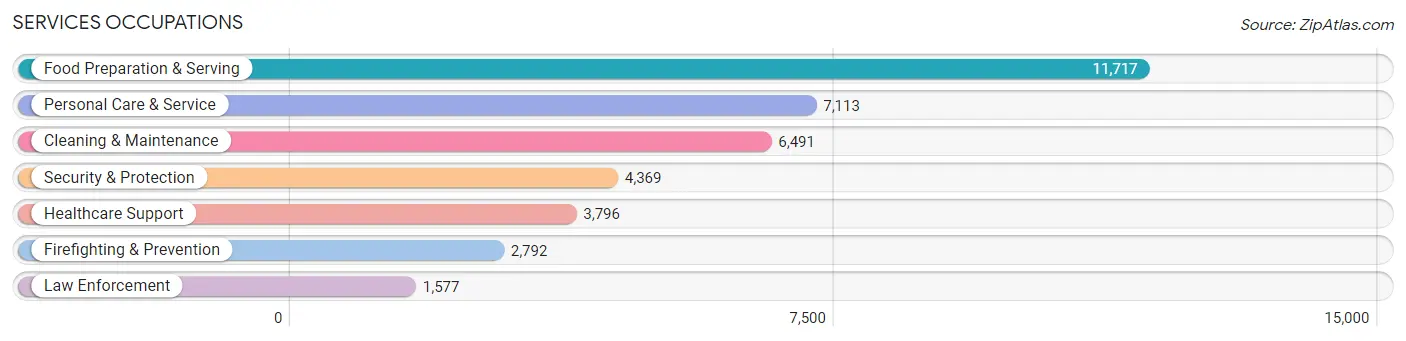
Services Occupations
The most common Services occupations in Atlantic County are Food Preparation & Serving (11,717 | 9.0%), Personal Care & Service (7,113 | 5.5%), Cleaning & Maintenance (6,491 | 5.0%), Security & Protection (4,369 | 3.4%), and Healthcare Support (3,796 | 2.9%).
Services Occupations by Sex
Within the Services occupations in Atlantic County, the most male-oriented occupations are Law Enforcement (90.3%), Security & Protection (82.8%), and Firefighting & Prevention (78.5%), while the most female-oriented occupations are Healthcare Support (88.2%), Personal Care & Service (57.5%), and Food Preparation & Serving (55.7%).

| Occupation | Male | Female |
| Healthcare Support | 449 (11.8%) | 3,347 (88.2%) |
| Security & Protection | 3,616 (82.8%) | 753 (17.2%) |
| Firefighting & Prevention | 2,192 (78.5%) | 600 (21.5%) |
| Law Enforcement | 1,424 (90.3%) | 153 (9.7%) |
| Food Preparation & Serving | 5,193 (44.3%) | 6,524 (55.7%) |
| Cleaning & Maintenance | 3,882 (59.8%) | 2,609 (40.2%) |
| Personal Care & Service | 3,023 (42.5%) | 4,090 (57.5%) |
| Total (Category) | 16,163 (48.3%) | 17,323 (51.7%) |
| Total (Overall) | 66,613 (51.4%) | 62,998 (48.6%) |
Sales and Office Occupations
The most common Sales and Office occupations in Atlantic County are Office & Administration (13,849 | 10.7%), and Sales & Related (13,358 | 10.3%).

Sales and Office Occupations by Sex

| Occupation | Male | Female |
| Sales & Related | 6,432 (48.1%) | 6,926 (51.8%) |
| Office & Administration | 3,669 (26.5%) | 10,180 (73.5%) |
| Total (Category) | 10,101 (37.1%) | 17,106 (62.9%) |
| Total (Overall) | 66,613 (51.4%) | 62,998 (48.6%) |
Natural Resources, Construction and Maintenance Occupations
The most common Natural Resources, Construction and Maintenance occupations in Atlantic County are Construction & Extraction (6,499 | 5.0%), Installation, Maintenance & Repair (3,236 | 2.5%), and Farming, Fishing & Forestry (254 | 0.2%).

Natural Resources, Construction and Maintenance Occupations by Sex

| Occupation | Male | Female |
| Farming, Fishing & Forestry | 254 (100.0%) | 0 (0.0%) |
| Construction & Extraction | 6,338 (97.5%) | 161 (2.5%) |
| Installation, Maintenance & Repair | 3,201 (98.9%) | 35 (1.1%) |
| Total (Category) | 9,793 (98.0%) | 196 (2.0%) |
| Total (Overall) | 66,613 (51.4%) | 62,998 (48.6%) |
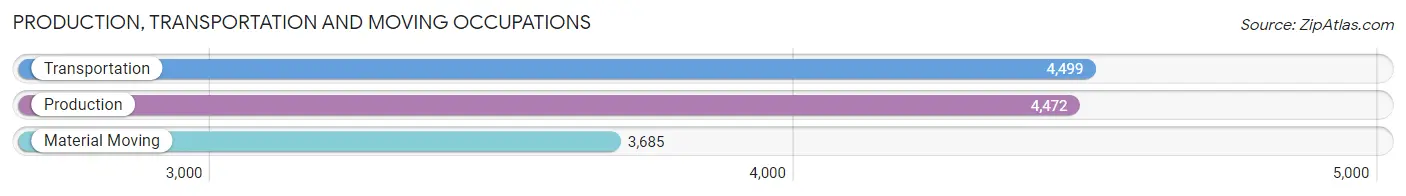
Production, Transportation and Moving Occupations
The most common Production, Transportation and Moving occupations in Atlantic County are Transportation (4,499 | 3.5%), Production (4,472 | 3.5%), and Material Moving (3,685 | 2.8%).
Production, Transportation and Moving Occupations by Sex

| Occupation | Male | Female |
| Production | 3,403 (76.1%) | 1,069 (23.9%) |
| Transportation | 3,774 (83.9%) | 725 (16.1%) |
| Material Moving | 2,886 (78.3%) | 799 (21.7%) |
| Total (Category) | 10,063 (79.5%) | 2,593 (20.5%) |
| Total (Overall) | 66,613 (51.4%) | 62,998 (48.6%) |
Employment Industries by Sex in Atlantic County
Employment Industries in Atlantic County
The major employment industries in Atlantic County include Health Care & Social Assistance (18,183 | 14.0%), Retail Trade (15,789 | 12.2%), Accommodation & Food Services (15,369 | 11.9%), Educational Services (13,120 | 10.1%), and Arts, Entertainment & Recreation (10,588 | 8.2%).

Employment Industries by Sex in Atlantic County
The Atlantic County industries that see more men than women are Mining, Quarrying, & Extraction (100.0%), Agriculture, Fishing & Hunting (92.5%), and Construction (91.1%), whereas the industries that tend to have a higher number of women are Health Care & Social Assistance (75.3%), Educational Services (73.4%), and Enterprise Management (64.5%).

| Industry | Male | Female |
| Agriculture, Fishing & Hunting | 410 (92.5%) | 33 (7.4%) |
| Mining, Quarrying, & Extraction | 3 (100.0%) | 0 (0.0%) |
| Construction | 7,459 (91.1%) | 730 (8.9%) |
| Manufacturing | 4,679 (76.6%) | 1,429 (23.4%) |
| Wholesale Trade | 1,578 (72.3%) | 606 (27.8%) |
| Retail Trade | 8,071 (51.1%) | 7,718 (48.9%) |
| Transportation & Warehousing | 3,649 (67.8%) | 1,729 (32.2%) |
| Utilities | 588 (75.7%) | 189 (24.3%) |
| Information | 1,076 (64.5%) | 592 (35.5%) |
| Finance & Insurance | 2,009 (45.5%) | 2,407 (54.5%) |
| Real Estate, Rental & Leasing | 956 (53.4%) | 835 (46.6%) |
| Professional & Scientific | 4,074 (51.5%) | 3,833 (48.5%) |
| Enterprise Management | 39 (35.4%) | 71 (64.5%) |
| Administrative & Support | 3,471 (67.7%) | 1,654 (32.3%) |
| Educational Services | 3,490 (26.6%) | 9,630 (73.4%) |
| Health Care & Social Assistance | 4,486 (24.7%) | 13,697 (75.3%) |
| Arts, Entertainment & Recreation | 6,143 (58.0%) | 4,445 (42.0%) |
| Accommodation & Food Services | 7,273 (47.3%) | 8,096 (52.7%) |
| Public Administration | 4,373 (63.9%) | 2,466 (36.1%) |
| Total | 66,613 (51.4%) | 62,998 (48.6%) |
Education in Atlantic County
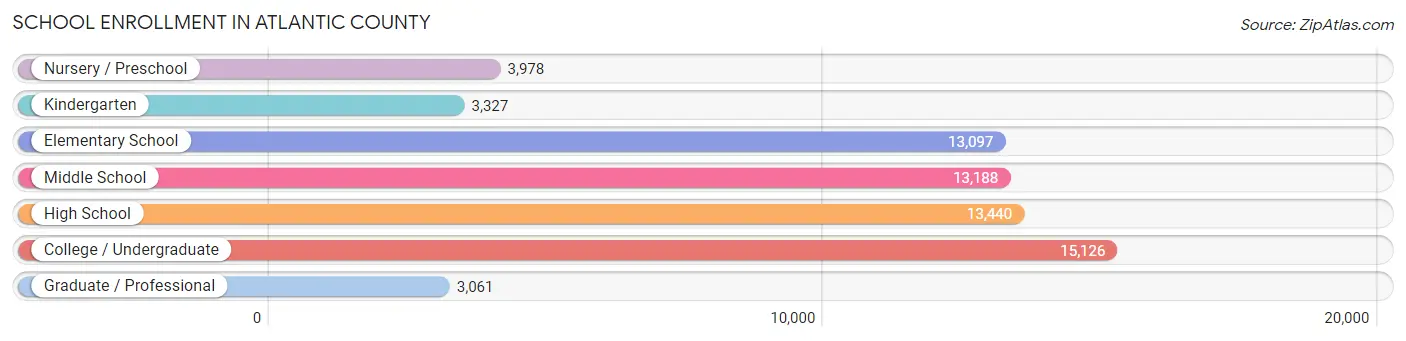
School Enrollment in Atlantic County
The most common levels of schooling among the 65,217 students in Atlantic County are college / undergraduate (15,126 | 23.2%), high school (13,440 | 20.6%), and middle school (13,188 | 20.2%).
| School Level | # Students | % Students |
| Nursery / Preschool | 3,978 | 6.1% |
| Kindergarten | 3,327 | 5.1% |
| Elementary School | 13,097 | 20.1% |
| Middle School | 13,188 | 20.2% |
| High School | 13,440 | 20.6% |
| College / Undergraduate | 15,126 | 23.2% |
| Graduate / Professional | 3,061 | 4.7% |
| Total | 65,217 | 100.0% |
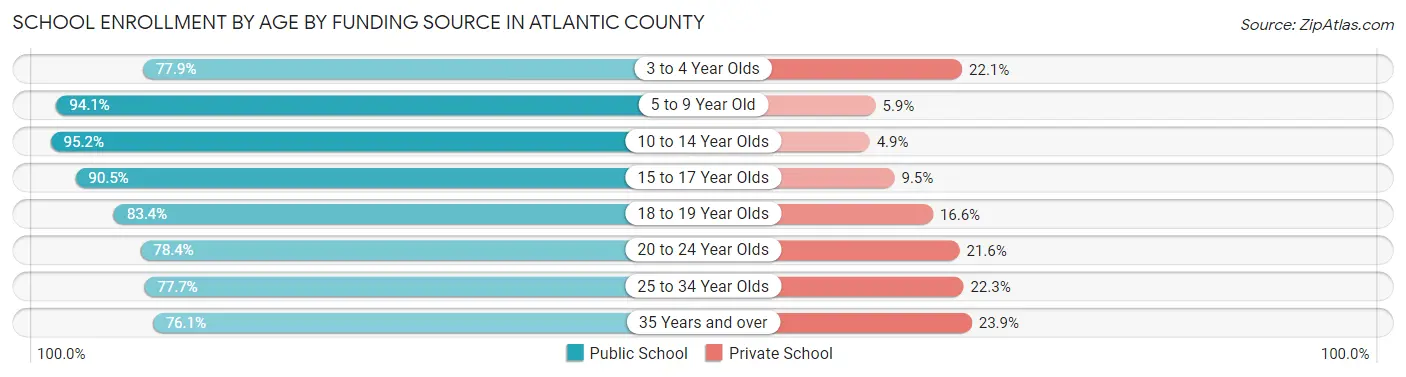
School Enrollment by Age by Funding Source in Atlantic County
Out of a total of 65,217 students who are enrolled in schools in Atlantic County, 7,565 (11.6%) attend a private institution, while the remaining 57,652 (88.4%) are enrolled in public schools. The age group of 35 years and over has the highest likelihood of being enrolled in private schools, with 802 (23.9% in the age bracket) enrolled. Conversely, the age group of 10 to 14 year olds has the lowest likelihood of being enrolled in a private school, with 16,082 (95.2% in the age bracket) attending a public institution.
| Age Bracket | Public School | Private School |
| 3 to 4 Year Olds | 2,650 (77.9%) | 750 (22.1%) |
| 5 to 9 Year Old | 14,093 (94.1%) | 888 (5.9%) |
| 10 to 14 Year Olds | 16,082 (95.2%) | 819 (4.9%) |
| 15 to 17 Year Olds | 9,067 (90.5%) | 949 (9.5%) |
| 18 to 19 Year Olds | 4,145 (83.4%) | 827 (16.6%) |
| 20 to 24 Year Olds | 6,244 (78.4%) | 1,718 (21.6%) |
| 25 to 34 Year Olds | 2,816 (77.7%) | 809 (22.3%) |
| 35 Years and over | 2,558 (76.1%) | 802 (23.9%) |
| Total | 57,652 (88.4%) | 7,565 (11.6%) |
Educational Attainment by Field of Study in Atlantic County
Business (11,797 | 19.0%), education (9,480 | 15.2%), science & technology (6,982 | 11.2%), arts & humanities (4,231 | 6.8%), and bio, nature & agricultural (4,112 | 6.6%) are the most common fields of study among 62,217 individuals in Atlantic County who have obtained a bachelor's degree or higher.
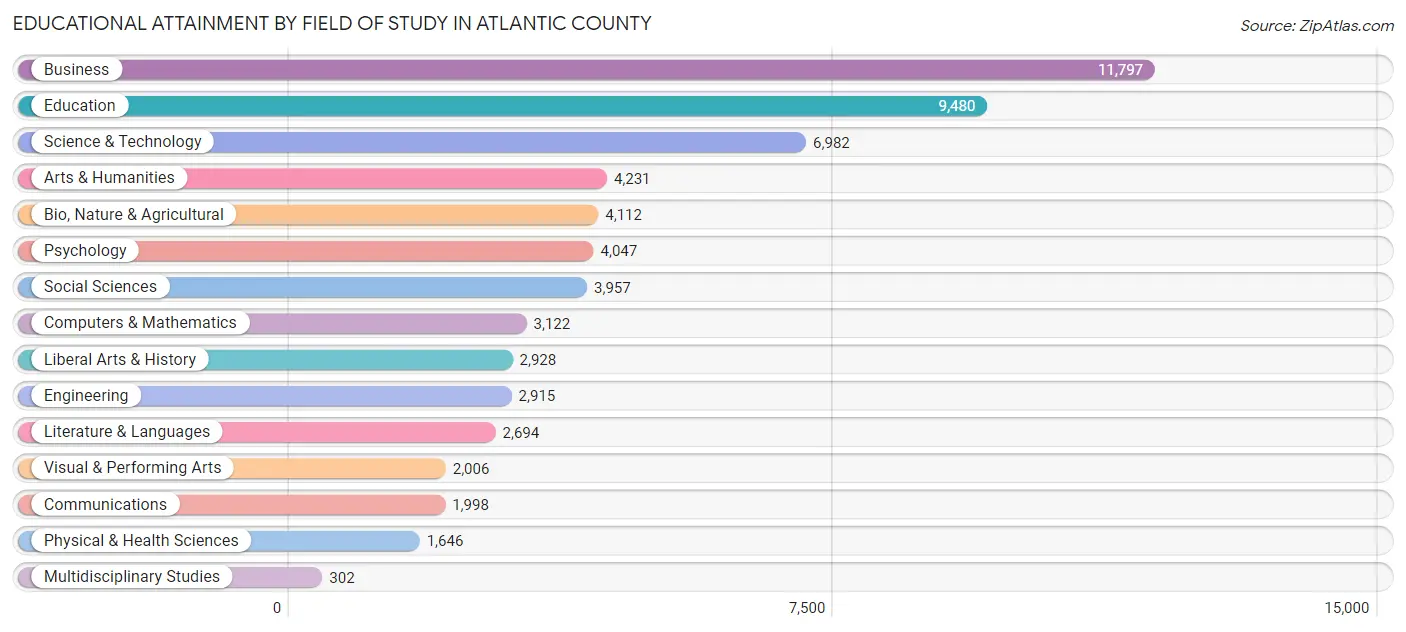
| Field of Study | # Graduates | % Graduates |
| Computers & Mathematics | 3,122 | 5.0% |
| Bio, Nature & Agricultural | 4,112 | 6.6% |
| Physical & Health Sciences | 1,646 | 2.6% |
| Psychology | 4,047 | 6.5% |
| Social Sciences | 3,957 | 6.4% |
| Engineering | 2,915 | 4.7% |
| Multidisciplinary Studies | 302 | 0.5% |
| Science & Technology | 6,982 | 11.2% |
| Business | 11,797 | 19.0% |
| Education | 9,480 | 15.2% |
| Literature & Languages | 2,694 | 4.3% |
| Liberal Arts & History | 2,928 | 4.7% |
| Visual & Performing Arts | 2,006 | 3.2% |
| Communications | 1,998 | 3.2% |
| Arts & Humanities | 4,231 | 6.8% |
| Total | 62,217 | 100.0% |
Transportation & Commute in Atlantic County
Vehicle Availability by Sex in Atlantic County
The most prevalent vehicle ownership categories in Atlantic County are males with 2 vehicles (25,604, accounting for 39.4%) and females with 2 vehicles (23,185, making up 42.5%).

| Vehicles Available | Male | Female |
| No Vehicle | 3,782 (5.8%) | 4,364 (7.2%) |
| 1 Vehicle | 13,143 (20.2%) | 14,005 (23.3%) |
| 2 Vehicles | 25,604 (39.4%) | 23,185 (38.5%) |
| 3 Vehicles | 14,134 (21.7%) | 11,877 (19.7%) |
| 4 Vehicles | 5,496 (8.5%) | 4,845 (8.0%) |
| 5 or more Vehicles | 2,828 (4.3%) | 1,968 (3.3%) |
| Total | 64,987 (100.0%) | 60,244 (100.0%) |
Commute Time in Atlantic County
The most frequently occuring commute durations in Atlantic County are 15 to 19 minutes (20,234 commuters, 17.2%), 20 to 24 minutes (19,524 commuters, 16.6%), and 10 to 14 minutes (16,392 commuters, 14.0%).

| Commute Time | # Commuters | % Commuters |
| Less than 5 Minutes | 3,372 | 2.9% |
| 5 to 9 Minutes | 11,620 | 9.9% |
| 10 to 14 Minutes | 16,392 | 14.0% |
| 15 to 19 Minutes | 20,234 | 17.2% |
| 20 to 24 Minutes | 19,524 | 16.6% |
| 25 to 29 Minutes | 9,357 | 8.0% |
| 30 to 34 Minutes | 14,327 | 12.2% |
| 35 to 39 Minutes | 2,437 | 2.1% |
| 40 to 44 Minutes | 4,158 | 3.5% |
| 45 to 59 Minutes | 6,803 | 5.8% |
| 60 to 89 Minutes | 5,503 | 4.7% |
| 90 or more Minutes | 3,644 | 3.1% |
Commute Time by Sex in Atlantic County
The most common commute times in Atlantic County are 20 to 24 minutes (10,449 commuters, 17.0%) for males and 15 to 19 minutes (10,276 commuters, 18.4%) for females.
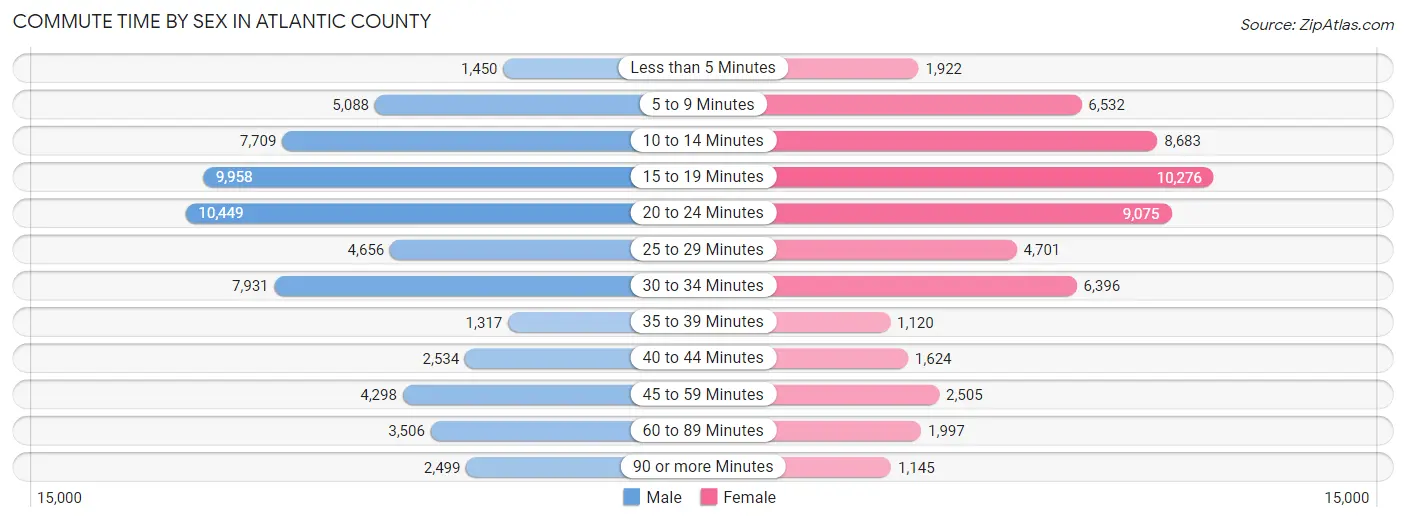
| Commute Time | Male | Female |
| Less than 5 Minutes | 1,450 (2.4%) | 1,922 (3.4%) |
| 5 to 9 Minutes | 5,088 (8.3%) | 6,532 (11.7%) |
| 10 to 14 Minutes | 7,709 (12.6%) | 8,683 (15.5%) |
| 15 to 19 Minutes | 9,958 (16.2%) | 10,276 (18.4%) |
| 20 to 24 Minutes | 10,449 (17.0%) | 9,075 (16.2%) |
| 25 to 29 Minutes | 4,656 (7.6%) | 4,701 (8.4%) |
| 30 to 34 Minutes | 7,931 (12.9%) | 6,396 (11.4%) |
| 35 to 39 Minutes | 1,317 (2.1%) | 1,120 (2.0%) |
| 40 to 44 Minutes | 2,534 (4.1%) | 1,624 (2.9%) |
| 45 to 59 Minutes | 4,298 (7.0%) | 2,505 (4.5%) |
| 60 to 89 Minutes | 3,506 (5.7%) | 1,997 (3.6%) |
| 90 or more Minutes | 2,499 (4.1%) | 1,145 (2.1%) |
Time of Departure to Work by Sex in Atlantic County
The most frequent times of departure to work in Atlantic County are 7:00 AM to 7:29 AM (8,165, 13.3%) for males and 8:00 AM to 8:29 AM (8,648, 15.4%) for females.

| Time of Departure | Male | Female |
| 12:00 AM to 4:59 AM | 3,381 (5.5%) | 1,331 (2.4%) |
| 5:00 AM to 5:29 AM | 2,679 (4.4%) | 1,030 (1.8%) |
| 5:30 AM to 5:59 AM | 2,499 (4.1%) | 955 (1.7%) |
| 6:00 AM to 6:29 AM | 5,271 (8.6%) | 3,220 (5.8%) |
| 6:30 AM to 6:59 AM | 5,292 (8.6%) | 4,296 (7.7%) |
| 7:00 AM to 7:29 AM | 8,165 (13.3%) | 6,200 (11.1%) |
| 7:30 AM to 7:59 AM | 6,470 (10.5%) | 7,170 (12.8%) |
| 8:00 AM to 8:29 AM | 5,493 (8.9%) | 8,648 (15.4%) |
| 8:30 AM to 8:59 AM | 3,455 (5.6%) | 4,169 (7.4%) |
| 9:00 AM to 9:59 AM | 3,772 (6.1%) | 4,160 (7.4%) |
| 10:00 AM to 10:59 AM | 2,599 (4.2%) | 2,317 (4.1%) |
| 11:00 AM to 11:59 AM | 1,472 (2.4%) | 1,263 (2.3%) |
| 12:00 PM to 3:59 PM | 5,229 (8.5%) | 6,067 (10.8%) |
| 4:00 PM to 11:59 PM | 5,618 (9.1%) | 5,150 (9.2%) |
| Total | 61,395 (100.0%) | 55,976 (100.0%) |
Housing Occupancy in Atlantic County
Occupancy by Ownership in Atlantic County
Of the total 106,640 dwellings in Atlantic County, owner-occupied units account for 72,378 (67.9%), while renter-occupied units make up 34,262 (32.1%).

| Occupancy | # Housing Units | % Housing Units |
| Owner Occupied Housing Units | 72,378 | 67.9% |
| Renter-Occupied Housing Units | 34,262 | 32.1% |
| Total Occupied Housing Units | 106,640 | 100.0% |
Occupancy by Household Size in Atlantic County

| Household Size | # Housing Units | % Housing Units |
| 1-Person Household | 30,600 | 28.7% |
| 2-Person Household | 35,134 | 33.0% |
| 3-Person Household | 16,647 | 15.6% |
| 4+ Person Household | 24,259 | 22.8% |
| Total Housing Units | 106,640 | 100.0% |
Occupancy by Ownership by Household Size in Atlantic County
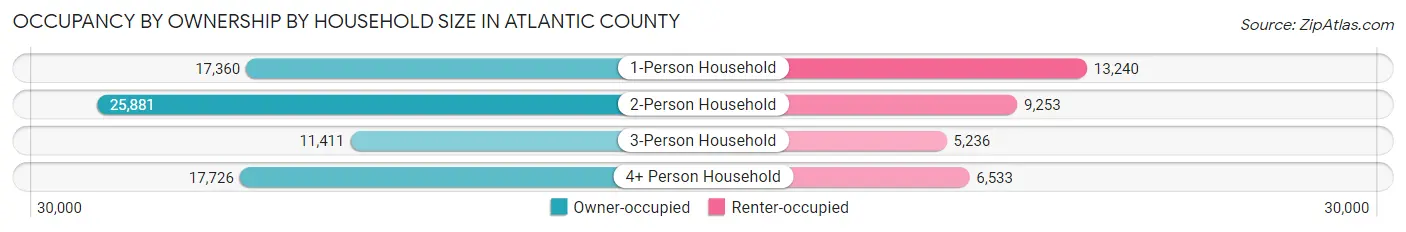
| Household Size | Owner-occupied | Renter-occupied |
| 1-Person Household | 17,360 (56.7%) | 13,240 (43.3%) |
| 2-Person Household | 25,881 (73.7%) | 9,253 (26.3%) |
| 3-Person Household | 11,411 (68.5%) | 5,236 (31.5%) |
| 4+ Person Household | 17,726 (73.1%) | 6,533 (26.9%) |
| Total Housing Units | 72,378 (67.9%) | 34,262 (32.1%) |
Occupancy by Educational Attainment in Atlantic County

| Household Size | Owner-occupied | Renter-occupied |
| Less than High School | 4,617 (43.7%) | 5,955 (56.3%) |
| High School Diploma | 20,218 (62.7%) | 12,017 (37.3%) |
| College/Associate Degree | 20,007 (67.4%) | 9,689 (32.6%) |
| Bachelor's Degree or higher | 27,536 (80.7%) | 6,601 (19.3%) |
Occupancy by Age of Householder in Atlantic County
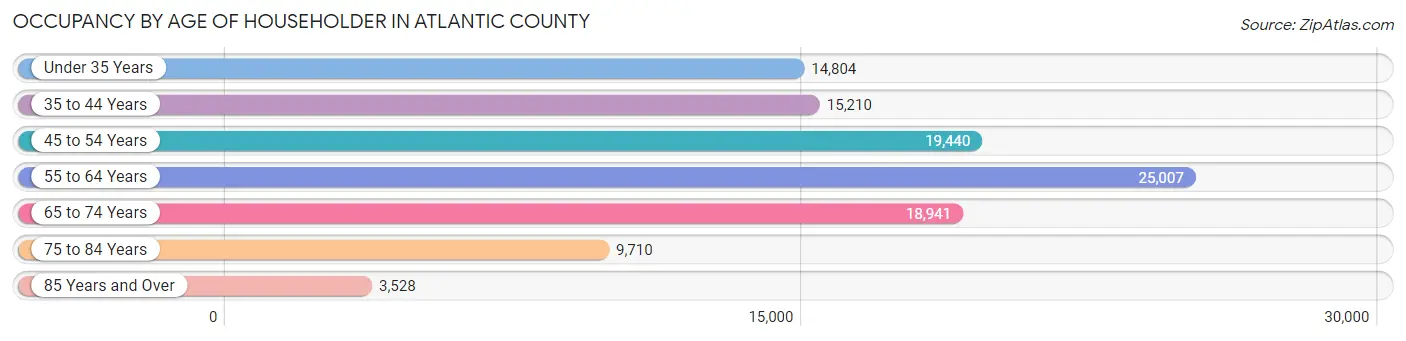
| Age Bracket | # Households | % Households |
| Under 35 Years | 14,804 | 13.9% |
| 35 to 44 Years | 15,210 | 14.3% |
| 45 to 54 Years | 19,440 | 18.2% |
| 55 to 64 Years | 25,007 | 23.4% |
| 65 to 74 Years | 18,941 | 17.8% |
| 75 to 84 Years | 9,710 | 9.1% |
| 85 Years and Over | 3,528 | 3.3% |
| Total | 106,640 | 100.0% |
Housing Finances in Atlantic County
Median Income by Occupancy in Atlantic County
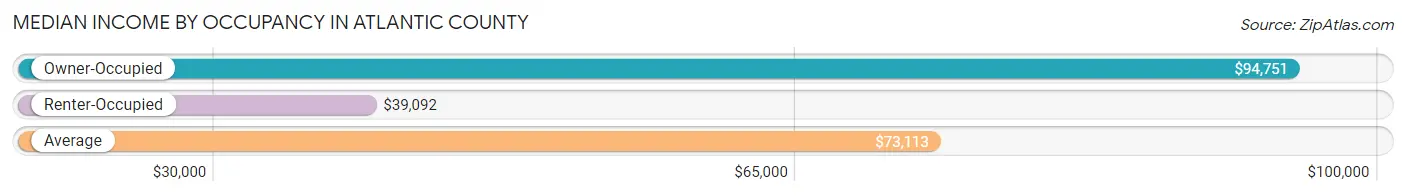
| Occupancy Type | # Households | Median Income |
| Owner-Occupied | 72,378 (67.9%) | $94,751 |
| Renter-Occupied | 34,262 (32.1%) | $39,092 |
| Average | 106,640 (100.0%) | $73,113 |
Occupancy by Householder Income Bracket in Atlantic County
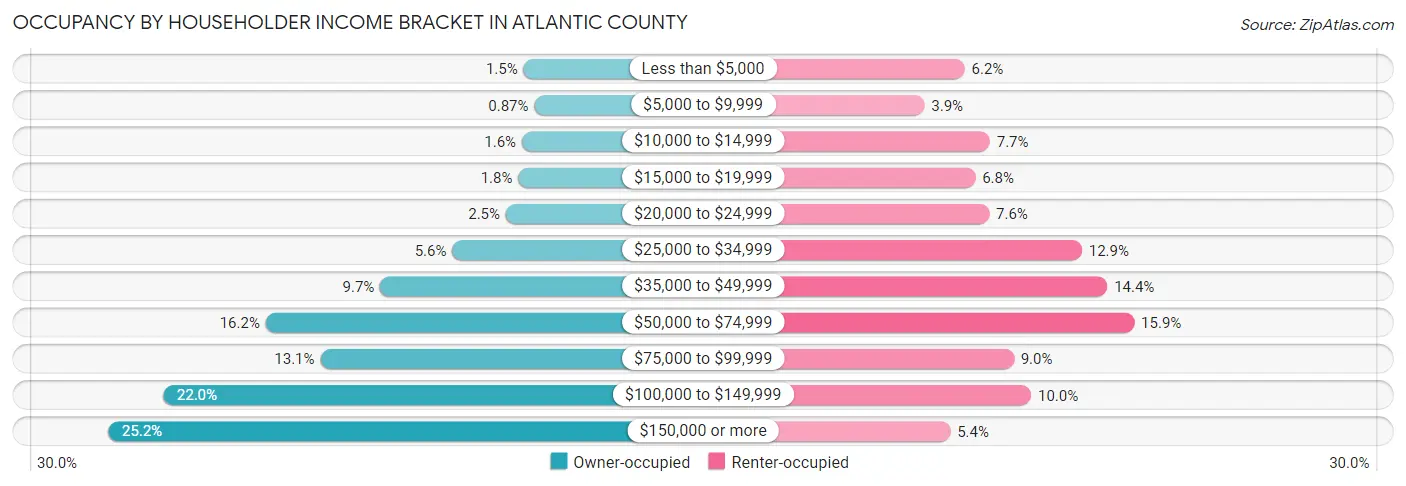
| Income Bracket | Owner-occupied | Renter-occupied |
| Less than $5,000 | 1,075 (1.5%) | 2,135 (6.2%) |
| $5,000 to $9,999 | 630 (0.9%) | 1,345 (3.9%) |
| $10,000 to $14,999 | 1,147 (1.6%) | 2,627 (7.7%) |
| $15,000 to $19,999 | 1,293 (1.8%) | 2,343 (6.8%) |
| $20,000 to $24,999 | 1,806 (2.5%) | 2,615 (7.6%) |
| $25,000 to $34,999 | 4,023 (5.6%) | 4,430 (12.9%) |
| $35,000 to $49,999 | 7,009 (9.7%) | 4,927 (14.4%) |
| $50,000 to $74,999 | 11,737 (16.2%) | 5,455 (15.9%) |
| $75,000 to $99,999 | 9,483 (13.1%) | 3,097 (9.0%) |
| $100,000 to $149,999 | 15,953 (22.0%) | 3,436 (10.0%) |
| $150,000 or more | 18,222 (25.2%) | 1,852 (5.4%) |
| Total | 72,378 (100.0%) | 34,262 (100.0%) |
Monthly Housing Cost Tiers in Atlantic County
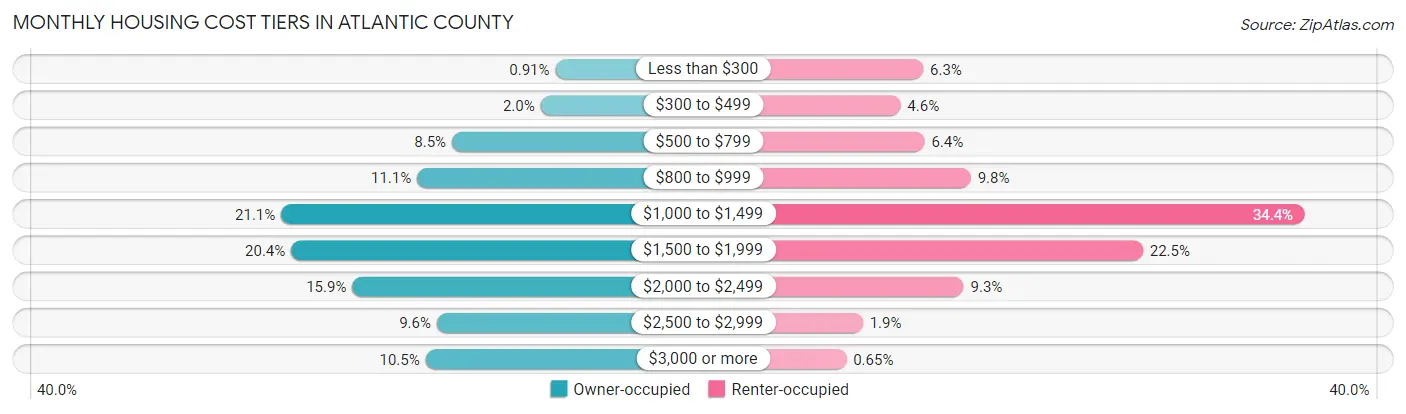
| Monthly Cost | Owner-occupied | Renter-occupied |
| Less than $300 | 656 (0.9%) | 2,161 (6.3%) |
| $300 to $499 | 1,448 (2.0%) | 1,589 (4.6%) |
| $500 to $799 | 6,176 (8.5%) | 2,195 (6.4%) |
| $800 to $999 | 8,034 (11.1%) | 3,365 (9.8%) |
| $1,000 to $1,499 | 15,280 (21.1%) | 11,797 (34.4%) |
| $1,500 to $1,999 | 14,744 (20.4%) | 7,707 (22.5%) |
| $2,000 to $2,499 | 11,485 (15.9%) | 3,184 (9.3%) |
| $2,500 to $2,999 | 6,978 (9.6%) | 638 (1.9%) |
| $3,000 or more | 7,577 (10.5%) | 223 (0.6%) |
| Total | 72,378 (100.0%) | 34,262 (100.0%) |
Physical Housing Characteristics in Atlantic County
Housing Structures in Atlantic County

| Structure Type | # Housing Units | % Housing Units |
| Single Unit, Detached | 64,671 | 60.6% |
| Single Unit, Attached | 9,781 | 9.2% |
| 2 Unit Apartments | 4,913 | 4.6% |
| 3 or 4 Unit Apartments | 4,113 | 3.9% |
| 5 to 9 Unit Apartments | 4,972 | 4.7% |
| 10 or more Apartments | 14,818 | 13.9% |
| Mobile Home / Other | 3,372 | 3.2% |
| Total | 106,640 | 100.0% |
Housing Structures by Occupancy in Atlantic County

| Structure Type | Owner-occupied | Renter-occupied |
| Single Unit, Detached | 57,908 (89.5%) | 6,763 (10.5%) |
| Single Unit, Attached | 6,250 (63.9%) | 3,531 (36.1%) |
| 2 Unit Apartments | 1,126 (22.9%) | 3,787 (77.1%) |
| 3 or 4 Unit Apartments | 766 (18.6%) | 3,347 (81.4%) |
| 5 to 9 Unit Apartments | 642 (12.9%) | 4,330 (87.1%) |
| 10 or more Apartments | 2,898 (19.6%) | 11,920 (80.4%) |
| Mobile Home / Other | 2,788 (82.7%) | 584 (17.3%) |
| Total | 72,378 (67.9%) | 34,262 (32.1%) |
Housing Structures by Number of Rooms in Atlantic County
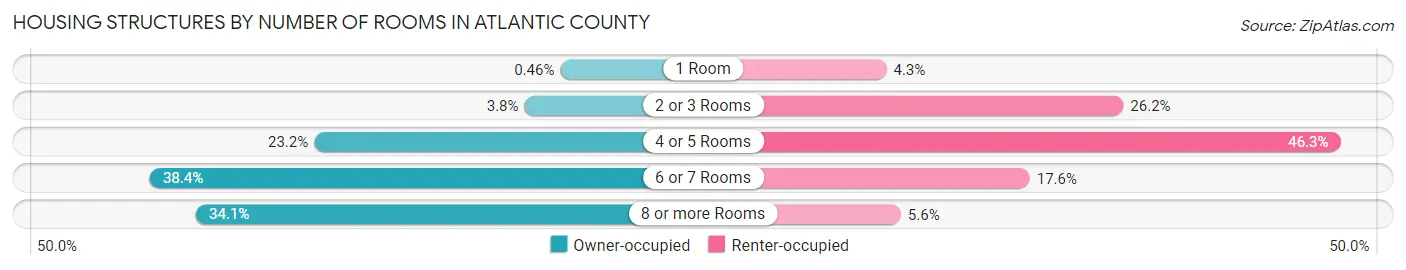
| Number of Rooms | Owner-occupied | Renter-occupied |
| 1 Room | 333 (0.5%) | 1,475 (4.3%) |
| 2 or 3 Rooms | 2,735 (3.8%) | 8,984 (26.2%) |
| 4 or 5 Rooms | 16,811 (23.2%) | 15,853 (46.3%) |
| 6 or 7 Rooms | 27,794 (38.4%) | 6,016 (17.6%) |
| 8 or more Rooms | 24,705 (34.1%) | 1,934 (5.6%) |
| Total | 72,378 (100.0%) | 34,262 (100.0%) |
Housing Structure by Heating Type in Atlantic County

| Heating Type | Owner-occupied | Renter-occupied |
| Utility Gas | 55,648 (76.9%) | 21,339 (62.3%) |
| Bottled, Tank, or LP Gas | 2,274 (3.1%) | 554 (1.6%) |
| Electricity | 7,255 (10.0%) | 9,981 (29.1%) |
| Fuel Oil or Kerosene | 5,245 (7.2%) | 1,432 (4.2%) |
| Coal or Coke | 0 (0.0%) | 0 (0.0%) |
| All other Fuels | 1,701 (2.4%) | 291 (0.9%) |
| No Fuel Used | 255 (0.4%) | 665 (1.9%) |
| Total | 72,378 (100.0%) | 34,262 (100.0%) |
Household Vehicle Usage in Atlantic County
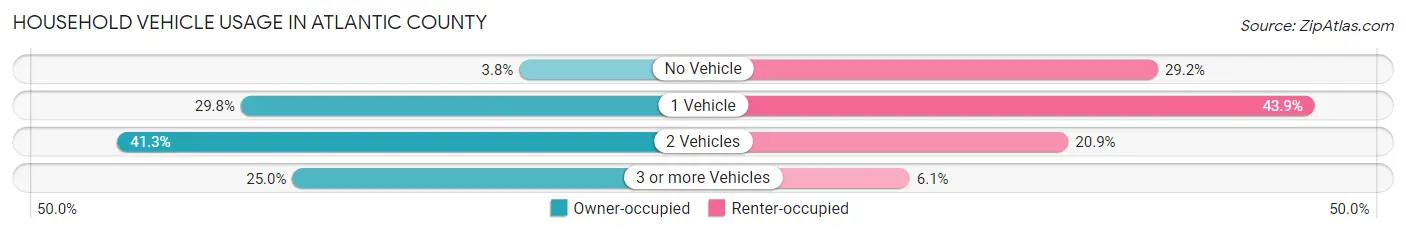
| Vehicles per Household | Owner-occupied | Renter-occupied |
| No Vehicle | 2,771 (3.8%) | 10,013 (29.2%) |
| 1 Vehicle | 21,586 (29.8%) | 15,024 (43.9%) |
| 2 Vehicles | 29,921 (41.3%) | 7,148 (20.9%) |
| 3 or more Vehicles | 18,100 (25.0%) | 2,077 (6.1%) |
| Total | 72,378 (100.0%) | 34,262 (100.0%) |
Real Estate & Mortgages in Atlantic County
Real Estate and Mortgage Overview in Atlantic County
| Characteristic | Without Mortgage | With Mortgage |
| Housing Units | 28,220 | 44,158 |
| Median Property Value | $237,300 | $264,000 |
| Median Household Income | $70,424 | $13,233 |
| Monthly Housing Costs | $969 | $7,376 |
| Real Estate Taxes | $6,482 | $1,179 |
Property Value by Mortgage Status in Atlantic County
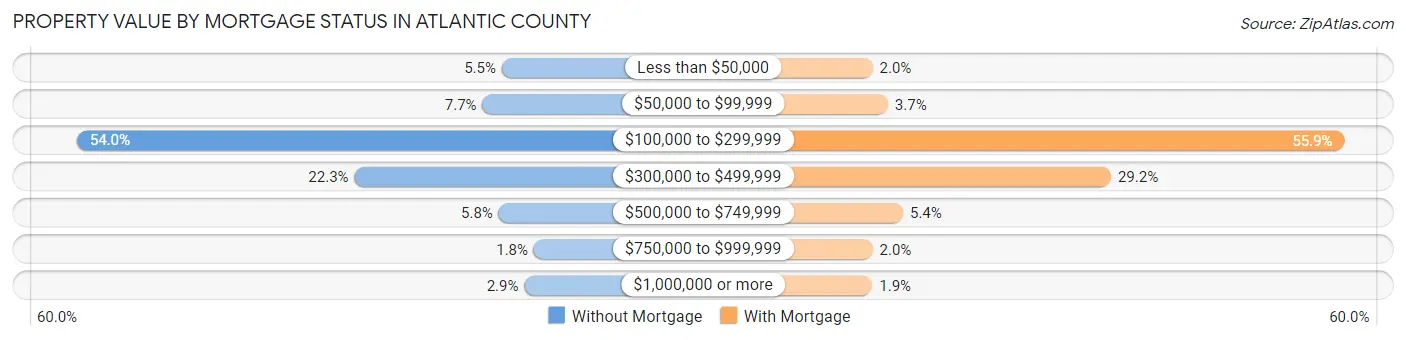
| Property Value | Without Mortgage | With Mortgage |
| Less than $50,000 | 1,541 (5.5%) | 861 (1.9%) |
| $50,000 to $99,999 | 2,167 (7.7%) | 1,633 (3.7%) |
| $100,000 to $299,999 | 15,248 (54.0%) | 24,671 (55.9%) |
| $300,000 to $499,999 | 6,297 (22.3%) | 12,888 (29.2%) |
| $500,000 to $749,999 | 1,643 (5.8%) | 2,397 (5.4%) |
| $750,000 to $999,999 | 508 (1.8%) | 861 (1.9%) |
| $1,000,000 or more | 816 (2.9%) | 847 (1.9%) |
| Total | 28,220 (100.0%) | 44,158 (100.0%) |
Household Income by Mortgage Status in Atlantic County
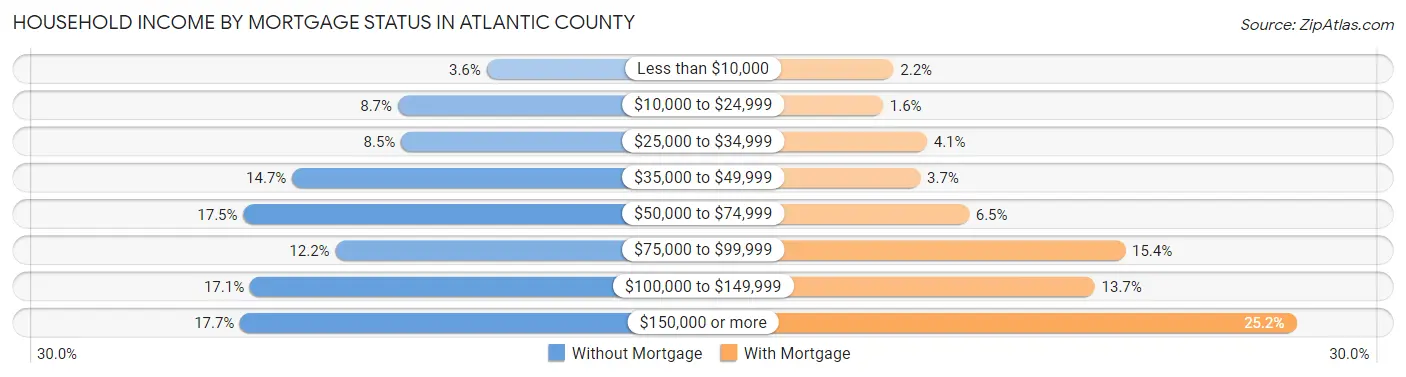
| Household Income | Without Mortgage | With Mortgage |
| Less than $10,000 | 1,016 (3.6%) | 954 (2.2%) |
| $10,000 to $24,999 | 2,448 (8.7%) | 689 (1.6%) |
| $25,000 to $34,999 | 2,392 (8.5%) | 1,798 (4.1%) |
| $35,000 to $49,999 | 4,152 (14.7%) | 1,631 (3.7%) |
| $50,000 to $74,999 | 4,938 (17.5%) | 2,857 (6.5%) |
| $75,000 to $99,999 | 3,453 (12.2%) | 6,799 (15.4%) |
| $100,000 to $149,999 | 4,832 (17.1%) | 6,030 (13.7%) |
| $150,000 or more | 4,989 (17.7%) | 11,121 (25.2%) |
| Total | 28,220 (100.0%) | 44,158 (100.0%) |
Property Value to Household Income Ratio in Atlantic County
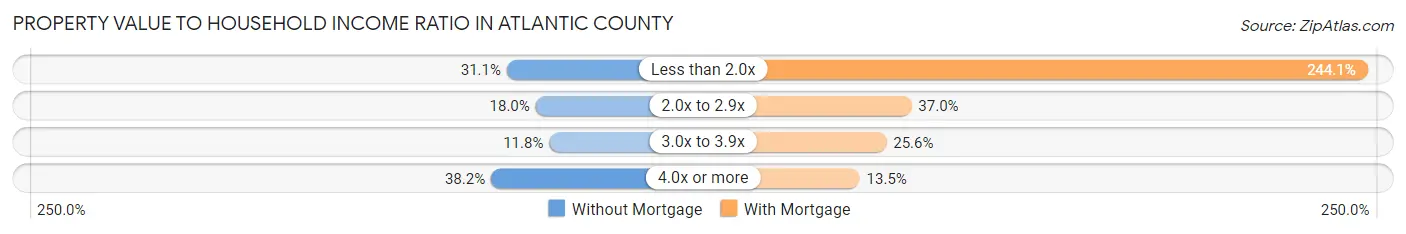
| Value-to-Income Ratio | Without Mortgage | With Mortgage |
| Less than 2.0x | 8,771 (31.1%) | 107,793 (244.1%) |
| 2.0x to 2.9x | 5,079 (18.0%) | 16,339 (37.0%) |
| 3.0x to 3.9x | 3,334 (11.8%) | 11,301 (25.6%) |
| 4.0x or more | 10,791 (38.2%) | 5,959 (13.5%) |
| Total | 28,220 (100.0%) | 44,158 (100.0%) |
Real Estate Taxes by Mortgage Status in Atlantic County
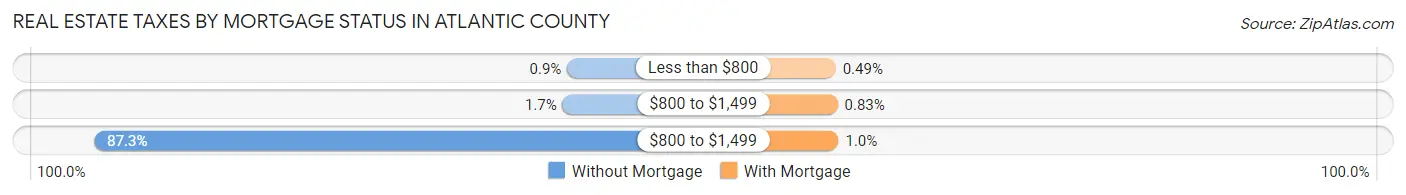
| Property Taxes | Without Mortgage | With Mortgage |
| Less than $800 | 254 (0.9%) | 216 (0.5%) |
| $800 to $1,499 | 490 (1.7%) | 366 (0.8%) |
| $800 to $1,499 | 24,638 (87.3%) | 440 (1.0%) |
| Total | 28,220 (100.0%) | 44,158 (100.0%) |
Health & Disability in Atlantic County
Health Insurance Coverage by Age in Atlantic County
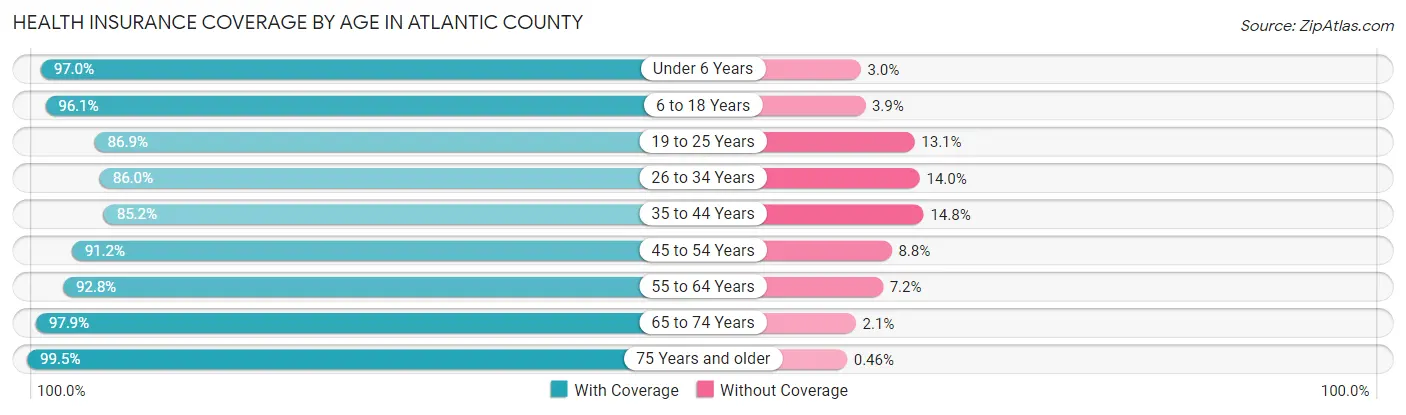
| Age Bracket | With Coverage | Without Coverage |
| Under 6 Years | 16,970 (97.0%) | 530 (3.0%) |
| 6 to 18 Years | 41,656 (96.1%) | 1,674 (3.9%) |
| 19 to 25 Years | 21,642 (86.9%) | 3,253 (13.1%) |
| 26 to 34 Years | 25,093 (86.0%) | 4,094 (14.0%) |
| 35 to 44 Years | 25,899 (85.2%) | 4,489 (14.8%) |
| 45 to 54 Years | 32,117 (91.2%) | 3,097 (8.8%) |
| 55 to 64 Years | 38,168 (92.8%) | 2,943 (7.2%) |
| 65 to 74 Years | 29,510 (97.9%) | 635 (2.1%) |
| 75 Years and older | 20,074 (99.5%) | 93 (0.5%) |
| Total | 251,129 (92.3%) | 20,808 (7.6%) |
Health Insurance Coverage by Citizenship Status in Atlantic County
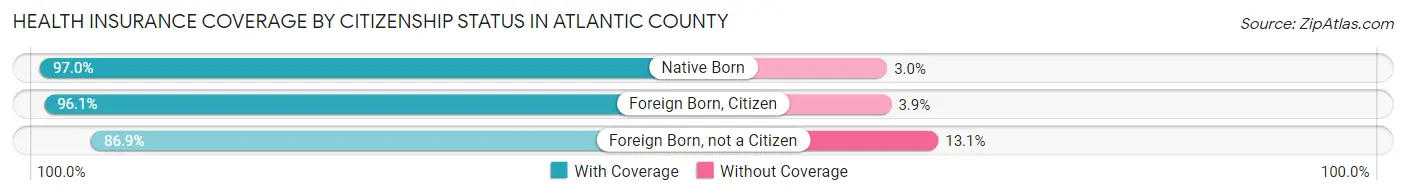
| Citizenship Status | With Coverage | Without Coverage |
| Native Born | 16,970 (97.0%) | 530 (3.0%) |
| Foreign Born, Citizen | 41,656 (96.1%) | 1,674 (3.9%) |
| Foreign Born, not a Citizen | 21,642 (86.9%) | 3,253 (13.1%) |
Health Insurance Coverage by Household Income in Atlantic County
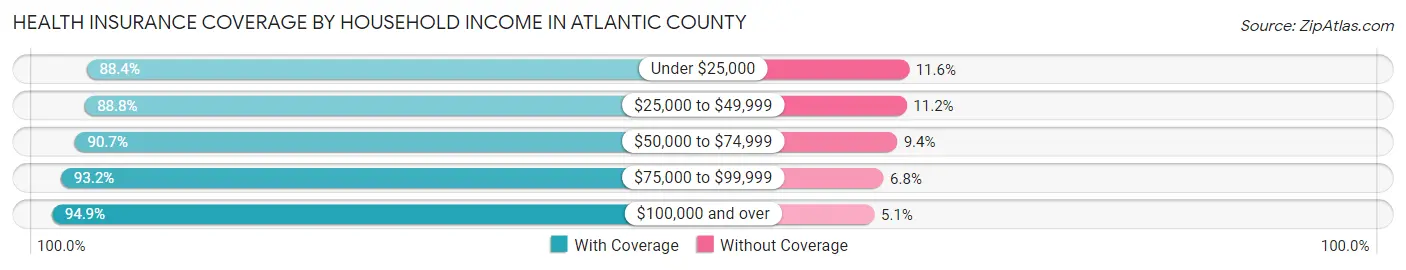
| Household Income | With Coverage | Without Coverage |
| Under $25,000 | 26,323 (88.4%) | 3,455 (11.6%) |
| $25,000 to $49,999 | 38,651 (88.8%) | 4,859 (11.2%) |
| $50,000 to $74,999 | 36,124 (90.6%) | 3,724 (9.3%) |
| $75,000 to $99,999 | 32,464 (93.2%) | 2,374 (6.8%) |
| $100,000 and over | 113,820 (94.9%) | 6,124 (5.1%) |
Public vs Private Health Insurance Coverage by Age in Atlantic County

| Age Bracket | Public Insurance | Private Insurance |
| Under 6 | 7,983 (45.6%) | 9,772 (55.8%) |
| 6 to 18 Years | 19,605 (45.3%) | 23,969 (55.3%) |
| 19 to 25 Years | 5,505 (22.1%) | 16,763 (67.3%) |
| 25 to 34 Years | 6,740 (23.1%) | 18,933 (64.9%) |
| 35 to 44 Years | 5,426 (17.9%) | 21,019 (69.2%) |
| 45 to 54 Years | 7,779 (22.1%) | 25,649 (72.8%) |
| 55 to 64 Years | 9,797 (23.8%) | 30,591 (74.4%) |
| 65 to 74 Years | 28,190 (93.5%) | 17,807 (59.1%) |
| 75 Years and over | 19,948 (98.9%) | 12,807 (63.5%) |
| Total | 110,973 (40.8%) | 177,310 (65.2%) |
Disability Status by Sex by Age in Atlantic County
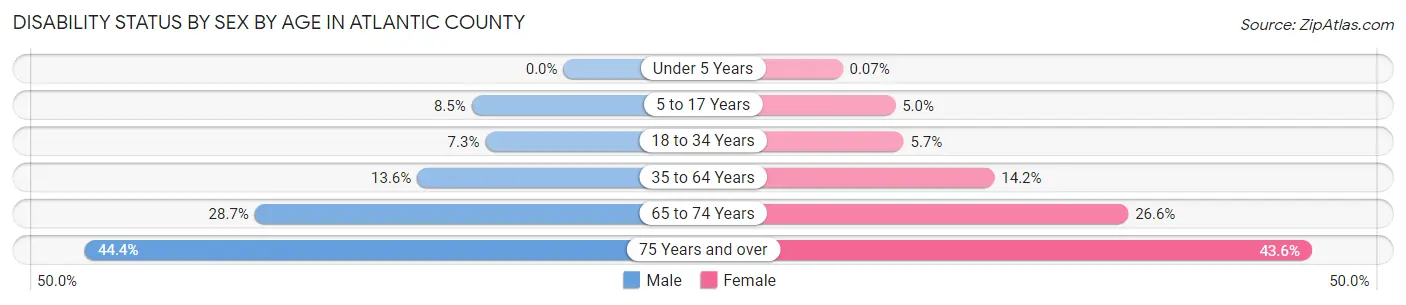
| Age Bracket | Male | Female |
| Under 5 Years | 0 (0.0%) | 5 (0.1%) |
| 5 to 17 Years | 1,887 (8.5%) | 1,039 (5.0%) |
| 18 to 34 Years | 2,085 (7.2%) | 1,640 (5.7%) |
| 35 to 64 Years | 6,984 (13.6%) | 7,827 (14.2%) |
| 65 to 74 Years | 4,090 (28.6%) | 4,218 (26.6%) |
| 75 Years and over | 3,732 (44.4%) | 5,127 (43.6%) |
Disability Class by Sex by Age in Atlantic County
Disability Class: Hearing Difficulty
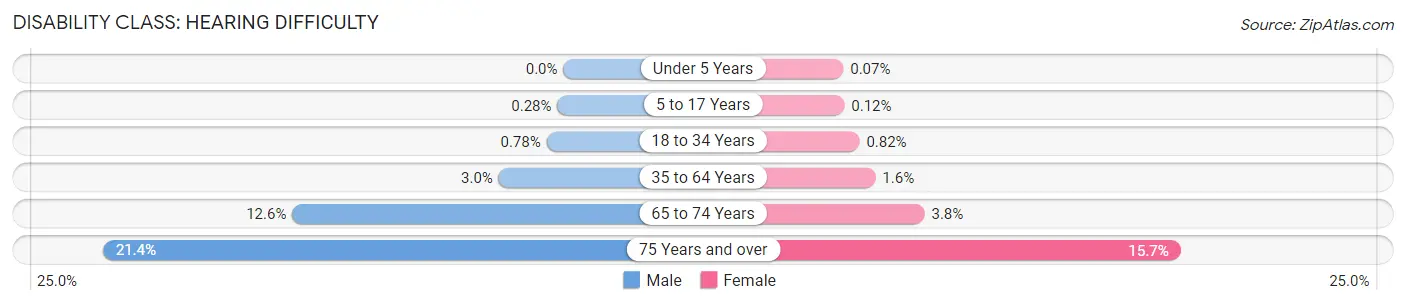
| Age Bracket | Male | Female |
| Under 5 Years | 0 (0.0%) | 5 (0.1%) |
| 5 to 17 Years | 62 (0.3%) | 25 (0.1%) |
| 18 to 34 Years | 224 (0.8%) | 234 (0.8%) |
| 35 to 64 Years | 1,542 (3.0%) | 861 (1.6%) |
| 65 to 74 Years | 1,796 (12.6%) | 610 (3.8%) |
| 75 Years and over | 1,797 (21.4%) | 1,848 (15.7%) |
Disability Class: Vision Difficulty

| Age Bracket | Male | Female |
| Under 5 Years | 0 (0.0%) | 5 (0.1%) |
| 5 to 17 Years | 138 (0.6%) | 124 (0.6%) |
| 18 to 34 Years | 278 (1.0%) | 518 (1.8%) |
| 35 to 64 Years | 1,561 (3.0%) | 1,584 (2.9%) |
| 65 to 74 Years | 746 (5.2%) | 1,029 (6.5%) |
| 75 Years and over | 857 (10.2%) | 887 (7.5%) |
Disability Class: Cognitive Difficulty
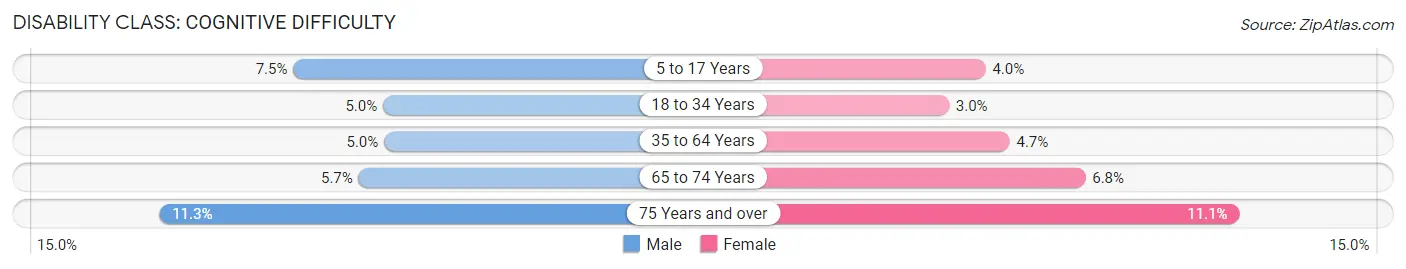
| Age Bracket | Male | Female |
| 5 to 17 Years | 1,665 (7.5%) | 839 (4.0%) |
| 18 to 34 Years | 1,445 (5.0%) | 854 (3.0%) |
| 35 to 64 Years | 2,568 (5.0%) | 2,581 (4.7%) |
| 65 to 74 Years | 814 (5.7%) | 1,076 (6.8%) |
| 75 Years and over | 946 (11.3%) | 1,301 (11.1%) |
Disability Class: Ambulatory Difficulty
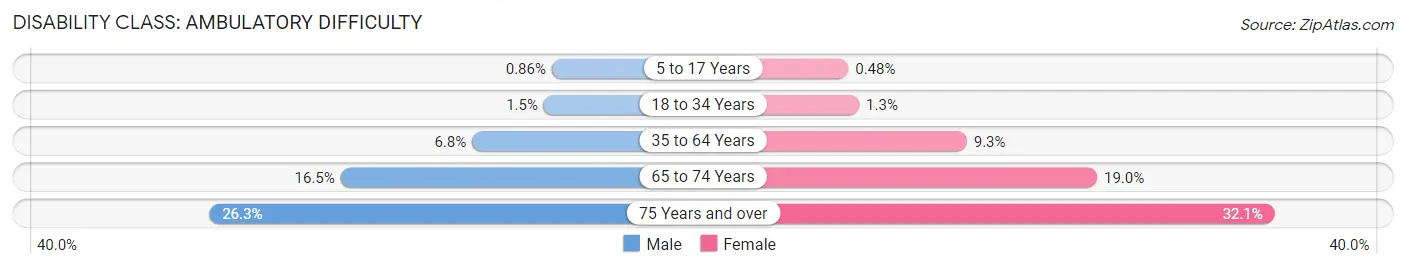
| Age Bracket | Male | Female |
| 5 to 17 Years | 191 (0.9%) | 101 (0.5%) |
| 18 to 34 Years | 417 (1.5%) | 368 (1.3%) |
| 35 to 64 Years | 3,491 (6.8%) | 5,127 (9.3%) |
| 65 to 74 Years | 2,362 (16.5%) | 3,007 (19.0%) |
| 75 Years and over | 2,211 (26.3%) | 3,779 (32.1%) |
Disability Class: Self-Care Difficulty
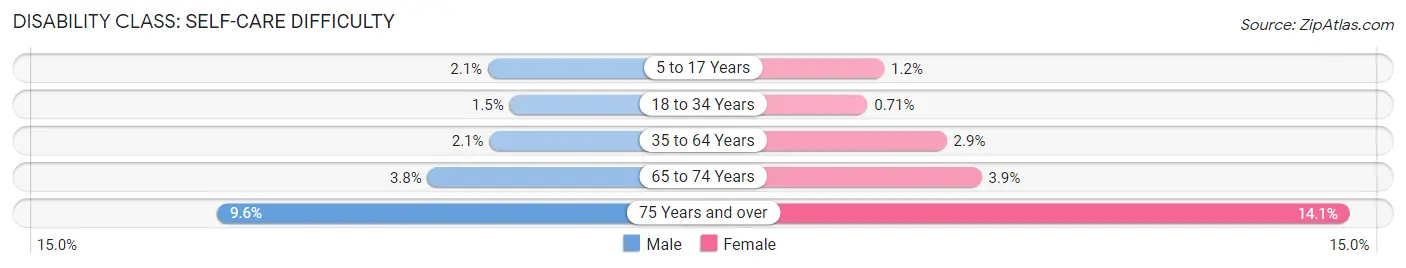
| Age Bracket | Male | Female |
| 5 to 17 Years | 466 (2.1%) | 247 (1.2%) |
| 18 to 34 Years | 432 (1.5%) | 204 (0.7%) |
| 35 to 64 Years | 1,059 (2.1%) | 1,611 (2.9%) |
| 65 to 74 Years | 539 (3.8%) | 617 (3.9%) |
| 75 Years and over | 811 (9.6%) | 1,662 (14.1%) |
Technology Access in Atlantic County
Computing Device Access in Atlantic County
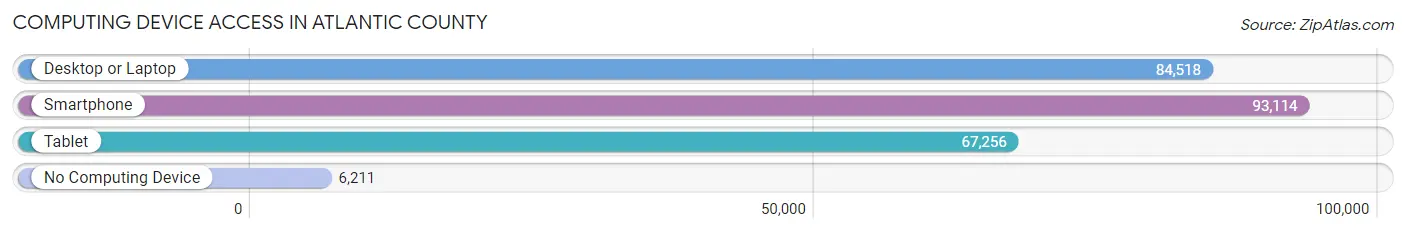
| Device Type | # Households | % Households |
| Desktop or Laptop | 84,518 | 79.3% |
| Smartphone | 93,114 | 87.3% |
| Tablet | 67,256 | 63.1% |
| No Computing Device | 6,211 | 5.8% |
| Total | 106,640 | 100.0% |
Internet Access in Atlantic County

| Internet Type | # Households | % Households |
| Dial-Up Internet | 313 | 0.3% |
| Broadband Home | 82,149 | 77.0% |
| Cellular Data Only | 10,908 | 10.2% |
| Satellite Internet | 4,348 | 4.1% |
| No Internet | 11,324 | 10.6% |
| Total | 106,640 | 100.0% |
Atlantic County Summary
Atlantic County, NJ is located in the southeastern part of the state, along the Atlantic Ocean. It is bordered by Cape May County to the south, Cumberland County to the west, and Ocean County to the east. Atlantic County is part of the Atlantic City-Hammonton Metropolitan Statistical Area, which includes Atlantic, Cape May, and Ocean counties. The county seat is Mays Landing.
History
Atlantic County was established in 1837 from portions of Gloucester and Cape May counties. It was named for the Atlantic Ocean, which borders the county to the east. The county was originally divided into three townships: Egg Harbor, Galloway, and Hamilton.
The county was home to the Lenni-Lenape Native Americans prior to European settlement. The first European settlers arrived in the area in the late 1600s. The county was an agricultural area until the mid-1800s, when the railroad arrived and the area began to develop.
In the late 1800s, Atlantic City became a popular resort destination, and the county’s population began to grow rapidly. The city was incorporated in 1854, and the county was officially established in 1837.
Geography
Atlantic County covers an area of 637 square miles, making it the third-largest county in New Jersey. The county is located in the Atlantic Coastal Plain region of the state, and is bordered by the Atlantic Ocean to the east. The county is divided into three townships: Egg Harbor, Galloway, and Hamilton.
The county is home to several bodies of water, including the Great Egg Harbor River, the Mullica River, and the Atlantic Ocean. The county also contains several parks, including the Edwin B. Forsythe National Wildlife Refuge, the Atlantic County Park, and the Atlantic County Veterans Memorial Park.
Economy
The economy of Atlantic County is largely based on tourism and gaming. Atlantic City is the county’s largest city and is home to several casinos, hotels, and other tourist attractions. The county is also home to several manufacturing and technology companies, as well as a growing number of small businesses.
The county’s unemployment rate was 5.2% in 2019, slightly lower than the state average of 5.3%. The median household income in the county was $63,845 in 2019, slightly higher than the state average of $62,843.
Demographics
As of the 2019 census, Atlantic County had a population of 274,549. The population is racially diverse, with the largest racial group being White (63.3%), followed by Black or African American (20.2%), Hispanic or Latino (10.2%), and Asian (4.2%).
The median age in the county is 42.3, slightly higher than the state average of 40.7. The largest age group is 45-54 (20.2%), followed by 35-44 (18.7%), 25-34 (17.2%), and 55-64 (15.7%).
The county is home to a large number of foreign-born residents, with the largest group being from India (7.2%), followed by Mexico (5.2%), and China (3.2%). The largest ancestry group in the county is German (17.2%), followed by Irish (14.2%), and Italian (10.2%).
Common Questions
What is Per Capita Income in Atlantic County?
Per Capita income in Atlantic County is $39,699.
What is the Median Family Income in Atlantic County?
Median Family Income in Atlantic County is $91,891.
What is the Median Household income in Atlantic County?
Median Household Income in Atlantic County is $73,113.
What is Income or Wage Gap in Atlantic County?
Income or Wage Gap in Atlantic County is 26.4%.
Women in Atlantic County earn 73.6 cents for every dollar earned by a man.
What is Family Income Deficit in Atlantic County?
Family Income Deficit in Atlantic County is $9,364.
Families that are below poverty line in Atlantic County earn $9,364 less on average than the poverty threshold level.
What is Inequality or Gini Index in Atlantic County?
Inequality or Gini Index in Atlantic County is 0.48.
What is the Total Population of Atlantic County?
Total Population of Atlantic County is 274,339.
What is the Total Male Population of Atlantic County?
Total Male Population of Atlantic County is 133,897.
What is the Total Female Population of Atlantic County?
Total Female Population of Atlantic County is 140,442.
What is the Ratio of Males per 100 Females in Atlantic County?
There are 95.34 Males per 100 Females in Atlantic County.
What is the Ratio of Females per 100 Males in Atlantic County?
There are 104.89 Females per 100 Males in Atlantic County.
What is the Median Population Age in Atlantic County?
Median Population Age in Atlantic County is 42.0 Years.
What is the Average Family Size in Atlantic County
Average Family Size in Atlantic County is 3.1 People.
What is the Average Household Size in Atlantic County
Average Household Size in Atlantic County is 2.5 People.
How Large is the Labor Force in Atlantic County?
There are 141,815 People in the Labor Forcein in Atlantic County.
What is the Percentage of People in the Labor Force in Atlantic County?
63.3% of People are in the Labor Force in Atlantic County.
What is the Unemployment Rate in Atlantic County?
Unemployment Rate in Atlantic County is 8.3%.