O Fallon, IL Map & Demographics
O Fallon Map
O Fallon Overview
$47,901
PER CAPITA INCOME
$123,695
AVG FAMILY INCOME
$102,560
AVG HOUSEHOLD INCOME
42.6%
WAGE / INCOME GAP [ % ]
57.4¢/ $1
WAGE / INCOME GAP [ $ ]
0.41
INEQUALITY / GINI INDEX
32,104
TOTAL POPULATION
15,732
MALE POPULATION
16,372
FEMALE POPULATION
96.09
MALES / 100 FEMALES
104.07
FEMALES / 100 MALES
37.3
MEDIAN AGE
3.1
AVG FAMILY SIZE
2.6
AVG HOUSEHOLD SIZE
16,030
LABOR FORCE [ PEOPLE ]
66.8%
PERCENT IN LABOR FORCE
3.6%
UNEMPLOYMENT RATE
O Fallon Zip Codes
O Fallon Area Codes
Income in O Fallon
Income Overview in O Fallon
Per Capita Income in O Fallon is $47,901, while median incomes of families and households are $123,695 and $102,560 respectively.
| Characteristic | Number | Measure |
| Per Capita Income | 32,104 | $47,901 |
| Median Family Income | 9,073 | $123,695 |
| Mean Family Income | 9,073 | $145,653 |
| Median Household Income | 12,093 | $102,560 |
| Mean Household Income | 12,093 | $125,549 |
| Income Deficit | 9,073 | $0 |
| Wage / Income Gap (%) | 32,104 | 42.59% |
| Wage / Income Gap ($) | 32,104 | 57.41¢ per $1 |
| Gini / Inequality Index | 32,104 | 0.41 |
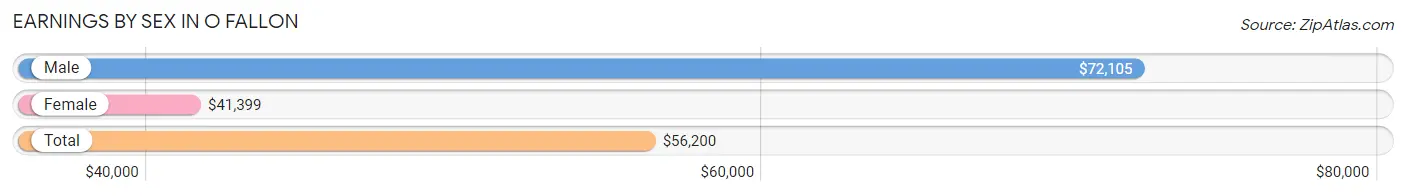
Earnings by Sex in O Fallon
Average Earnings in O Fallon are $56,200, $72,105 for men and $41,399 for women, a difference of 42.6%.
| Sex | Number | Average Earnings |
| Male | 9,079 (53.8%) | $72,105 |
| Female | 7,803 (46.2%) | $41,399 |
| Total | 16,882 (100.0%) | $56,200 |
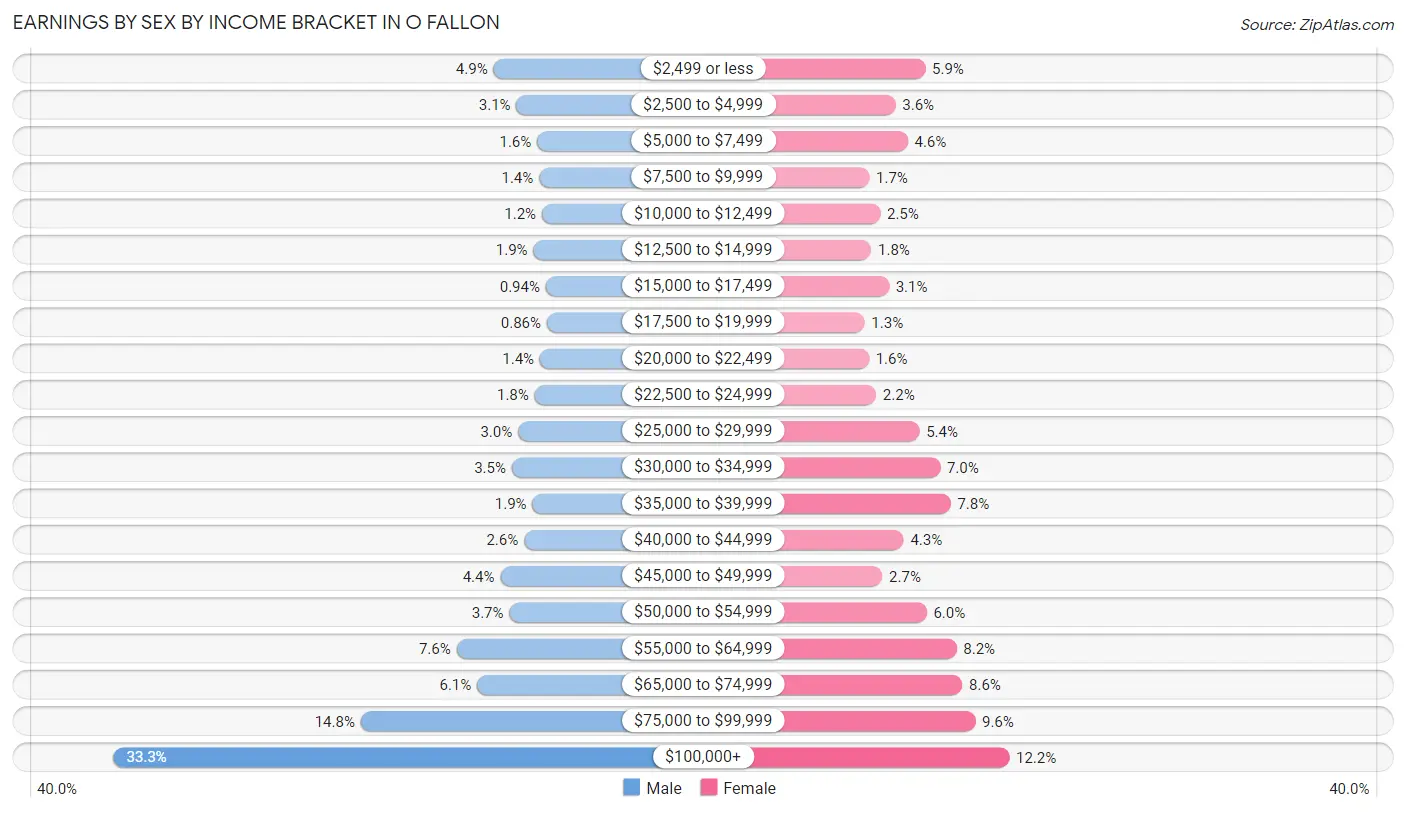
Earnings by Sex by Income Bracket in O Fallon
The most common earnings brackets in O Fallon are $100,000+ for men (3,027 | 33.3%) and $100,000+ for women (949 | 12.2%).
| Income | Male | Female |
| $2,499 or less | 441 (4.9%) | 458 (5.9%) |
| $2,500 to $4,999 | 285 (3.1%) | 284 (3.6%) |
| $5,000 to $7,499 | 144 (1.6%) | 355 (4.5%) |
| $7,500 to $9,999 | 131 (1.4%) | 130 (1.7%) |
| $10,000 to $12,499 | 112 (1.2%) | 194 (2.5%) |
| $12,500 to $14,999 | 170 (1.9%) | 142 (1.8%) |
| $15,000 to $17,499 | 85 (0.9%) | 245 (3.1%) |
| $17,500 to $19,999 | 78 (0.9%) | 103 (1.3%) |
| $20,000 to $22,499 | 125 (1.4%) | 128 (1.6%) |
| $22,500 to $24,999 | 162 (1.8%) | 170 (2.2%) |
| $25,000 to $29,999 | 274 (3.0%) | 424 (5.4%) |
| $30,000 to $34,999 | 317 (3.5%) | 545 (7.0%) |
| $35,000 to $39,999 | 176 (1.9%) | 606 (7.8%) |
| $40,000 to $44,999 | 233 (2.6%) | 332 (4.3%) |
| $45,000 to $49,999 | 395 (4.3%) | 207 (2.6%) |
| $50,000 to $54,999 | 333 (3.7%) | 466 (6.0%) |
| $55,000 to $64,999 | 693 (7.6%) | 641 (8.2%) |
| $65,000 to $74,999 | 553 (6.1%) | 674 (8.6%) |
| $75,000 to $99,999 | 1,345 (14.8%) | 750 (9.6%) |
| $100,000+ | 3,027 (33.3%) | 949 (12.2%) |
| Total | 9,079 (100.0%) | 7,803 (100.0%) |
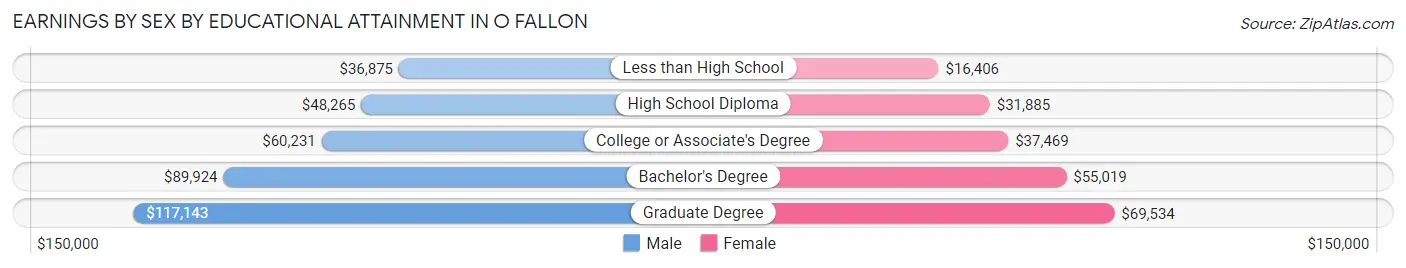
Earnings by Sex by Educational Attainment in O Fallon
Average earnings in O Fallon are $78,615 for men and $47,342 for women, a difference of 39.8%. Men with an educational attainment of graduate degree enjoy the highest average annual earnings of $117,143, while those with less than high school education earn the least with $36,875. Women with an educational attainment of graduate degree earn the most with the average annual earnings of $69,534, while those with less than high school education have the smallest earnings of $16,406.
| Educational Attainment | Male Income | Female Income |
| Less than High School | $36,875 | $16,406 |
| High School Diploma | $48,265 | $31,885 |
| College or Associate's Degree | $60,231 | $37,469 |
| Bachelor's Degree | $89,924 | $55,019 |
| Graduate Degree | $117,143 | $69,534 |
| Total | $78,615 | $47,342 |
Family Income in O Fallon
Family Income Brackets in O Fallon
According to the O Fallon family income data, there are 2,241 families falling into the $100,000 to $149,999 income range, which is the most common income bracket and makes up 24.7% of all families. Conversely, the $10,000 to $14,999 income bracket is the least frequent group with only 54 families (0.6%) belonging to this category.
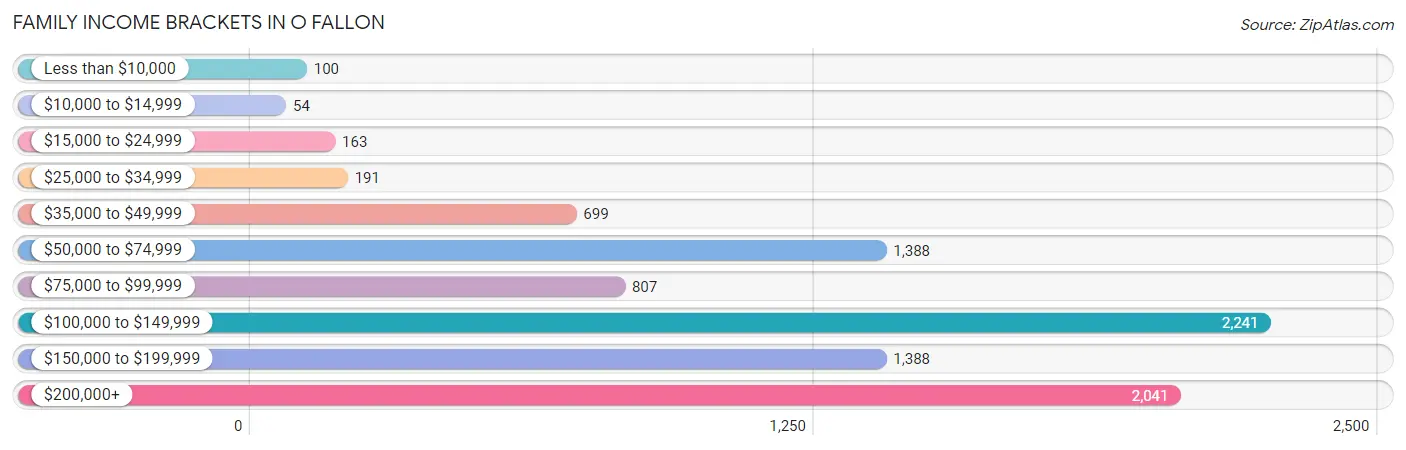
| Income Bracket | # Families | % Families |
| Less than $10,000 | 100 | 1.1% |
| $10,000 to $14,999 | 54 | 0.6% |
| $15,000 to $24,999 | 163 | 1.8% |
| $25,000 to $34,999 | 191 | 2.1% |
| $35,000 to $49,999 | 699 | 7.7% |
| $50,000 to $74,999 | 1,388 | 15.3% |
| $75,000 to $99,999 | 807 | 8.9% |
| $100,000 to $149,999 | 2,241 | 24.7% |
| $150,000 to $199,999 | 1,388 | 15.3% |
| $200,000+ | 2,041 | 22.5% |
Family Income by Famaliy Size in O Fallon
6-person families (322 | 3.5%) account for the highest median family income in O Fallon with $180,429 per family, while 2-person families (4,065 | 44.8%) have the highest median income of $54,287 per family member.
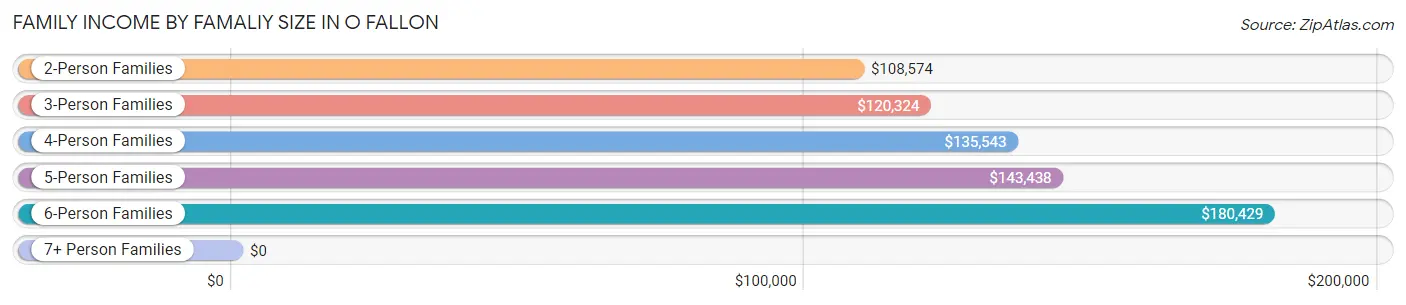
| Income Bracket | # Families | Median Income |
| 2-Person Families | 4,065 (44.8%) | $108,574 |
| 3-Person Families | 1,975 (21.8%) | $120,324 |
| 4-Person Families | 1,904 (21.0%) | $135,543 |
| 5-Person Families | 703 (7.7%) | $143,438 |
| 6-Person Families | 322 (3.5%) | $180,429 |
| 7+ Person Families | 104 (1.1%) | $0 |
| Total | 9,073 (100.0%) | $123,695 |
Family Income by Number of Earners in O Fallon
The median family income in O Fallon is $123,695, with families comprising 3+ earners (811) having the highest median family income of $198,295, while families with no earners (1,186) have the lowest median family income of $69,054, accounting for 8.9% and 13.1% of families, respectively.
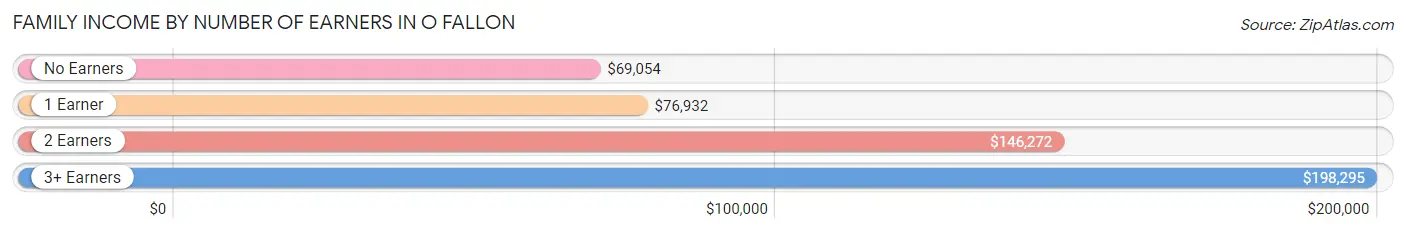
| Number of Earners | # Families | Median Income |
| No Earners | 1,186 (13.1%) | $69,054 |
| 1 Earner | 2,825 (31.1%) | $76,932 |
| 2 Earners | 4,251 (46.9%) | $146,272 |
| 3+ Earners | 811 (8.9%) | $198,295 |
| Total | 9,073 (100.0%) | $123,695 |
Household Income in O Fallon
Household Income Brackets in O Fallon
With 2,576 households falling in the category, the $100,000 to $149,999 income range is the most frequent in O Fallon, accounting for 21.3% of all households. In contrast, only 181 households (1.5%) fall into the $10,000 to $14,999 income bracket, making it the least populous group.
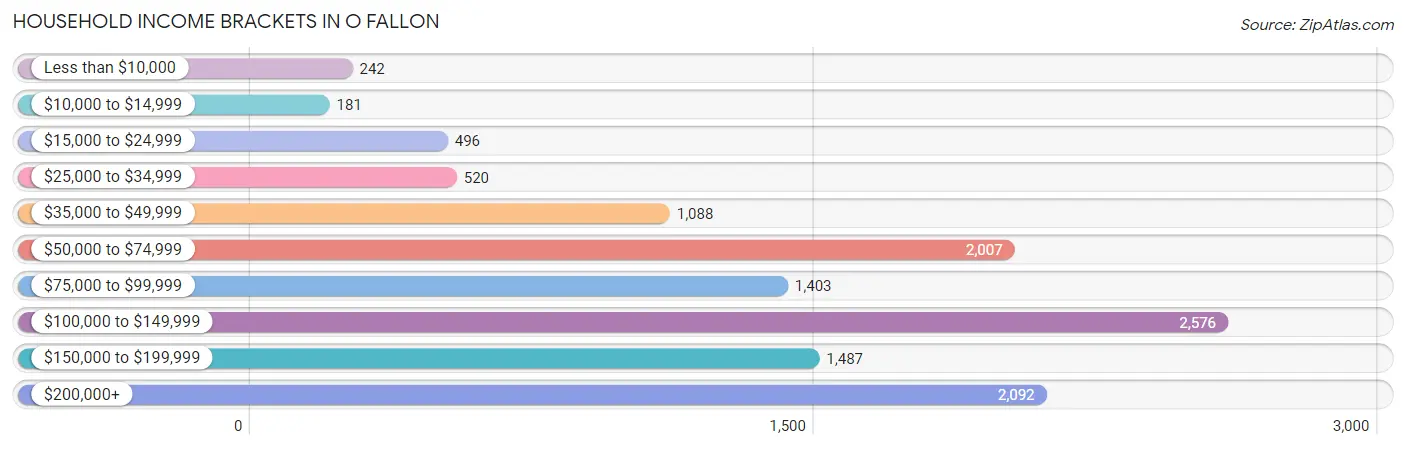
| Income Bracket | # Households | % Households |
| Less than $10,000 | 242 | 2.0% |
| $10,000 to $14,999 | 181 | 1.5% |
| $15,000 to $24,999 | 496 | 4.1% |
| $25,000 to $34,999 | 520 | 4.3% |
| $35,000 to $49,999 | 1,088 | 9.0% |
| $50,000 to $74,999 | 2,007 | 16.6% |
| $75,000 to $99,999 | 1,403 | 11.6% |
| $100,000 to $149,999 | 2,576 | 21.3% |
| $150,000 to $199,999 | 1,487 | 12.3% |
| $200,000+ | 2,092 | 17.3% |
Household Income by Householder Age in O Fallon
The median household income in O Fallon is $102,560, with the highest median household income of $151,667 found in the 45 to 64 years age bracket for the primary householder. A total of 4,304 households (35.6%) fall into this category. Meanwhile, the 15 to 24 years age bracket for the primary householder has the lowest median household income of $42,730, with 249 households (2.1%) in this group.
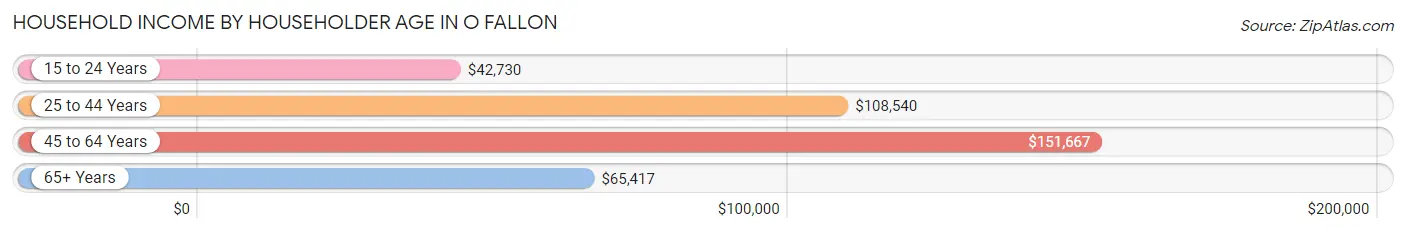
| Income Bracket | # Households | Median Income |
| 15 to 24 Years | 249 (2.1%) | $42,730 |
| 25 to 44 Years | 4,433 (36.7%) | $108,540 |
| 45 to 64 Years | 4,304 (35.6%) | $151,667 |
| 65+ Years | 3,107 (25.7%) | $65,417 |
| Total | 12,093 (100.0%) | $102,560 |
Poverty in O Fallon
Income Below Poverty by Sex and Age in O Fallon
With 2.4% poverty level for males and 4.2% for females among the residents of O Fallon, under 5 year old males and 15 year old females are the most vulnerable to poverty, with 110 males (8.8%) and 50 females (13.9%) in their respective age groups living below the poverty level.
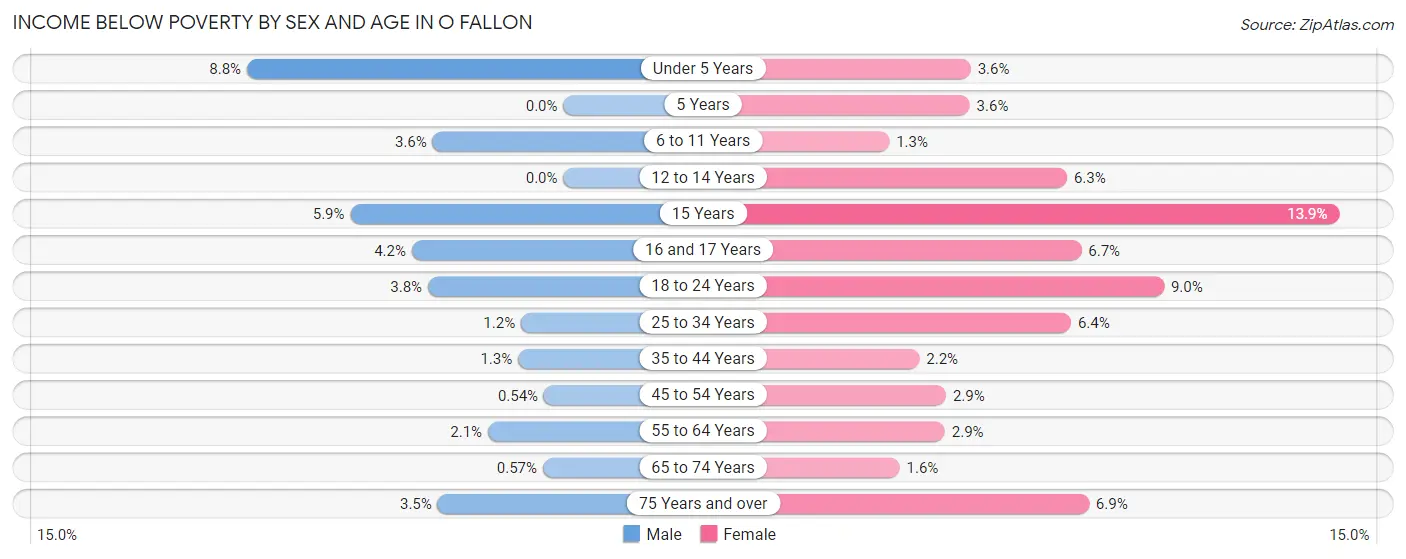
| Age Bracket | Male | Female |
| Under 5 Years | 110 (8.8%) | 36 (3.6%) |
| 5 Years | 0 (0.0%) | 8 (3.6%) |
| 6 to 11 Years | 53 (3.6%) | 20 (1.3%) |
| 12 to 14 Years | 0 (0.0%) | 61 (6.3%) |
| 15 Years | 14 (5.9%) | 50 (13.9%) |
| 16 and 17 Years | 25 (4.2%) | 23 (6.7%) |
| 18 to 24 Years | 43 (3.8%) | 82 (9.0%) |
| 25 to 34 Years | 25 (1.2%) | 118 (6.4%) |
| 35 to 44 Years | 26 (1.3%) | 53 (2.2%) |
| 45 to 54 Years | 12 (0.5%) | 66 (2.9%) |
| 55 to 64 Years | 32 (2.1%) | 44 (2.9%) |
| 65 to 74 Years | 7 (0.6%) | 25 (1.6%) |
| 75 Years and over | 30 (3.5%) | 92 (6.9%) |
| Total | 377 (2.4%) | 678 (4.2%) |
Income Above Poverty by Sex and Age in O Fallon
According to the poverty statistics in O Fallon, males aged 5 years and females aged 6 to 11 years are the age groups that are most secure financially, with 100.0% of males and 98.7% of females in these age groups living above the poverty line.
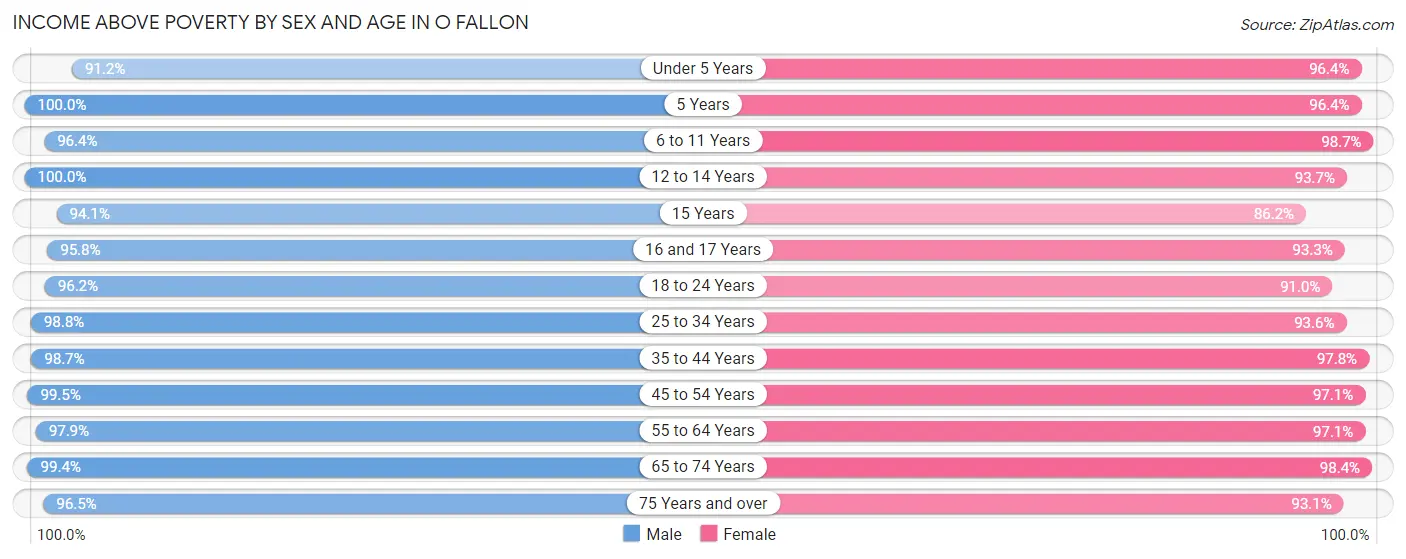
| Age Bracket | Male | Female |
| Under 5 Years | 1,139 (91.2%) | 966 (96.4%) |
| 5 Years | 294 (100.0%) | 217 (96.4%) |
| 6 to 11 Years | 1,402 (96.4%) | 1,491 (98.7%) |
| 12 to 14 Years | 686 (100.0%) | 912 (93.7%) |
| 15 Years | 222 (94.1%) | 311 (86.2%) |
| 16 and 17 Years | 568 (95.8%) | 322 (93.3%) |
| 18 to 24 Years | 1,098 (96.2%) | 832 (91.0%) |
| 25 to 34 Years | 2,086 (98.8%) | 1,732 (93.6%) |
| 35 to 44 Years | 2,041 (98.7%) | 2,403 (97.8%) |
| 45 to 54 Years | 2,196 (99.5%) | 2,208 (97.1%) |
| 55 to 64 Years | 1,494 (97.9%) | 1,488 (97.1%) |
| 65 to 74 Years | 1,231 (99.4%) | 1,523 (98.4%) |
| 75 Years and over | 826 (96.5%) | 1,246 (93.1%) |
| Total | 15,283 (97.6%) | 15,651 (95.9%) |
Income Below Poverty Among Married-Couple Families in O Fallon
The poverty statistics for married-couple families in O Fallon show that 0.3% or 22 of the total 7,114 families live below the poverty line. Families with 3 or 4 children have the highest poverty rate of 0.8%, comprising of 5 families. On the other hand, families with 1 or 2 children have the lowest poverty rate of 0.0%, which includes 0 families.
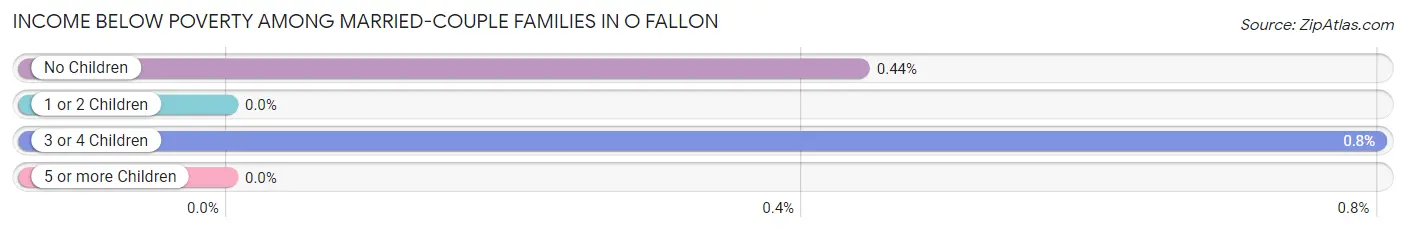
| Children | Above Poverty | Below Poverty |
| No Children | 3,838 (99.6%) | 17 (0.4%) |
| 1 or 2 Children | 2,592 (100.0%) | 0 (0.0%) |
| 3 or 4 Children | 621 (99.2%) | 5 (0.8%) |
| 5 or more Children | 41 (100.0%) | 0 (0.0%) |
| Total | 7,092 (99.7%) | 22 (0.3%) |
Income Below Poverty Among Single-Parent Households in O Fallon
According to the poverty data in O Fallon, 2.8% or 14 single-father households and 9.6% or 141 single-mother households are living below the poverty line. Among single-father households, those with no children have the highest poverty rate, with 14 households (7.4%) experiencing poverty. Likewise, among single-mother households, those with 5 or more children have the highest poverty rate, with 44 households (63.8%) falling below the poverty line.
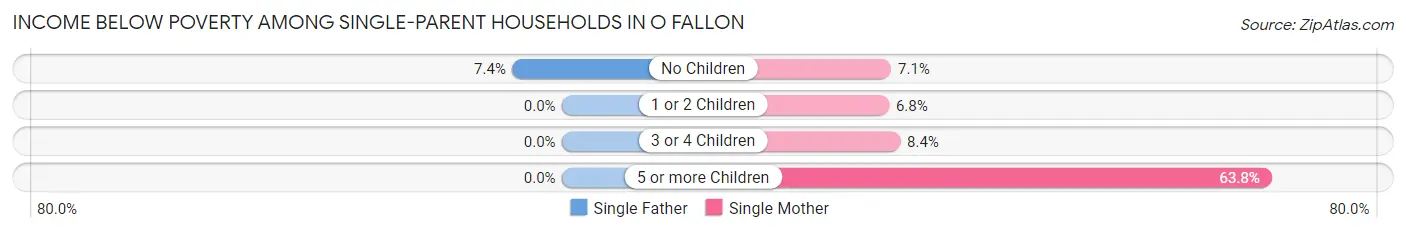
| Children | Single Father | Single Mother |
| No Children | 14 (7.4%) | 21 (7.1%) |
| 1 or 2 Children | 0 (0.0%) | 67 (6.8%) |
| 3 or 4 Children | 0 (0.0%) | 9 (8.4%) |
| 5 or more Children | 0 (0.0%) | 44 (63.8%) |
| Total | 14 (2.8%) | 141 (9.6%) |
Income Below Poverty Among Married-Couple vs Single-Parent Households in O Fallon
The poverty data for O Fallon shows that 22 of the married-couple family households (0.3%) and 155 of the single-parent households (7.9%) are living below the poverty level. Within the married-couple family households, those with 3 or 4 children have the highest poverty rate, with 5 households (0.8%) falling below the poverty line. Among the single-parent households, those with 5 or more children have the highest poverty rate, with 44 household (63.8%) living below poverty.
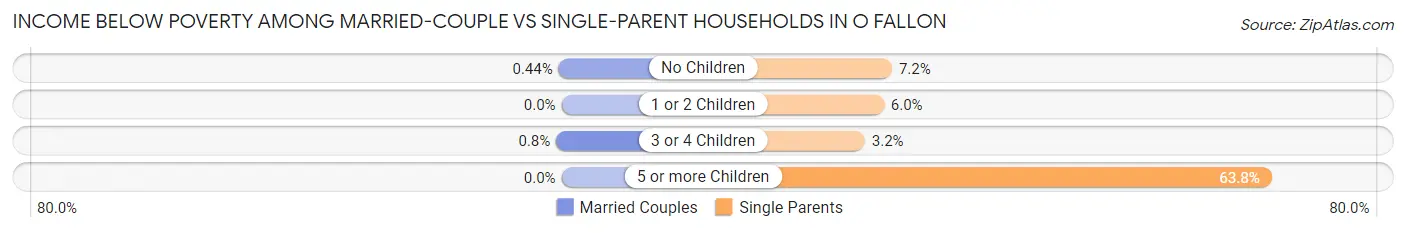
| Children | Married-Couple Families | Single-Parent Households |
| No Children | 17 (0.4%) | 35 (7.2%) |
| 1 or 2 Children | 0 (0.0%) | 67 (6.0%) |
| 3 or 4 Children | 5 (0.8%) | 9 (3.2%) |
| 5 or more Children | 0 (0.0%) | 44 (63.8%) |
| Total | 22 (0.3%) | 155 (7.9%) |
Race in O Fallon
The most populous races in O Fallon are White / Caucasian (23,558 | 73.4%), Black / African American (4,077 | 12.7%), and Two or more Races (3,046 | 9.5%).
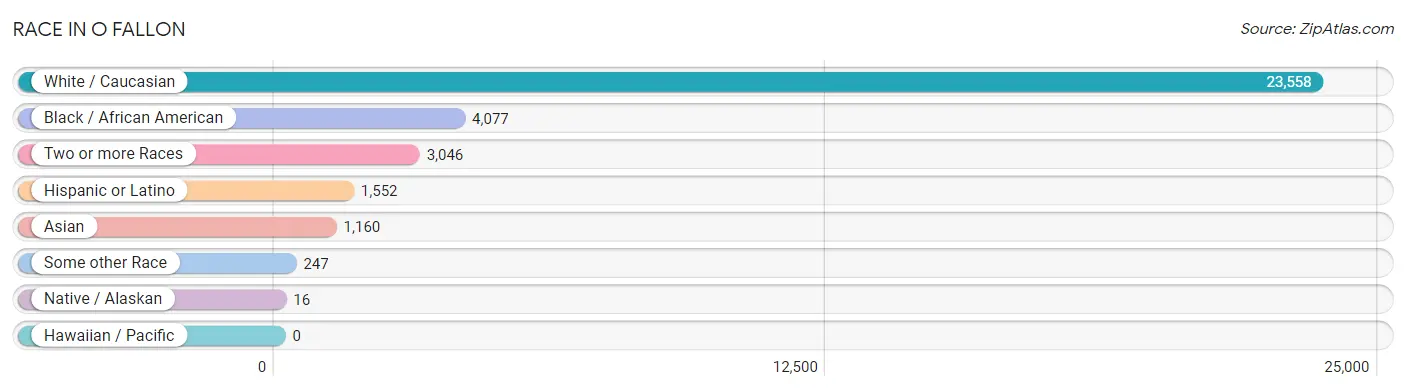
| Race | # Population | % Population |
| Asian | 1,160 | 3.6% |
| Black / African American | 4,077 | 12.7% |
| Hawaiian / Pacific | 0 | 0.0% |
| Hispanic or Latino | 1,552 | 4.8% |
| Native / Alaskan | 16 | 0.1% |
| White / Caucasian | 23,558 | 73.4% |
| Two or more Races | 3,046 | 9.5% |
| Some other Race | 247 | 0.8% |
| Total | 32,104 | 100.0% |
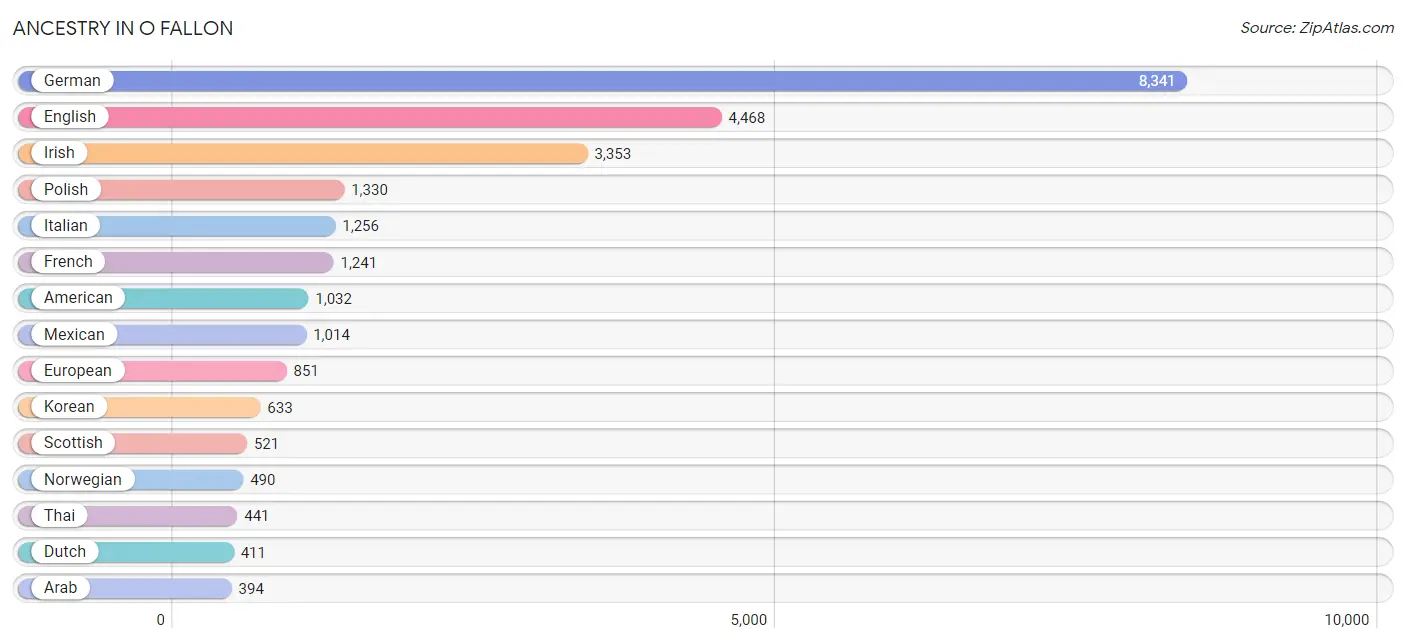
Ancestry in O Fallon
The most populous ancestries reported in O Fallon are German (8,341 | 26.0%), English (4,468 | 13.9%), Irish (3,353 | 10.4%), Polish (1,330 | 4.1%), and Italian (1,256 | 3.9%), together accounting for 58.4% of all O Fallon residents.
| Ancestry | # Population | % Population |
| African | 114 | 0.4% |
| Alsatian | 30 | 0.1% |
| American | 1,032 | 3.2% |
| Arab | 394 | 1.2% |
| Austrian | 98 | 0.3% |
| Bhutanese | 238 | 0.7% |
| Blackfeet | 126 | 0.4% |
| British | 159 | 0.5% |
| Burmese | 187 | 0.6% |
| Canadian | 69 | 0.2% |
| Cherokee | 223 | 0.7% |
| Chinese | 8 | 0.0% |
| Chippewa | 15 | 0.1% |
| Colombian | 13 | 0.0% |
| Croatian | 98 | 0.3% |
| Czech | 93 | 0.3% |
| Czechoslovakian | 17 | 0.1% |
| Danish | 80 | 0.3% |
| Dominican | 50 | 0.2% |
| Dutch | 411 | 1.3% |
| Eastern European | 88 | 0.3% |
| Egyptian | 52 | 0.2% |
| English | 4,468 | 13.9% |
| European | 851 | 2.6% |
| Finnish | 16 | 0.1% |
| French | 1,241 | 3.9% |
| French American Indian | 8 | 0.0% |
| French Canadian | 146 | 0.4% |
| German | 8,341 | 26.0% |
| Ghanaian | 13 | 0.0% |
| Greek | 24 | 0.1% |
| Guamanian / Chamorro | 8 | 0.0% |
| Guyanese | 14 | 0.0% |
| Haitian | 32 | 0.1% |
| Hungarian | 125 | 0.4% |
| Indian (Asian) | 109 | 0.3% |
| Iraqi | 28 | 0.1% |
| Irish | 3,353 | 10.4% |
| Iroquois | 2 | 0.0% |
| Israeli | 7 | 0.0% |
| Italian | 1,256 | 3.9% |
| Jamaican | 72 | 0.2% |
| Korean | 633 | 2.0% |
| Lebanese | 17 | 0.1% |
| Lithuanian | 68 | 0.2% |
| Mexican | 1,014 | 3.2% |
| Mexican American Indian | 37 | 0.1% |
| Native Hawaiian | 35 | 0.1% |
| Navajo | 11 | 0.0% |
| Nigerian | 38 | 0.1% |
| Northern European | 35 | 0.1% |
| Norwegian | 490 | 1.5% |
| Ottawa | 51 | 0.2% |
| Pakistani | 9 | 0.0% |
| Peruvian | 38 | 0.1% |
| Polish | 1,330 | 4.1% |
| Portuguese | 36 | 0.1% |
| Puerto Rican | 122 | 0.4% |
| Romanian | 8 | 0.0% |
| Russian | 112 | 0.4% |
| Scandinavian | 86 | 0.3% |
| Scotch-Irish | 375 | 1.2% |
| Scottish | 521 | 1.6% |
| Serbian | 10 | 0.0% |
| Slavic | 39 | 0.1% |
| Slovak | 11 | 0.0% |
| South American | 56 | 0.2% |
| Spaniard | 101 | 0.3% |
| Spanish | 178 | 0.5% |
| Sri Lankan | 90 | 0.3% |
| Subsaharan African | 212 | 0.7% |
| Swedish | 315 | 1.0% |
| Swiss | 131 | 0.4% |
| Syrian | 13 | 0.0% |
| Thai | 441 | 1.4% |
| Ukrainian | 54 | 0.2% |
| Venezuelan | 5 | 0.0% |
| Welsh | 335 | 1.0% |
| West Indian | 27 | 0.1% |
| Yugoslavian | 8 | 0.0% | View All 80 Rows |
Immigrants in O Fallon
The most numerous immigrant groups reported in O Fallon came from Asia (665 | 2.1%), Europe (270 | 0.8%), South Eastern Asia (270 | 0.8%), Philippines (228 | 0.7%), and India (204 | 0.6%), together accounting for 5.1% of all O Fallon residents.
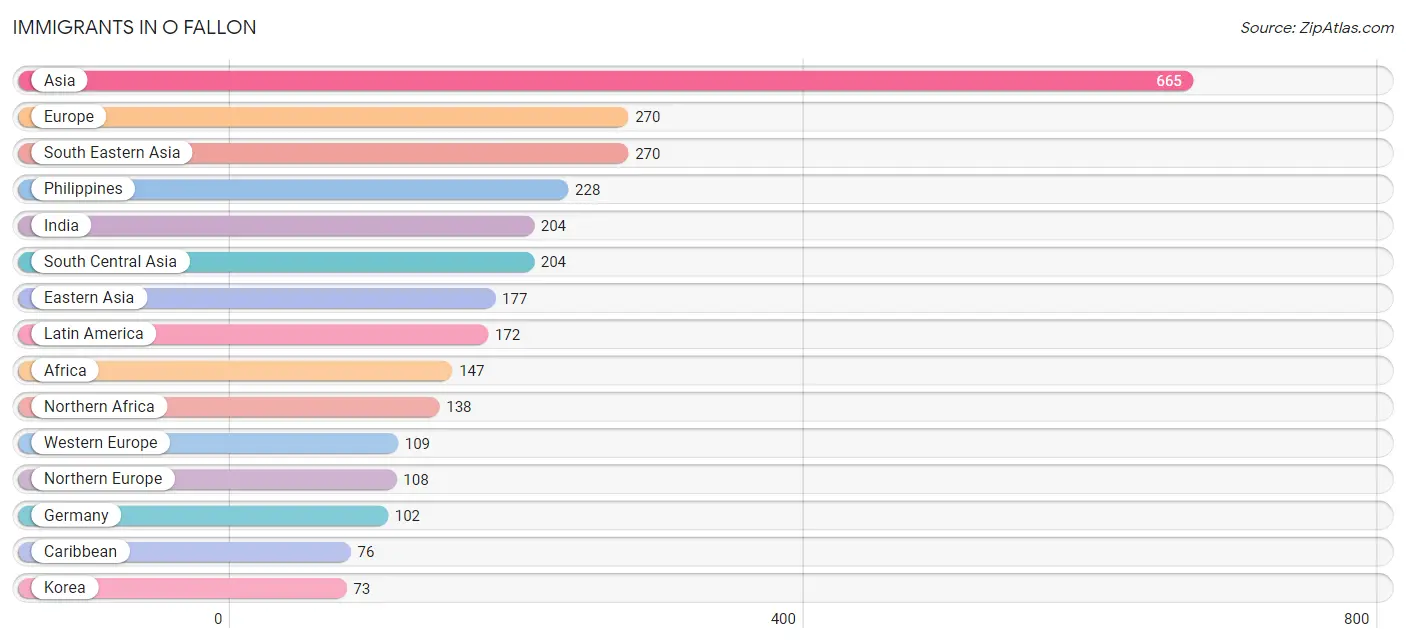
| Immigration Origin | # Population | % Population |
| Africa | 147 | 0.5% |
| Asia | 665 | 2.1% |
| Austria | 7 | 0.0% |
| Cambodia | 9 | 0.0% |
| Canada | 47 | 0.2% |
| Caribbean | 76 | 0.2% |
| Central America | 63 | 0.2% |
| China | 47 | 0.2% |
| Colombia | 13 | 0.0% |
| Dominican Republic | 11 | 0.0% |
| Eastern Africa | 9 | 0.0% |
| Eastern Asia | 177 | 0.5% |
| Eastern Europe | 21 | 0.1% |
| Egypt | 52 | 0.2% |
| England | 33 | 0.1% |
| Europe | 270 | 0.8% |
| Germany | 102 | 0.3% |
| Guyana | 14 | 0.0% |
| Haiti | 32 | 0.1% |
| Hungary | 13 | 0.0% |
| India | 204 | 0.6% |
| Iraq | 14 | 0.0% |
| Italy | 12 | 0.0% |
| Jamaica | 33 | 0.1% |
| Japan | 57 | 0.2% |
| Korea | 73 | 0.2% |
| Latin America | 172 | 0.5% |
| Mexico | 63 | 0.2% |
| Northern Africa | 138 | 0.4% |
| Northern Europe | 108 | 0.3% |
| Peru | 6 | 0.0% |
| Philippines | 228 | 0.7% |
| Poland | 8 | 0.0% |
| South America | 33 | 0.1% |
| South Central Asia | 204 | 0.6% |
| South Eastern Asia | 270 | 0.8% |
| Southern Europe | 32 | 0.1% |
| Spain | 20 | 0.1% |
| Vietnam | 33 | 0.1% |
| Western Asia | 14 | 0.0% |
| Western Europe | 109 | 0.3% | View All 41 Rows |
Sex and Age in O Fallon
Sex and Age in O Fallon
The most populous age groups in O Fallon are 10 to 14 Years (1,362 | 8.7%) for men and 10 to 14 Years (1,496 | 9.1%) for women.
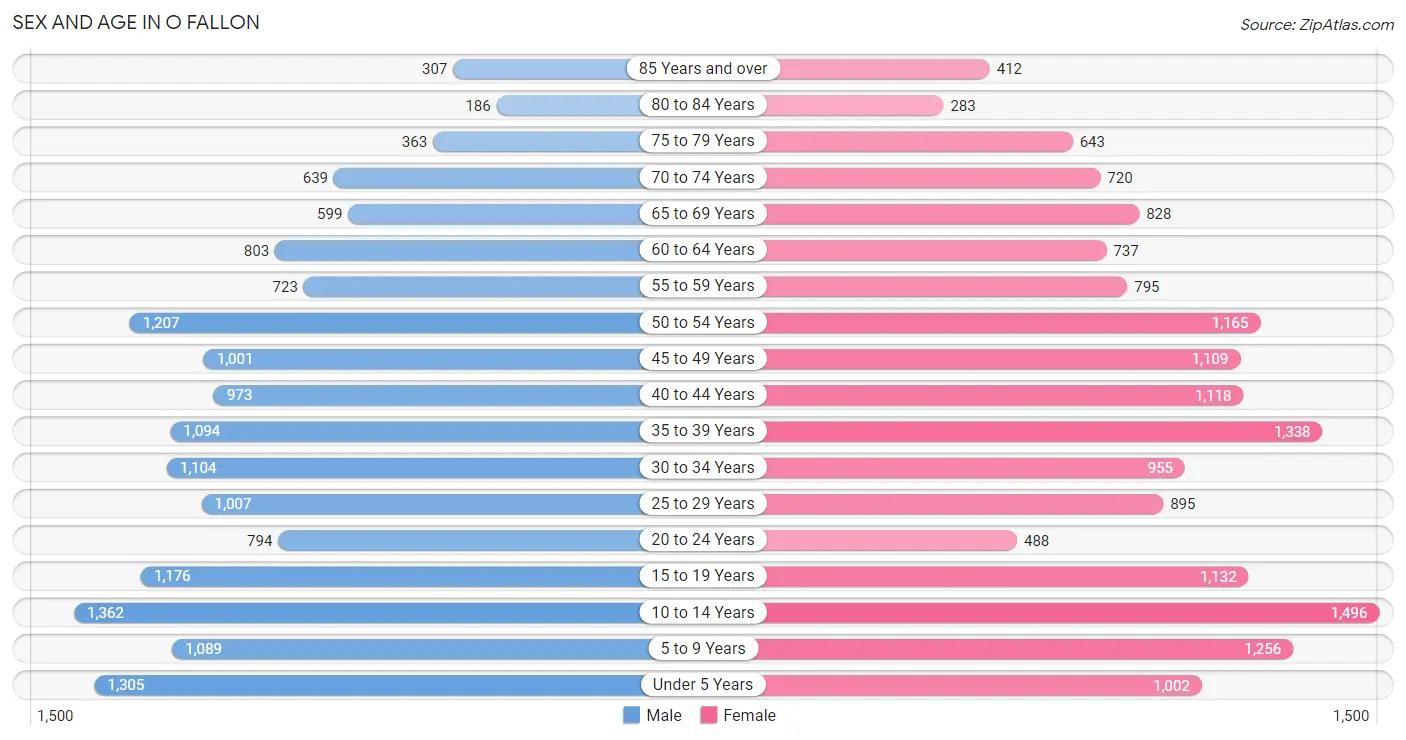
| Age Bracket | Male | Female |
| Under 5 Years | 1,305 (8.3%) | 1,002 (6.1%) |
| 5 to 9 Years | 1,089 (6.9%) | 1,256 (7.7%) |
| 10 to 14 Years | 1,362 (8.7%) | 1,496 (9.1%) |
| 15 to 19 Years | 1,176 (7.5%) | 1,132 (6.9%) |
| 20 to 24 Years | 794 (5.1%) | 488 (3.0%) |
| 25 to 29 Years | 1,007 (6.4%) | 895 (5.5%) |
| 30 to 34 Years | 1,104 (7.0%) | 955 (5.8%) |
| 35 to 39 Years | 1,094 (7.0%) | 1,338 (8.2%) |
| 40 to 44 Years | 973 (6.2%) | 1,118 (6.8%) |
| 45 to 49 Years | 1,001 (6.4%) | 1,109 (6.8%) |
| 50 to 54 Years | 1,207 (7.7%) | 1,165 (7.1%) |
| 55 to 59 Years | 723 (4.6%) | 795 (4.9%) |
| 60 to 64 Years | 803 (5.1%) | 737 (4.5%) |
| 65 to 69 Years | 599 (3.8%) | 828 (5.1%) |
| 70 to 74 Years | 639 (4.1%) | 720 (4.4%) |
| 75 to 79 Years | 363 (2.3%) | 643 (3.9%) |
| 80 to 84 Years | 186 (1.2%) | 283 (1.7%) |
| 85 Years and over | 307 (1.9%) | 412 (2.5%) |
| Total | 15,732 (100.0%) | 16,372 (100.0%) |
Families and Households in O Fallon
Median Family Size in O Fallon
The median family size in O Fallon is 3.10 persons per family, with single male/father families (493 | 5.4%) accounting for the largest median family size of 3.48 persons per family. On the other hand, single female/mother families (1,466 | 16.2%) represent the smallest median family size with 2.99 persons per family.
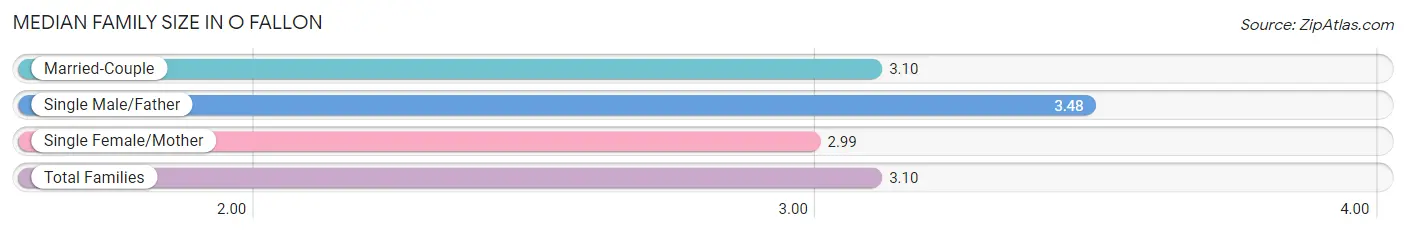
| Family Type | # Families | Family Size |
| Married-Couple | 7,114 (78.4%) | 3.10 |
| Single Male/Father | 493 (5.4%) | 3.48 |
| Single Female/Mother | 1,466 (16.2%) | 2.99 |
| Total Families | 9,073 (100.0%) | 3.10 |
Median Household Size in O Fallon
The median household size in O Fallon is 2.65 persons per household, with single male/father households (493 | 4.1%) accounting for the largest median household size of 3.91 persons per household. non-family households (3,020 | 25.0%) represent the smallest median household size with 1.10 persons per household.
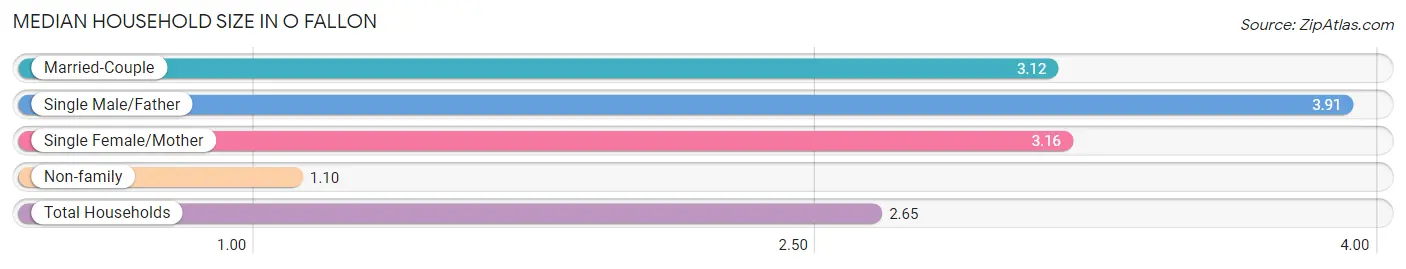
| Household Type | # Households | Household Size |
| Married-Couple | 7,114 (58.8%) | 3.12 |
| Single Male/Father | 493 (4.1%) | 3.91 |
| Single Female/Mother | 1,466 (12.1%) | 3.16 |
| Non-family | 3,020 (25.0%) | 1.10 |
| Total Households | 12,093 (100.0%) | 2.65 |
Household Size by Marriage Status in O Fallon
Out of a total of 12,093 households in O Fallon, 9,073 (75.0%) are family households, while 3,020 (25.0%) are nonfamily households. The most numerous type of family households are 2-person households, comprising 3,877, and the most common type of nonfamily households are 1-person households, comprising 2,785.
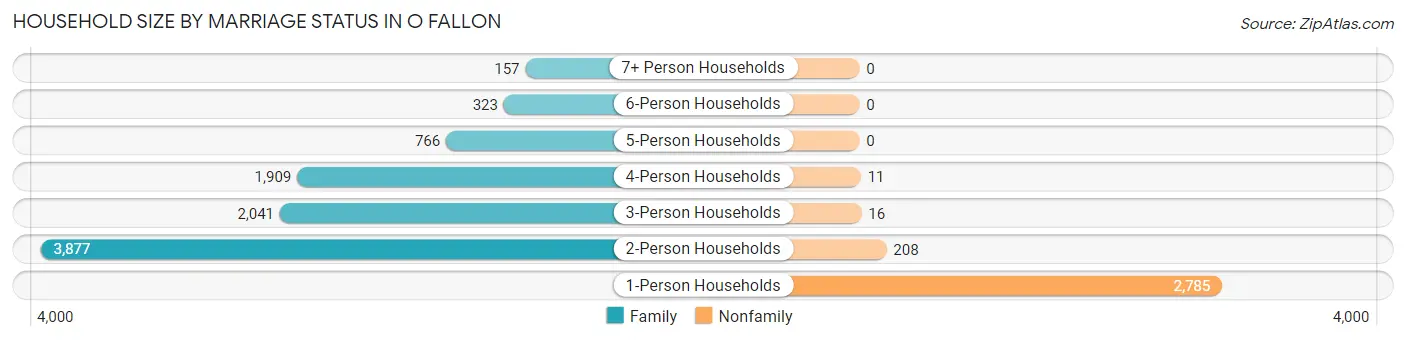
| Household Size | Family Households | Nonfamily Households |
| 1-Person Households | - | 2,785 (23.0%) |
| 2-Person Households | 3,877 (32.1%) | 208 (1.7%) |
| 3-Person Households | 2,041 (16.9%) | 16 (0.1%) |
| 4-Person Households | 1,909 (15.8%) | 11 (0.1%) |
| 5-Person Households | 766 (6.3%) | 0 (0.0%) |
| 6-Person Households | 323 (2.7%) | 0 (0.0%) |
| 7+ Person Households | 157 (1.3%) | 0 (0.0%) |
| Total | 9,073 (75.0%) | 3,020 (25.0%) |
Female Fertility in O Fallon
Fertility by Age in O Fallon
Average fertility rate in O Fallon is 98.0 births per 1,000 women. Women in the age bracket of 20 to 34 years have the highest fertility rate with 163.0 births per 1,000 women. Women in the age bracket of 20 to 34 years acount for 53.7% of all women with births.
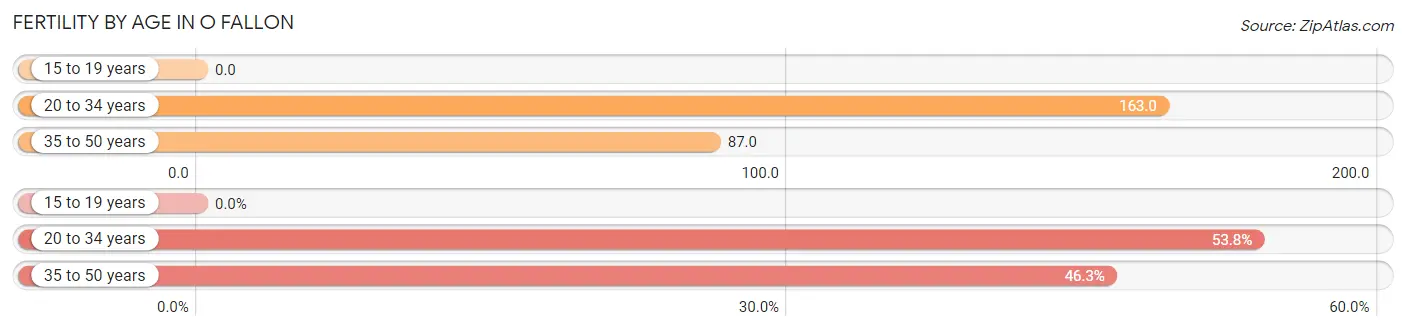
| Age Bracket | Women with Births | Births / 1,000 Women |
| 15 to 19 years | 0 (0.0%) | 0.0 |
| 20 to 34 years | 380 (53.7%) | 163.0 |
| 35 to 50 years | 327 (46.3%) | 87.0 |
| Total | 707 (100.0%) | 98.0 |
Fertility by Age by Marriage Status in O Fallon
71.6% of women with births (707) in O Fallon are married. The highest percentage of unmarried women with births falls into 35 to 50 years age bracket with 39.8% of them unmarried at the time of birth, while the lowest percentage of unmarried women with births belong to 20 to 34 years age bracket with 18.7% of them unmarried.
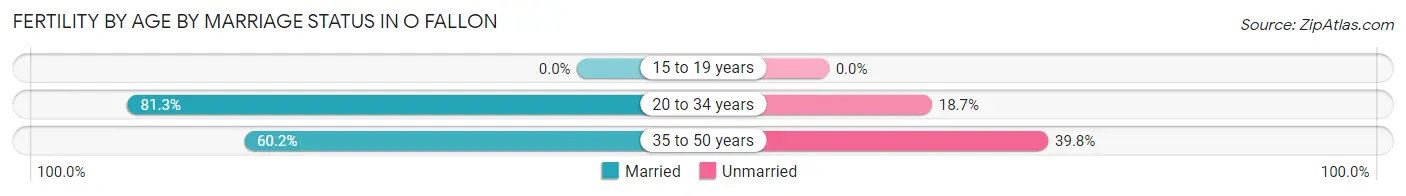
| Age Bracket | Married | Unmarried |
| 15 to 19 years | 0 (0.0%) | 0 (0.0%) |
| 20 to 34 years | 309 (81.3%) | 71 (18.7%) |
| 35 to 50 years | 197 (60.2%) | 130 (39.8%) |
| Total | 506 (71.6%) | 201 (28.4%) |
Fertility by Education in O Fallon
Average fertility rate in O Fallon is 98.0 births per 1,000 women. Women with the education attainment of bachelor's degree have the highest fertility rate of 167.0 births per 1,000 women, while women with the education attainment of college or associate's degree have the lowest fertility at 40.0 births per 1,000 women. Women with the education attainment of bachelor's degree represent 52.0% of all women with births.
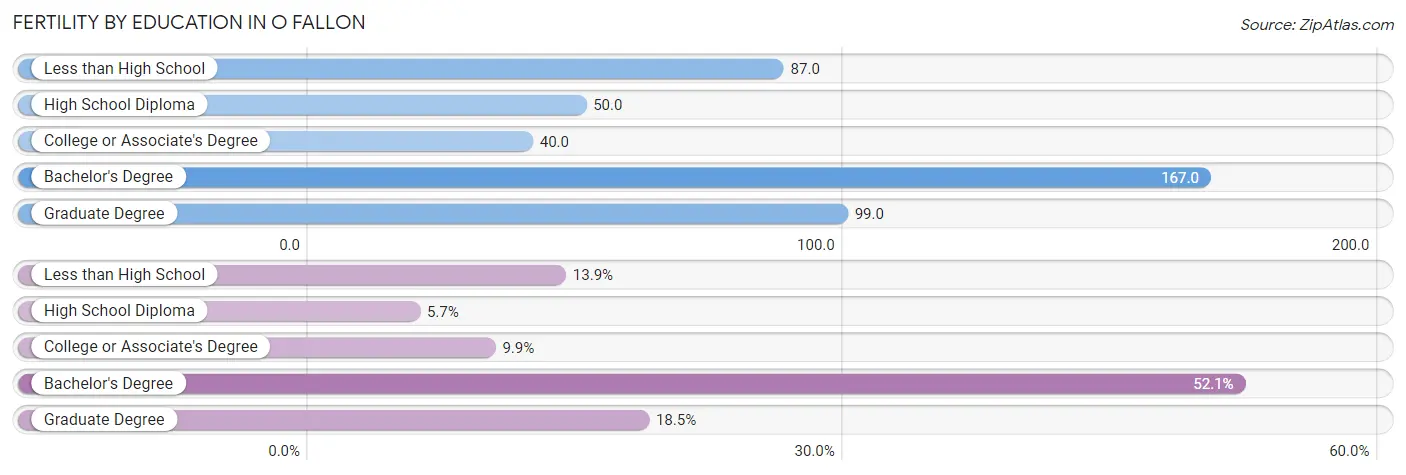
| Educational Attainment | Women with Births | Births / 1,000 Women |
| Less than High School | 98 (13.9%) | 87.0 |
| High School Diploma | 40 (5.7%) | 50.0 |
| College or Associate's Degree | 70 (9.9%) | 40.0 |
| Bachelor's Degree | 368 (52.0%) | 167.0 |
| Graduate Degree | 131 (18.5%) | 99.0 |
| Total | 707 (100.0%) | 98.0 |
Fertility by Education by Marriage Status in O Fallon
28.4% of women with births in O Fallon are unmarried. Women with the educational attainment of college or associate's degree are most likely to be married with 100.0% of them married at childbirth, while women with the educational attainment of less than high school are least likely to be married with 55.1% of them unmarried at childbirth.
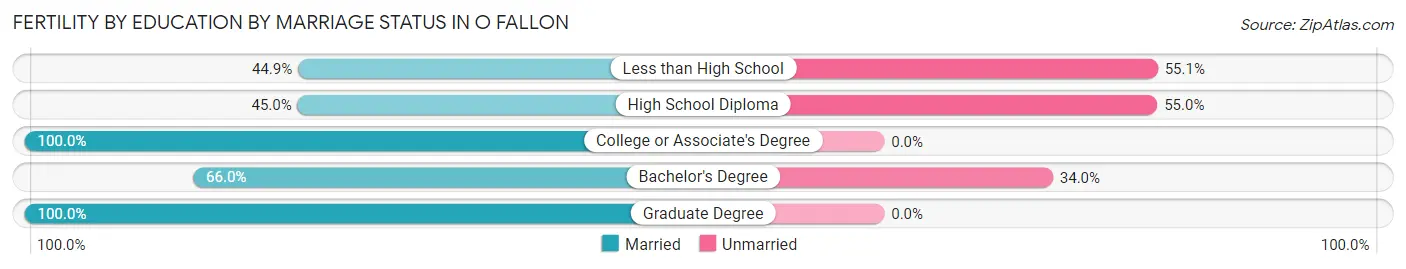
| Educational Attainment | Married | Unmarried |
| Less than High School | 44 (44.9%) | 54 (55.1%) |
| High School Diploma | 18 (45.0%) | 22 (55.0%) |
| College or Associate's Degree | 70 (100.0%) | 0 (0.0%) |
| Bachelor's Degree | 243 (66.0%) | 125 (34.0%) |
| Graduate Degree | 131 (100.0%) | 0 (0.0%) |
| Total | 506 (71.6%) | 201 (28.4%) |
Employment Characteristics in O Fallon
Employment by Class of Employer in O Fallon
Among the 15,009 employed individuals in O Fallon, private company employees (9,321 | 62.1%), federal government employees (2,317 | 15.4%), and not-for-profit organizations (1,390 | 9.3%) make up the most common classes of employment.
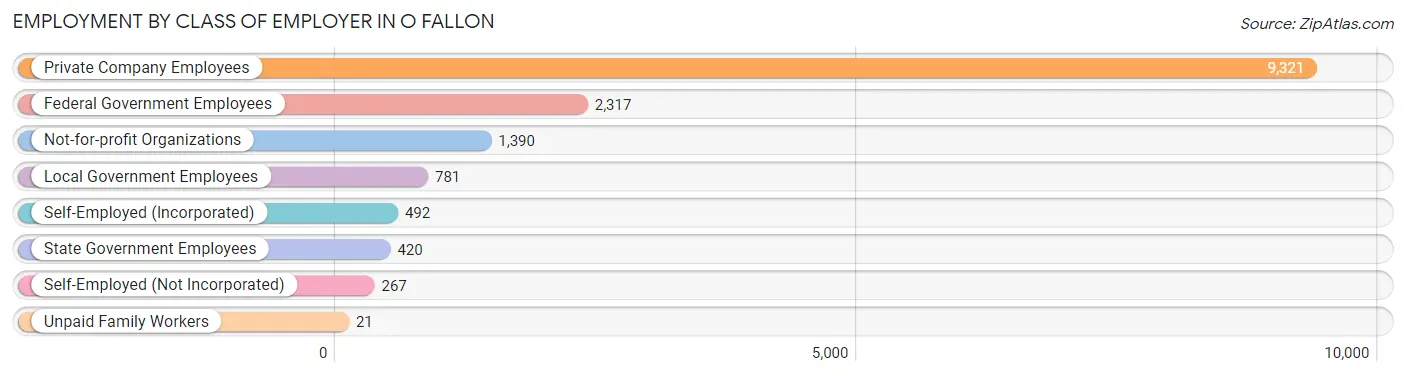
| Employer Class | # Employees | % Employees |
| Private Company Employees | 9,321 | 62.1% |
| Self-Employed (Incorporated) | 492 | 3.3% |
| Self-Employed (Not Incorporated) | 267 | 1.8% |
| Not-for-profit Organizations | 1,390 | 9.3% |
| Local Government Employees | 781 | 5.2% |
| State Government Employees | 420 | 2.8% |
| Federal Government Employees | 2,317 | 15.4% |
| Unpaid Family Workers | 21 | 0.1% |
| Total | 15,009 | 100.0% |
Employment Status by Age in O Fallon
According to the labor force statistics for O Fallon, out of the total population over 16 years of age (23,997), 66.8% or 16,030 individuals are in the labor force, with 3.6% or 577 of them unemployed. The age group with the highest labor force participation rate is 30 to 34 years, with 89.4% or 1,841 individuals in the labor force. Within the labor force, the 16 to 19 years age range has the highest percentage of unemployed individuals, with 17.5% or 114 of them being unemployed.
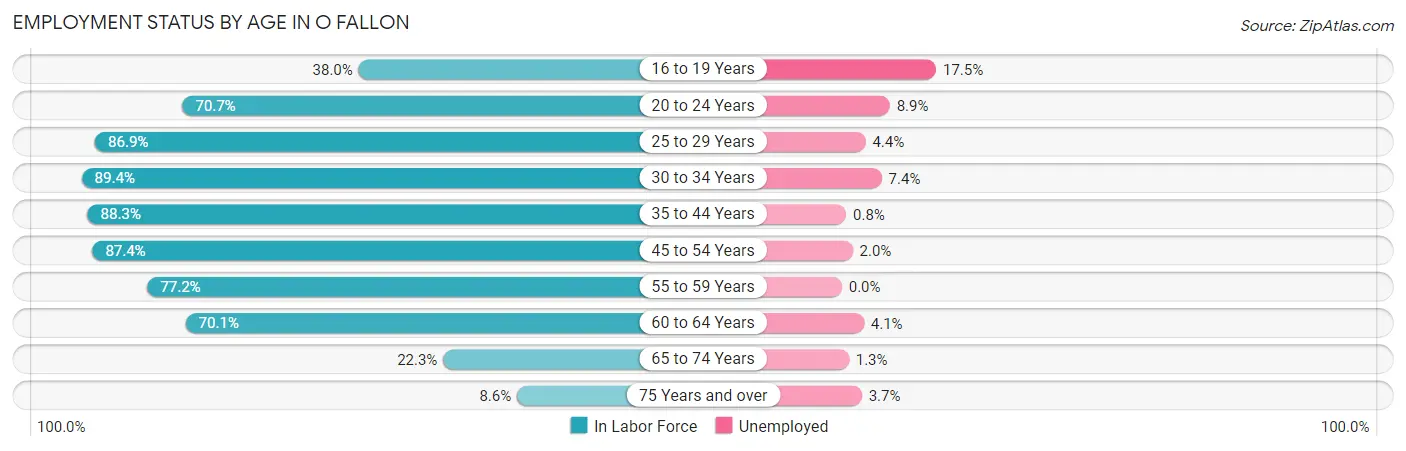
| Age Bracket | In Labor Force | Unemployed |
| 16 to 19 Years | 650 (38.0%) | 114 (17.5%) |
| 20 to 24 Years | 906 (70.7%) | 81 (8.9%) |
| 25 to 29 Years | 1,653 (86.9%) | 73 (4.4%) |
| 30 to 34 Years | 1,841 (89.4%) | 136 (7.4%) |
| 35 to 44 Years | 3,994 (88.3%) | 32 (0.8%) |
| 45 to 54 Years | 3,917 (87.4%) | 78 (2.0%) |
| 55 to 59 Years | 1,172 (77.2%) | 0 (0.0%) |
| 60 to 64 Years | 1,080 (70.1%) | 44 (4.1%) |
| 65 to 74 Years | 621 (22.3%) | 8 (1.3%) |
| 75 Years and over | 189 (8.6%) | 7 (3.7%) |
| Total | 16,030 (66.8%) | 577 (3.6%) |
Employment Status by Educational Attainment in O Fallon
According to labor force statistics for O Fallon, 85.2% of individuals (13,652) out of the total population between 25 and 64 years of age (16,024) are in the labor force, with 2.6% or 355 of them being unemployed. The group with the highest labor force participation rate are those with the educational attainment of bachelor's degree or higher, with 89.7% or 7,975 individuals in the labor force. Within the labor force, individuals with less than high school education have the highest percentage of unemployment, with 16.3% or 53 of them being unemployed.
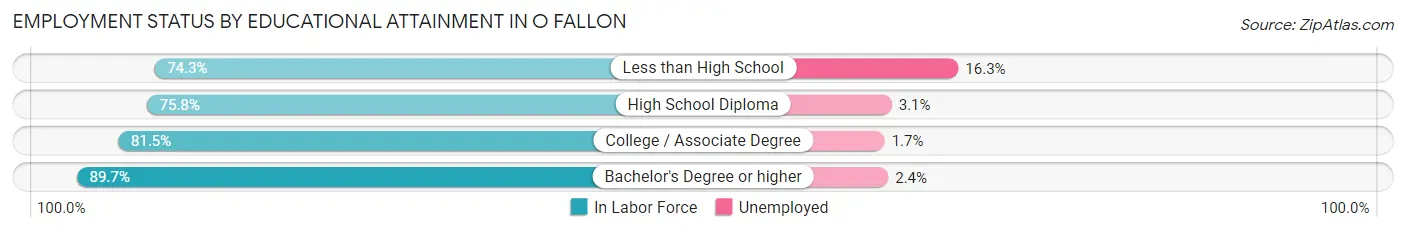
| Educational Attainment | In Labor Force | Unemployed |
| Less than High School | 326 (74.3%) | 72 (16.3%) |
| High School Diploma | 1,387 (75.8%) | 57 (3.1%) |
| College / Associate Degree | 3,964 (81.5%) | 83 (1.7%) |
| Bachelor's Degree or higher | 7,975 (89.7%) | 213 (2.4%) |
| Total | 13,652 (85.2%) | 417 (2.6%) |
Employment Occupations by Sex in O Fallon
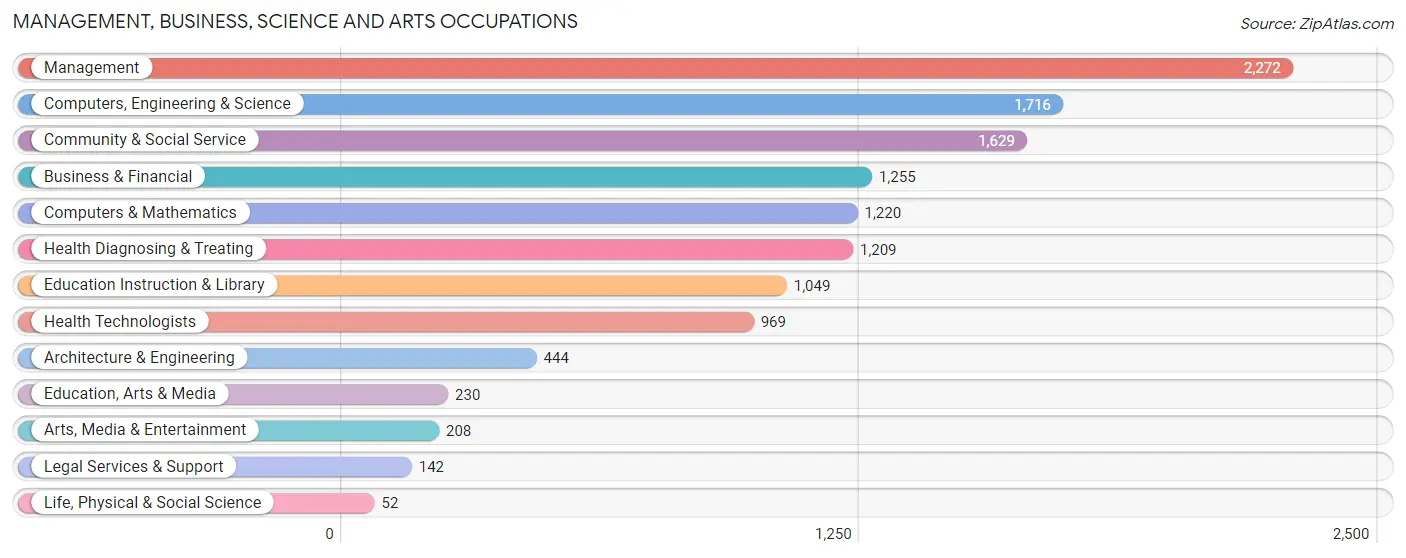
Management, Business, Science and Arts Occupations
The most common Management, Business, Science and Arts occupations in O Fallon are Management (2,272 | 15.4%), Computers, Engineering & Science (1,716 | 11.6%), Community & Social Service (1,629 | 11.0%), Business & Financial (1,255 | 8.5%), and Computers & Mathematics (1,220 | 8.3%).
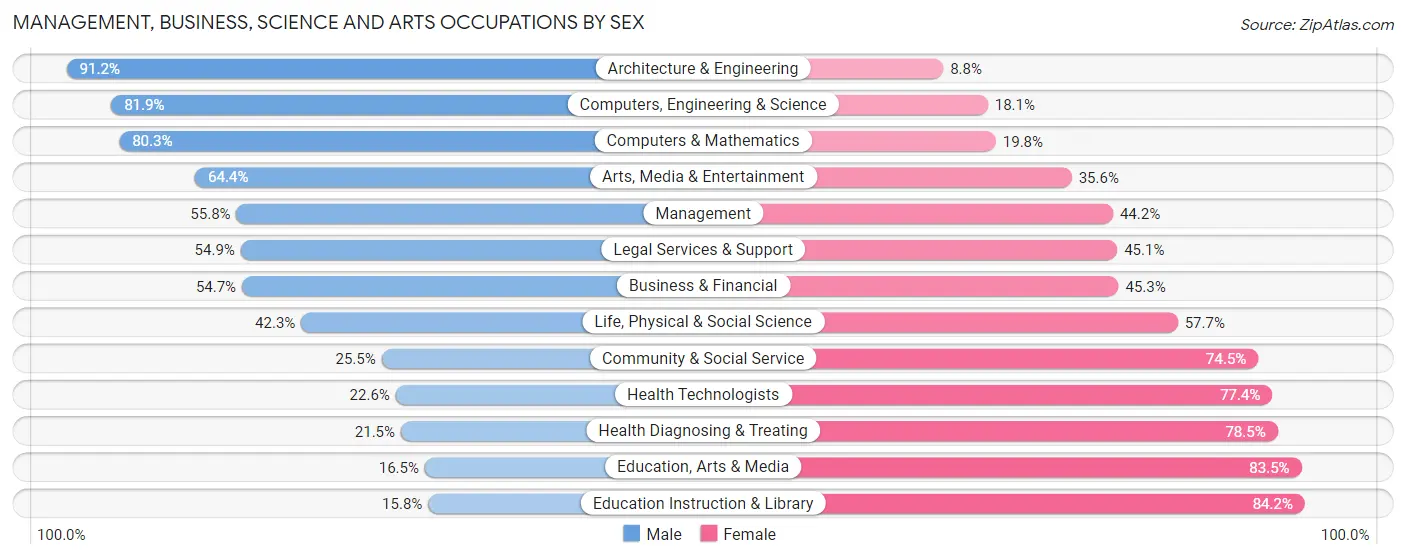
Management, Business, Science and Arts Occupations by Sex
Within the Management, Business, Science and Arts occupations in O Fallon, the most male-oriented occupations are Architecture & Engineering (91.2%), Computers, Engineering & Science (81.9%), and Computers & Mathematics (80.2%), while the most female-oriented occupations are Education Instruction & Library (84.2%), Education, Arts & Media (83.5%), and Health Diagnosing & Treating (78.5%).
| Occupation | Male | Female |
| Management | 1,268 (55.8%) | 1,004 (44.2%) |
| Business & Financial | 686 (54.7%) | 569 (45.3%) |
| Computers, Engineering & Science | 1,406 (81.9%) | 310 (18.1%) |
| Computers & Mathematics | 979 (80.2%) | 241 (19.8%) |
| Architecture & Engineering | 405 (91.2%) | 39 (8.8%) |
| Life, Physical & Social Science | 22 (42.3%) | 30 (57.7%) |
| Community & Social Service | 416 (25.5%) | 1,213 (74.5%) |
| Education, Arts & Media | 38 (16.5%) | 192 (83.5%) |
| Legal Services & Support | 78 (54.9%) | 64 (45.1%) |
| Education Instruction & Library | 166 (15.8%) | 883 (84.2%) |
| Arts, Media & Entertainment | 134 (64.4%) | 74 (35.6%) |
| Health Diagnosing & Treating | 260 (21.5%) | 949 (78.5%) |
| Health Technologists | 219 (22.6%) | 750 (77.4%) |
| Total (Category) | 4,036 (49.9%) | 4,045 (50.1%) |
| Total (Overall) | 7,704 (52.2%) | 7,054 (47.8%) |
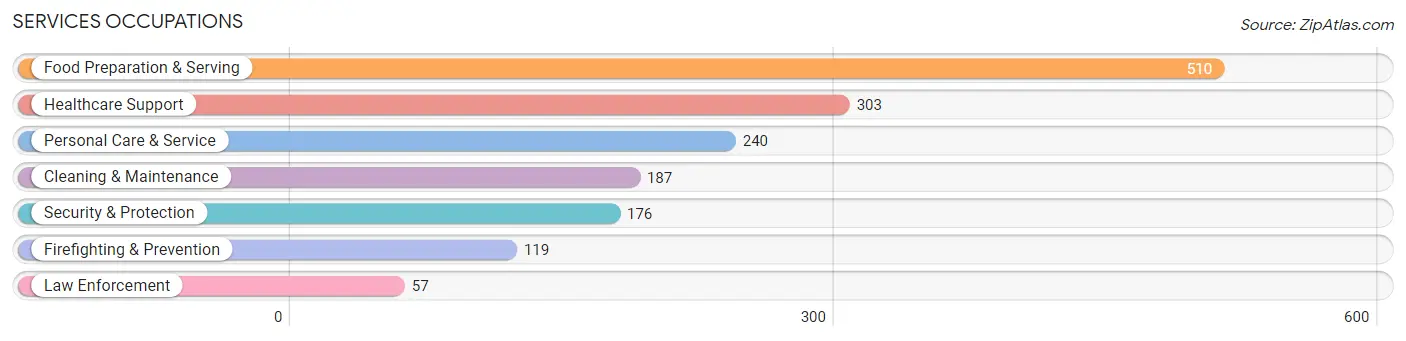
Services Occupations
The most common Services occupations in O Fallon are Food Preparation & Serving (510 | 3.5%), Healthcare Support (303 | 2.1%), Personal Care & Service (240 | 1.6%), Cleaning & Maintenance (187 | 1.3%), and Security & Protection (176 | 1.2%).
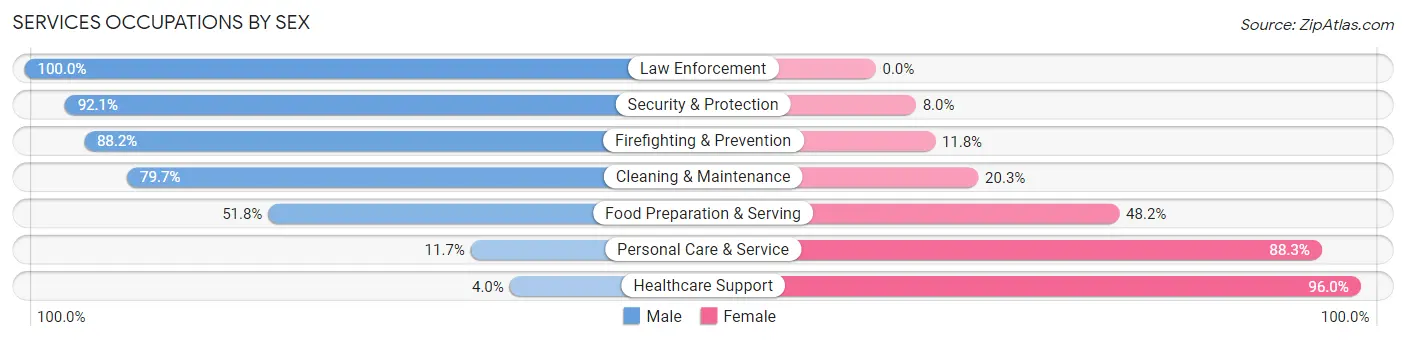
Services Occupations by Sex
Within the Services occupations in O Fallon, the most male-oriented occupations are Law Enforcement (100.0%), Security & Protection (92.0%), and Firefighting & Prevention (88.2%), while the most female-oriented occupations are Healthcare Support (96.0%), Personal Care & Service (88.3%), and Food Preparation & Serving (48.2%).
| Occupation | Male | Female |
| Healthcare Support | 12 (4.0%) | 291 (96.0%) |
| Security & Protection | 162 (92.0%) | 14 (8.0%) |
| Firefighting & Prevention | 105 (88.2%) | 14 (11.8%) |
| Law Enforcement | 57 (100.0%) | 0 (0.0%) |
| Food Preparation & Serving | 264 (51.8%) | 246 (48.2%) |
| Cleaning & Maintenance | 149 (79.7%) | 38 (20.3%) |
| Personal Care & Service | 28 (11.7%) | 212 (88.3%) |
| Total (Category) | 615 (43.4%) | 801 (56.6%) |
| Total (Overall) | 7,704 (52.2%) | 7,054 (47.8%) |
Sales and Office Occupations
The most common Sales and Office occupations in O Fallon are Office & Administration (1,708 | 11.6%), and Sales & Related (1,203 | 8.2%).

Sales and Office Occupations by Sex

| Occupation | Male | Female |
| Sales & Related | 438 (36.4%) | 765 (63.6%) |
| Office & Administration | 560 (32.8%) | 1,148 (67.2%) |
| Total (Category) | 998 (34.3%) | 1,913 (65.7%) |
| Total (Overall) | 7,704 (52.2%) | 7,054 (47.8%) |
Natural Resources, Construction and Maintenance Occupations
The most common Natural Resources, Construction and Maintenance occupations in O Fallon are Construction & Extraction (455 | 3.1%), Installation, Maintenance & Repair (359 | 2.4%), and Farming, Fishing & Forestry (11 | 0.1%).
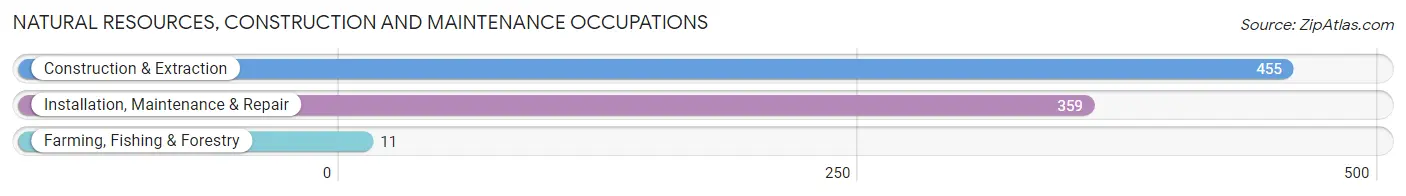
Natural Resources, Construction and Maintenance Occupations by Sex

| Occupation | Male | Female |
| Farming, Fishing & Forestry | 11 (100.0%) | 0 (0.0%) |
| Construction & Extraction | 445 (97.8%) | 10 (2.2%) |
| Installation, Maintenance & Repair | 359 (100.0%) | 0 (0.0%) |
| Total (Category) | 815 (98.8%) | 10 (1.2%) |
| Total (Overall) | 7,704 (52.2%) | 7,054 (47.8%) |
Production, Transportation and Moving Occupations
The most common Production, Transportation and Moving occupations in O Fallon are Transportation (623 | 4.2%), Material Moving (597 | 4.1%), and Production (305 | 2.1%).
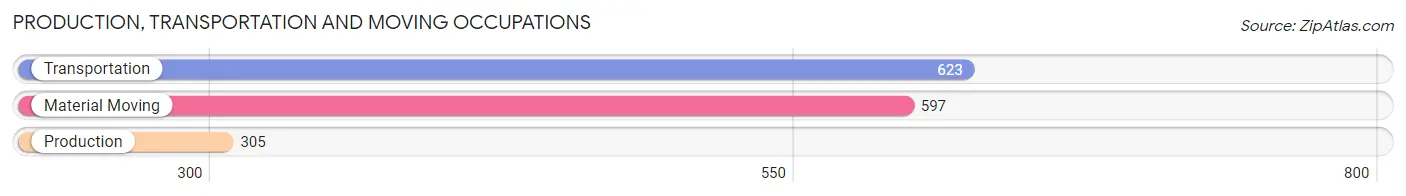
Production, Transportation and Moving Occupations by Sex
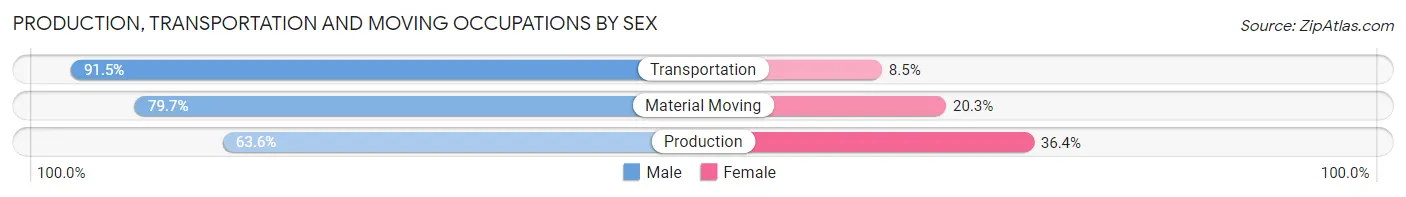
| Occupation | Male | Female |
| Production | 194 (63.6%) | 111 (36.4%) |
| Transportation | 570 (91.5%) | 53 (8.5%) |
| Material Moving | 476 (79.7%) | 121 (20.3%) |
| Total (Category) | 1,240 (81.3%) | 285 (18.7%) |
| Total (Overall) | 7,704 (52.2%) | 7,054 (47.8%) |
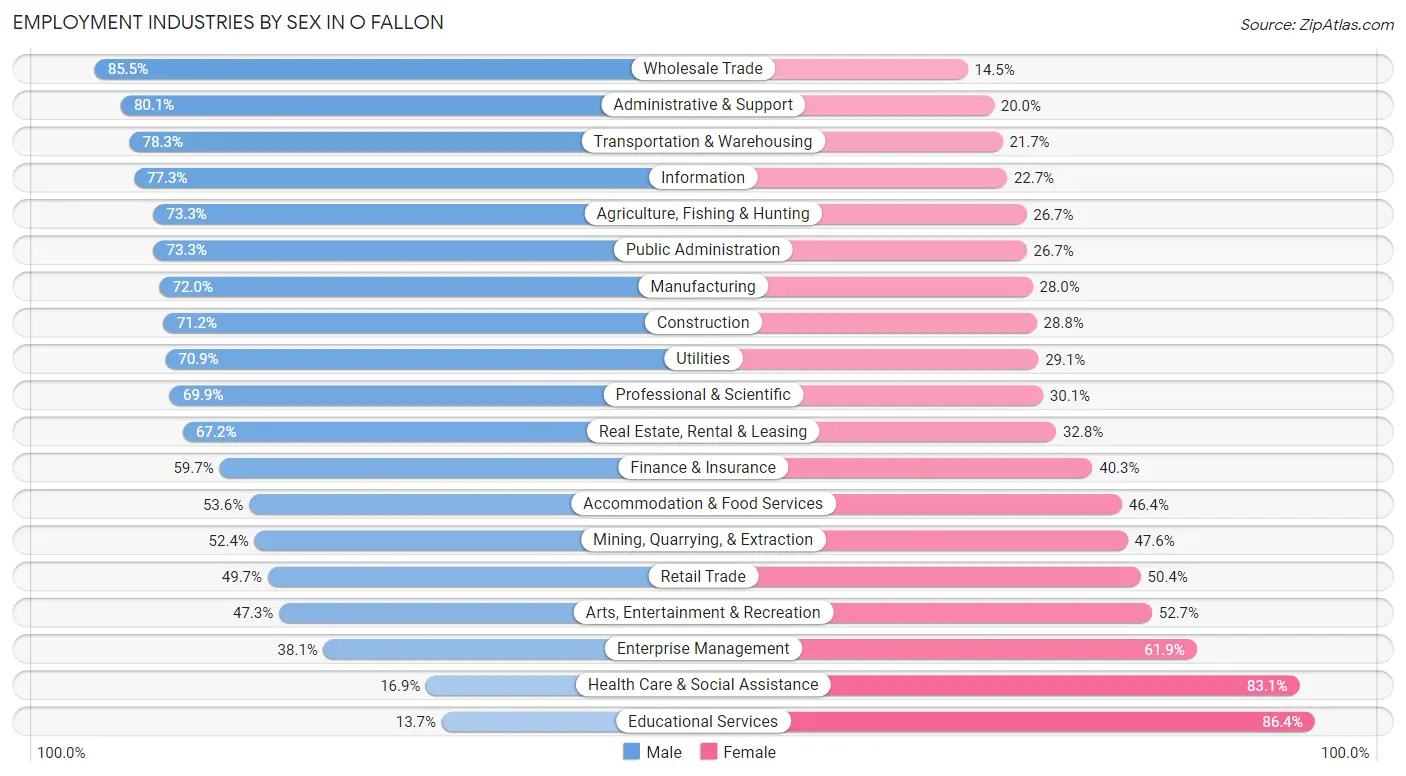
Employment Industries by Sex in O Fallon
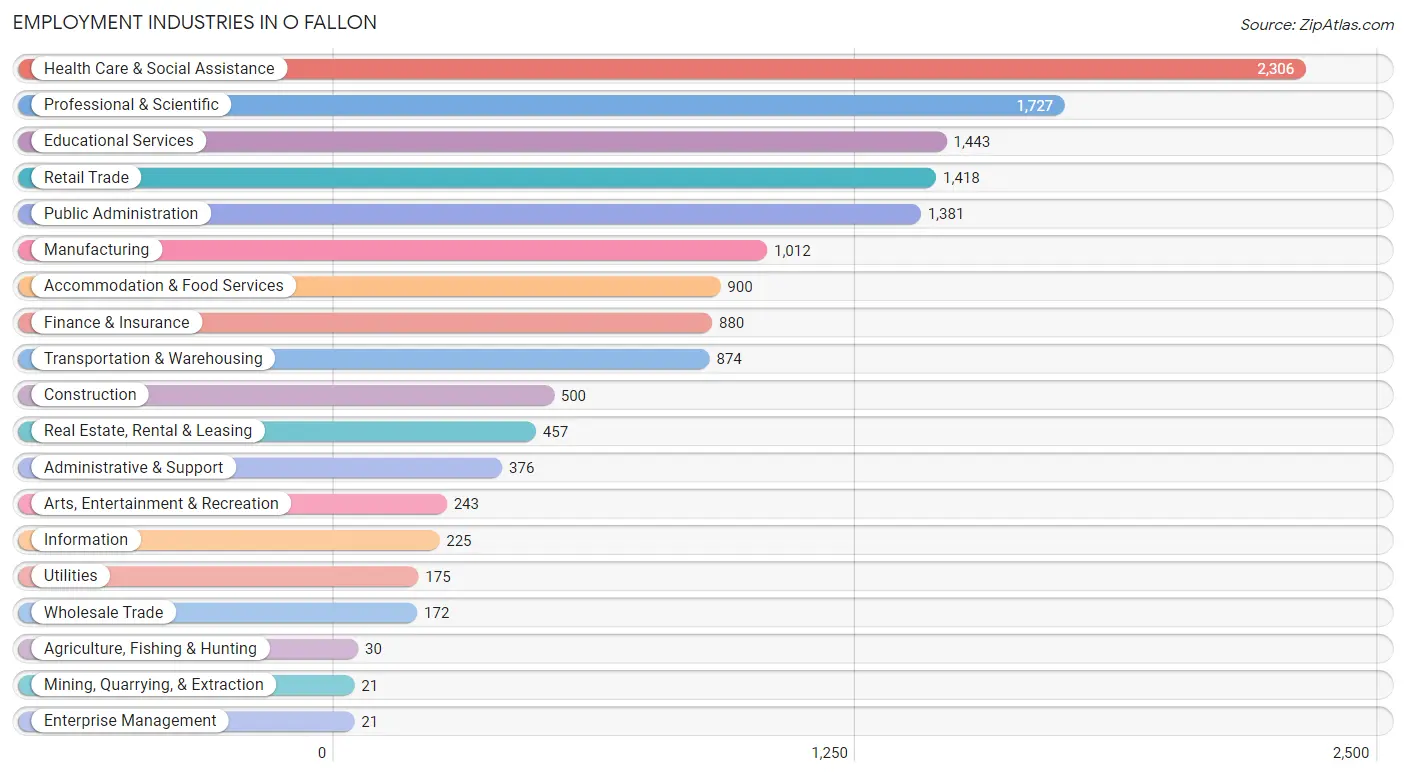
Employment Industries in O Fallon
The major employment industries in O Fallon include Health Care & Social Assistance (2,306 | 15.6%), Professional & Scientific (1,727 | 11.7%), Educational Services (1,443 | 9.8%), Retail Trade (1,418 | 9.6%), and Public Administration (1,381 | 9.4%).
Employment Industries by Sex in O Fallon
The O Fallon industries that see more men than women are Wholesale Trade (85.5%), Administrative & Support (80.0%), and Transportation & Warehousing (78.3%), whereas the industries that tend to have a higher number of women are Educational Services (86.4%), Health Care & Social Assistance (83.1%), and Enterprise Management (61.9%).
| Industry | Male | Female |
| Agriculture, Fishing & Hunting | 22 (73.3%) | 8 (26.7%) |
| Mining, Quarrying, & Extraction | 11 (52.4%) | 10 (47.6%) |
| Construction | 356 (71.2%) | 144 (28.8%) |
| Manufacturing | 729 (72.0%) | 283 (28.0%) |
| Wholesale Trade | 147 (85.5%) | 25 (14.5%) |
| Retail Trade | 704 (49.6%) | 714 (50.3%) |
| Transportation & Warehousing | 684 (78.3%) | 190 (21.7%) |
| Utilities | 124 (70.9%) | 51 (29.1%) |
| Information | 174 (77.3%) | 51 (22.7%) |
| Finance & Insurance | 525 (59.7%) | 355 (40.3%) |
| Real Estate, Rental & Leasing | 307 (67.2%) | 150 (32.8%) |
| Professional & Scientific | 1,207 (69.9%) | 520 (30.1%) |
| Enterprise Management | 8 (38.1%) | 13 (61.9%) |
| Administrative & Support | 301 (80.0%) | 75 (20.0%) |
| Educational Services | 197 (13.7%) | 1,246 (86.4%) |
| Health Care & Social Assistance | 389 (16.9%) | 1,917 (83.1%) |
| Arts, Entertainment & Recreation | 115 (47.3%) | 128 (52.7%) |
| Accommodation & Food Services | 482 (53.6%) | 418 (46.4%) |
| Public Administration | 1,012 (73.3%) | 369 (26.7%) |
| Total | 7,704 (52.2%) | 7,054 (47.8%) |
Education in O Fallon
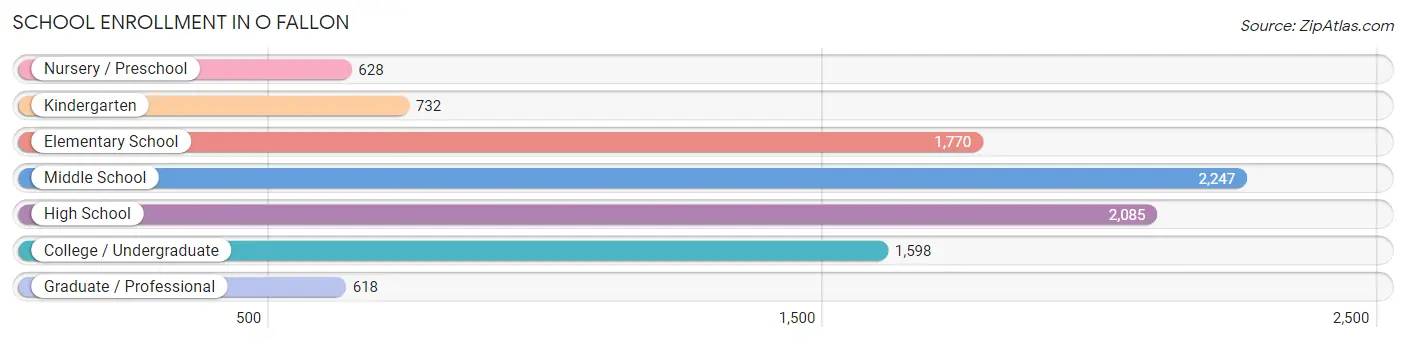
School Enrollment in O Fallon
The most common levels of schooling among the 9,678 students in O Fallon are middle school (2,247 | 23.2%), high school (2,085 | 21.5%), and elementary school (1,770 | 18.3%).
| School Level | # Students | % Students |
| Nursery / Preschool | 628 | 6.5% |
| Kindergarten | 732 | 7.6% |
| Elementary School | 1,770 | 18.3% |
| Middle School | 2,247 | 23.2% |
| High School | 2,085 | 21.5% |
| College / Undergraduate | 1,598 | 16.5% |
| Graduate / Professional | 618 | 6.4% |
| Total | 9,678 | 100.0% |
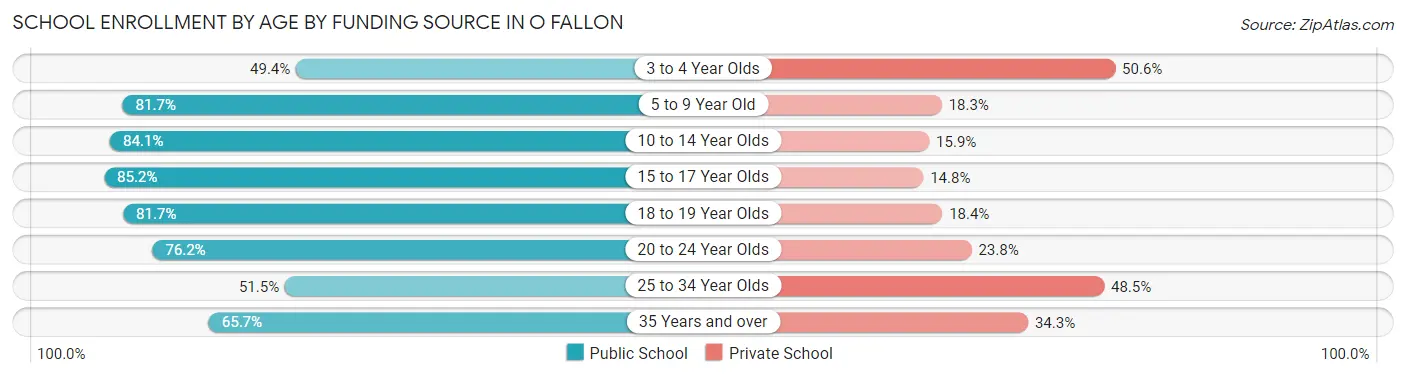
School Enrollment by Age by Funding Source in O Fallon
Out of a total of 9,678 students who are enrolled in schools in O Fallon, 2,149 (22.2%) attend a private institution, while the remaining 7,529 (77.8%) are enrolled in public schools. The age group of 3 to 4 year olds has the highest likelihood of being enrolled in private schools, with 221 (50.6% in the age bracket) enrolled. Conversely, the age group of 15 to 17 year olds has the lowest likelihood of being enrolled in a private school, with 1,282 (85.2% in the age bracket) attending a public institution.
| Age Bracket | Public School | Private School |
| 3 to 4 Year Olds | 216 (49.4%) | 221 (50.6%) |
| 5 to 9 Year Old | 1,894 (81.7%) | 423 (18.3%) |
| 10 to 14 Year Olds | 2,403 (84.1%) | 455 (15.9%) |
| 15 to 17 Year Olds | 1,282 (85.2%) | 223 (14.8%) |
| 18 to 19 Year Olds | 436 (81.7%) | 98 (18.3%) |
| 20 to 24 Year Olds | 528 (76.2%) | 165 (23.8%) |
| 25 to 34 Year Olds | 378 (51.5%) | 356 (48.5%) |
| 35 Years and over | 394 (65.7%) | 206 (34.3%) |
| Total | 7,529 (77.8%) | 2,149 (22.2%) |
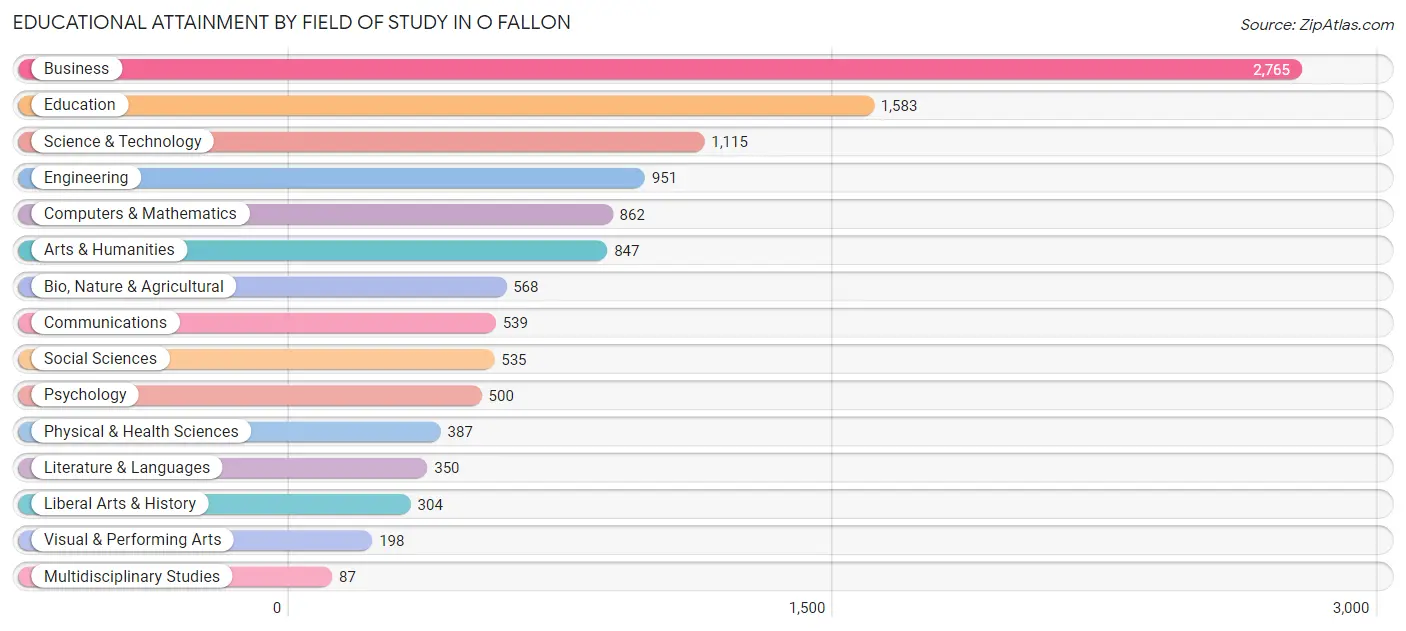
Educational Attainment by Field of Study in O Fallon
Business (2,765 | 23.8%), education (1,583 | 13.7%), science & technology (1,115 | 9.6%), engineering (951 | 8.2%), and computers & mathematics (862 | 7.4%) are the most common fields of study among 11,591 individuals in O Fallon who have obtained a bachelor's degree or higher.
| Field of Study | # Graduates | % Graduates |
| Computers & Mathematics | 862 | 7.4% |
| Bio, Nature & Agricultural | 568 | 4.9% |
| Physical & Health Sciences | 387 | 3.3% |
| Psychology | 500 | 4.3% |
| Social Sciences | 535 | 4.6% |
| Engineering | 951 | 8.2% |
| Multidisciplinary Studies | 87 | 0.7% |
| Science & Technology | 1,115 | 9.6% |
| Business | 2,765 | 23.8% |
| Education | 1,583 | 13.7% |
| Literature & Languages | 350 | 3.0% |
| Liberal Arts & History | 304 | 2.6% |
| Visual & Performing Arts | 198 | 1.7% |
| Communications | 539 | 4.6% |
| Arts & Humanities | 847 | 7.3% |
| Total | 11,591 | 100.0% |
Transportation & Commute in O Fallon
Vehicle Availability by Sex in O Fallon
The most prevalent vehicle ownership categories in O Fallon are males with 2 vehicles (3,781, accounting for 46.4%) and females with 2 vehicles (3,162, making up 55.1%).
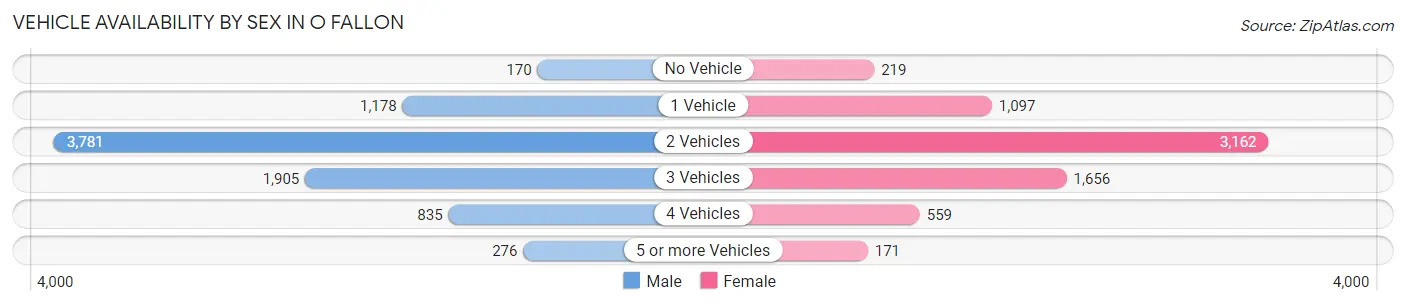
| Vehicles Available | Male | Female |
| No Vehicle | 170 (2.1%) | 219 (3.2%) |
| 1 Vehicle | 1,178 (14.5%) | 1,097 (16.0%) |
| 2 Vehicles | 3,781 (46.4%) | 3,162 (46.1%) |
| 3 Vehicles | 1,905 (23.4%) | 1,656 (24.1%) |
| 4 Vehicles | 835 (10.2%) | 559 (8.1%) |
| 5 or more Vehicles | 276 (3.4%) | 171 (2.5%) |
| Total | 8,145 (100.0%) | 6,864 (100.0%) |
Commute Time in O Fallon
The most frequently occuring commute durations in O Fallon are 10 to 14 minutes (1,995 commuters, 15.3%), 15 to 19 minutes (1,791 commuters, 13.7%), and 30 to 34 minutes (1,724 commuters, 13.2%).
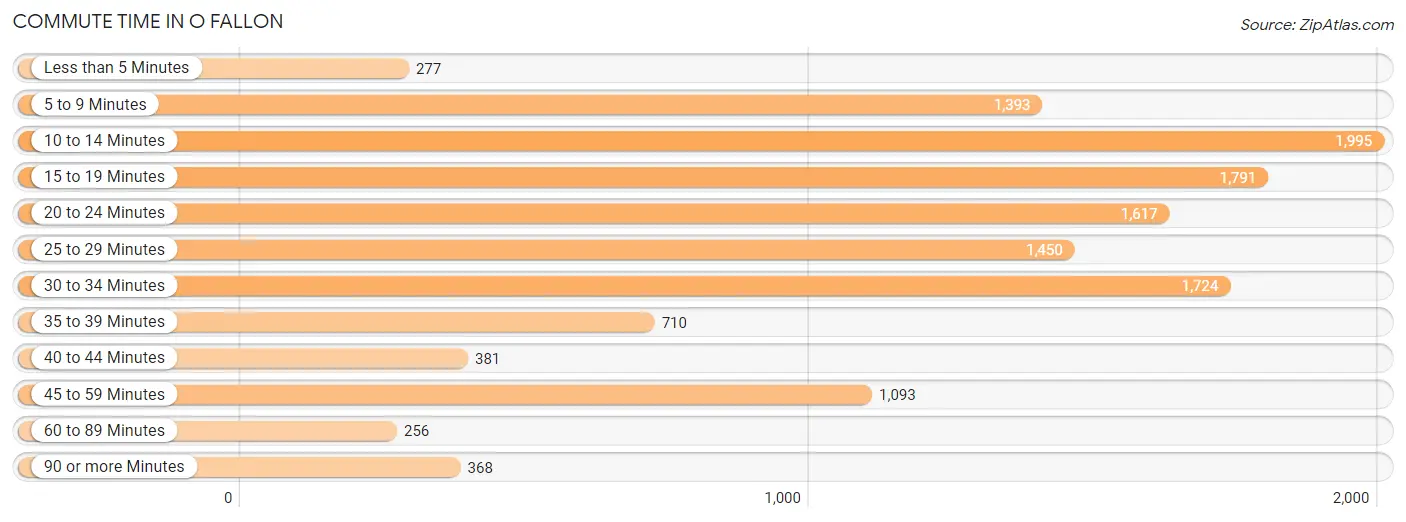
| Commute Time | # Commuters | % Commuters |
| Less than 5 Minutes | 277 | 2.1% |
| 5 to 9 Minutes | 1,393 | 10.7% |
| 10 to 14 Minutes | 1,995 | 15.3% |
| 15 to 19 Minutes | 1,791 | 13.7% |
| 20 to 24 Minutes | 1,617 | 12.4% |
| 25 to 29 Minutes | 1,450 | 11.1% |
| 30 to 34 Minutes | 1,724 | 13.2% |
| 35 to 39 Minutes | 710 | 5.4% |
| 40 to 44 Minutes | 381 | 2.9% |
| 45 to 59 Minutes | 1,093 | 8.4% |
| 60 to 89 Minutes | 256 | 2.0% |
| 90 or more Minutes | 368 | 2.8% |
Commute Time by Sex in O Fallon
The most common commute times in O Fallon are 15 to 19 minutes (991 commuters, 14.1%) for males and 10 to 14 minutes (1,063 commuters, 17.6%) for females.
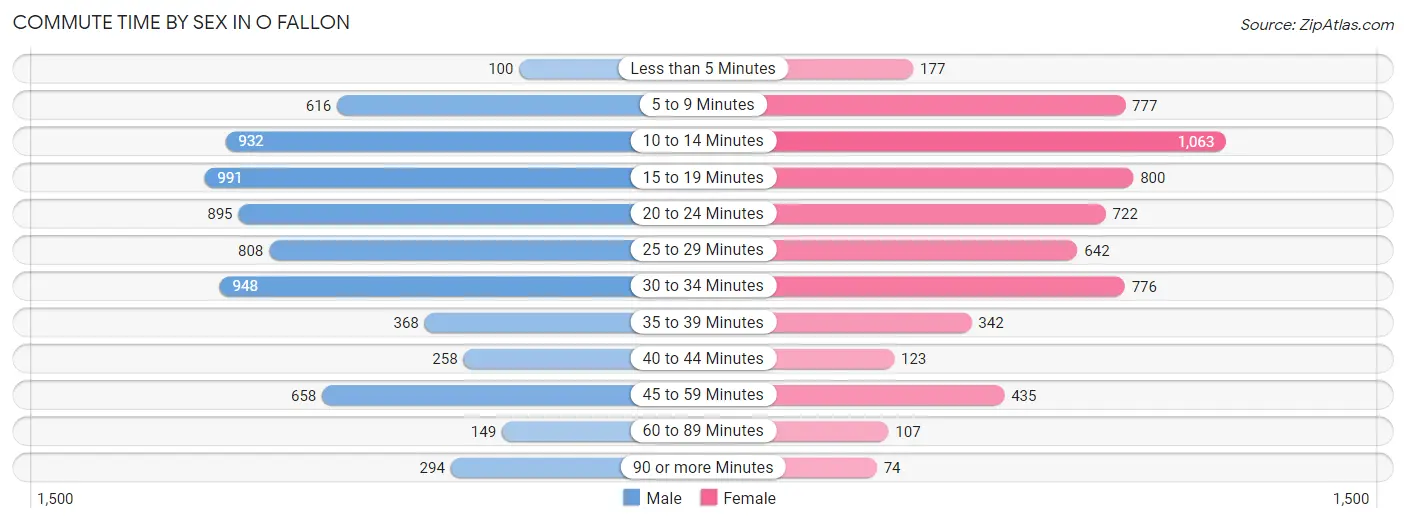
| Commute Time | Male | Female |
| Less than 5 Minutes | 100 (1.4%) | 177 (2.9%) |
| 5 to 9 Minutes | 616 (8.8%) | 777 (12.9%) |
| 10 to 14 Minutes | 932 (13.3%) | 1,063 (17.6%) |
| 15 to 19 Minutes | 991 (14.1%) | 800 (13.3%) |
| 20 to 24 Minutes | 895 (12.8%) | 722 (12.0%) |
| 25 to 29 Minutes | 808 (11.5%) | 642 (10.6%) |
| 30 to 34 Minutes | 948 (13.5%) | 776 (12.9%) |
| 35 to 39 Minutes | 368 (5.2%) | 342 (5.7%) |
| 40 to 44 Minutes | 258 (3.7%) | 123 (2.0%) |
| 45 to 59 Minutes | 658 (9.4%) | 435 (7.2%) |
| 60 to 89 Minutes | 149 (2.1%) | 107 (1.8%) |
| 90 or more Minutes | 294 (4.2%) | 74 (1.2%) |
Time of Departure to Work by Sex in O Fallon
The most frequent times of departure to work in O Fallon are 7:00 AM to 7:29 AM (1,136, 16.2%) for males and 7:00 AM to 7:29 AM (1,112, 18.4%) for females.
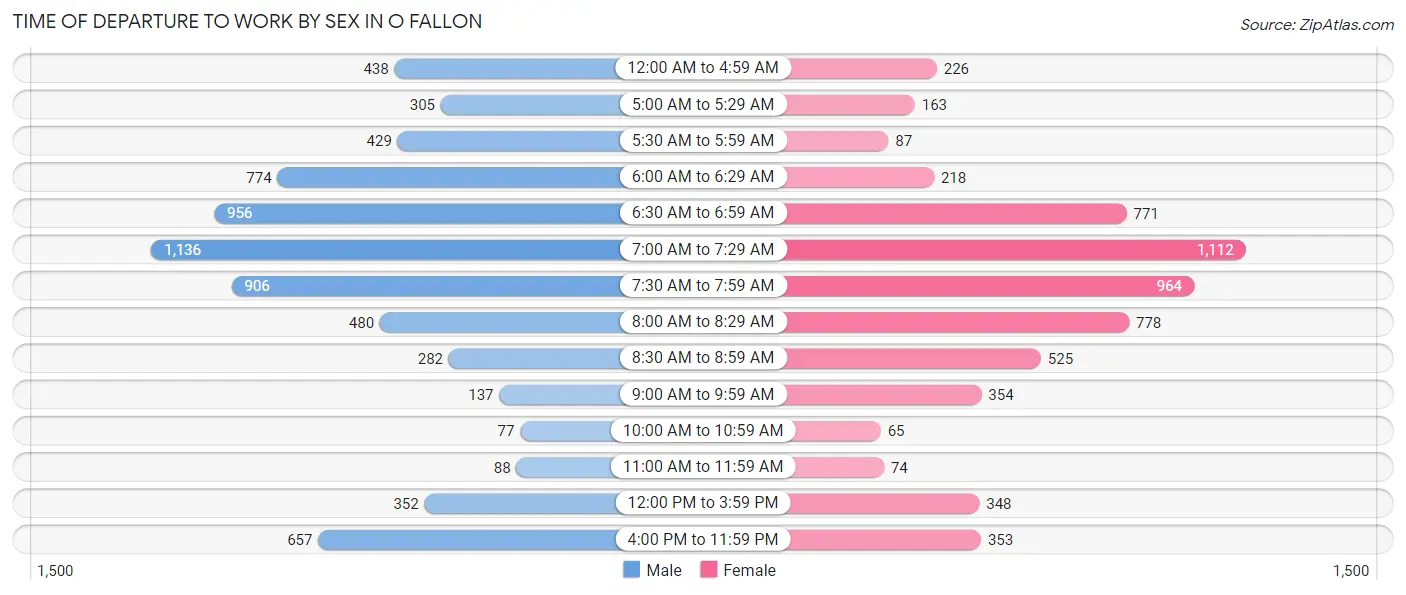
| Time of Departure | Male | Female |
| 12:00 AM to 4:59 AM | 438 (6.2%) | 226 (3.7%) |
| 5:00 AM to 5:29 AM | 305 (4.3%) | 163 (2.7%) |
| 5:30 AM to 5:59 AM | 429 (6.1%) | 87 (1.4%) |
| 6:00 AM to 6:29 AM | 774 (11.0%) | 218 (3.6%) |
| 6:30 AM to 6:59 AM | 956 (13.6%) | 771 (12.8%) |
| 7:00 AM to 7:29 AM | 1,136 (16.2%) | 1,112 (18.4%) |
| 7:30 AM to 7:59 AM | 906 (12.9%) | 964 (16.0%) |
| 8:00 AM to 8:29 AM | 480 (6.8%) | 778 (12.9%) |
| 8:30 AM to 8:59 AM | 282 (4.0%) | 525 (8.7%) |
| 9:00 AM to 9:59 AM | 137 (1.9%) | 354 (5.9%) |
| 10:00 AM to 10:59 AM | 77 (1.1%) | 65 (1.1%) |
| 11:00 AM to 11:59 AM | 88 (1.3%) | 74 (1.2%) |
| 12:00 PM to 3:59 PM | 352 (5.0%) | 348 (5.8%) |
| 4:00 PM to 11:59 PM | 657 (9.4%) | 353 (5.9%) |
| Total | 7,017 (100.0%) | 6,038 (100.0%) |
Housing Occupancy in O Fallon
Occupancy by Ownership in O Fallon
Of the total 12,093 dwellings in O Fallon, owner-occupied units account for 8,821 (72.9%), while renter-occupied units make up 3,272 (27.1%).
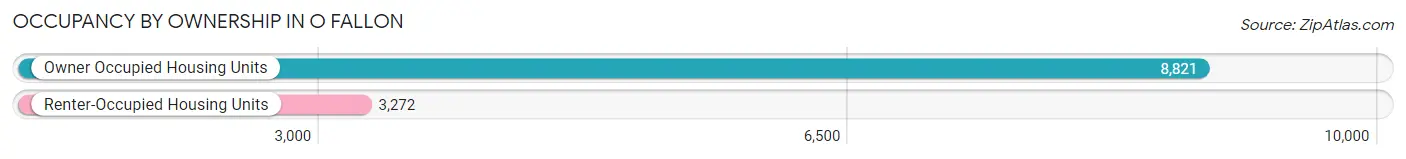
| Occupancy | # Housing Units | % Housing Units |
| Owner Occupied Housing Units | 8,821 | 72.9% |
| Renter-Occupied Housing Units | 3,272 | 27.1% |
| Total Occupied Housing Units | 12,093 | 100.0% |
Occupancy by Household Size in O Fallon
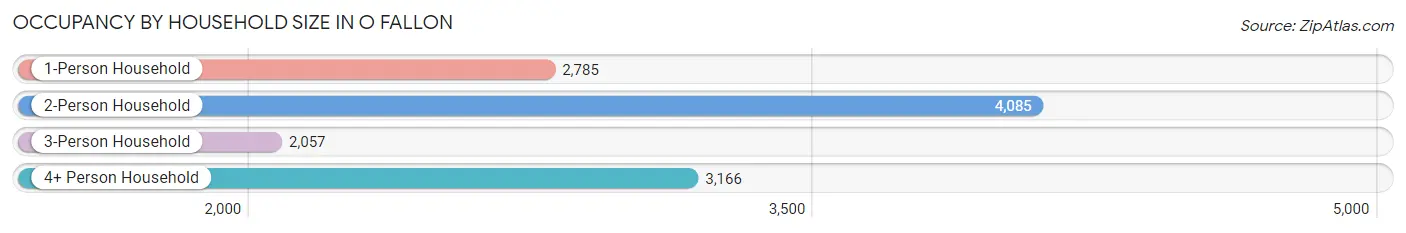
| Household Size | # Housing Units | % Housing Units |
| 1-Person Household | 2,785 | 23.0% |
| 2-Person Household | 4,085 | 33.8% |
| 3-Person Household | 2,057 | 17.0% |
| 4+ Person Household | 3,166 | 26.2% |
| Total Housing Units | 12,093 | 100.0% |
Occupancy by Ownership by Household Size in O Fallon
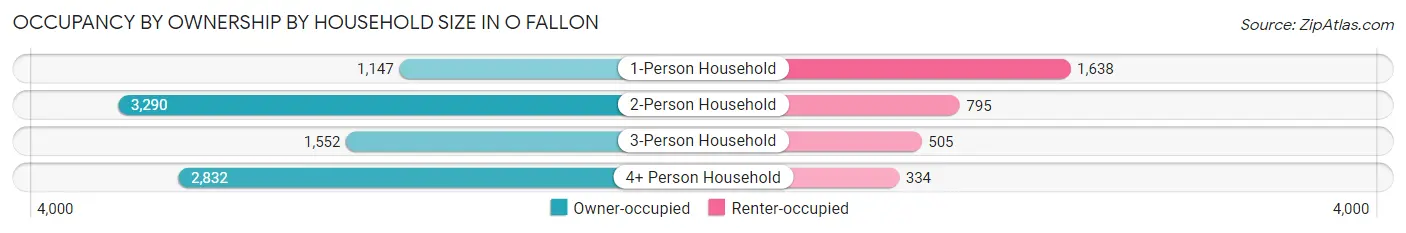
| Household Size | Owner-occupied | Renter-occupied |
| 1-Person Household | 1,147 (41.2%) | 1,638 (58.8%) |
| 2-Person Household | 3,290 (80.5%) | 795 (19.5%) |
| 3-Person Household | 1,552 (75.4%) | 505 (24.5%) |
| 4+ Person Household | 2,832 (89.4%) | 334 (10.5%) |
| Total Housing Units | 8,821 (72.9%) | 3,272 (27.1%) |
Occupancy by Educational Attainment in O Fallon
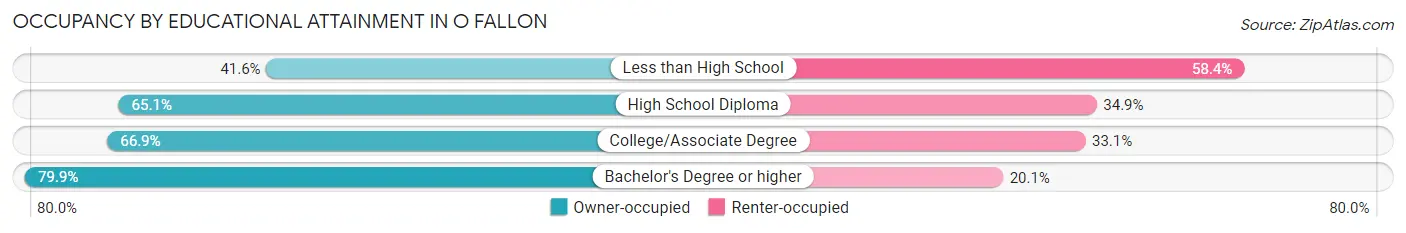
| Household Size | Owner-occupied | Renter-occupied |
| Less than High School | 147 (41.6%) | 206 (58.4%) |
| High School Diploma | 954 (65.1%) | 512 (34.9%) |
| College/Associate Degree | 2,519 (66.9%) | 1,248 (33.1%) |
| Bachelor's Degree or higher | 5,201 (79.9%) | 1,306 (20.1%) |
Occupancy by Age of Householder in O Fallon
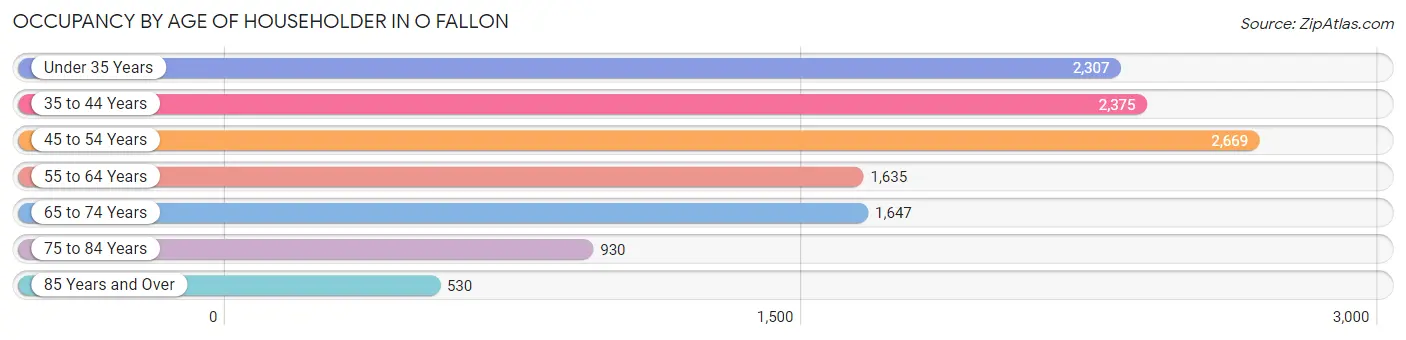
| Age Bracket | # Households | % Households |
| Under 35 Years | 2,307 | 19.1% |
| 35 to 44 Years | 2,375 | 19.6% |
| 45 to 54 Years | 2,669 | 22.1% |
| 55 to 64 Years | 1,635 | 13.5% |
| 65 to 74 Years | 1,647 | 13.6% |
| 75 to 84 Years | 930 | 7.7% |
| 85 Years and Over | 530 | 4.4% |
| Total | 12,093 | 100.0% |
Housing Finances in O Fallon
Median Income by Occupancy in O Fallon
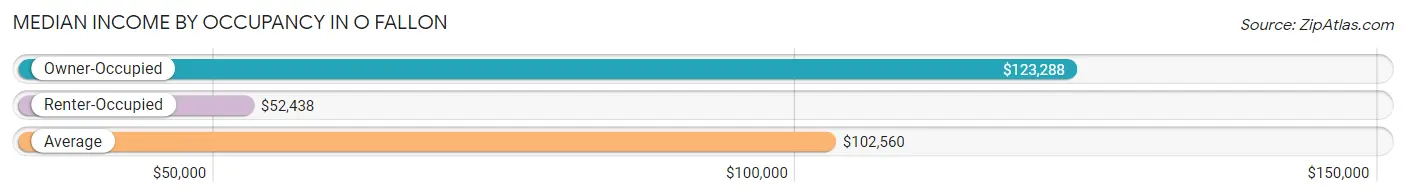
| Occupancy Type | # Households | Median Income |
| Owner-Occupied | 8,821 (72.9%) | $123,288 |
| Renter-Occupied | 3,272 (27.1%) | $52,438 |
| Average | 12,093 (100.0%) | $102,560 |
Occupancy by Householder Income Bracket in O Fallon
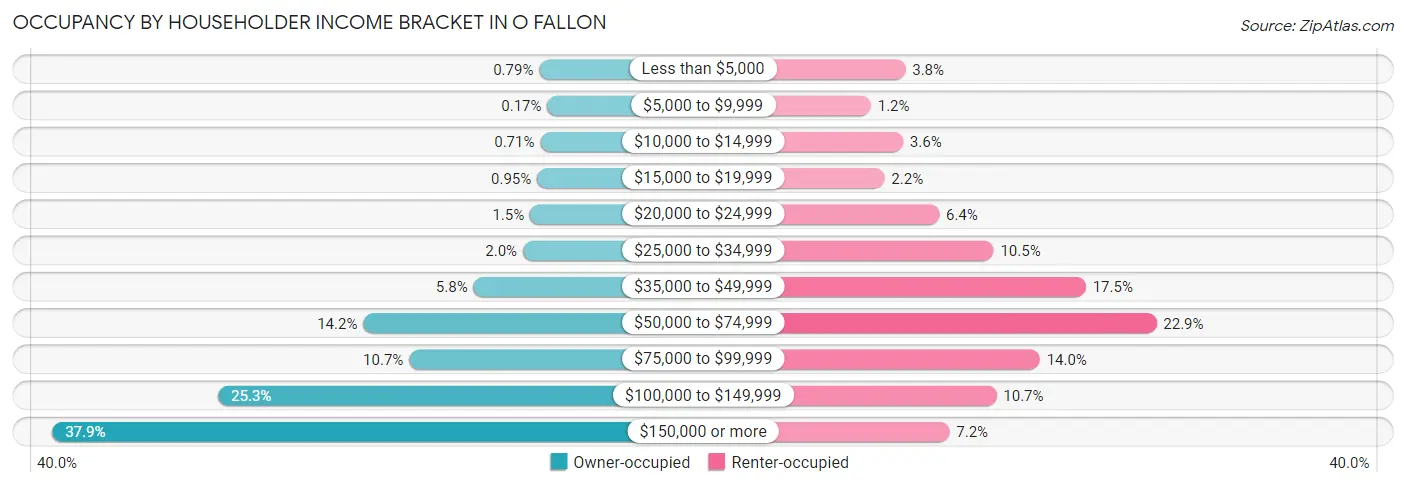
| Income Bracket | Owner-occupied | Renter-occupied |
| Less than $5,000 | 70 (0.8%) | 124 (3.8%) |
| $5,000 to $9,999 | 15 (0.2%) | 38 (1.2%) |
| $10,000 to $14,999 | 63 (0.7%) | 118 (3.6%) |
| $15,000 to $19,999 | 84 (0.9%) | 72 (2.2%) |
| $20,000 to $24,999 | 131 (1.5%) | 208 (6.4%) |
| $25,000 to $34,999 | 179 (2.0%) | 344 (10.5%) |
| $35,000 to $49,999 | 512 (5.8%) | 574 (17.5%) |
| $50,000 to $74,999 | 1,253 (14.2%) | 750 (22.9%) |
| $75,000 to $99,999 | 944 (10.7%) | 459 (14.0%) |
| $100,000 to $149,999 | 2,228 (25.3%) | 351 (10.7%) |
| $150,000 or more | 3,342 (37.9%) | 234 (7.1%) |
| Total | 8,821 (100.0%) | 3,272 (100.0%) |
Monthly Housing Cost Tiers in O Fallon
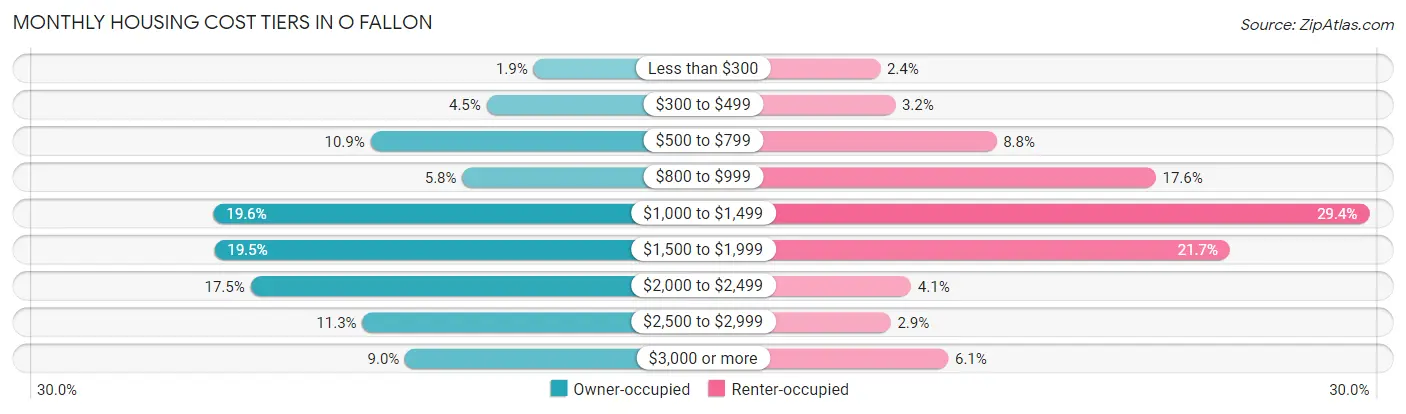
| Monthly Cost | Owner-occupied | Renter-occupied |
| Less than $300 | 167 (1.9%) | 77 (2.4%) |
| $300 to $499 | 395 (4.5%) | 104 (3.2%) |
| $500 to $799 | 961 (10.9%) | 287 (8.8%) |
| $800 to $999 | 513 (5.8%) | 575 (17.6%) |
| $1,000 to $1,499 | 1,726 (19.6%) | 961 (29.4%) |
| $1,500 to $1,999 | 1,722 (19.5%) | 709 (21.7%) |
| $2,000 to $2,499 | 1,545 (17.5%) | 133 (4.1%) |
| $2,500 to $2,999 | 1,000 (11.3%) | 96 (2.9%) |
| $3,000 or more | 792 (9.0%) | 200 (6.1%) |
| Total | 8,821 (100.0%) | 3,272 (100.0%) |
Physical Housing Characteristics in O Fallon
Housing Structures in O Fallon
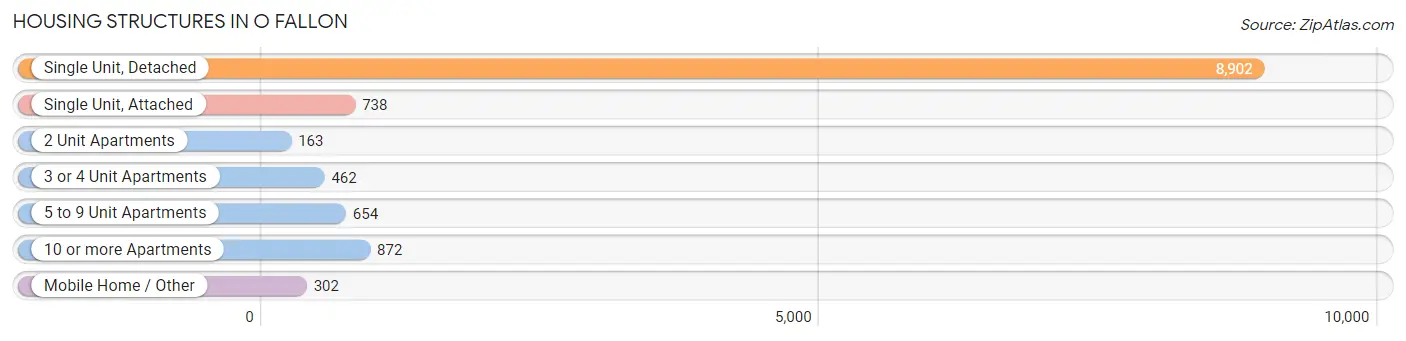
| Structure Type | # Housing Units | % Housing Units |
| Single Unit, Detached | 8,902 | 73.6% |
| Single Unit, Attached | 738 | 6.1% |
| 2 Unit Apartments | 163 | 1.3% |
| 3 or 4 Unit Apartments | 462 | 3.8% |
| 5 to 9 Unit Apartments | 654 | 5.4% |
| 10 or more Apartments | 872 | 7.2% |
| Mobile Home / Other | 302 | 2.5% |
| Total | 12,093 | 100.0% |
Housing Structures by Occupancy in O Fallon
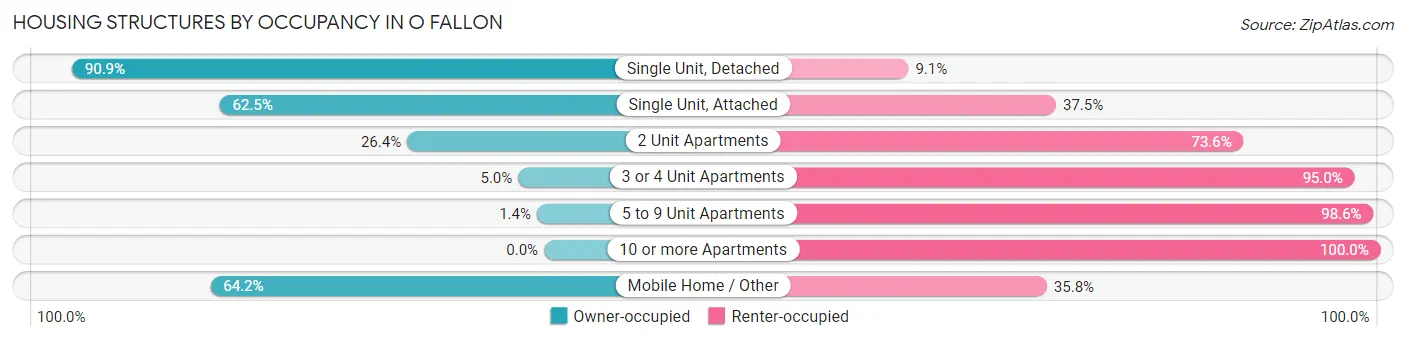
| Structure Type | Owner-occupied | Renter-occupied |
| Single Unit, Detached | 8,091 (90.9%) | 811 (9.1%) |
| Single Unit, Attached | 461 (62.5%) | 277 (37.5%) |
| 2 Unit Apartments | 43 (26.4%) | 120 (73.6%) |
| 3 or 4 Unit Apartments | 23 (5.0%) | 439 (95.0%) |
| 5 to 9 Unit Apartments | 9 (1.4%) | 645 (98.6%) |
| 10 or more Apartments | 0 (0.0%) | 872 (100.0%) |
| Mobile Home / Other | 194 (64.2%) | 108 (35.8%) |
| Total | 8,821 (72.9%) | 3,272 (27.1%) |
Housing Structures by Number of Rooms in O Fallon
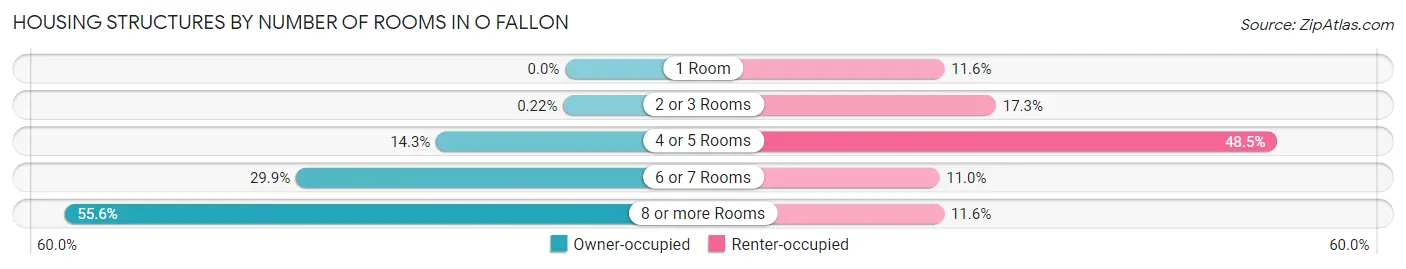
| Number of Rooms | Owner-occupied | Renter-occupied |
| 1 Room | 0 (0.0%) | 379 (11.6%) |
| 2 or 3 Rooms | 19 (0.2%) | 566 (17.3%) |
| 4 or 5 Rooms | 1,263 (14.3%) | 1,588 (48.5%) |
| 6 or 7 Rooms | 2,636 (29.9%) | 361 (11.0%) |
| 8 or more Rooms | 4,903 (55.6%) | 378 (11.6%) |
| Total | 8,821 (100.0%) | 3,272 (100.0%) |
Housing Structure by Heating Type in O Fallon
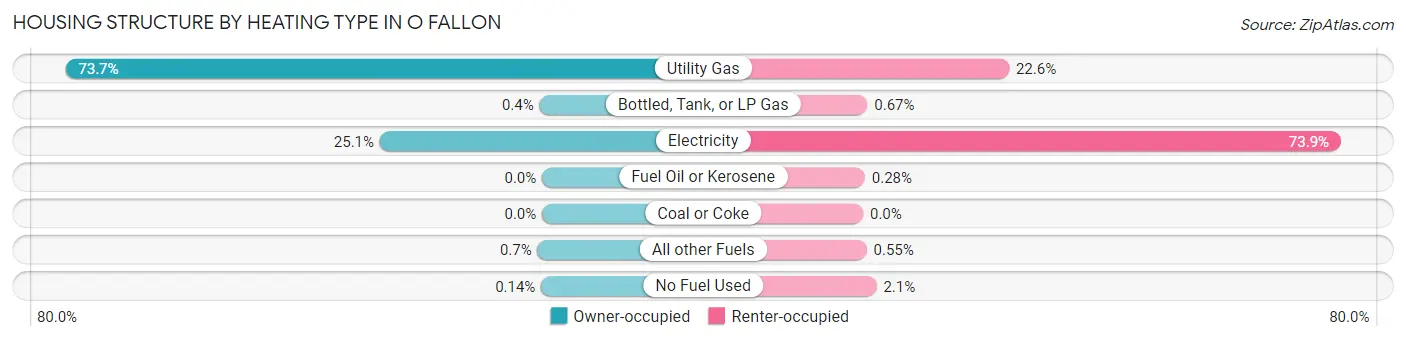
| Heating Type | Owner-occupied | Renter-occupied |
| Utility Gas | 6,500 (73.7%) | 738 (22.6%) |
| Bottled, Tank, or LP Gas | 35 (0.4%) | 22 (0.7%) |
| Electricity | 2,212 (25.1%) | 2,417 (73.9%) |
| Fuel Oil or Kerosene | 0 (0.0%) | 9 (0.3%) |
| Coal or Coke | 0 (0.0%) | 0 (0.0%) |
| All other Fuels | 62 (0.7%) | 18 (0.5%) |
| No Fuel Used | 12 (0.1%) | 68 (2.1%) |
| Total | 8,821 (100.0%) | 3,272 (100.0%) |
Household Vehicle Usage in O Fallon
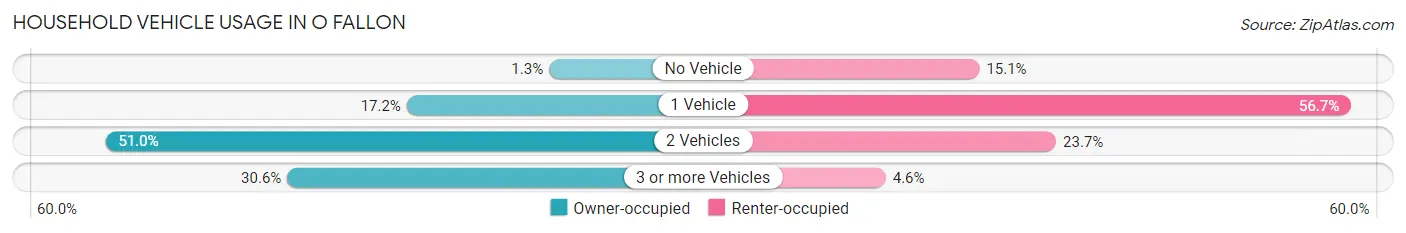
| Vehicles per Household | Owner-occupied | Renter-occupied |
| No Vehicle | 111 (1.3%) | 493 (15.1%) |
| 1 Vehicle | 1,517 (17.2%) | 1,855 (56.7%) |
| 2 Vehicles | 4,495 (51.0%) | 774 (23.7%) |
| 3 or more Vehicles | 2,698 (30.6%) | 150 (4.6%) |
| Total | 8,821 (100.0%) | 3,272 (100.0%) |
Real Estate & Mortgages in O Fallon
Real Estate and Mortgage Overview in O Fallon
| Characteristic | Without Mortgage | With Mortgage |
| Housing Units | 2,144 | 6,677 |
| Median Property Value | $214,200 | $275,700 |
| Median Household Income | $87,604 | $2,747 |
| Monthly Housing Costs | $733 | $792 |
| Real Estate Taxes | $4,396 | $283 |
Property Value by Mortgage Status in O Fallon
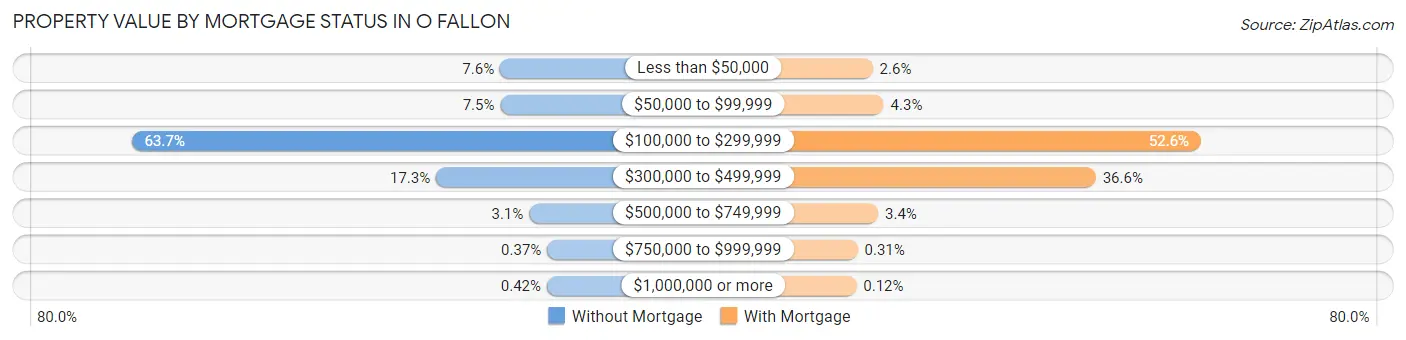
| Property Value | Without Mortgage | With Mortgage |
| Less than $50,000 | 162 (7.6%) | 174 (2.6%) |
| $50,000 to $99,999 | 161 (7.5%) | 286 (4.3%) |
| $100,000 to $299,999 | 1,366 (63.7%) | 3,514 (52.6%) |
| $300,000 to $499,999 | 371 (17.3%) | 2,444 (36.6%) |
| $500,000 to $749,999 | 67 (3.1%) | 230 (3.4%) |
| $750,000 to $999,999 | 8 (0.4%) | 21 (0.3%) |
| $1,000,000 or more | 9 (0.4%) | 8 (0.1%) |
| Total | 2,144 (100.0%) | 6,677 (100.0%) |
Household Income by Mortgage Status in O Fallon
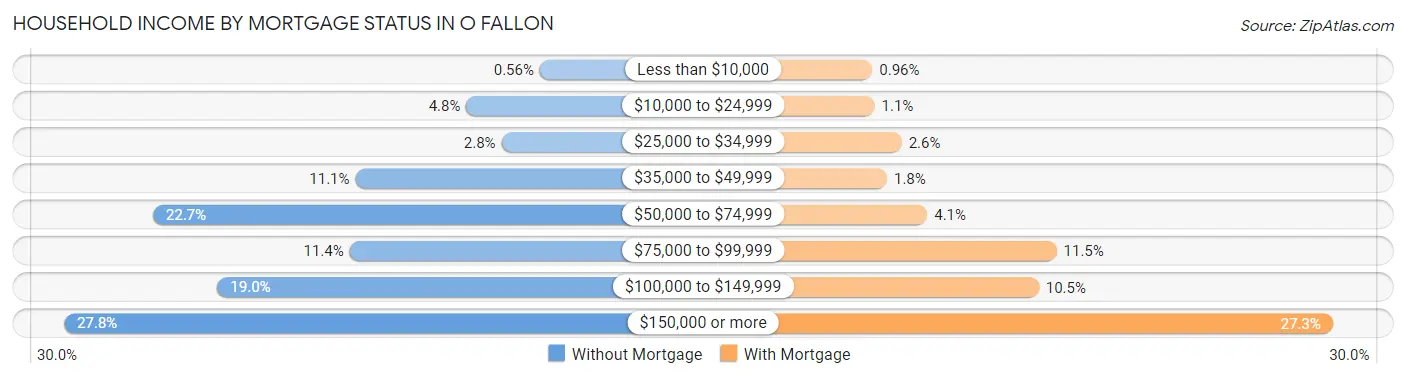
| Household Income | Without Mortgage | With Mortgage |
| Less than $10,000 | 12 (0.6%) | 64 (1.0%) |
| $10,000 to $24,999 | 102 (4.8%) | 73 (1.1%) |
| $25,000 to $34,999 | 59 (2.8%) | 176 (2.6%) |
| $35,000 to $49,999 | 238 (11.1%) | 120 (1.8%) |
| $50,000 to $74,999 | 486 (22.7%) | 274 (4.1%) |
| $75,000 to $99,999 | 245 (11.4%) | 767 (11.5%) |
| $100,000 to $149,999 | 407 (19.0%) | 699 (10.5%) |
| $150,000 or more | 595 (27.8%) | 1,821 (27.3%) |
| Total | 2,144 (100.0%) | 6,677 (100.0%) |
Property Value to Household Income Ratio in O Fallon
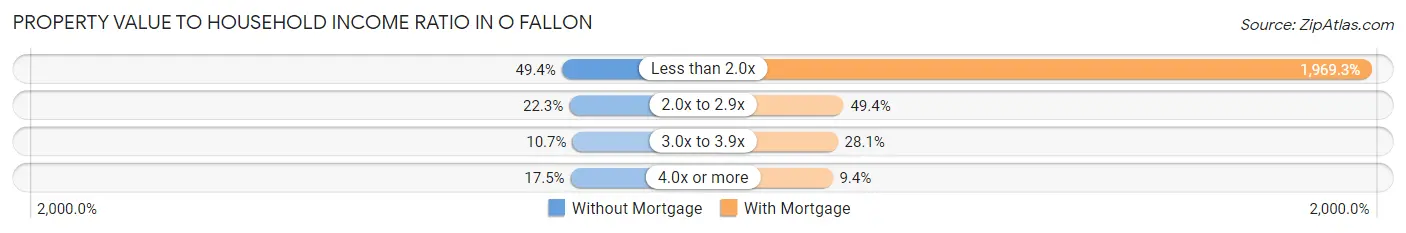
| Value-to-Income Ratio | Without Mortgage | With Mortgage |
| Less than 2.0x | 1,060 (49.4%) | 131,492 (1,969.3%) |
| 2.0x to 2.9x | 479 (22.3%) | 3,295 (49.3%) |
| 3.0x to 3.9x | 229 (10.7%) | 1,879 (28.1%) |
| 4.0x or more | 376 (17.5%) | 624 (9.3%) |
| Total | 2,144 (100.0%) | 6,677 (100.0%) |
Real Estate Taxes by Mortgage Status in O Fallon

| Property Taxes | Without Mortgage | With Mortgage |
| Less than $800 | 129 (6.0%) | 12 (0.2%) |
| $800 to $1,499 | 146 (6.8%) | 125 (1.9%) |
| $800 to $1,499 | 1,674 (78.1%) | 213 (3.2%) |
| Total | 2,144 (100.0%) | 6,677 (100.0%) |
Health & Disability in O Fallon
Health Insurance Coverage by Age in O Fallon
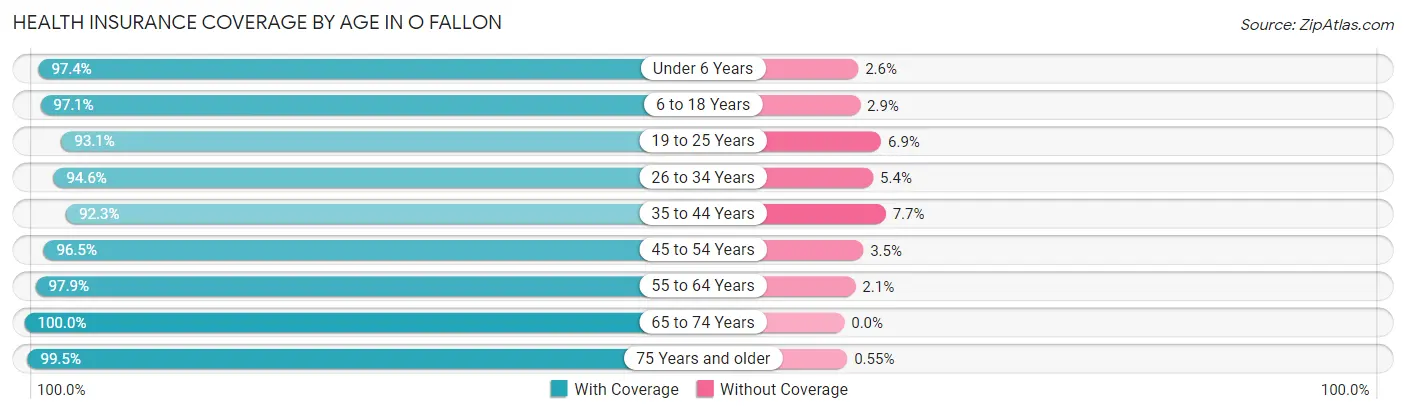
| Age Bracket | With Coverage | Without Coverage |
| Under 6 Years | 2,785 (97.4%) | 74 (2.6%) |
| 6 to 18 Years | 6,361 (97.1%) | 193 (2.9%) |
| 19 to 25 Years | 1,780 (93.1%) | 131 (6.9%) |
| 26 to 34 Years | 3,256 (94.6%) | 185 (5.4%) |
| 35 to 44 Years | 3,881 (92.3%) | 325 (7.7%) |
| 45 to 54 Years | 4,232 (96.5%) | 155 (3.5%) |
| 55 to 64 Years | 2,986 (97.9%) | 63 (2.1%) |
| 65 to 74 Years | 2,786 (100.0%) | 0 (0.0%) |
| 75 Years and older | 2,182 (99.5%) | 12 (0.5%) |
| Total | 30,249 (96.4%) | 1,138 (3.6%) |
Health Insurance Coverage by Citizenship Status in O Fallon

| Citizenship Status | With Coverage | Without Coverage |
| Native Born | 2,785 (97.4%) | 74 (2.6%) |
| Foreign Born, Citizen | 6,361 (97.1%) | 193 (2.9%) |
| Foreign Born, not a Citizen | 1,780 (93.1%) | 131 (6.9%) |
Health Insurance Coverage by Household Income in O Fallon
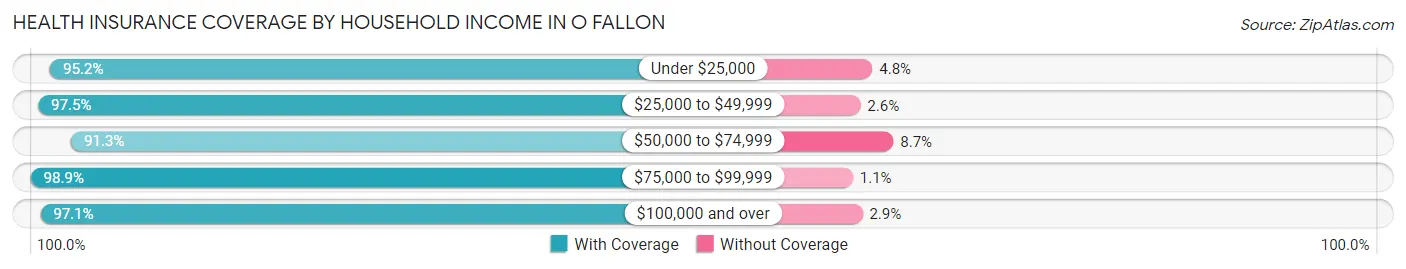
| Household Income | With Coverage | Without Coverage |
| Under $25,000 | 1,376 (95.2%) | 69 (4.8%) |
| $25,000 to $49,999 | 2,832 (97.5%) | 74 (2.5%) |
| $50,000 to $74,999 | 4,112 (91.3%) | 393 (8.7%) |
| $75,000 to $99,999 | 3,251 (98.9%) | 37 (1.1%) |
| $100,000 and over | 18,678 (97.1%) | 565 (2.9%) |
Public vs Private Health Insurance Coverage by Age in O Fallon
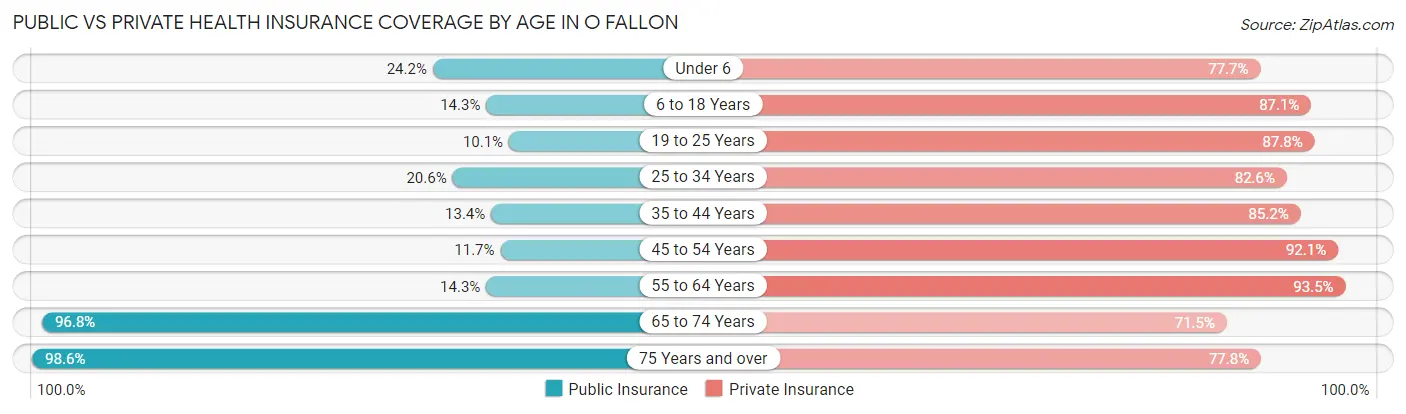
| Age Bracket | Public Insurance | Private Insurance |
| Under 6 | 693 (24.2%) | 2,221 (77.7%) |
| 6 to 18 Years | 938 (14.3%) | 5,710 (87.1%) |
| 19 to 25 Years | 193 (10.1%) | 1,677 (87.8%) |
| 25 to 34 Years | 708 (20.6%) | 2,842 (82.6%) |
| 35 to 44 Years | 564 (13.4%) | 3,582 (85.2%) |
| 45 to 54 Years | 513 (11.7%) | 4,040 (92.1%) |
| 55 to 64 Years | 437 (14.3%) | 2,850 (93.5%) |
| 65 to 74 Years | 2,696 (96.8%) | 1,991 (71.5%) |
| 75 Years and over | 2,163 (98.6%) | 1,707 (77.8%) |
| Total | 8,905 (28.4%) | 26,620 (84.8%) |
Disability Status by Sex by Age in O Fallon
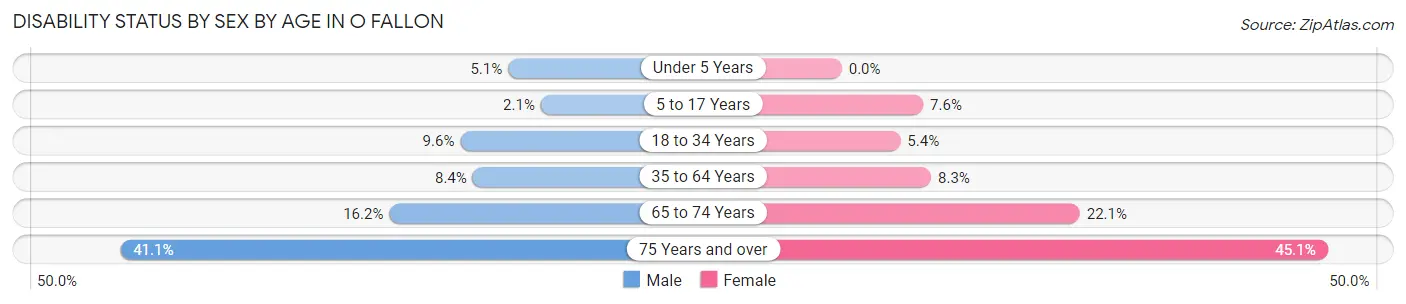
| Age Bracket | Male | Female |
| Under 5 Years | 67 (5.1%) | 0 (0.0%) |
| 5 to 17 Years | 69 (2.1%) | 261 (7.5%) |
| 18 to 34 Years | 289 (9.6%) | 147 (5.4%) |
| 35 to 64 Years | 457 (8.4%) | 515 (8.3%) |
| 65 to 74 Years | 200 (16.2%) | 342 (22.1%) |
| 75 Years and over | 352 (41.1%) | 603 (45.1%) |
Disability Class by Sex by Age in O Fallon
Disability Class: Hearing Difficulty
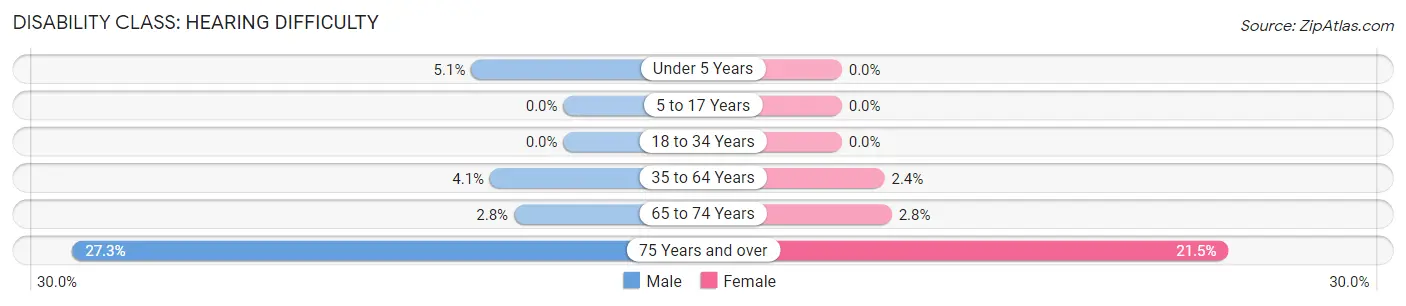
| Age Bracket | Male | Female |
| Under 5 Years | 67 (5.1%) | 0 (0.0%) |
| 5 to 17 Years | 0 (0.0%) | 0 (0.0%) |
| 18 to 34 Years | 0 (0.0%) | 0 (0.0%) |
| 35 to 64 Years | 222 (4.1%) | 148 (2.4%) |
| 65 to 74 Years | 34 (2.8%) | 43 (2.8%) |
| 75 Years and over | 234 (27.3%) | 288 (21.5%) |
Disability Class: Vision Difficulty
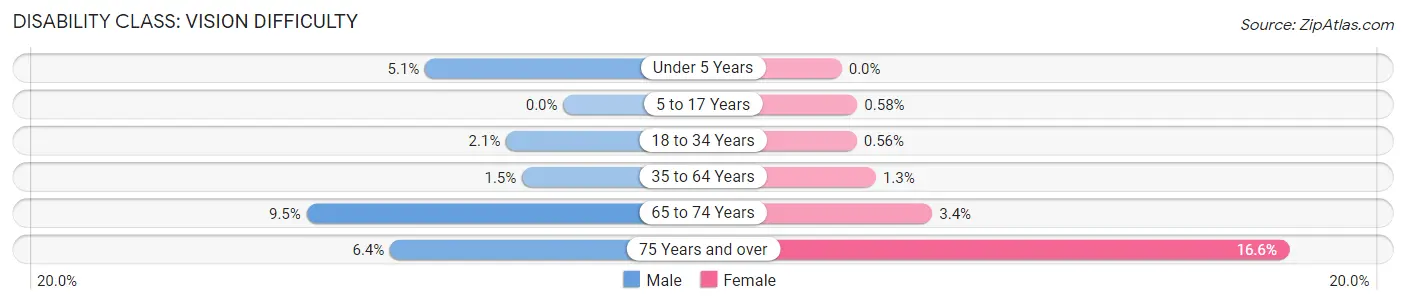
| Age Bracket | Male | Female |
| Under 5 Years | 67 (5.1%) | 0 (0.0%) |
| 5 to 17 Years | 0 (0.0%) | 20 (0.6%) |
| 18 to 34 Years | 64 (2.1%) | 15 (0.6%) |
| 35 to 64 Years | 83 (1.5%) | 79 (1.3%) |
| 65 to 74 Years | 118 (9.5%) | 52 (3.4%) |
| 75 Years and over | 55 (6.4%) | 222 (16.6%) |
Disability Class: Cognitive Difficulty
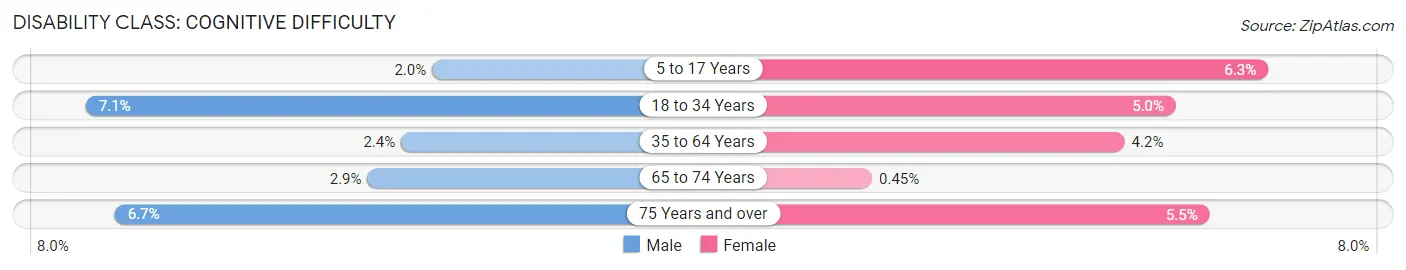
| Age Bracket | Male | Female |
| 5 to 17 Years | 64 (1.9%) | 219 (6.3%) |
| 18 to 34 Years | 214 (7.1%) | 134 (5.0%) |
| 35 to 64 Years | 131 (2.4%) | 261 (4.2%) |
| 65 to 74 Years | 36 (2.9%) | 7 (0.4%) |
| 75 Years and over | 57 (6.7%) | 73 (5.5%) |
Disability Class: Ambulatory Difficulty
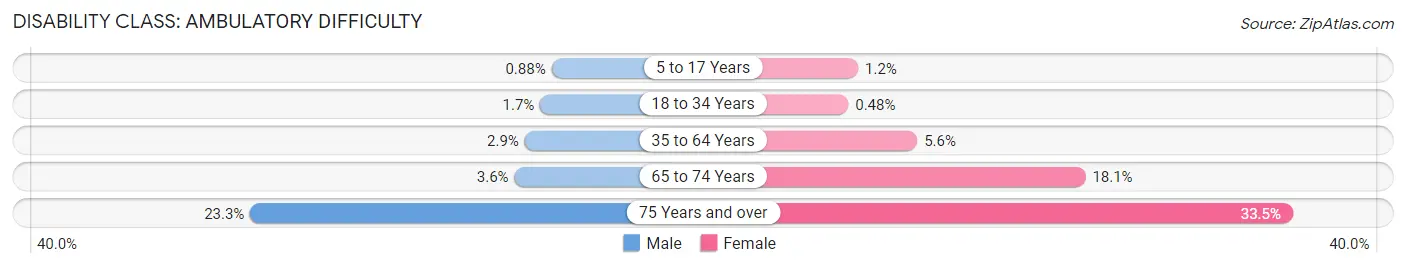
| Age Bracket | Male | Female |
| 5 to 17 Years | 29 (0.9%) | 42 (1.2%) |
| 18 to 34 Years | 52 (1.7%) | 13 (0.5%) |
| 35 to 64 Years | 156 (2.9%) | 348 (5.6%) |
| 65 to 74 Years | 45 (3.6%) | 280 (18.1%) |
| 75 Years and over | 199 (23.3%) | 448 (33.5%) |
Disability Class: Self-Care Difficulty
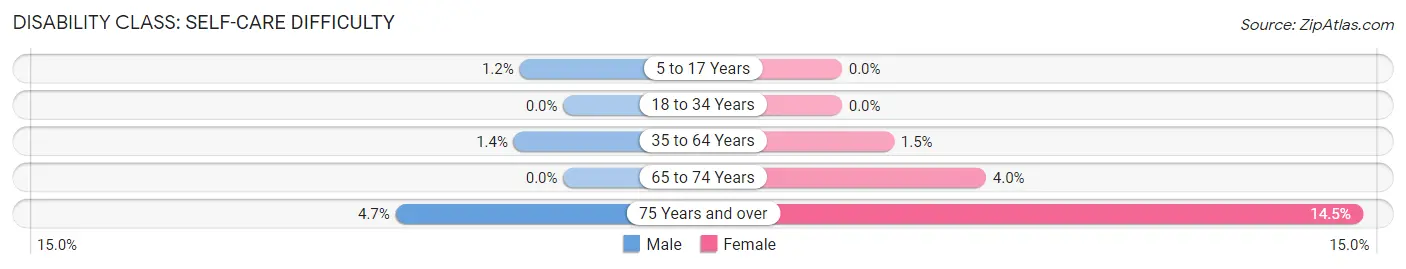
| Age Bracket | Male | Female |
| 5 to 17 Years | 40 (1.2%) | 0 (0.0%) |
| 18 to 34 Years | 0 (0.0%) | 0 (0.0%) |
| 35 to 64 Years | 75 (1.4%) | 90 (1.5%) |
| 65 to 74 Years | 0 (0.0%) | 62 (4.0%) |
| 75 Years and over | 40 (4.7%) | 194 (14.5%) |
Technology Access in O Fallon
Computing Device Access in O Fallon
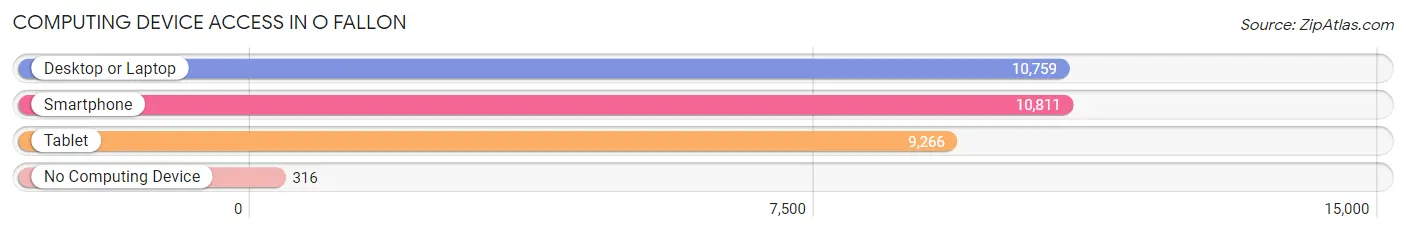
| Device Type | # Households | % Households |
| Desktop or Laptop | 10,759 | 89.0% |
| Smartphone | 10,811 | 89.4% |
| Tablet | 9,266 | 76.6% |
| No Computing Device | 316 | 2.6% |
| Total | 12,093 | 100.0% |
Internet Access in O Fallon
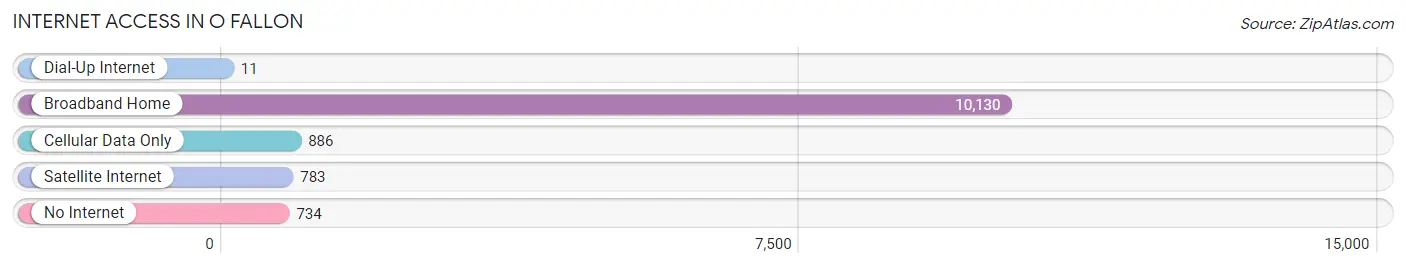
| Internet Type | # Households | % Households |
| Dial-Up Internet | 11 | 0.1% |
| Broadband Home | 10,130 | 83.8% |
| Cellular Data Only | 886 | 7.3% |
| Satellite Internet | 783 | 6.5% |
| No Internet | 734 | 6.1% |
| Total | 12,093 | 100.0% |
O Fallon Summary
O'Fallon is a city located in St. Clair County, Illinois, United States. It is part of the Metro-East region of the Greater St. Louis metropolitan area. As of the 2010 census, the city had a population of 28,281. The city is the third largest city in the Metro-East region, behind Belleville and Edwardsville.
History
The area that is now O'Fallon was first settled in the early 19th century by French-Canadian immigrants. The town was originally known as "Caldwell's Settlement" and was named after James Caldwell, a local landowner. In 1853, the town was renamed O'Fallon in honor of John O'Fallon, a prominent St. Louis businessman and philanthropist.
The city was officially incorporated in 1874. During the late 19th century, O'Fallon experienced rapid growth and development, becoming a major industrial center. The city was home to several factories, including a brickyard, a canning factory, and a brewery.
In the early 20th century, O'Fallon continued to grow and prosper. The city was home to several large businesses, including a lumber mill, a furniture factory, and a shoe factory. The city also had a thriving agricultural industry, with several farms located in the area.
Geography
O'Fallon is located in southwestern St. Clair County, approximately 25 miles east of St. Louis. The city is situated along the banks of the Kaskaskia River. The city has a total area of 16.2 square miles, of which 16.1 square miles is land and 0.1 square miles is water.
The city is located in the Central Lowland region of the United States. The climate is characterized by hot, humid summers and cold, wet winters. The average annual temperature is 54°F, and the average annual precipitation is 40 inches.
Economy
O'Fallon's economy is largely based on manufacturing and retail. The city is home to several large manufacturing companies, including O'Fallon Industries, a manufacturer of industrial equipment, and O'Fallon Manufacturing, a manufacturer of automotive parts. The city is also home to several large retail stores, including Walmart, Target, and Kohl's.
The city is also home to several large employers, including Scott Air Force Base, which is located just outside of the city limits. The base is home to more than 10,000 military personnel and civilian employees.
Demographics
As of the 2010 census, there were 28,281 people, 10,845 households, and 7,717 families residing in the city. The population density was 1,749.3 people per square mile. The racial makeup of the city was 87.3% White, 6.7% African American, 0.3% Native American, 1.7% Asian, 0.1% Pacific Islander, 1.7% from other races, and 2.1% from two or more races. Hispanic or Latino of any race were 4.3% of the population.
The median income for a household in the city was $62,917, and the median income for a family was $76,917. The per capita income for the city was $30,917. About 4.3% of families and 5.7% of the population were below the poverty line, including 7.2% of those under age 18 and 4.3% of those age 65 or over.
Common Questions
What is Per Capita Income in O Fallon?
Per Capita income in O Fallon is $47,901.
What is the Median Family Income in O Fallon?
Median Family Income in O Fallon is $123,695.
What is the Median Household income in O Fallon?
Median Household Income in O Fallon is $102,560.
What is Income or Wage Gap in O Fallon?
Income or Wage Gap in O Fallon is 42.6%.
Women in O Fallon earn 57.4 cents for every dollar earned by a man.
What is Inequality or Gini Index in O Fallon?
Inequality or Gini Index in O Fallon is 0.41.
What is the Total Population of O Fallon?
Total Population of O Fallon is 32,104.
What is the Total Male Population of O Fallon?
Total Male Population of O Fallon is 15,732.
What is the Total Female Population of O Fallon?
Total Female Population of O Fallon is 16,372.
What is the Ratio of Males per 100 Females in O Fallon?
There are 96.09 Males per 100 Females in O Fallon.
What is the Ratio of Females per 100 Males in O Fallon?
There are 104.07 Females per 100 Males in O Fallon.
What is the Median Population Age in O Fallon?
Median Population Age in O Fallon is 37.3 Years.
What is the Average Family Size in O Fallon
Average Family Size in O Fallon is 3.1 People.
What is the Average Household Size in O Fallon
Average Household Size in O Fallon is 2.6 People.
How Large is the Labor Force in O Fallon?
There are 16,030 People in the Labor Forcein in O Fallon.
What is the Percentage of People in the Labor Force in O Fallon?
66.8% of People are in the Labor Force in O Fallon.
What is the Unemployment Rate in O Fallon?
Unemployment Rate in O Fallon is 3.6%.