Metamora, IL Map & Demographics
Metamora Map
Metamora Overview
$45,298
PER CAPITA INCOME
$124,250
AVG FAMILY INCOME
$83,793
AVG HOUSEHOLD INCOME
40.3%
WAGE / INCOME GAP [ % ]
59.7¢/ $1
WAGE / INCOME GAP [ $ ]
0.40
INEQUALITY / GINI INDEX
4,065
TOTAL POPULATION
1,789
MALE POPULATION
2,276
FEMALE POPULATION
78.60
MALES / 100 FEMALES
127.22
FEMALES / 100 MALES
36.7
MEDIAN AGE
3.0
AVG FAMILY SIZE
2.4
AVG HOUSEHOLD SIZE
2,136
LABOR FORCE [ PEOPLE ]
70.3%
PERCENT IN LABOR FORCE
Metamora Zip Codes
Metamora Area Codes
Income in Metamora
Income Overview in Metamora
Per Capita Income in Metamora is $45,298, while median incomes of families and households are $124,250 and $83,793 respectively.
| Characteristic | Number | Measure |
| Per Capita Income | 4,065 | $45,298 |
| Median Family Income | 1,107 | $124,250 |
| Mean Family Income | 1,107 | $136,954 |
| Median Household Income | 1,668 | $83,793 |
| Mean Household Income | 1,668 | $109,756 |
| Income Deficit | 1,107 | $0 |
| Wage / Income Gap (%) | 4,065 | 40.32% |
| Wage / Income Gap ($) | 4,065 | 59.68¢ per $1 |
| Gini / Inequality Index | 4,065 | 0.40 |
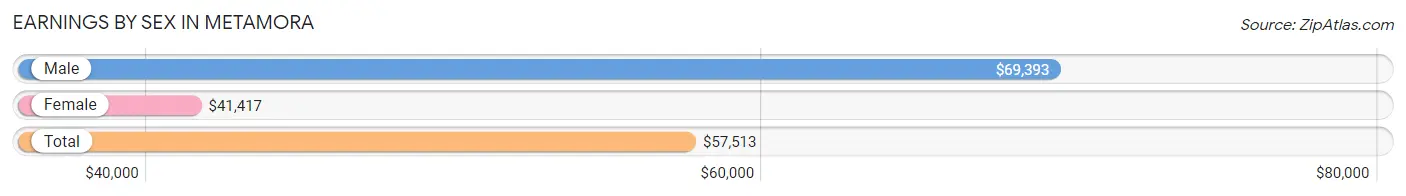
Earnings by Sex in Metamora
Average Earnings in Metamora are $57,513, $69,393 for men and $41,417 for women, a difference of 40.3%.
| Sex | Number | Average Earnings |
| Male | 997 (46.0%) | $69,393 |
| Female | 1,172 (54.0%) | $41,417 |
| Total | 2,169 (100.0%) | $57,513 |
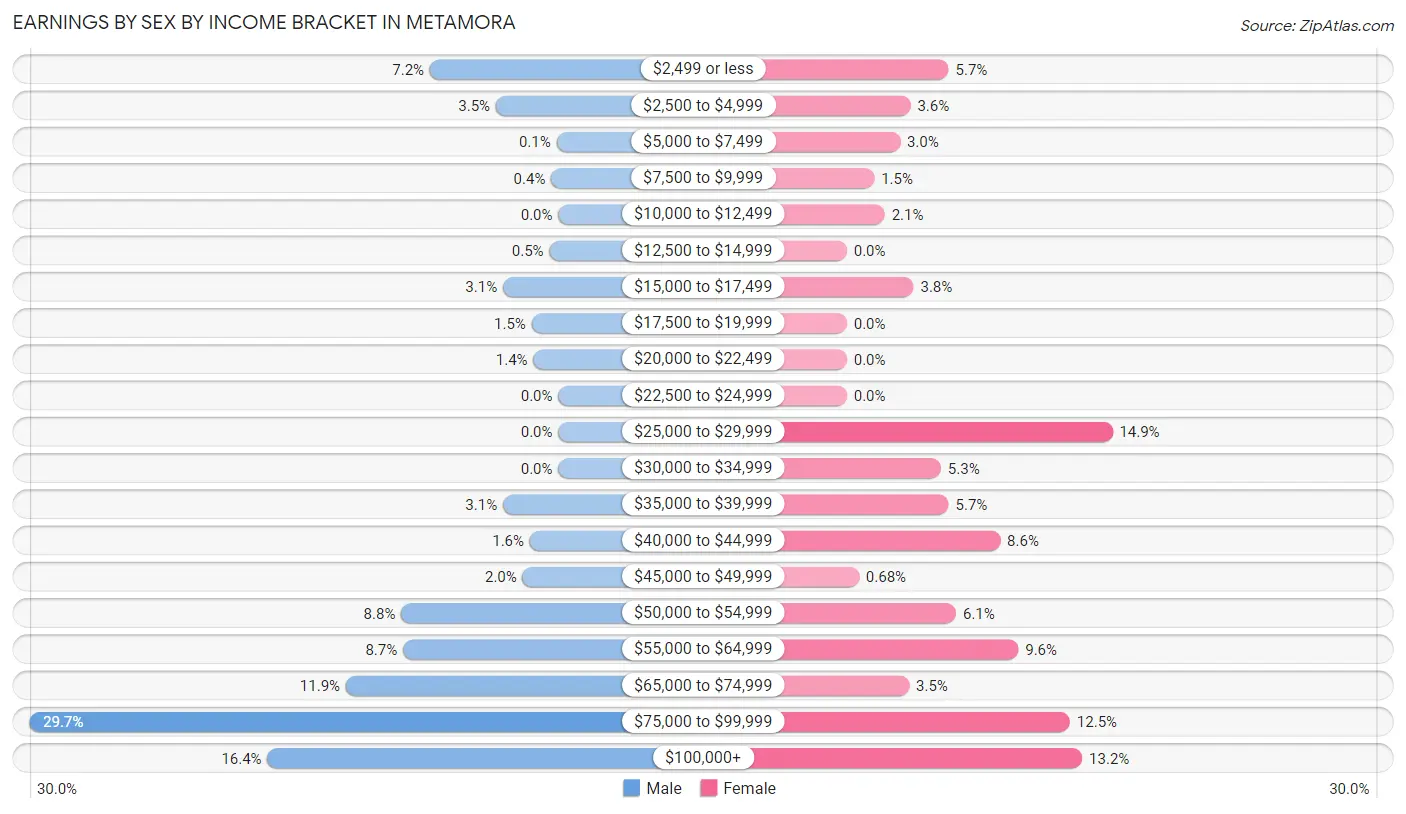
Earnings by Sex by Income Bracket in Metamora
The most common earnings brackets in Metamora are $75,000 to $99,999 for men (296 | 29.7%) and $25,000 to $29,999 for women (175 | 14.9%).
| Income | Male | Female |
| $2,499 or less | 72 (7.2%) | 67 (5.7%) |
| $2,500 to $4,999 | 35 (3.5%) | 42 (3.6%) |
| $5,000 to $7,499 | 1 (0.1%) | 35 (3.0%) |
| $7,500 to $9,999 | 4 (0.4%) | 18 (1.5%) |
| $10,000 to $12,499 | 0 (0.0%) | 25 (2.1%) |
| $12,500 to $14,999 | 5 (0.5%) | 0 (0.0%) |
| $15,000 to $17,499 | 31 (3.1%) | 44 (3.7%) |
| $17,500 to $19,999 | 15 (1.5%) | 0 (0.0%) |
| $20,000 to $22,499 | 14 (1.4%) | 0 (0.0%) |
| $22,500 to $24,999 | 0 (0.0%) | 0 (0.0%) |
| $25,000 to $29,999 | 0 (0.0%) | 175 (14.9%) |
| $30,000 to $34,999 | 0 (0.0%) | 62 (5.3%) |
| $35,000 to $39,999 | 31 (3.1%) | 67 (5.7%) |
| $40,000 to $44,999 | 16 (1.6%) | 101 (8.6%) |
| $45,000 to $49,999 | 20 (2.0%) | 8 (0.7%) |
| $50,000 to $54,999 | 88 (8.8%) | 72 (6.1%) |
| $55,000 to $64,999 | 87 (8.7%) | 113 (9.6%) |
| $65,000 to $74,999 | 119 (11.9%) | 41 (3.5%) |
| $75,000 to $99,999 | 296 (29.7%) | 147 (12.5%) |
| $100,000+ | 163 (16.4%) | 155 (13.2%) |
| Total | 997 (100.0%) | 1,172 (100.0%) |
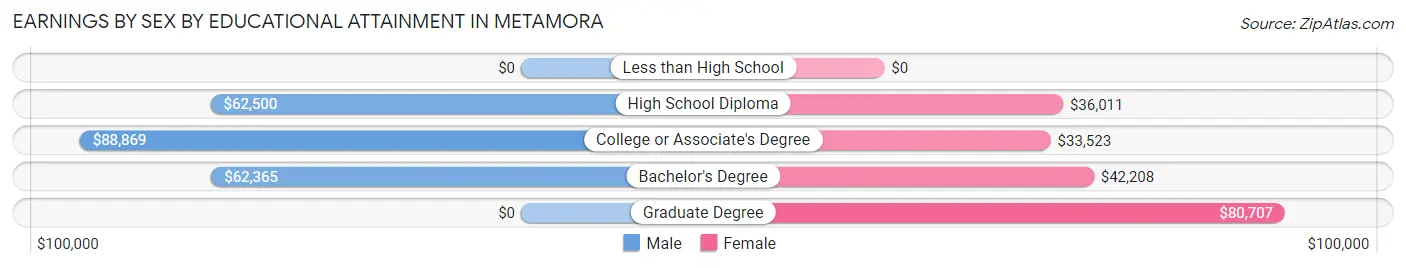
Earnings by Sex by Educational Attainment in Metamora
Average earnings in Metamora are $70,217 for men and $50,469 for women, a difference of 28.1%. Men with an educational attainment of college or associate's degree enjoy the highest average annual earnings of $88,869, while those with bachelor's degree education earn the least with $62,365. Women with an educational attainment of graduate degree earn the most with the average annual earnings of $80,707, while those with college or associate's degree education have the smallest earnings of $33,523.
| Educational Attainment | Male Income | Female Income |
| Less than High School | - | - |
| High School Diploma | $62,500 | $36,011 |
| College or Associate's Degree | $88,869 | $33,523 |
| Bachelor's Degree | $62,365 | $42,208 |
| Graduate Degree | - | - |
| Total | $70,217 | $50,469 |
Family Income in Metamora
Family Income Brackets in Metamora
According to the Metamora family income data, there are 267 families falling into the $75,000 to $99,999 income range, which is the most common income bracket and makes up 24.1% of all families.
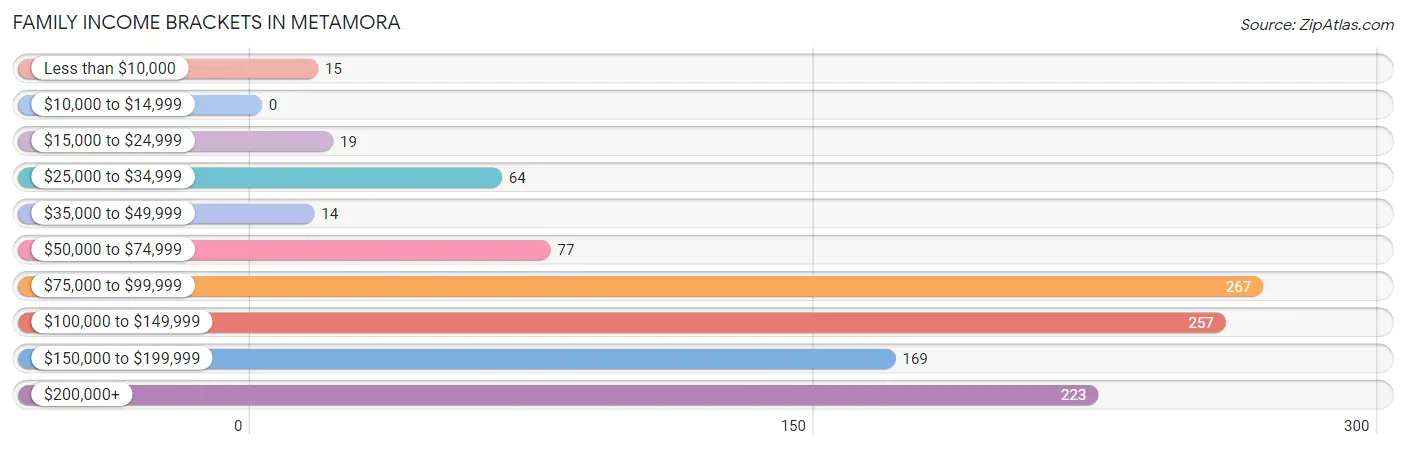
| Income Bracket | # Families | % Families |
| Less than $10,000 | 15 | 1.4% |
| $10,000 to $14,999 | 0 | 0.0% |
| $15,000 to $24,999 | 19 | 1.7% |
| $25,000 to $34,999 | 64 | 5.8% |
| $35,000 to $49,999 | 14 | 1.3% |
| $50,000 to $74,999 | 77 | 7.0% |
| $75,000 to $99,999 | 267 | 24.1% |
| $100,000 to $149,999 | 257 | 23.2% |
| $150,000 to $199,999 | 169 | 15.3% |
| $200,000+ | 223 | 20.1% |
Family Income by Famaliy Size in Metamora
3-person families (189 | 17.1%) account for the highest median family income in Metamora with $168,533 per family, while 3-person families (189 | 17.1%) have the highest median income of $56,178 per family member.
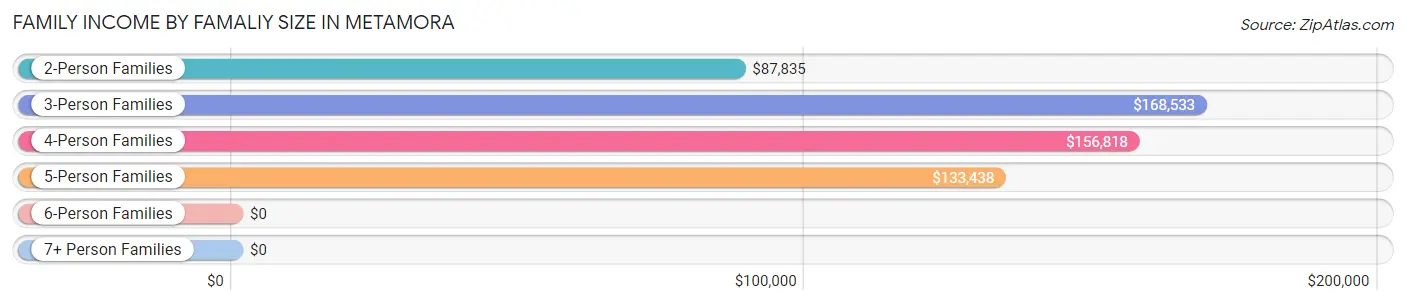
| Income Bracket | # Families | Median Income |
| 2-Person Families | 543 (49.0%) | $87,835 |
| 3-Person Families | 189 (17.1%) | $168,533 |
| 4-Person Families | 280 (25.3%) | $156,818 |
| 5-Person Families | 84 (7.6%) | $133,438 |
| 6-Person Families | 0 (0.0%) | $0 |
| 7+ Person Families | 11 (1.0%) | $0 |
| Total | 1,107 (100.0%) | $124,250 |
Family Income by Number of Earners in Metamora
The median family income in Metamora is $124,250, with families comprising 3+ earners (100) having the highest median family income of $182,045, while families with 1 earner (252) have the lowest median family income of $83,359, accounting for 9.0% and 22.8% of families, respectively.
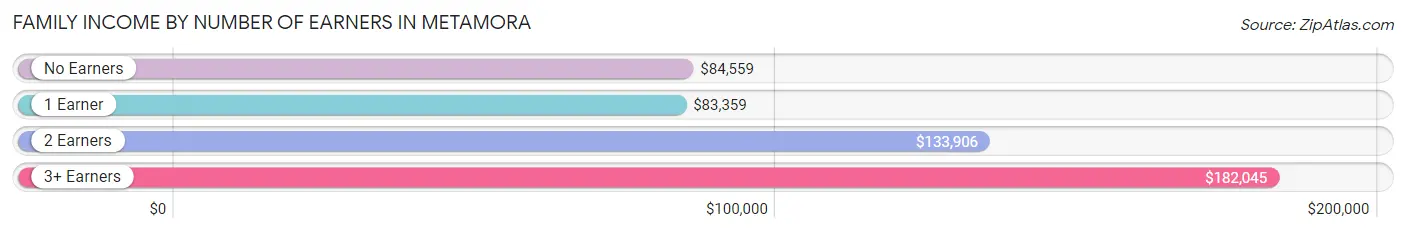
| Number of Earners | # Families | Median Income |
| No Earners | 116 (10.5%) | $84,559 |
| 1 Earner | 252 (22.8%) | $83,359 |
| 2 Earners | 639 (57.7%) | $133,906 |
| 3+ Earners | 100 (9.0%) | $182,045 |
| Total | 1,107 (100.0%) | $124,250 |
Household Income in Metamora
Household Income Brackets in Metamora
With 275 households falling in the category, the $75,000 to $99,999 income range is the most frequent in Metamora, accounting for 16.5% of all households. In contrast, only 28 households (1.7%) fall into the $10,000 to $14,999 income bracket, making it the least populous group.
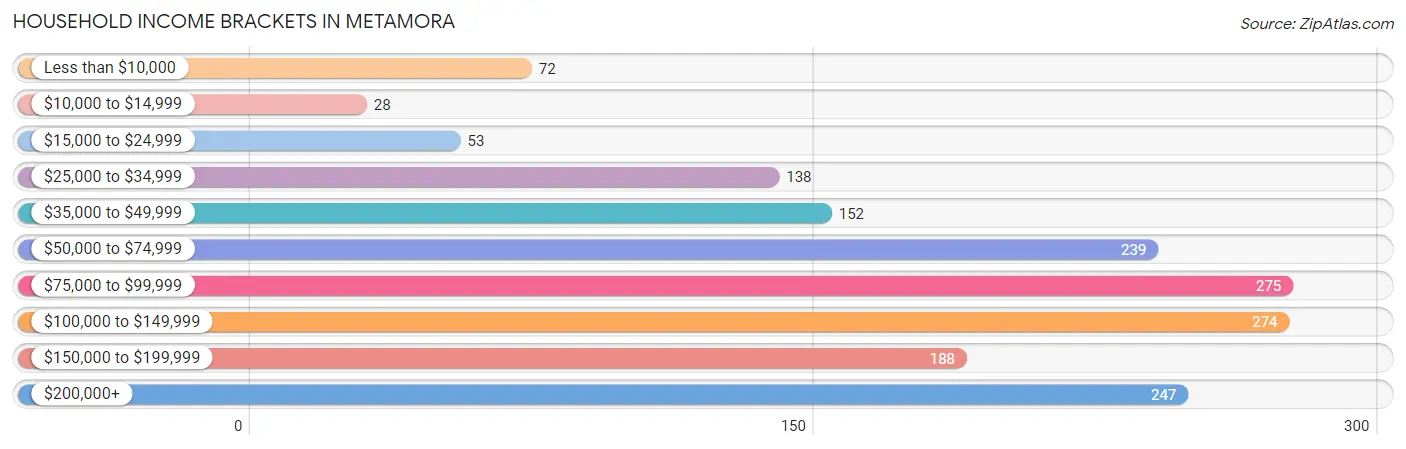
| Income Bracket | # Households | % Households |
| Less than $10,000 | 72 | 4.3% |
| $10,000 to $14,999 | 28 | 1.7% |
| $15,000 to $24,999 | 53 | 3.2% |
| $25,000 to $34,999 | 138 | 8.3% |
| $35,000 to $49,999 | 152 | 9.1% |
| $50,000 to $74,999 | 239 | 14.3% |
| $75,000 to $99,999 | 275 | 16.5% |
| $100,000 to $149,999 | 274 | 16.4% |
| $150,000 to $199,999 | 188 | 11.3% |
| $200,000+ | 247 | 14.8% |
Household Income by Householder Age in Metamora
The median household income in Metamora is $83,793, with the highest median household income of $125,101 found in the 25 to 44 years age bracket for the primary householder. A total of 663 households (39.8%) fall into this category. Meanwhile, the 15 to 24 years age bracket for the primary householder has the lowest median household income of $0, with 30 households (1.8%) in this group.
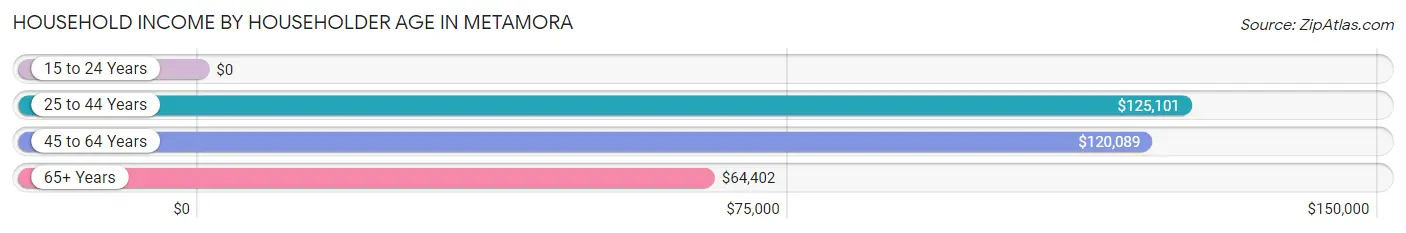
| Income Bracket | # Households | Median Income |
| 15 to 24 Years | 30 (1.8%) | $0 |
| 25 to 44 Years | 663 (39.8%) | $125,101 |
| 45 to 64 Years | 547 (32.8%) | $120,089 |
| 65+ Years | 428 (25.7%) | $64,402 |
| Total | 1,668 (100.0%) | $83,793 |
Poverty in Metamora
Income Below Poverty by Sex and Age in Metamora
With 3.6% poverty level for males and 8.8% for females among the residents of Metamora, 6 to 11 year old males and 16 and 17 year old females are the most vulnerable to poverty, with 22 males (28.6%) and 27 females (46.6%) in their respective age groups living below the poverty level.
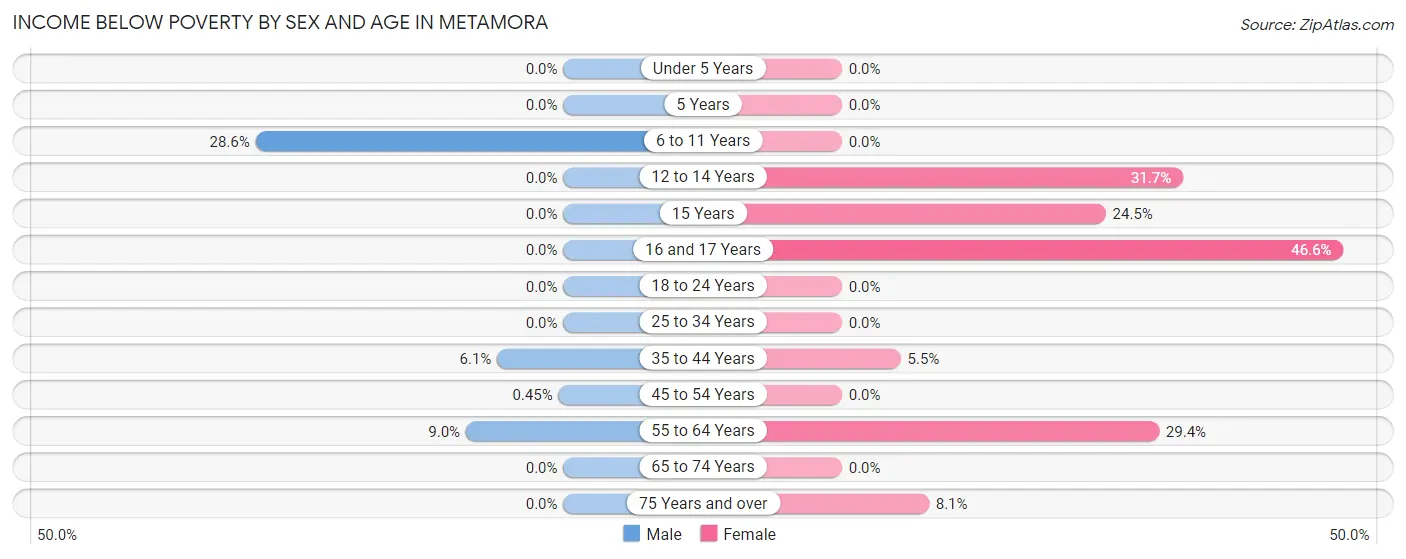
| Age Bracket | Male | Female |
| Under 5 Years | 0 (0.0%) | 0 (0.0%) |
| 5 Years | 0 (0.0%) | 0 (0.0%) |
| 6 to 11 Years | 22 (28.6%) | 0 (0.0%) |
| 12 to 14 Years | 0 (0.0%) | 19 (31.7%) |
| 15 Years | 0 (0.0%) | 12 (24.5%) |
| 16 and 17 Years | 0 (0.0%) | 27 (46.6%) |
| 18 to 24 Years | 0 (0.0%) | 0 (0.0%) |
| 25 to 34 Years | 0 (0.0%) | 0 (0.0%) |
| 35 to 44 Years | 24 (6.1%) | 19 (5.5%) |
| 45 to 54 Years | 1 (0.4%) | 0 (0.0%) |
| 55 to 64 Years | 17 (9.0%) | 103 (29.4%) |
| 65 to 74 Years | 0 (0.0%) | 0 (0.0%) |
| 75 Years and over | 0 (0.0%) | 13 (8.1%) |
| Total | 64 (3.6%) | 193 (8.8%) |
Income Above Poverty by Sex and Age in Metamora
According to the poverty statistics in Metamora, males aged under 5 years and females aged under 5 years are the age groups that are most secure financially, with 100.0% of males and 100.0% of females in these age groups living above the poverty line.
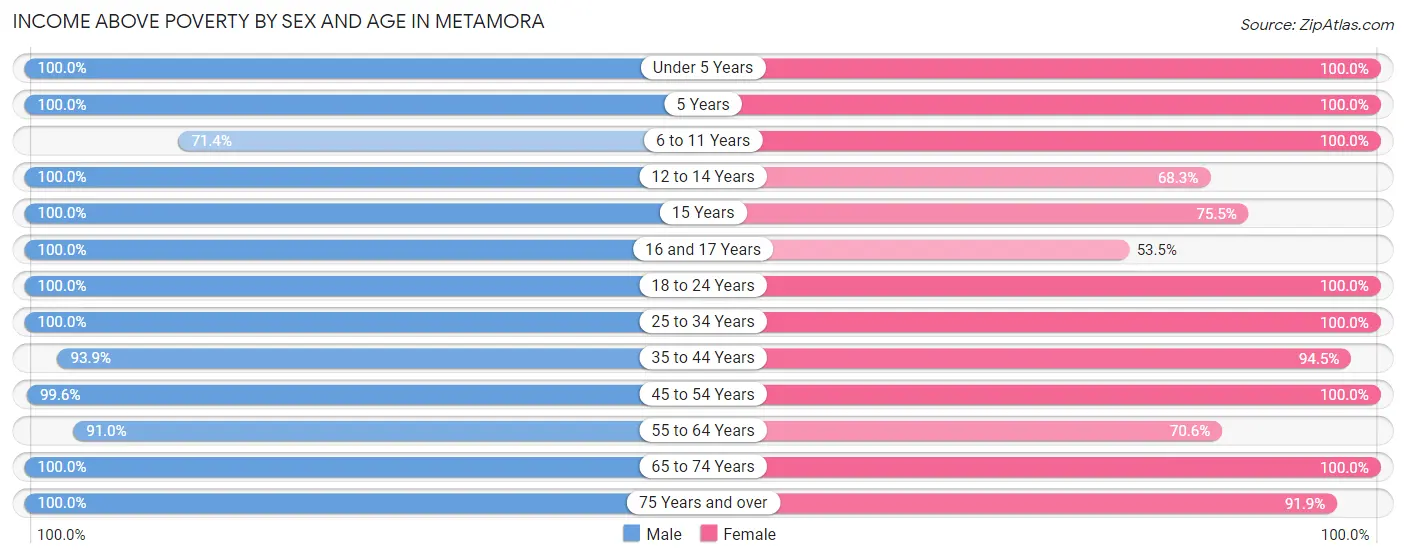
| Age Bracket | Male | Female |
| Under 5 Years | 291 (100.0%) | 144 (100.0%) |
| 5 Years | 71 (100.0%) | 109 (100.0%) |
| 6 to 11 Years | 55 (71.4%) | 95 (100.0%) |
| 12 to 14 Years | 70 (100.0%) | 41 (68.3%) |
| 15 Years | 50 (100.0%) | 37 (75.5%) |
| 16 and 17 Years | 23 (100.0%) | 31 (53.4%) |
| 18 to 24 Years | 14 (100.0%) | 90 (100.0%) |
| 25 to 34 Years | 119 (100.0%) | 360 (100.0%) |
| 35 to 44 Years | 367 (93.9%) | 329 (94.5%) |
| 45 to 54 Years | 221 (99.6%) | 206 (100.0%) |
| 55 to 64 Years | 171 (91.0%) | 247 (70.6%) |
| 65 to 74 Years | 119 (100.0%) | 159 (100.0%) |
| 75 Years and over | 119 (100.0%) | 148 (91.9%) |
| Total | 1,690 (96.4%) | 1,996 (91.2%) |
Income Below Poverty Among Married-Couple Families in Metamora
The poverty statistics for married-couple families in Metamora show that 1.7% or 16 of the total 967 families live below the poverty line. Families with no children have the highest poverty rate of 3.0%, comprising of 16 families. On the other hand, families with 1 or 2 children have the lowest poverty rate of 0.0%, which includes 0 families.
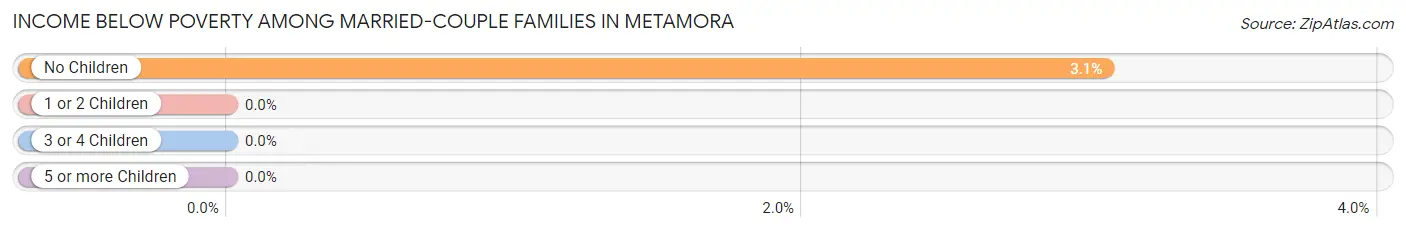
| Children | Above Poverty | Below Poverty |
| No Children | 509 (97.0%) | 16 (3.0%) |
| 1 or 2 Children | 377 (100.0%) | 0 (0.0%) |
| 3 or 4 Children | 65 (100.0%) | 0 (0.0%) |
| 5 or more Children | 0 (0.0%) | 0 (0.0%) |
| Total | 951 (98.4%) | 16 (1.7%) |
Income Below Poverty Among Single-Parent Households in Metamora
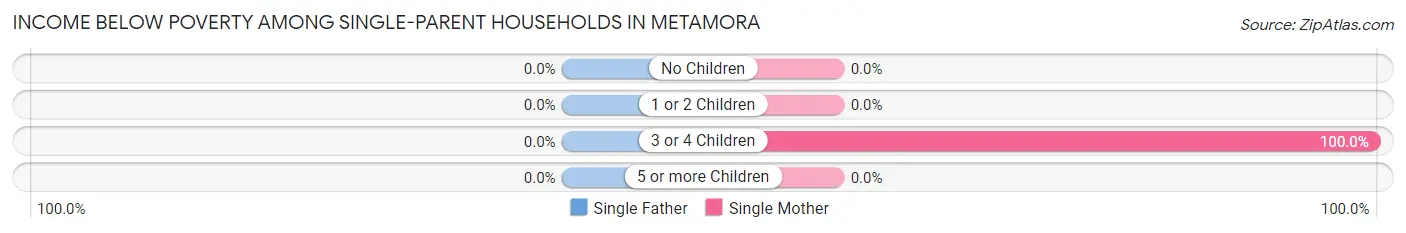
| Children | Single Father | Single Mother |
| No Children | 0 (0.0%) | 0 (0.0%) |
| 1 or 2 Children | 0 (0.0%) | 0 (0.0%) |
| 3 or 4 Children | 0 (0.0%) | 19 (100.0%) |
| 5 or more Children | 0 (0.0%) | 0 (0.0%) |
| Total | 0 (0.0%) | 19 (16.0%) |
Income Below Poverty Among Married-Couple vs Single-Parent Households in Metamora
The poverty data for Metamora shows that 16 of the married-couple family households (1.7%) and 19 of the single-parent households (13.6%) are living below the poverty level. Within the married-couple family households, those with no children have the highest poverty rate, with 16 households (3.0%) falling below the poverty line. Among the single-parent households, those with 3 or 4 children have the highest poverty rate, with 19 household (100.0%) living below poverty.
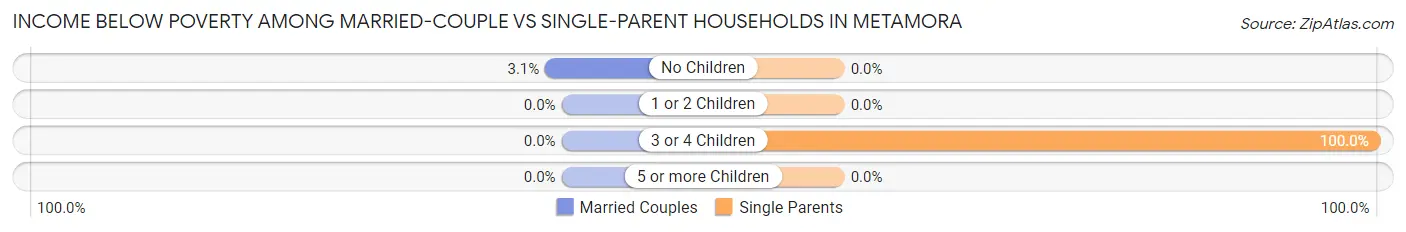
| Children | Married-Couple Families | Single-Parent Households |
| No Children | 16 (3.0%) | 0 (0.0%) |
| 1 or 2 Children | 0 (0.0%) | 0 (0.0%) |
| 3 or 4 Children | 0 (0.0%) | 19 (100.0%) |
| 5 or more Children | 0 (0.0%) | 0 (0.0%) |
| Total | 16 (1.7%) | 19 (13.6%) |
Race in Metamora
The most populous races in Metamora are White / Caucasian (3,923 | 96.5%), Two or more Races (78 | 1.9%), and Asian (62 | 1.5%).
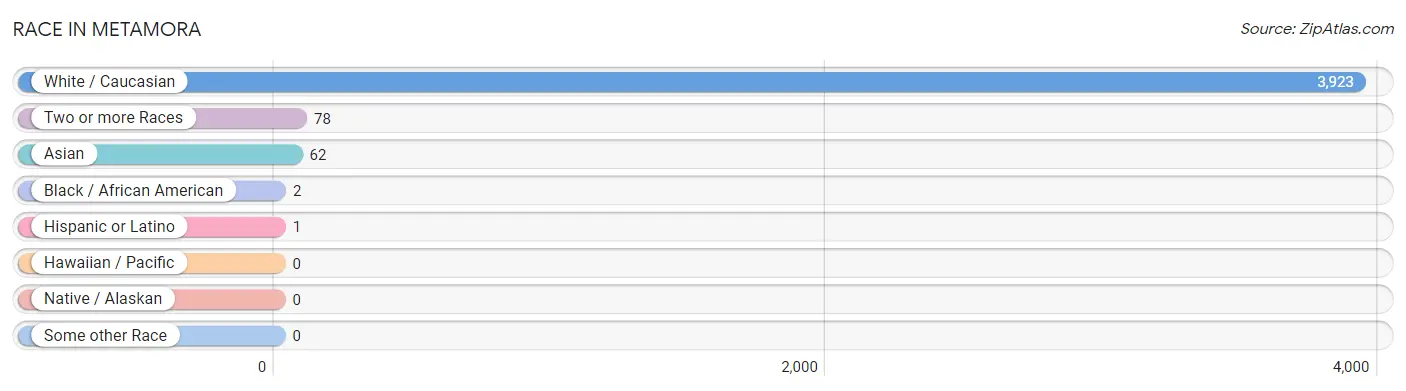
| Race | # Population | % Population |
| Asian | 62 | 1.5% |
| Black / African American | 2 | 0.1% |
| Hawaiian / Pacific | 0 | 0.0% |
| Hispanic or Latino | 1 | 0.0% |
| Native / Alaskan | 0 | 0.0% |
| White / Caucasian | 3,923 | 96.5% |
| Two or more Races | 78 | 1.9% |
| Some other Race | 0 | 0.0% |
| Total | 4,065 | 100.0% |
Ancestry in Metamora
The most populous ancestries reported in Metamora are German (1,985 | 48.8%), Irish (563 | 13.9%), Italian (357 | 8.8%), English (307 | 7.5%), and Swedish (206 | 5.1%), together accounting for 84.1% of all Metamora residents.
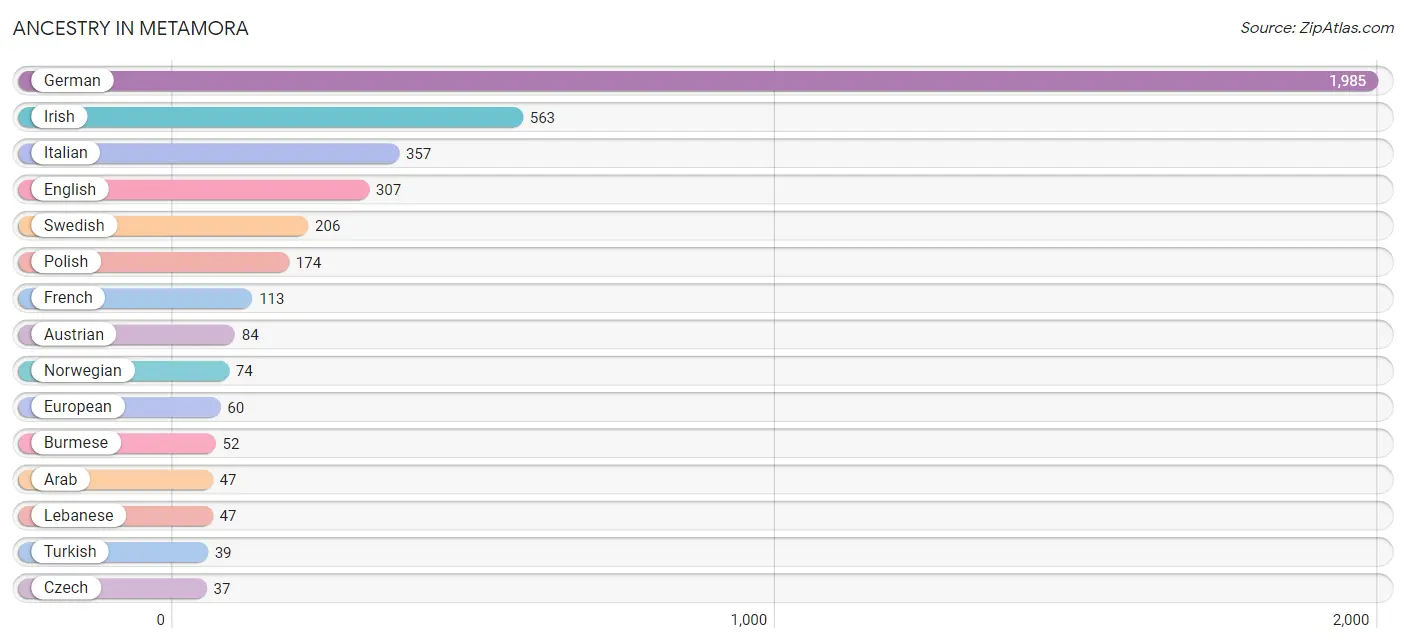
| Ancestry | # Population | % Population |
| American | 33 | 0.8% |
| Arab | 47 | 1.2% |
| Austrian | 84 | 2.1% |
| British | 14 | 0.3% |
| Burmese | 52 | 1.3% |
| Cherokee | 16 | 0.4% |
| Czech | 37 | 0.9% |
| Danish | 15 | 0.4% |
| Dutch | 29 | 0.7% |
| English | 307 | 7.5% |
| European | 60 | 1.5% |
| French | 113 | 2.8% |
| German | 1,985 | 48.8% |
| Irish | 563 | 13.9% |
| Italian | 357 | 8.8% |
| Japanese | 34 | 0.8% |
| Lebanese | 47 | 1.2% |
| Mexican | 1 | 0.0% |
| Northern European | 14 | 0.3% |
| Norwegian | 74 | 1.8% |
| Polish | 174 | 4.3% |
| Russian | 30 | 0.7% |
| Scotch-Irish | 14 | 0.3% |
| Swedish | 206 | 5.1% |
| Swiss | 8 | 0.2% |
| Turkish | 39 | 1.0% |
| Welsh | 17 | 0.4% |
| West Indian | 1 | 0.0% | View All 28 Rows |
Immigrants in Metamora
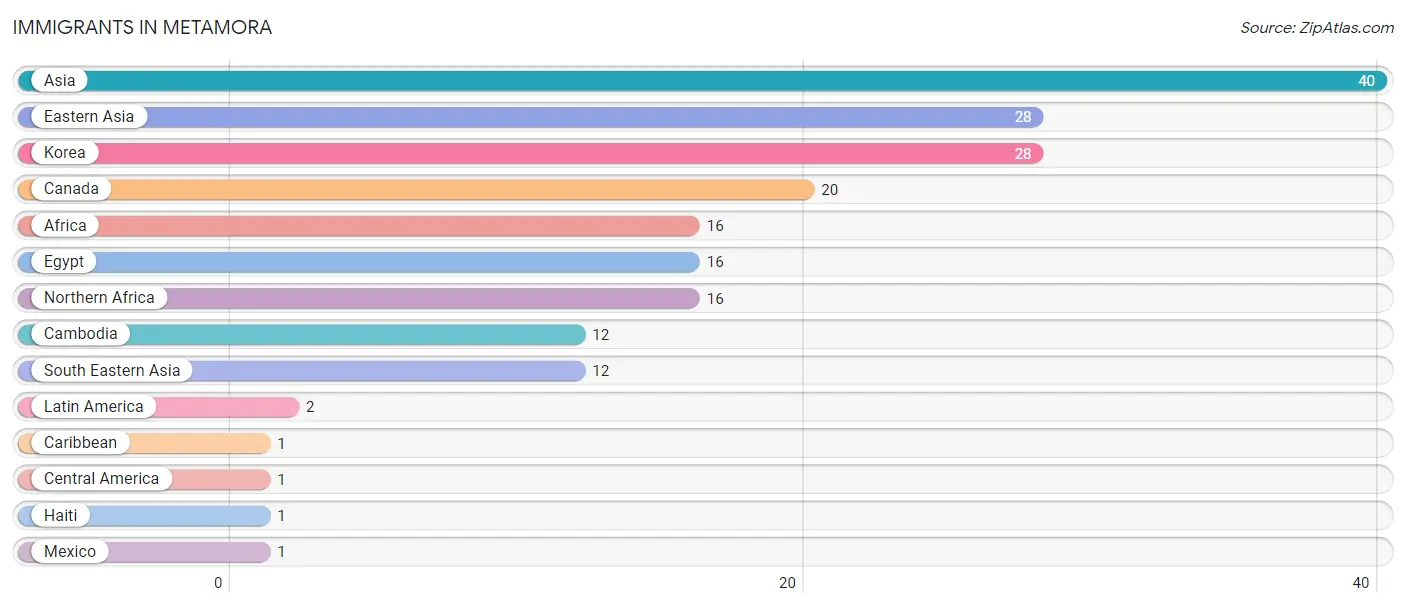
The most numerous immigrant groups reported in Metamora came from Asia (40 | 1.0%), Eastern Asia (28 | 0.7%), Korea (28 | 0.7%), Canada (20 | 0.5%), and Africa (16 | 0.4%), together accounting for 3.2% of all Metamora residents.
| Immigration Origin | # Population | % Population |
| Africa | 16 | 0.4% |
| Asia | 40 | 1.0% |
| Cambodia | 12 | 0.3% |
| Canada | 20 | 0.5% |
| Caribbean | 1 | 0.0% |
| Central America | 1 | 0.0% |
| Eastern Asia | 28 | 0.7% |
| Egypt | 16 | 0.4% |
| Haiti | 1 | 0.0% |
| Korea | 28 | 0.7% |
| Latin America | 2 | 0.1% |
| Mexico | 1 | 0.0% |
| Northern Africa | 16 | 0.4% |
| South Eastern Asia | 12 | 0.3% | View All 14 Rows |
Sex and Age in Metamora
Sex and Age in Metamora
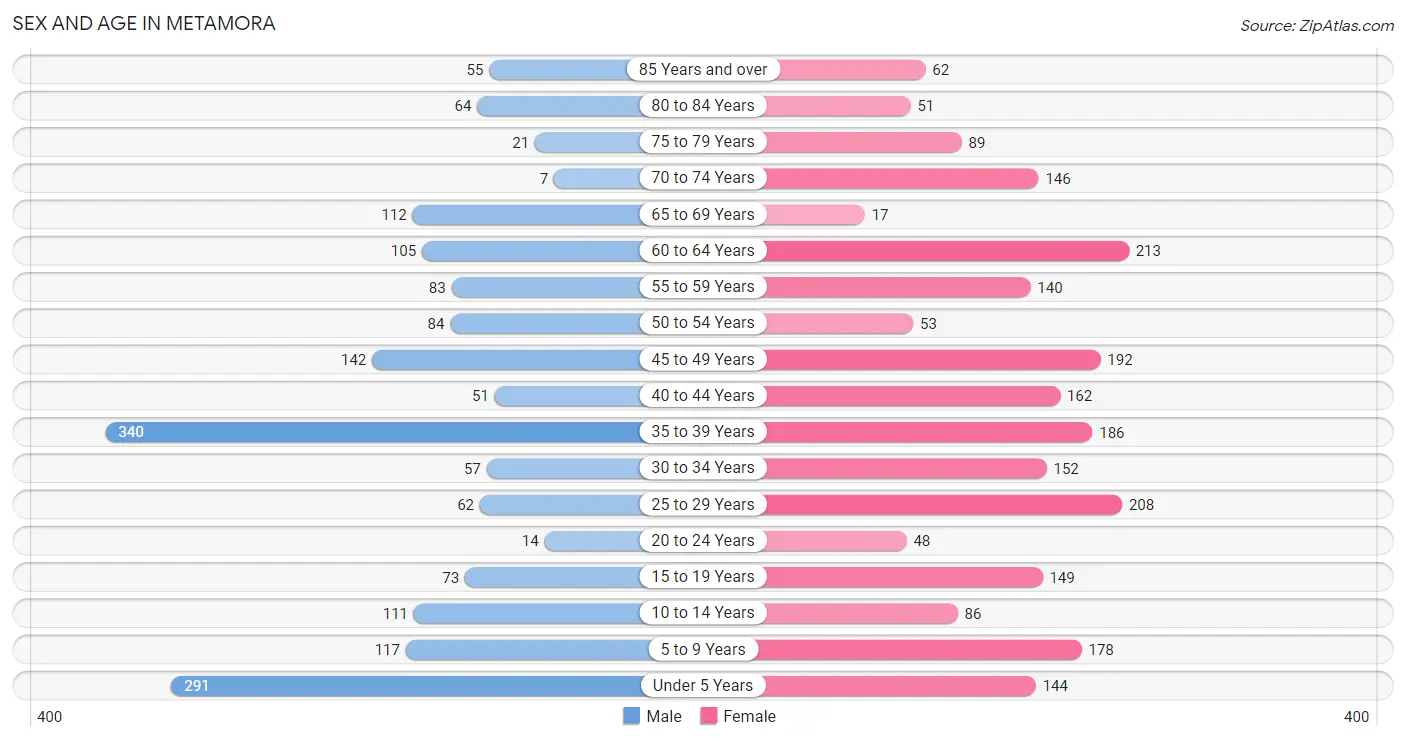
The most populous age groups in Metamora are 35 to 39 Years (340 | 19.0%) for men and 60 to 64 Years (213 | 9.4%) for women.
| Age Bracket | Male | Female |
| Under 5 Years | 291 (16.3%) | 144 (6.3%) |
| 5 to 9 Years | 117 (6.5%) | 178 (7.8%) |
| 10 to 14 Years | 111 (6.2%) | 86 (3.8%) |
| 15 to 19 Years | 73 (4.1%) | 149 (6.6%) |
| 20 to 24 Years | 14 (0.8%) | 48 (2.1%) |
| 25 to 29 Years | 62 (3.5%) | 208 (9.1%) |
| 30 to 34 Years | 57 (3.2%) | 152 (6.7%) |
| 35 to 39 Years | 340 (19.0%) | 186 (8.2%) |
| 40 to 44 Years | 51 (2.9%) | 162 (7.1%) |
| 45 to 49 Years | 142 (7.9%) | 192 (8.4%) |
| 50 to 54 Years | 84 (4.7%) | 53 (2.3%) |
| 55 to 59 Years | 83 (4.6%) | 140 (6.1%) |
| 60 to 64 Years | 105 (5.9%) | 213 (9.4%) |
| 65 to 69 Years | 112 (6.3%) | 17 (0.7%) |
| 70 to 74 Years | 7 (0.4%) | 146 (6.4%) |
| 75 to 79 Years | 21 (1.2%) | 89 (3.9%) |
| 80 to 84 Years | 64 (3.6%) | 51 (2.2%) |
| 85 Years and over | 55 (3.1%) | 62 (2.7%) |
| Total | 1,789 (100.0%) | 2,276 (100.0%) |
Families and Households in Metamora
Median Family Size in Metamora
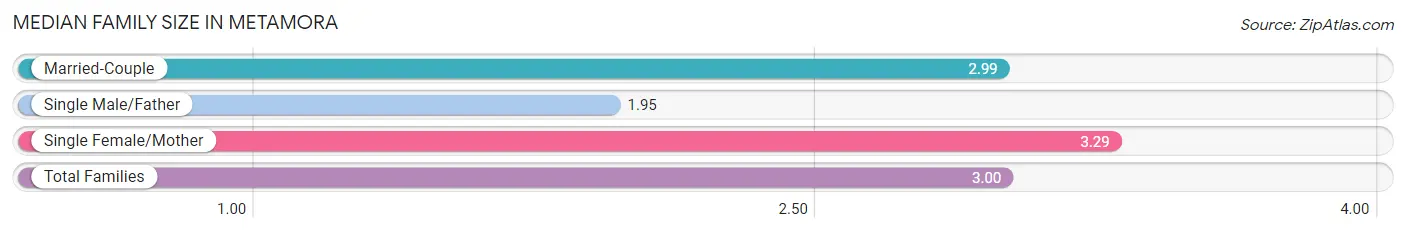
The median family size in Metamora is 3.00 persons per family, with single female/mother families (119 | 10.7%) accounting for the largest median family size of 3.29 persons per family. On the other hand, single male/father families (21 | 1.9%) represent the smallest median family size with 1.95 persons per family.
| Family Type | # Families | Family Size |
| Married-Couple | 967 (87.4%) | 2.99 |
| Single Male/Father | 21 (1.9%) | 1.95 |
| Single Female/Mother | 119 (10.7%) | 3.29 |
| Total Families | 1,107 (100.0%) | 3.00 |
Median Household Size in Metamora
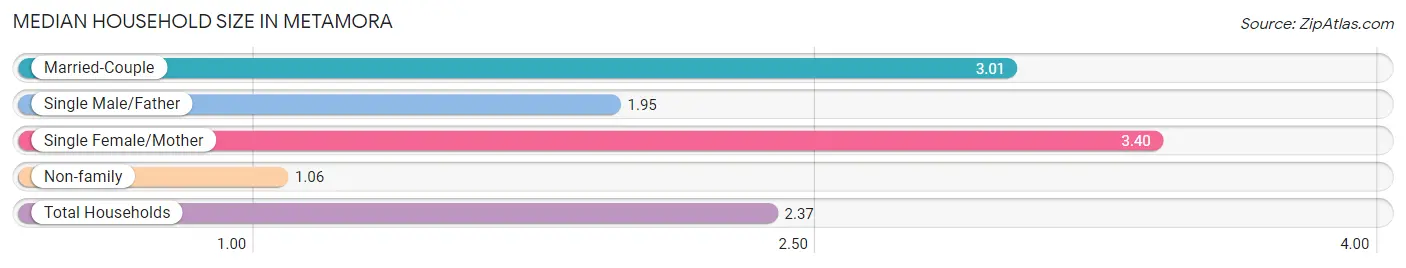
The median household size in Metamora is 2.37 persons per household, with single female/mother households (119 | 7.1%) accounting for the largest median household size of 3.4 persons per household. non-family households (561 | 33.6%) represent the smallest median household size with 1.06 persons per household.
| Household Type | # Households | Household Size |
| Married-Couple | 967 (58.0%) | 3.01 |
| Single Male/Father | 21 (1.3%) | 1.95 |
| Single Female/Mother | 119 (7.1%) | 3.40 |
| Non-family | 561 (33.6%) | 1.06 |
| Total Households | 1,668 (100.0%) | 2.37 |
Household Size by Marriage Status in Metamora
Out of a total of 1,668 households in Metamora, 1,107 (66.4%) are family households, while 561 (33.6%) are nonfamily households. The most numerous type of family households are 2-person households, comprising 532, and the most common type of nonfamily households are 1-person households, comprising 533.
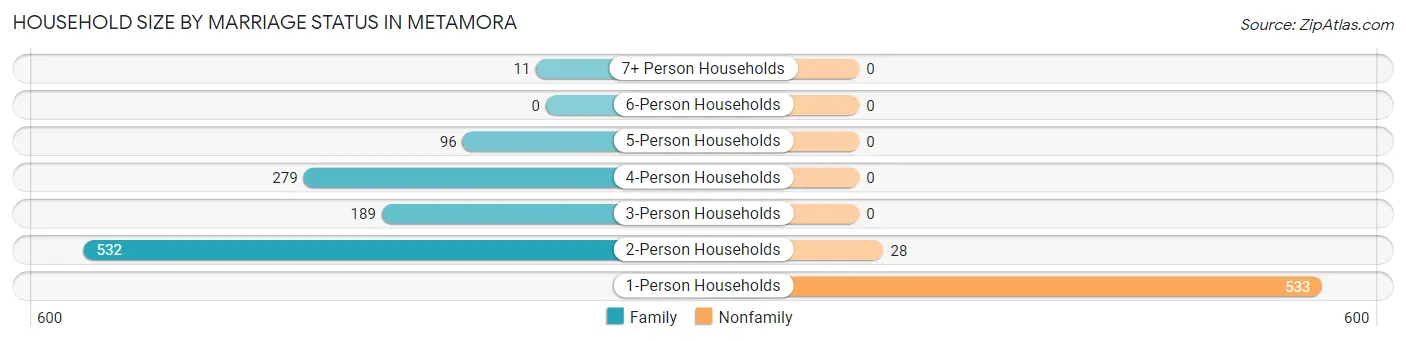
| Household Size | Family Households | Nonfamily Households |
| 1-Person Households | - | 533 (32.0%) |
| 2-Person Households | 532 (31.9%) | 28 (1.7%) |
| 3-Person Households | 189 (11.3%) | 0 (0.0%) |
| 4-Person Households | 279 (16.7%) | 0 (0.0%) |
| 5-Person Households | 96 (5.8%) | 0 (0.0%) |
| 6-Person Households | 0 (0.0%) | 0 (0.0%) |
| 7+ Person Households | 11 (0.7%) | 0 (0.0%) |
| Total | 1,107 (66.4%) | 561 (33.6%) |
Female Fertility in Metamora
Fertility by Age in Metamora
Average fertility rate in Metamora is 118.0 births per 1,000 women. Women in the age bracket of 20 to 34 years have the highest fertility rate with 316.0 births per 1,000 women. Women in the age bracket of 20 to 34 years acount for 100.0% of all women with births.
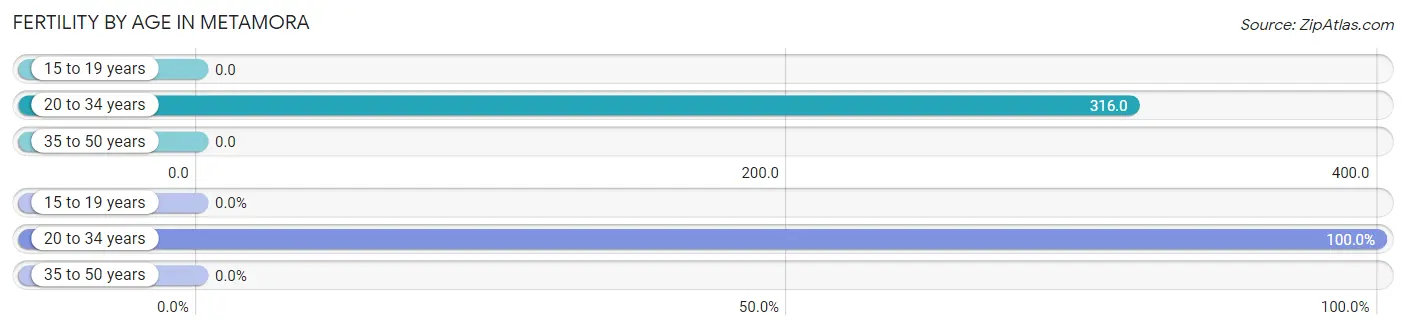
| Age Bracket | Women with Births | Births / 1,000 Women |
| 15 to 19 years | 0 (0.0%) | 0.0 |
| 20 to 34 years | 129 (100.0%) | 316.0 |
| 35 to 50 years | 0 (0.0%) | 0.0 |
| Total | 129 (100.0%) | 118.0 |
Fertility by Age by Marriage Status in Metamora
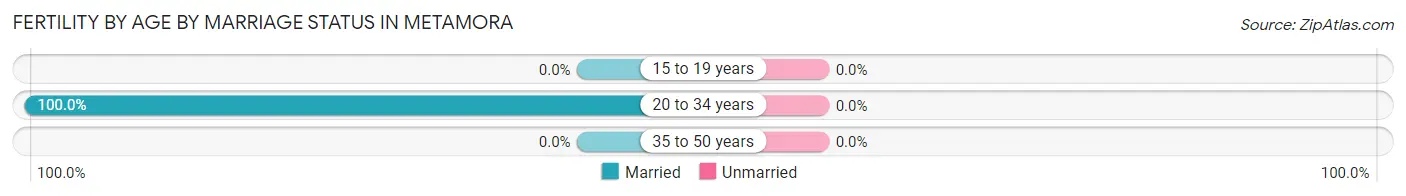
| Age Bracket | Married | Unmarried |
| 15 to 19 years | 0 (0.0%) | 0 (0.0%) |
| 20 to 34 years | 129 (100.0%) | 0 (0.0%) |
| 35 to 50 years | 0 (0.0%) | 0 (0.0%) |
| Total | 129 (100.0%) | 0 (0.0%) |
Fertility by Education in Metamora
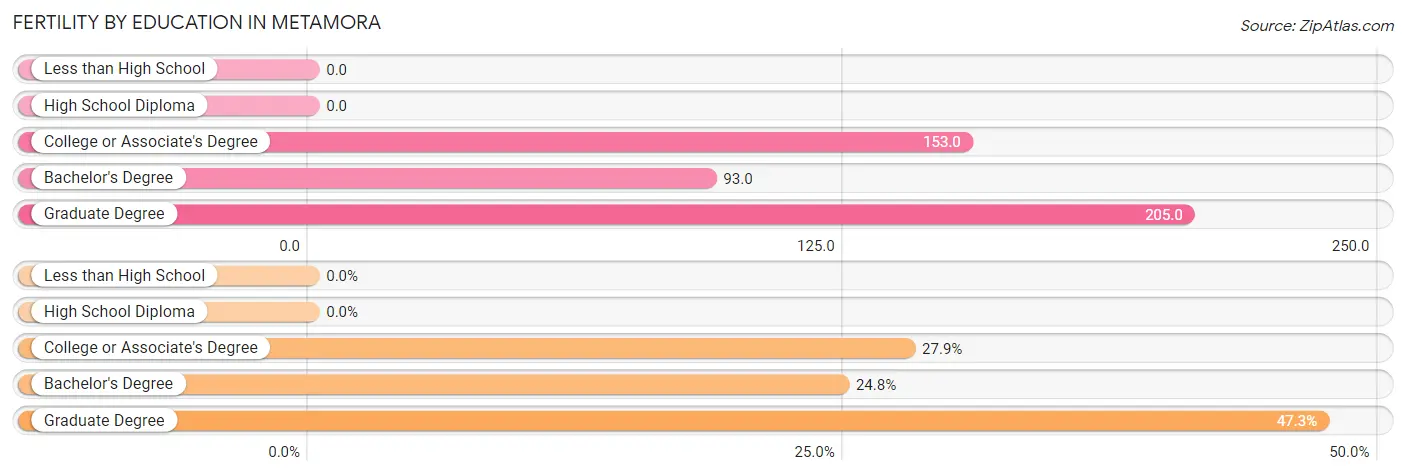
| Educational Attainment | Women with Births | Births / 1,000 Women |
| Less than High School | 0 (0.0%) | 0.0 |
| High School Diploma | 0 (0.0%) | 0.0 |
| College or Associate's Degree | 36 (27.9%) | 153.0 |
| Bachelor's Degree | 32 (24.8%) | 93.0 |
| Graduate Degree | 61 (47.3%) | 205.0 |
| Total | 129 (100.0%) | 118.0 |
Fertility by Education by Marriage Status in Metamora
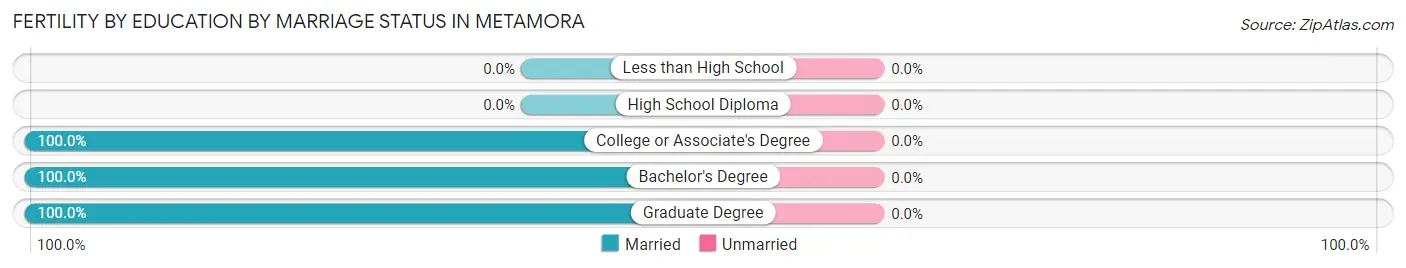
| Educational Attainment | Married | Unmarried |
| Less than High School | 0 (0.0%) | 0 (0.0%) |
| High School Diploma | 0 (0.0%) | 0 (0.0%) |
| College or Associate's Degree | 36 (100.0%) | 0 (0.0%) |
| Bachelor's Degree | 32 (100.0%) | 0 (0.0%) |
| Graduate Degree | 61 (100.0%) | 0 (0.0%) |
| Total | 129 (100.0%) | 0 (0.0%) |
Employment Characteristics in Metamora
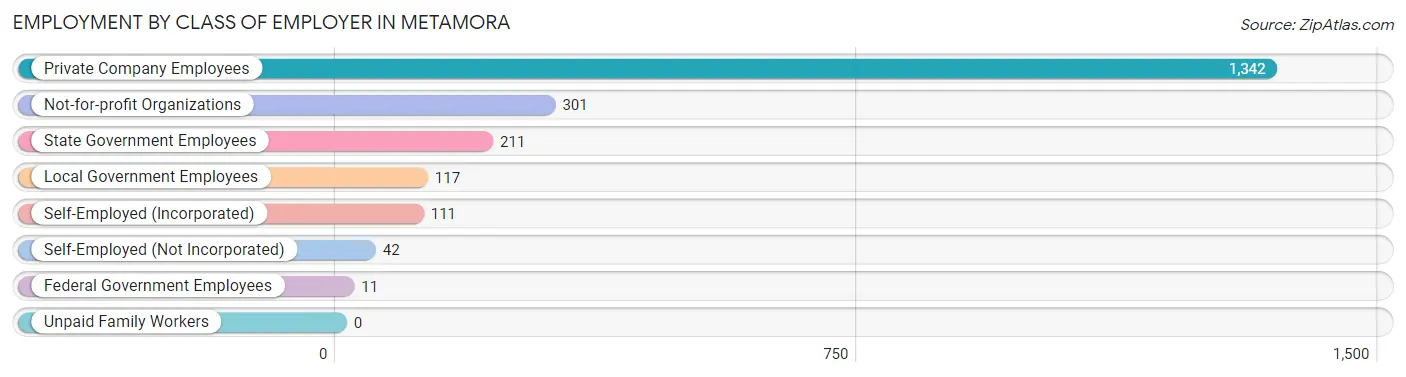
Employment by Class of Employer in Metamora
Among the 2,135 employed individuals in Metamora, private company employees (1,342 | 62.9%), not-for-profit organizations (301 | 14.1%), and state government employees (211 | 9.9%) make up the most common classes of employment.
| Employer Class | # Employees | % Employees |
| Private Company Employees | 1,342 | 62.9% |
| Self-Employed (Incorporated) | 111 | 5.2% |
| Self-Employed (Not Incorporated) | 42 | 2.0% |
| Not-for-profit Organizations | 301 | 14.1% |
| Local Government Employees | 117 | 5.5% |
| State Government Employees | 211 | 9.9% |
| Federal Government Employees | 11 | 0.5% |
| Unpaid Family Workers | 0 | 0.0% |
| Total | 2,135 | 100.0% |
Employment Status by Age in Metamora
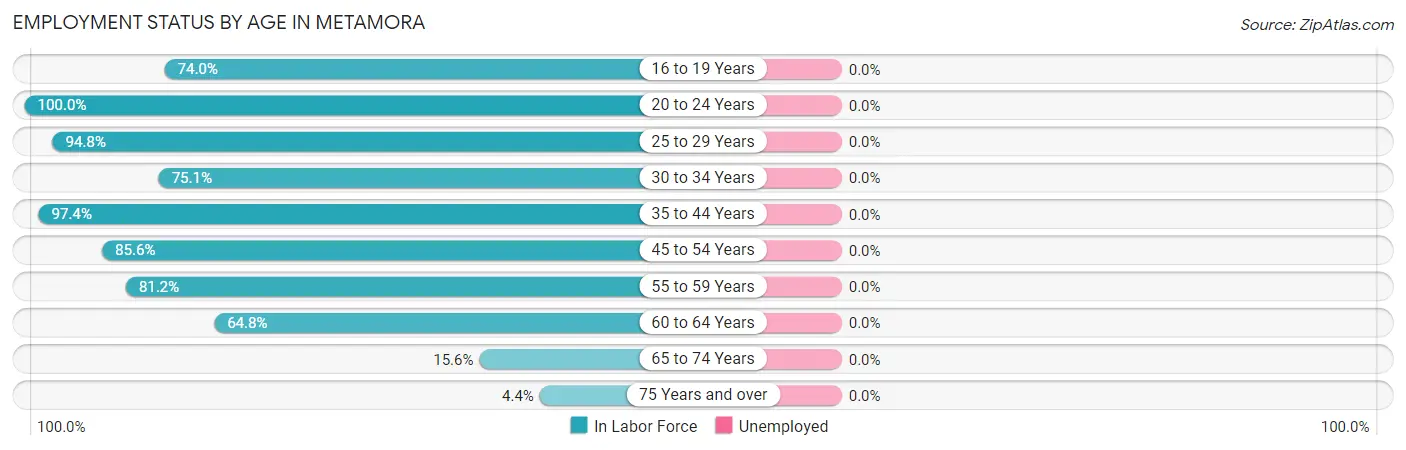
| Age Bracket | In Labor Force | Unemployed |
| 16 to 19 Years | 91 (74.0%) | 0 (0.0%) |
| 20 to 24 Years | 62 (100.0%) | 0 (0.0%) |
| 25 to 29 Years | 256 (94.8%) | 0 (0.0%) |
| 30 to 34 Years | 157 (75.1%) | 0 (0.0%) |
| 35 to 44 Years | 720 (97.4%) | 0 (0.0%) |
| 45 to 54 Years | 403 (85.6%) | 0 (0.0%) |
| 55 to 59 Years | 181 (81.2%) | 0 (0.0%) |
| 60 to 64 Years | 206 (64.8%) | 0 (0.0%) |
| 65 to 74 Years | 44 (15.6%) | 0 (0.0%) |
| 75 Years and over | 15 (4.4%) | 0 (0.0%) |
| Total | 2,136 (70.3%) | 0 (0.0%) |
Employment Status by Educational Attainment in Metamora
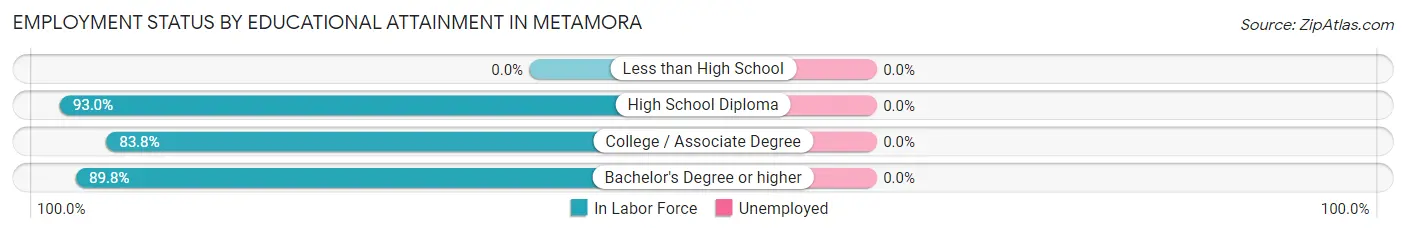
| Educational Attainment | In Labor Force | Unemployed |
| Less than High School | 0 (0.0%) | 0 (0.0%) |
| High School Diploma | 307 (93.0%) | 0 (0.0%) |
| College / Associate Degree | 514 (83.8%) | 0 (0.0%) |
| Bachelor's Degree or higher | 1,102 (89.8%) | 0 (0.0%) |
| Total | 1,922 (86.2%) | 0 (0.0%) |
Employment Occupations by Sex in Metamora
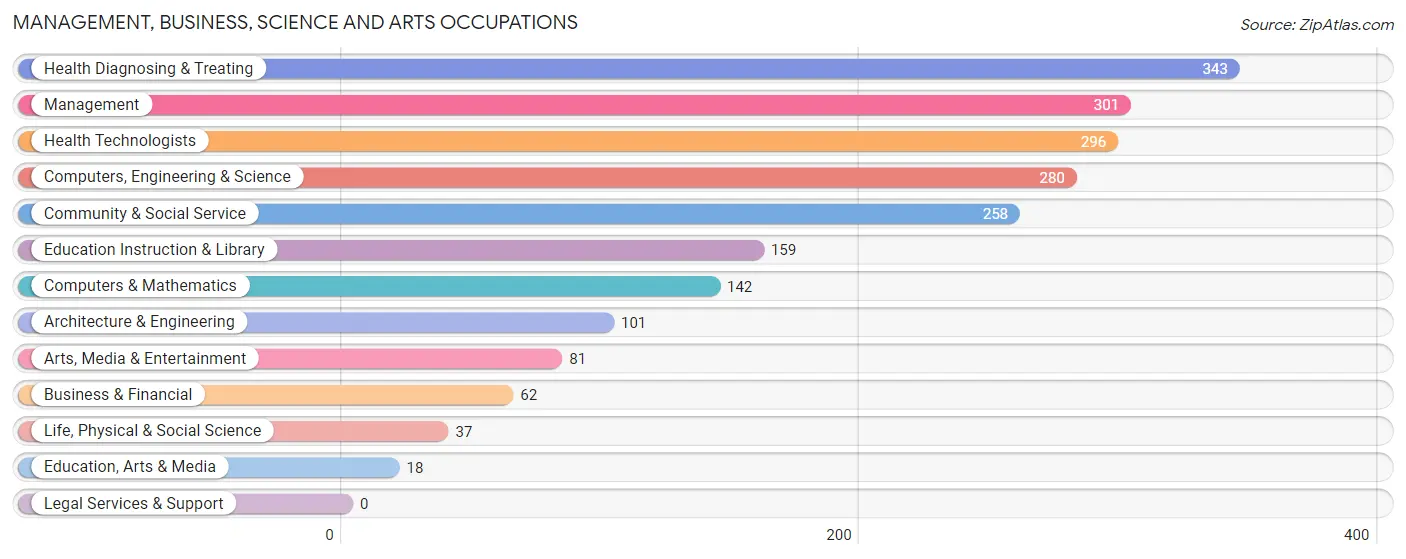
Management, Business, Science and Arts Occupations
The most common Management, Business, Science and Arts occupations in Metamora are Health Diagnosing & Treating (343 | 16.1%), Management (301 | 14.1%), Health Technologists (296 | 13.9%), Computers, Engineering & Science (280 | 13.1%), and Community & Social Service (258 | 12.1%).
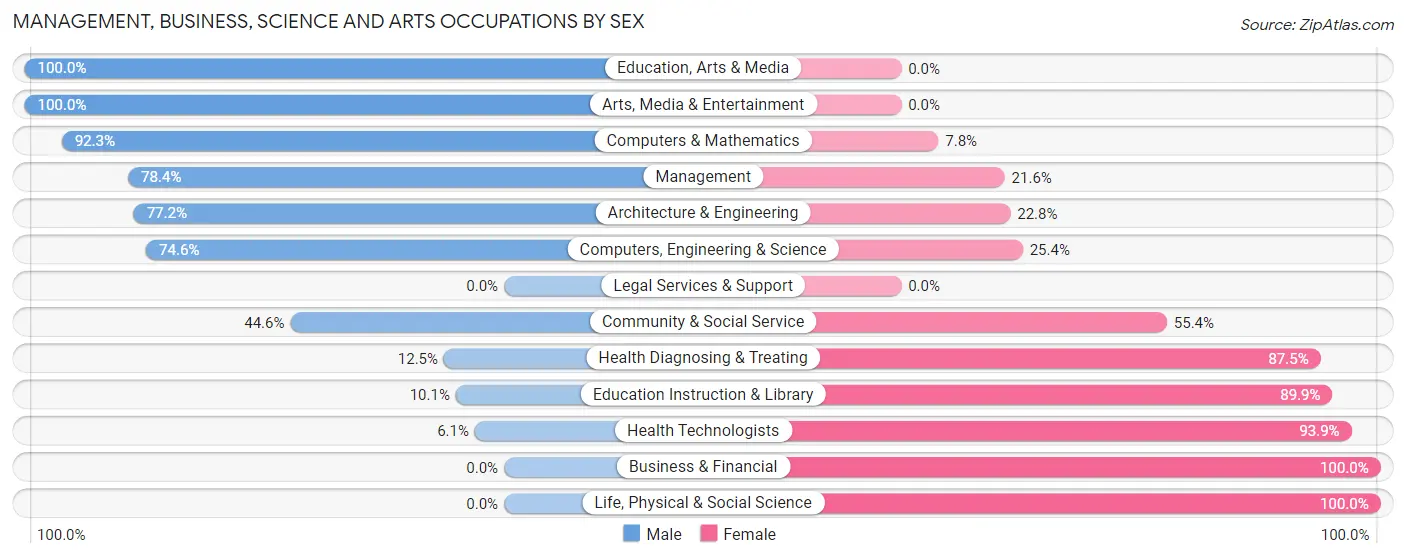
Management, Business, Science and Arts Occupations by Sex
Within the Management, Business, Science and Arts occupations in Metamora, the most male-oriented occupations are Education, Arts & Media (100.0%), Arts, Media & Entertainment (100.0%), and Computers & Mathematics (92.2%), while the most female-oriented occupations are Business & Financial (100.0%), Life, Physical & Social Science (100.0%), and Health Technologists (93.9%).
| Occupation | Male | Female |
| Management | 236 (78.4%) | 65 (21.6%) |
| Business & Financial | 0 (0.0%) | 62 (100.0%) |
| Computers, Engineering & Science | 209 (74.6%) | 71 (25.4%) |
| Computers & Mathematics | 131 (92.2%) | 11 (7.7%) |
| Architecture & Engineering | 78 (77.2%) | 23 (22.8%) |
| Life, Physical & Social Science | 0 (0.0%) | 37 (100.0%) |
| Community & Social Service | 115 (44.6%) | 143 (55.4%) |
| Education, Arts & Media | 18 (100.0%) | 0 (0.0%) |
| Legal Services & Support | 0 (0.0%) | 0 (0.0%) |
| Education Instruction & Library | 16 (10.1%) | 143 (89.9%) |
| Arts, Media & Entertainment | 81 (100.0%) | 0 (0.0%) |
| Health Diagnosing & Treating | 43 (12.5%) | 300 (87.5%) |
| Health Technologists | 18 (6.1%) | 278 (93.9%) |
| Total (Category) | 603 (48.5%) | 641 (51.5%) |
| Total (Overall) | 992 (46.5%) | 1,143 (53.5%) |
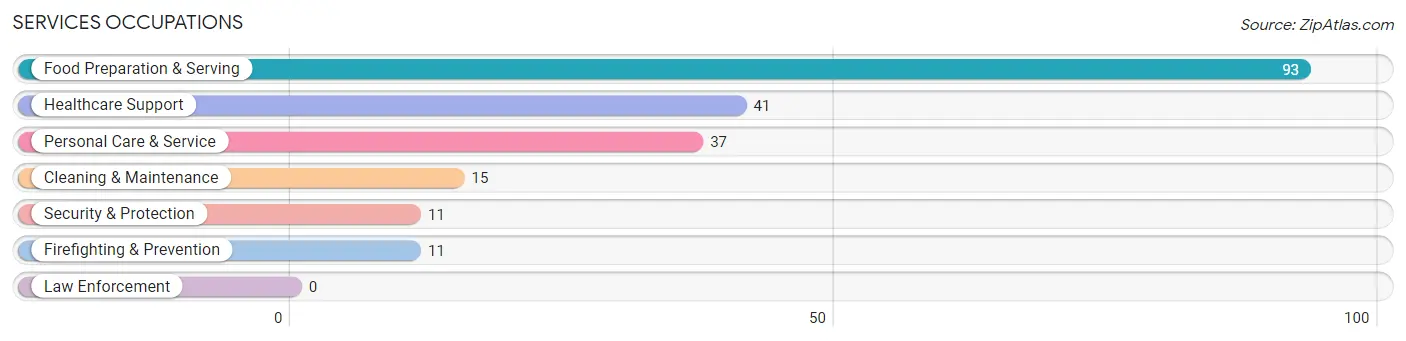
Services Occupations
The most common Services occupations in Metamora are Food Preparation & Serving (93 | 4.4%), Healthcare Support (41 | 1.9%), Personal Care & Service (37 | 1.7%), Cleaning & Maintenance (15 | 0.7%), and Security & Protection (11 | 0.5%).
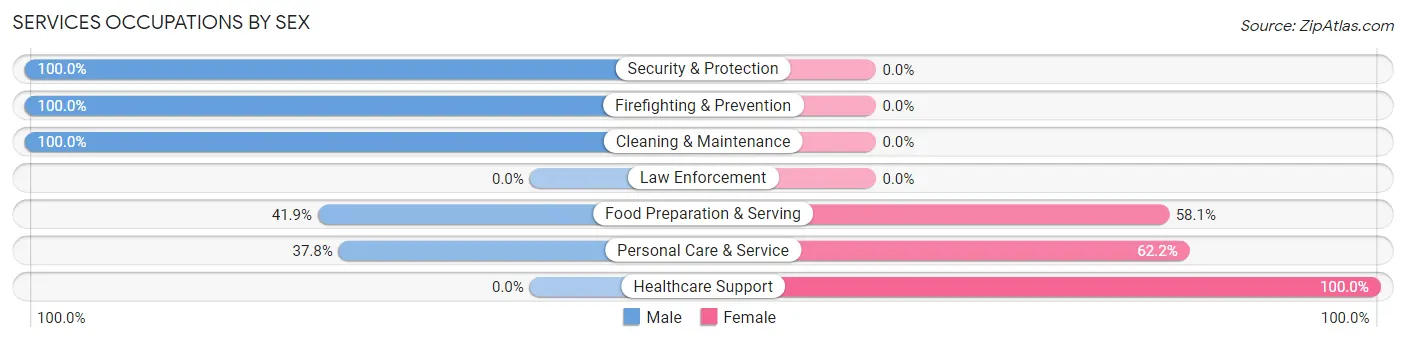
Services Occupations by Sex
Within the Services occupations in Metamora, the most male-oriented occupations are Security & Protection (100.0%), Firefighting & Prevention (100.0%), and Cleaning & Maintenance (100.0%), while the most female-oriented occupations are Healthcare Support (100.0%), Personal Care & Service (62.2%), and Food Preparation & Serving (58.1%).
| Occupation | Male | Female |
| Healthcare Support | 0 (0.0%) | 41 (100.0%) |
| Security & Protection | 11 (100.0%) | 0 (0.0%) |
| Firefighting & Prevention | 11 (100.0%) | 0 (0.0%) |
| Law Enforcement | 0 (0.0%) | 0 (0.0%) |
| Food Preparation & Serving | 39 (41.9%) | 54 (58.1%) |
| Cleaning & Maintenance | 15 (100.0%) | 0 (0.0%) |
| Personal Care & Service | 14 (37.8%) | 23 (62.2%) |
| Total (Category) | 79 (40.1%) | 118 (59.9%) |
| Total (Overall) | 992 (46.5%) | 1,143 (53.5%) |
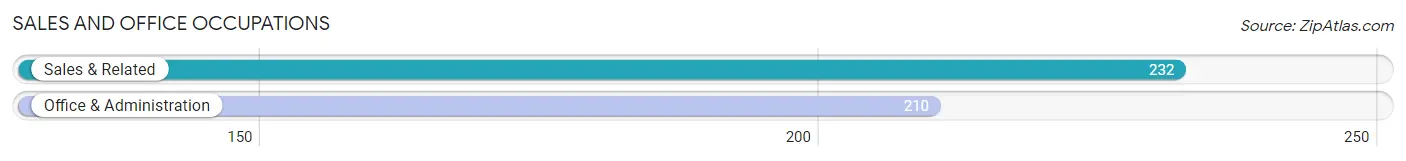
Sales and Office Occupations
The most common Sales and Office occupations in Metamora are Sales & Related (232 | 10.9%), and Office & Administration (210 | 9.8%).
Sales and Office Occupations by Sex
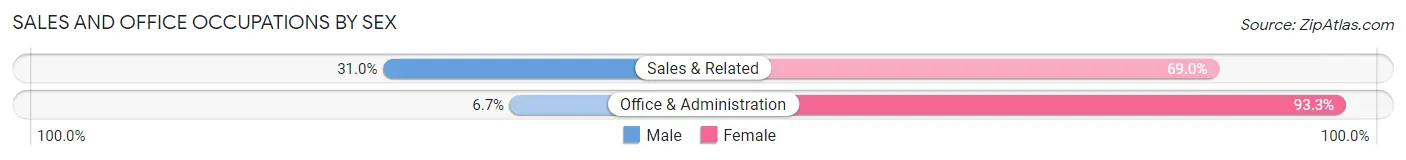
| Occupation | Male | Female |
| Sales & Related | 72 (31.0%) | 160 (69.0%) |
| Office & Administration | 14 (6.7%) | 196 (93.3%) |
| Total (Category) | 86 (19.5%) | 356 (80.5%) |
| Total (Overall) | 992 (46.5%) | 1,143 (53.5%) |
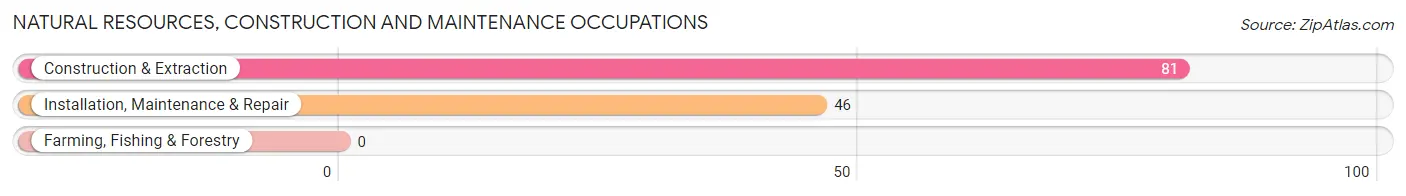
Natural Resources, Construction and Maintenance Occupations
The most common Natural Resources, Construction and Maintenance occupations in Metamora are Construction & Extraction (81 | 3.8%), and Installation, Maintenance & Repair (46 | 2.1%).
Natural Resources, Construction and Maintenance Occupations by Sex
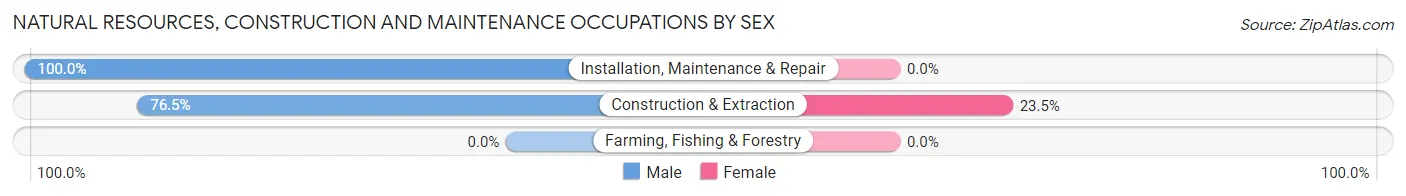
| Occupation | Male | Female |
| Farming, Fishing & Forestry | 0 (0.0%) | 0 (0.0%) |
| Construction & Extraction | 62 (76.5%) | 19 (23.5%) |
| Installation, Maintenance & Repair | 46 (100.0%) | 0 (0.0%) |
| Total (Category) | 108 (85.0%) | 19 (15.0%) |
| Total (Overall) | 992 (46.5%) | 1,143 (53.5%) |
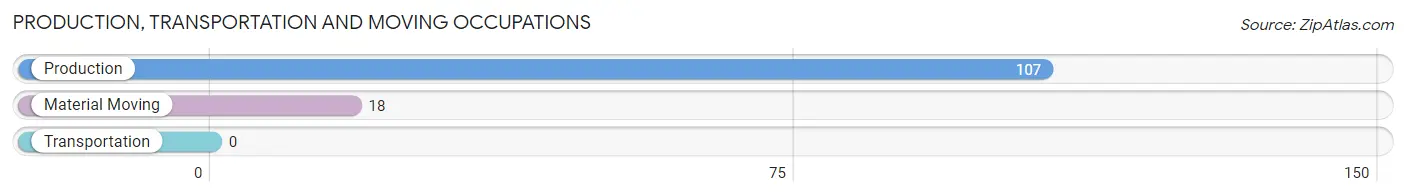
Production, Transportation and Moving Occupations
The most common Production, Transportation and Moving occupations in Metamora are Production (107 | 5.0%), and Material Moving (18 | 0.8%).
Production, Transportation and Moving Occupations by Sex
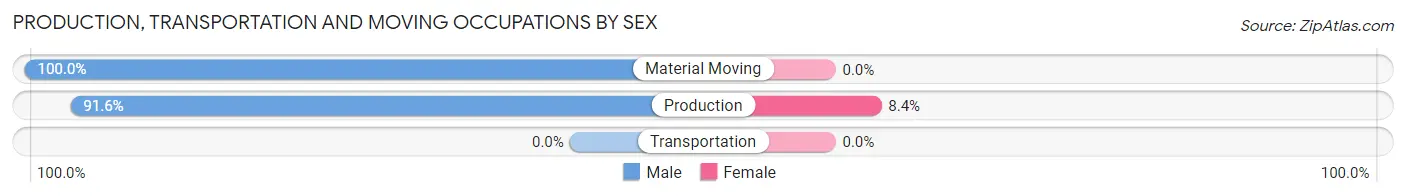
| Occupation | Male | Female |
| Production | 98 (91.6%) | 9 (8.4%) |
| Transportation | 0 (0.0%) | 0 (0.0%) |
| Material Moving | 18 (100.0%) | 0 (0.0%) |
| Total (Category) | 116 (92.8%) | 9 (7.2%) |
| Total (Overall) | 992 (46.5%) | 1,143 (53.5%) |
Employment Industries by Sex in Metamora
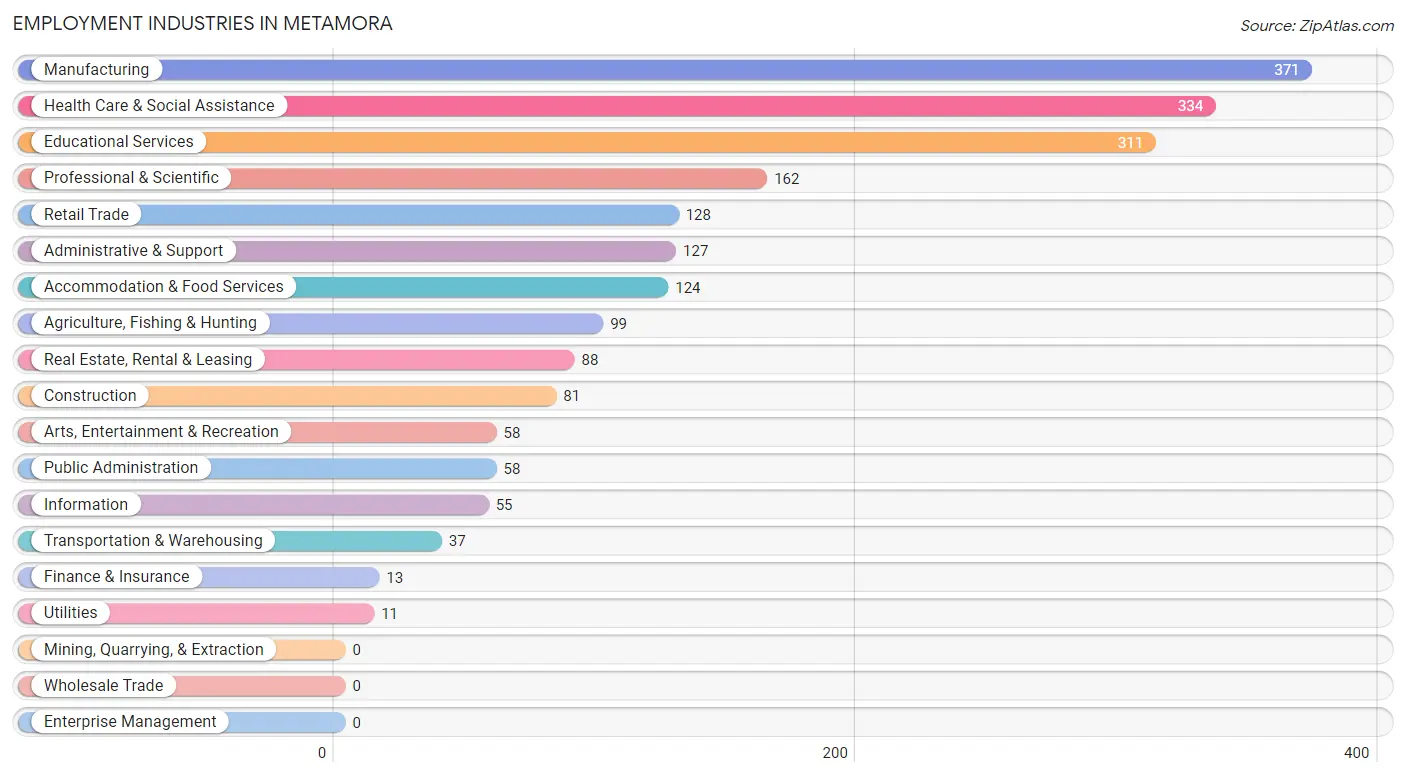
Employment Industries in Metamora
The major employment industries in Metamora include Manufacturing (371 | 17.4%), Health Care & Social Assistance (334 | 15.6%), Educational Services (311 | 14.6%), Professional & Scientific (162 | 7.6%), and Retail Trade (128 | 6.0%).
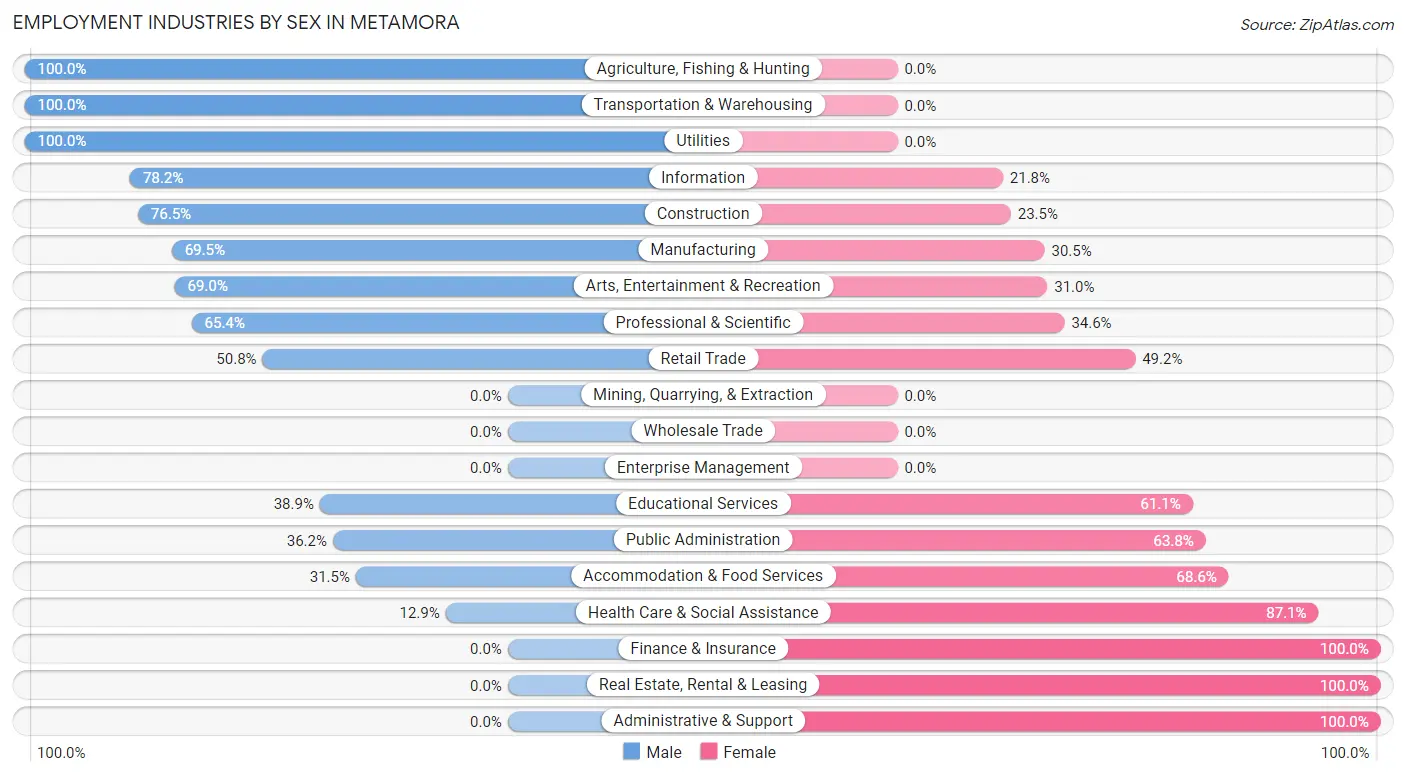
Employment Industries by Sex in Metamora
The Metamora industries that see more men than women are Agriculture, Fishing & Hunting (100.0%), Transportation & Warehousing (100.0%), and Utilities (100.0%), whereas the industries that tend to have a higher number of women are Finance & Insurance (100.0%), Real Estate, Rental & Leasing (100.0%), and Administrative & Support (100.0%).
| Industry | Male | Female |
| Agriculture, Fishing & Hunting | 99 (100.0%) | 0 (0.0%) |
| Mining, Quarrying, & Extraction | 0 (0.0%) | 0 (0.0%) |
| Construction | 62 (76.5%) | 19 (23.5%) |
| Manufacturing | 258 (69.5%) | 113 (30.5%) |
| Wholesale Trade | 0 (0.0%) | 0 (0.0%) |
| Retail Trade | 65 (50.8%) | 63 (49.2%) |
| Transportation & Warehousing | 37 (100.0%) | 0 (0.0%) |
| Utilities | 11 (100.0%) | 0 (0.0%) |
| Information | 43 (78.2%) | 12 (21.8%) |
| Finance & Insurance | 0 (0.0%) | 13 (100.0%) |
| Real Estate, Rental & Leasing | 0 (0.0%) | 88 (100.0%) |
| Professional & Scientific | 106 (65.4%) | 56 (34.6%) |
| Enterprise Management | 0 (0.0%) | 0 (0.0%) |
| Administrative & Support | 0 (0.0%) | 127 (100.0%) |
| Educational Services | 121 (38.9%) | 190 (61.1%) |
| Health Care & Social Assistance | 43 (12.9%) | 291 (87.1%) |
| Arts, Entertainment & Recreation | 40 (69.0%) | 18 (31.0%) |
| Accommodation & Food Services | 39 (31.5%) | 85 (68.5%) |
| Public Administration | 21 (36.2%) | 37 (63.8%) |
| Total | 992 (46.5%) | 1,143 (53.5%) |
Education in Metamora
School Enrollment in Metamora
The most common levels of schooling among the 972 students in Metamora are high school (201 | 20.7%), middle school (176 | 18.1%), and nursery / preschool (148 | 15.2%).
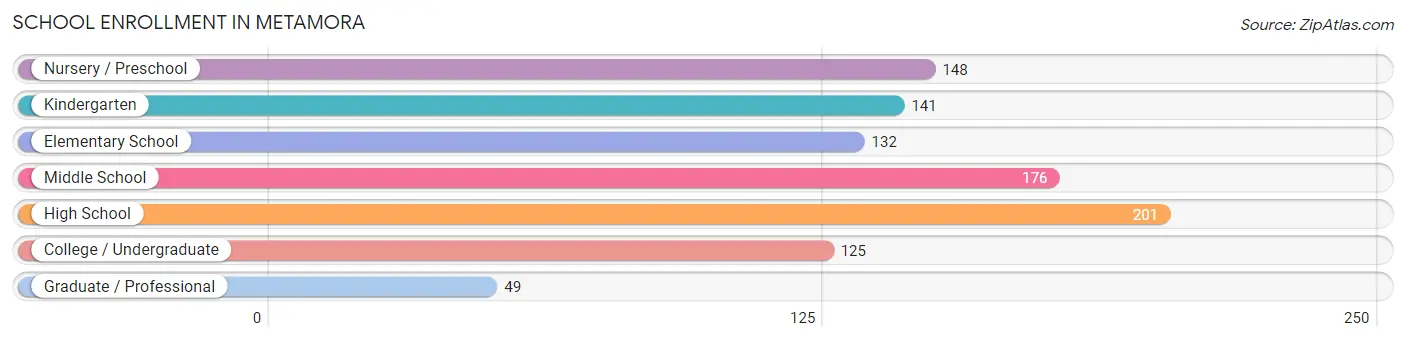
| School Level | # Students | % Students |
| Nursery / Preschool | 148 | 15.2% |
| Kindergarten | 141 | 14.5% |
| Elementary School | 132 | 13.6% |
| Middle School | 176 | 18.1% |
| High School | 201 | 20.7% |
| College / Undergraduate | 125 | 12.9% |
| Graduate / Professional | 49 | 5.0% |
| Total | 972 | 100.0% |
School Enrollment by Age by Funding Source in Metamora
Out of a total of 972 students who are enrolled in schools in Metamora, 104 (10.7%) attend a private institution, while the remaining 868 (89.3%) are enrolled in public schools. The age group of 5 to 9 year old has the highest likelihood of being enrolled in private schools, with 57 (19.3% in the age bracket) enrolled. Conversely, the age group of 15 to 17 year olds has the lowest likelihood of being enrolled in a private school, with 180 (100.0% in the age bracket) attending a public institution.
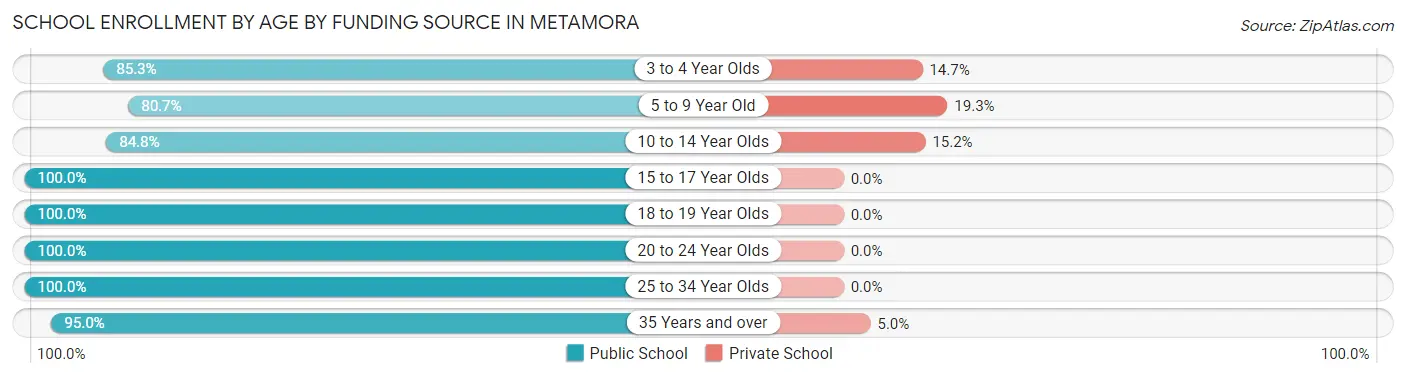
| Age Bracket | Public School | Private School |
| 3 to 4 Year Olds | 93 (85.3%) | 16 (14.7%) |
| 5 to 9 Year Old | 238 (80.7%) | 57 (19.3%) |
| 10 to 14 Year Olds | 167 (84.8%) | 30 (15.2%) |
| 15 to 17 Year Olds | 180 (100.0%) | 0 (0.0%) |
| 18 to 19 Year Olds | 42 (100.0%) | 0 (0.0%) |
| 20 to 24 Year Olds | 62 (100.0%) | 0 (0.0%) |
| 25 to 34 Year Olds | 67 (100.0%) | 0 (0.0%) |
| 35 Years and over | 19 (95.0%) | 1 (5.0%) |
| Total | 868 (89.3%) | 104 (10.7%) |
Educational Attainment by Field of Study in Metamora
Science & technology (322 | 20.9%), education (295 | 19.2%), business (252 | 16.4%), communications (150 | 9.8%), and arts & humanities (109 | 7.1%) are the most common fields of study among 1,538 individuals in Metamora who have obtained a bachelor's degree or higher.
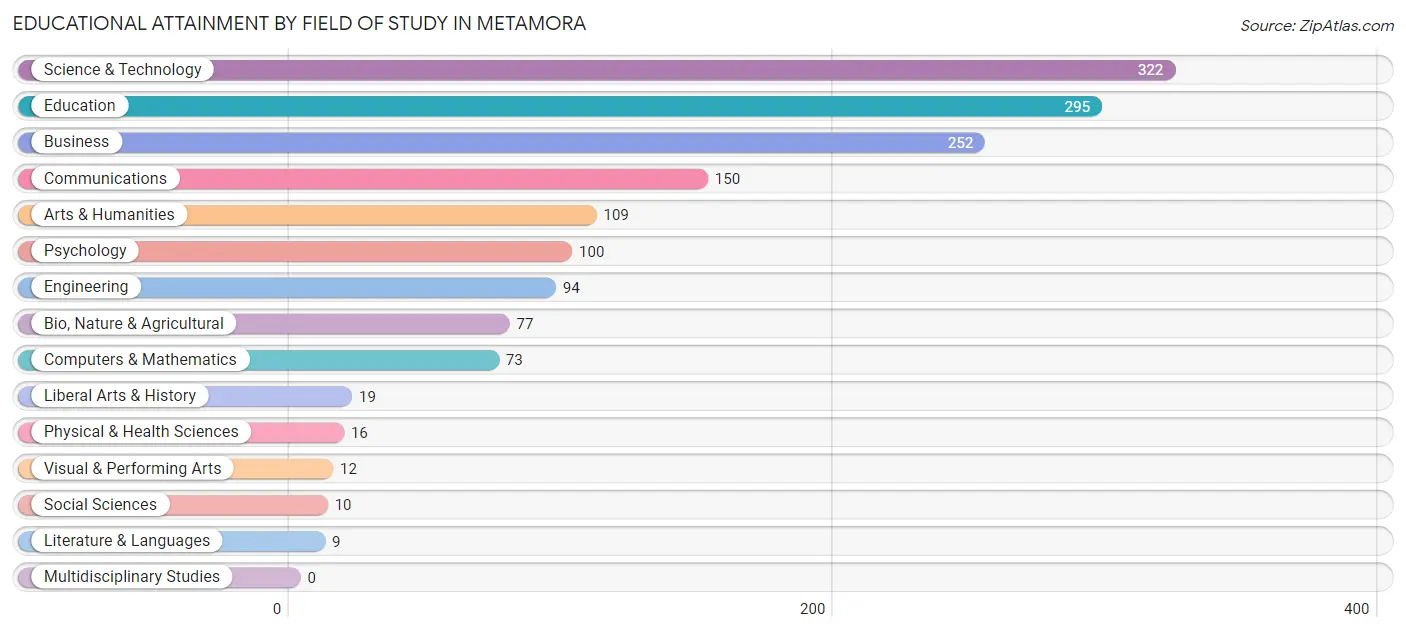
| Field of Study | # Graduates | % Graduates |
| Computers & Mathematics | 73 | 4.8% |
| Bio, Nature & Agricultural | 77 | 5.0% |
| Physical & Health Sciences | 16 | 1.0% |
| Psychology | 100 | 6.5% |
| Social Sciences | 10 | 0.6% |
| Engineering | 94 | 6.1% |
| Multidisciplinary Studies | 0 | 0.0% |
| Science & Technology | 322 | 20.9% |
| Business | 252 | 16.4% |
| Education | 295 | 19.2% |
| Literature & Languages | 9 | 0.6% |
| Liberal Arts & History | 19 | 1.2% |
| Visual & Performing Arts | 12 | 0.8% |
| Communications | 150 | 9.8% |
| Arts & Humanities | 109 | 7.1% |
| Total | 1,538 | 100.0% |
Transportation & Commute in Metamora
Vehicle Availability by Sex in Metamora
The most prevalent vehicle ownership categories in Metamora are males with 2 vehicles (467, accounting for 47.2%) and females with 2 vehicles (371, making up 40.9%).
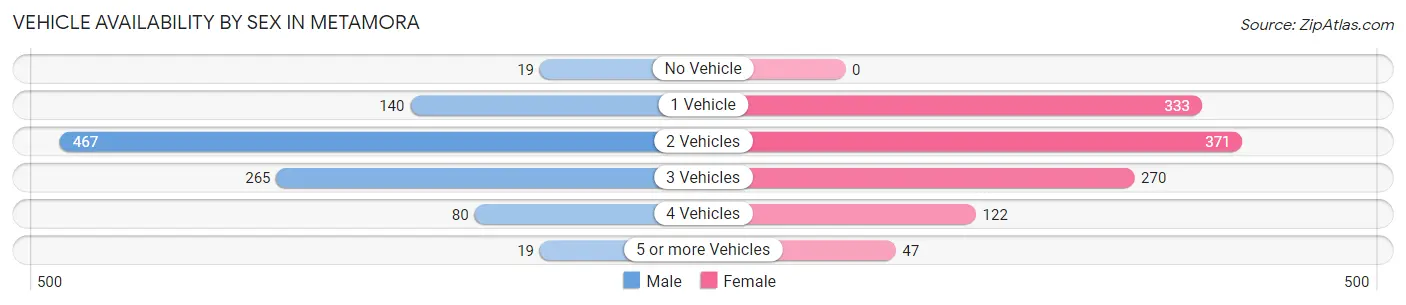
| Vehicles Available | Male | Female |
| No Vehicle | 19 (1.9%) | 0 (0.0%) |
| 1 Vehicle | 140 (14.1%) | 333 (29.1%) |
| 2 Vehicles | 467 (47.2%) | 371 (32.5%) |
| 3 Vehicles | 265 (26.8%) | 270 (23.6%) |
| 4 Vehicles | 80 (8.1%) | 122 (10.7%) |
| 5 or more Vehicles | 19 (1.9%) | 47 (4.1%) |
| Total | 990 (100.0%) | 1,143 (100.0%) |
Commute Time in Metamora
The most frequently occuring commute durations in Metamora are 25 to 29 minutes (400 commuters, 20.8%), 30 to 34 minutes (392 commuters, 20.3%), and 15 to 19 minutes (218 commuters, 11.3%).
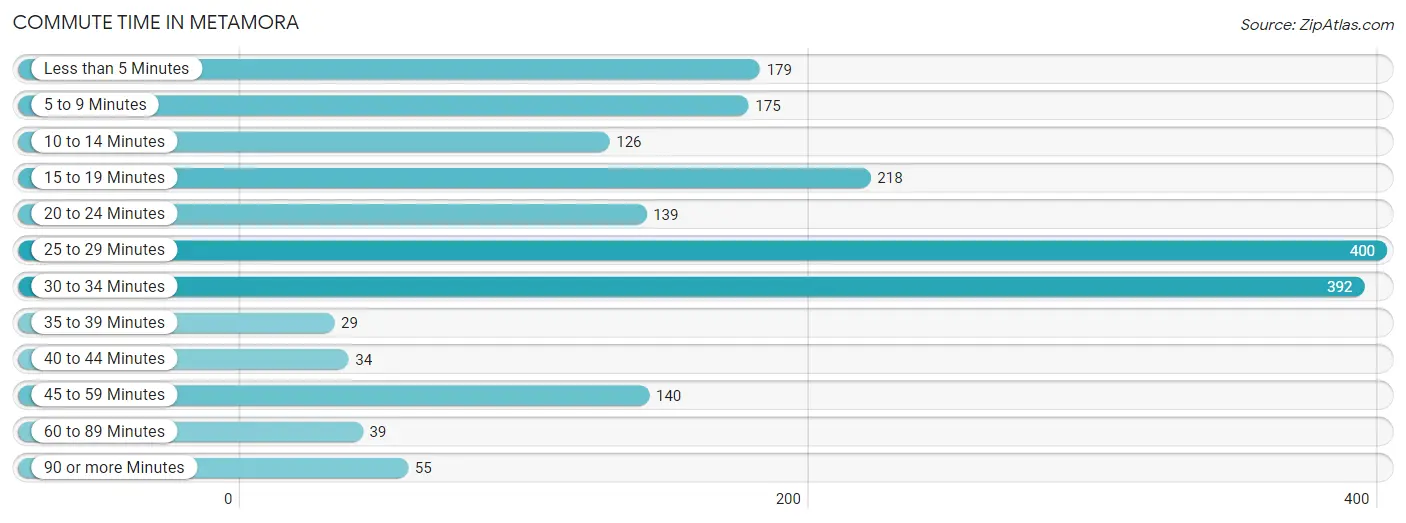
| Commute Time | # Commuters | % Commuters |
| Less than 5 Minutes | 179 | 9.3% |
| 5 to 9 Minutes | 175 | 9.1% |
| 10 to 14 Minutes | 126 | 6.5% |
| 15 to 19 Minutes | 218 | 11.3% |
| 20 to 24 Minutes | 139 | 7.2% |
| 25 to 29 Minutes | 400 | 20.8% |
| 30 to 34 Minutes | 392 | 20.3% |
| 35 to 39 Minutes | 29 | 1.5% |
| 40 to 44 Minutes | 34 | 1.8% |
| 45 to 59 Minutes | 140 | 7.3% |
| 60 to 89 Minutes | 39 | 2.0% |
| 90 or more Minutes | 55 | 2.9% |
Commute Time by Sex in Metamora
The most common commute times in Metamora are 15 to 19 minutes (168 commuters, 19.4%) for males and 25 to 29 minutes (256 commuters, 24.1%) for females.
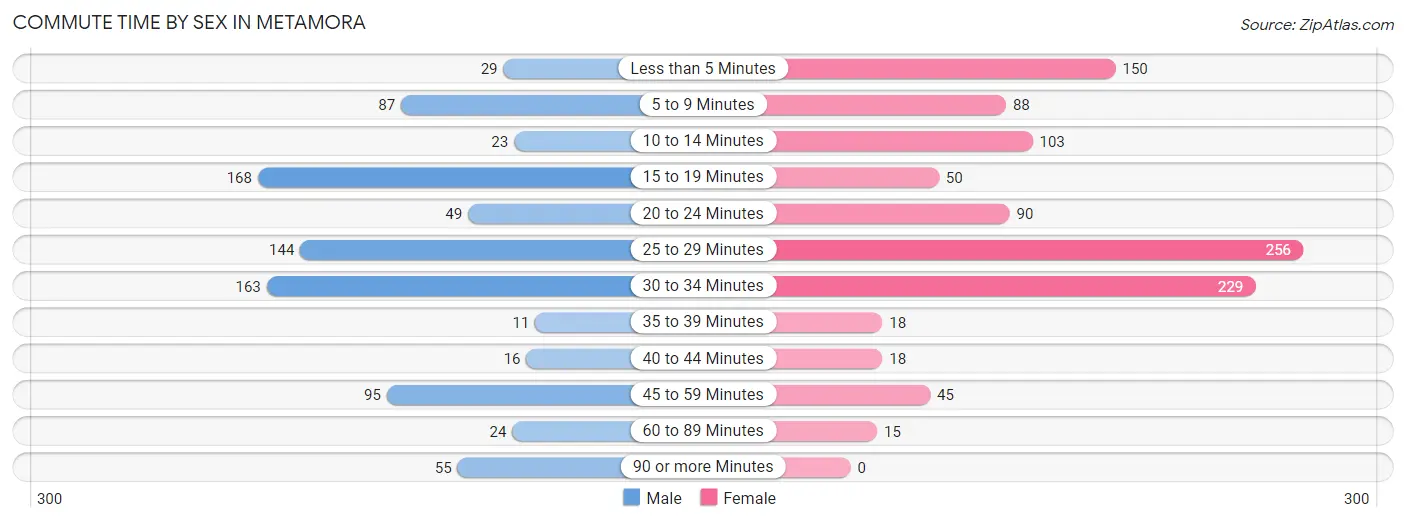
| Commute Time | Male | Female |
| Less than 5 Minutes | 29 (3.4%) | 150 (14.1%) |
| 5 to 9 Minutes | 87 (10.1%) | 88 (8.3%) |
| 10 to 14 Minutes | 23 (2.7%) | 103 (9.7%) |
| 15 to 19 Minutes | 168 (19.4%) | 50 (4.7%) |
| 20 to 24 Minutes | 49 (5.7%) | 90 (8.5%) |
| 25 to 29 Minutes | 144 (16.7%) | 256 (24.1%) |
| 30 to 34 Minutes | 163 (18.9%) | 229 (21.6%) |
| 35 to 39 Minutes | 11 (1.3%) | 18 (1.7%) |
| 40 to 44 Minutes | 16 (1.8%) | 18 (1.7%) |
| 45 to 59 Minutes | 95 (11.0%) | 45 (4.2%) |
| 60 to 89 Minutes | 24 (2.8%) | 15 (1.4%) |
| 90 or more Minutes | 55 (6.4%) | 0 (0.0%) |
Time of Departure to Work by Sex in Metamora
The most frequent times of departure to work in Metamora are 6:00 AM to 6:29 AM (176, 20.4%) for males and 8:00 AM to 8:29 AM (258, 24.3%) for females.
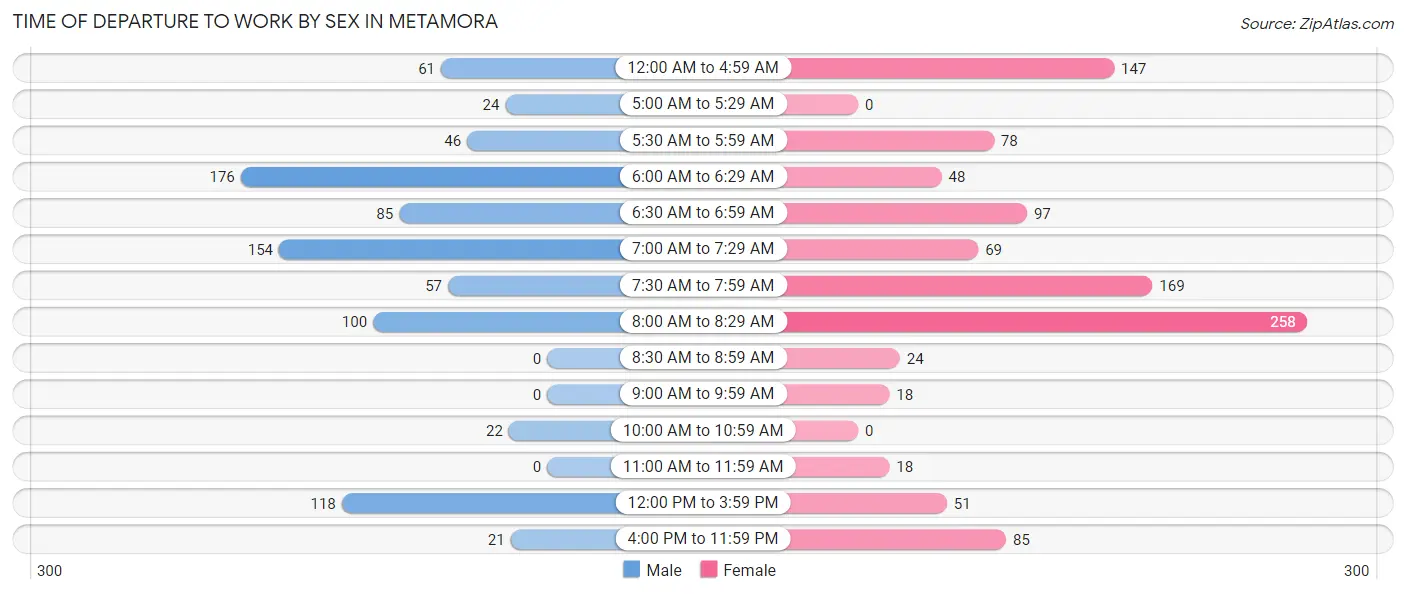
| Time of Departure | Male | Female |
| 12:00 AM to 4:59 AM | 61 (7.1%) | 147 (13.8%) |
| 5:00 AM to 5:29 AM | 24 (2.8%) | 0 (0.0%) |
| 5:30 AM to 5:59 AM | 46 (5.3%) | 78 (7.3%) |
| 6:00 AM to 6:29 AM | 176 (20.4%) | 48 (4.5%) |
| 6:30 AM to 6:59 AM | 85 (9.8%) | 97 (9.1%) |
| 7:00 AM to 7:29 AM | 154 (17.8%) | 69 (6.5%) |
| 7:30 AM to 7:59 AM | 57 (6.6%) | 169 (15.9%) |
| 8:00 AM to 8:29 AM | 100 (11.6%) | 258 (24.3%) |
| 8:30 AM to 8:59 AM | 0 (0.0%) | 24 (2.3%) |
| 9:00 AM to 9:59 AM | 0 (0.0%) | 18 (1.7%) |
| 10:00 AM to 10:59 AM | 22 (2.5%) | 0 (0.0%) |
| 11:00 AM to 11:59 AM | 0 (0.0%) | 18 (1.7%) |
| 12:00 PM to 3:59 PM | 118 (13.7%) | 51 (4.8%) |
| 4:00 PM to 11:59 PM | 21 (2.4%) | 85 (8.0%) |
| Total | 864 (100.0%) | 1,062 (100.0%) |
Housing Occupancy in Metamora
Occupancy by Ownership in Metamora
Of the total 1,668 dwellings in Metamora, owner-occupied units account for 1,445 (86.6%), while renter-occupied units make up 223 (13.4%).
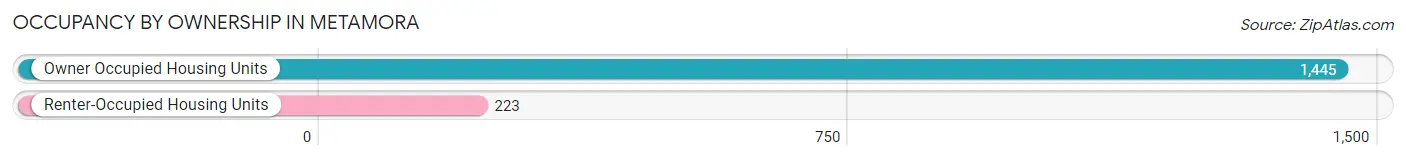
| Occupancy | # Housing Units | % Housing Units |
| Owner Occupied Housing Units | 1,445 | 86.6% |
| Renter-Occupied Housing Units | 223 | 13.4% |
| Total Occupied Housing Units | 1,668 | 100.0% |
Occupancy by Household Size in Metamora
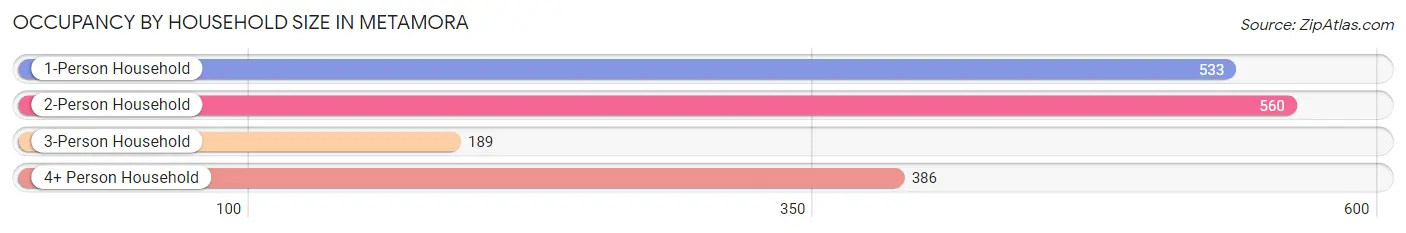
| Household Size | # Housing Units | % Housing Units |
| 1-Person Household | 533 | 32.0% |
| 2-Person Household | 560 | 33.6% |
| 3-Person Household | 189 | 11.3% |
| 4+ Person Household | 386 | 23.1% |
| Total Housing Units | 1,668 | 100.0% |
Occupancy by Ownership by Household Size in Metamora
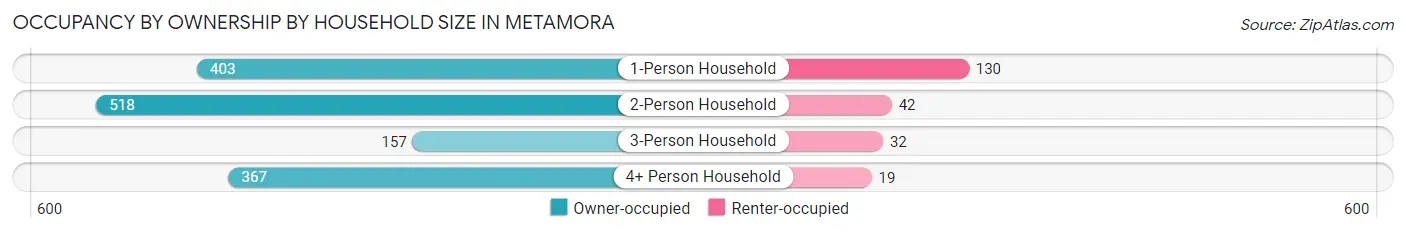
| Household Size | Owner-occupied | Renter-occupied |
| 1-Person Household | 403 (75.6%) | 130 (24.4%) |
| 2-Person Household | 518 (92.5%) | 42 (7.5%) |
| 3-Person Household | 157 (83.1%) | 32 (16.9%) |
| 4+ Person Household | 367 (95.1%) | 19 (4.9%) |
| Total Housing Units | 1,445 (86.6%) | 223 (13.4%) |
Occupancy by Educational Attainment in Metamora
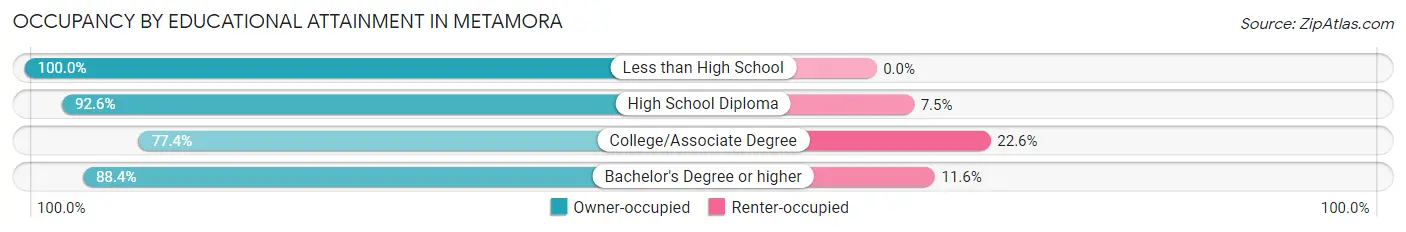
| Household Size | Owner-occupied | Renter-occupied |
| Less than High School | 35 (100.0%) | 0 (0.0%) |
| High School Diploma | 236 (92.5%) | 19 (7.4%) |
| College/Associate Degree | 311 (77.4%) | 91 (22.6%) |
| Bachelor's Degree or higher | 863 (88.4%) | 113 (11.6%) |
Occupancy by Age of Householder in Metamora
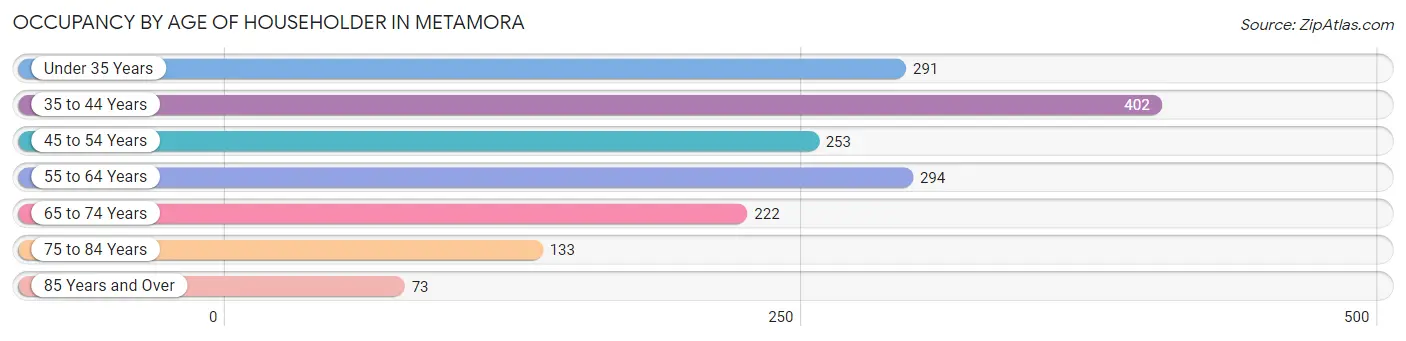
| Age Bracket | # Households | % Households |
| Under 35 Years | 291 | 17.4% |
| 35 to 44 Years | 402 | 24.1% |
| 45 to 54 Years | 253 | 15.2% |
| 55 to 64 Years | 294 | 17.6% |
| 65 to 74 Years | 222 | 13.3% |
| 75 to 84 Years | 133 | 8.0% |
| 85 Years and Over | 73 | 4.4% |
| Total | 1,668 | 100.0% |
Housing Finances in Metamora
Median Income by Occupancy in Metamora
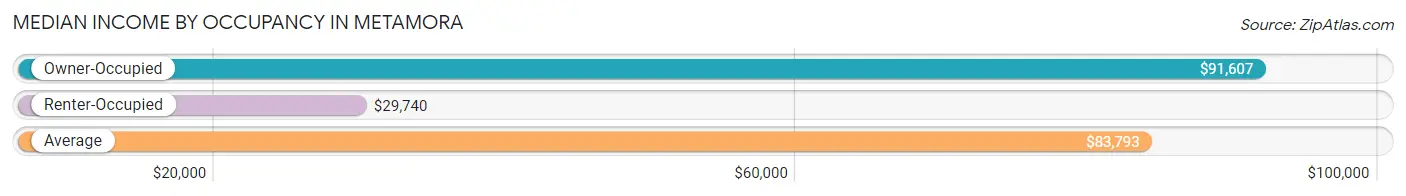
| Occupancy Type | # Households | Median Income |
| Owner-Occupied | 1,445 (86.6%) | $91,607 |
| Renter-Occupied | 223 (13.4%) | $29,740 |
| Average | 1,668 (100.0%) | $83,793 |
Occupancy by Householder Income Bracket in Metamora
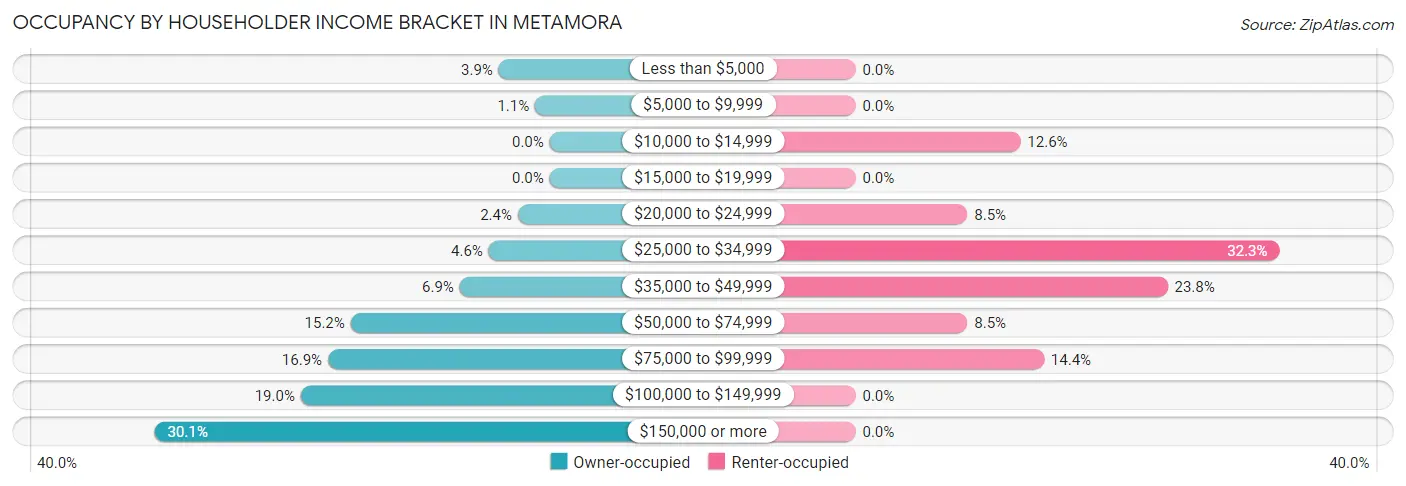
| Income Bracket | Owner-occupied | Renter-occupied |
| Less than $5,000 | 56 (3.9%) | 0 (0.0%) |
| $5,000 to $9,999 | 16 (1.1%) | 0 (0.0%) |
| $10,000 to $14,999 | 0 (0.0%) | 28 (12.6%) |
| $15,000 to $19,999 | 0 (0.0%) | 0 (0.0%) |
| $20,000 to $24,999 | 35 (2.4%) | 19 (8.5%) |
| $25,000 to $34,999 | 67 (4.6%) | 72 (32.3%) |
| $35,000 to $49,999 | 99 (6.9%) | 53 (23.8%) |
| $50,000 to $74,999 | 219 (15.2%) | 19 (8.5%) |
| $75,000 to $99,999 | 244 (16.9%) | 32 (14.3%) |
| $100,000 to $149,999 | 274 (19.0%) | 0 (0.0%) |
| $150,000 or more | 435 (30.1%) | 0 (0.0%) |
| Total | 1,445 (100.0%) | 223 (100.0%) |
Monthly Housing Cost Tiers in Metamora
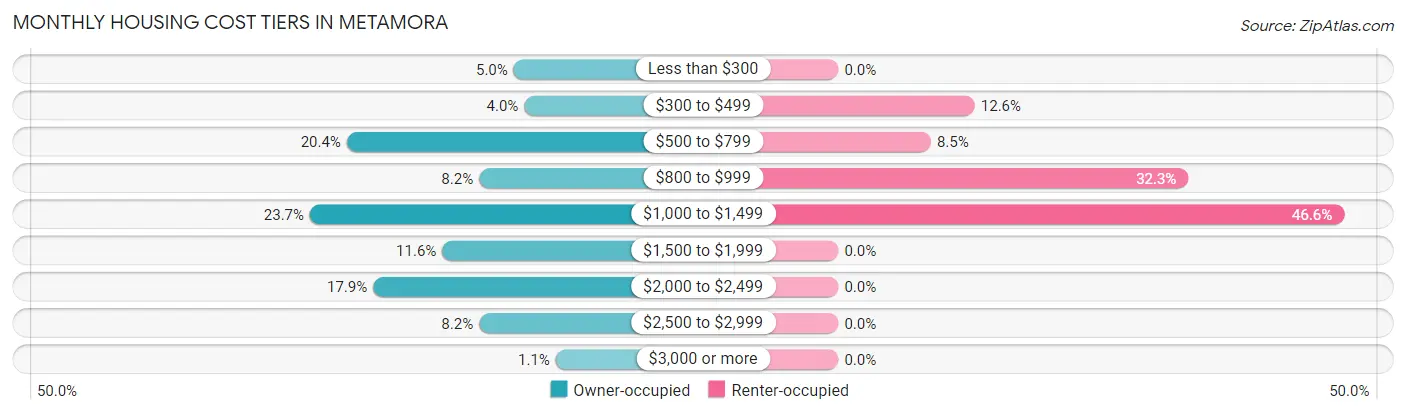
| Monthly Cost | Owner-occupied | Renter-occupied |
| Less than $300 | 72 (5.0%) | 0 (0.0%) |
| $300 to $499 | 58 (4.0%) | 28 (12.6%) |
| $500 to $799 | 294 (20.3%) | 19 (8.5%) |
| $800 to $999 | 118 (8.2%) | 72 (32.3%) |
| $1,000 to $1,499 | 343 (23.7%) | 104 (46.6%) |
| $1,500 to $1,999 | 167 (11.6%) | 0 (0.0%) |
| $2,000 to $2,499 | 259 (17.9%) | 0 (0.0%) |
| $2,500 to $2,999 | 118 (8.2%) | 0 (0.0%) |
| $3,000 or more | 16 (1.1%) | 0 (0.0%) |
| Total | 1,445 (100.0%) | 223 (100.0%) |
Physical Housing Characteristics in Metamora
Housing Structures in Metamora
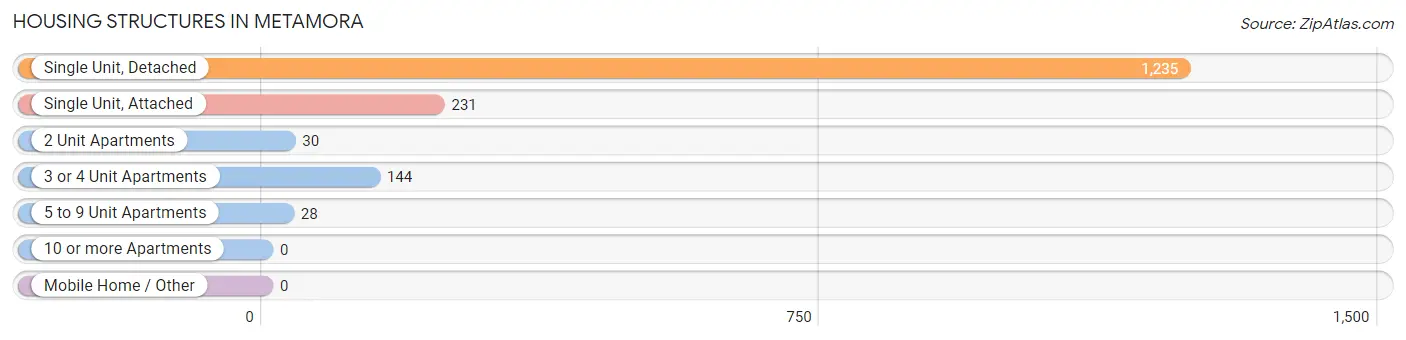
| Structure Type | # Housing Units | % Housing Units |
| Single Unit, Detached | 1,235 | 74.0% |
| Single Unit, Attached | 231 | 13.9% |
| 2 Unit Apartments | 30 | 1.8% |
| 3 or 4 Unit Apartments | 144 | 8.6% |
| 5 to 9 Unit Apartments | 28 | 1.7% |
| 10 or more Apartments | 0 | 0.0% |
| Mobile Home / Other | 0 | 0.0% |
| Total | 1,668 | 100.0% |
Housing Structures by Occupancy in Metamora
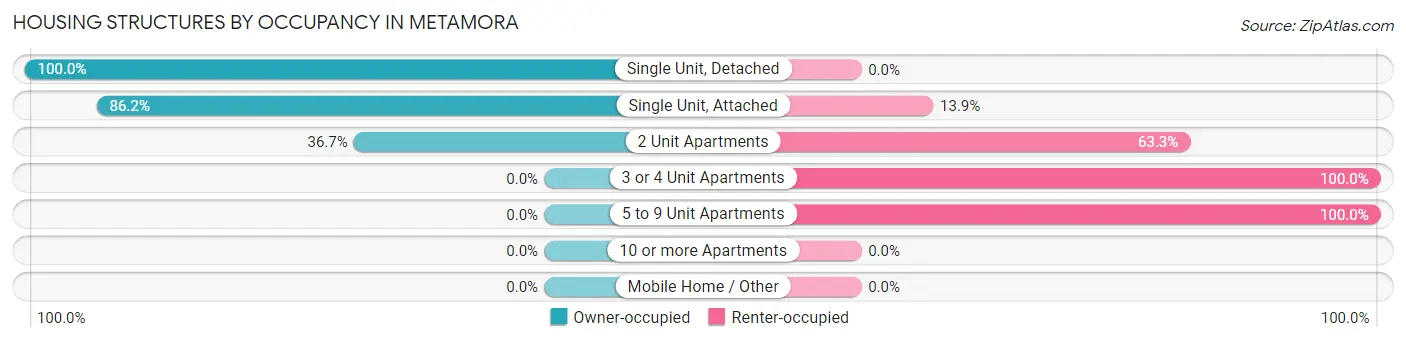
| Structure Type | Owner-occupied | Renter-occupied |
| Single Unit, Detached | 1,235 (100.0%) | 0 (0.0%) |
| Single Unit, Attached | 199 (86.2%) | 32 (13.9%) |
| 2 Unit Apartments | 11 (36.7%) | 19 (63.3%) |
| 3 or 4 Unit Apartments | 0 (0.0%) | 144 (100.0%) |
| 5 to 9 Unit Apartments | 0 (0.0%) | 28 (100.0%) |
| 10 or more Apartments | 0 (0.0%) | 0 (0.0%) |
| Mobile Home / Other | 0 (0.0%) | 0 (0.0%) |
| Total | 1,445 (86.6%) | 223 (13.4%) |
Housing Structures by Number of Rooms in Metamora
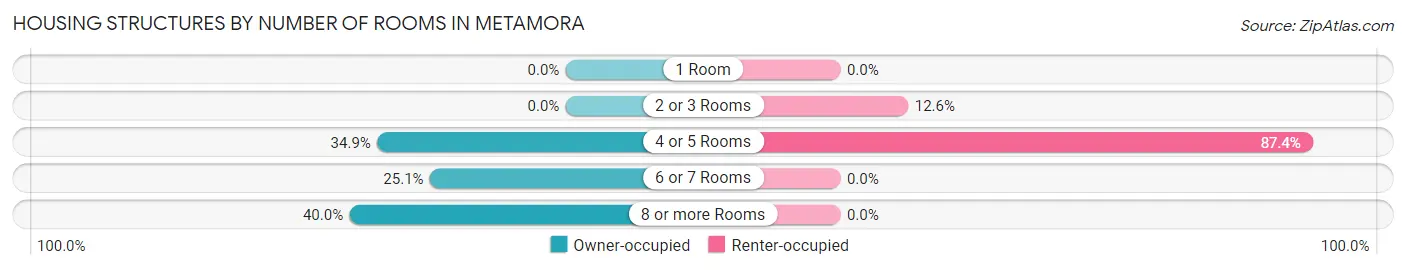
| Number of Rooms | Owner-occupied | Renter-occupied |
| 1 Room | 0 (0.0%) | 0 (0.0%) |
| 2 or 3 Rooms | 0 (0.0%) | 28 (12.6%) |
| 4 or 5 Rooms | 504 (34.9%) | 195 (87.4%) |
| 6 or 7 Rooms | 363 (25.1%) | 0 (0.0%) |
| 8 or more Rooms | 578 (40.0%) | 0 (0.0%) |
| Total | 1,445 (100.0%) | 223 (100.0%) |
Housing Structure by Heating Type in Metamora
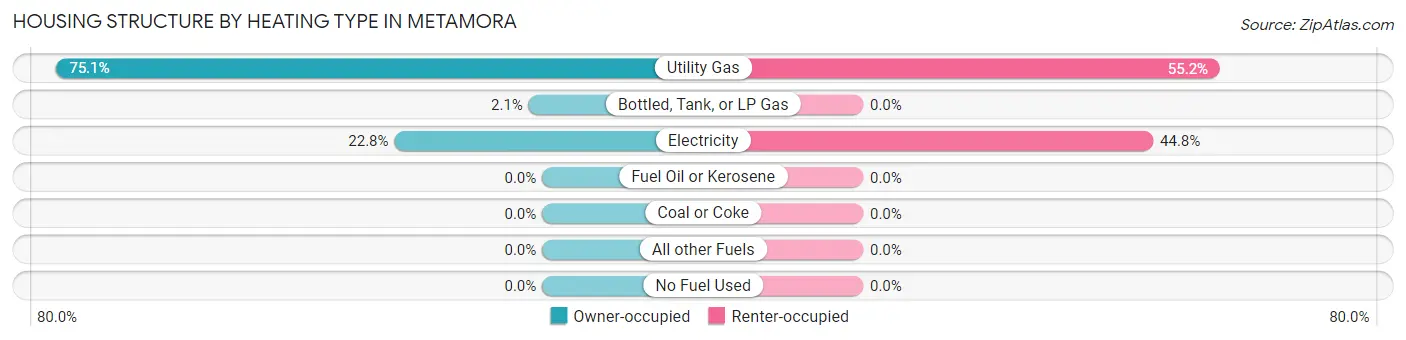
| Heating Type | Owner-occupied | Renter-occupied |
| Utility Gas | 1,085 (75.1%) | 123 (55.2%) |
| Bottled, Tank, or LP Gas | 30 (2.1%) | 0 (0.0%) |
| Electricity | 330 (22.8%) | 100 (44.8%) |
| Fuel Oil or Kerosene | 0 (0.0%) | 0 (0.0%) |
| Coal or Coke | 0 (0.0%) | 0 (0.0%) |
| All other Fuels | 0 (0.0%) | 0 (0.0%) |
| No Fuel Used | 0 (0.0%) | 0 (0.0%) |
| Total | 1,445 (100.0%) | 223 (100.0%) |
Household Vehicle Usage in Metamora
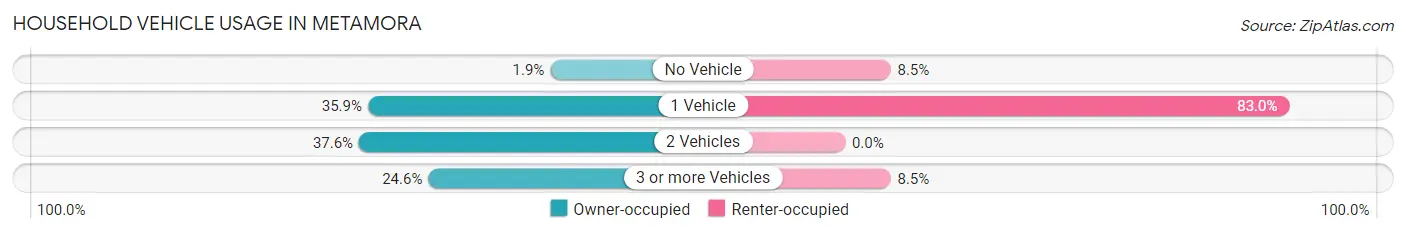
| Vehicles per Household | Owner-occupied | Renter-occupied |
| No Vehicle | 27 (1.9%) | 19 (8.5%) |
| 1 Vehicle | 519 (35.9%) | 185 (83.0%) |
| 2 Vehicles | 543 (37.6%) | 0 (0.0%) |
| 3 or more Vehicles | 356 (24.6%) | 19 (8.5%) |
| Total | 1,445 (100.0%) | 223 (100.0%) |
Real Estate & Mortgages in Metamora
Real Estate and Mortgage Overview in Metamora
| Characteristic | Without Mortgage | With Mortgage |
| Housing Units | 620 | 825 |
| Median Property Value | $178,100 | $225,100 |
| Median Household Income | $73,684 | $317 |
| Monthly Housing Costs | $648 | $16 |
| Real Estate Taxes | $4,593 | $0 |
Property Value by Mortgage Status in Metamora
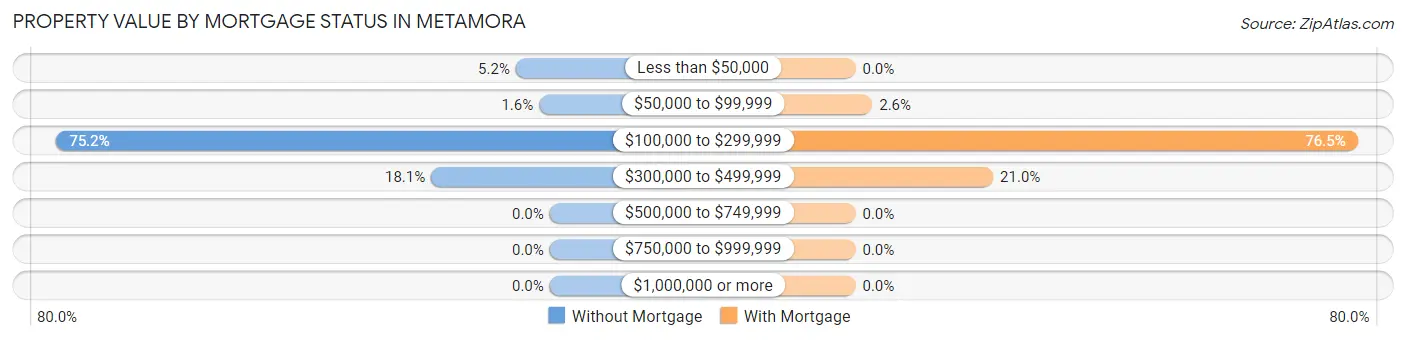
| Property Value | Without Mortgage | With Mortgage |
| Less than $50,000 | 32 (5.2%) | 0 (0.0%) |
| $50,000 to $99,999 | 10 (1.6%) | 21 (2.5%) |
| $100,000 to $299,999 | 466 (75.2%) | 631 (76.5%) |
| $300,000 to $499,999 | 112 (18.1%) | 173 (21.0%) |
| $500,000 to $749,999 | 0 (0.0%) | 0 (0.0%) |
| $750,000 to $999,999 | 0 (0.0%) | 0 (0.0%) |
| $1,000,000 or more | 0 (0.0%) | 0 (0.0%) |
| Total | 620 (100.0%) | 825 (100.0%) |
Household Income by Mortgage Status in Metamora
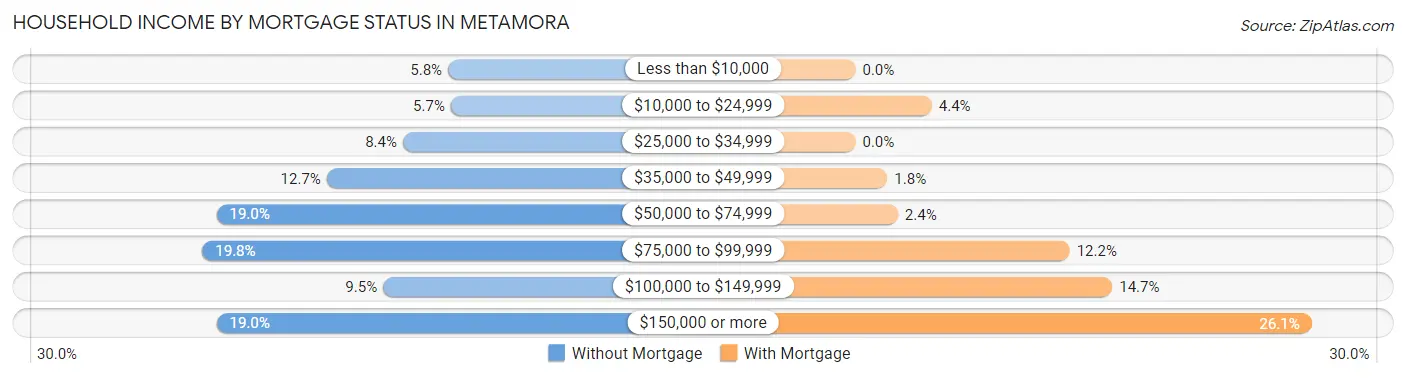
| Household Income | Without Mortgage | With Mortgage |
| Less than $10,000 | 36 (5.8%) | 0 (0.0%) |
| $10,000 to $24,999 | 35 (5.7%) | 36 (4.4%) |
| $25,000 to $34,999 | 52 (8.4%) | 0 (0.0%) |
| $35,000 to $49,999 | 79 (12.7%) | 15 (1.8%) |
| $50,000 to $74,999 | 118 (19.0%) | 20 (2.4%) |
| $75,000 to $99,999 | 123 (19.8%) | 101 (12.2%) |
| $100,000 to $149,999 | 59 (9.5%) | 121 (14.7%) |
| $150,000 or more | 118 (19.0%) | 215 (26.1%) |
| Total | 620 (100.0%) | 825 (100.0%) |
Property Value to Household Income Ratio in Metamora
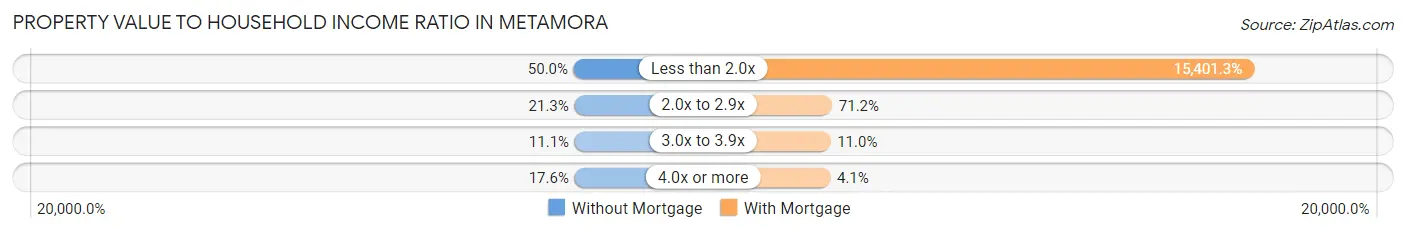
| Value-to-Income Ratio | Without Mortgage | With Mortgage |
| Less than 2.0x | 310 (50.0%) | 127,061 (15,401.3%) |
| 2.0x to 2.9x | 132 (21.3%) | 587 (71.2%) |
| 3.0x to 3.9x | 69 (11.1%) | 91 (11.0%) |
| 4.0x or more | 109 (17.6%) | 34 (4.1%) |
| Total | 620 (100.0%) | 825 (100.0%) |
Real Estate Taxes by Mortgage Status in Metamora
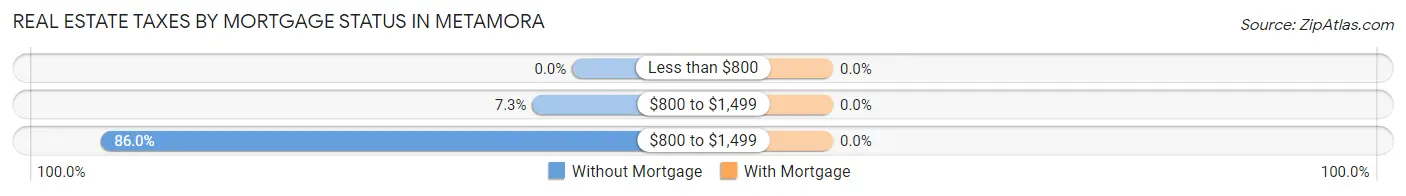
| Property Taxes | Without Mortgage | With Mortgage |
| Less than $800 | 0 (0.0%) | 0 (0.0%) |
| $800 to $1,499 | 45 (7.3%) | 0 (0.0%) |
| $800 to $1,499 | 533 (86.0%) | 0 (0.0%) |
| Total | 620 (100.0%) | 825 (100.0%) |
Health & Disability in Metamora
Health Insurance Coverage by Age in Metamora
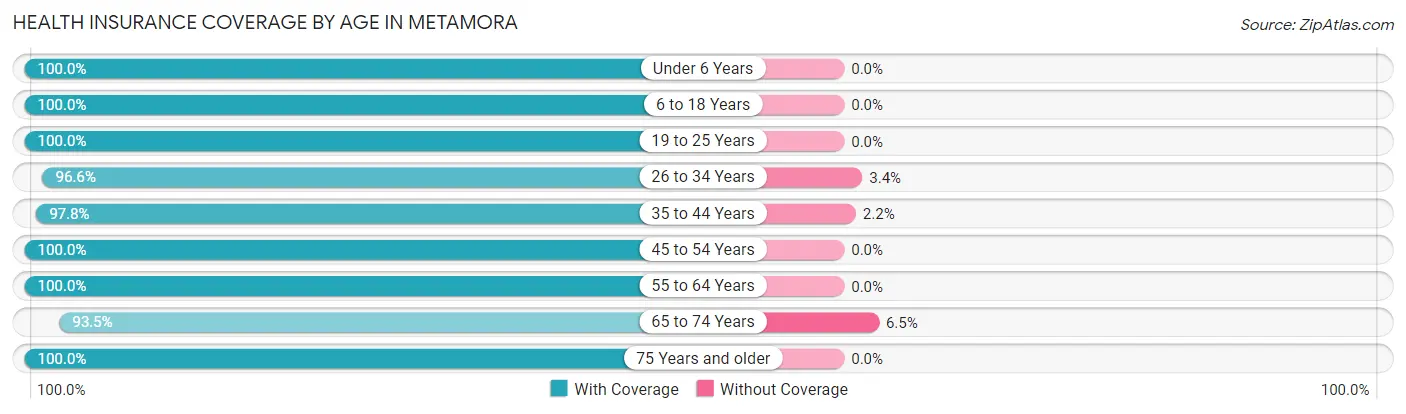
| Age Bracket | With Coverage | Without Coverage |
| Under 6 Years | 615 (100.0%) | 0 (0.0%) |
| 6 to 18 Years | 534 (100.0%) | 0 (0.0%) |
| 19 to 25 Years | 124 (100.0%) | 0 (0.0%) |
| 26 to 34 Years | 403 (96.6%) | 14 (3.4%) |
| 35 to 44 Years | 723 (97.8%) | 16 (2.2%) |
| 45 to 54 Years | 428 (100.0%) | 0 (0.0%) |
| 55 to 64 Years | 538 (100.0%) | 0 (0.0%) |
| 65 to 74 Years | 260 (93.5%) | 18 (6.5%) |
| 75 Years and older | 280 (100.0%) | 0 (0.0%) |
| Total | 3,905 (98.8%) | 48 (1.2%) |
Health Insurance Coverage by Citizenship Status in Metamora
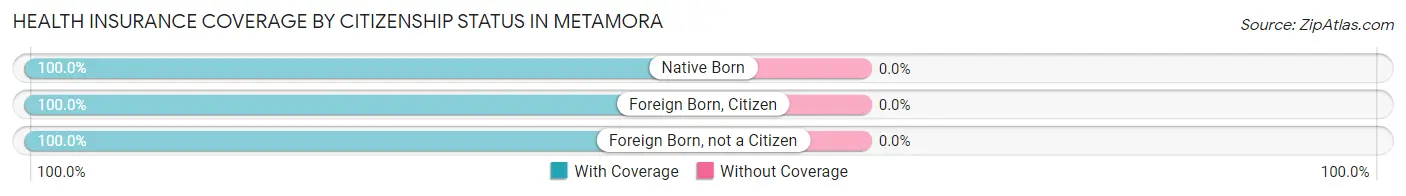
| Citizenship Status | With Coverage | Without Coverage |
| Native Born | 615 (100.0%) | 0 (0.0%) |
| Foreign Born, Citizen | 534 (100.0%) | 0 (0.0%) |
| Foreign Born, not a Citizen | 124 (100.0%) | 0 (0.0%) |
Health Insurance Coverage by Household Income in Metamora
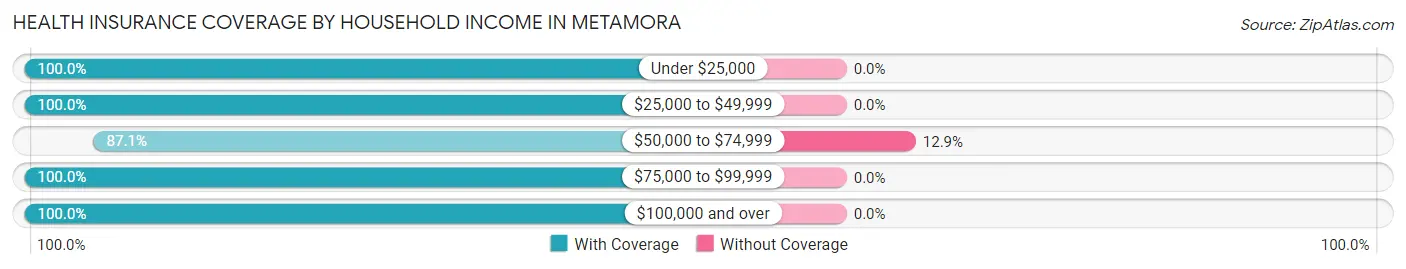
| Household Income | With Coverage | Without Coverage |
| Under $25,000 | 264 (100.0%) | 0 (0.0%) |
| $25,000 to $49,999 | 369 (100.0%) | 0 (0.0%) |
| $50,000 to $74,999 | 323 (87.1%) | 48 (12.9%) |
| $75,000 to $99,999 | 679 (100.0%) | 0 (0.0%) |
| $100,000 and over | 2,266 (100.0%) | 0 (0.0%) |
Public vs Private Health Insurance Coverage by Age in Metamora
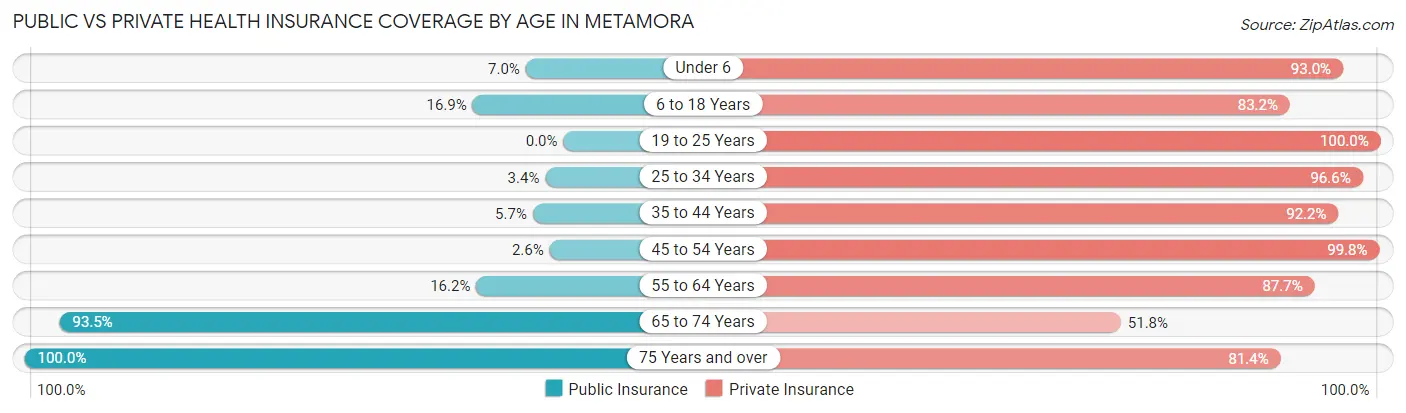
| Age Bracket | Public Insurance | Private Insurance |
| Under 6 | 43 (7.0%) | 572 (93.0%) |
| 6 to 18 Years | 90 (16.9%) | 444 (83.2%) |
| 19 to 25 Years | 0 (0.0%) | 124 (100.0%) |
| 25 to 34 Years | 14 (3.4%) | 403 (96.6%) |
| 35 to 44 Years | 42 (5.7%) | 681 (92.1%) |
| 45 to 54 Years | 11 (2.6%) | 427 (99.8%) |
| 55 to 64 Years | 87 (16.2%) | 472 (87.7%) |
| 65 to 74 Years | 260 (93.5%) | 144 (51.8%) |
| 75 Years and over | 280 (100.0%) | 228 (81.4%) |
| Total | 827 (20.9%) | 3,495 (88.4%) |
Disability Status by Sex by Age in Metamora
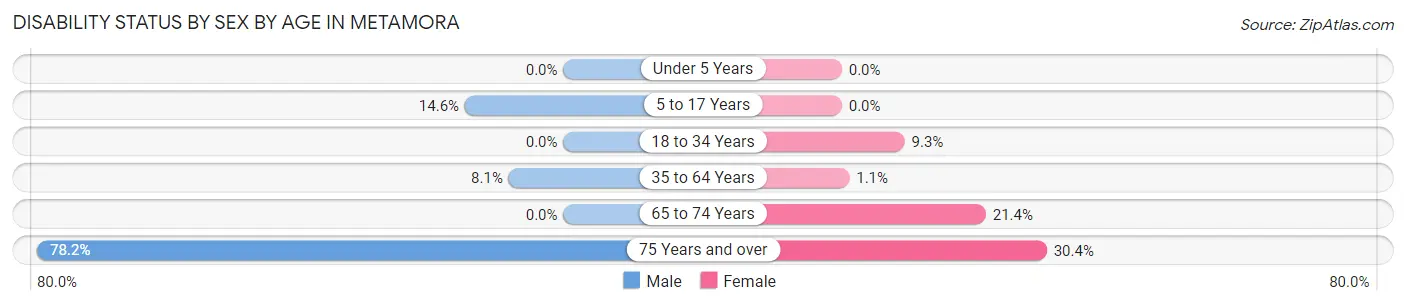
| Age Bracket | Male | Female |
| Under 5 Years | 0 (0.0%) | 0 (0.0%) |
| 5 to 17 Years | 44 (14.6%) | 0 (0.0%) |
| 18 to 34 Years | 0 (0.0%) | 42 (9.3%) |
| 35 to 64 Years | 65 (8.1%) | 10 (1.1%) |
| 65 to 74 Years | 0 (0.0%) | 34 (21.4%) |
| 75 Years and over | 93 (78.1%) | 49 (30.4%) |
Disability Class by Sex by Age in Metamora
Disability Class: Hearing Difficulty
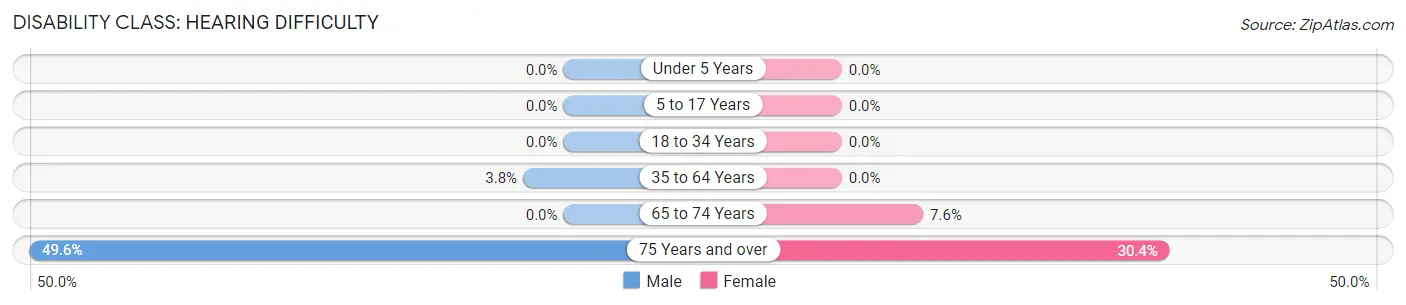
| Age Bracket | Male | Female |
| Under 5 Years | 0 (0.0%) | 0 (0.0%) |
| 5 to 17 Years | 0 (0.0%) | 0 (0.0%) |
| 18 to 34 Years | 0 (0.0%) | 0 (0.0%) |
| 35 to 64 Years | 30 (3.7%) | 0 (0.0%) |
| 65 to 74 Years | 0 (0.0%) | 12 (7.5%) |
| 75 Years and over | 59 (49.6%) | 49 (30.4%) |
Disability Class: Vision Difficulty
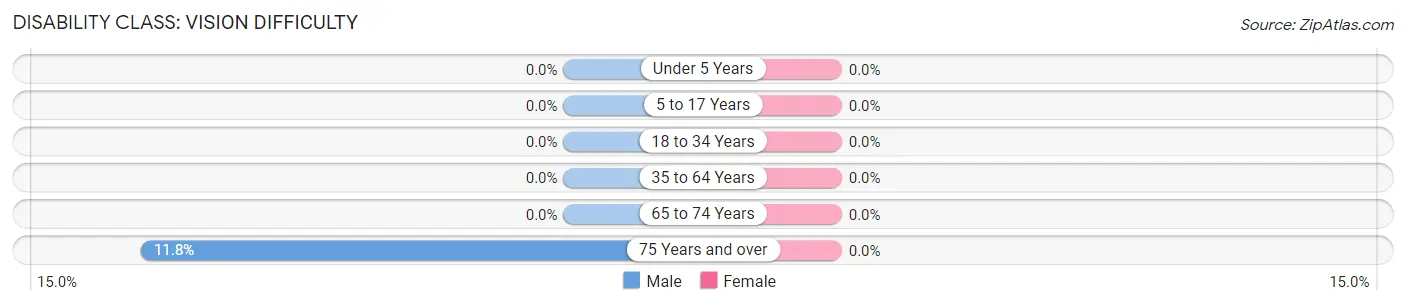
| Age Bracket | Male | Female |
| Under 5 Years | 0 (0.0%) | 0 (0.0%) |
| 5 to 17 Years | 0 (0.0%) | 0 (0.0%) |
| 18 to 34 Years | 0 (0.0%) | 0 (0.0%) |
| 35 to 64 Years | 0 (0.0%) | 0 (0.0%) |
| 65 to 74 Years | 0 (0.0%) | 0 (0.0%) |
| 75 Years and over | 14 (11.8%) | 0 (0.0%) |
Disability Class: Cognitive Difficulty
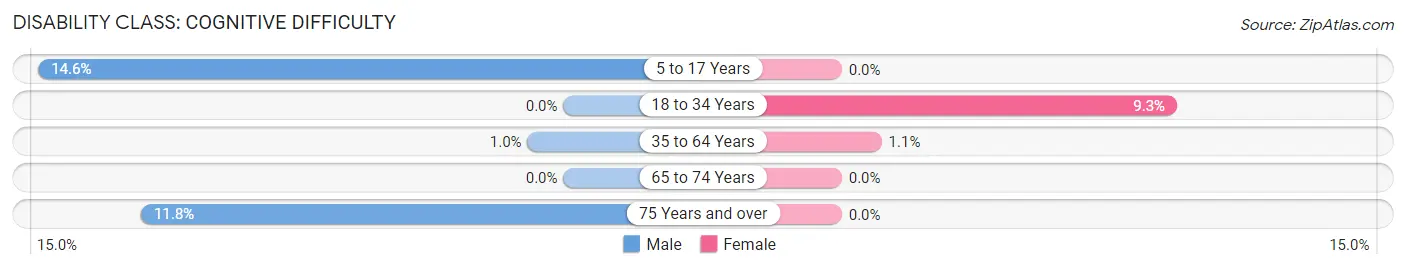
| Age Bracket | Male | Female |
| 5 to 17 Years | 44 (14.6%) | 0 (0.0%) |
| 18 to 34 Years | 0 (0.0%) | 42 (9.3%) |
| 35 to 64 Years | 8 (1.0%) | 10 (1.1%) |
| 65 to 74 Years | 0 (0.0%) | 0 (0.0%) |
| 75 Years and over | 14 (11.8%) | 0 (0.0%) |
Disability Class: Ambulatory Difficulty
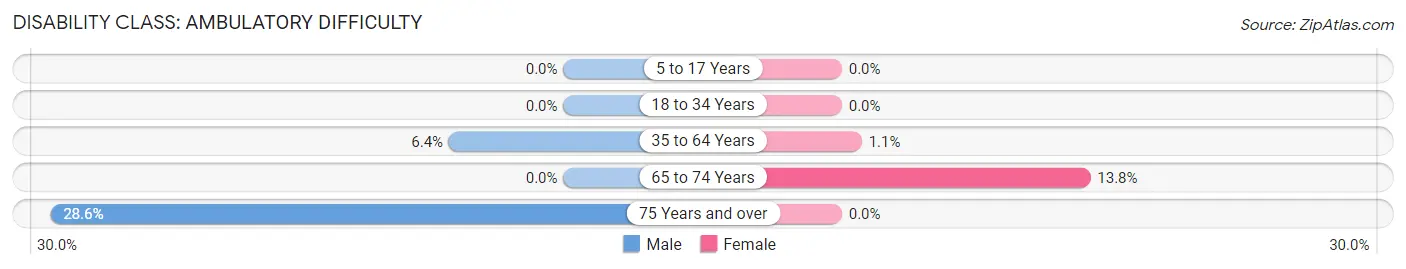
| Age Bracket | Male | Female |
| 5 to 17 Years | 0 (0.0%) | 0 (0.0%) |
| 18 to 34 Years | 0 (0.0%) | 0 (0.0%) |
| 35 to 64 Years | 51 (6.4%) | 10 (1.1%) |
| 65 to 74 Years | 0 (0.0%) | 22 (13.8%) |
| 75 Years and over | 34 (28.6%) | 0 (0.0%) |
Disability Class: Self-Care Difficulty
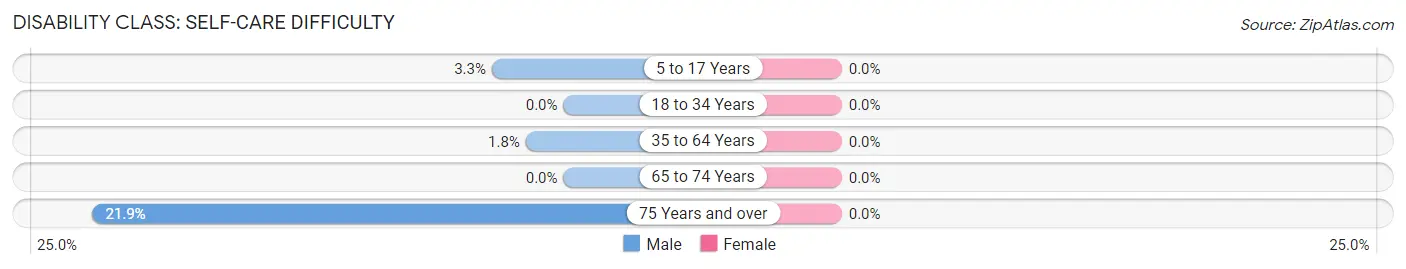
| Age Bracket | Male | Female |
| 5 to 17 Years | 10 (3.3%) | 0 (0.0%) |
| 18 to 34 Years | 0 (0.0%) | 0 (0.0%) |
| 35 to 64 Years | 14 (1.8%) | 0 (0.0%) |
| 65 to 74 Years | 0 (0.0%) | 0 (0.0%) |
| 75 Years and over | 26 (21.8%) | 0 (0.0%) |
Technology Access in Metamora
Computing Device Access in Metamora
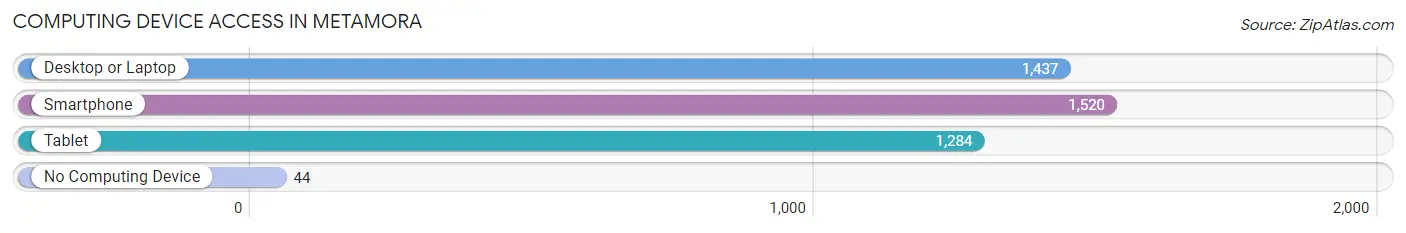
| Device Type | # Households | % Households |
| Desktop or Laptop | 1,437 | 86.2% |
| Smartphone | 1,520 | 91.1% |
| Tablet | 1,284 | 77.0% |
| No Computing Device | 44 | 2.6% |
| Total | 1,668 | 100.0% |
Internet Access in Metamora
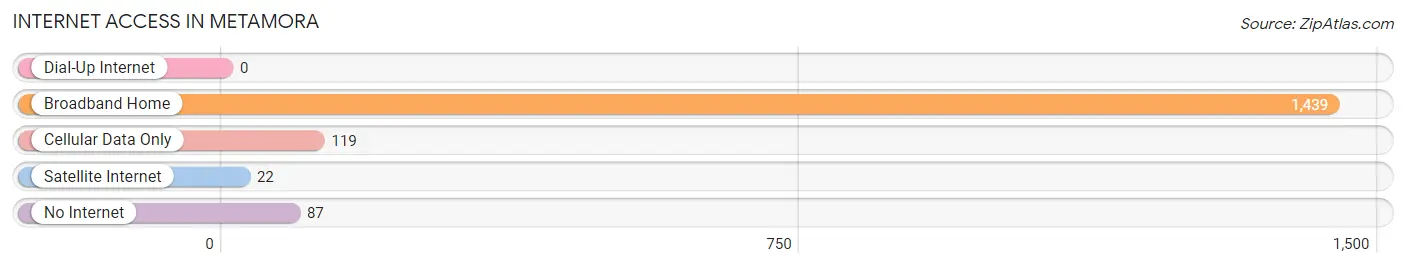
| Internet Type | # Households | % Households |
| Dial-Up Internet | 0 | 0.0% |
| Broadband Home | 1,439 | 86.3% |
| Cellular Data Only | 119 | 7.1% |
| Satellite Internet | 22 | 1.3% |
| No Internet | 87 | 5.2% |
| Total | 1,668 | 100.0% |
Metamora Summary
Metamora, Illinois is a small village located in Woodford County, Illinois. It is situated on the banks of the Illinois River, approximately 30 miles northeast of Peoria. The village has a population of approximately 2,500 people and is known for its historic downtown area, which is listed on the National Register of Historic Places.
History
Metamora was founded in 1836 by a group of settlers from New York. The village was named after the nearby Metamora Township, which was named after the Native American tribe that once inhabited the area. The village was incorporated in 1854 and quickly became a thriving agricultural and industrial center. The village was home to several mills, including a grist mill, a saw mill, and a woolen mill. The village also had a large number of stores and businesses, including a hotel, a bank, and a post office.
Geography
Metamora is located in the heart of the Illinois River Valley, which is known for its rolling hills and lush farmland. The village is situated on the banks of the Illinois River, which provides a scenic backdrop for the village. The village is surrounded by several small towns, including Germantown, Eureka, and Washington. The village is also located near several state parks, including Starved Rock State Park and Matthiessen State Park.
Economy
Metamora’s economy is largely based on agriculture and tourism. The village is home to several farms, which produce a variety of crops, including corn, soybeans, and wheat. The village also has several wineries, which produce a variety of wines. Tourism is also an important part of the local economy, as the village is home to several historic sites, including the Metamora Courthouse State Historic Site and the Metamora Canal State Historic Site.
Demographics
As of the 2010 census, the population of Metamora was 2,521. The racial makeup of the village was 97.2% White, 0.7% African American, 0.2% Native American, 0.3% Asian, 0.1% Pacific Islander, 0.7% from other races, and 0.9% from two or more races. Hispanic or Latino of any race were 1.7% of the population. The median household income in Metamora was $50,972, and the median family income was $60,972.
Metamora is a small village with a rich history and a vibrant economy. The village is home to several historic sites, farms, wineries, and businesses. The village is also home to a diverse population, with a variety of racial and ethnic backgrounds. Metamora is a great place to live, work, and visit.
Common Questions
What is Per Capita Income in Metamora?
Per Capita income in Metamora is $45,298.
What is the Median Family Income in Metamora?
Median Family Income in Metamora is $124,250.
What is the Median Household income in Metamora?
Median Household Income in Metamora is $83,793.
What is Income or Wage Gap in Metamora?
Income or Wage Gap in Metamora is 40.3%.
Women in Metamora earn 59.7 cents for every dollar earned by a man.
What is Inequality or Gini Index in Metamora?
Inequality or Gini Index in Metamora is 0.40.
What is the Total Population of Metamora?
Total Population of Metamora is 4,065.
What is the Total Male Population of Metamora?
Total Male Population of Metamora is 1,789.
What is the Total Female Population of Metamora?
Total Female Population of Metamora is 2,276.
What is the Ratio of Males per 100 Females in Metamora?
There are 78.60 Males per 100 Females in Metamora.
What is the Ratio of Females per 100 Males in Metamora?
There are 127.22 Females per 100 Males in Metamora.
What is the Median Population Age in Metamora?
Median Population Age in Metamora is 36.7 Years.
What is the Average Family Size in Metamora
Average Family Size in Metamora is 3.0 People.
What is the Average Household Size in Metamora
Average Household Size in Metamora is 2.4 People.
How Large is the Labor Force in Metamora?
There are 2,136 People in the Labor Forcein in Metamora.
What is the Percentage of People in the Labor Force in Metamora?
70.3% of People are in the Labor Force in Metamora.