Stickney, IL Map & Demographics
Stickney Map
Stickney Overview
$30,078
PER CAPITA INCOME
$79,657
AVG FAMILY INCOME
$67,067
AVG HOUSEHOLD INCOME
35.4%
WAGE / INCOME GAP [ % ]
64.6¢/ $1
WAGE / INCOME GAP [ $ ]
0.38
INEQUALITY / GINI INDEX
7,031
TOTAL POPULATION
3,818
MALE POPULATION
3,213
FEMALE POPULATION
118.83
MALES / 100 FEMALES
84.15
FEMALES / 100 MALES
38.7
MEDIAN AGE
3.6
AVG FAMILY SIZE
2.9
AVG HOUSEHOLD SIZE
3,241
LABOR FORCE [ PEOPLE ]
59.0%
PERCENT IN LABOR FORCE
4.6%
UNEMPLOYMENT RATE
Stickney Area Codes
Income in Stickney
Income Overview in Stickney
Per Capita Income in Stickney is $30,078, while median incomes of families and households are $79,657 and $67,067 respectively.
| Characteristic | Number | Measure |
| Per Capita Income | 7,031 | $30,078 |
| Median Family Income | 1,774 | $79,657 |
| Mean Family Income | 1,774 | $93,304 |
| Median Household Income | 2,392 | $67,067 |
| Mean Household Income | 2,392 | $80,313 |
| Income Deficit | 1,774 | $0 |
| Wage / Income Gap (%) | 7,031 | 35.39% |
| Wage / Income Gap ($) | 7,031 | 64.61¢ per $1 |
| Gini / Inequality Index | 7,031 | 0.38 |
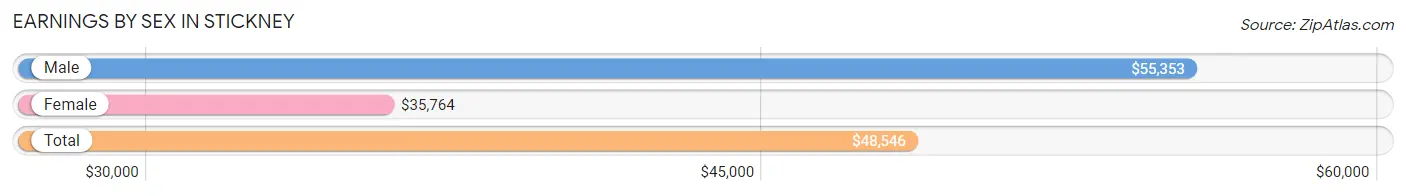
Earnings by Sex in Stickney
Average Earnings in Stickney are $48,546, $55,353 for men and $35,764 for women, a difference of 35.4%.
| Sex | Number | Average Earnings |
| Male | 2,159 (66.1%) | $55,353 |
| Female | 1,105 (33.9%) | $35,764 |
| Total | 3,264 (100.0%) | $48,546 |
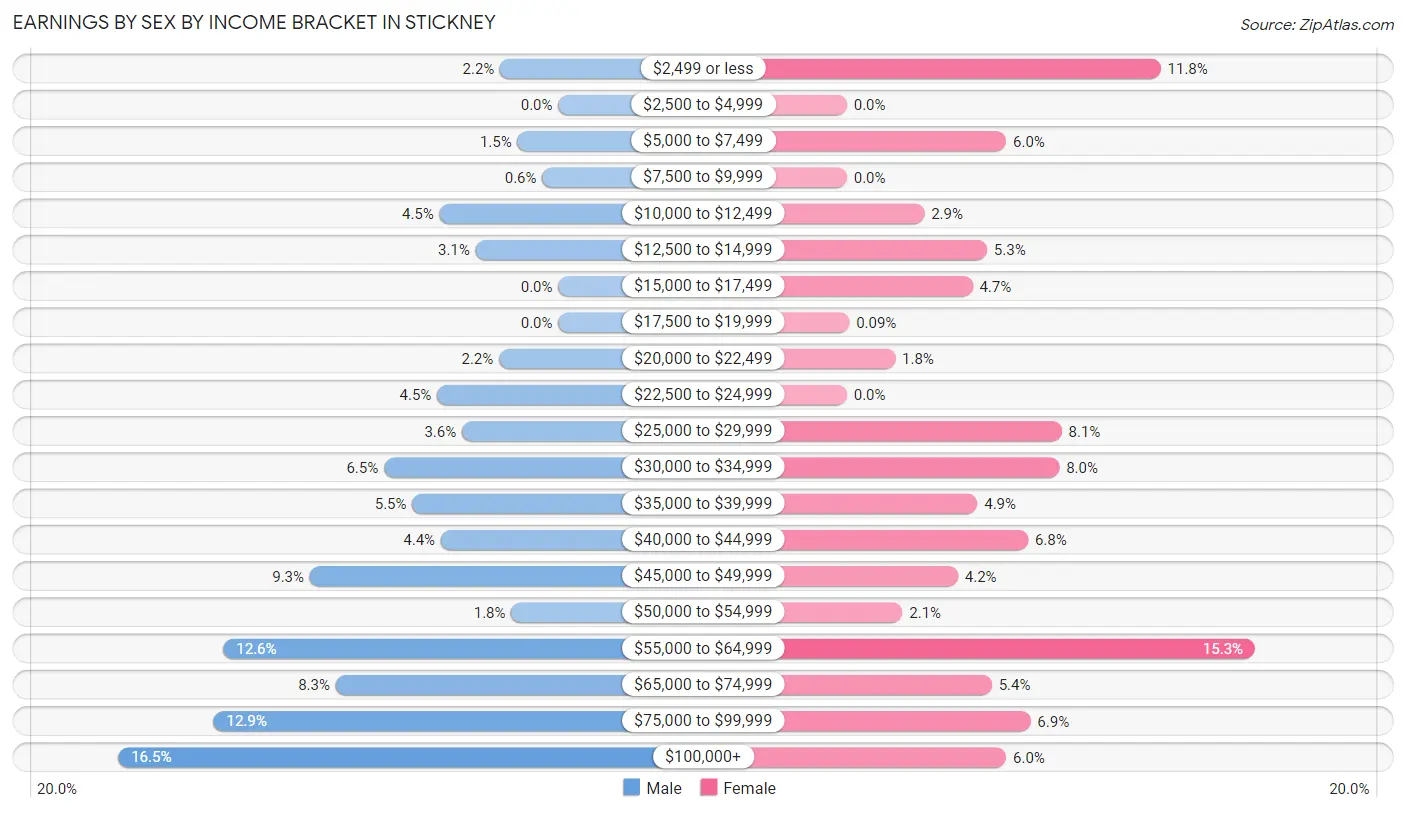
Earnings by Sex by Income Bracket in Stickney
The most common earnings brackets in Stickney are $100,000+ for men (356 | 16.5%) and $55,000 to $64,999 for women (169 | 15.3%).
| Income | Male | Female |
| $2,499 or less | 47 (2.2%) | 130 (11.8%) |
| $2,500 to $4,999 | 0 (0.0%) | 0 (0.0%) |
| $5,000 to $7,499 | 33 (1.5%) | 66 (6.0%) |
| $7,500 to $9,999 | 13 (0.6%) | 0 (0.0%) |
| $10,000 to $12,499 | 96 (4.4%) | 32 (2.9%) |
| $12,500 to $14,999 | 67 (3.1%) | 58 (5.2%) |
| $15,000 to $17,499 | 0 (0.0%) | 52 (4.7%) |
| $17,500 to $19,999 | 0 (0.0%) | 1 (0.1%) |
| $20,000 to $22,499 | 48 (2.2%) | 20 (1.8%) |
| $22,500 to $24,999 | 98 (4.5%) | 0 (0.0%) |
| $25,000 to $29,999 | 78 (3.6%) | 89 (8.1%) |
| $30,000 to $34,999 | 141 (6.5%) | 88 (8.0%) |
| $35,000 to $39,999 | 118 (5.5%) | 54 (4.9%) |
| $40,000 to $44,999 | 95 (4.4%) | 75 (6.8%) |
| $45,000 to $49,999 | 201 (9.3%) | 46 (4.2%) |
| $50,000 to $54,999 | 38 (1.8%) | 23 (2.1%) |
| $55,000 to $64,999 | 271 (12.6%) | 169 (15.3%) |
| $65,000 to $74,999 | 180 (8.3%) | 60 (5.4%) |
| $75,000 to $99,999 | 279 (12.9%) | 76 (6.9%) |
| $100,000+ | 356 (16.5%) | 66 (6.0%) |
| Total | 2,159 (100.0%) | 1,105 (100.0%) |
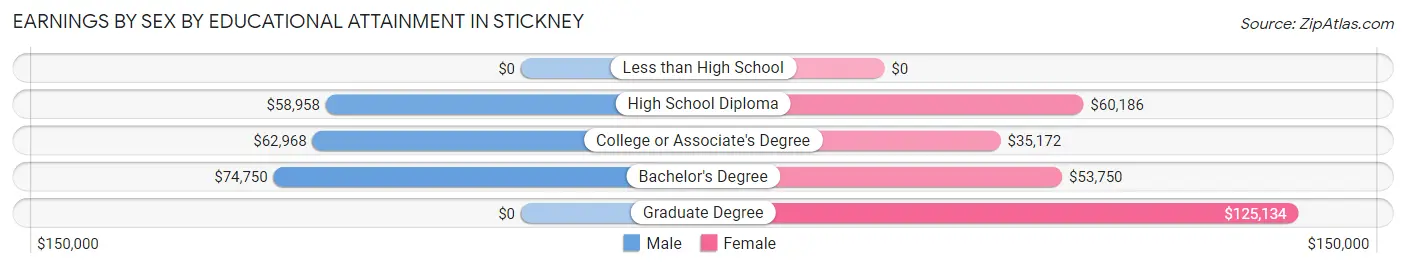
Earnings by Sex by Educational Attainment in Stickney
Average earnings in Stickney are $61,711 for men and $40,467 for women, a difference of 34.4%. Men with an educational attainment of bachelor's degree enjoy the highest average annual earnings of $74,750, while those with high school diploma education earn the least with $58,958. Women with an educational attainment of graduate degree earn the most with the average annual earnings of $125,134, while those with college or associate's degree education have the smallest earnings of $35,172.
| Educational Attainment | Male Income | Female Income |
| Less than High School | - | - |
| High School Diploma | $58,958 | $60,186 |
| College or Associate's Degree | $62,968 | $35,172 |
| Bachelor's Degree | $74,750 | $53,750 |
| Graduate Degree | - | - |
| Total | $61,711 | $40,467 |
Family Income in Stickney
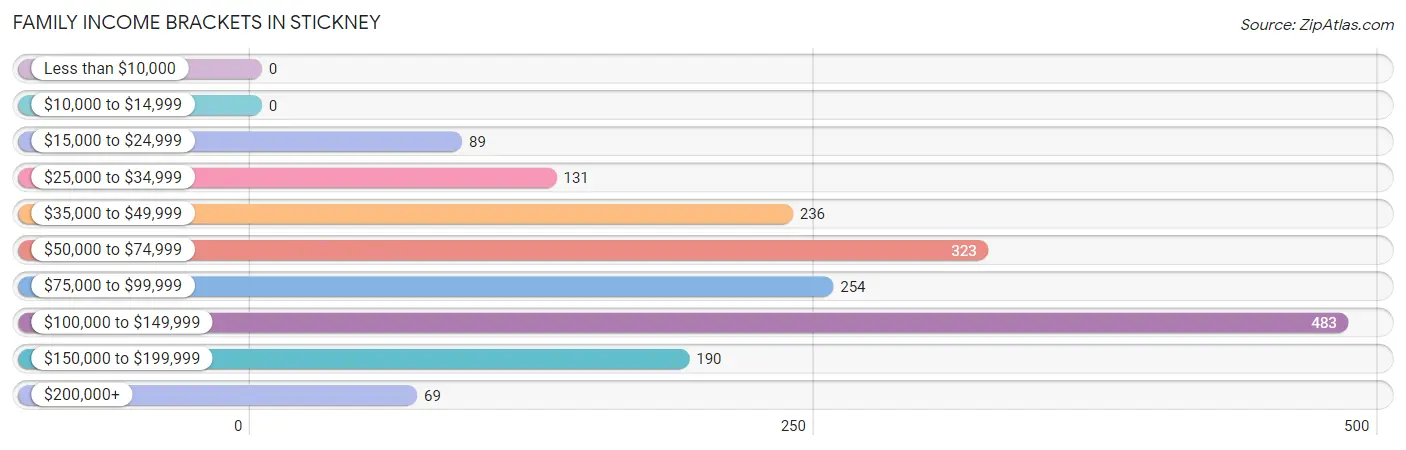
Family Income Brackets in Stickney
According to the Stickney family income data, there are 483 families falling into the $100,000 to $149,999 income range, which is the most common income bracket and makes up 27.2% of all families.
| Income Bracket | # Families | % Families |
| Less than $10,000 | 0 | 0.0% |
| $10,000 to $14,999 | 0 | 0.0% |
| $15,000 to $24,999 | 89 | 5.0% |
| $25,000 to $34,999 | 131 | 7.4% |
| $35,000 to $49,999 | 236 | 13.3% |
| $50,000 to $74,999 | 323 | 18.2% |
| $75,000 to $99,999 | 254 | 14.3% |
| $100,000 to $149,999 | 483 | 27.2% |
| $150,000 to $199,999 | 190 | 10.7% |
| $200,000+ | 69 | 3.9% |
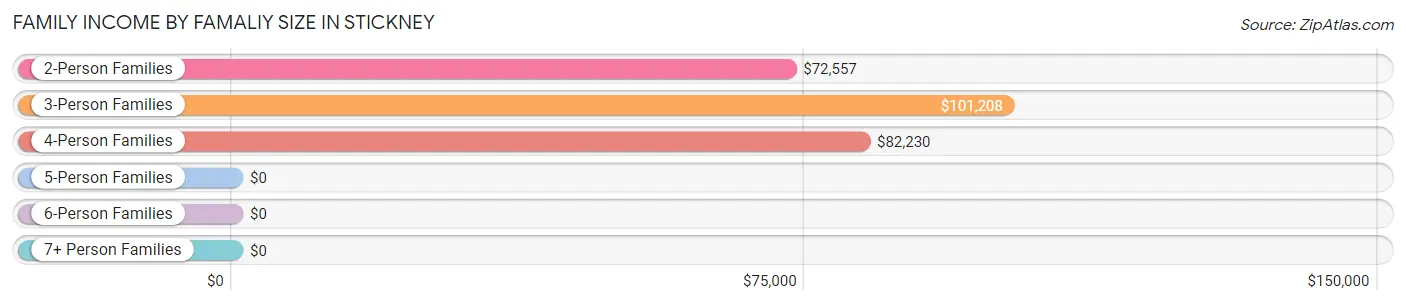
Family Income by Famaliy Size in Stickney
3-person families (343 | 19.3%) account for the highest median family income in Stickney with $101,208 per family, while 2-person families (705 | 39.7%) have the highest median income of $36,278 per family member.
| Income Bracket | # Families | Median Income |
| 2-Person Families | 705 (39.7%) | $72,557 |
| 3-Person Families | 343 (19.3%) | $101,208 |
| 4-Person Families | 299 (16.9%) | $82,230 |
| 5-Person Families | 229 (12.9%) | $0 |
| 6-Person Families | 169 (9.5%) | $0 |
| 7+ Person Families | 29 (1.6%) | $0 |
| Total | 1,774 (100.0%) | $79,657 |
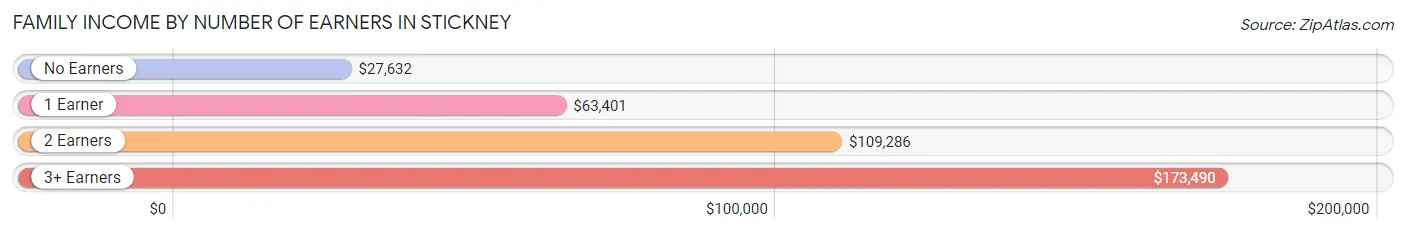
Family Income by Number of Earners in Stickney
The median family income in Stickney is $79,657, with families comprising 3+ earners (199) having the highest median family income of $173,490, while families with no earners (128) have the lowest median family income of $27,632, accounting for 11.2% and 7.2% of families, respectively.
| Number of Earners | # Families | Median Income |
| No Earners | 128 (7.2%) | $27,632 |
| 1 Earner | 837 (47.2%) | $63,401 |
| 2 Earners | 610 (34.4%) | $109,286 |
| 3+ Earners | 199 (11.2%) | $173,490 |
| Total | 1,774 (100.0%) | $79,657 |
Household Income in Stickney
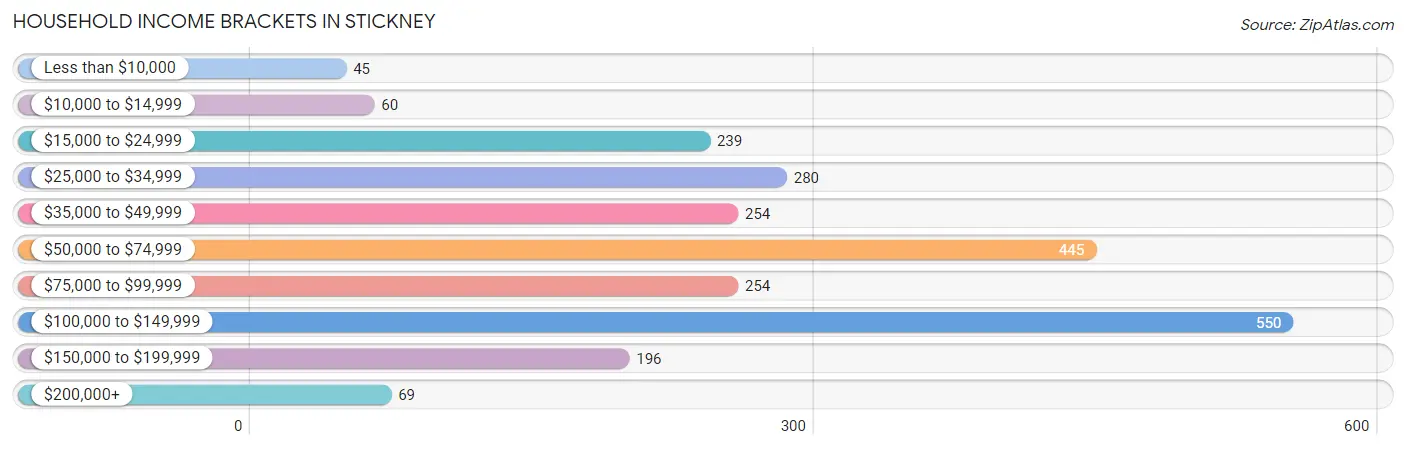
Household Income Brackets in Stickney
With 550 households falling in the category, the $100,000 to $149,999 income range is the most frequent in Stickney, accounting for 23.0% of all households. In contrast, only 45 households (1.9%) fall into the less than $10,000 income bracket, making it the least populous group.
| Income Bracket | # Households | % Households |
| Less than $10,000 | 45 | 1.9% |
| $10,000 to $14,999 | 60 | 2.5% |
| $15,000 to $24,999 | 239 | 10.0% |
| $25,000 to $34,999 | 280 | 11.7% |
| $35,000 to $49,999 | 254 | 10.6% |
| $50,000 to $74,999 | 445 | 18.6% |
| $75,000 to $99,999 | 254 | 10.6% |
| $100,000 to $149,999 | 550 | 23.0% |
| $150,000 to $199,999 | 196 | 8.2% |
| $200,000+ | 69 | 2.9% |
Household Income by Householder Age in Stickney
The median household income in Stickney is $67,067, with the highest median household income of $91,012 found in the 25 to 44 years age bracket for the primary householder. A total of 869 households (36.3%) fall into this category. Meanwhile, the 15 to 24 years age bracket for the primary householder has the lowest median household income of $0, with 78 households (3.3%) in this group.
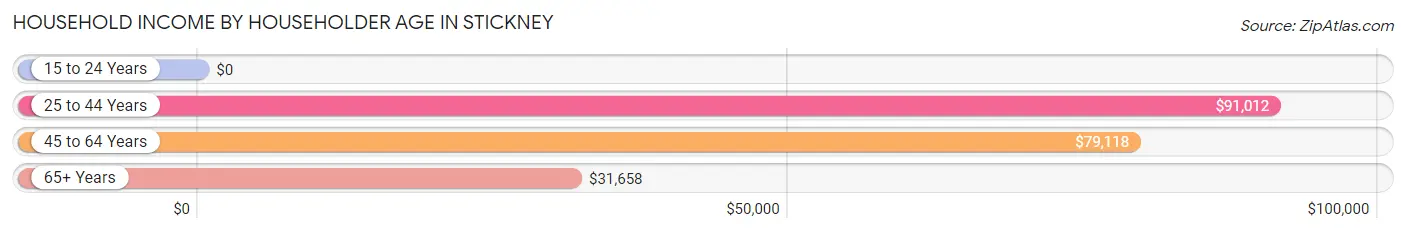
| Income Bracket | # Households | Median Income |
| 15 to 24 Years | 78 (3.3%) | $0 |
| 25 to 44 Years | 869 (36.3%) | $91,012 |
| 45 to 64 Years | 738 (30.8%) | $79,118 |
| 65+ Years | 707 (29.6%) | $31,658 |
| Total | 2,392 (100.0%) | $67,067 |
Poverty in Stickney
Income Below Poverty by Sex and Age in Stickney
With 7.5% poverty level for males and 18.2% for females among the residents of Stickney, 12 to 14 year old males and 5 year old females are the most vulnerable to poverty, with 55 males (27.4%) and 42 females (65.6%) in their respective age groups living below the poverty level.
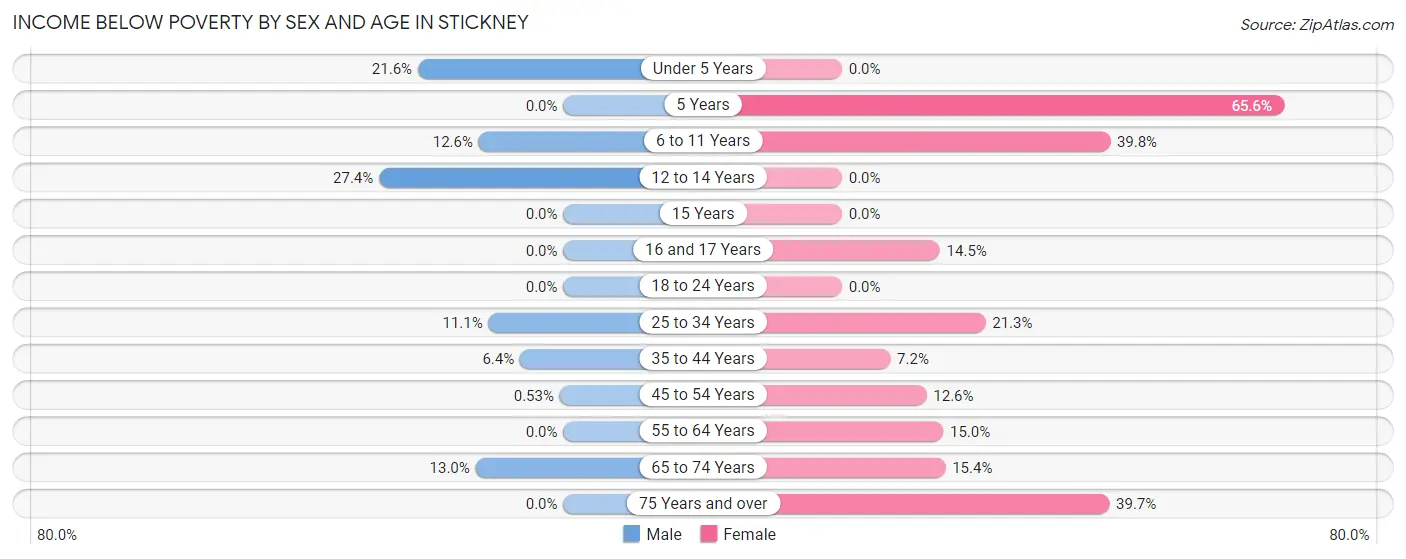
| Age Bracket | Male | Female |
| Under 5 Years | 35 (21.6%) | 0 (0.0%) |
| 5 Years | 0 (0.0%) | 42 (65.6%) |
| 6 to 11 Years | 54 (12.6%) | 135 (39.8%) |
| 12 to 14 Years | 55 (27.4%) | 0 (0.0%) |
| 15 Years | 0 (0.0%) | 0 (0.0%) |
| 16 and 17 Years | 0 (0.0%) | 34 (14.5%) |
| 18 to 24 Years | 0 (0.0%) | 0 (0.0%) |
| 25 to 34 Years | 37 (11.1%) | 65 (21.3%) |
| 35 to 44 Years | 55 (6.4%) | 29 (7.2%) |
| 45 to 54 Years | 2 (0.5%) | 52 (12.6%) |
| 55 to 64 Years | 0 (0.0%) | 54 (15.0%) |
| 65 to 74 Years | 46 (13.0%) | 45 (15.4%) |
| 75 Years and over | 0 (0.0%) | 127 (39.7%) |
| Total | 284 (7.5%) | 583 (18.2%) |
Income Above Poverty by Sex and Age in Stickney
According to the poverty statistics in Stickney, males aged 5 years and females aged under 5 years are the age groups that are most secure financially, with 100.0% of males and 100.0% of females in these age groups living above the poverty line.
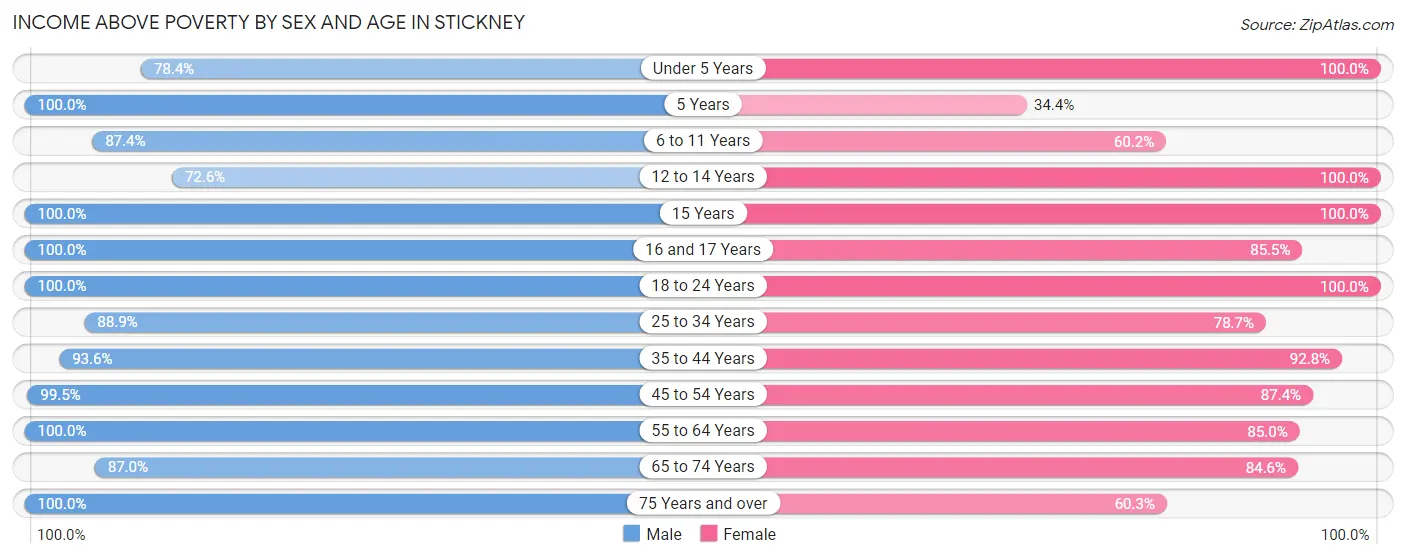
| Age Bracket | Male | Female |
| Under 5 Years | 127 (78.4%) | 150 (100.0%) |
| 5 Years | 34 (100.0%) | 22 (34.4%) |
| 6 to 11 Years | 376 (87.4%) | 204 (60.2%) |
| 12 to 14 Years | 146 (72.6%) | 20 (100.0%) |
| 15 Years | 92 (100.0%) | 46 (100.0%) |
| 16 and 17 Years | 46 (100.0%) | 200 (85.5%) |
| 18 to 24 Years | 333 (100.0%) | 246 (100.0%) |
| 25 to 34 Years | 296 (88.9%) | 240 (78.7%) |
| 35 to 44 Years | 801 (93.6%) | 375 (92.8%) |
| 45 to 54 Years | 372 (99.5%) | 362 (87.4%) |
| 55 to 64 Years | 433 (100.0%) | 305 (85.0%) |
| 65 to 74 Years | 307 (87.0%) | 248 (84.6%) |
| 75 Years and over | 146 (100.0%) | 193 (60.3%) |
| Total | 3,509 (92.5%) | 2,611 (81.8%) |
Income Below Poverty Among Married-Couple Families in Stickney
The poverty statistics for married-couple families in Stickney show that 9.3% or 113 of the total 1,209 families live below the poverty line. Families with 3 or 4 children have the highest poverty rate of 39.6%, comprising of 76 families. On the other hand, families with no children have the lowest poverty rate of 0.0%, which includes 0 families.
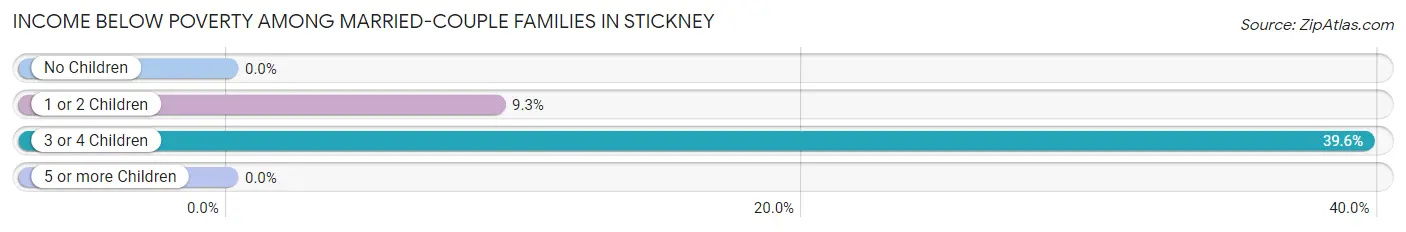
| Children | Above Poverty | Below Poverty |
| No Children | 619 (100.0%) | 0 (0.0%) |
| 1 or 2 Children | 361 (90.7%) | 37 (9.3%) |
| 3 or 4 Children | 116 (60.4%) | 76 (39.6%) |
| 5 or more Children | 0 (0.0%) | 0 (0.0%) |
| Total | 1,096 (90.6%) | 113 (9.3%) |
Income Below Poverty Among Single-Parent Households in Stickney
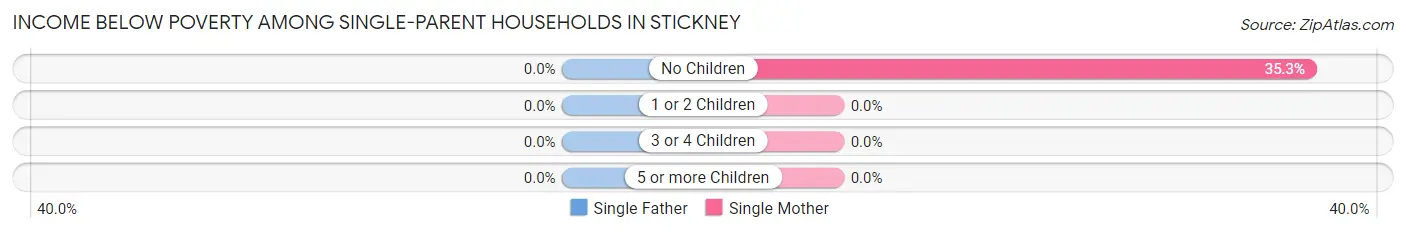
| Children | Single Father | Single Mother |
| No Children | 0 (0.0%) | 49 (35.2%) |
| 1 or 2 Children | 0 (0.0%) | 0 (0.0%) |
| 3 or 4 Children | 0 (0.0%) | 0 (0.0%) |
| 5 or more Children | 0 (0.0%) | 0 (0.0%) |
| Total | 0 (0.0%) | 49 (23.1%) |
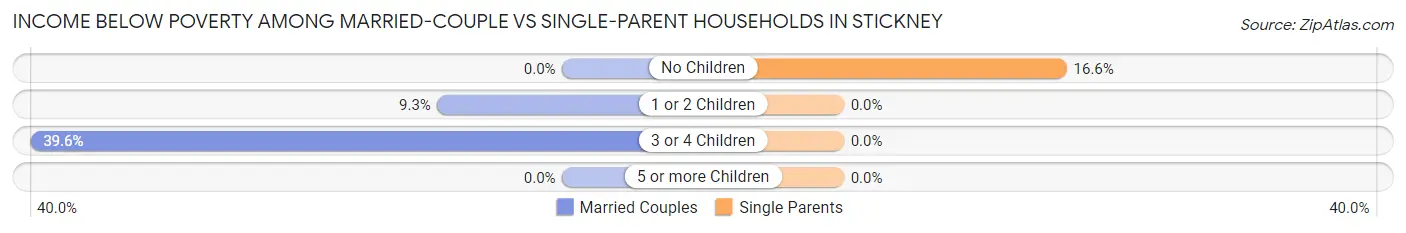
Income Below Poverty Among Married-Couple vs Single-Parent Households in Stickney
The poverty data for Stickney shows that 113 of the married-couple family households (9.3%) and 49 of the single-parent households (8.7%) are living below the poverty level. Within the married-couple family households, those with 3 or 4 children have the highest poverty rate, with 76 households (39.6%) falling below the poverty line. Among the single-parent households, those with no children have the highest poverty rate, with 49 household (16.6%) living below poverty.
| Children | Married-Couple Families | Single-Parent Households |
| No Children | 0 (0.0%) | 49 (16.6%) |
| 1 or 2 Children | 37 (9.3%) | 0 (0.0%) |
| 3 or 4 Children | 76 (39.6%) | 0 (0.0%) |
| 5 or more Children | 0 (0.0%) | 0 (0.0%) |
| Total | 113 (9.3%) | 49 (8.7%) |
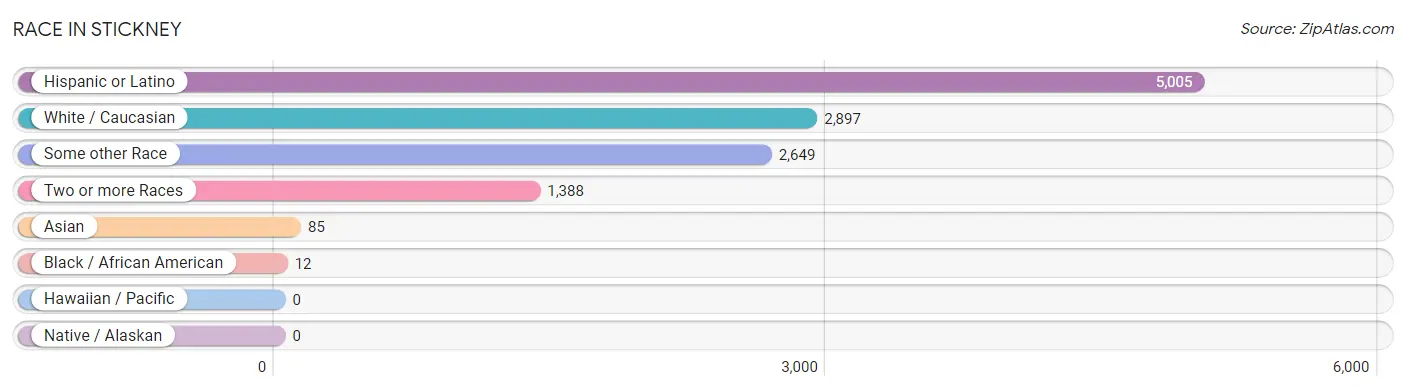
Race in Stickney
The most populous races in Stickney are Hispanic or Latino (5,005 | 71.2%), White / Caucasian (2,897 | 41.2%), and Some other Race (2,649 | 37.7%).
| Race | # Population | % Population |
| Asian | 85 | 1.2% |
| Black / African American | 12 | 0.2% |
| Hawaiian / Pacific | 0 | 0.0% |
| Hispanic or Latino | 5,005 | 71.2% |
| Native / Alaskan | 0 | 0.0% |
| White / Caucasian | 2,897 | 41.2% |
| Two or more Races | 1,388 | 19.7% |
| Some other Race | 2,649 | 37.7% |
| Total | 7,031 | 100.0% |
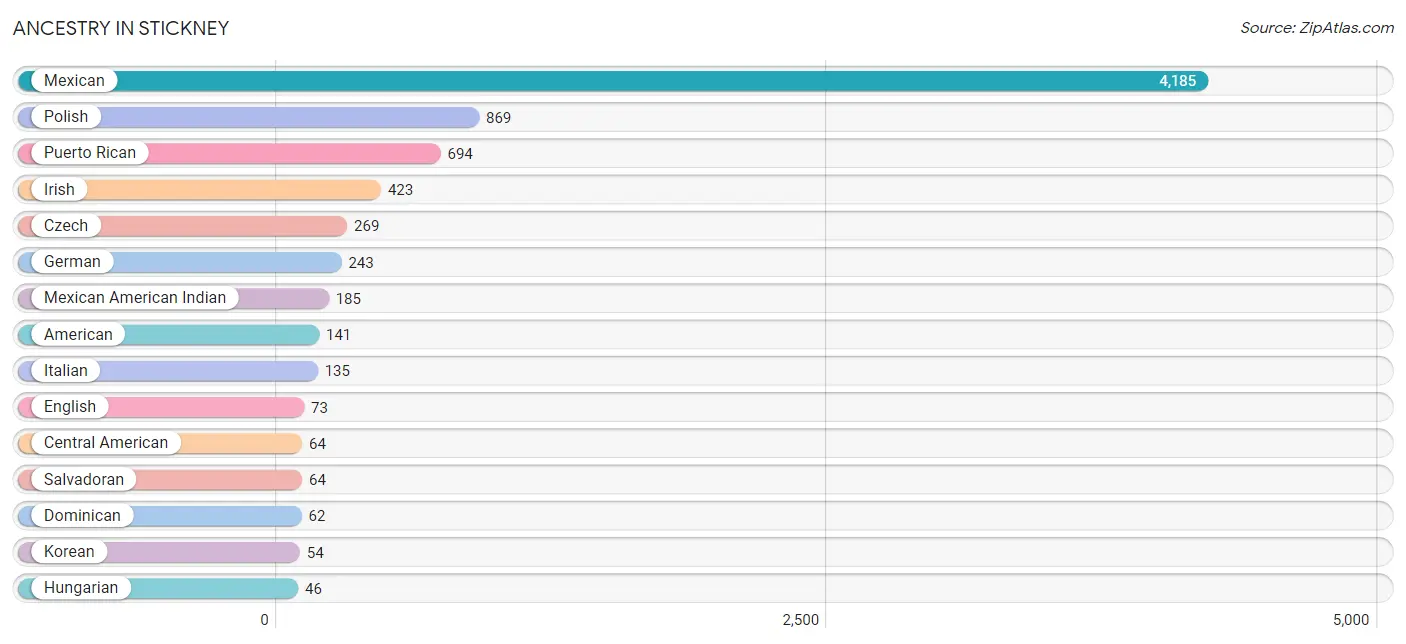
Ancestry in Stickney
The most populous ancestries reported in Stickney are Mexican (4,185 | 59.5%), Polish (869 | 12.4%), Puerto Rican (694 | 9.9%), Irish (423 | 6.0%), and Czech (269 | 3.8%), together accounting for 91.6% of all Stickney residents.
| Ancestry | # Population | % Population |
| American | 141 | 2.0% |
| Burmese | 31 | 0.4% |
| Central American | 64 | 0.9% |
| Croatian | 11 | 0.2% |
| Czech | 269 | 3.8% |
| Czechoslovakian | 18 | 0.3% |
| Dominican | 62 | 0.9% |
| English | 73 | 1.0% |
| European | 37 | 0.5% |
| German | 243 | 3.5% |
| Greek | 24 | 0.3% |
| Hungarian | 46 | 0.6% |
| Irish | 423 | 6.0% |
| Italian | 135 | 1.9% |
| Korean | 54 | 0.8% |
| Lithuanian | 16 | 0.2% |
| Mexican | 4,185 | 59.5% |
| Mexican American Indian | 185 | 2.6% |
| Polish | 869 | 12.4% |
| Puerto Rican | 694 | 9.9% |
| Russian | 26 | 0.4% |
| Salvadoran | 64 | 0.9% |
| Slovak | 36 | 0.5% |
| Subsaharan African | 1 | 0.0% |
| Swedish | 6 | 0.1% |
| Ugandan | 1 | 0.0% |
| Yugoslavian | 12 | 0.2% | View All 27 Rows |
Immigrants in Stickney
The most numerous immigrant groups reported in Stickney came from Latin America (1,627 | 23.1%), Central America (1,599 | 22.7%), Mexico (1,528 | 21.7%), Eastern Europe (47 | 0.7%), and Europe (47 | 0.7%), together accounting for 69.0% of all Stickney residents.
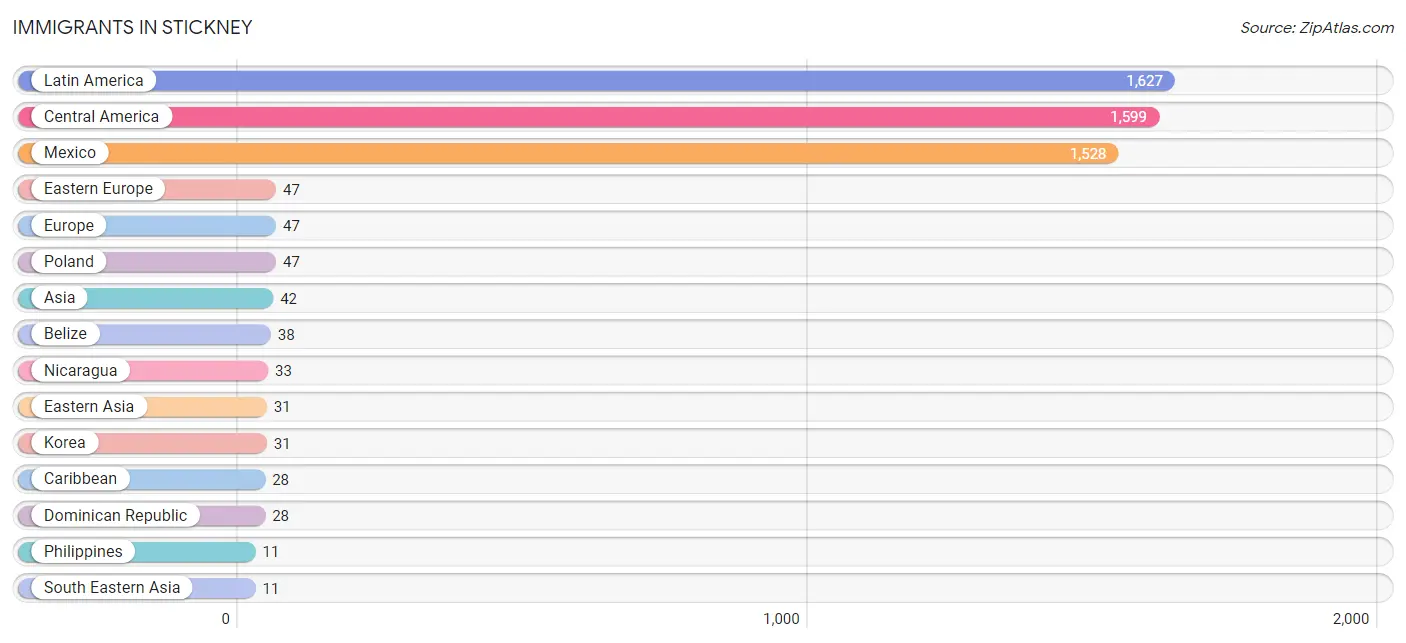
| Immigration Origin | # Population | % Population |
| Africa | 1 | 0.0% |
| Asia | 42 | 0.6% |
| Belize | 38 | 0.5% |
| Caribbean | 28 | 0.4% |
| Central America | 1,599 | 22.7% |
| Dominican Republic | 28 | 0.4% |
| Eastern Africa | 1 | 0.0% |
| Eastern Asia | 31 | 0.4% |
| Eastern Europe | 47 | 0.7% |
| Europe | 47 | 0.7% |
| Korea | 31 | 0.4% |
| Latin America | 1,627 | 23.1% |
| Mexico | 1,528 | 21.7% |
| Nicaragua | 33 | 0.5% |
| Philippines | 11 | 0.2% |
| Poland | 47 | 0.7% |
| South Eastern Asia | 11 | 0.2% |
| Uganda | 1 | 0.0% | View All 18 Rows |
Sex and Age in Stickney
Sex and Age in Stickney
The most populous age groups in Stickney are 35 to 39 Years (526 | 13.8%) for men and 15 to 19 Years (360 | 11.2%) for women.
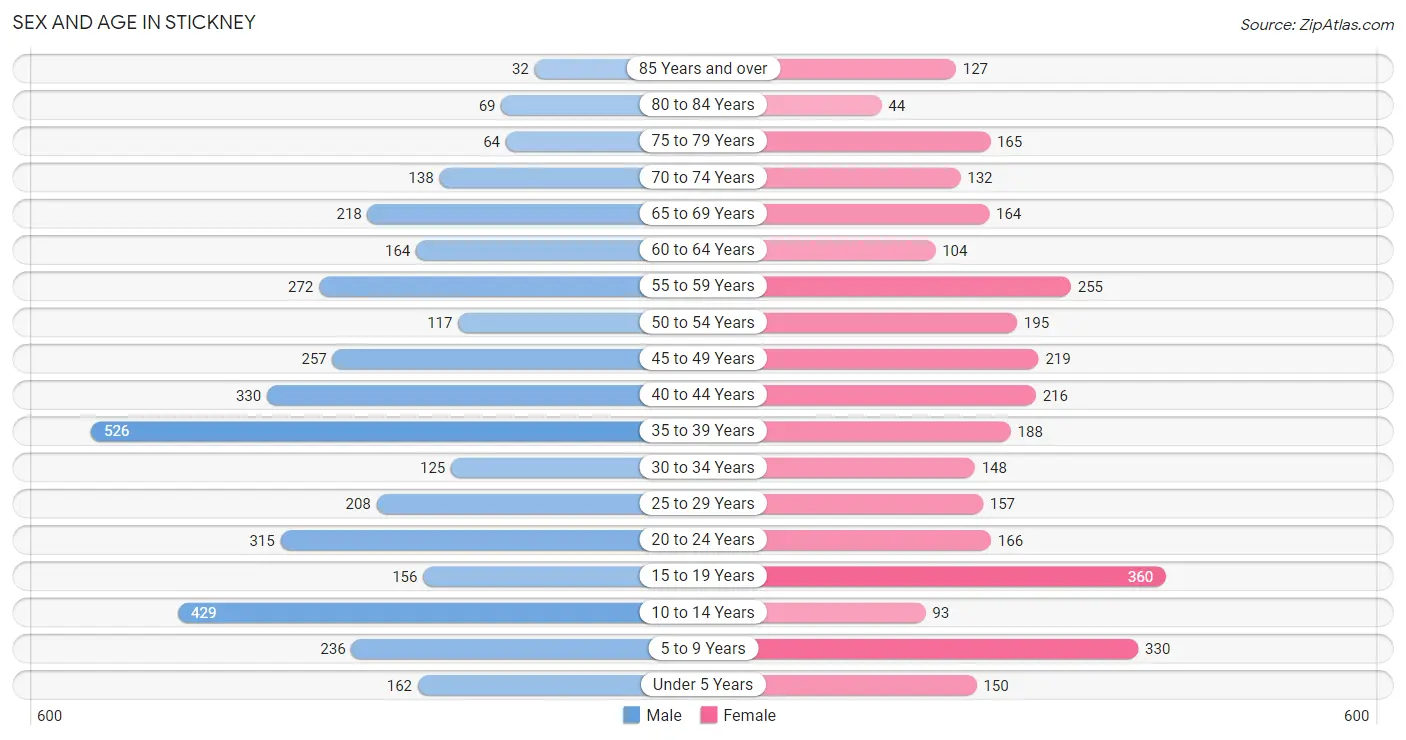
| Age Bracket | Male | Female |
| Under 5 Years | 162 (4.2%) | 150 (4.7%) |
| 5 to 9 Years | 236 (6.2%) | 330 (10.3%) |
| 10 to 14 Years | 429 (11.2%) | 93 (2.9%) |
| 15 to 19 Years | 156 (4.1%) | 360 (11.2%) |
| 20 to 24 Years | 315 (8.3%) | 166 (5.2%) |
| 25 to 29 Years | 208 (5.4%) | 157 (4.9%) |
| 30 to 34 Years | 125 (3.3%) | 148 (4.6%) |
| 35 to 39 Years | 526 (13.8%) | 188 (5.9%) |
| 40 to 44 Years | 330 (8.6%) | 216 (6.7%) |
| 45 to 49 Years | 257 (6.7%) | 219 (6.8%) |
| 50 to 54 Years | 117 (3.1%) | 195 (6.1%) |
| 55 to 59 Years | 272 (7.1%) | 255 (7.9%) |
| 60 to 64 Years | 164 (4.3%) | 104 (3.2%) |
| 65 to 69 Years | 218 (5.7%) | 164 (5.1%) |
| 70 to 74 Years | 138 (3.6%) | 132 (4.1%) |
| 75 to 79 Years | 64 (1.7%) | 165 (5.1%) |
| 80 to 84 Years | 69 (1.8%) | 44 (1.4%) |
| 85 Years and over | 32 (0.8%) | 127 (4.0%) |
| Total | 3,818 (100.0%) | 3,213 (100.0%) |
Families and Households in Stickney
Median Family Size in Stickney
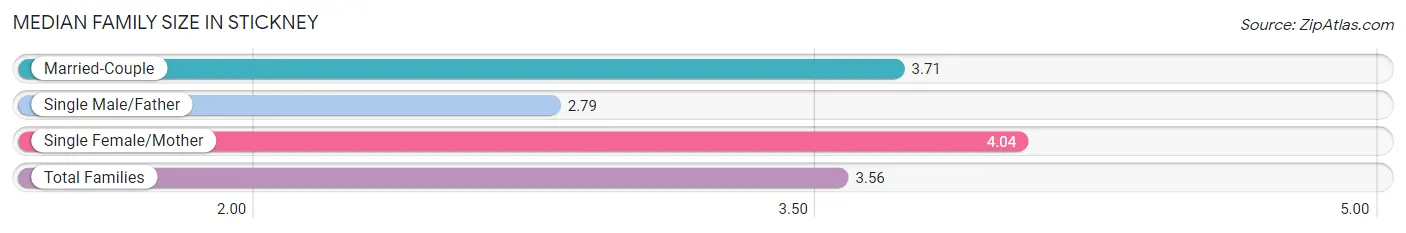
The median family size in Stickney is 3.56 persons per family, with single female/mother families (212 | 11.9%) accounting for the largest median family size of 4.04 persons per family. On the other hand, single male/father families (353 | 19.9%) represent the smallest median family size with 2.79 persons per family.
| Family Type | # Families | Family Size |
| Married-Couple | 1,209 (68.1%) | 3.71 |
| Single Male/Father | 353 (19.9%) | 2.79 |
| Single Female/Mother | 212 (11.9%) | 4.04 |
| Total Families | 1,774 (100.0%) | 3.56 |
Median Household Size in Stickney
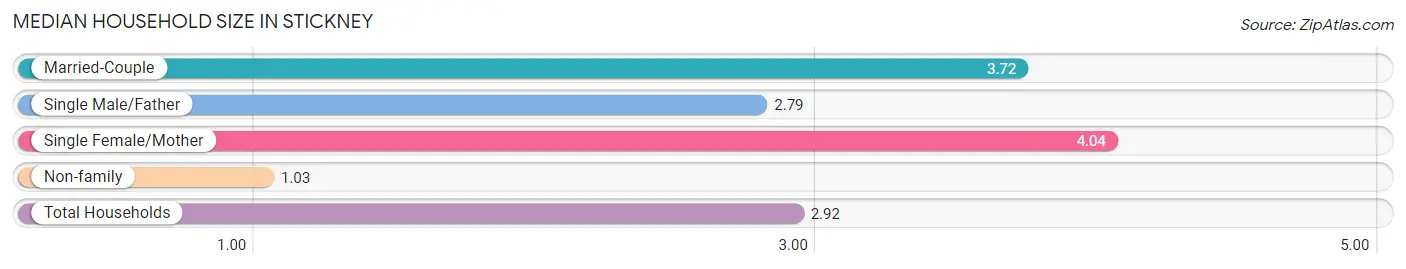
The median household size in Stickney is 2.92 persons per household, with single female/mother households (212 | 8.9%) accounting for the largest median household size of 4.04 persons per household. non-family households (618 | 25.8%) represent the smallest median household size with 1.03 persons per household.
| Household Type | # Households | Household Size |
| Married-Couple | 1,209 (50.5%) | 3.72 |
| Single Male/Father | 353 (14.8%) | 2.79 |
| Single Female/Mother | 212 (8.9%) | 4.04 |
| Non-family | 618 (25.8%) | 1.03 |
| Total Households | 2,392 (100.0%) | 2.92 |
Household Size by Marriage Status in Stickney
Out of a total of 2,392 households in Stickney, 1,774 (74.2%) are family households, while 618 (25.8%) are nonfamily households. The most numerous type of family households are 2-person households, comprising 705, and the most common type of nonfamily households are 1-person households, comprising 599.
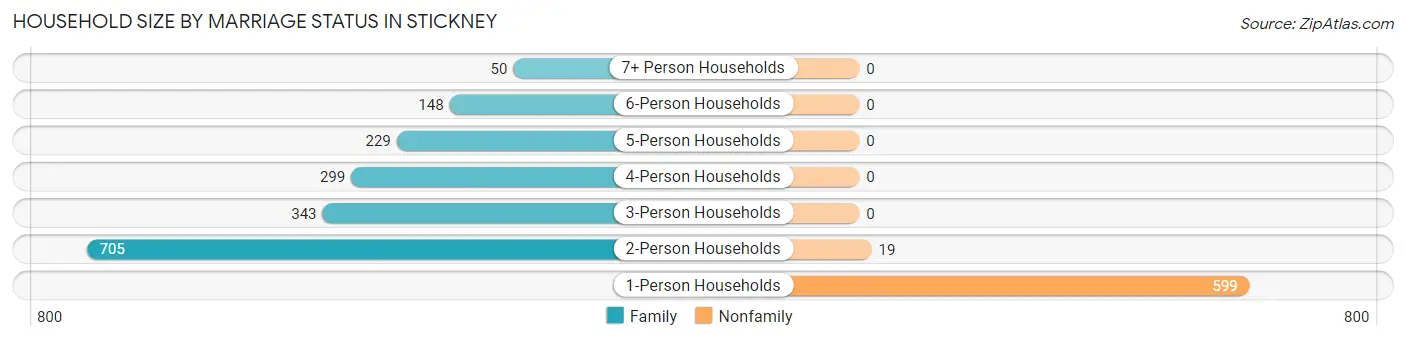
| Household Size | Family Households | Nonfamily Households |
| 1-Person Households | - | 599 (25.0%) |
| 2-Person Households | 705 (29.5%) | 19 (0.8%) |
| 3-Person Households | 343 (14.3%) | 0 (0.0%) |
| 4-Person Households | 299 (12.5%) | 0 (0.0%) |
| 5-Person Households | 229 (9.6%) | 0 (0.0%) |
| 6-Person Households | 148 (6.2%) | 0 (0.0%) |
| 7+ Person Households | 50 (2.1%) | 0 (0.0%) |
| Total | 1,774 (74.2%) | 618 (25.8%) |
Female Fertility in Stickney
Fertility by Age in Stickney
Average fertility rate in Stickney is 69.0 births per 1,000 women. Women in the age bracket of 20 to 34 years have the highest fertility rate with 117.0 births per 1,000 women. Women in the age bracket of 20 to 34 years acount for 54.5% of all women with births.
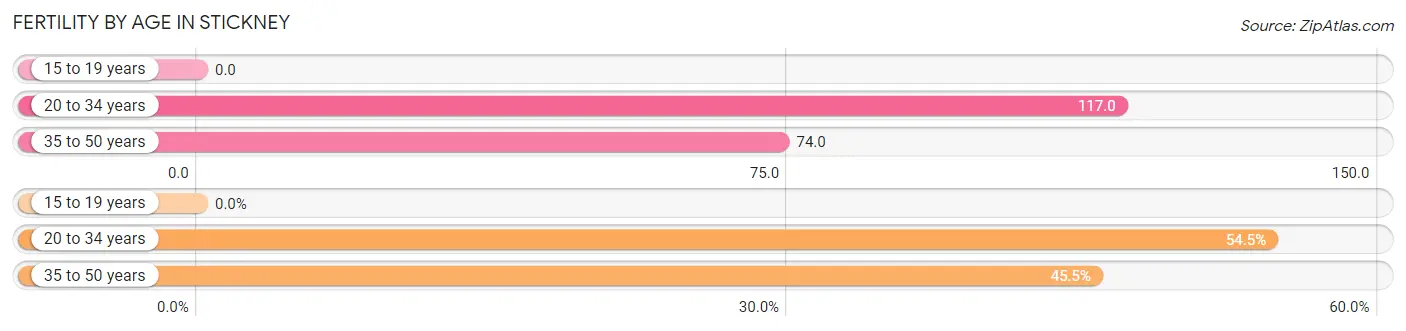
| Age Bracket | Women with Births | Births / 1,000 Women |
| 15 to 19 years | 0 (0.0%) | 0.0 |
| 20 to 34 years | 55 (54.5%) | 117.0 |
| 35 to 50 years | 46 (45.5%) | 74.0 |
| Total | 101 (100.0%) | 69.0 |
Fertility by Age by Marriage Status in Stickney
99.0% of women with births (101) in Stickney are married. The highest percentage of unmarried women with births falls into 20 to 34 years age bracket with 1.8% of them unmarried at the time of birth, while the lowest percentage of unmarried women with births belong to 35 to 50 years age bracket with 0.0% of them unmarried.
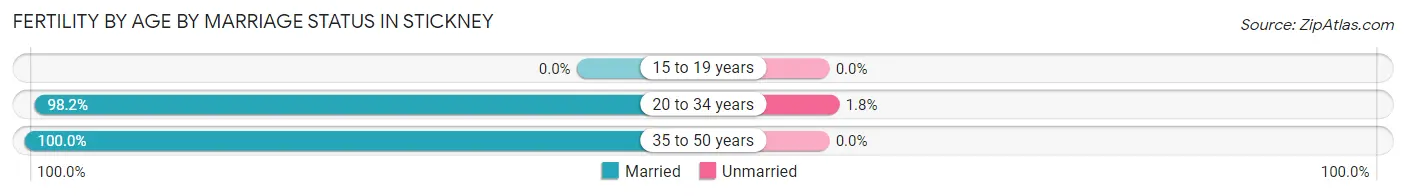
| Age Bracket | Married | Unmarried |
| 15 to 19 years | 0 (0.0%) | 0 (0.0%) |
| 20 to 34 years | 54 (98.2%) | 1 (1.8%) |
| 35 to 50 years | 46 (100.0%) | 0 (0.0%) |
| Total | 100 (99.0%) | 1 (1.0%) |
Fertility by Education in Stickney
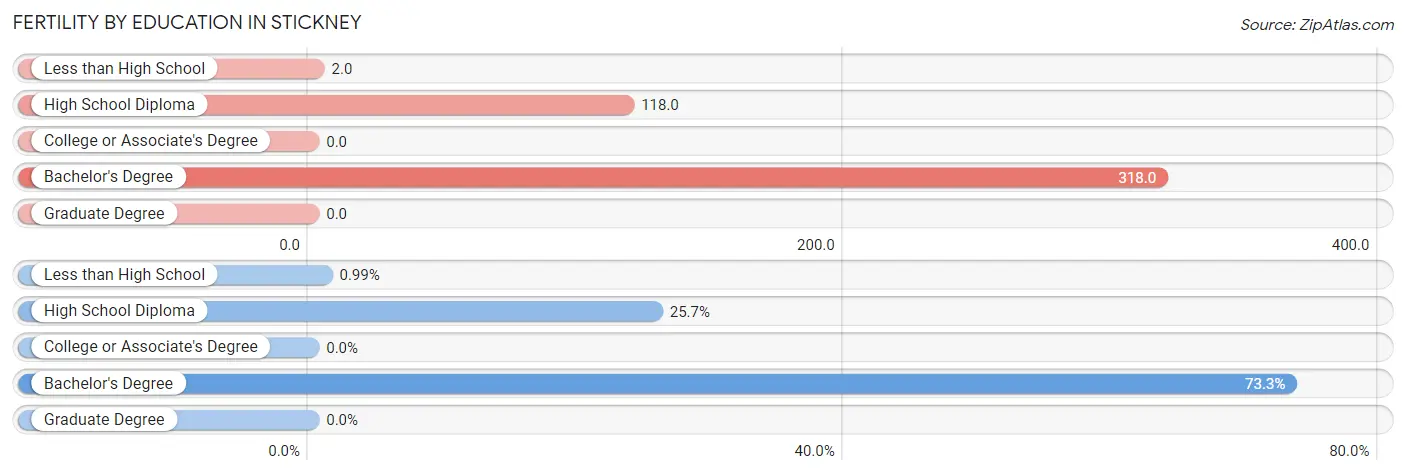
| Educational Attainment | Women with Births | Births / 1,000 Women |
| Less than High School | 1 (1.0%) | 2.0 |
| High School Diploma | 26 (25.7%) | 118.0 |
| College or Associate's Degree | 0 (0.0%) | 0.0 |
| Bachelor's Degree | 74 (73.3%) | 318.0 |
| Graduate Degree | 0 (0.0%) | 0.0 |
| Total | 101 (100.0%) | 69.0 |
Fertility by Education by Marriage Status in Stickney
1.0% of women with births in Stickney are unmarried. Women with the educational attainment of high school diploma are most likely to be married with 100.0% of them married at childbirth, while women with the educational attainment of less than high school are least likely to be married with 100.0% of them unmarried at childbirth.
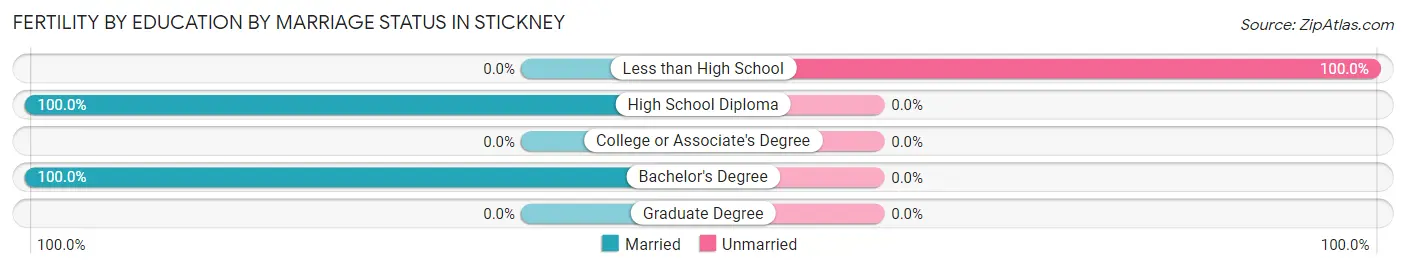
| Educational Attainment | Married | Unmarried |
| Less than High School | 0 (0.0%) | 1 (100.0%) |
| High School Diploma | 26 (100.0%) | 0 (0.0%) |
| College or Associate's Degree | 0 (0.0%) | 0 (0.0%) |
| Bachelor's Degree | 74 (100.0%) | 0 (0.0%) |
| Graduate Degree | 0 (0.0%) | 0 (0.0%) |
| Total | 100 (99.0%) | 1 (1.0%) |
Employment Characteristics in Stickney
Employment by Class of Employer in Stickney
Among the 3,058 employed individuals in Stickney, private company employees (1,914 | 62.6%), federal government employees (334 | 10.9%), and local government employees (266 | 8.7%) make up the most common classes of employment.
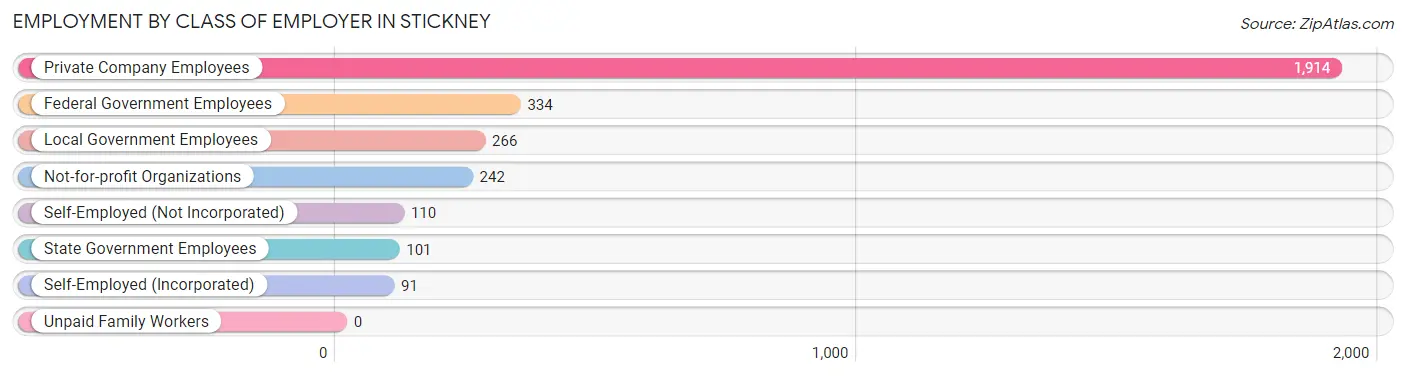
| Employer Class | # Employees | % Employees |
| Private Company Employees | 1,914 | 62.6% |
| Self-Employed (Incorporated) | 91 | 3.0% |
| Self-Employed (Not Incorporated) | 110 | 3.6% |
| Not-for-profit Organizations | 242 | 7.9% |
| Local Government Employees | 266 | 8.7% |
| State Government Employees | 101 | 3.3% |
| Federal Government Employees | 334 | 10.9% |
| Unpaid Family Workers | 0 | 0.0% |
| Total | 3,058 | 100.0% |
Employment Status by Age in Stickney
According to the labor force statistics for Stickney, out of the total population over 16 years of age (5,493), 59.0% or 3,241 individuals are in the labor force, with 4.6% or 149 of them unemployed. The age group with the highest labor force participation rate is 45 to 54 years, with 88.2% or 695 individuals in the labor force. Within the labor force, the 30 to 34 years age range has the highest percentage of unemployed individuals, with 13.5% or 30 of them being unemployed.
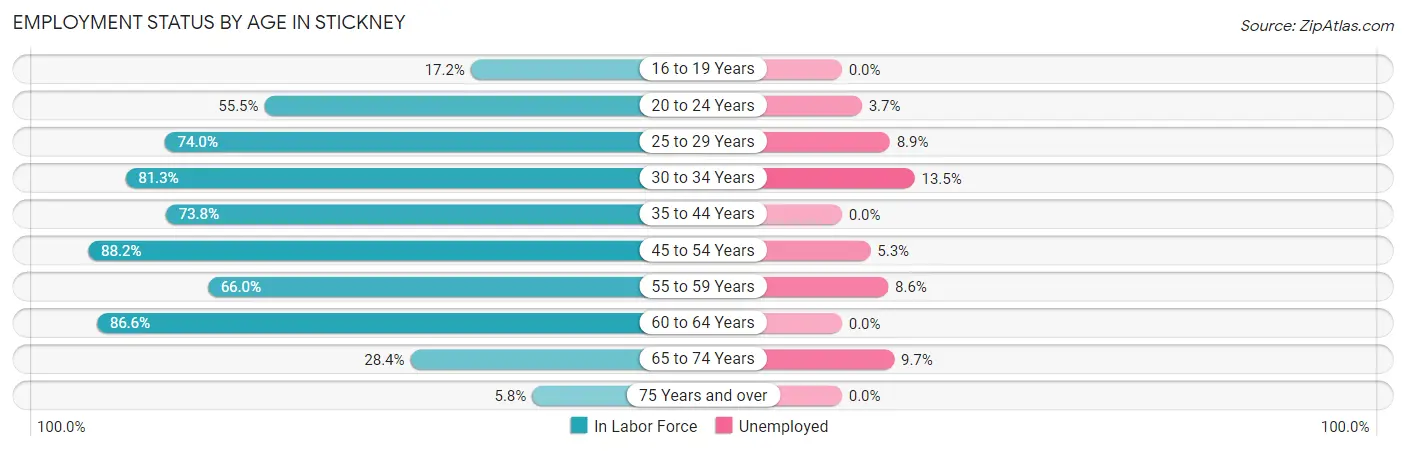
| Age Bracket | In Labor Force | Unemployed |
| 16 to 19 Years | 65 (17.2%) | 0 (0.0%) |
| 20 to 24 Years | 267 (55.5%) | 10 (3.7%) |
| 25 to 29 Years | 270 (74.0%) | 24 (8.9%) |
| 30 to 34 Years | 222 (81.3%) | 30 (13.5%) |
| 35 to 44 Years | 930 (73.8%) | 0 (0.0%) |
| 45 to 54 Years | 695 (88.2%) | 37 (5.3%) |
| 55 to 59 Years | 348 (66.0%) | 30 (8.6%) |
| 60 to 64 Years | 232 (86.6%) | 0 (0.0%) |
| 65 to 74 Years | 185 (28.4%) | 18 (9.7%) |
| 75 Years and over | 29 (5.8%) | 0 (0.0%) |
| Total | 3,241 (59.0%) | 149 (4.6%) |
Employment Status by Educational Attainment in Stickney
According to labor force statistics for Stickney, 77.5% of individuals (2,698) out of the total population between 25 and 64 years of age (3,481) are in the labor force, with 4.5% or 121 of them being unemployed. The group with the highest labor force participation rate are those with the educational attainment of college / associate degree, with 87.5% or 1,039 individuals in the labor force. Within the labor force, individuals with less than high school education have the highest percentage of unemployment, with 12.9% or 28 of them being unemployed.
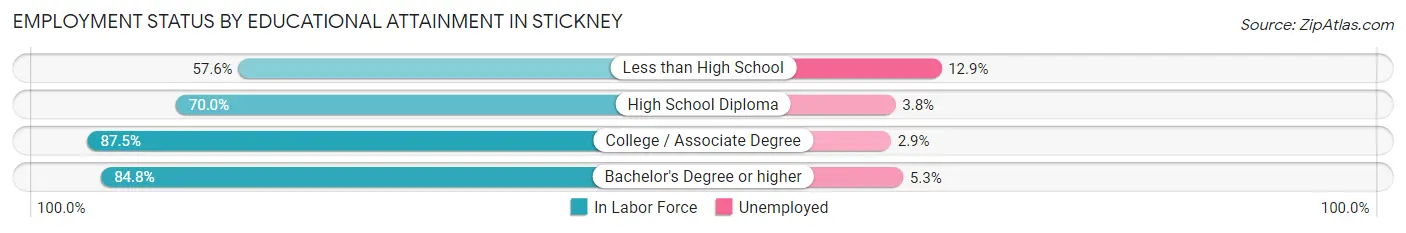
| Educational Attainment | In Labor Force | Unemployed |
| Less than High School | 217 (57.6%) | 49 (12.9%) |
| High School Diploma | 873 (70.0%) | 47 (3.8%) |
| College / Associate Degree | 1,039 (87.5%) | 34 (2.9%) |
| Bachelor's Degree or higher | 568 (84.8%) | 36 (5.3%) |
| Total | 2,698 (77.5%) | 157 (4.5%) |
Employment Occupations by Sex in Stickney
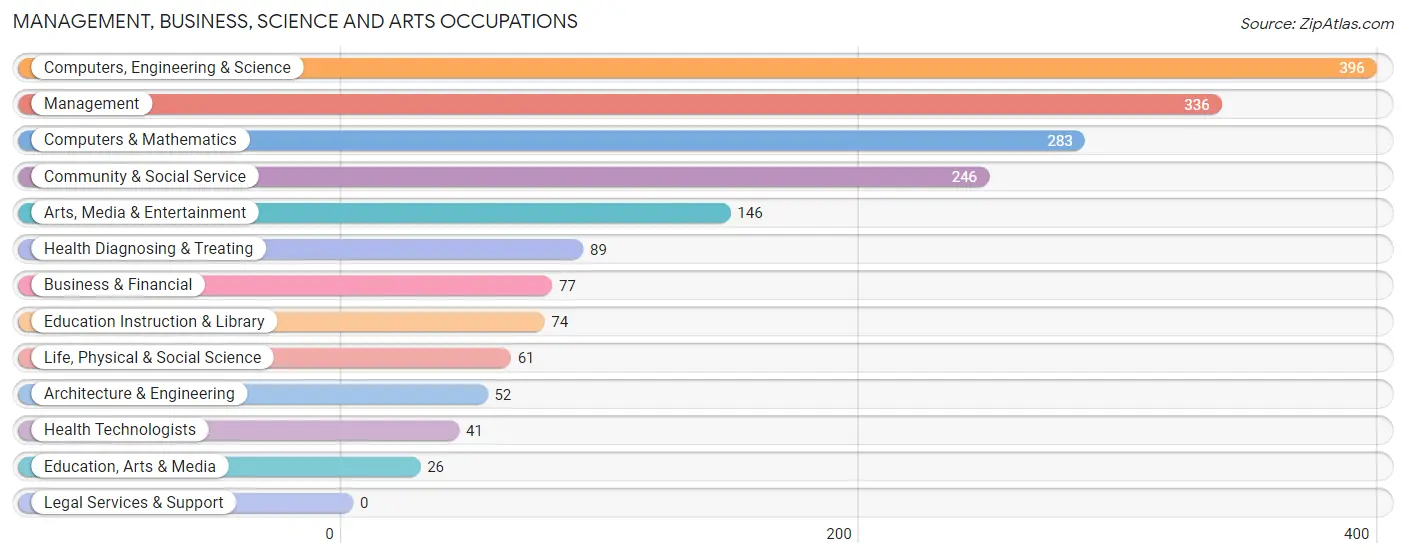
Management, Business, Science and Arts Occupations
The most common Management, Business, Science and Arts occupations in Stickney are Computers, Engineering & Science (396 | 12.8%), Management (336 | 10.9%), Computers & Mathematics (283 | 9.1%), Community & Social Service (246 | 8.0%), and Arts, Media & Entertainment (146 | 4.7%).
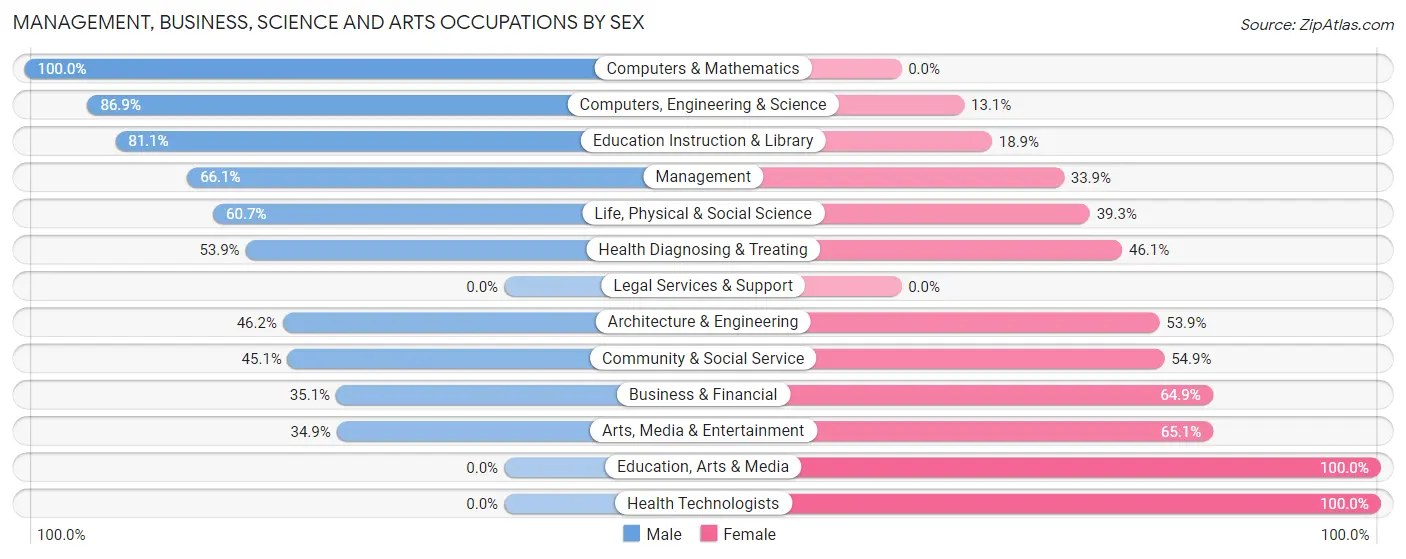
Management, Business, Science and Arts Occupations by Sex
Within the Management, Business, Science and Arts occupations in Stickney, the most male-oriented occupations are Computers & Mathematics (100.0%), Computers, Engineering & Science (86.9%), and Education Instruction & Library (81.1%), while the most female-oriented occupations are Education, Arts & Media (100.0%), Health Technologists (100.0%), and Arts, Media & Entertainment (65.1%).
| Occupation | Male | Female |
| Management | 222 (66.1%) | 114 (33.9%) |
| Business & Financial | 27 (35.1%) | 50 (64.9%) |
| Computers, Engineering & Science | 344 (86.9%) | 52 (13.1%) |
| Computers & Mathematics | 283 (100.0%) | 0 (0.0%) |
| Architecture & Engineering | 24 (46.2%) | 28 (53.8%) |
| Life, Physical & Social Science | 37 (60.7%) | 24 (39.3%) |
| Community & Social Service | 111 (45.1%) | 135 (54.9%) |
| Education, Arts & Media | 0 (0.0%) | 26 (100.0%) |
| Legal Services & Support | 0 (0.0%) | 0 (0.0%) |
| Education Instruction & Library | 60 (81.1%) | 14 (18.9%) |
| Arts, Media & Entertainment | 51 (34.9%) | 95 (65.1%) |
| Health Diagnosing & Treating | 48 (53.9%) | 41 (46.1%) |
| Health Technologists | 0 (0.0%) | 41 (100.0%) |
| Total (Category) | 752 (65.7%) | 392 (34.3%) |
| Total (Overall) | 2,074 (67.0%) | 1,020 (33.0%) |
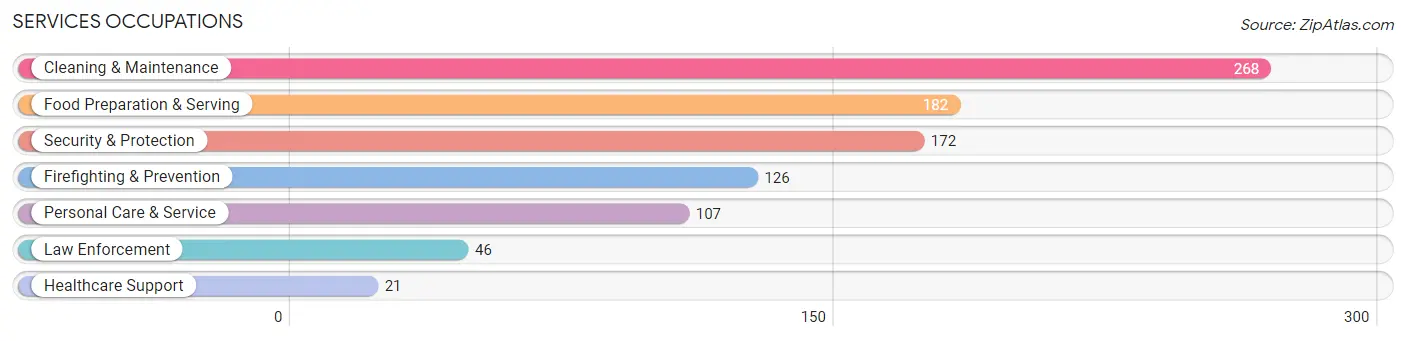
Services Occupations
The most common Services occupations in Stickney are Cleaning & Maintenance (268 | 8.7%), Food Preparation & Serving (182 | 5.9%), Security & Protection (172 | 5.6%), Firefighting & Prevention (126 | 4.1%), and Personal Care & Service (107 | 3.5%).
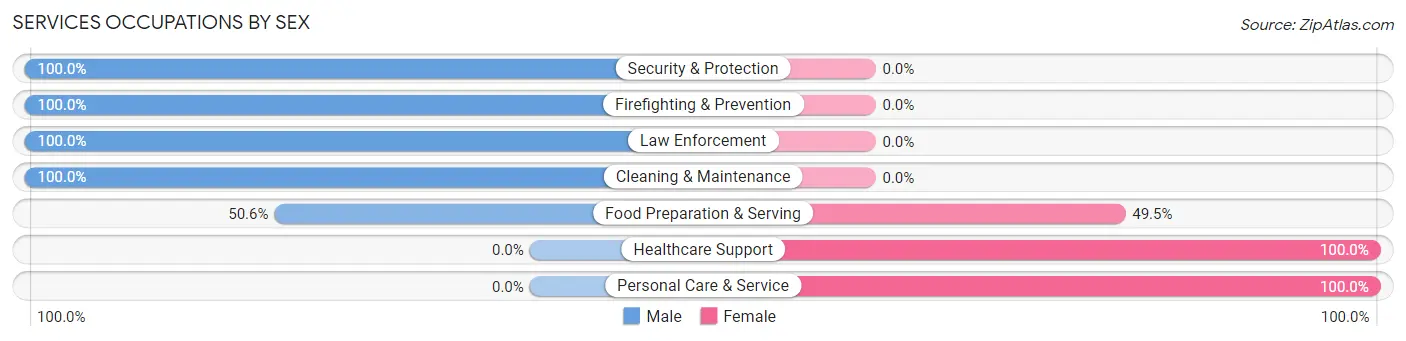
Services Occupations by Sex
Within the Services occupations in Stickney, the most male-oriented occupations are Security & Protection (100.0%), Firefighting & Prevention (100.0%), and Law Enforcement (100.0%), while the most female-oriented occupations are Healthcare Support (100.0%), Personal Care & Service (100.0%), and Food Preparation & Serving (49.4%).
| Occupation | Male | Female |
| Healthcare Support | 0 (0.0%) | 21 (100.0%) |
| Security & Protection | 172 (100.0%) | 0 (0.0%) |
| Firefighting & Prevention | 126 (100.0%) | 0 (0.0%) |
| Law Enforcement | 46 (100.0%) | 0 (0.0%) |
| Food Preparation & Serving | 92 (50.5%) | 90 (49.4%) |
| Cleaning & Maintenance | 268 (100.0%) | 0 (0.0%) |
| Personal Care & Service | 0 (0.0%) | 107 (100.0%) |
| Total (Category) | 532 (70.9%) | 218 (29.1%) |
| Total (Overall) | 2,074 (67.0%) | 1,020 (33.0%) |
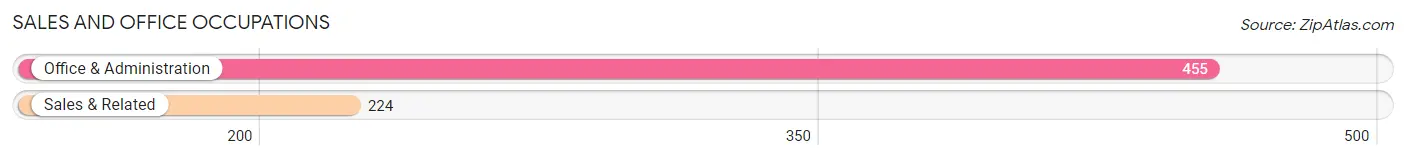
Sales and Office Occupations
The most common Sales and Office occupations in Stickney are Office & Administration (455 | 14.7%), and Sales & Related (224 | 7.2%).
Sales and Office Occupations by Sex
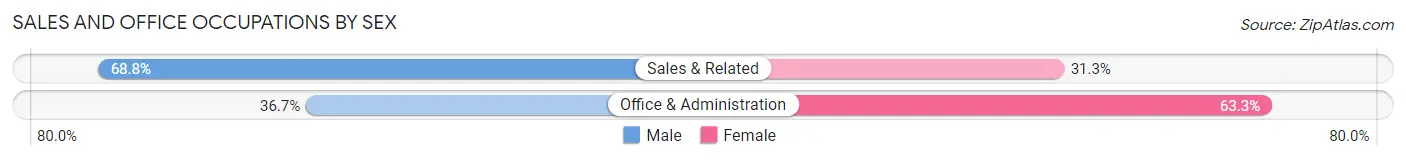
| Occupation | Male | Female |
| Sales & Related | 154 (68.8%) | 70 (31.2%) |
| Office & Administration | 167 (36.7%) | 288 (63.3%) |
| Total (Category) | 321 (47.3%) | 358 (52.7%) |
| Total (Overall) | 2,074 (67.0%) | 1,020 (33.0%) |
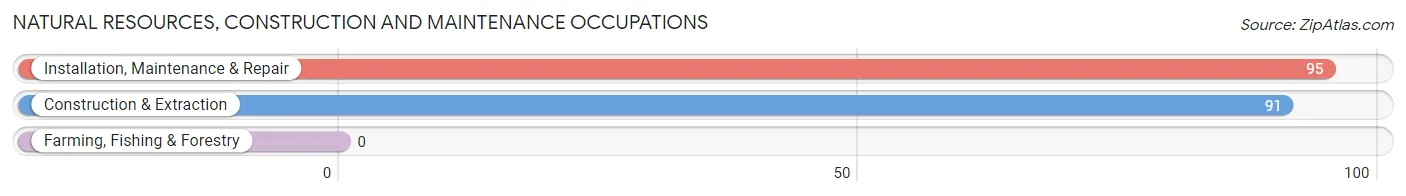
Natural Resources, Construction and Maintenance Occupations
The most common Natural Resources, Construction and Maintenance occupations in Stickney are Installation, Maintenance & Repair (95 | 3.1%), and Construction & Extraction (91 | 2.9%).
Natural Resources, Construction and Maintenance Occupations by Sex
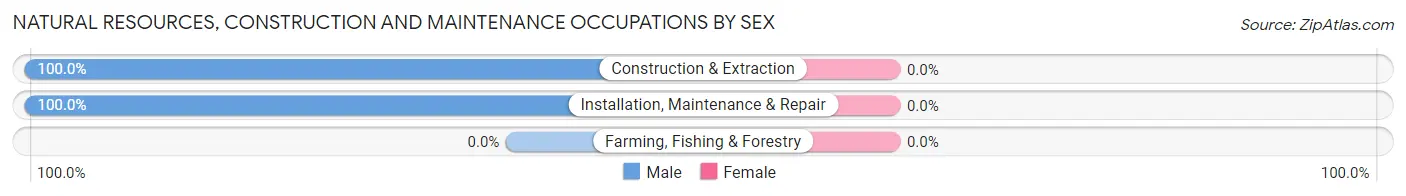
| Occupation | Male | Female |
| Farming, Fishing & Forestry | 0 (0.0%) | 0 (0.0%) |
| Construction & Extraction | 91 (100.0%) | 0 (0.0%) |
| Installation, Maintenance & Repair | 95 (100.0%) | 0 (0.0%) |
| Total (Category) | 186 (100.0%) | 0 (0.0%) |
| Total (Overall) | 2,074 (67.0%) | 1,020 (33.0%) |
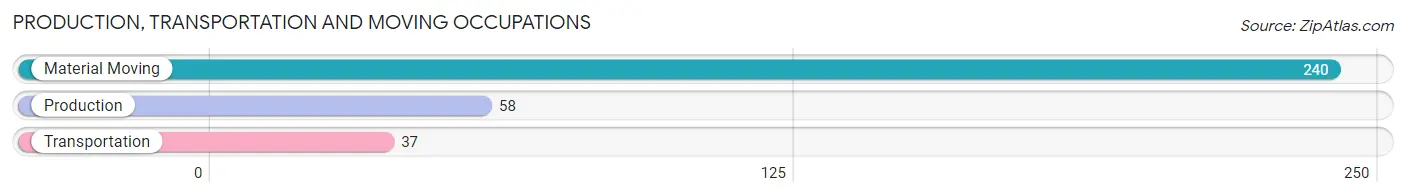
Production, Transportation and Moving Occupations
The most common Production, Transportation and Moving occupations in Stickney are Material Moving (240 | 7.8%), Production (58 | 1.9%), and Transportation (37 | 1.2%).
Production, Transportation and Moving Occupations by Sex
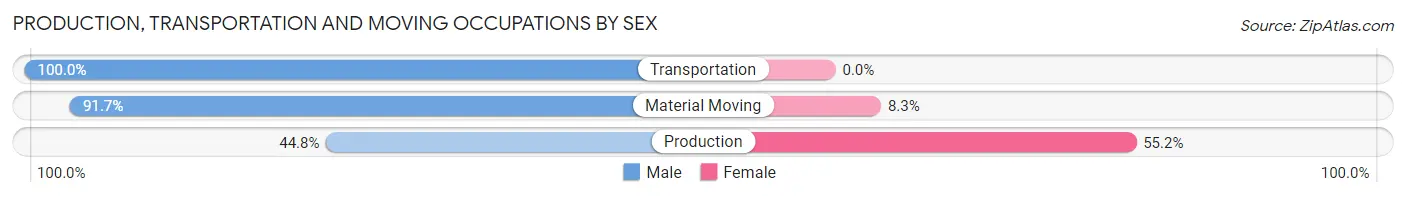
| Occupation | Male | Female |
| Production | 26 (44.8%) | 32 (55.2%) |
| Transportation | 37 (100.0%) | 0 (0.0%) |
| Material Moving | 220 (91.7%) | 20 (8.3%) |
| Total (Category) | 283 (84.5%) | 52 (15.5%) |
| Total (Overall) | 2,074 (67.0%) | 1,020 (33.0%) |
Employment Industries by Sex in Stickney
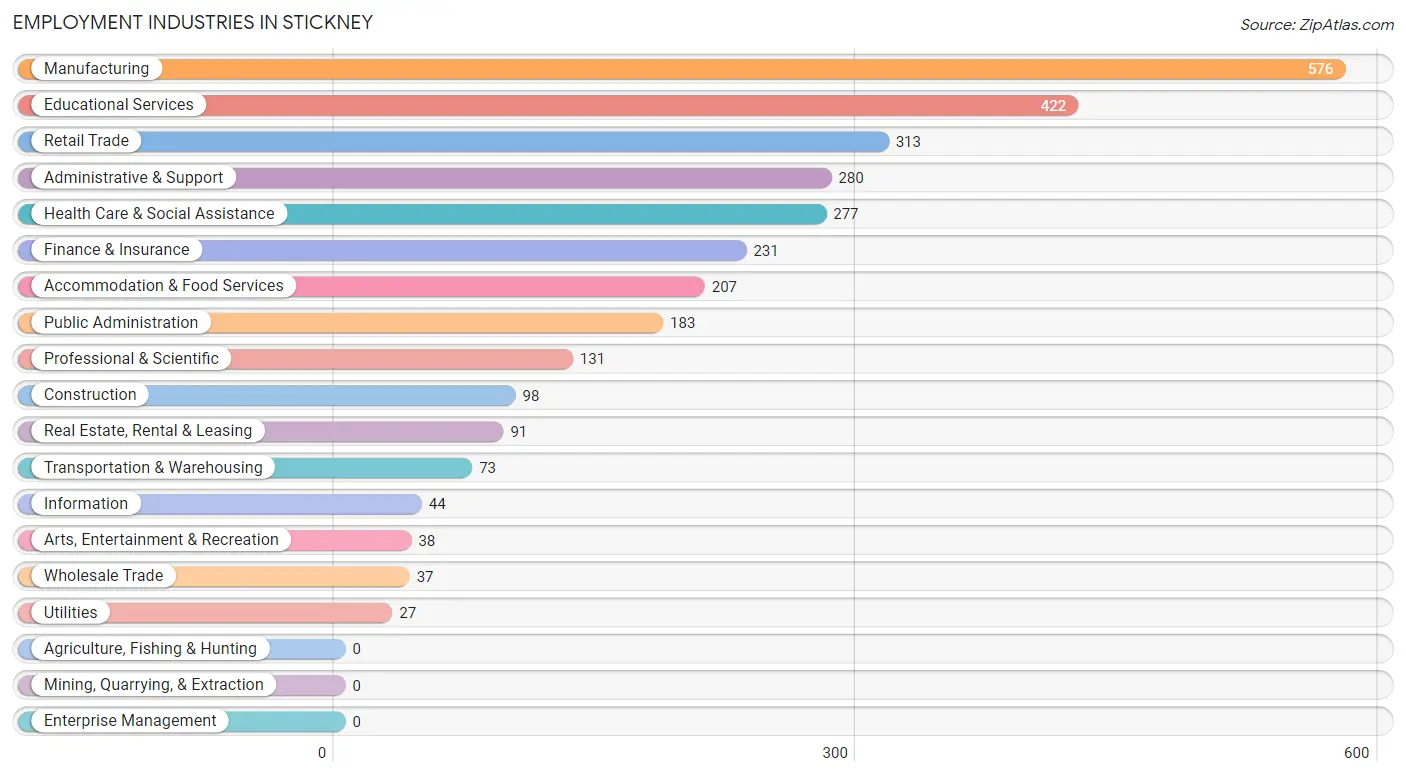
Employment Industries in Stickney
The major employment industries in Stickney include Manufacturing (576 | 18.6%), Educational Services (422 | 13.6%), Retail Trade (313 | 10.1%), Administrative & Support (280 | 9.0%), and Health Care & Social Assistance (277 | 8.9%).
Employment Industries by Sex in Stickney
The Stickney industries that see more men than women are Construction (100.0%), Utilities (100.0%), and Real Estate, Rental & Leasing (100.0%), whereas the industries that tend to have a higher number of women are Wholesale Trade (100.0%), Information (100.0%), and Health Care & Social Assistance (75.1%).
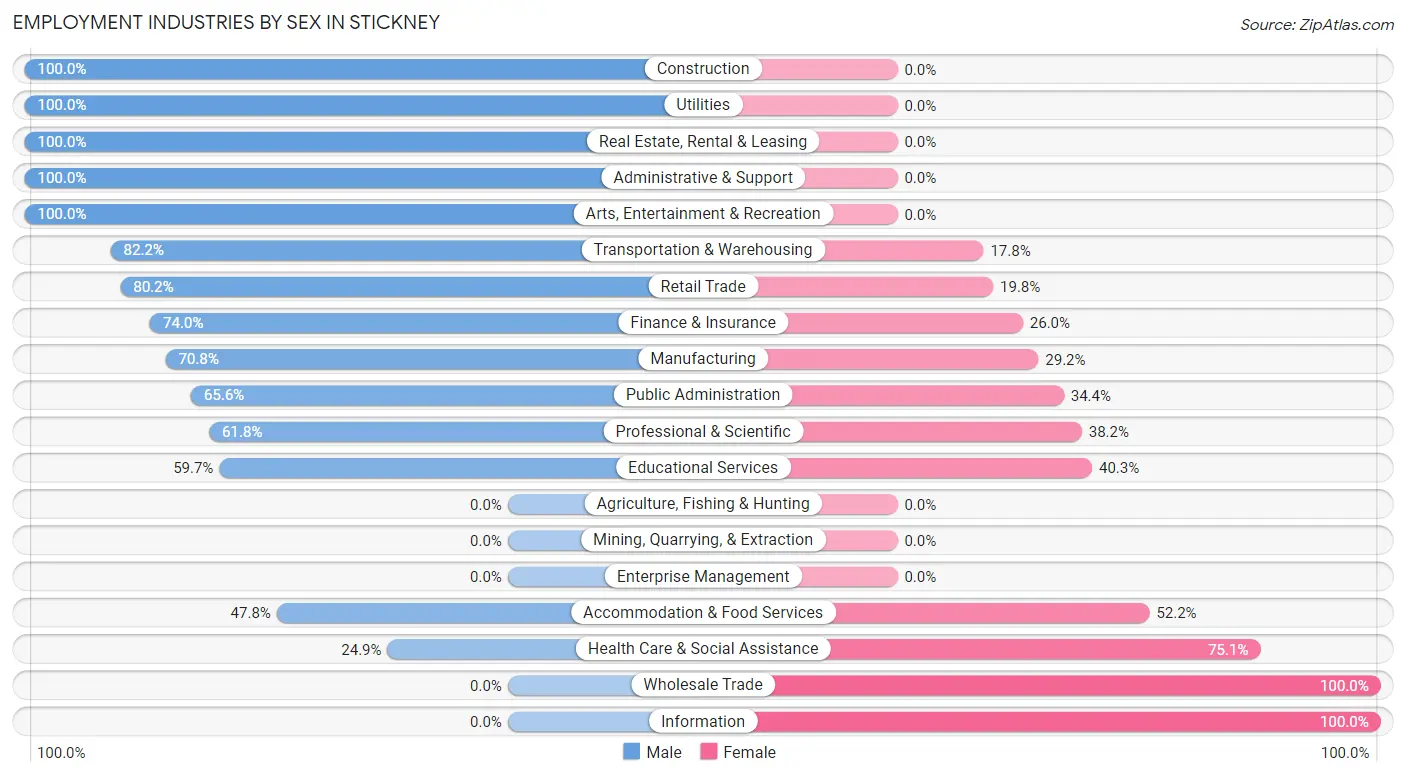
| Industry | Male | Female |
| Agriculture, Fishing & Hunting | 0 (0.0%) | 0 (0.0%) |
| Mining, Quarrying, & Extraction | 0 (0.0%) | 0 (0.0%) |
| Construction | 98 (100.0%) | 0 (0.0%) |
| Manufacturing | 408 (70.8%) | 168 (29.2%) |
| Wholesale Trade | 0 (0.0%) | 37 (100.0%) |
| Retail Trade | 251 (80.2%) | 62 (19.8%) |
| Transportation & Warehousing | 60 (82.2%) | 13 (17.8%) |
| Utilities | 27 (100.0%) | 0 (0.0%) |
| Information | 0 (0.0%) | 44 (100.0%) |
| Finance & Insurance | 171 (74.0%) | 60 (26.0%) |
| Real Estate, Rental & Leasing | 91 (100.0%) | 0 (0.0%) |
| Professional & Scientific | 81 (61.8%) | 50 (38.2%) |
| Enterprise Management | 0 (0.0%) | 0 (0.0%) |
| Administrative & Support | 280 (100.0%) | 0 (0.0%) |
| Educational Services | 252 (59.7%) | 170 (40.3%) |
| Health Care & Social Assistance | 69 (24.9%) | 208 (75.1%) |
| Arts, Entertainment & Recreation | 38 (100.0%) | 0 (0.0%) |
| Accommodation & Food Services | 99 (47.8%) | 108 (52.2%) |
| Public Administration | 120 (65.6%) | 63 (34.4%) |
| Total | 2,074 (67.0%) | 1,020 (33.0%) |
Education in Stickney
School Enrollment in Stickney
The most common levels of schooling among the 2,006 students in Stickney are high school (493 | 24.6%), middle school (475 | 23.7%), and college / undergraduate (451 | 22.5%).
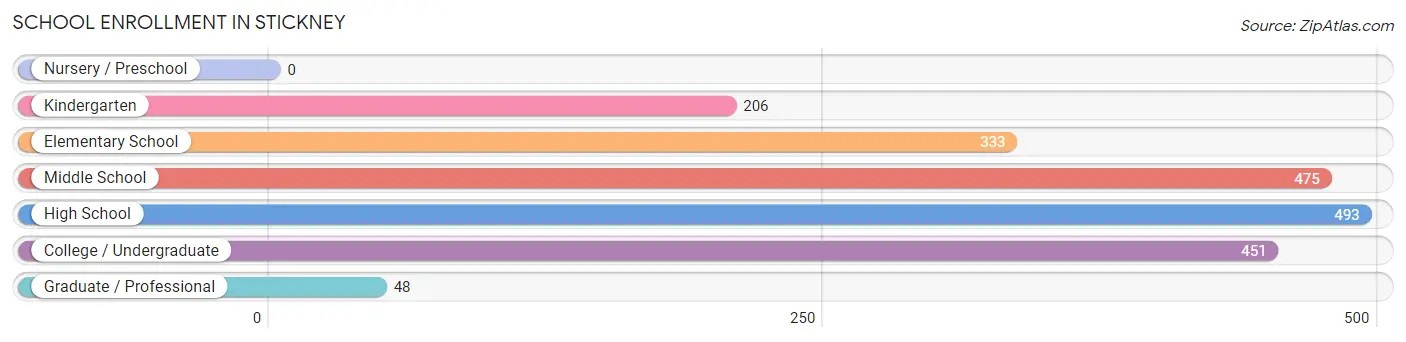
| School Level | # Students | % Students |
| Nursery / Preschool | 0 | 0.0% |
| Kindergarten | 206 | 10.3% |
| Elementary School | 333 | 16.6% |
| Middle School | 475 | 23.7% |
| High School | 493 | 24.6% |
| College / Undergraduate | 451 | 22.5% |
| Graduate / Professional | 48 | 2.4% |
| Total | 2,006 | 100.0% |
School Enrollment by Age by Funding Source in Stickney
Out of a total of 2,006 students who are enrolled in schools in Stickney, 241 (12.0%) attend a private institution, while the remaining 1,765 (88.0%) are enrolled in public schools. The age group of 18 to 19 year olds has the highest likelihood of being enrolled in private schools, with 46 (82.1% in the age bracket) enrolled. Conversely, the age group of 3 to 4 year olds has the lowest likelihood of being enrolled in a private school, with 23 (100.0% in the age bracket) attending a public institution.
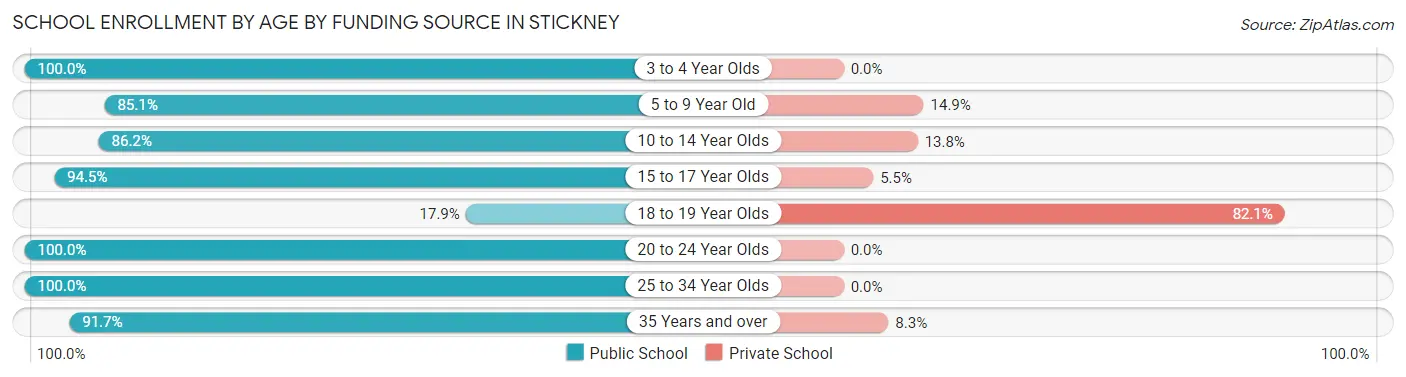
| Age Bracket | Public School | Private School |
| 3 to 4 Year Olds | 23 (100.0%) | 0 (0.0%) |
| 5 to 9 Year Old | 463 (85.1%) | 81 (14.9%) |
| 10 to 14 Year Olds | 450 (86.2%) | 72 (13.8%) |
| 15 to 17 Year Olds | 395 (94.5%) | 23 (5.5%) |
| 18 to 19 Year Olds | 10 (17.9%) | 46 (82.1%) |
| 20 to 24 Year Olds | 187 (100.0%) | 0 (0.0%) |
| 25 to 34 Year Olds | 40 (100.0%) | 0 (0.0%) |
| 35 Years and over | 198 (91.7%) | 18 (8.3%) |
| Total | 1,765 (88.0%) | 241 (12.0%) |
Educational Attainment by Field of Study in Stickney
Education (149 | 17.4%), business (142 | 16.6%), science & technology (88 | 10.3%), visual & performing arts (83 | 9.7%), and arts & humanities (81 | 9.5%) are the most common fields of study among 857 individuals in Stickney who have obtained a bachelor's degree or higher.
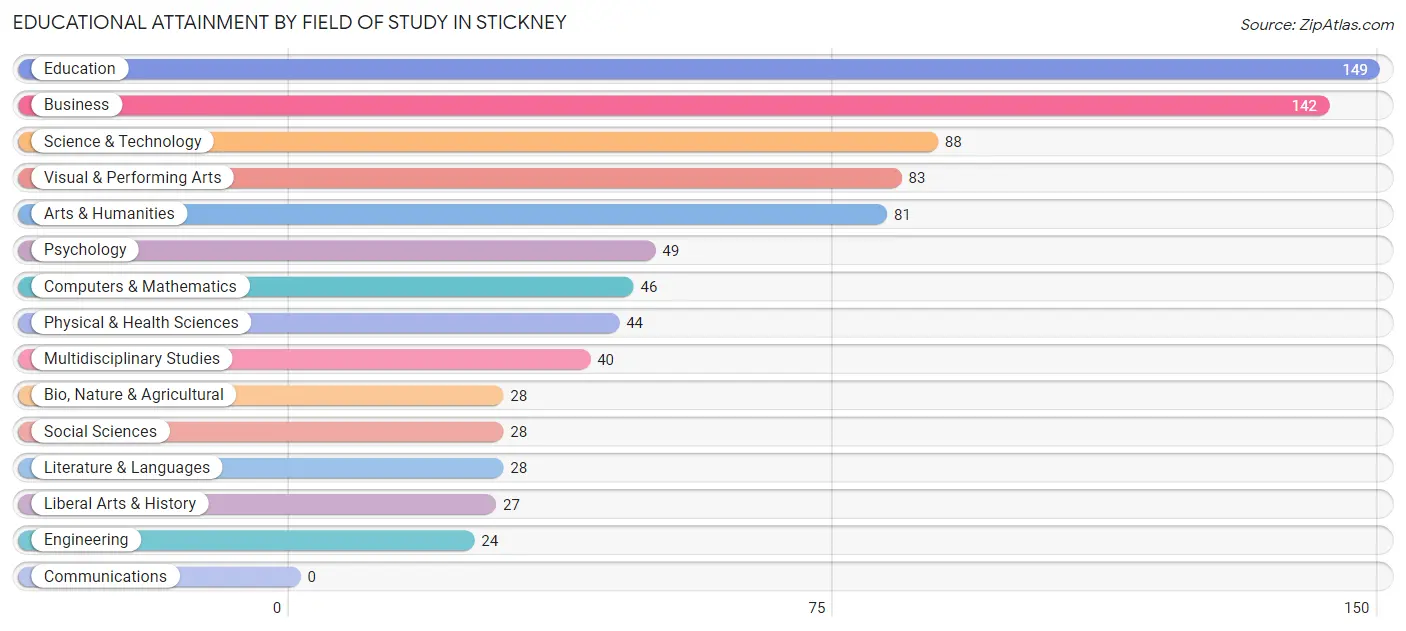
| Field of Study | # Graduates | % Graduates |
| Computers & Mathematics | 46 | 5.4% |
| Bio, Nature & Agricultural | 28 | 3.3% |
| Physical & Health Sciences | 44 | 5.1% |
| Psychology | 49 | 5.7% |
| Social Sciences | 28 | 3.3% |
| Engineering | 24 | 2.8% |
| Multidisciplinary Studies | 40 | 4.7% |
| Science & Technology | 88 | 10.3% |
| Business | 142 | 16.6% |
| Education | 149 | 17.4% |
| Literature & Languages | 28 | 3.3% |
| Liberal Arts & History | 27 | 3.2% |
| Visual & Performing Arts | 83 | 9.7% |
| Communications | 0 | 0.0% |
| Arts & Humanities | 81 | 9.5% |
| Total | 857 | 100.0% |
Transportation & Commute in Stickney
Vehicle Availability by Sex in Stickney
The most prevalent vehicle ownership categories in Stickney are males with 2 vehicles (763, accounting for 37.4%) and females with 2 vehicles (500, making up 75.0%).
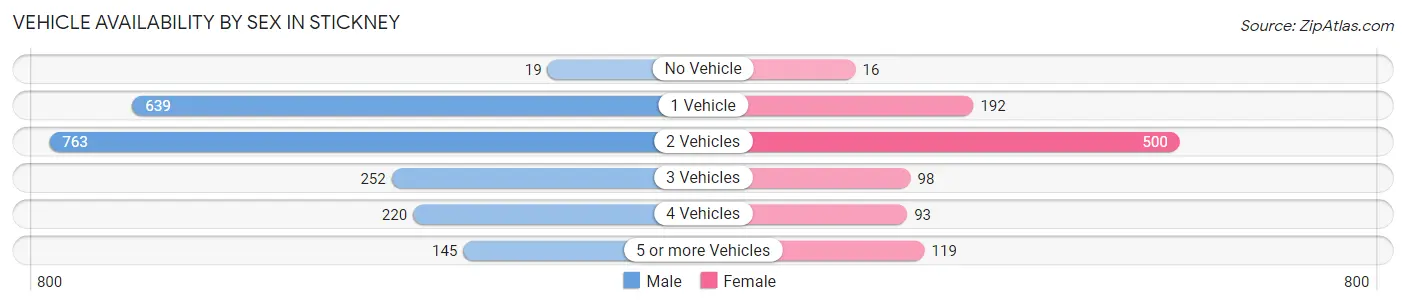
| Vehicles Available | Male | Female |
| No Vehicle | 19 (0.9%) | 16 (1.6%) |
| 1 Vehicle | 639 (31.4%) | 192 (18.9%) |
| 2 Vehicles | 763 (37.4%) | 500 (49.1%) |
| 3 Vehicles | 252 (12.4%) | 98 (9.6%) |
| 4 Vehicles | 220 (10.8%) | 93 (9.1%) |
| 5 or more Vehicles | 145 (7.1%) | 119 (11.7%) |
| Total | 2,038 (100.0%) | 1,018 (100.0%) |
Commute Time in Stickney
The most frequently occuring commute durations in Stickney are 10 to 14 minutes (505 commuters, 18.2%), 40 to 44 minutes (472 commuters, 17.0%), and 30 to 34 minutes (443 commuters, 16.0%).
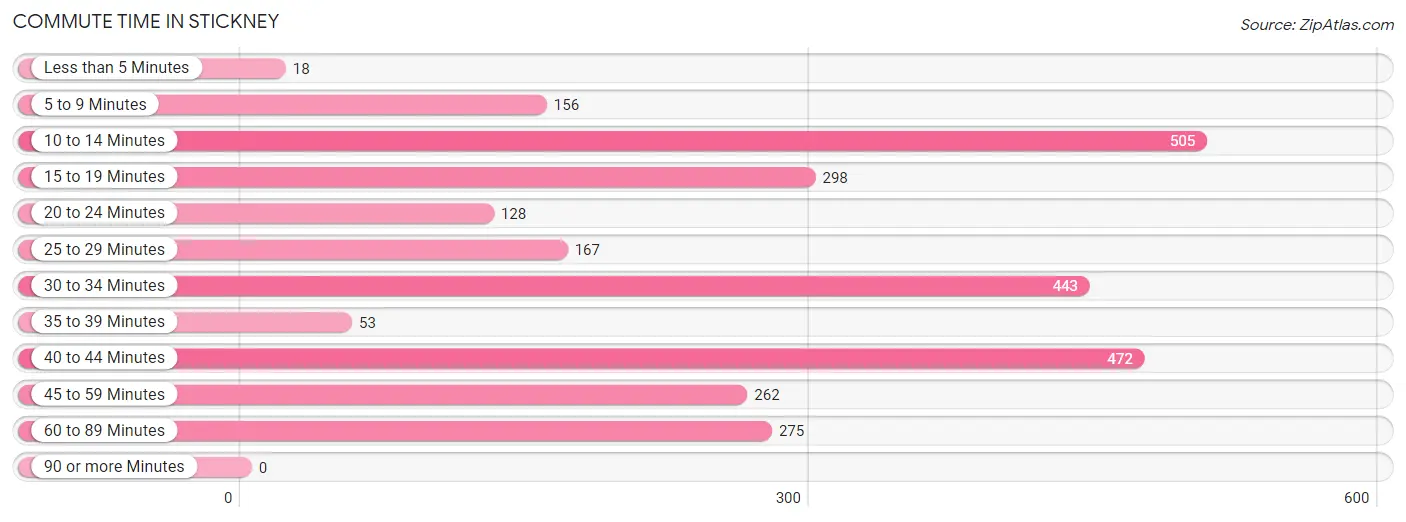
| Commute Time | # Commuters | % Commuters |
| Less than 5 Minutes | 18 | 0.6% |
| 5 to 9 Minutes | 156 | 5.6% |
| 10 to 14 Minutes | 505 | 18.2% |
| 15 to 19 Minutes | 298 | 10.7% |
| 20 to 24 Minutes | 128 | 4.6% |
| 25 to 29 Minutes | 167 | 6.0% |
| 30 to 34 Minutes | 443 | 16.0% |
| 35 to 39 Minutes | 53 | 1.9% |
| 40 to 44 Minutes | 472 | 17.0% |
| 45 to 59 Minutes | 262 | 9.4% |
| 60 to 89 Minutes | 275 | 9.9% |
| 90 or more Minutes | 0 | 0.0% |
Commute Time by Sex in Stickney
The most common commute times in Stickney are 40 to 44 minutes (419 commuters, 22.2%) for males and 10 to 14 minutes (219 commuters, 24.7%) for females.
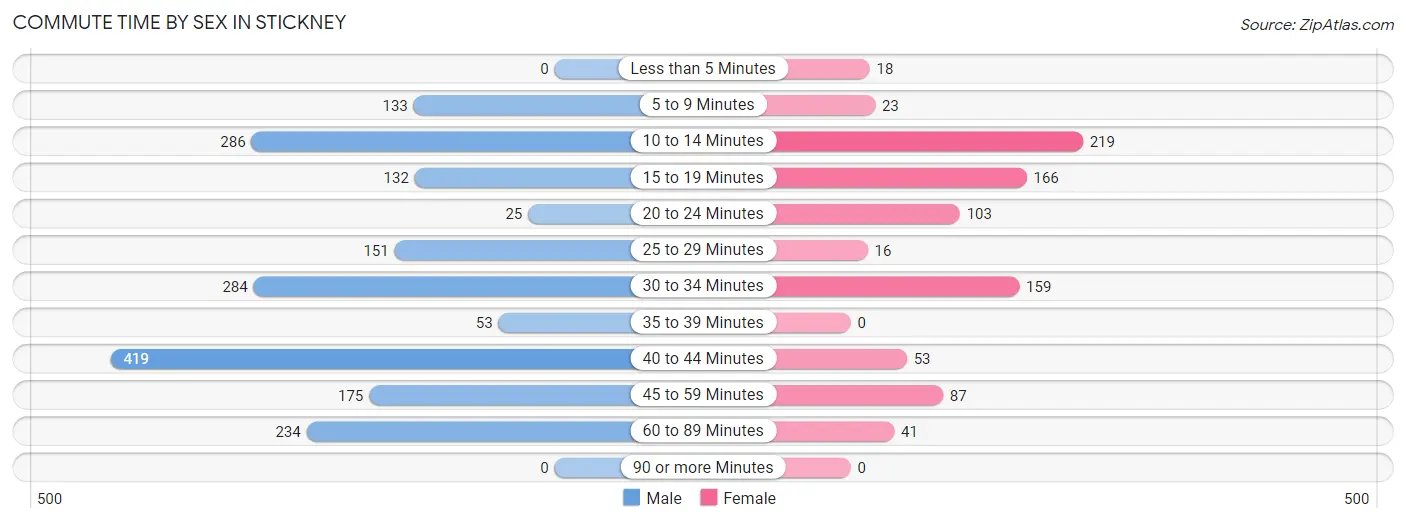
| Commute Time | Male | Female |
| Less than 5 Minutes | 0 (0.0%) | 18 (2.0%) |
| 5 to 9 Minutes | 133 (7.0%) | 23 (2.6%) |
| 10 to 14 Minutes | 286 (15.1%) | 219 (24.7%) |
| 15 to 19 Minutes | 132 (7.0%) | 166 (18.8%) |
| 20 to 24 Minutes | 25 (1.3%) | 103 (11.6%) |
| 25 to 29 Minutes | 151 (8.0%) | 16 (1.8%) |
| 30 to 34 Minutes | 284 (15.0%) | 159 (18.0%) |
| 35 to 39 Minutes | 53 (2.8%) | 0 (0.0%) |
| 40 to 44 Minutes | 419 (22.2%) | 53 (6.0%) |
| 45 to 59 Minutes | 175 (9.2%) | 87 (9.8%) |
| 60 to 89 Minutes | 234 (12.4%) | 41 (4.6%) |
| 90 or more Minutes | 0 (0.0%) | 0 (0.0%) |
Time of Departure to Work by Sex in Stickney
The most frequent times of departure to work in Stickney are 5:30 AM to 5:59 AM (430, 22.7%) for males and 12:00 PM to 3:59 PM (195, 22.0%) for females.
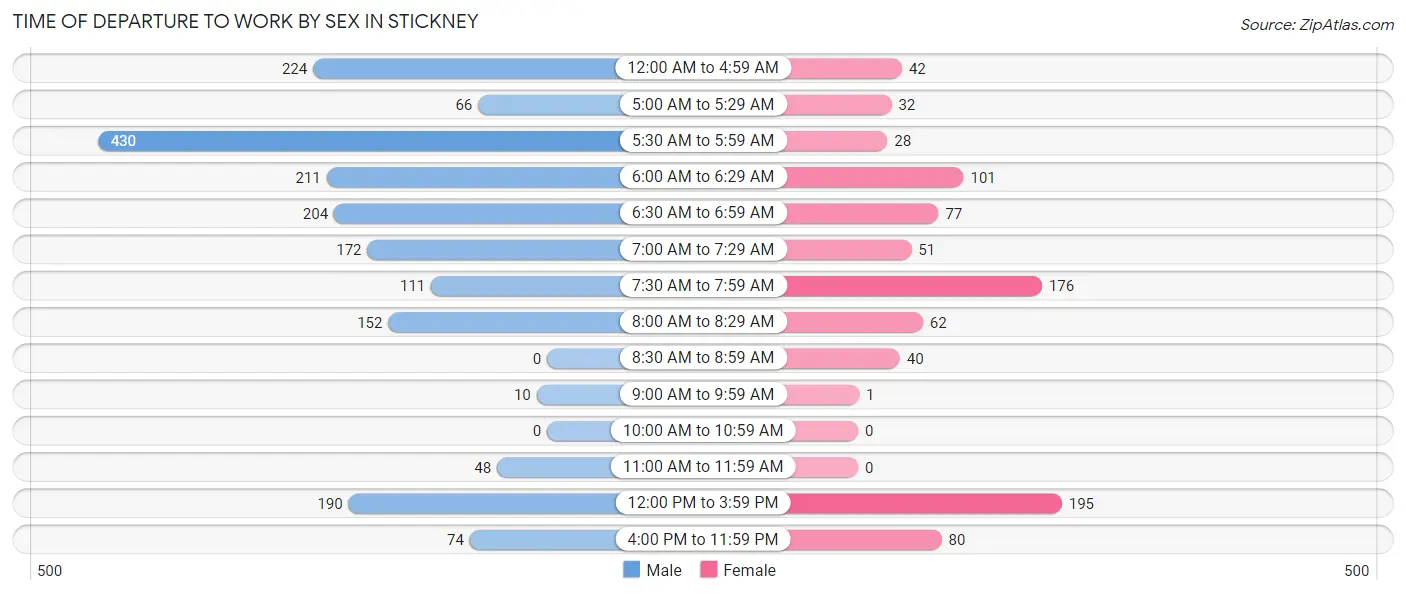
| Time of Departure | Male | Female |
| 12:00 AM to 4:59 AM | 224 (11.8%) | 42 (4.8%) |
| 5:00 AM to 5:29 AM | 66 (3.5%) | 32 (3.6%) |
| 5:30 AM to 5:59 AM | 430 (22.7%) | 28 (3.2%) |
| 6:00 AM to 6:29 AM | 211 (11.2%) | 101 (11.4%) |
| 6:30 AM to 6:59 AM | 204 (10.8%) | 77 (8.7%) |
| 7:00 AM to 7:29 AM | 172 (9.1%) | 51 (5.8%) |
| 7:30 AM to 7:59 AM | 111 (5.9%) | 176 (19.9%) |
| 8:00 AM to 8:29 AM | 152 (8.0%) | 62 (7.0%) |
| 8:30 AM to 8:59 AM | 0 (0.0%) | 40 (4.5%) |
| 9:00 AM to 9:59 AM | 10 (0.5%) | 1 (0.1%) |
| 10:00 AM to 10:59 AM | 0 (0.0%) | 0 (0.0%) |
| 11:00 AM to 11:59 AM | 48 (2.5%) | 0 (0.0%) |
| 12:00 PM to 3:59 PM | 190 (10.0%) | 195 (22.0%) |
| 4:00 PM to 11:59 PM | 74 (3.9%) | 80 (9.0%) |
| Total | 1,892 (100.0%) | 885 (100.0%) |
Housing Occupancy in Stickney
Occupancy by Ownership in Stickney
Of the total 2,392 dwellings in Stickney, owner-occupied units account for 2,095 (87.6%), while renter-occupied units make up 297 (12.4%).
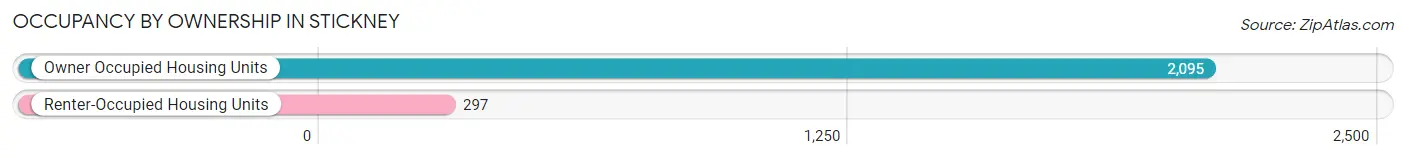
| Occupancy | # Housing Units | % Housing Units |
| Owner Occupied Housing Units | 2,095 | 87.6% |
| Renter-Occupied Housing Units | 297 | 12.4% |
| Total Occupied Housing Units | 2,392 | 100.0% |
Occupancy by Household Size in Stickney
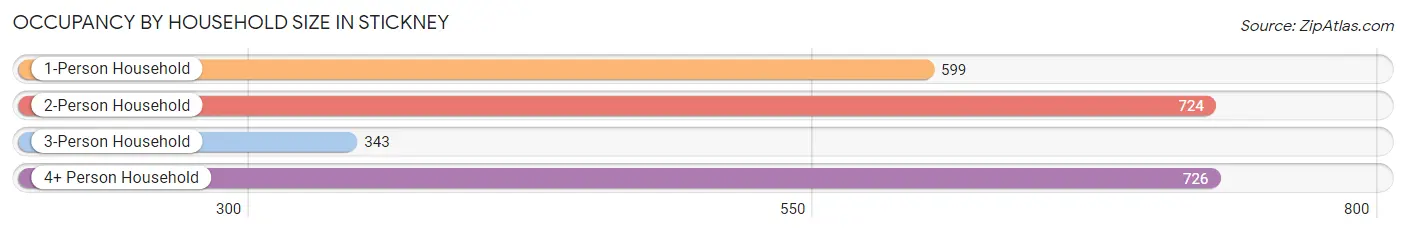
| Household Size | # Housing Units | % Housing Units |
| 1-Person Household | 599 | 25.0% |
| 2-Person Household | 724 | 30.3% |
| 3-Person Household | 343 | 14.3% |
| 4+ Person Household | 726 | 30.3% |
| Total Housing Units | 2,392 | 100.0% |
Occupancy by Ownership by Household Size in Stickney
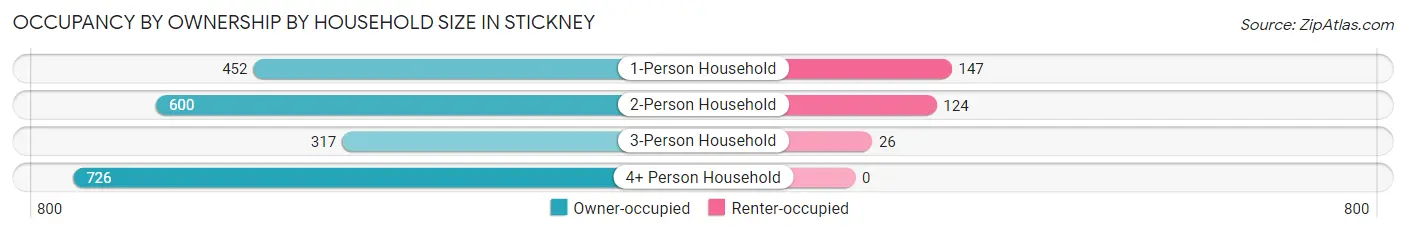
| Household Size | Owner-occupied | Renter-occupied |
| 1-Person Household | 452 (75.5%) | 147 (24.5%) |
| 2-Person Household | 600 (82.9%) | 124 (17.1%) |
| 3-Person Household | 317 (92.4%) | 26 (7.6%) |
| 4+ Person Household | 726 (100.0%) | 0 (0.0%) |
| Total Housing Units | 2,095 (87.6%) | 297 (12.4%) |
Occupancy by Educational Attainment in Stickney
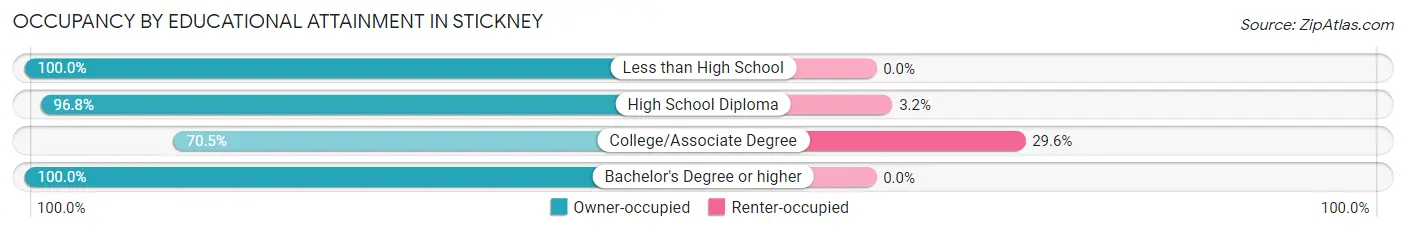
| Household Size | Owner-occupied | Renter-occupied |
| Less than High School | 214 (100.0%) | 0 (0.0%) |
| High School Diploma | 791 (96.8%) | 26 (3.2%) |
| College/Associate Degree | 646 (70.5%) | 271 (29.5%) |
| Bachelor's Degree or higher | 444 (100.0%) | 0 (0.0%) |
Occupancy by Age of Householder in Stickney
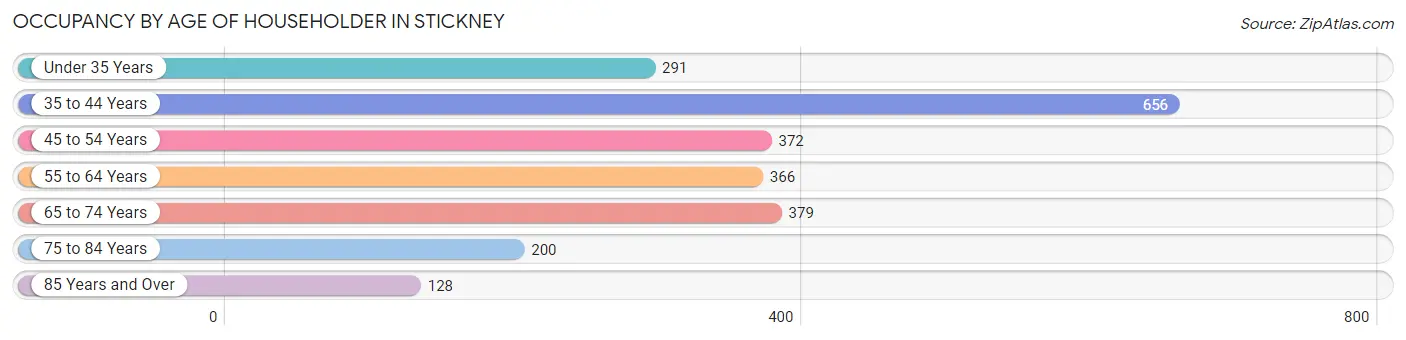
| Age Bracket | # Households | % Households |
| Under 35 Years | 291 | 12.2% |
| 35 to 44 Years | 656 | 27.4% |
| 45 to 54 Years | 372 | 15.5% |
| 55 to 64 Years | 366 | 15.3% |
| 65 to 74 Years | 379 | 15.8% |
| 75 to 84 Years | 200 | 8.4% |
| 85 Years and Over | 128 | 5.3% |
| Total | 2,392 | 100.0% |
Housing Finances in Stickney
Median Income by Occupancy in Stickney
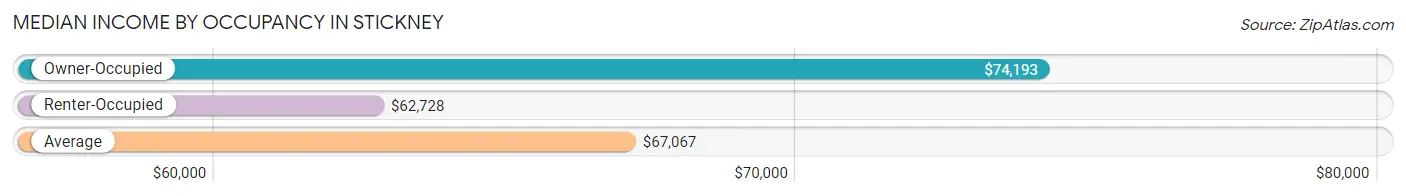
| Occupancy Type | # Households | Median Income |
| Owner-Occupied | 2,095 (87.6%) | $74,193 |
| Renter-Occupied | 297 (12.4%) | $62,728 |
| Average | 2,392 (100.0%) | $67,067 |
Occupancy by Householder Income Bracket in Stickney
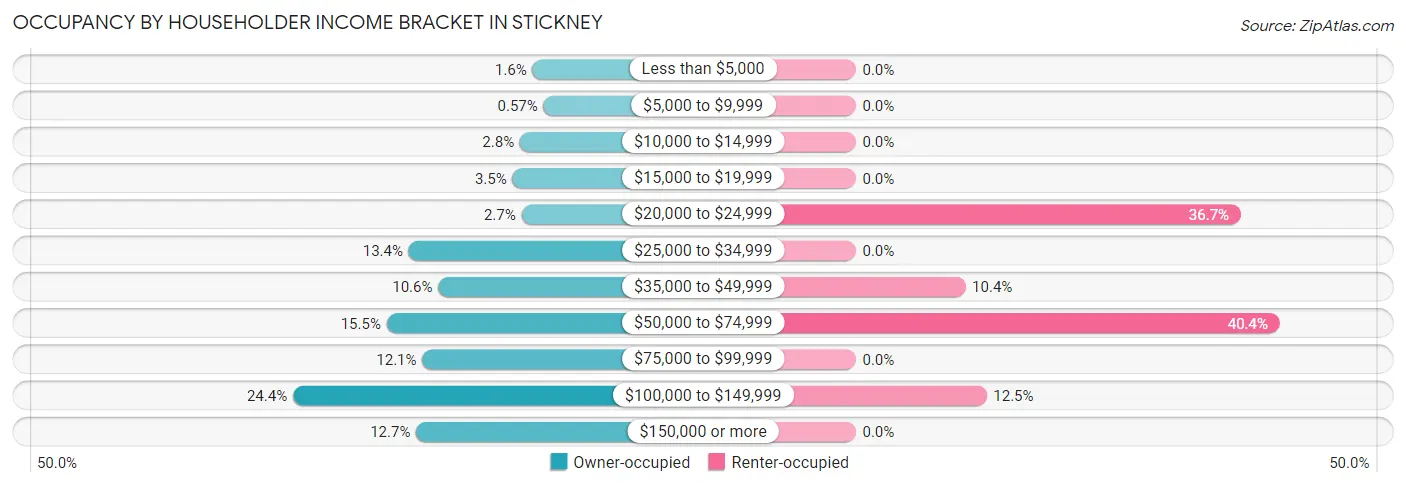
| Income Bracket | Owner-occupied | Renter-occupied |
| Less than $5,000 | 34 (1.6%) | 0 (0.0%) |
| $5,000 to $9,999 | 12 (0.6%) | 0 (0.0%) |
| $10,000 to $14,999 | 59 (2.8%) | 0 (0.0%) |
| $15,000 to $19,999 | 74 (3.5%) | 0 (0.0%) |
| $20,000 to $24,999 | 56 (2.7%) | 109 (36.7%) |
| $25,000 to $34,999 | 281 (13.4%) | 0 (0.0%) |
| $35,000 to $49,999 | 222 (10.6%) | 31 (10.4%) |
| $50,000 to $74,999 | 325 (15.5%) | 120 (40.4%) |
| $75,000 to $99,999 | 254 (12.1%) | 0 (0.0%) |
| $100,000 to $149,999 | 512 (24.4%) | 37 (12.5%) |
| $150,000 or more | 266 (12.7%) | 0 (0.0%) |
| Total | 2,095 (100.0%) | 297 (100.0%) |
Monthly Housing Cost Tiers in Stickney
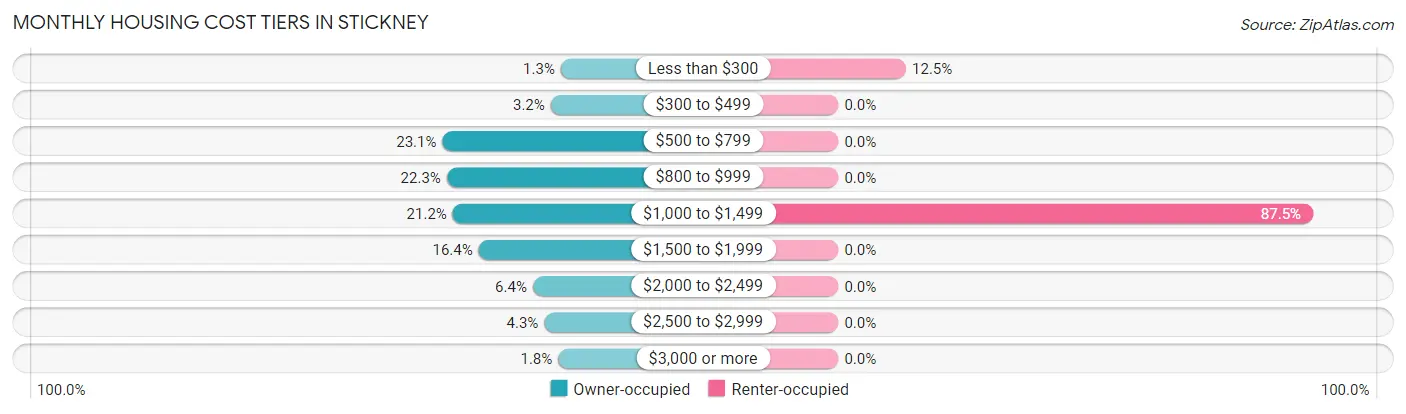
| Monthly Cost | Owner-occupied | Renter-occupied |
| Less than $300 | 27 (1.3%) | 37 (12.5%) |
| $300 to $499 | 66 (3.2%) | 0 (0.0%) |
| $500 to $799 | 484 (23.1%) | 0 (0.0%) |
| $800 to $999 | 467 (22.3%) | 0 (0.0%) |
| $1,000 to $1,499 | 444 (21.2%) | 260 (87.5%) |
| $1,500 to $1,999 | 344 (16.4%) | 0 (0.0%) |
| $2,000 to $2,499 | 135 (6.4%) | 0 (0.0%) |
| $2,500 to $2,999 | 91 (4.3%) | 0 (0.0%) |
| $3,000 or more | 37 (1.8%) | 0 (0.0%) |
| Total | 2,095 (100.0%) | 297 (100.0%) |
Physical Housing Characteristics in Stickney
Housing Structures in Stickney
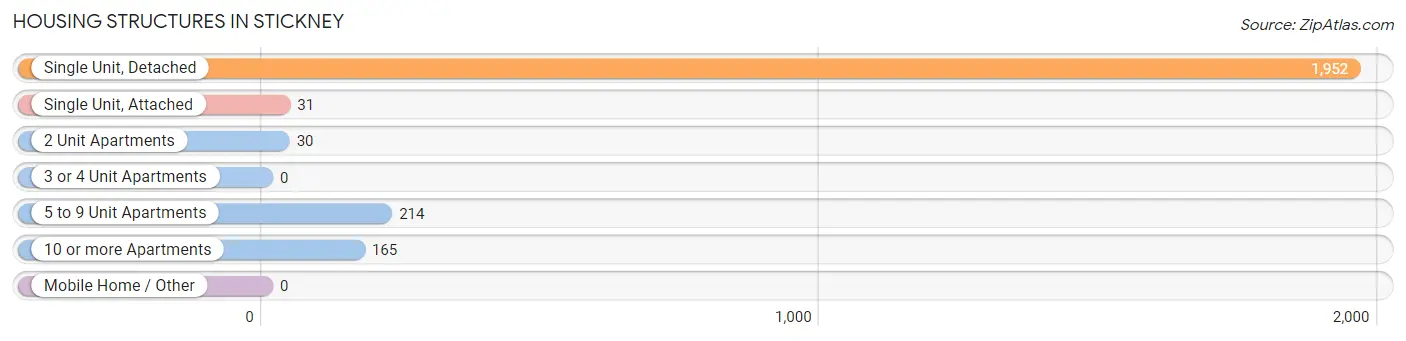
| Structure Type | # Housing Units | % Housing Units |
| Single Unit, Detached | 1,952 | 81.6% |
| Single Unit, Attached | 31 | 1.3% |
| 2 Unit Apartments | 30 | 1.3% |
| 3 or 4 Unit Apartments | 0 | 0.0% |
| 5 to 9 Unit Apartments | 214 | 8.9% |
| 10 or more Apartments | 165 | 6.9% |
| Mobile Home / Other | 0 | 0.0% |
| Total | 2,392 | 100.0% |
Housing Structures by Occupancy in Stickney
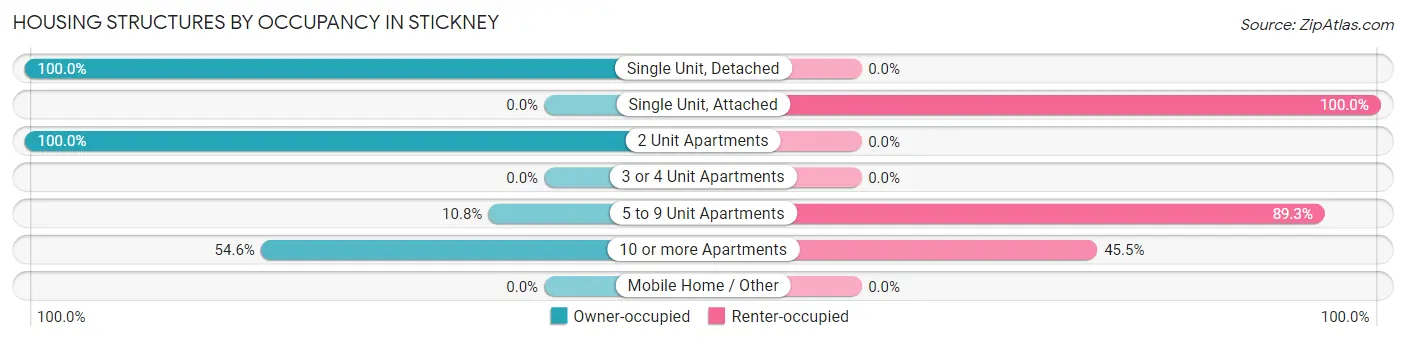
| Structure Type | Owner-occupied | Renter-occupied |
| Single Unit, Detached | 1,952 (100.0%) | 0 (0.0%) |
| Single Unit, Attached | 0 (0.0%) | 31 (100.0%) |
| 2 Unit Apartments | 30 (100.0%) | 0 (0.0%) |
| 3 or 4 Unit Apartments | 0 (0.0%) | 0 (0.0%) |
| 5 to 9 Unit Apartments | 23 (10.7%) | 191 (89.2%) |
| 10 or more Apartments | 90 (54.5%) | 75 (45.5%) |
| Mobile Home / Other | 0 (0.0%) | 0 (0.0%) |
| Total | 2,095 (87.6%) | 297 (12.4%) |
Housing Structures by Number of Rooms in Stickney
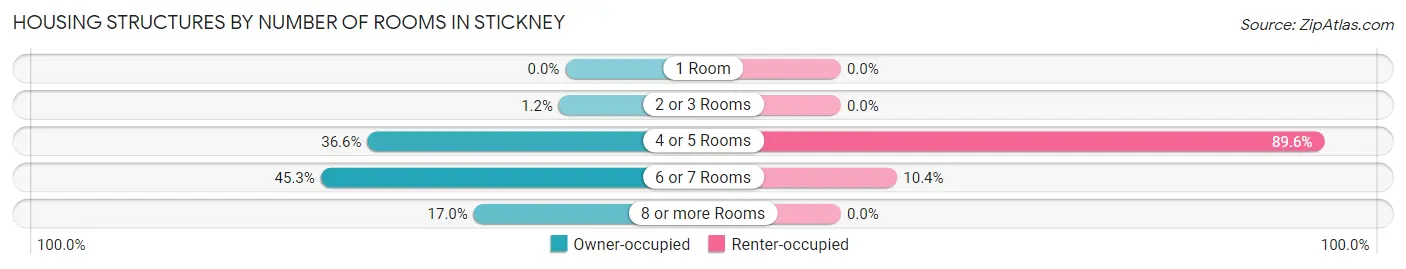
| Number of Rooms | Owner-occupied | Renter-occupied |
| 1 Room | 0 (0.0%) | 0 (0.0%) |
| 2 or 3 Rooms | 25 (1.2%) | 0 (0.0%) |
| 4 or 5 Rooms | 767 (36.6%) | 266 (89.6%) |
| 6 or 7 Rooms | 948 (45.3%) | 31 (10.4%) |
| 8 or more Rooms | 355 (17.0%) | 0 (0.0%) |
| Total | 2,095 (100.0%) | 297 (100.0%) |
Housing Structure by Heating Type in Stickney
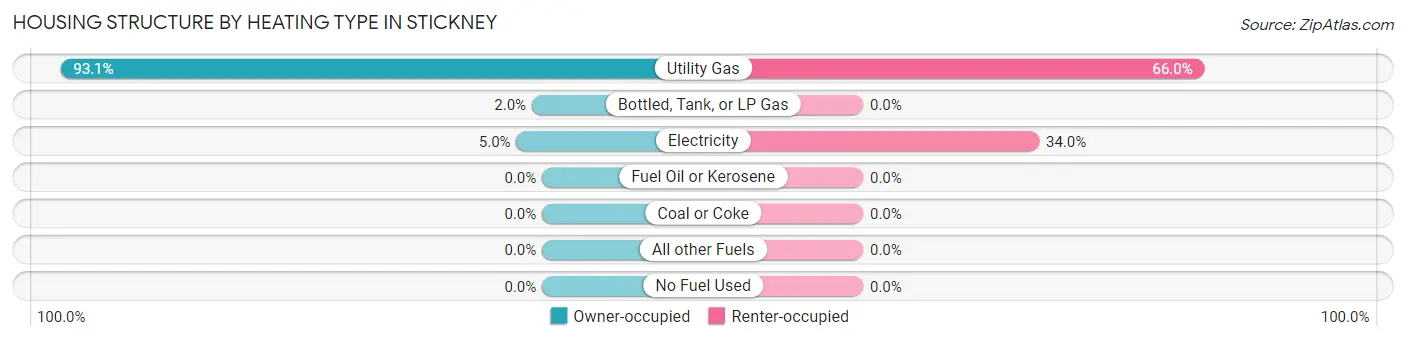
| Heating Type | Owner-occupied | Renter-occupied |
| Utility Gas | 1,950 (93.1%) | 196 (66.0%) |
| Bottled, Tank, or LP Gas | 41 (2.0%) | 0 (0.0%) |
| Electricity | 104 (5.0%) | 101 (34.0%) |
| Fuel Oil or Kerosene | 0 (0.0%) | 0 (0.0%) |
| Coal or Coke | 0 (0.0%) | 0 (0.0%) |
| All other Fuels | 0 (0.0%) | 0 (0.0%) |
| No Fuel Used | 0 (0.0%) | 0 (0.0%) |
| Total | 2,095 (100.0%) | 297 (100.0%) |
Household Vehicle Usage in Stickney
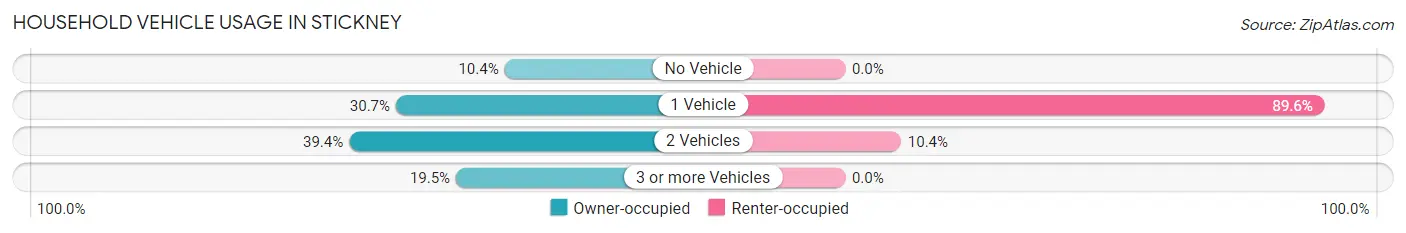
| Vehicles per Household | Owner-occupied | Renter-occupied |
| No Vehicle | 218 (10.4%) | 0 (0.0%) |
| 1 Vehicle | 643 (30.7%) | 266 (89.6%) |
| 2 Vehicles | 826 (39.4%) | 31 (10.4%) |
| 3 or more Vehicles | 408 (19.5%) | 0 (0.0%) |
| Total | 2,095 (100.0%) | 297 (100.0%) |
Real Estate & Mortgages in Stickney
Real Estate and Mortgage Overview in Stickney
| Characteristic | Without Mortgage | With Mortgage |
| Housing Units | 1,078 | 1,017 |
| Median Property Value | $203,900 | $231,600 |
| Median Household Income | $37,500 | $183 |
| Monthly Housing Costs | $788 | $37 |
| Real Estate Taxes | $4,933 | $0 |
Property Value by Mortgage Status in Stickney
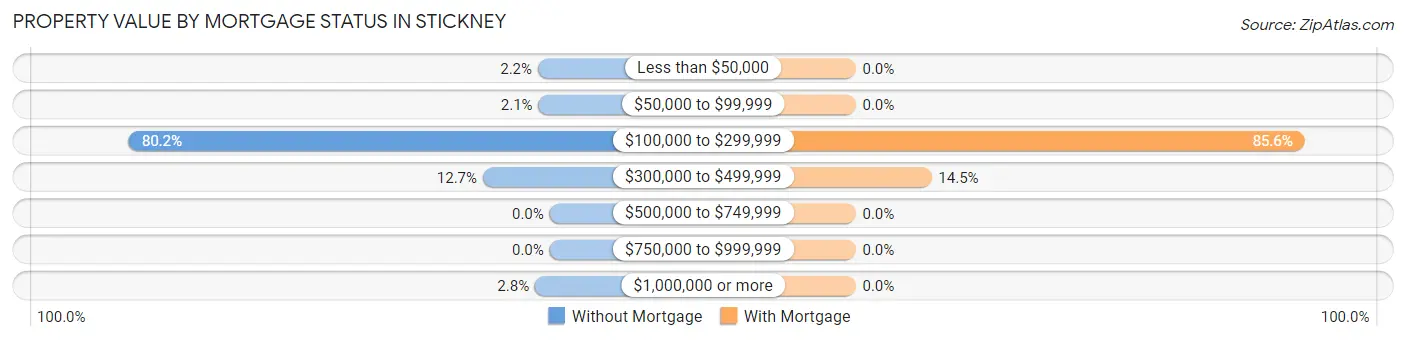
| Property Value | Without Mortgage | With Mortgage |
| Less than $50,000 | 24 (2.2%) | 0 (0.0%) |
| $50,000 to $99,999 | 23 (2.1%) | 0 (0.0%) |
| $100,000 to $299,999 | 864 (80.1%) | 870 (85.6%) |
| $300,000 to $499,999 | 137 (12.7%) | 147 (14.4%) |
| $500,000 to $749,999 | 0 (0.0%) | 0 (0.0%) |
| $750,000 to $999,999 | 0 (0.0%) | 0 (0.0%) |
| $1,000,000 or more | 30 (2.8%) | 0 (0.0%) |
| Total | 1,078 (100.0%) | 1,017 (100.0%) |
Household Income by Mortgage Status in Stickney
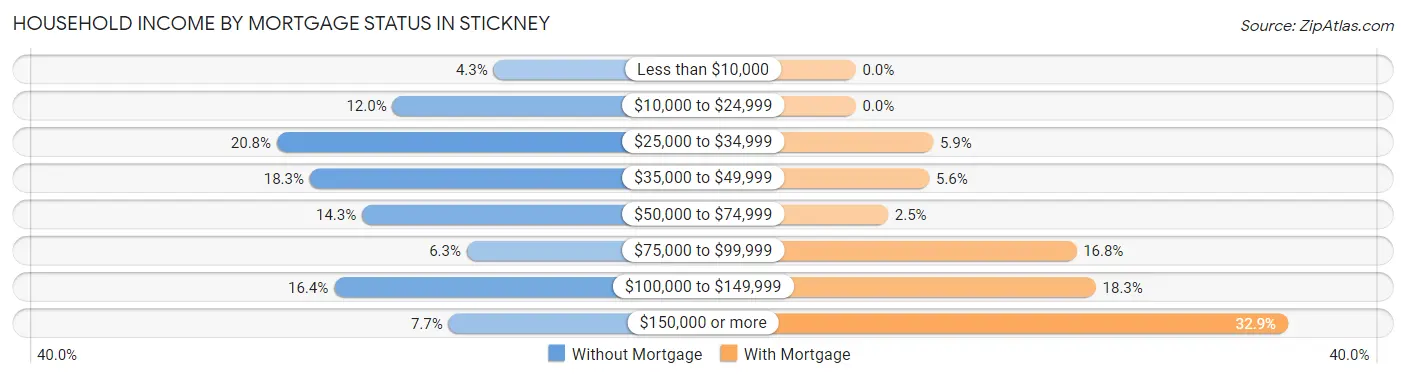
| Household Income | Without Mortgage | With Mortgage |
| Less than $10,000 | 46 (4.3%) | 0 (0.0%) |
| $10,000 to $24,999 | 129 (12.0%) | 0 (0.0%) |
| $25,000 to $34,999 | 224 (20.8%) | 60 (5.9%) |
| $35,000 to $49,999 | 197 (18.3%) | 57 (5.6%) |
| $50,000 to $74,999 | 154 (14.3%) | 25 (2.5%) |
| $75,000 to $99,999 | 68 (6.3%) | 171 (16.8%) |
| $100,000 to $149,999 | 177 (16.4%) | 186 (18.3%) |
| $150,000 or more | 83 (7.7%) | 335 (32.9%) |
| Total | 1,078 (100.0%) | 1,017 (100.0%) |
Property Value to Household Income Ratio in Stickney
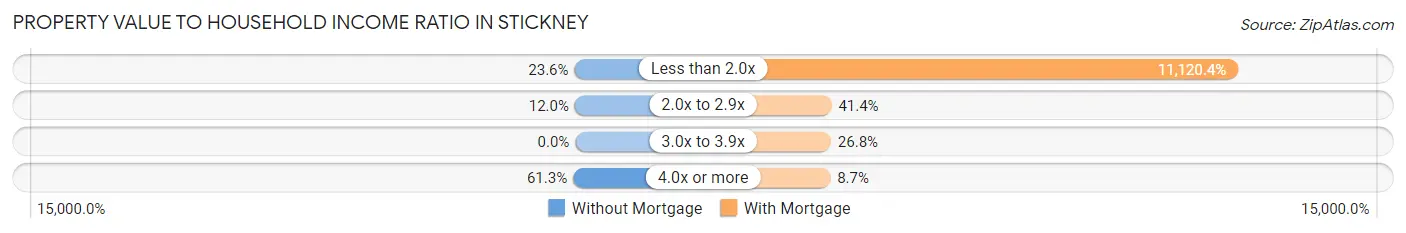
| Value-to-Income Ratio | Without Mortgage | With Mortgage |
| Less than 2.0x | 254 (23.6%) | 113,094 (11,120.4%) |
| 2.0x to 2.9x | 129 (12.0%) | 421 (41.4%) |
| 3.0x to 3.9x | 0 (0.0%) | 272 (26.8%) |
| 4.0x or more | 661 (61.3%) | 88 (8.6%) |
| Total | 1,078 (100.0%) | 1,017 (100.0%) |
Real Estate Taxes by Mortgage Status in Stickney
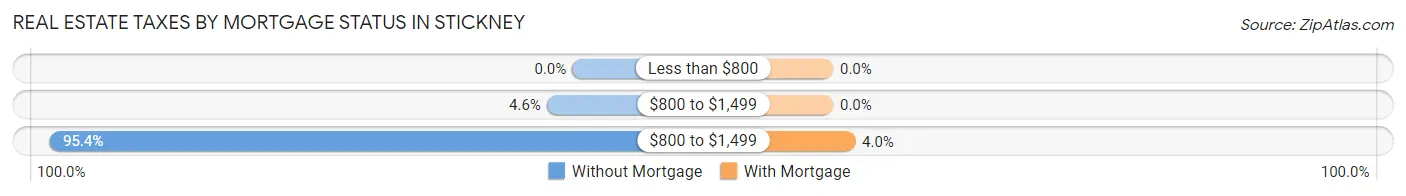
| Property Taxes | Without Mortgage | With Mortgage |
| Less than $800 | 0 (0.0%) | 0 (0.0%) |
| $800 to $1,499 | 50 (4.6%) | 0 (0.0%) |
| $800 to $1,499 | 1,028 (95.4%) | 41 (4.0%) |
| Total | 1,078 (100.0%) | 1,017 (100.0%) |
Health & Disability in Stickney
Health Insurance Coverage by Age in Stickney
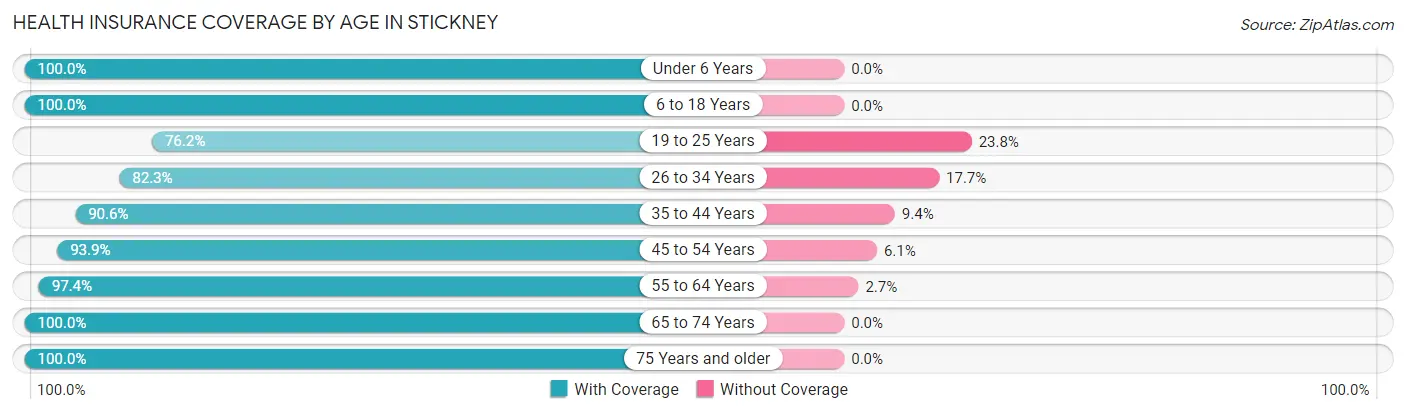
| Age Bracket | With Coverage | Without Coverage |
| Under 6 Years | 410 (100.0%) | 0 (0.0%) |
| 6 to 18 Years | 1,408 (100.0%) | 0 (0.0%) |
| 19 to 25 Years | 462 (76.2%) | 144 (23.8%) |
| 26 to 34 Years | 503 (82.3%) | 108 (17.7%) |
| 35 to 44 Years | 1,141 (90.6%) | 119 (9.4%) |
| 45 to 54 Years | 740 (93.9%) | 48 (6.1%) |
| 55 to 64 Years | 771 (97.4%) | 21 (2.6%) |
| 65 to 74 Years | 646 (100.0%) | 0 (0.0%) |
| 75 Years and older | 466 (100.0%) | 0 (0.0%) |
| Total | 6,547 (93.7%) | 440 (6.3%) |
Health Insurance Coverage by Citizenship Status in Stickney
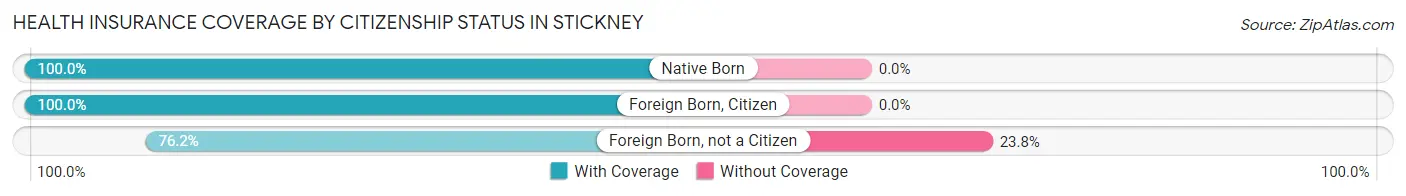
| Citizenship Status | With Coverage | Without Coverage |
| Native Born | 410 (100.0%) | 0 (0.0%) |
| Foreign Born, Citizen | 1,408 (100.0%) | 0 (0.0%) |
| Foreign Born, not a Citizen | 462 (76.2%) | 144 (23.8%) |
Health Insurance Coverage by Household Income in Stickney
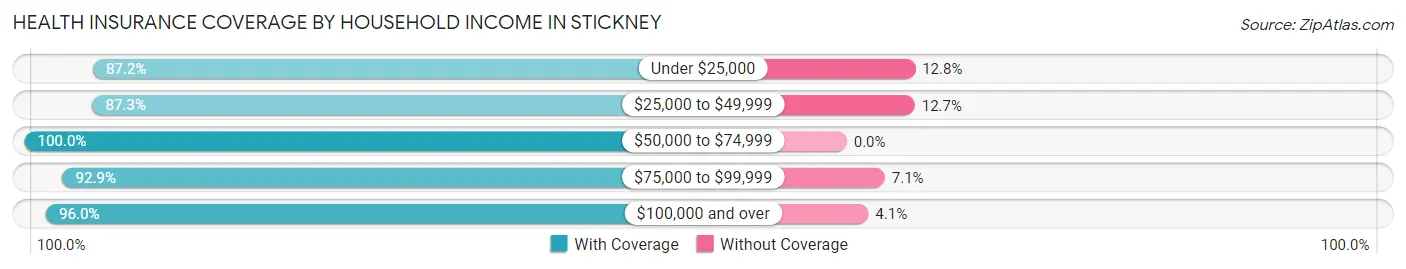
| Household Income | With Coverage | Without Coverage |
| Under $25,000 | 415 (87.2%) | 61 (12.8%) |
| $25,000 to $49,999 | 1,391 (87.3%) | 203 (12.7%) |
| $50,000 to $74,999 | 1,150 (100.0%) | 0 (0.0%) |
| $75,000 to $99,999 | 716 (92.9%) | 55 (7.1%) |
| $100,000 and over | 2,869 (96.0%) | 121 (4.1%) |
Public vs Private Health Insurance Coverage by Age in Stickney
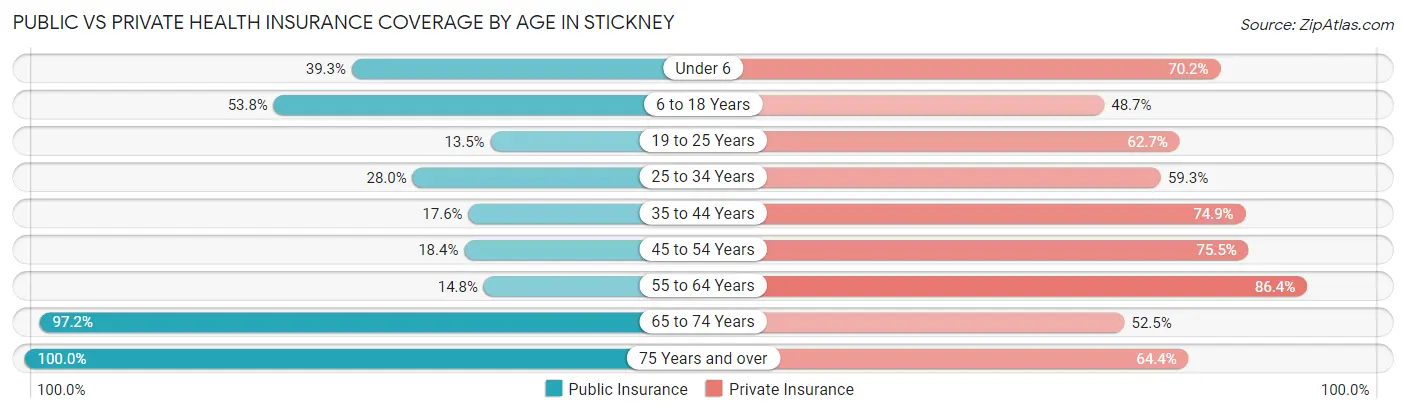
| Age Bracket | Public Insurance | Private Insurance |
| Under 6 | 161 (39.3%) | 288 (70.2%) |
| 6 to 18 Years | 757 (53.8%) | 686 (48.7%) |
| 19 to 25 Years | 82 (13.5%) | 380 (62.7%) |
| 25 to 34 Years | 171 (28.0%) | 362 (59.3%) |
| 35 to 44 Years | 222 (17.6%) | 944 (74.9%) |
| 45 to 54 Years | 145 (18.4%) | 595 (75.5%) |
| 55 to 64 Years | 117 (14.8%) | 684 (86.4%) |
| 65 to 74 Years | 628 (97.2%) | 339 (52.5%) |
| 75 Years and over | 466 (100.0%) | 300 (64.4%) |
| Total | 2,749 (39.3%) | 4,578 (65.5%) |
Disability Status by Sex by Age in Stickney
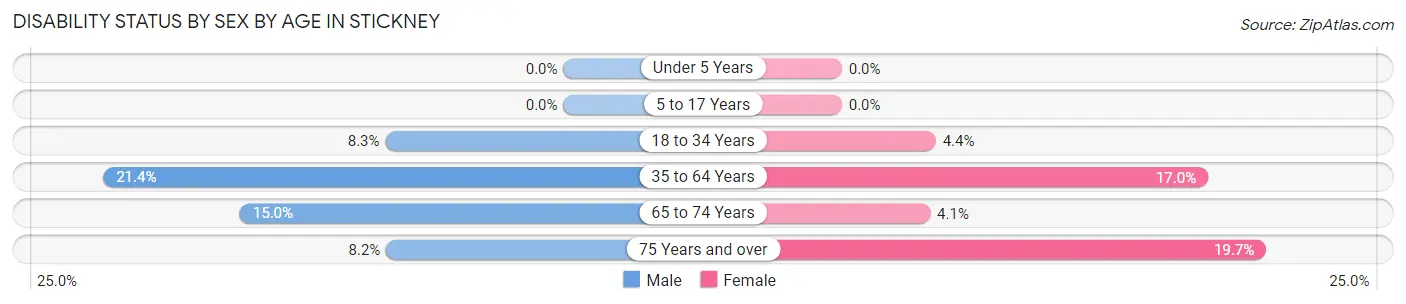
| Age Bracket | Male | Female |
| Under 5 Years | 0 (0.0%) | 0 (0.0%) |
| 5 to 17 Years | 0 (0.0%) | 0 (0.0%) |
| 18 to 34 Years | 55 (8.3%) | 24 (4.4%) |
| 35 to 64 Years | 355 (21.3%) | 200 (17.0%) |
| 65 to 74 Years | 53 (15.0%) | 12 (4.1%) |
| 75 Years and over | 12 (8.2%) | 63 (19.7%) |
Disability Class by Sex by Age in Stickney
Disability Class: Hearing Difficulty
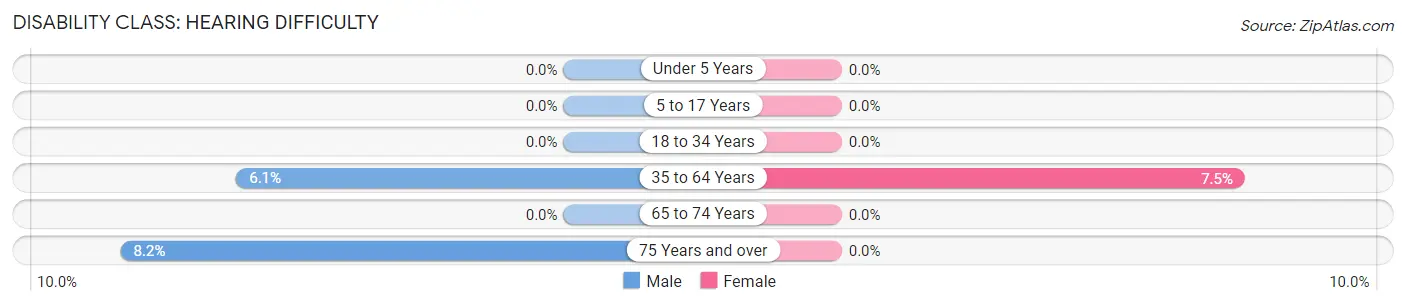
| Age Bracket | Male | Female |
| Under 5 Years | 0 (0.0%) | 0 (0.0%) |
| 5 to 17 Years | 0 (0.0%) | 0 (0.0%) |
| 18 to 34 Years | 0 (0.0%) | 0 (0.0%) |
| 35 to 64 Years | 101 (6.1%) | 88 (7.5%) |
| 65 to 74 Years | 0 (0.0%) | 0 (0.0%) |
| 75 Years and over | 12 (8.2%) | 0 (0.0%) |
Disability Class: Vision Difficulty
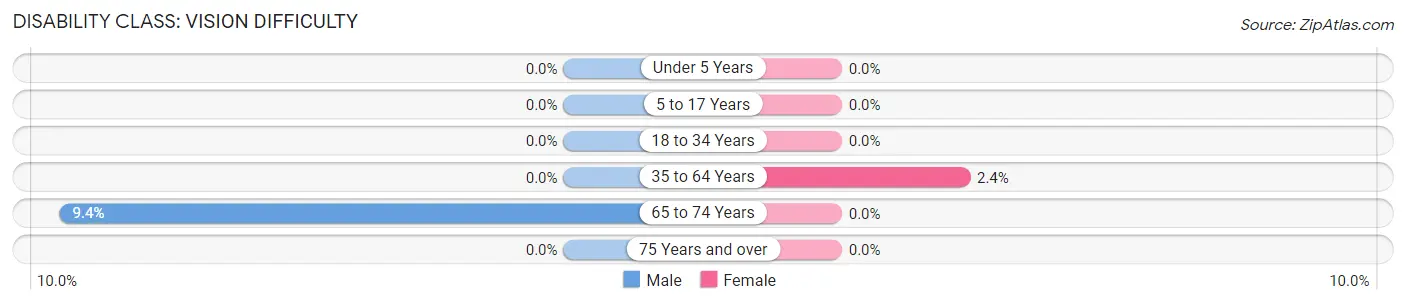
| Age Bracket | Male | Female |
| Under 5 Years | 0 (0.0%) | 0 (0.0%) |
| 5 to 17 Years | 0 (0.0%) | 0 (0.0%) |
| 18 to 34 Years | 0 (0.0%) | 0 (0.0%) |
| 35 to 64 Years | 0 (0.0%) | 28 (2.4%) |
| 65 to 74 Years | 33 (9.3%) | 0 (0.0%) |
| 75 Years and over | 0 (0.0%) | 0 (0.0%) |
Disability Class: Cognitive Difficulty
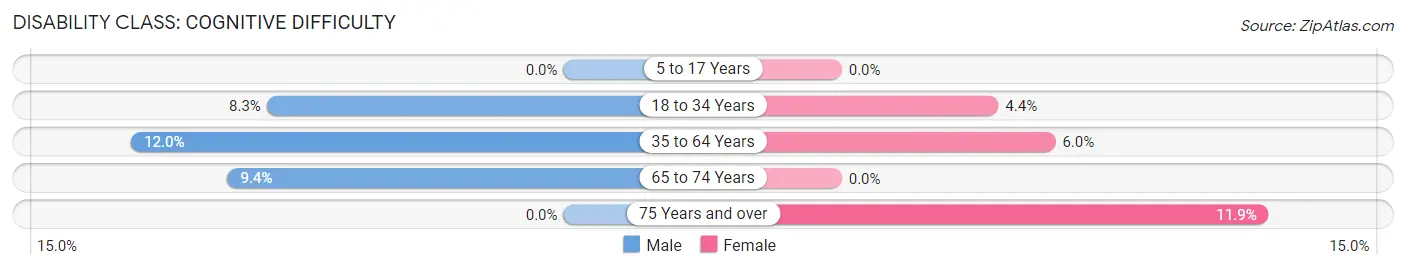
| Age Bracket | Male | Female |
| 5 to 17 Years | 0 (0.0%) | 0 (0.0%) |
| 18 to 34 Years | 55 (8.3%) | 24 (4.4%) |
| 35 to 64 Years | 200 (12.0%) | 70 (5.9%) |
| 65 to 74 Years | 33 (9.3%) | 0 (0.0%) |
| 75 Years and over | 0 (0.0%) | 38 (11.9%) |
Disability Class: Ambulatory Difficulty
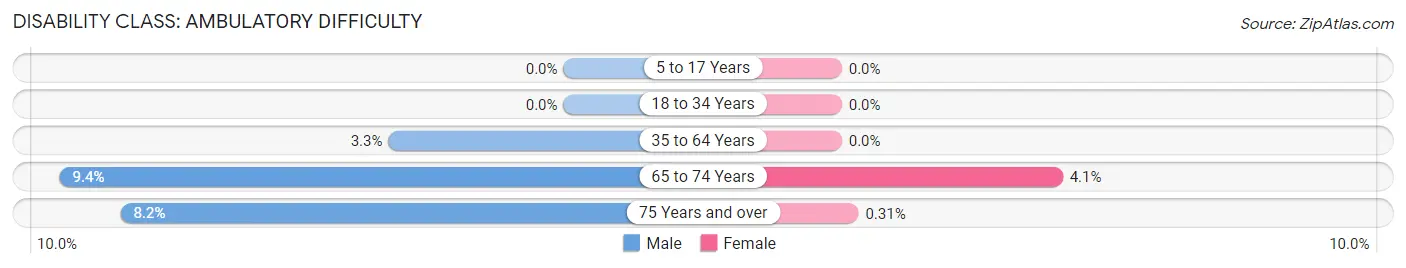
| Age Bracket | Male | Female |
| 5 to 17 Years | 0 (0.0%) | 0 (0.0%) |
| 18 to 34 Years | 0 (0.0%) | 0 (0.0%) |
| 35 to 64 Years | 54 (3.3%) | 0 (0.0%) |
| 65 to 74 Years | 33 (9.3%) | 12 (4.1%) |
| 75 Years and over | 12 (8.2%) | 1 (0.3%) |
Disability Class: Self-Care Difficulty
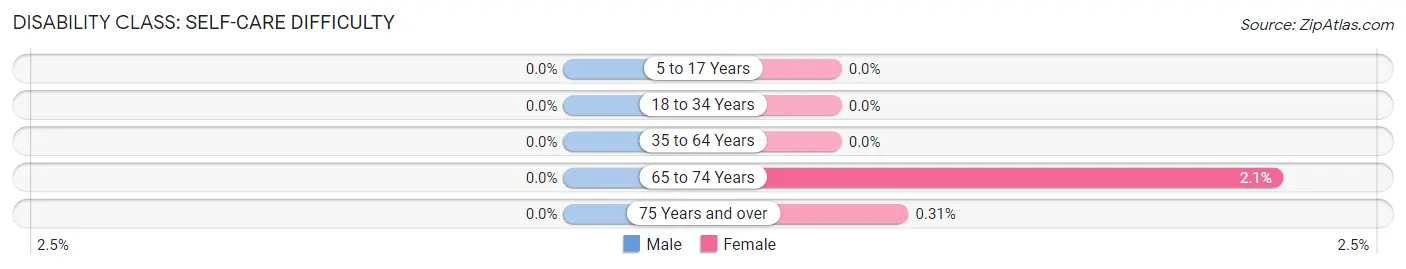
| Age Bracket | Male | Female |
| 5 to 17 Years | 0 (0.0%) | 0 (0.0%) |
| 18 to 34 Years | 0 (0.0%) | 0 (0.0%) |
| 35 to 64 Years | 0 (0.0%) | 0 (0.0%) |
| 65 to 74 Years | 0 (0.0%) | 6 (2.1%) |
| 75 Years and over | 0 (0.0%) | 1 (0.3%) |
Technology Access in Stickney
Computing Device Access in Stickney
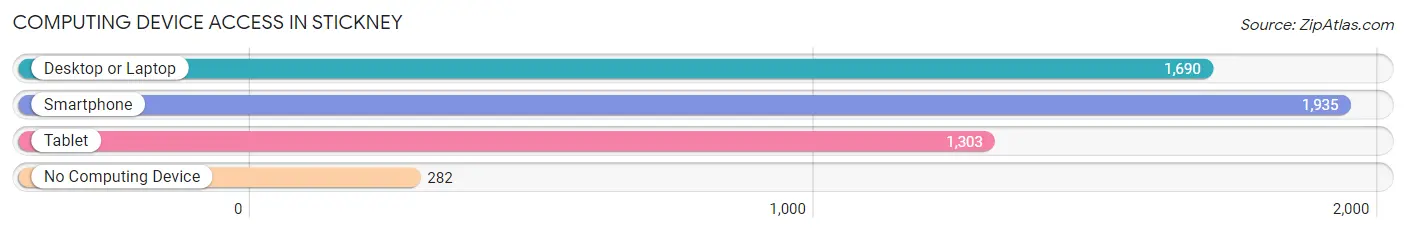
| Device Type | # Households | % Households |
| Desktop or Laptop | 1,690 | 70.7% |
| Smartphone | 1,935 | 80.9% |
| Tablet | 1,303 | 54.5% |
| No Computing Device | 282 | 11.8% |
| Total | 2,392 | 100.0% |
Internet Access in Stickney
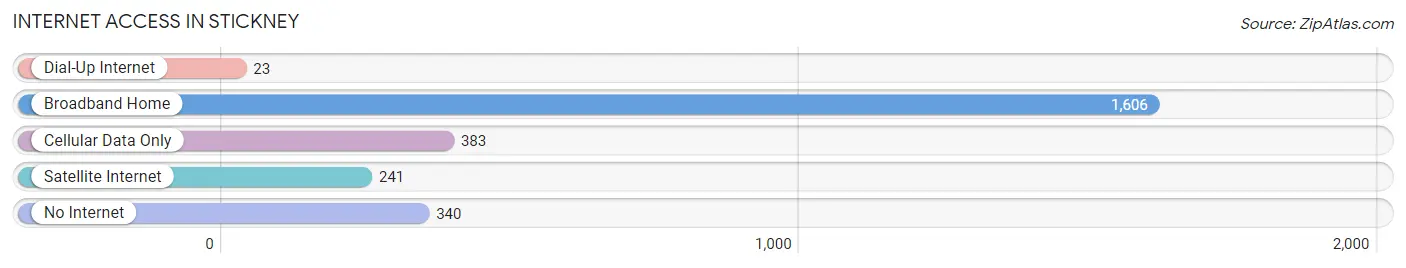
| Internet Type | # Households | % Households |
| Dial-Up Internet | 23 | 1.0% |
| Broadband Home | 1,606 | 67.1% |
| Cellular Data Only | 383 | 16.0% |
| Satellite Internet | 241 | 10.1% |
| No Internet | 340 | 14.2% |
| Total | 2,392 | 100.0% |
Stickney Summary
Stickney is a village located in Cook County, Illinois, United States. It is a suburb of Chicago, located approximately 13 miles southwest of the city's Loop. As of the 2010 census, the village had a population of 8,561.
History
Stickney was first settled in 1835 by a group of German immigrants led by John Stickney. The village was incorporated in 1892 and was named after Stickney. The village was originally a farming community, but it soon developed into a manufacturing center. The village was home to several factories, including the Stickney Brick Company, which was the largest brick manufacturer in the world at the time.
Geography
Stickney is located at 41°48'17" North, 87°45'17" West (41.804722, -87.754722). According to the 2010 census, the village has a total area of 2.2 square miles, all of it land.
Economy
Stickney's economy is largely based on manufacturing and retail. The village is home to several factories, including the Stickney Brick Company, which is the largest brick manufacturer in the world. The village is also home to several retail stores, including a Walmart Supercenter.
Demographics
As of the 2010 census, there were 8,561 people, 3,093 households, and 2,092 families residing in the village. The population density was 3,890.2 people per square mile. The racial makeup of the village was 79.2% White, 4.2% African American, 0.3% Native American, 4.2% Asian, 0.1% Pacific Islander, 9.2% from other races, and 2.9% from two or more races. Hispanic or Latino of any race were 22.2% of the population.
The median income for a household in the village was $50,945, and the median income for a family was $60,945. The per capita income for the village was $22,945. About 8.2% of families and 10.2% of the population were below the poverty line, including 14.2% of those under age 18 and 6.2% of those age 65 or over.
Common Questions
What is Per Capita Income in Stickney?
Per Capita income in Stickney is $30,078.
What is the Median Family Income in Stickney?
Median Family Income in Stickney is $79,657.
What is the Median Household income in Stickney?
Median Household Income in Stickney is $67,067.
What is Income or Wage Gap in Stickney?
Income or Wage Gap in Stickney is 35.4%.
Women in Stickney earn 64.6 cents for every dollar earned by a man.
What is Inequality or Gini Index in Stickney?
Inequality or Gini Index in Stickney is 0.38.
What is the Total Population of Stickney?
Total Population of Stickney is 7,031.
What is the Total Male Population of Stickney?
Total Male Population of Stickney is 3,818.
What is the Total Female Population of Stickney?
Total Female Population of Stickney is 3,213.
What is the Ratio of Males per 100 Females in Stickney?
There are 118.83 Males per 100 Females in Stickney.
What is the Ratio of Females per 100 Males in Stickney?
There are 84.15 Females per 100 Males in Stickney.
What is the Median Population Age in Stickney?
Median Population Age in Stickney is 38.7 Years.
What is the Average Family Size in Stickney
Average Family Size in Stickney is 3.6 People.
What is the Average Household Size in Stickney
Average Household Size in Stickney is 2.9 People.
How Large is the Labor Force in Stickney?
There are 3,241 People in the Labor Forcein in Stickney.
What is the Percentage of People in the Labor Force in Stickney?
59.0% of People are in the Labor Force in Stickney.
What is the Unemployment Rate in Stickney?
Unemployment Rate in Stickney is 4.6%.