Grand Detour, IL Map & Demographics
Grand Detour Map
Grand Detour Overview
$43,585
PER CAPITA INCOME
$121,484
AVG FAMILY INCOME
$71,953
AVG HOUSEHOLD INCOME
0.41
INEQUALITY / GINI INDEX
302
TOTAL POPULATION
187
MALE POPULATION
115
FEMALE POPULATION
162.61
MALES / 100 FEMALES
61.50
FEMALES / 100 MALES
49.4
MEDIAN AGE
2.6
AVG FAMILY SIZE
2.0
AVG HOUSEHOLD SIZE
174
LABOR FORCE [ PEOPLE ]
60.4%
PERCENT IN LABOR FORCE
16.7%
UNEMPLOYMENT RATE
Income in Grand Detour
Income Overview in Grand Detour
Per Capita Income in Grand Detour is $43,585, while median incomes of families and households are $121,484 and $71,953 respectively.
| Characteristic | Number | Measure |
| Per Capita Income | 302 | $43,585 |
| Median Family Income | 99 | $121,484 |
| Mean Family Income | 99 | $123,734 |
| Median Household Income | 148 | $71,953 |
| Mean Household Income | 148 | $89,489 |
| Income Deficit | 99 | $0 |
| Wage / Income Gap (%) | 302 | 0.00% |
| Wage / Income Gap ($) | 302 | 100.00¢ per $1 |
| Gini / Inequality Index | 302 | 0.41 |
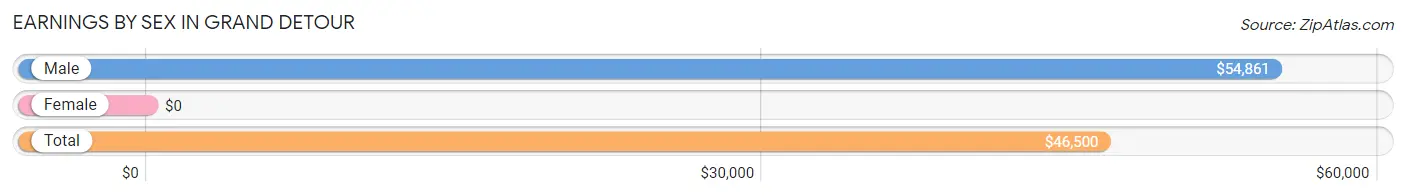
Earnings by Sex in Grand Detour
| Sex | Number | Average Earnings |
| Male | 131 (77.1%) | $54,861 |
| Female | 39 (22.9%) | $0 |
| Total | 170 (100.0%) | $46,500 |
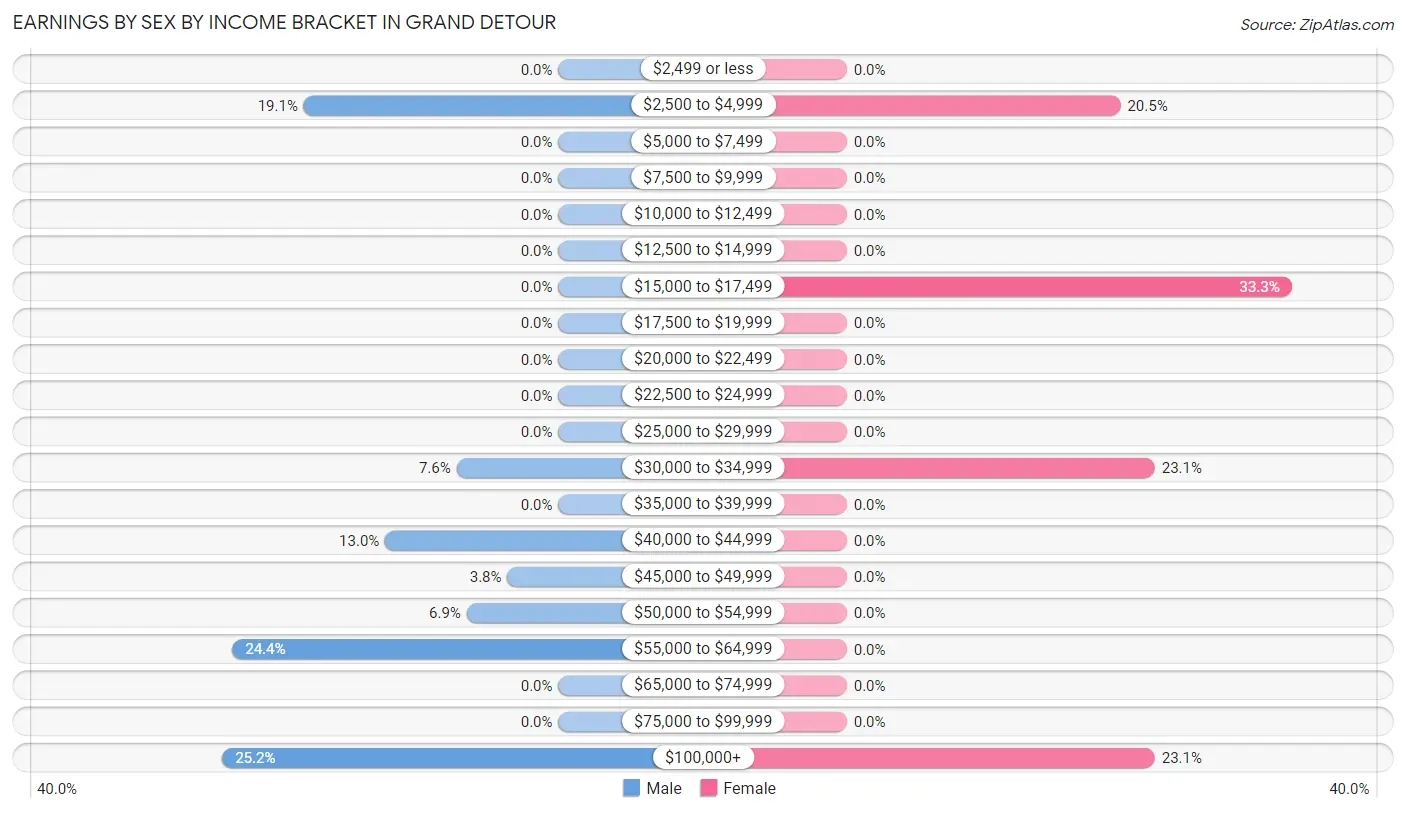
Earnings by Sex by Income Bracket in Grand Detour
The most common earnings brackets in Grand Detour are $100,000+ for men (33 | 25.2%) and $15,000 to $17,499 for women (13 | 33.3%).
| Income | Male | Female |
| $2,499 or less | 0 (0.0%) | 0 (0.0%) |
| $2,500 to $4,999 | 25 (19.1%) | 8 (20.5%) |
| $5,000 to $7,499 | 0 (0.0%) | 0 (0.0%) |
| $7,500 to $9,999 | 0 (0.0%) | 0 (0.0%) |
| $10,000 to $12,499 | 0 (0.0%) | 0 (0.0%) |
| $12,500 to $14,999 | 0 (0.0%) | 0 (0.0%) |
| $15,000 to $17,499 | 0 (0.0%) | 13 (33.3%) |
| $17,500 to $19,999 | 0 (0.0%) | 0 (0.0%) |
| $20,000 to $22,499 | 0 (0.0%) | 0 (0.0%) |
| $22,500 to $24,999 | 0 (0.0%) | 0 (0.0%) |
| $25,000 to $29,999 | 0 (0.0%) | 0 (0.0%) |
| $30,000 to $34,999 | 10 (7.6%) | 9 (23.1%) |
| $35,000 to $39,999 | 0 (0.0%) | 0 (0.0%) |
| $40,000 to $44,999 | 17 (13.0%) | 0 (0.0%) |
| $45,000 to $49,999 | 5 (3.8%) | 0 (0.0%) |
| $50,000 to $54,999 | 9 (6.9%) | 0 (0.0%) |
| $55,000 to $64,999 | 32 (24.4%) | 0 (0.0%) |
| $65,000 to $74,999 | 0 (0.0%) | 0 (0.0%) |
| $75,000 to $99,999 | 0 (0.0%) | 0 (0.0%) |
| $100,000+ | 33 (25.2%) | 9 (23.1%) |
| Total | 131 (100.0%) | 39 (100.0%) |
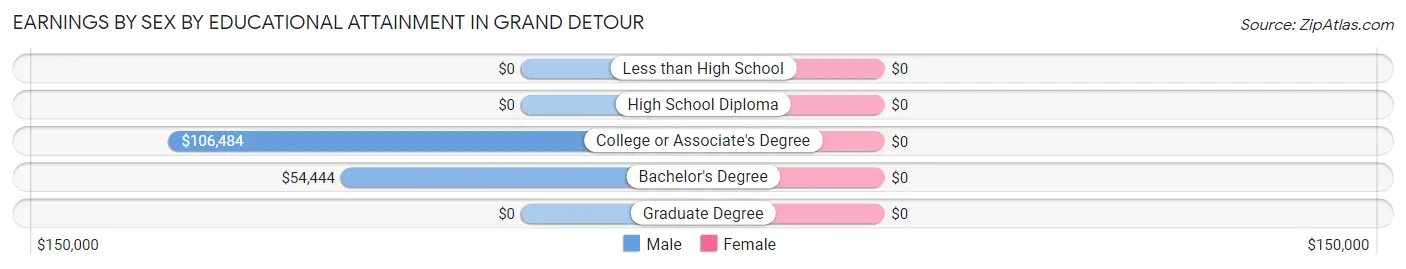
Earnings by Sex by Educational Attainment in Grand Detour
| Educational Attainment | Male Income | Female Income |
| Less than High School | - | - |
| High School Diploma | - | - |
| College or Associate's Degree | $106,484 | $0 |
| Bachelor's Degree | $54,444 | $0 |
| Graduate Degree | - | - |
| Total | $58,086 | $0 |
Family Income in Grand Detour
Family Income Brackets in Grand Detour
According to the Grand Detour family income data, there are 42 families falling into the $100,000 to $149,999 income range, which is the most common income bracket and makes up 42.4% of all families.
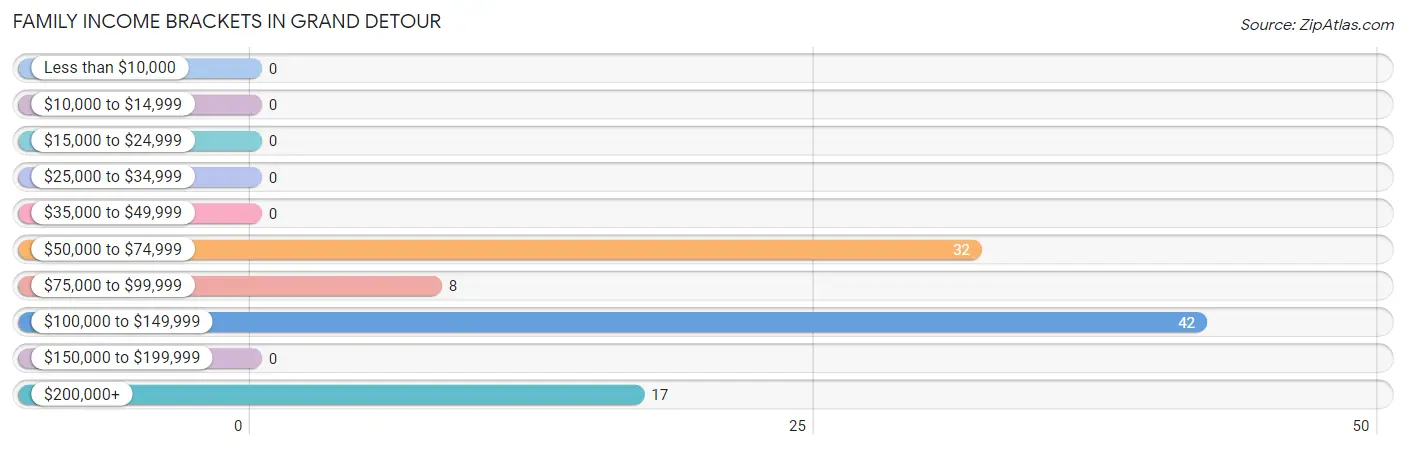
| Income Bracket | # Families | % Families |
| Less than $10,000 | 0 | 0.0% |
| $10,000 to $14,999 | 0 | 0.0% |
| $15,000 to $24,999 | 0 | 0.0% |
| $25,000 to $34,999 | 0 | 0.0% |
| $35,000 to $49,999 | 0 | 0.0% |
| $50,000 to $74,999 | 32 | 32.3% |
| $75,000 to $99,999 | 8 | 8.1% |
| $100,000 to $149,999 | 42 | 42.4% |
| $150,000 to $199,999 | 0 | 0.0% |
| $200,000+ | 17 | 17.2% |
Family Income by Famaliy Size in Grand Detour
2-person families (41 | 41.4%) account for the highest median family income in Grand Detour with $141,406 per family, while 2-person families (41 | 41.4%) have the highest median income of $70,703 per family member.
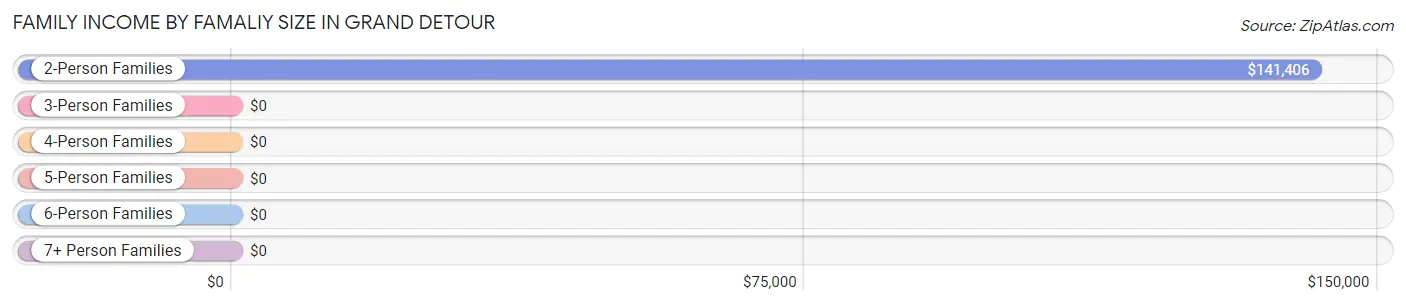
| Income Bracket | # Families | Median Income |
| 2-Person Families | 41 (41.4%) | $141,406 |
| 3-Person Families | 26 (26.3%) | $0 |
| 4-Person Families | 32 (32.3%) | $0 |
| 5-Person Families | 0 (0.0%) | $0 |
| 6-Person Families | 0 (0.0%) | $0 |
| 7+ Person Families | 0 (0.0%) | $0 |
| Total | 99 (100.0%) | $121,484 |
Family Income by Number of Earners in Grand Detour
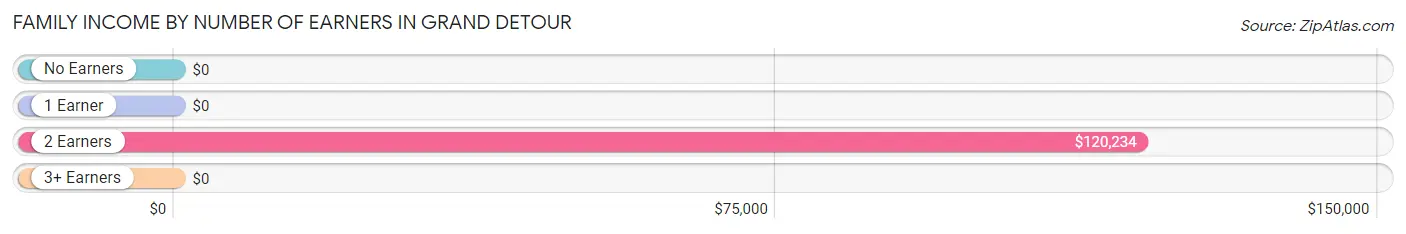
| Number of Earners | # Families | Median Income |
| No Earners | 0 (0.0%) | $0 |
| 1 Earner | 16 (16.2%) | $0 |
| 2 Earners | 83 (83.8%) | $120,234 |
| 3+ Earners | 0 (0.0%) | $0 |
| Total | 99 (100.0%) | $121,484 |
Household Income in Grand Detour
Household Income Brackets in Grand Detour
With 42 households falling in the category, the $100,000 to $149,999 income range is the most frequent in Grand Detour, accounting for 28.4% of all households.
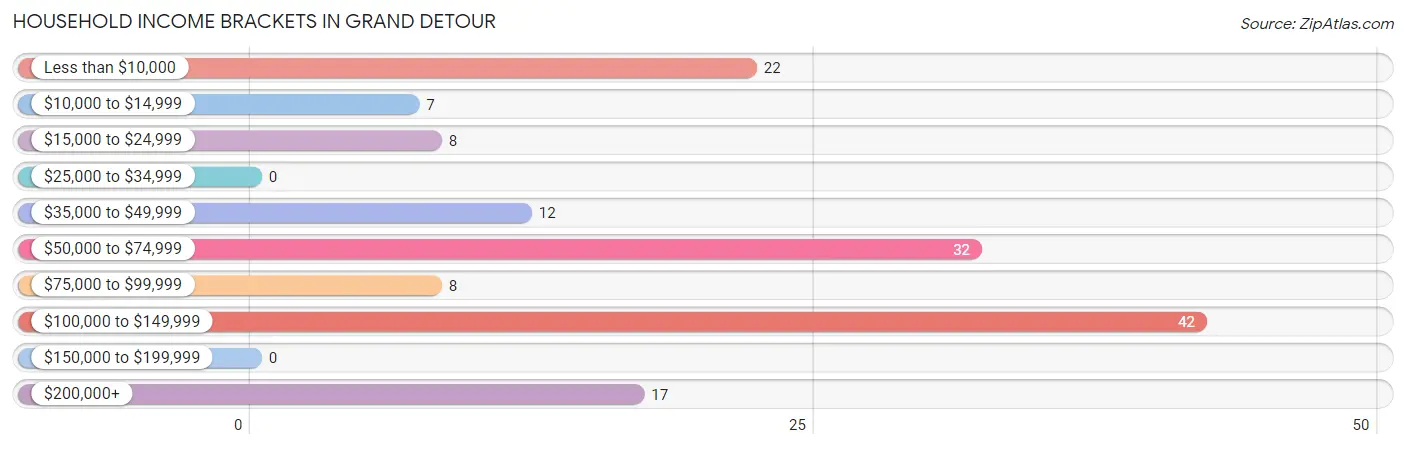
| Income Bracket | # Households | % Households |
| Less than $10,000 | 22 | 14.9% |
| $10,000 to $14,999 | 7 | 4.7% |
| $15,000 to $24,999 | 8 | 5.4% |
| $25,000 to $34,999 | 0 | 0.0% |
| $35,000 to $49,999 | 12 | 8.1% |
| $50,000 to $74,999 | 32 | 21.6% |
| $75,000 to $99,999 | 8 | 5.4% |
| $100,000 to $149,999 | 42 | 28.4% |
| $150,000 to $199,999 | 0 | 0.0% |
| $200,000+ | 17 | 11.5% |
Household Income by Householder Age in Grand Detour
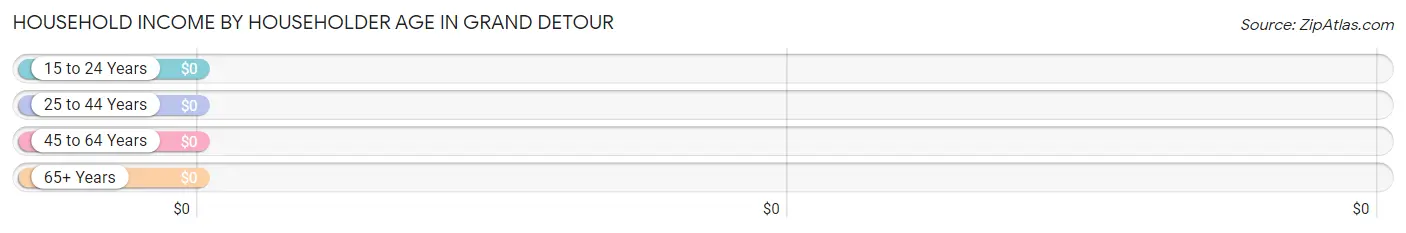
| Income Bracket | # Households | Median Income |
| 15 to 24 Years | 0 (0.0%) | $0 |
| 25 to 44 Years | 24 (16.2%) | $0 |
| 45 to 64 Years | 62 (41.9%) | $0 |
| 65+ Years | 62 (41.9%) | $0 |
| Total | 148 (100.0%) | $71,953 |
Poverty in Grand Detour
Income Below Poverty by Sex and Age in Grand Detour
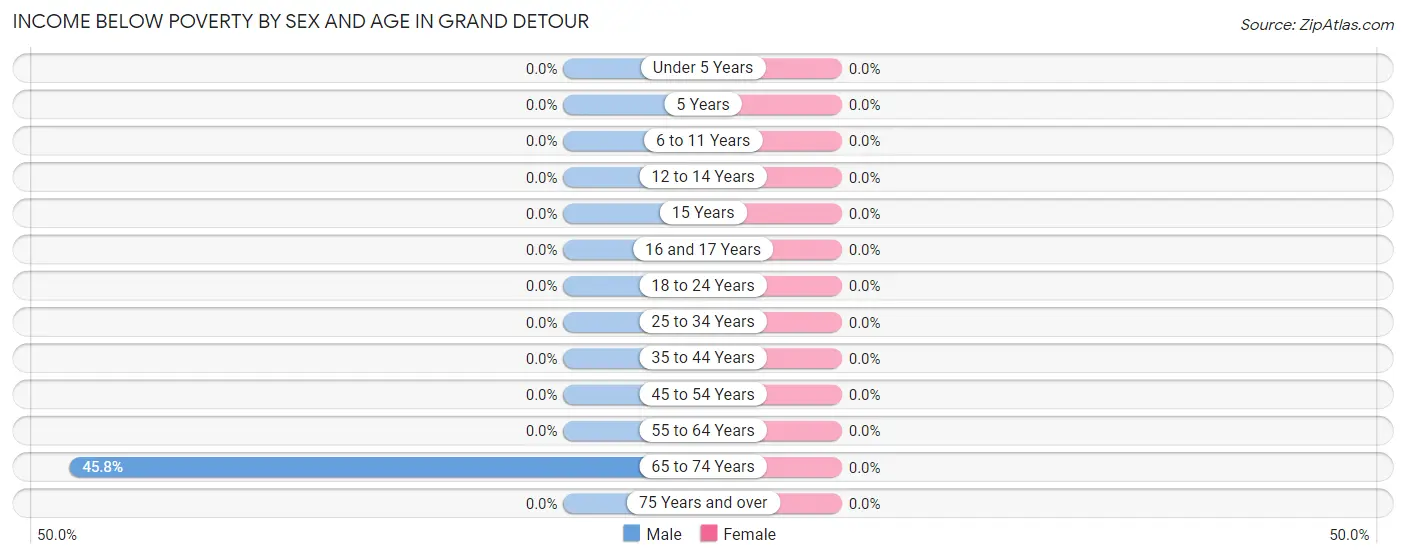
| Age Bracket | Male | Female |
| Under 5 Years | 0 (0.0%) | 0 (0.0%) |
| 5 Years | 0 (0.0%) | 0 (0.0%) |
| 6 to 11 Years | 0 (0.0%) | 0 (0.0%) |
| 12 to 14 Years | 0 (0.0%) | 0 (0.0%) |
| 15 Years | 0 (0.0%) | 0 (0.0%) |
| 16 and 17 Years | 0 (0.0%) | 0 (0.0%) |
| 18 to 24 Years | 0 (0.0%) | 0 (0.0%) |
| 25 to 34 Years | 0 (0.0%) | 0 (0.0%) |
| 35 to 44 Years | 0 (0.0%) | 0 (0.0%) |
| 45 to 54 Years | 0 (0.0%) | 0 (0.0%) |
| 55 to 64 Years | 0 (0.0%) | 0 (0.0%) |
| 65 to 74 Years | 22 (45.8%) | 0 (0.0%) |
| 75 Years and over | 0 (0.0%) | 0 (0.0%) |
| Total | 22 (11.8%) | 0 (0.0%) |
Income Above Poverty by Sex and Age in Grand Detour
According to the poverty statistics in Grand Detour, males aged 18 to 24 years and females aged 5 years are the age groups that are most secure financially, with 100.0% of males and 100.0% of females in these age groups living above the poverty line.
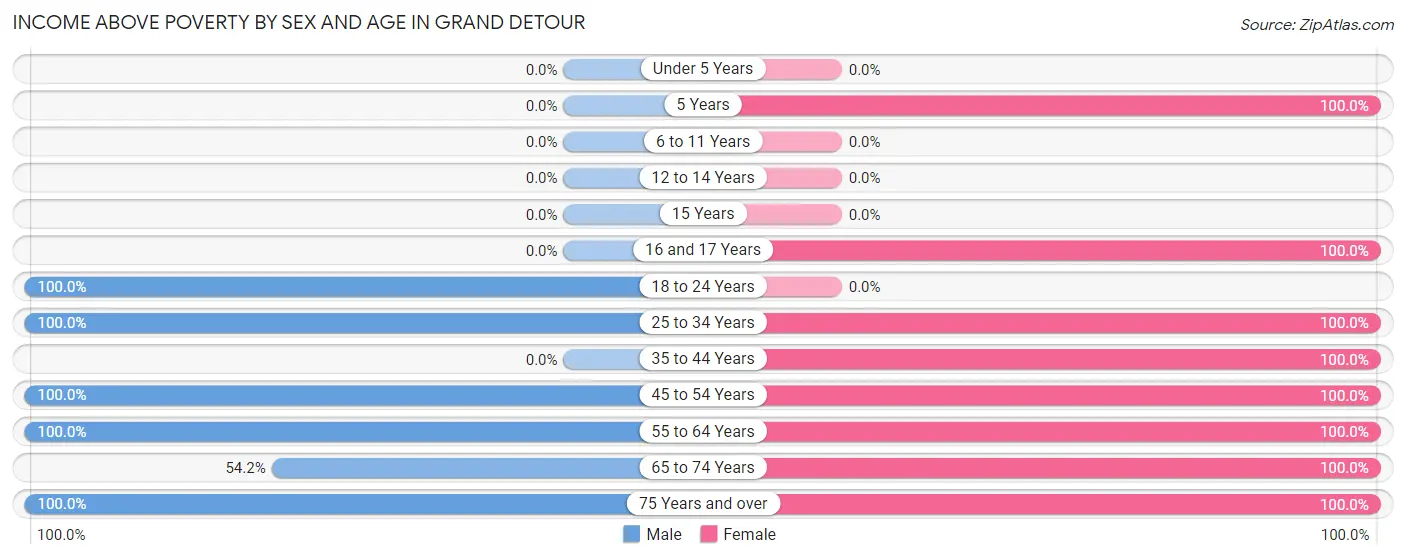
| Age Bracket | Male | Female |
| Under 5 Years | 0 (0.0%) | 0 (0.0%) |
| 5 Years | 0 (0.0%) | 14 (100.0%) |
| 6 to 11 Years | 0 (0.0%) | 0 (0.0%) |
| 12 to 14 Years | 0 (0.0%) | 0 (0.0%) |
| 15 Years | 0 (0.0%) | 0 (0.0%) |
| 16 and 17 Years | 0 (0.0%) | 29 (100.0%) |
| 18 to 24 Years | 35 (100.0%) | 0 (0.0%) |
| 25 to 34 Years | 34 (100.0%) | 13 (100.0%) |
| 35 to 44 Years | 0 (0.0%) | 9 (100.0%) |
| 45 to 54 Years | 46 (100.0%) | 8 (100.0%) |
| 55 to 64 Years | 17 (100.0%) | 17 (100.0%) |
| 65 to 74 Years | 26 (54.2%) | 18 (100.0%) |
| 75 Years and over | 7 (100.0%) | 7 (100.0%) |
| Total | 165 (88.2%) | 115 (100.0%) |
Income Below Poverty Among Married-Couple Families in Grand Detour
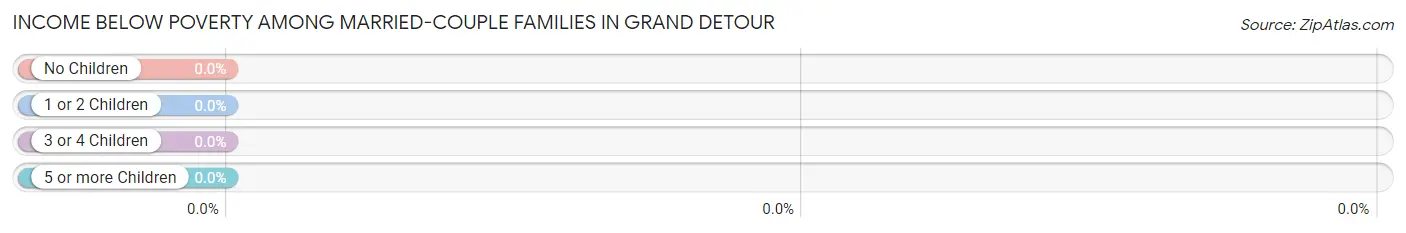
| Children | Above Poverty | Below Poverty |
| No Children | 51 (100.0%) | 0 (0.0%) |
| 1 or 2 Children | 16 (100.0%) | 0 (0.0%) |
| 3 or 4 Children | 0 (0.0%) | 0 (0.0%) |
| 5 or more Children | 0 (0.0%) | 0 (0.0%) |
| Total | 67 (100.0%) | 0 (0.0%) |
Income Below Poverty Among Single-Parent Households in Grand Detour
| Children | Single Father | Single Mother |
| No Children | 0 (0.0%) | 0 (0.0%) |
| 1 or 2 Children | 0 (0.0%) | 0 (0.0%) |
| 3 or 4 Children | 0 (0.0%) | 0 (0.0%) |
| 5 or more Children | 0 (0.0%) | 0 (0.0%) |
| Total | 0 (0.0%) | 0 (0.0%) |
Income Below Poverty Among Married-Couple vs Single-Parent Households in Grand Detour
| Children | Married-Couple Families | Single-Parent Households |
| No Children | 0 (0.0%) | 0 (0.0%) |
| 1 or 2 Children | 0 (0.0%) | 0 (0.0%) |
| 3 or 4 Children | 0 (0.0%) | 0 (0.0%) |
| 5 or more Children | 0 (0.0%) | 0 (0.0%) |
| Total | 0 (0.0%) | 0 (0.0%) |
Race in Grand Detour
The most populous races in Grand Detour are White / Caucasian (216 | 71.5%), Hispanic or Latino (86 | 28.5%), and Two or more Races (64 | 21.2%).
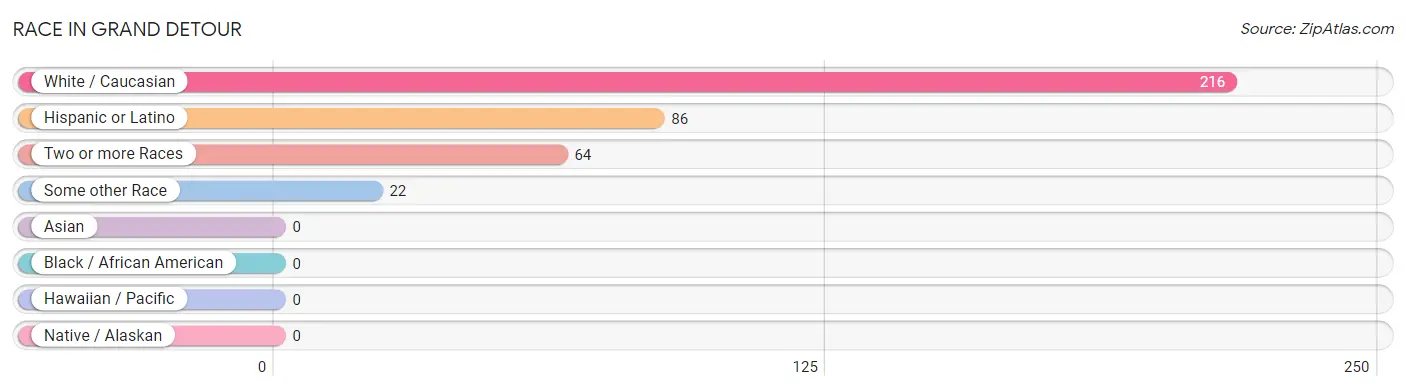
| Race | # Population | % Population |
| Asian | 0 | 0.0% |
| Black / African American | 0 | 0.0% |
| Hawaiian / Pacific | 0 | 0.0% |
| Hispanic or Latino | 86 | 28.5% |
| Native / Alaskan | 0 | 0.0% |
| White / Caucasian | 216 | 71.5% |
| Two or more Races | 64 | 21.2% |
| Some other Race | 22 | 7.3% |
| Total | 302 | 100.0% |
Ancestry in Grand Detour
The most populous ancestries reported in Grand Detour are German (113 | 37.4%), Mexican (86 | 28.5%), American (41 | 13.6%), French (32 | 10.6%), and English (25 | 8.3%), together accounting for 98.4% of all Grand Detour residents.
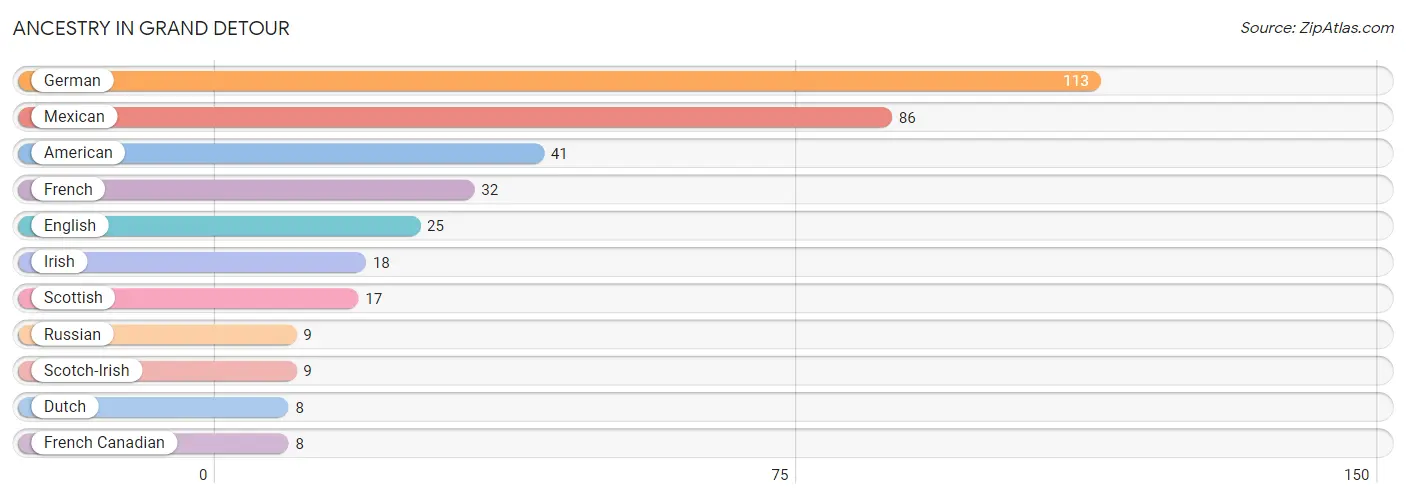
| Ancestry | # Population | % Population |
| American | 41 | 13.6% |
| Dutch | 8 | 2.6% |
| English | 25 | 8.3% |
| French | 32 | 10.6% |
| French Canadian | 8 | 2.6% |
| German | 113 | 37.4% |
| Irish | 18 | 6.0% |
| Mexican | 86 | 28.5% |
| Russian | 9 | 3.0% |
| Scotch-Irish | 9 | 3.0% |
| Scottish | 17 | 5.6% | View All 11 Rows |
Immigrants in Grand Detour
The most numerous immigrant groups reported in Grand Detour came from , and Canada (8 | 2.6%), together accounting for 2.6% of all Grand Detour residents.

| Immigration Origin | # Population | % Population |
| Canada | 8 | 2.6% | View All 1 Rows |
Sex and Age in Grand Detour
Sex and Age in Grand Detour
The most populous age groups in Grand Detour are 50 to 54 Years (32 | 17.1%) for men and 15 to 19 Years (29 | 25.2%) for women.
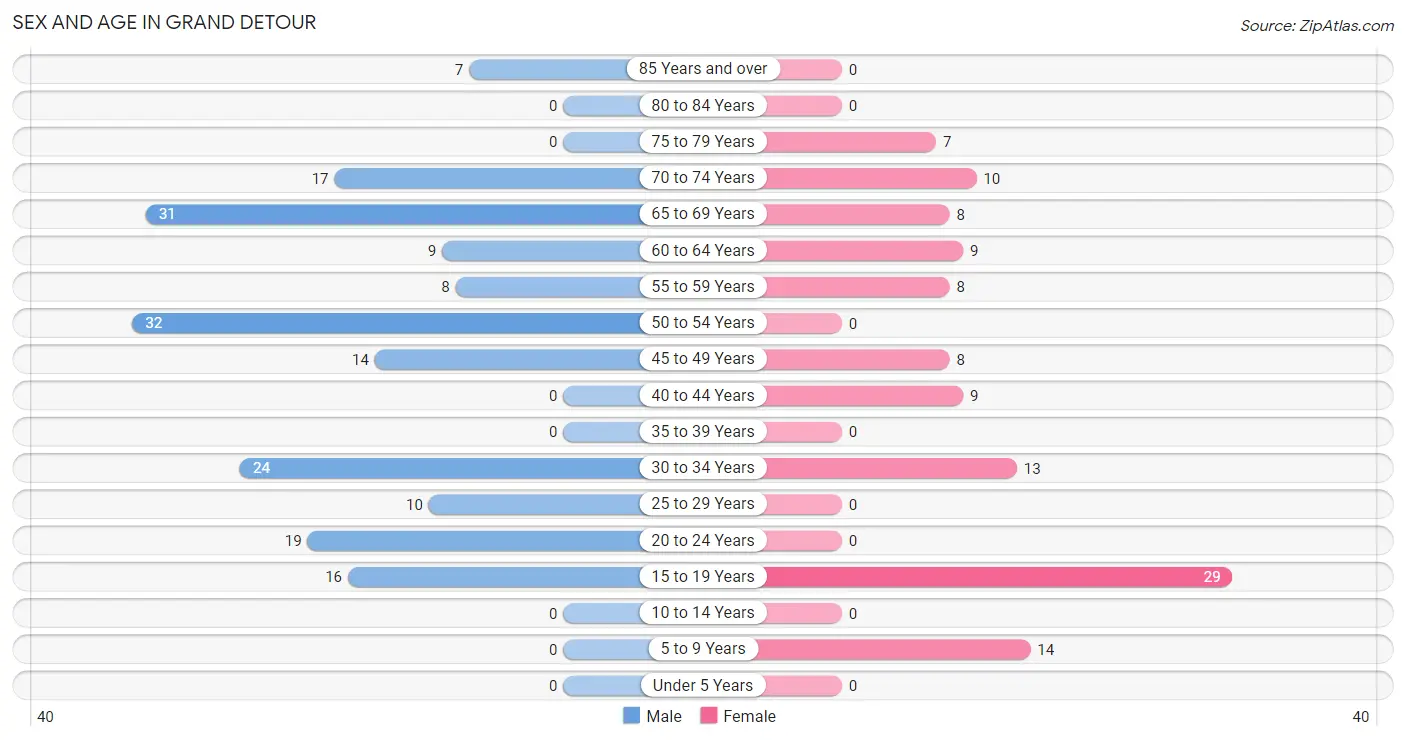
| Age Bracket | Male | Female |
| Under 5 Years | 0 (0.0%) | 0 (0.0%) |
| 5 to 9 Years | 0 (0.0%) | 14 (12.2%) |
| 10 to 14 Years | 0 (0.0%) | 0 (0.0%) |
| 15 to 19 Years | 16 (8.6%) | 29 (25.2%) |
| 20 to 24 Years | 19 (10.2%) | 0 (0.0%) |
| 25 to 29 Years | 10 (5.3%) | 0 (0.0%) |
| 30 to 34 Years | 24 (12.8%) | 13 (11.3%) |
| 35 to 39 Years | 0 (0.0%) | 0 (0.0%) |
| 40 to 44 Years | 0 (0.0%) | 9 (7.8%) |
| 45 to 49 Years | 14 (7.5%) | 8 (7.0%) |
| 50 to 54 Years | 32 (17.1%) | 0 (0.0%) |
| 55 to 59 Years | 8 (4.3%) | 8 (7.0%) |
| 60 to 64 Years | 9 (4.8%) | 9 (7.8%) |
| 65 to 69 Years | 31 (16.6%) | 8 (7.0%) |
| 70 to 74 Years | 17 (9.1%) | 10 (8.7%) |
| 75 to 79 Years | 0 (0.0%) | 7 (6.1%) |
| 80 to 84 Years | 0 (0.0%) | 0 (0.0%) |
| 85 Years and over | 7 (3.7%) | 0 (0.0%) |
| Total | 187 (100.0%) | 115 (100.0%) |
Families and Households in Grand Detour
Median Family Size in Grand Detour
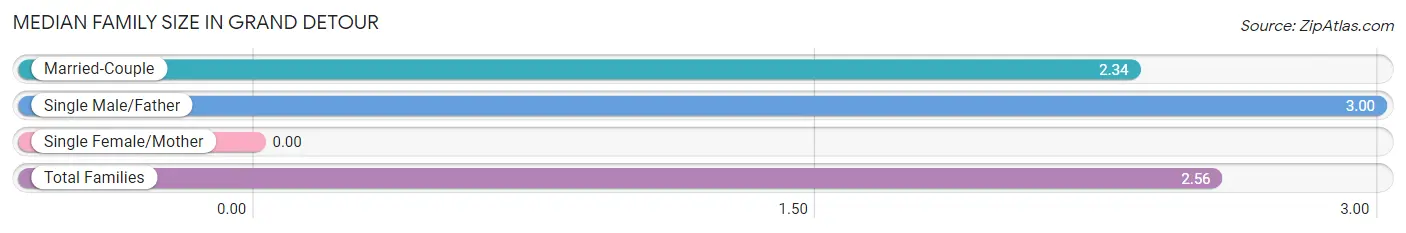
| Family Type | # Families | Family Size |
| Married-Couple | 67 (67.7%) | 2.34 |
| Single Male/Father | 32 (32.3%) | 3.00 |
| Single Female/Mother | 0 (0.0%) | - |
| Total Families | 99 (100.0%) | 2.56 |
Median Household Size in Grand Detour
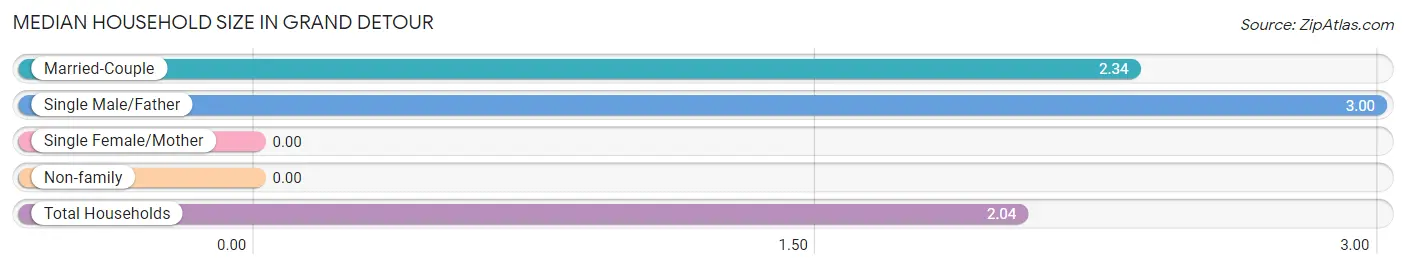
| Household Type | # Households | Household Size |
| Married-Couple | 67 (45.3%) | 2.34 |
| Single Male/Father | 32 (21.6%) | 3.00 |
| Single Female/Mother | 0 (0.0%) | - |
| Non-family | 49 (33.1%) | - |
| Total Households | 148 (100.0%) | 2.04 |
Household Size by Marriage Status in Grand Detour
Out of a total of 148 households in Grand Detour, 99 (66.9%) are family households, while 49 (33.1%) are nonfamily households. The most numerous type of family households are 2-person households, comprising 41, and the most common type of nonfamily households are 1-person households, comprising 49.
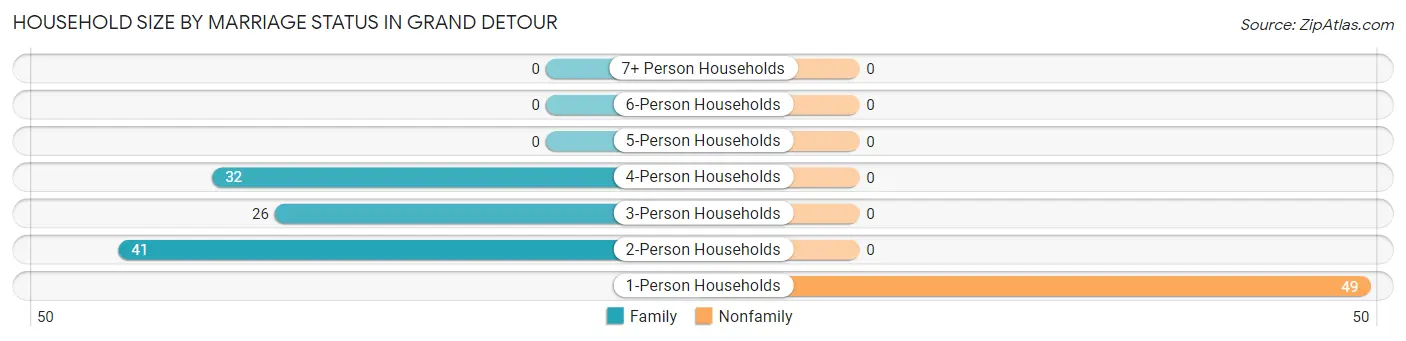
| Household Size | Family Households | Nonfamily Households |
| 1-Person Households | - | 49 (33.1%) |
| 2-Person Households | 41 (27.7%) | 0 (0.0%) |
| 3-Person Households | 26 (17.6%) | 0 (0.0%) |
| 4-Person Households | 32 (21.6%) | 0 (0.0%) |
| 5-Person Households | 0 (0.0%) | 0 (0.0%) |
| 6-Person Households | 0 (0.0%) | 0 (0.0%) |
| 7+ Person Households | 0 (0.0%) | 0 (0.0%) |
| Total | 99 (66.9%) | 49 (33.1%) |
Female Fertility in Grand Detour
Fertility by Age in Grand Detour
| Age Bracket | Women with Births | Births / 1,000 Women |
| 15 to 19 years | 0 (0.0%) | 0.0 |
| 20 to 34 years | 0 (0.0%) | 0.0 |
| 35 to 50 years | 0 (0.0%) | 0.0 |
| Total | 0 (0.0%) | 0.0 |
Fertility by Age by Marriage Status in Grand Detour
| Age Bracket | Married | Unmarried |
| 15 to 19 years | 0 (0.0%) | 0 (0.0%) |
| 20 to 34 years | 0 (0.0%) | 0 (0.0%) |
| 35 to 50 years | 0 (0.0%) | 0 (0.0%) |
| Total | 0 (0.0%) | 0 (0.0%) |
Fertility by Education in Grand Detour
| Educational Attainment | Women with Births | Births / 1,000 Women |
| Less than High School | 0 (0.0%) | 0.0 |
| High School Diploma | 0 (0.0%) | 0.0 |
| College or Associate's Degree | 0 (0.0%) | 0.0 |
| Bachelor's Degree | 0 (0.0%) | 0.0 |
| Graduate Degree | 0 (0.0%) | 0.0 |
| Total | 0 (0.0%) | 0.0 |
Fertility by Education by Marriage Status in Grand Detour
| Educational Attainment | Married | Unmarried |
| Less than High School | 0 (0.0%) | 0 (0.0%) |
| High School Diploma | 0 (0.0%) | 0 (0.0%) |
| College or Associate's Degree | 0 (0.0%) | 0 (0.0%) |
| Bachelor's Degree | 0 (0.0%) | 0 (0.0%) |
| Graduate Degree | 0 (0.0%) | 0 (0.0%) |
| Total | 0 (0.0%) | 0 (0.0%) |
Employment Characteristics in Grand Detour
Employment by Class of Employer in Grand Detour
Among the 145 employed individuals in Grand Detour, private company employees (129 | 89.0%), self-employed (not incorporated) (8 | 5.5%), and not-for-profit organizations (8 | 5.5%) make up the most common classes of employment.
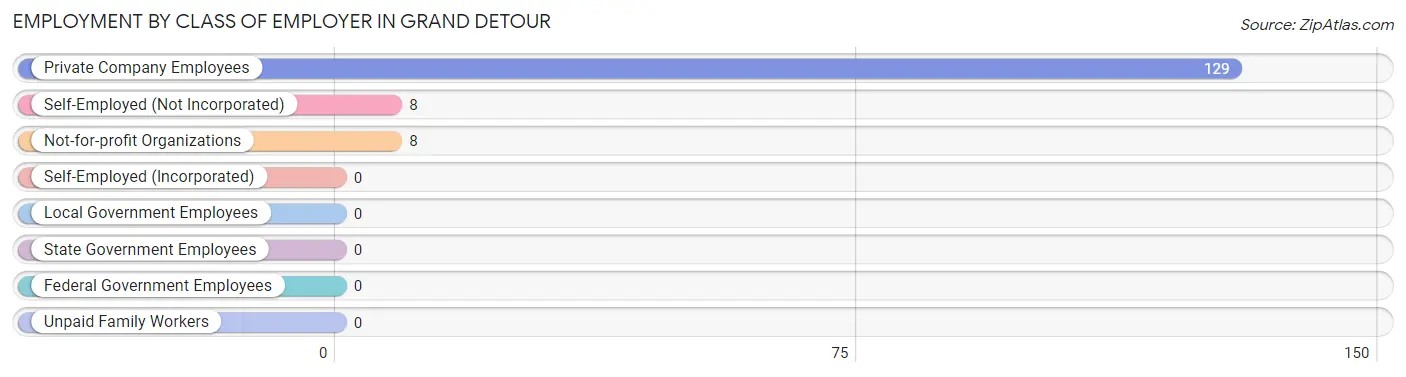
| Employer Class | # Employees | % Employees |
| Private Company Employees | 129 | 89.0% |
| Self-Employed (Incorporated) | 0 | 0.0% |
| Self-Employed (Not Incorporated) | 8 | 5.5% |
| Not-for-profit Organizations | 8 | 5.5% |
| Local Government Employees | 0 | 0.0% |
| State Government Employees | 0 | 0.0% |
| Federal Government Employees | 0 | 0.0% |
| Unpaid Family Workers | 0 | 0.0% |
| Total | 145 | 100.0% |
Employment Status by Age in Grand Detour
According to the labor force statistics for Grand Detour, out of the total population over 16 years of age (288), 60.4% or 174 individuals are in the labor force, with 16.7% or 29 of them unemployed. The age group with the highest labor force participation rate is 25 to 29 years, with 100.0% or 10 individuals in the labor force. Within the labor force, the 16 to 19 years age range has the highest percentage of unemployed individuals, with 100.0% or 29 of them being unemployed.
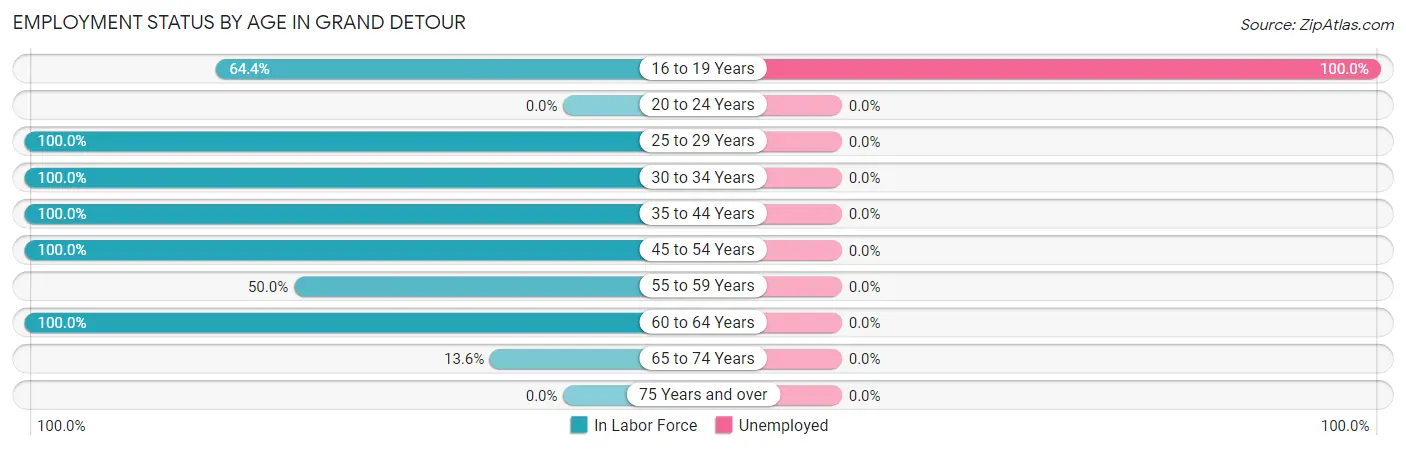
| Age Bracket | In Labor Force | Unemployed |
| 16 to 19 Years | 29 (64.4%) | 29 (100.0%) |
| 20 to 24 Years | 0 (0.0%) | 0 (0.0%) |
| 25 to 29 Years | 10 (100.0%) | 0 (0.0%) |
| 30 to 34 Years | 37 (100.0%) | 0 (0.0%) |
| 35 to 44 Years | 9 (100.0%) | 0 (0.0%) |
| 45 to 54 Years | 54 (100.0%) | 0 (0.0%) |
| 55 to 59 Years | 8 (50.0%) | 0 (0.0%) |
| 60 to 64 Years | 18 (100.0%) | 0 (0.0%) |
| 65 to 74 Years | 9 (13.6%) | 0 (0.0%) |
| 75 Years and over | 0 (0.0%) | 0 (0.0%) |
| Total | 174 (60.4%) | 29 (16.7%) |
Employment Status by Educational Attainment in Grand Detour
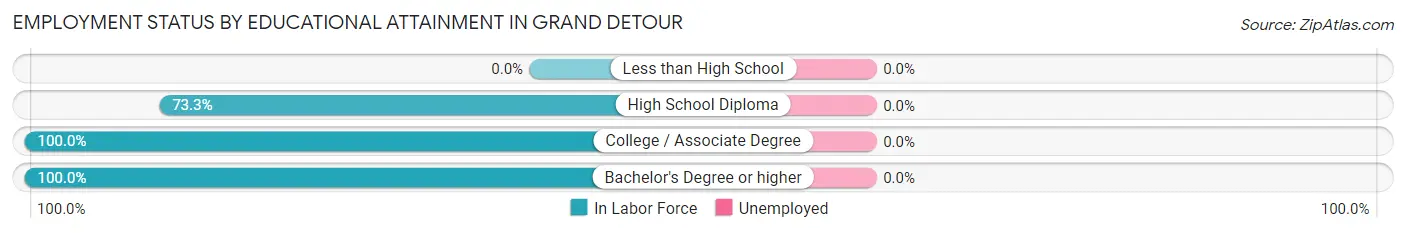
| Educational Attainment | In Labor Force | Unemployed |
| Less than High School | 0 (0.0%) | 0 (0.0%) |
| High School Diploma | 22 (73.3%) | 0 (0.0%) |
| College / Associate Degree | 38 (100.0%) | 0 (0.0%) |
| Bachelor's Degree or higher | 76 (100.0%) | 0 (0.0%) |
| Total | 136 (94.4%) | 0 (0.0%) |
Employment Occupations by Sex in Grand Detour
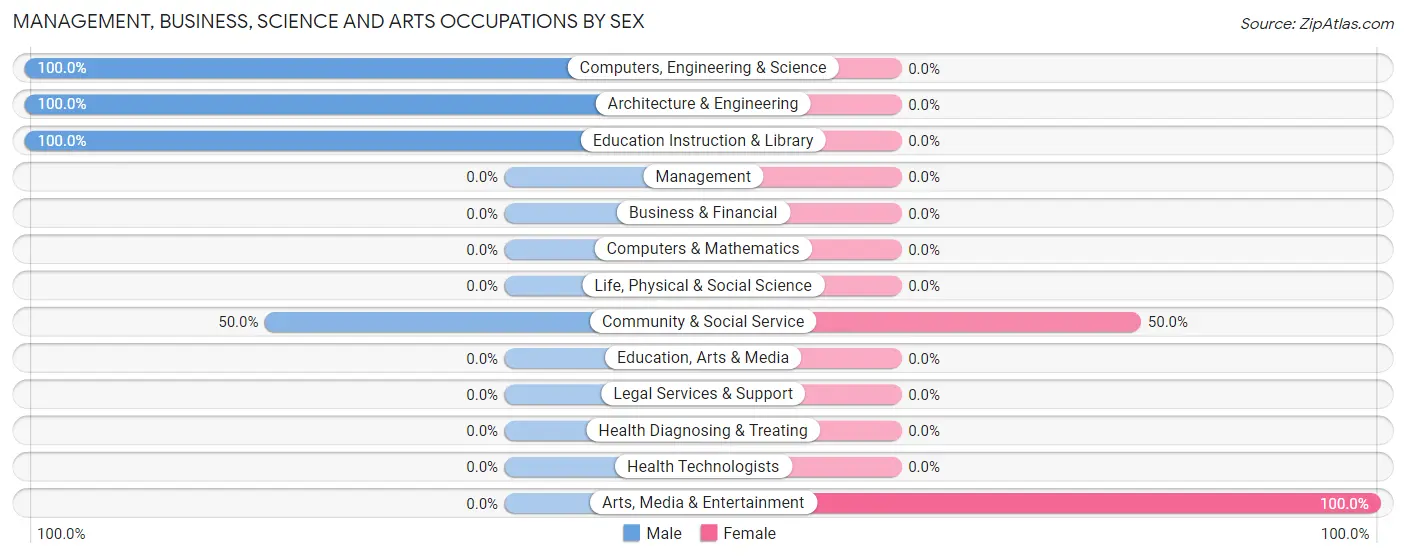
Management, Business, Science and Arts Occupations
The most common Management, Business, Science and Arts occupations in Grand Detour are Computers, Engineering & Science (32 | 22.1%), Architecture & Engineering (32 | 22.1%), Community & Social Service (16 | 11.0%), Education Instruction & Library (8 | 5.5%), and Arts, Media & Entertainment (8 | 5.5%).
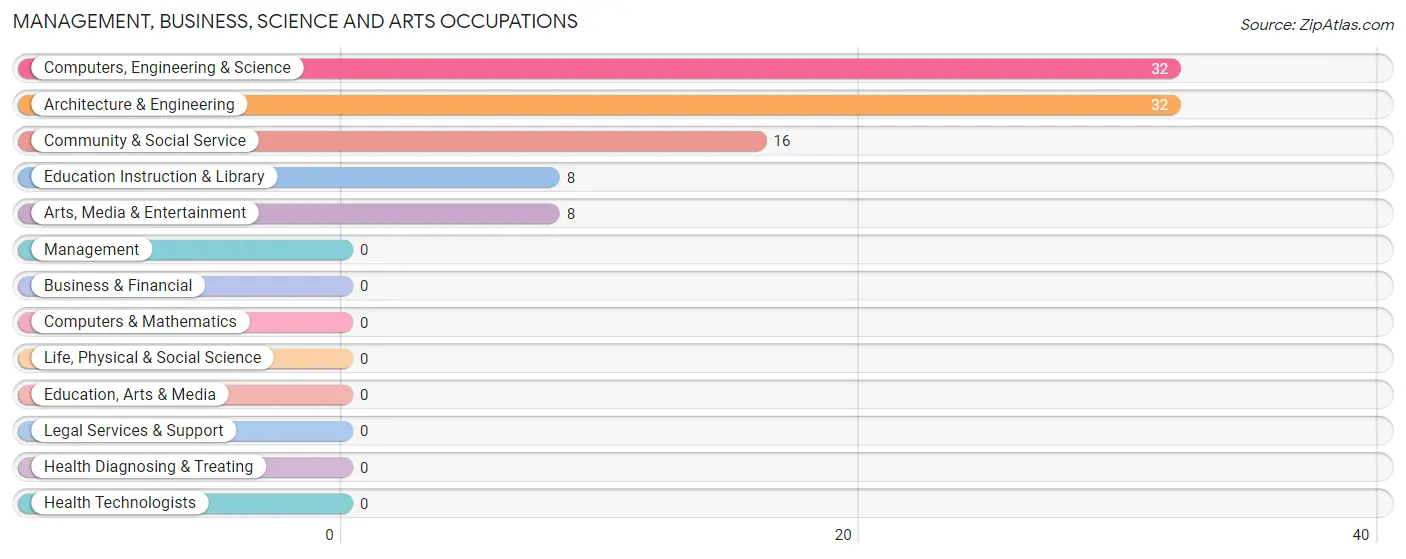
Management, Business, Science and Arts Occupations by Sex
Within the Management, Business, Science and Arts occupations in Grand Detour, the most male-oriented occupations are Computers, Engineering & Science (100.0%), Architecture & Engineering (100.0%), and Education Instruction & Library (100.0%), while the most female-oriented occupations are Arts, Media & Entertainment (100.0%), and Community & Social Service (50.0%).
| Occupation | Male | Female |
| Management | 0 (0.0%) | 0 (0.0%) |
| Business & Financial | 0 (0.0%) | 0 (0.0%) |
| Computers, Engineering & Science | 32 (100.0%) | 0 (0.0%) |
| Computers & Mathematics | 0 (0.0%) | 0 (0.0%) |
| Architecture & Engineering | 32 (100.0%) | 0 (0.0%) |
| Life, Physical & Social Science | 0 (0.0%) | 0 (0.0%) |
| Community & Social Service | 8 (50.0%) | 8 (50.0%) |
| Education, Arts & Media | 0 (0.0%) | 0 (0.0%) |
| Legal Services & Support | 0 (0.0%) | 0 (0.0%) |
| Education Instruction & Library | 8 (100.0%) | 0 (0.0%) |
| Arts, Media & Entertainment | 0 (0.0%) | 8 (100.0%) |
| Health Diagnosing & Treating | 0 (0.0%) | 0 (0.0%) |
| Health Technologists | 0 (0.0%) | 0 (0.0%) |
| Total (Category) | 40 (83.3%) | 8 (16.7%) |
| Total (Overall) | 106 (73.1%) | 39 (26.9%) |
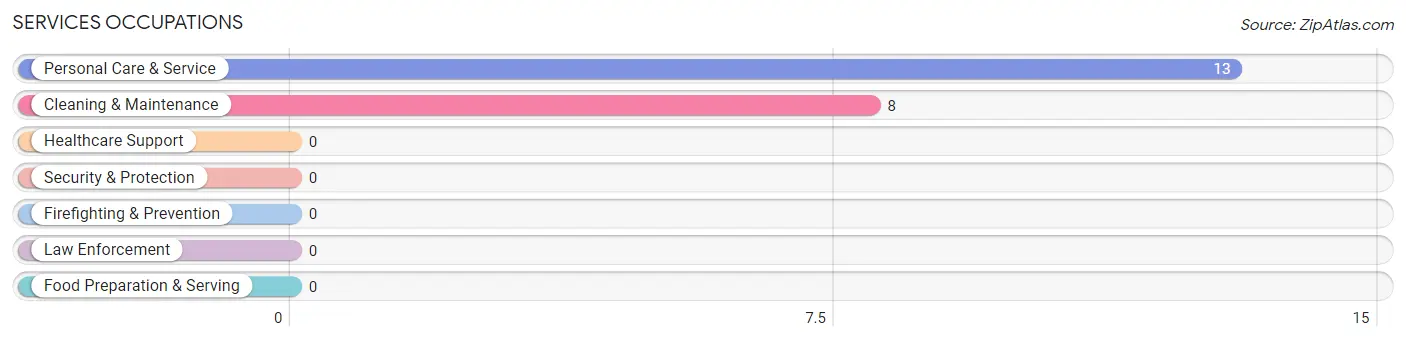
Services Occupations
The most common Services occupations in Grand Detour are Personal Care & Service (13 | 9.0%), and Cleaning & Maintenance (8 | 5.5%).
Services Occupations by Sex
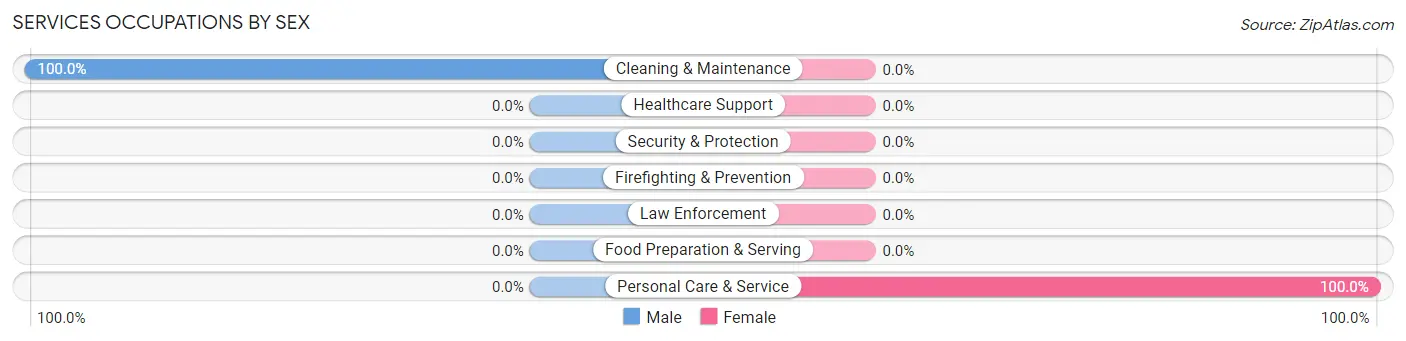
| Occupation | Male | Female |
| Healthcare Support | 0 (0.0%) | 0 (0.0%) |
| Security & Protection | 0 (0.0%) | 0 (0.0%) |
| Firefighting & Prevention | 0 (0.0%) | 0 (0.0%) |
| Law Enforcement | 0 (0.0%) | 0 (0.0%) |
| Food Preparation & Serving | 0 (0.0%) | 0 (0.0%) |
| Cleaning & Maintenance | 8 (100.0%) | 0 (0.0%) |
| Personal Care & Service | 0 (0.0%) | 13 (100.0%) |
| Total (Category) | 8 (38.1%) | 13 (61.9%) |
| Total (Overall) | 106 (73.1%) | 39 (26.9%) |
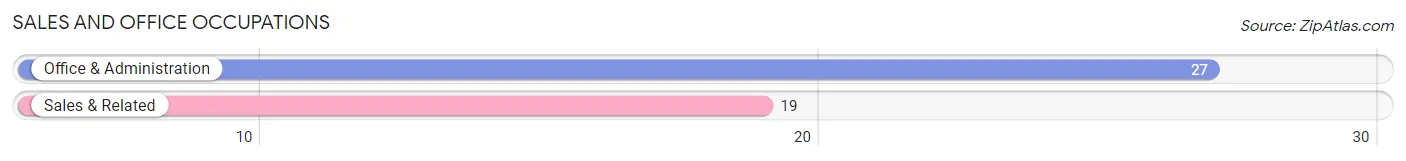
Sales and Office Occupations
The most common Sales and Office occupations in Grand Detour are Office & Administration (27 | 18.6%), and Sales & Related (19 | 13.1%).
Sales and Office Occupations by Sex
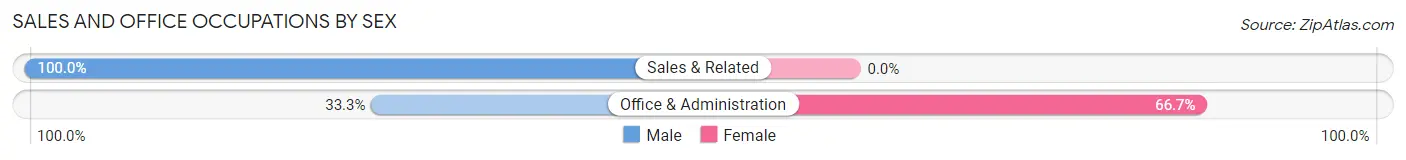
| Occupation | Male | Female |
| Sales & Related | 19 (100.0%) | 0 (0.0%) |
| Office & Administration | 9 (33.3%) | 18 (66.7%) |
| Total (Category) | 28 (60.9%) | 18 (39.1%) |
| Total (Overall) | 106 (73.1%) | 39 (26.9%) |
Natural Resources, Construction and Maintenance Occupations
The most common Natural Resources, Construction and Maintenance occupations in Grand Detour are , and Installation, Maintenance & Repair (9 | 6.2%).
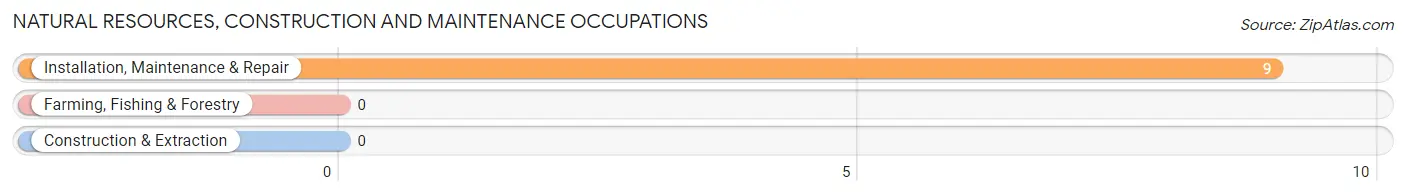
Natural Resources, Construction and Maintenance Occupations by Sex

| Occupation | Male | Female |
| Farming, Fishing & Forestry | 0 (0.0%) | 0 (0.0%) |
| Construction & Extraction | 0 (0.0%) | 0 (0.0%) |
| Installation, Maintenance & Repair | 9 (100.0%) | 0 (0.0%) |
| Total (Category) | 9 (100.0%) | 0 (0.0%) |
| Total (Overall) | 106 (73.1%) | 39 (26.9%) |
Production, Transportation and Moving Occupations
The most common Production, Transportation and Moving occupations in Grand Detour are , and Transportation (21 | 14.5%).
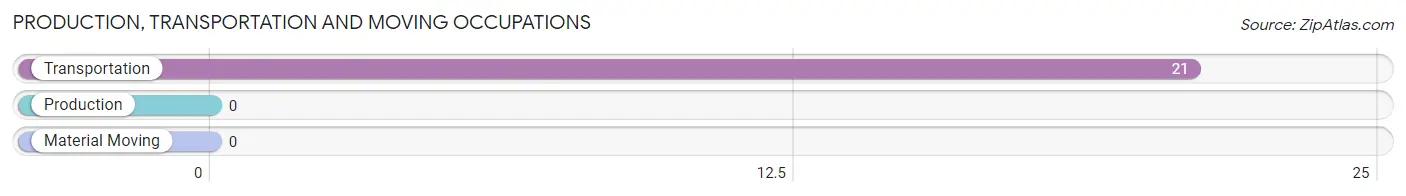
Production, Transportation and Moving Occupations by Sex
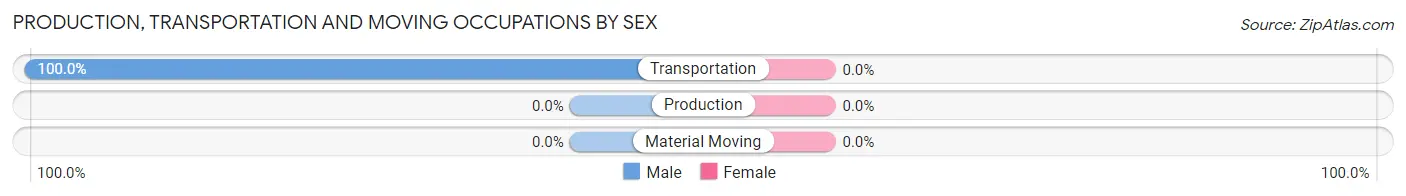
| Occupation | Male | Female |
| Production | 0 (0.0%) | 0 (0.0%) |
| Transportation | 21 (100.0%) | 0 (0.0%) |
| Material Moving | 0 (0.0%) | 0 (0.0%) |
| Total (Category) | 21 (100.0%) | 0 (0.0%) |
| Total (Overall) | 106 (73.1%) | 39 (26.9%) |
Employment Industries by Sex in Grand Detour
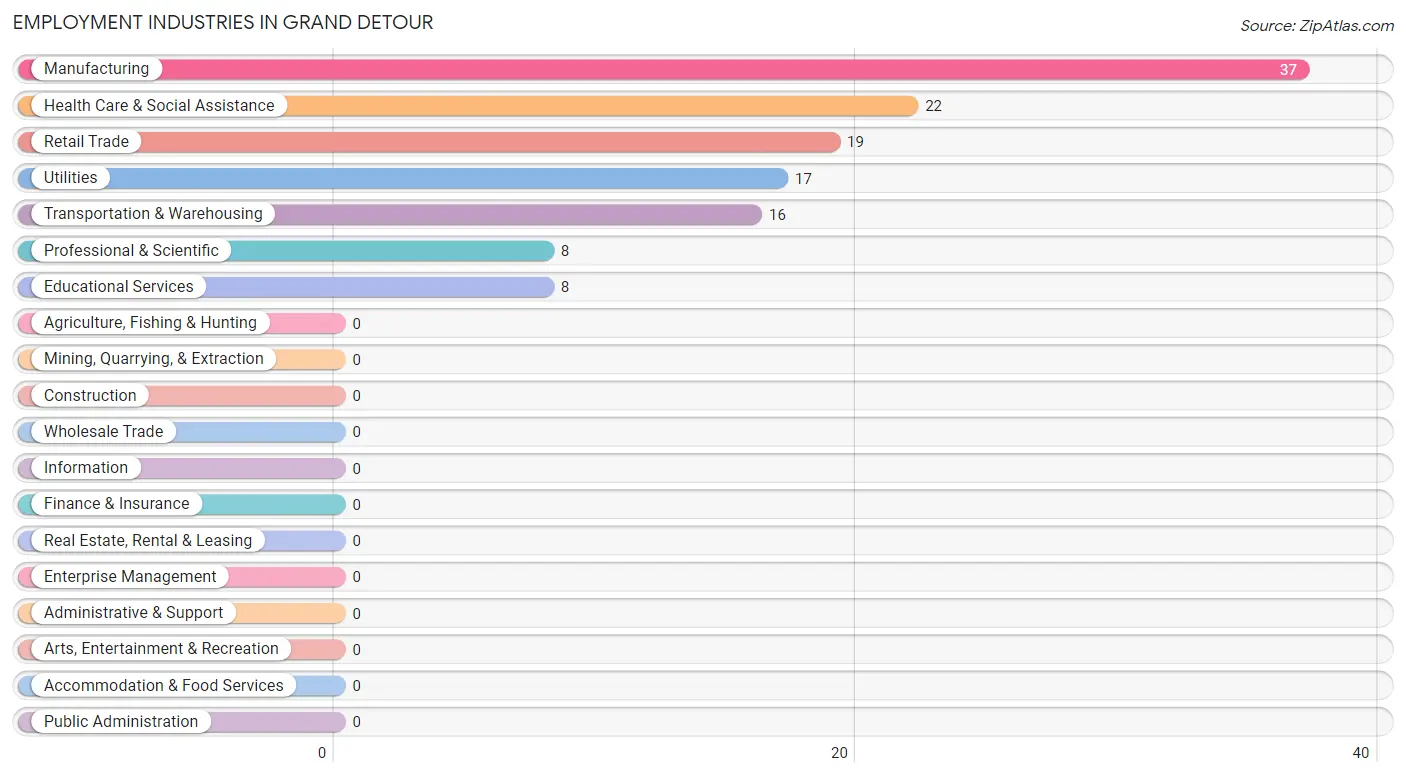
Employment Industries in Grand Detour
The major employment industries in Grand Detour include Manufacturing (37 | 25.5%), Health Care & Social Assistance (22 | 15.2%), Retail Trade (19 | 13.1%), Utilities (17 | 11.7%), and Transportation & Warehousing (16 | 11.0%).
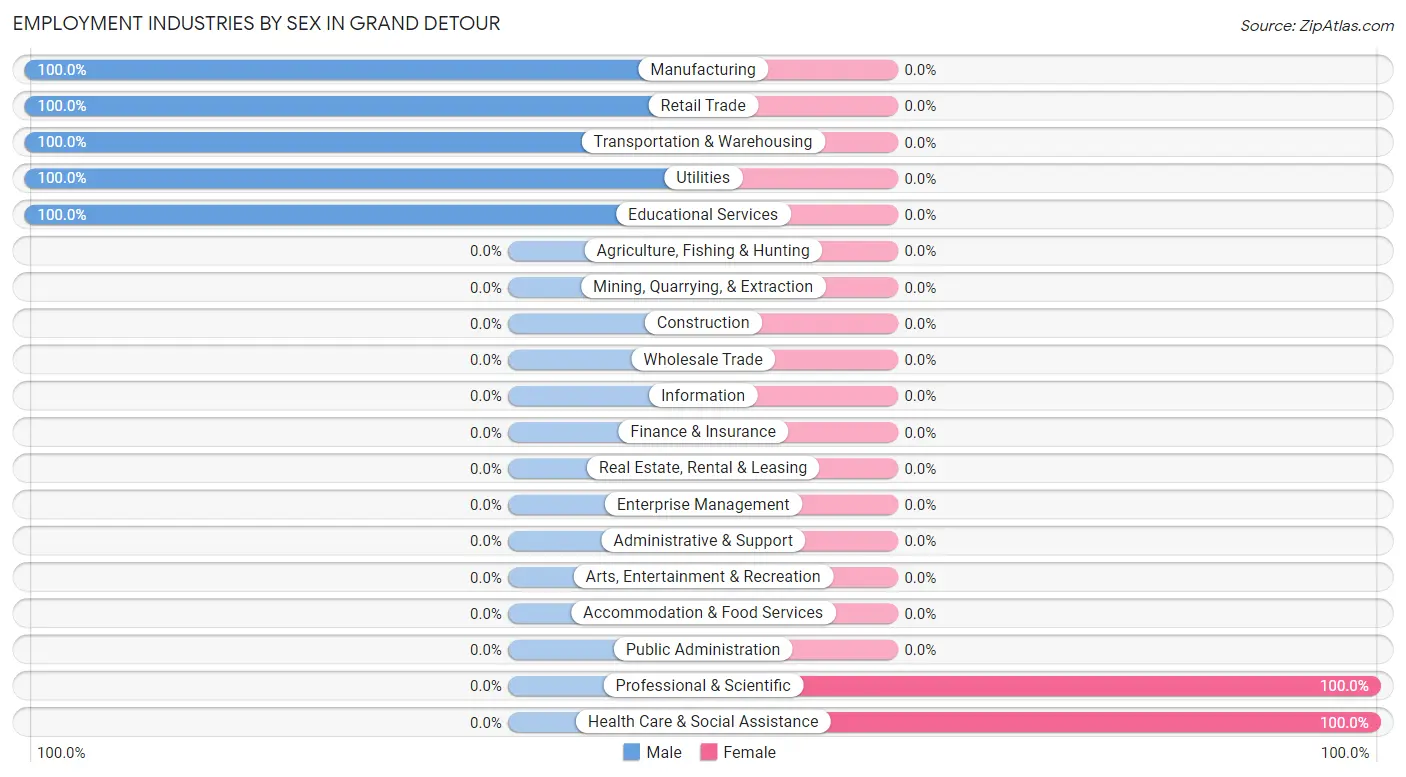
Employment Industries by Sex in Grand Detour
The Grand Detour industries that see more men than women are Manufacturing (100.0%), Retail Trade (100.0%), and Transportation & Warehousing (100.0%), whereas the industries that tend to have a higher number of women are Professional & Scientific (100.0%), and Health Care & Social Assistance (100.0%).
| Industry | Male | Female |
| Agriculture, Fishing & Hunting | 0 (0.0%) | 0 (0.0%) |
| Mining, Quarrying, & Extraction | 0 (0.0%) | 0 (0.0%) |
| Construction | 0 (0.0%) | 0 (0.0%) |
| Manufacturing | 37 (100.0%) | 0 (0.0%) |
| Wholesale Trade | 0 (0.0%) | 0 (0.0%) |
| Retail Trade | 19 (100.0%) | 0 (0.0%) |
| Transportation & Warehousing | 16 (100.0%) | 0 (0.0%) |
| Utilities | 17 (100.0%) | 0 (0.0%) |
| Information | 0 (0.0%) | 0 (0.0%) |
| Finance & Insurance | 0 (0.0%) | 0 (0.0%) |
| Real Estate, Rental & Leasing | 0 (0.0%) | 0 (0.0%) |
| Professional & Scientific | 0 (0.0%) | 8 (100.0%) |
| Enterprise Management | 0 (0.0%) | 0 (0.0%) |
| Administrative & Support | 0 (0.0%) | 0 (0.0%) |
| Educational Services | 8 (100.0%) | 0 (0.0%) |
| Health Care & Social Assistance | 0 (0.0%) | 22 (100.0%) |
| Arts, Entertainment & Recreation | 0 (0.0%) | 0 (0.0%) |
| Accommodation & Food Services | 0 (0.0%) | 0 (0.0%) |
| Public Administration | 0 (0.0%) | 0 (0.0%) |
| Total | 106 (73.1%) | 39 (26.9%) |
Education in Grand Detour
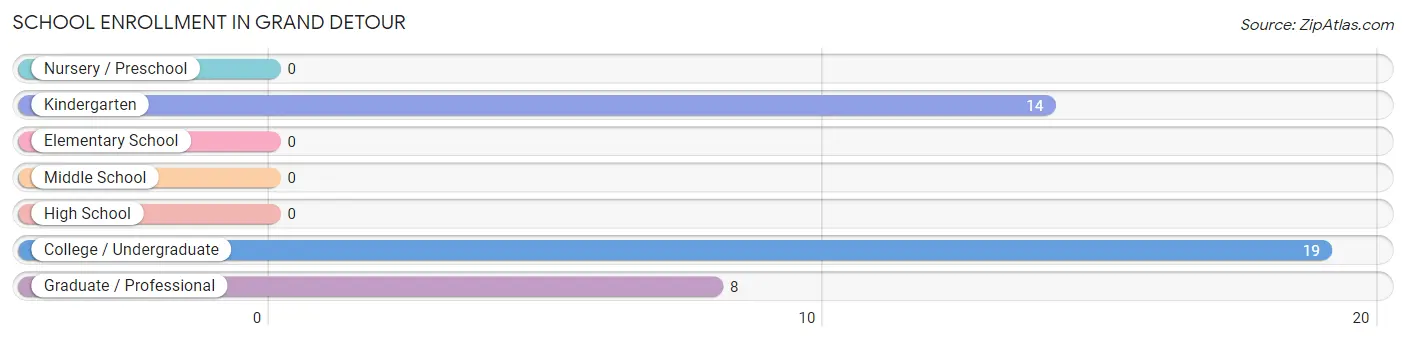
School Enrollment in Grand Detour
The most common levels of schooling among the 41 students in Grand Detour are college / undergraduate (19 | 46.3%), kindergarten (14 | 34.2%), and graduate / professional (8 | 19.5%).
| School Level | # Students | % Students |
| Nursery / Preschool | 0 | 0.0% |
| Kindergarten | 14 | 34.2% |
| Elementary School | 0 | 0.0% |
| Middle School | 0 | 0.0% |
| High School | 0 | 0.0% |
| College / Undergraduate | 19 | 46.3% |
| Graduate / Professional | 8 | 19.5% |
| Total | 41 | 100.0% |
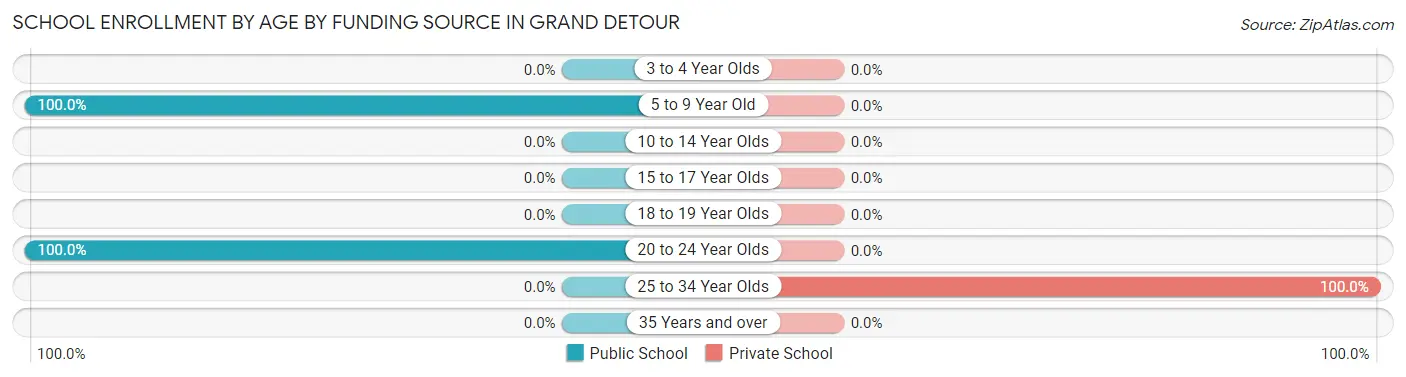
School Enrollment by Age by Funding Source in Grand Detour
Out of a total of 41 students who are enrolled in schools in Grand Detour, 8 (19.5%) attend a private institution, while the remaining 33 (80.5%) are enrolled in public schools. The age group of 25 to 34 year olds has the highest likelihood of being enrolled in private schools, with 8 (100.0% in the age bracket) enrolled. Conversely, the age group of 5 to 9 year old has the lowest likelihood of being enrolled in a private school, with 14 (100.0% in the age bracket) attending a public institution.
| Age Bracket | Public School | Private School |
| 3 to 4 Year Olds | 0 (0.0%) | 0 (0.0%) |
| 5 to 9 Year Old | 14 (100.0%) | 0 (0.0%) |
| 10 to 14 Year Olds | 0 (0.0%) | 0 (0.0%) |
| 15 to 17 Year Olds | 0 (0.0%) | 0 (0.0%) |
| 18 to 19 Year Olds | 0 (0.0%) | 0 (0.0%) |
| 20 to 24 Year Olds | 19 (100.0%) | 0 (0.0%) |
| 25 to 34 Year Olds | 0 (0.0%) | 8 (100.0%) |
| 35 Years and over | 0 (0.0%) | 0 (0.0%) |
| Total | 33 (80.5%) | 8 (19.5%) |
Educational Attainment by Field of Study in Grand Detour
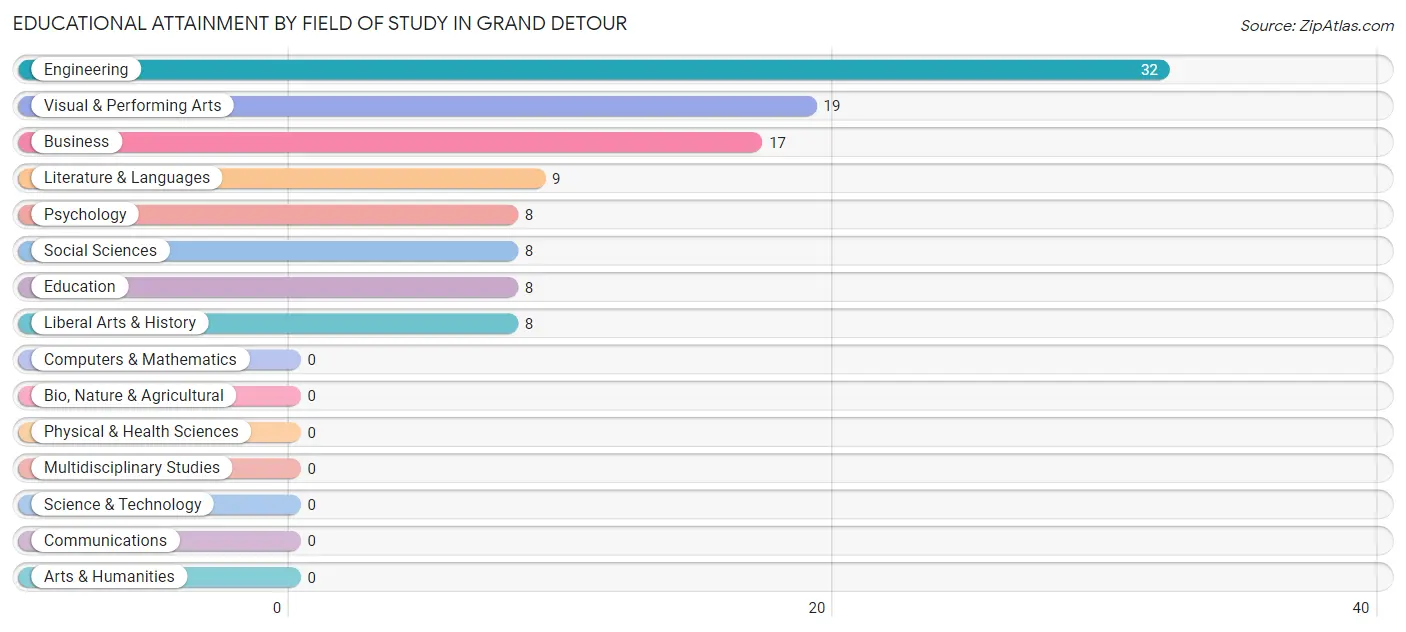
Engineering (32 | 29.4%), visual & performing arts (19 | 17.4%), business (17 | 15.6%), literature & languages (9 | 8.3%), and psychology (8 | 7.3%) are the most common fields of study among 109 individuals in Grand Detour who have obtained a bachelor's degree or higher.
| Field of Study | # Graduates | % Graduates |
| Computers & Mathematics | 0 | 0.0% |
| Bio, Nature & Agricultural | 0 | 0.0% |
| Physical & Health Sciences | 0 | 0.0% |
| Psychology | 8 | 7.3% |
| Social Sciences | 8 | 7.3% |
| Engineering | 32 | 29.4% |
| Multidisciplinary Studies | 0 | 0.0% |
| Science & Technology | 0 | 0.0% |
| Business | 17 | 15.6% |
| Education | 8 | 7.3% |
| Literature & Languages | 9 | 8.3% |
| Liberal Arts & History | 8 | 7.3% |
| Visual & Performing Arts | 19 | 17.4% |
| Communications | 0 | 0.0% |
| Arts & Humanities | 0 | 0.0% |
| Total | 109 | 100.0% |
Transportation & Commute in Grand Detour
Vehicle Availability by Sex in Grand Detour
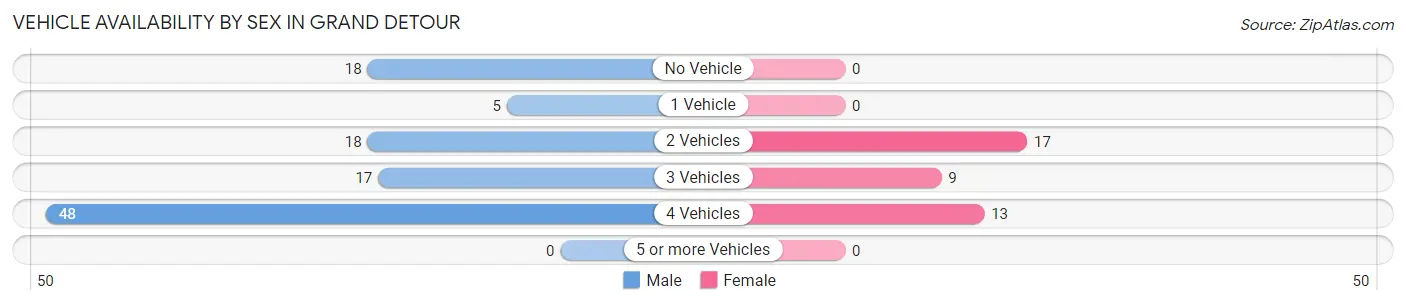
The most prevalent vehicle ownership categories in Grand Detour are males with 4 vehicles (48, accounting for 45.3%) and females with 4 vehicles (13, making up 123.1%).
| Vehicles Available | Male | Female |
| No Vehicle | 18 (17.0%) | 0 (0.0%) |
| 1 Vehicle | 5 (4.7%) | 0 (0.0%) |
| 2 Vehicles | 18 (17.0%) | 17 (43.6%) |
| 3 Vehicles | 17 (16.0%) | 9 (23.1%) |
| 4 Vehicles | 48 (45.3%) | 13 (33.3%) |
| 5 or more Vehicles | 0 (0.0%) | 0 (0.0%) |
| Total | 106 (100.0%) | 39 (100.0%) |
Commute Time in Grand Detour
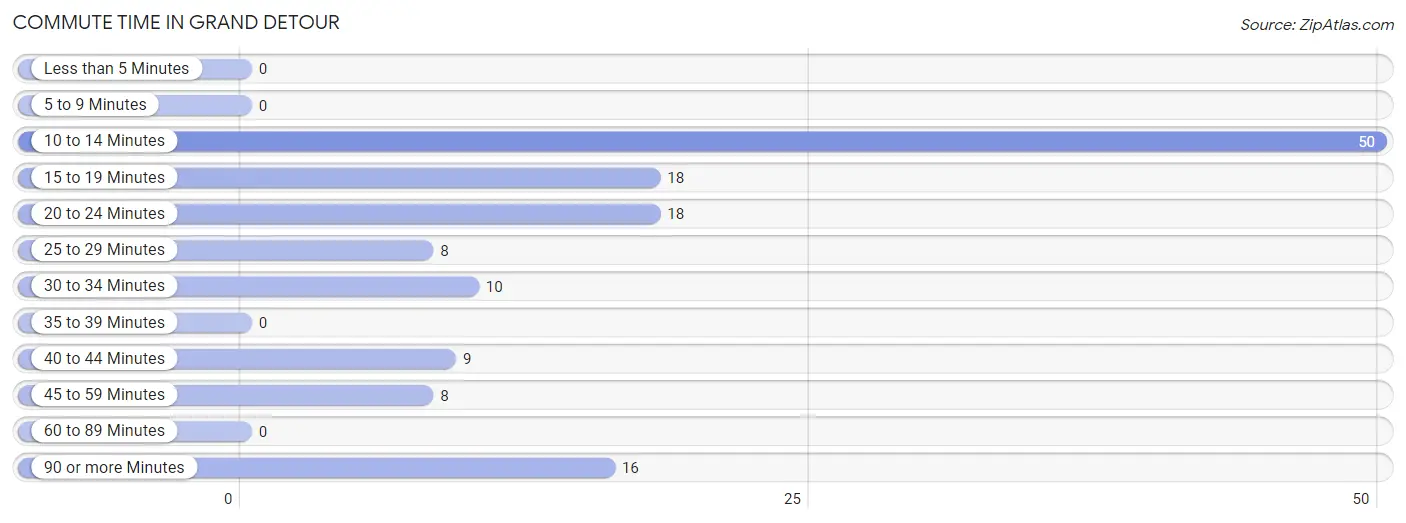
The most frequently occuring commute durations in Grand Detour are 10 to 14 minutes (50 commuters, 36.5%), 15 to 19 minutes (18 commuters, 13.1%), and 20 to 24 minutes (18 commuters, 13.1%).
| Commute Time | # Commuters | % Commuters |
| Less than 5 Minutes | 0 | 0.0% |
| 5 to 9 Minutes | 0 | 0.0% |
| 10 to 14 Minutes | 50 | 36.5% |
| 15 to 19 Minutes | 18 | 13.1% |
| 20 to 24 Minutes | 18 | 13.1% |
| 25 to 29 Minutes | 8 | 5.8% |
| 30 to 34 Minutes | 10 | 7.3% |
| 35 to 39 Minutes | 0 | 0.0% |
| 40 to 44 Minutes | 9 | 6.6% |
| 45 to 59 Minutes | 8 | 5.8% |
| 60 to 89 Minutes | 0 | 0.0% |
| 90 or more Minutes | 16 | 11.7% |
Commute Time by Sex in Grand Detour
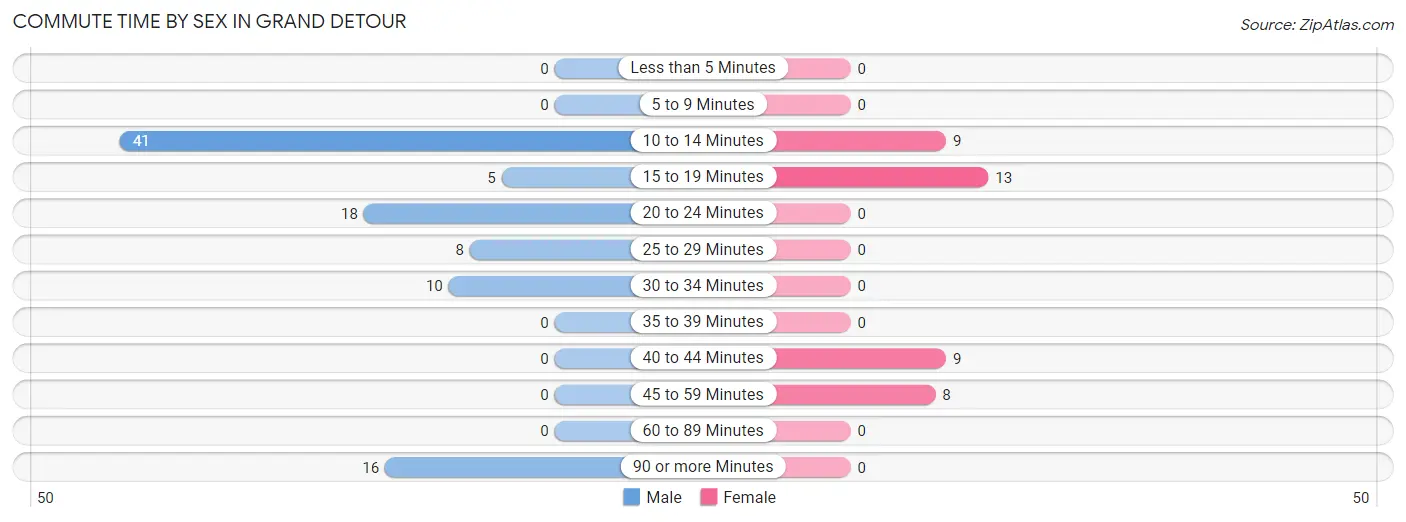
The most common commute times in Grand Detour are 10 to 14 minutes (41 commuters, 41.8%) for males and 15 to 19 minutes (13 commuters, 33.3%) for females.
| Commute Time | Male | Female |
| Less than 5 Minutes | 0 (0.0%) | 0 (0.0%) |
| 5 to 9 Minutes | 0 (0.0%) | 0 (0.0%) |
| 10 to 14 Minutes | 41 (41.8%) | 9 (23.1%) |
| 15 to 19 Minutes | 5 (5.1%) | 13 (33.3%) |
| 20 to 24 Minutes | 18 (18.4%) | 0 (0.0%) |
| 25 to 29 Minutes | 8 (8.2%) | 0 (0.0%) |
| 30 to 34 Minutes | 10 (10.2%) | 0 (0.0%) |
| 35 to 39 Minutes | 0 (0.0%) | 0 (0.0%) |
| 40 to 44 Minutes | 0 (0.0%) | 9 (23.1%) |
| 45 to 59 Minutes | 0 (0.0%) | 8 (20.5%) |
| 60 to 89 Minutes | 0 (0.0%) | 0 (0.0%) |
| 90 or more Minutes | 16 (16.3%) | 0 (0.0%) |
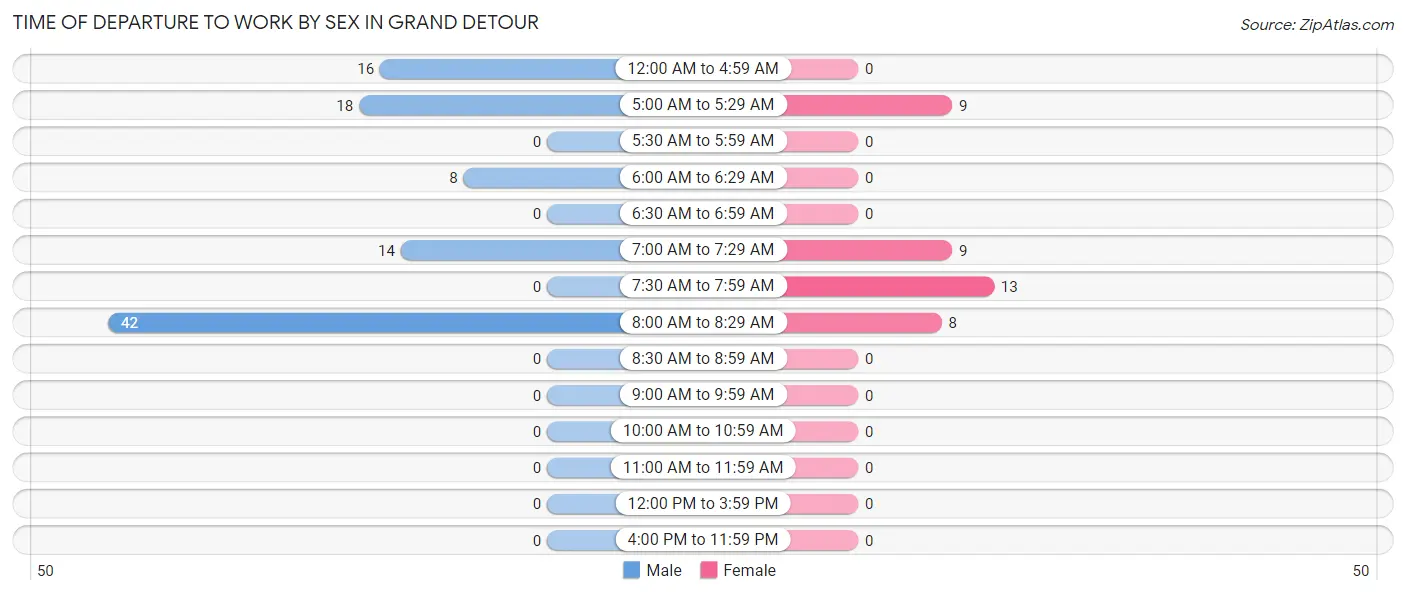
Time of Departure to Work by Sex in Grand Detour
The most frequent times of departure to work in Grand Detour are 8:00 AM to 8:29 AM (42, 42.9%) for males and 7:30 AM to 7:59 AM (13, 33.3%) for females.
| Time of Departure | Male | Female |
| 12:00 AM to 4:59 AM | 16 (16.3%) | 0 (0.0%) |
| 5:00 AM to 5:29 AM | 18 (18.4%) | 9 (23.1%) |
| 5:30 AM to 5:59 AM | 0 (0.0%) | 0 (0.0%) |
| 6:00 AM to 6:29 AM | 8 (8.2%) | 0 (0.0%) |
| 6:30 AM to 6:59 AM | 0 (0.0%) | 0 (0.0%) |
| 7:00 AM to 7:29 AM | 14 (14.3%) | 9 (23.1%) |
| 7:30 AM to 7:59 AM | 0 (0.0%) | 13 (33.3%) |
| 8:00 AM to 8:29 AM | 42 (42.9%) | 8 (20.5%) |
| 8:30 AM to 8:59 AM | 0 (0.0%) | 0 (0.0%) |
| 9:00 AM to 9:59 AM | 0 (0.0%) | 0 (0.0%) |
| 10:00 AM to 10:59 AM | 0 (0.0%) | 0 (0.0%) |
| 11:00 AM to 11:59 AM | 0 (0.0%) | 0 (0.0%) |
| 12:00 PM to 3:59 PM | 0 (0.0%) | 0 (0.0%) |
| 4:00 PM to 11:59 PM | 0 (0.0%) | 0 (0.0%) |
| Total | 98 (100.0%) | 39 (100.0%) |
Housing Occupancy in Grand Detour
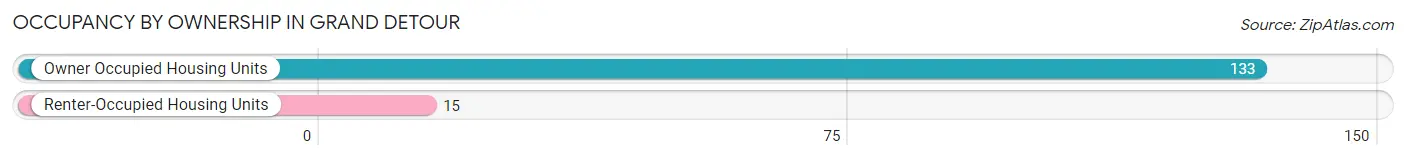
Occupancy by Ownership in Grand Detour
Of the total 148 dwellings in Grand Detour, owner-occupied units account for 133 (89.9%), while renter-occupied units make up 15 (10.1%).
| Occupancy | # Housing Units | % Housing Units |
| Owner Occupied Housing Units | 133 | 89.9% |
| Renter-Occupied Housing Units | 15 | 10.1% |
| Total Occupied Housing Units | 148 | 100.0% |
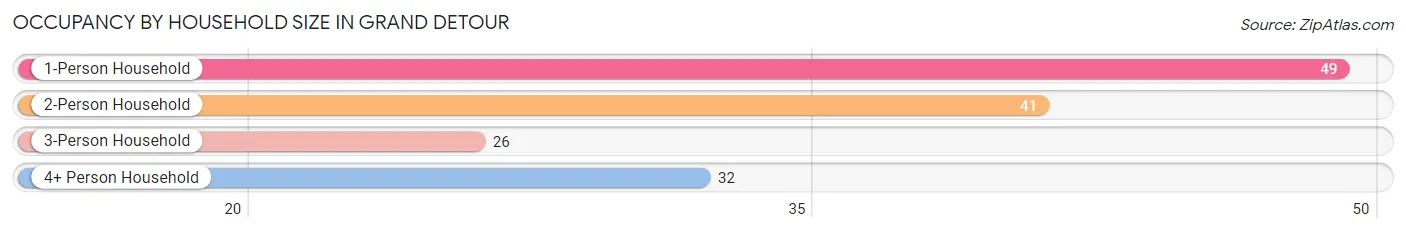
Occupancy by Household Size in Grand Detour
| Household Size | # Housing Units | % Housing Units |
| 1-Person Household | 49 | 33.1% |
| 2-Person Household | 41 | 27.7% |
| 3-Person Household | 26 | 17.6% |
| 4+ Person Household | 32 | 21.6% |
| Total Housing Units | 148 | 100.0% |
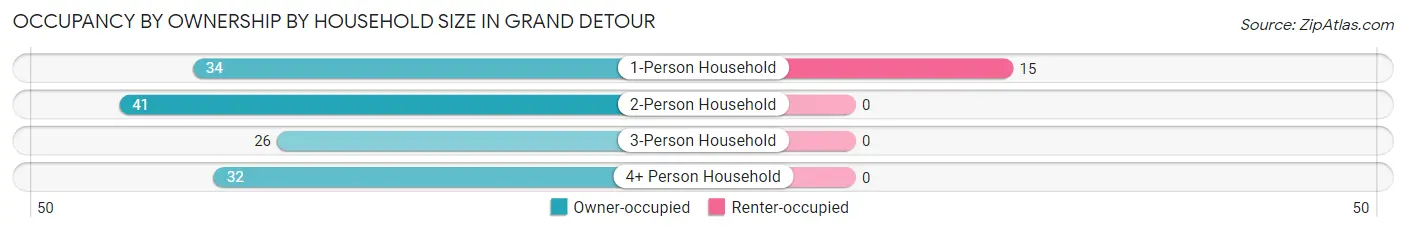
Occupancy by Ownership by Household Size in Grand Detour
| Household Size | Owner-occupied | Renter-occupied |
| 1-Person Household | 34 (69.4%) | 15 (30.6%) |
| 2-Person Household | 41 (100.0%) | 0 (0.0%) |
| 3-Person Household | 26 (100.0%) | 0 (0.0%) |
| 4+ Person Household | 32 (100.0%) | 0 (0.0%) |
| Total Housing Units | 133 (89.9%) | 15 (10.1%) |
Occupancy by Educational Attainment in Grand Detour
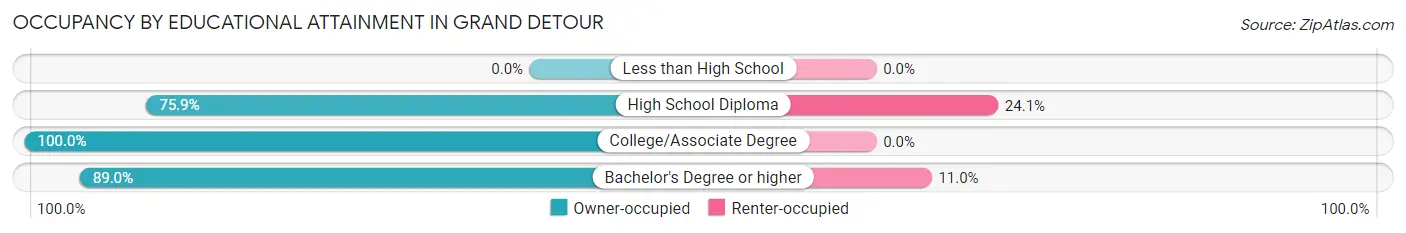
| Household Size | Owner-occupied | Renter-occupied |
| Less than High School | 0 (0.0%) | 0 (0.0%) |
| High School Diploma | 22 (75.9%) | 7 (24.1%) |
| College/Associate Degree | 46 (100.0%) | 0 (0.0%) |
| Bachelor's Degree or higher | 65 (89.0%) | 8 (11.0%) |
Occupancy by Age of Householder in Grand Detour
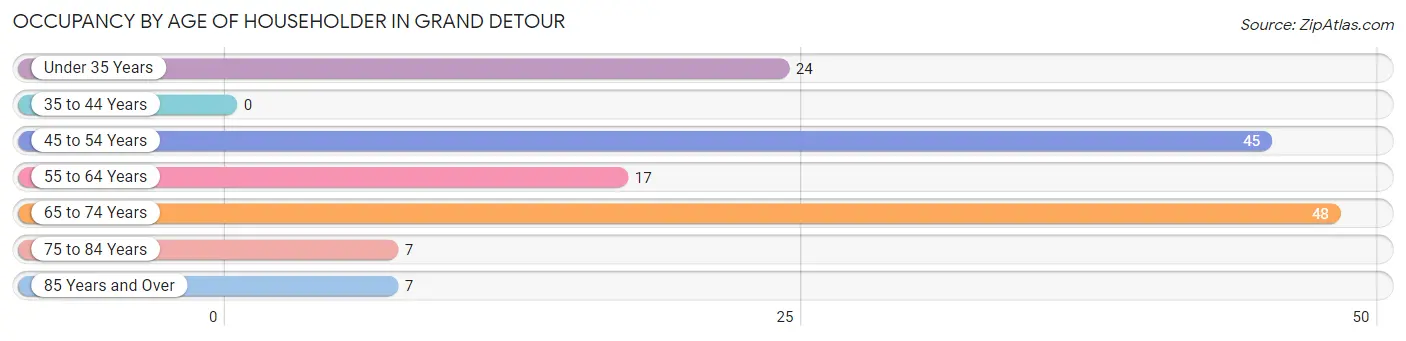
| Age Bracket | # Households | % Households |
| Under 35 Years | 24 | 16.2% |
| 35 to 44 Years | 0 | 0.0% |
| 45 to 54 Years | 45 | 30.4% |
| 55 to 64 Years | 17 | 11.5% |
| 65 to 74 Years | 48 | 32.4% |
| 75 to 84 Years | 7 | 4.7% |
| 85 Years and Over | 7 | 4.7% |
| Total | 148 | 100.0% |
Housing Finances in Grand Detour
Median Income by Occupancy in Grand Detour
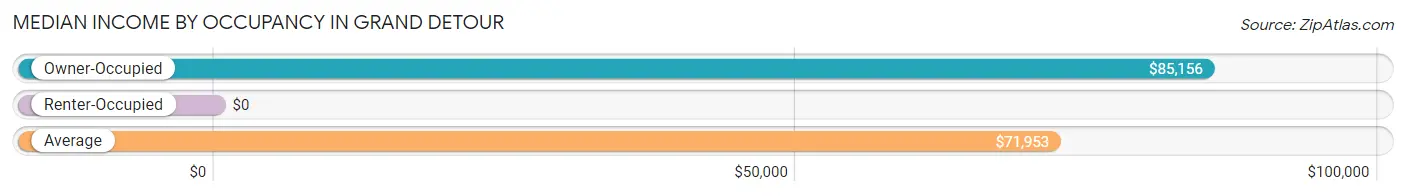
| Occupancy Type | # Households | Median Income |
| Owner-Occupied | 133 (89.9%) | $85,156 |
| Renter-Occupied | 15 (10.1%) | $0 |
| Average | 148 (100.0%) | $71,953 |
Occupancy by Householder Income Bracket in Grand Detour
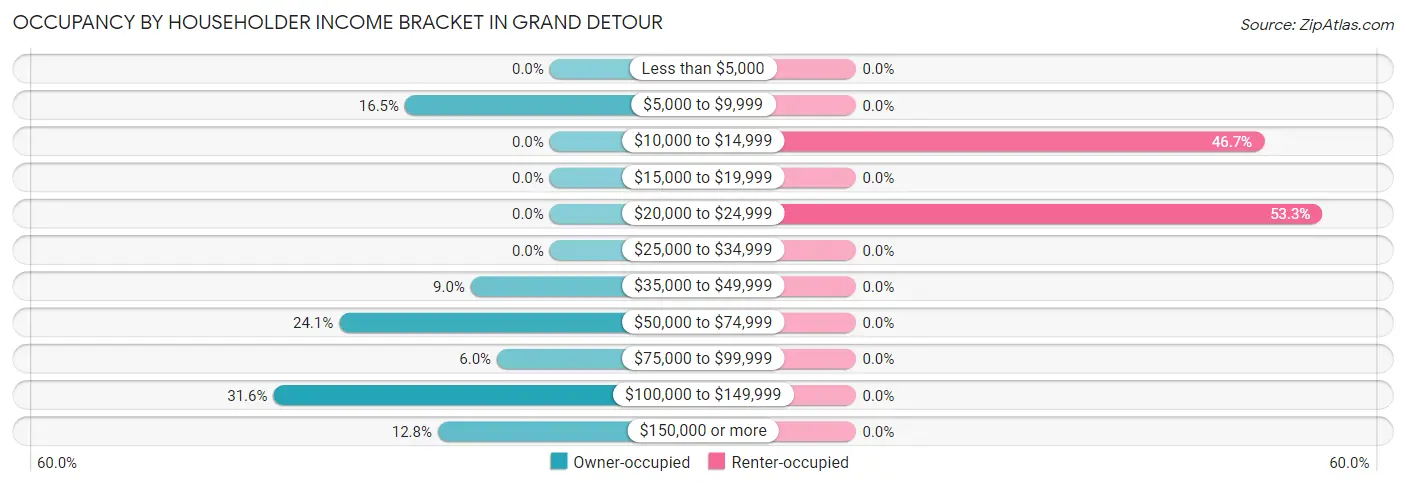
| Income Bracket | Owner-occupied | Renter-occupied |
| Less than $5,000 | 0 (0.0%) | 0 (0.0%) |
| $5,000 to $9,999 | 22 (16.5%) | 0 (0.0%) |
| $10,000 to $14,999 | 0 (0.0%) | 7 (46.7%) |
| $15,000 to $19,999 | 0 (0.0%) | 0 (0.0%) |
| $20,000 to $24,999 | 0 (0.0%) | 8 (53.3%) |
| $25,000 to $34,999 | 0 (0.0%) | 0 (0.0%) |
| $35,000 to $49,999 | 12 (9.0%) | 0 (0.0%) |
| $50,000 to $74,999 | 32 (24.1%) | 0 (0.0%) |
| $75,000 to $99,999 | 8 (6.0%) | 0 (0.0%) |
| $100,000 to $149,999 | 42 (31.6%) | 0 (0.0%) |
| $150,000 or more | 17 (12.8%) | 0 (0.0%) |
| Total | 133 (100.0%) | 15 (100.0%) |
Monthly Housing Cost Tiers in Grand Detour
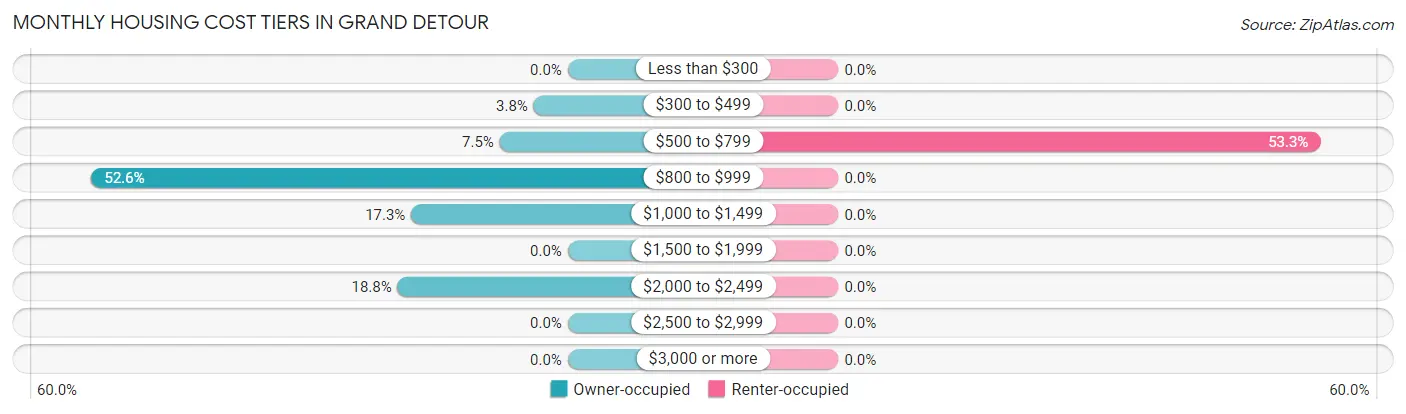
| Monthly Cost | Owner-occupied | Renter-occupied |
| Less than $300 | 0 (0.0%) | 0 (0.0%) |
| $300 to $499 | 5 (3.8%) | 0 (0.0%) |
| $500 to $799 | 10 (7.5%) | 8 (53.3%) |
| $800 to $999 | 70 (52.6%) | 0 (0.0%) |
| $1,000 to $1,499 | 23 (17.3%) | 0 (0.0%) |
| $1,500 to $1,999 | 0 (0.0%) | 0 (0.0%) |
| $2,000 to $2,499 | 25 (18.8%) | 0 (0.0%) |
| $2,500 to $2,999 | 0 (0.0%) | 0 (0.0%) |
| $3,000 or more | 0 (0.0%) | 0 (0.0%) |
| Total | 133 (100.0%) | 15 (100.0%) |
Physical Housing Characteristics in Grand Detour
Housing Structures in Grand Detour
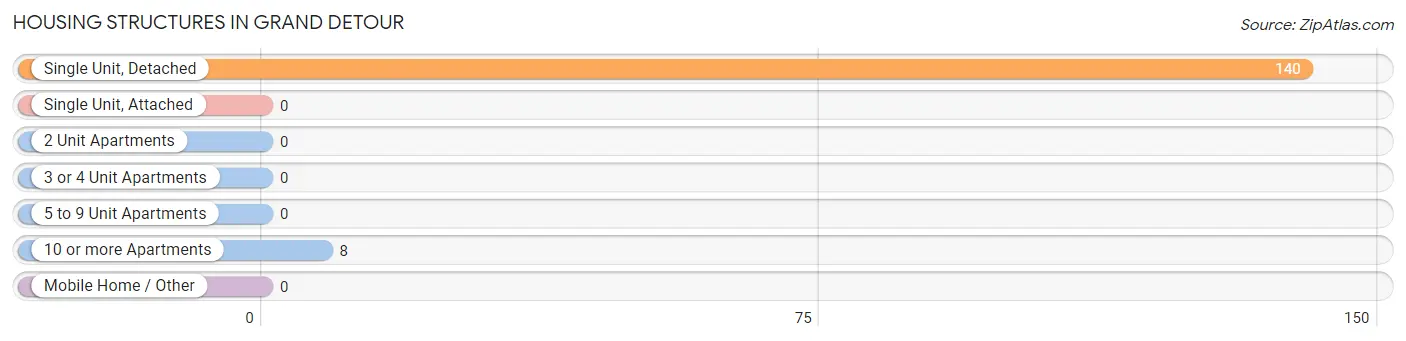
| Structure Type | # Housing Units | % Housing Units |
| Single Unit, Detached | 140 | 94.6% |
| Single Unit, Attached | 0 | 0.0% |
| 2 Unit Apartments | 0 | 0.0% |
| 3 or 4 Unit Apartments | 0 | 0.0% |
| 5 to 9 Unit Apartments | 0 | 0.0% |
| 10 or more Apartments | 8 | 5.4% |
| Mobile Home / Other | 0 | 0.0% |
| Total | 148 | 100.0% |
Housing Structures by Occupancy in Grand Detour
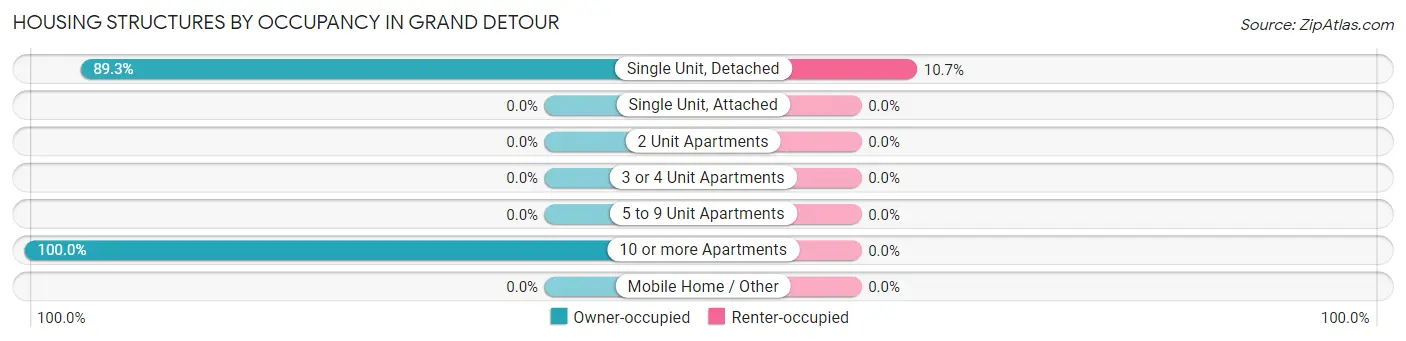
| Structure Type | Owner-occupied | Renter-occupied |
| Single Unit, Detached | 125 (89.3%) | 15 (10.7%) |
| Single Unit, Attached | 0 (0.0%) | 0 (0.0%) |
| 2 Unit Apartments | 0 (0.0%) | 0 (0.0%) |
| 3 or 4 Unit Apartments | 0 (0.0%) | 0 (0.0%) |
| 5 to 9 Unit Apartments | 0 (0.0%) | 0 (0.0%) |
| 10 or more Apartments | 8 (100.0%) | 0 (0.0%) |
| Mobile Home / Other | 0 (0.0%) | 0 (0.0%) |
| Total | 133 (89.9%) | 15 (10.1%) |
Housing Structures by Number of Rooms in Grand Detour
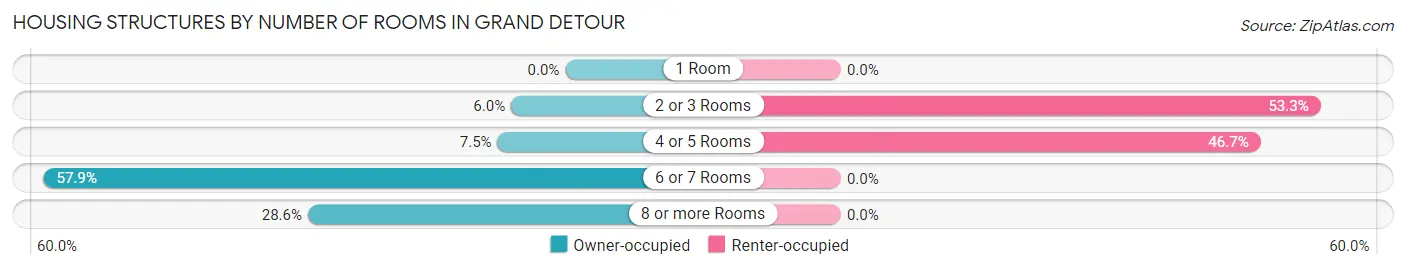
| Number of Rooms | Owner-occupied | Renter-occupied |
| 1 Room | 0 (0.0%) | 0 (0.0%) |
| 2 or 3 Rooms | 8 (6.0%) | 8 (53.3%) |
| 4 or 5 Rooms | 10 (7.5%) | 7 (46.7%) |
| 6 or 7 Rooms | 77 (57.9%) | 0 (0.0%) |
| 8 or more Rooms | 38 (28.6%) | 0 (0.0%) |
| Total | 133 (100.0%) | 15 (100.0%) |
Housing Structure by Heating Type in Grand Detour
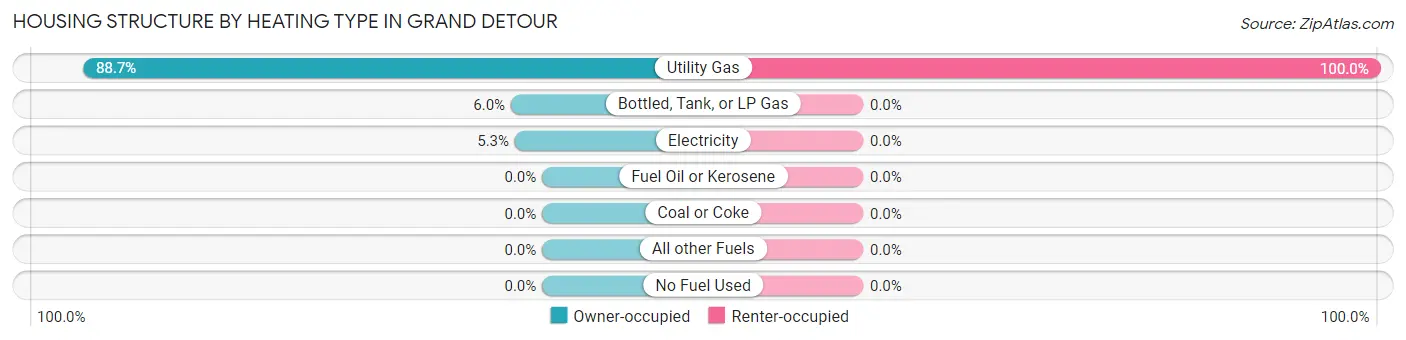
| Heating Type | Owner-occupied | Renter-occupied |
| Utility Gas | 118 (88.7%) | 15 (100.0%) |
| Bottled, Tank, or LP Gas | 8 (6.0%) | 0 (0.0%) |
| Electricity | 7 (5.3%) | 0 (0.0%) |
| Fuel Oil or Kerosene | 0 (0.0%) | 0 (0.0%) |
| Coal or Coke | 0 (0.0%) | 0 (0.0%) |
| All other Fuels | 0 (0.0%) | 0 (0.0%) |
| No Fuel Used | 0 (0.0%) | 0 (0.0%) |
| Total | 133 (100.0%) | 15 (100.0%) |
Household Vehicle Usage in Grand Detour
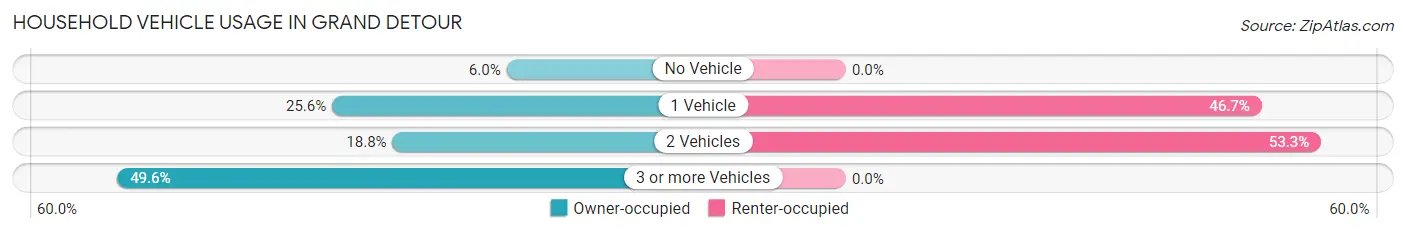
| Vehicles per Household | Owner-occupied | Renter-occupied |
| No Vehicle | 8 (6.0%) | 0 (0.0%) |
| 1 Vehicle | 34 (25.6%) | 7 (46.7%) |
| 2 Vehicles | 25 (18.8%) | 8 (53.3%) |
| 3 or more Vehicles | 66 (49.6%) | 0 (0.0%) |
| Total | 133 (100.0%) | 15 (100.0%) |
Real Estate & Mortgages in Grand Detour
Real Estate and Mortgage Overview in Grand Detour
| Characteristic | Without Mortgage | With Mortgage |
| Housing Units | 61 | 72 |
| Median Property Value | $277,300 | $0 |
| Median Household Income | $71,992 | $17 |
| Monthly Housing Costs | $880 | $0 |
| Real Estate Taxes | $4,638 | $0 |
Property Value by Mortgage Status in Grand Detour
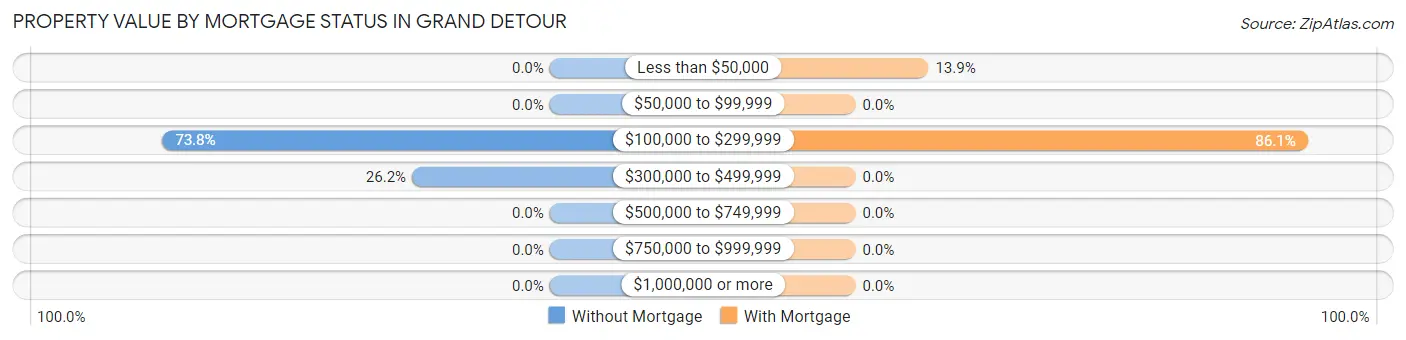
| Property Value | Without Mortgage | With Mortgage |
| Less than $50,000 | 0 (0.0%) | 10 (13.9%) |
| $50,000 to $99,999 | 0 (0.0%) | 0 (0.0%) |
| $100,000 to $299,999 | 45 (73.8%) | 62 (86.1%) |
| $300,000 to $499,999 | 16 (26.2%) | 0 (0.0%) |
| $500,000 to $749,999 | 0 (0.0%) | 0 (0.0%) |
| $750,000 to $999,999 | 0 (0.0%) | 0 (0.0%) |
| $1,000,000 or more | 0 (0.0%) | 0 (0.0%) |
| Total | 61 (100.0%) | 72 (100.0%) |
Household Income by Mortgage Status in Grand Detour
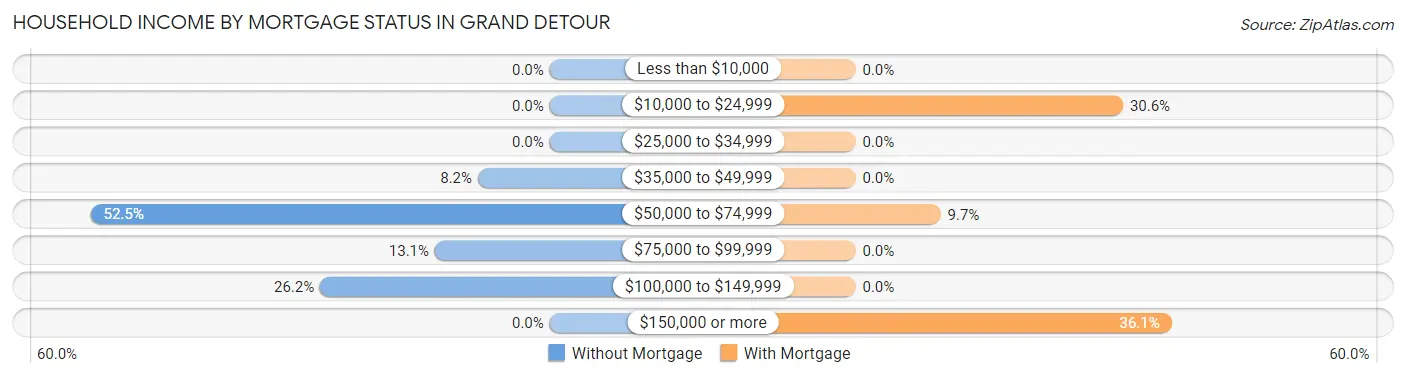
| Household Income | Without Mortgage | With Mortgage |
| Less than $10,000 | 0 (0.0%) | 0 (0.0%) |
| $10,000 to $24,999 | 0 (0.0%) | 22 (30.6%) |
| $25,000 to $34,999 | 0 (0.0%) | 0 (0.0%) |
| $35,000 to $49,999 | 5 (8.2%) | 0 (0.0%) |
| $50,000 to $74,999 | 32 (52.5%) | 7 (9.7%) |
| $75,000 to $99,999 | 8 (13.1%) | 0 (0.0%) |
| $100,000 to $149,999 | 16 (26.2%) | 0 (0.0%) |
| $150,000 or more | 0 (0.0%) | 26 (36.1%) |
| Total | 61 (100.0%) | 72 (100.0%) |
Property Value to Household Income Ratio in Grand Detour
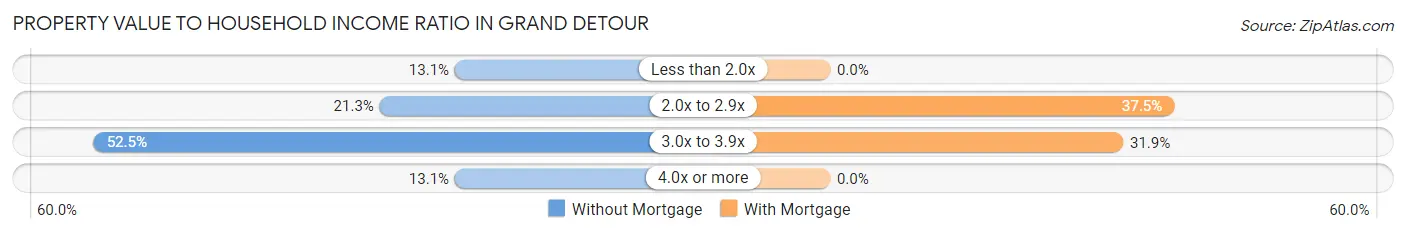
| Value-to-Income Ratio | Without Mortgage | With Mortgage |
| Less than 2.0x | 8 (13.1%) | 0 (0.0%) |
| 2.0x to 2.9x | 13 (21.3%) | 27 (37.5%) |
| 3.0x to 3.9x | 32 (52.5%) | 23 (31.9%) |
| 4.0x or more | 8 (13.1%) | 0 (0.0%) |
| Total | 61 (100.0%) | 72 (100.0%) |
Real Estate Taxes by Mortgage Status in Grand Detour
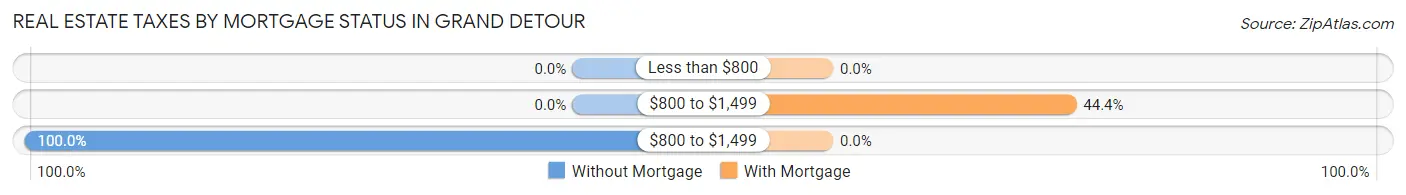
| Property Taxes | Without Mortgage | With Mortgage |
| Less than $800 | 0 (0.0%) | 0 (0.0%) |
| $800 to $1,499 | 0 (0.0%) | 32 (44.4%) |
| $800 to $1,499 | 61 (100.0%) | 0 (0.0%) |
| Total | 61 (100.0%) | 72 (100.0%) |
Health & Disability in Grand Detour
Health Insurance Coverage by Age in Grand Detour
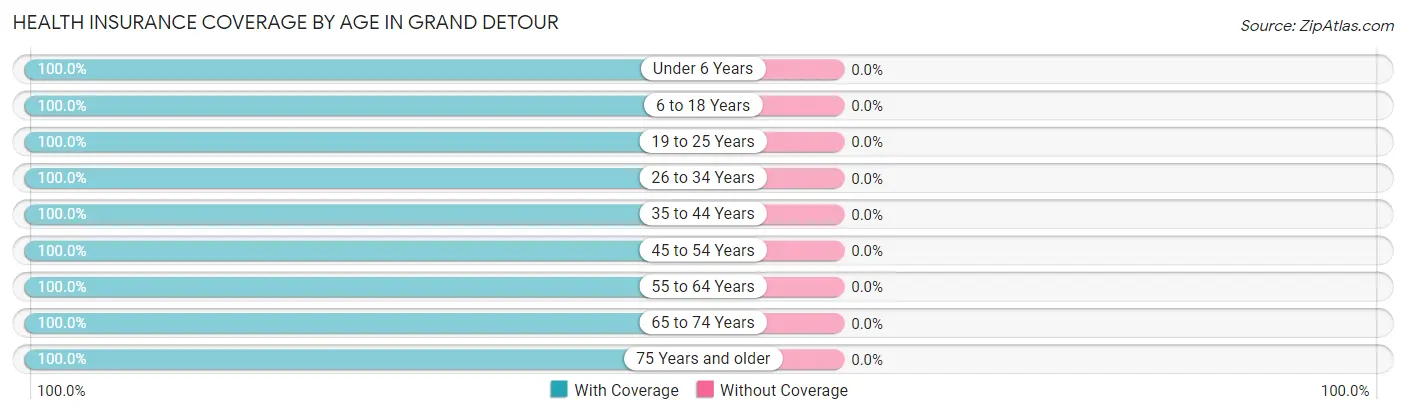
| Age Bracket | With Coverage | Without Coverage |
| Under 6 Years | 14 (100.0%) | 0 (0.0%) |
| 6 to 18 Years | 45 (100.0%) | 0 (0.0%) |
| 19 to 25 Years | 19 (100.0%) | 0 (0.0%) |
| 26 to 34 Years | 47 (100.0%) | 0 (0.0%) |
| 35 to 44 Years | 9 (100.0%) | 0 (0.0%) |
| 45 to 54 Years | 54 (100.0%) | 0 (0.0%) |
| 55 to 64 Years | 34 (100.0%) | 0 (0.0%) |
| 65 to 74 Years | 66 (100.0%) | 0 (0.0%) |
| 75 Years and older | 14 (100.0%) | 0 (0.0%) |
| Total | 302 (100.0%) | 0 (0.0%) |
Health Insurance Coverage by Citizenship Status in Grand Detour
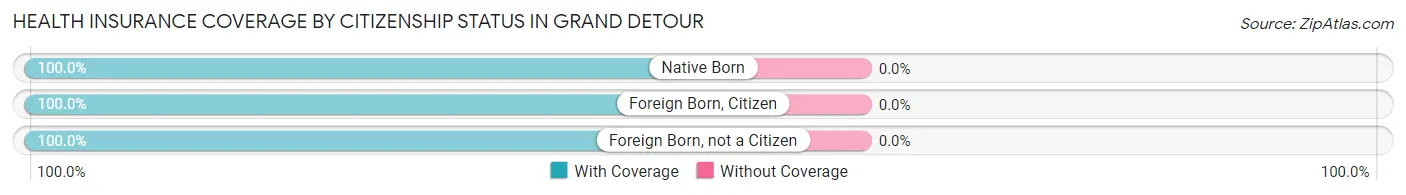
| Citizenship Status | With Coverage | Without Coverage |
| Native Born | 14 (100.0%) | 0 (0.0%) |
| Foreign Born, Citizen | 45 (100.0%) | 0 (0.0%) |
| Foreign Born, not a Citizen | 19 (100.0%) | 0 (0.0%) |
Health Insurance Coverage by Household Income in Grand Detour
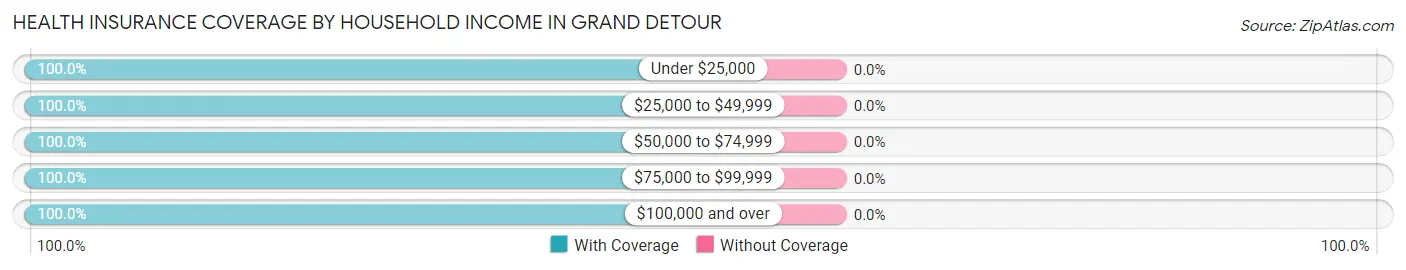
| Household Income | With Coverage | Without Coverage |
| Under $25,000 | 37 (100.0%) | 0 (0.0%) |
| $25,000 to $49,999 | 12 (100.0%) | 0 (0.0%) |
| $50,000 to $74,999 | 96 (100.0%) | 0 (0.0%) |
| $75,000 to $99,999 | 18 (100.0%) | 0 (0.0%) |
| $100,000 and over | 139 (100.0%) | 0 (0.0%) |
Public vs Private Health Insurance Coverage by Age in Grand Detour
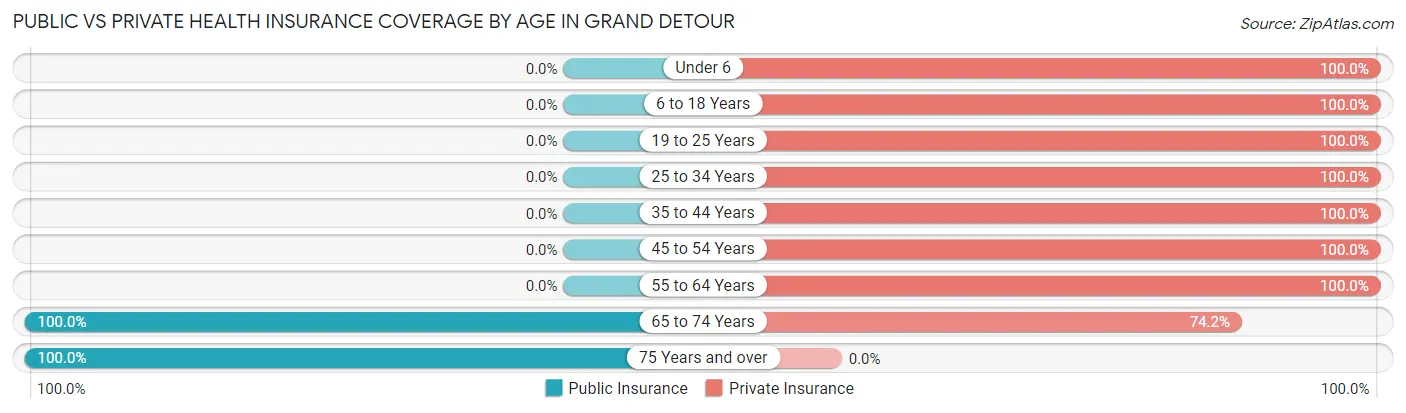
| Age Bracket | Public Insurance | Private Insurance |
| Under 6 | 0 (0.0%) | 14 (100.0%) |
| 6 to 18 Years | 0 (0.0%) | 45 (100.0%) |
| 19 to 25 Years | 0 (0.0%) | 19 (100.0%) |
| 25 to 34 Years | 0 (0.0%) | 47 (100.0%) |
| 35 to 44 Years | 0 (0.0%) | 9 (100.0%) |
| 45 to 54 Years | 0 (0.0%) | 54 (100.0%) |
| 55 to 64 Years | 0 (0.0%) | 34 (100.0%) |
| 65 to 74 Years | 66 (100.0%) | 49 (74.2%) |
| 75 Years and over | 14 (100.0%) | 0 (0.0%) |
| Total | 80 (26.5%) | 271 (89.7%) |
Disability Status by Sex by Age in Grand Detour
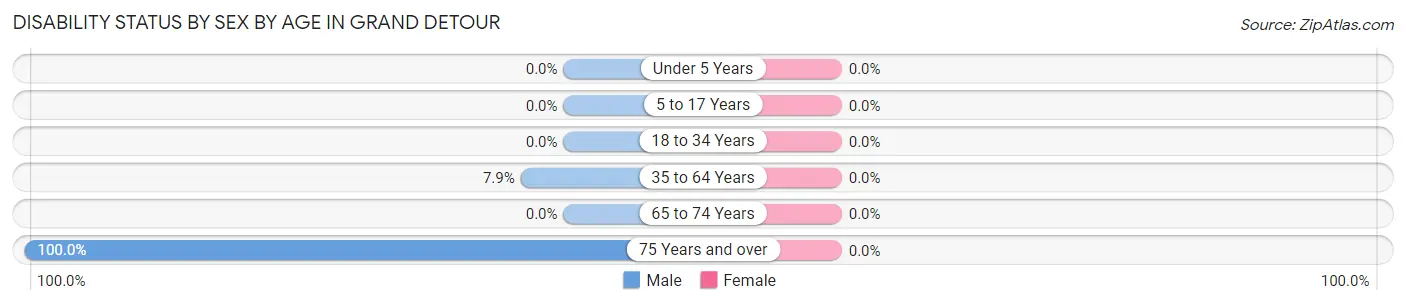
| Age Bracket | Male | Female |
| Under 5 Years | 0 (0.0%) | 0 (0.0%) |
| 5 to 17 Years | 0 (0.0%) | 0 (0.0%) |
| 18 to 34 Years | 0 (0.0%) | 0 (0.0%) |
| 35 to 64 Years | 5 (7.9%) | 0 (0.0%) |
| 65 to 74 Years | 0 (0.0%) | 0 (0.0%) |
| 75 Years and over | 7 (100.0%) | 0 (0.0%) |
Disability Class by Sex by Age in Grand Detour
Disability Class: Hearing Difficulty
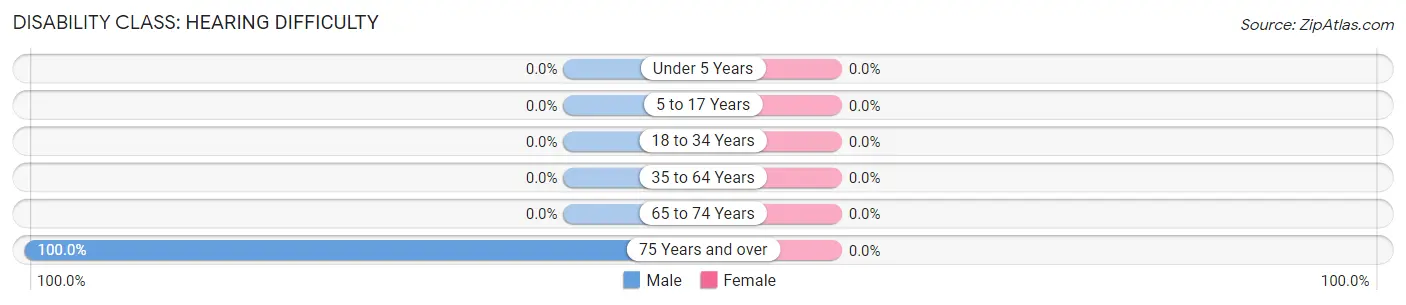
| Age Bracket | Male | Female |
| Under 5 Years | 0 (0.0%) | 0 (0.0%) |
| 5 to 17 Years | 0 (0.0%) | 0 (0.0%) |
| 18 to 34 Years | 0 (0.0%) | 0 (0.0%) |
| 35 to 64 Years | 0 (0.0%) | 0 (0.0%) |
| 65 to 74 Years | 0 (0.0%) | 0 (0.0%) |
| 75 Years and over | 7 (100.0%) | 0 (0.0%) |
Disability Class: Vision Difficulty
| Age Bracket | Male | Female |
| Under 5 Years | 0 (0.0%) | 0 (0.0%) |
| 5 to 17 Years | 0 (0.0%) | 0 (0.0%) |
| 18 to 34 Years | 0 (0.0%) | 0 (0.0%) |
| 35 to 64 Years | 0 (0.0%) | 0 (0.0%) |
| 65 to 74 Years | 0 (0.0%) | 0 (0.0%) |
| 75 Years and over | 0 (0.0%) | 0 (0.0%) |
Disability Class: Cognitive Difficulty
| Age Bracket | Male | Female |
| 5 to 17 Years | 0 (0.0%) | 0 (0.0%) |
| 18 to 34 Years | 0 (0.0%) | 0 (0.0%) |
| 35 to 64 Years | 0 (0.0%) | 0 (0.0%) |
| 65 to 74 Years | 0 (0.0%) | 0 (0.0%) |
| 75 Years and over | 0 (0.0%) | 0 (0.0%) |
Disability Class: Ambulatory Difficulty
| Age Bracket | Male | Female |
| 5 to 17 Years | 0 (0.0%) | 0 (0.0%) |
| 18 to 34 Years | 0 (0.0%) | 0 (0.0%) |
| 35 to 64 Years | 0 (0.0%) | 0 (0.0%) |
| 65 to 74 Years | 0 (0.0%) | 0 (0.0%) |
| 75 Years and over | 7 (100.0%) | 0 (0.0%) |
Disability Class: Self-Care Difficulty
| Age Bracket | Male | Female |
| 5 to 17 Years | 0 (0.0%) | 0 (0.0%) |
| 18 to 34 Years | 0 (0.0%) | 0 (0.0%) |
| 35 to 64 Years | 5 (7.9%) | 0 (0.0%) |
| 65 to 74 Years | 0 (0.0%) | 0 (0.0%) |
| 75 Years and over | 7 (100.0%) | 0 (0.0%) |
Technology Access in Grand Detour
Computing Device Access in Grand Detour
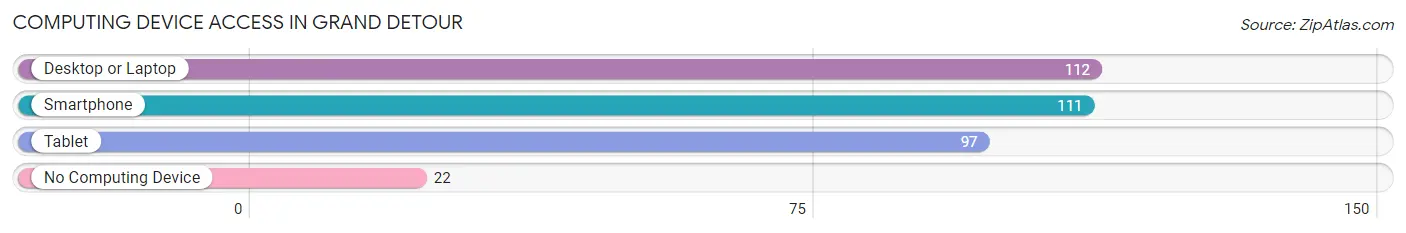
| Device Type | # Households | % Households |
| Desktop or Laptop | 112 | 75.7% |
| Smartphone | 111 | 75.0% |
| Tablet | 97 | 65.5% |
| No Computing Device | 22 | 14.9% |
| Total | 148 | 100.0% |
Internet Access in Grand Detour
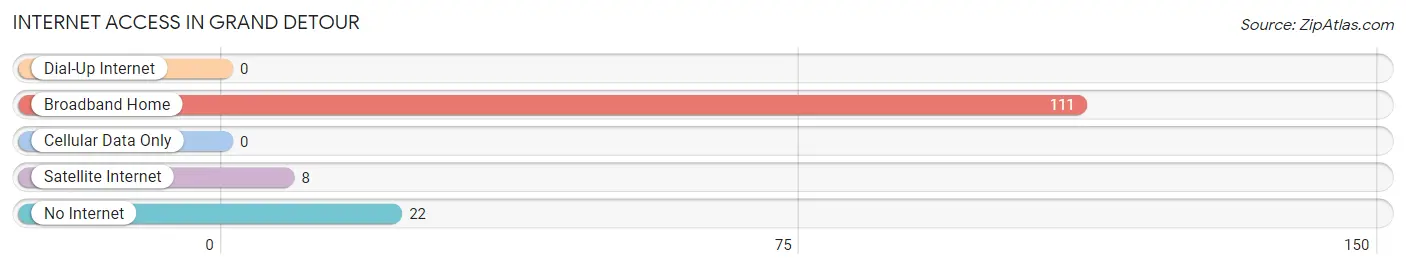
| Internet Type | # Households | % Households |
| Dial-Up Internet | 0 | 0.0% |
| Broadband Home | 111 | 75.0% |
| Cellular Data Only | 0 | 0.0% |
| Satellite Internet | 8 | 5.4% |
| No Internet | 22 | 14.9% |
| Total | 148 | 100.0% |
Grand Detour Summary
History
The small village of Grand Detour, Illinois is located in Ogle County, approximately 25 miles northwest of Rockford. The village was founded in 1835 by John Deere, the inventor of the steel plow. Deere had moved to the area from Vermont in search of a better life and was inspired by the rich soil of the area. He purchased a small tract of land and began to build a small village. The village was named after the “Grand Detour” of the Rock River, which was a popular route for travelers and traders.
The village grew slowly but steadily over the years, and by the late 19th century, it had become a thriving agricultural community. The village was home to a number of businesses, including a blacksmith, a general store, a hotel, and a post office. The village also had a school, a church, and a cemetery.
In the early 20th century, the village began to decline as the population shifted to larger cities. By the 1950s, the village had become a virtual ghost town. However, in the late 1970s, the village was rediscovered by a group of local residents who wanted to preserve its history and charm. The village was restored and is now a popular tourist destination.
Geography
Grand Detour is located in the northern part of Ogle County, Illinois. It is situated on the banks of the Rock River, which is a tributary of the Mississippi River. The village is surrounded by rolling hills and farmland, and is located approximately 25 miles northwest of Rockford.
The village is located at an elevation of 745 feet above sea level. The climate is humid continental, with hot summers and cold winters. The average annual temperature is around 50 degrees Fahrenheit.
Economy
The economy of Grand Detour is largely based on tourism. The village is a popular destination for visitors who are interested in its history and charm. The village is home to a number of historic buildings, including the John Deere House, the Grand Detour Hotel, and the Grand Detour Post Office.
The village also has a number of small businesses, including a general store, a cafe, and a bed and breakfast. The village is also home to a number of artists and craftspeople who sell their wares in the village.
Demographics
As of the 2010 census, the population of Grand Detour was 545. The racial makeup of the village was 97.3% White, 0.7% African American, 0.2% Native American, 0.2% Asian, and 1.6% from other races. The median household income was $45,000, and the median age was 44.
Grand Detour is a small, rural village with a strong sense of community. The village is home to a number of historic buildings and is a popular destination for visitors who are interested in its history and charm. The village is also home to a number of small businesses and artists, and is a great place to live and work.
Common Questions
What is Per Capita Income in Grand Detour?
Per Capita income in Grand Detour is $43,585.
What is the Median Family Income in Grand Detour?
Median Family Income in Grand Detour is $121,484.
What is the Median Household income in Grand Detour?
Median Household Income in Grand Detour is $71,953.
What is Inequality or Gini Index in Grand Detour?
Inequality or Gini Index in Grand Detour is 0.41.
What is the Total Population of Grand Detour?
Total Population of Grand Detour is 302.
What is the Total Male Population of Grand Detour?
Total Male Population of Grand Detour is 187.
What is the Total Female Population of Grand Detour?
Total Female Population of Grand Detour is 115.
What is the Ratio of Males per 100 Females in Grand Detour?
There are 162.61 Males per 100 Females in Grand Detour.
What is the Ratio of Females per 100 Males in Grand Detour?
There are 61.50 Females per 100 Males in Grand Detour.
What is the Median Population Age in Grand Detour?
Median Population Age in Grand Detour is 49.4 Years.
What is the Average Family Size in Grand Detour
Average Family Size in Grand Detour is 2.6 People.
What is the Average Household Size in Grand Detour
Average Household Size in Grand Detour is 2.0 People.
How Large is the Labor Force in Grand Detour?
There are 174 People in the Labor Forcein in Grand Detour.
What is the Percentage of People in the Labor Force in Grand Detour?
60.4% of People are in the Labor Force in Grand Detour.
What is the Unemployment Rate in Grand Detour?
Unemployment Rate in Grand Detour is 16.7%.