Fairview Heights, IL Map & Demographics
Fairview Heights Map
Fairview Heights Overview
$37,540
PER CAPITA INCOME
$88,326
AVG FAMILY INCOME
$74,038
AVG HOUSEHOLD INCOME
23.6%
WAGE / INCOME GAP [ % ]
76.4¢/ $1
WAGE / INCOME GAP [ $ ]
0.40
INEQUALITY / GINI INDEX
16,360
TOTAL POPULATION
8,347
MALE POPULATION
8,013
FEMALE POPULATION
104.17
MALES / 100 FEMALES
96.00
FEMALES / 100 MALES
40.0
MEDIAN AGE
3.1
AVG FAMILY SIZE
2.3
AVG HOUSEHOLD SIZE
8,792
LABOR FORCE [ PEOPLE ]
66.5%
PERCENT IN LABOR FORCE
6.0%
UNEMPLOYMENT RATE
Fairview Heights Zip Codes
Fairview Heights Area Codes
Income in Fairview Heights
Income Overview in Fairview Heights
Per Capita Income in Fairview Heights is $37,540, while median incomes of families and households are $88,326 and $74,038 respectively.
| Characteristic | Number | Measure |
| Per Capita Income | 16,360 | $37,540 |
| Median Family Income | 4,007 | $88,326 |
| Mean Family Income | 4,007 | $106,871 |
| Median Household Income | 7,026 | $74,038 |
| Mean Household Income | 7,026 | $85,786 |
| Income Deficit | 4,007 | $0 |
| Wage / Income Gap (%) | 16,360 | 23.64% |
| Wage / Income Gap ($) | 16,360 | 76.36¢ per $1 |
| Gini / Inequality Index | 16,360 | 0.40 |
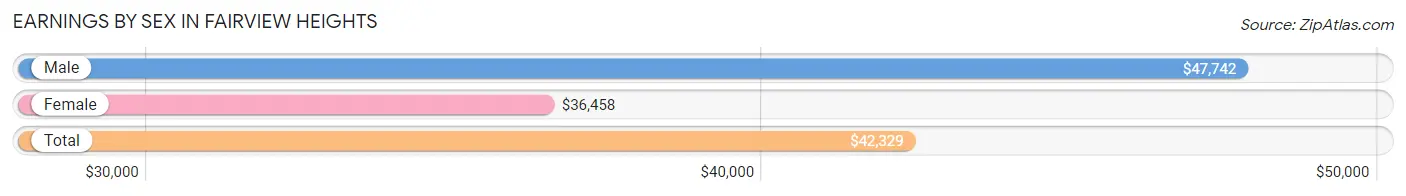
Earnings by Sex in Fairview Heights
Average Earnings in Fairview Heights are $42,329, $47,742 for men and $36,458 for women, a difference of 23.6%.
| Sex | Number | Average Earnings |
| Male | 4,561 (51.5%) | $47,742 |
| Female | 4,287 (48.4%) | $36,458 |
| Total | 8,848 (100.0%) | $42,329 |
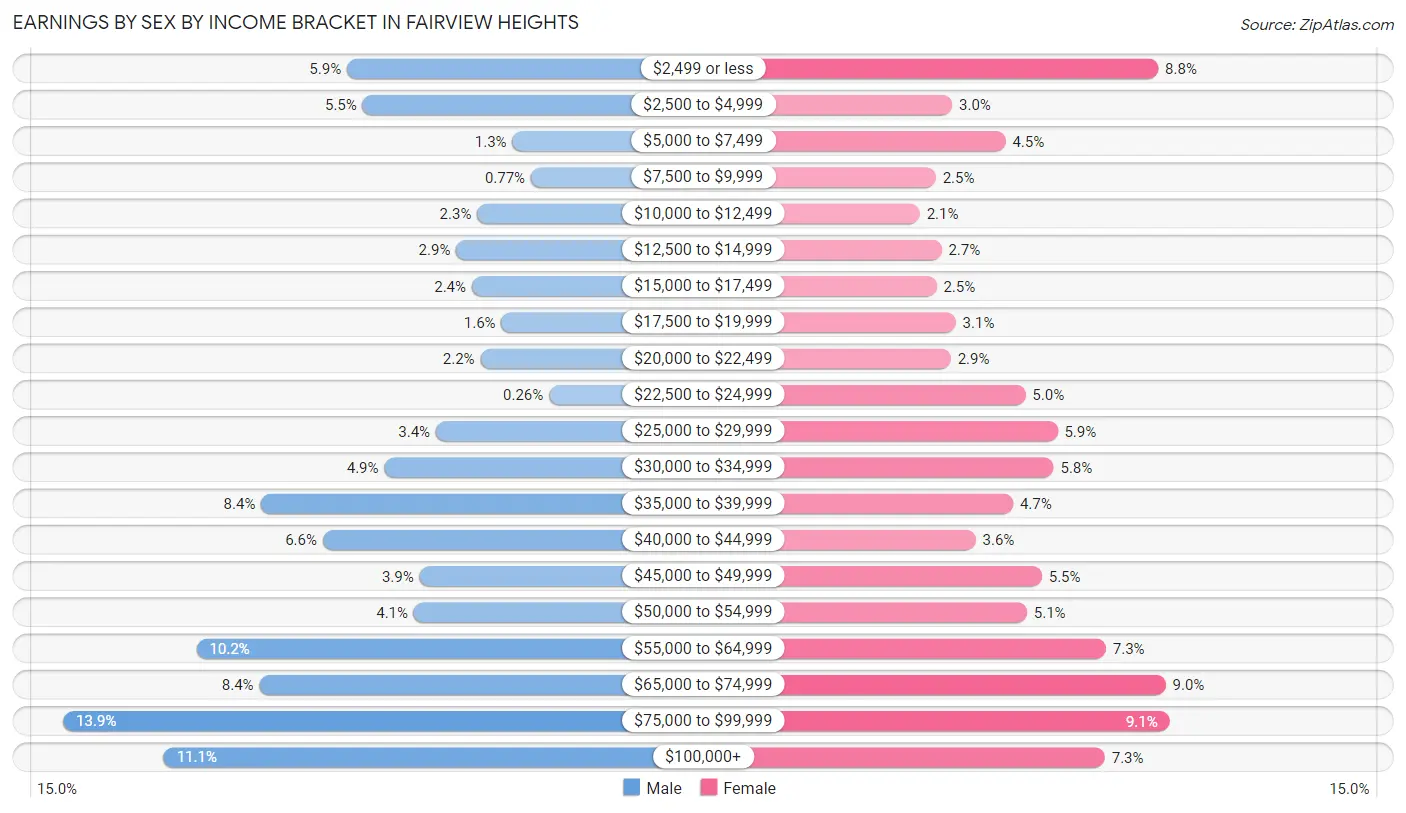
Earnings by Sex by Income Bracket in Fairview Heights
The most common earnings brackets in Fairview Heights are $75,000 to $99,999 for men (635 | 13.9%) and $75,000 to $99,999 for women (389 | 9.1%).
| Income | Male | Female |
| $2,499 or less | 271 (5.9%) | 375 (8.7%) |
| $2,500 to $4,999 | 251 (5.5%) | 127 (3.0%) |
| $5,000 to $7,499 | 59 (1.3%) | 191 (4.5%) |
| $7,500 to $9,999 | 35 (0.8%) | 107 (2.5%) |
| $10,000 to $12,499 | 104 (2.3%) | 88 (2.1%) |
| $12,500 to $14,999 | 131 (2.9%) | 114 (2.7%) |
| $15,000 to $17,499 | 111 (2.4%) | 108 (2.5%) |
| $17,500 to $19,999 | 73 (1.6%) | 131 (3.1%) |
| $20,000 to $22,499 | 100 (2.2%) | 125 (2.9%) |
| $22,500 to $24,999 | 12 (0.3%) | 215 (5.0%) |
| $25,000 to $29,999 | 157 (3.4%) | 254 (5.9%) |
| $30,000 to $34,999 | 223 (4.9%) | 249 (5.8%) |
| $35,000 to $39,999 | 381 (8.4%) | 200 (4.7%) |
| $40,000 to $44,999 | 302 (6.6%) | 155 (3.6%) |
| $45,000 to $49,999 | 178 (3.9%) | 235 (5.5%) |
| $50,000 to $54,999 | 185 (4.1%) | 217 (5.1%) |
| $55,000 to $64,999 | 464 (10.2%) | 312 (7.3%) |
| $65,000 to $74,999 | 383 (8.4%) | 384 (9.0%) |
| $75,000 to $99,999 | 635 (13.9%) | 389 (9.1%) |
| $100,000+ | 506 (11.1%) | 311 (7.2%) |
| Total | 4,561 (100.0%) | 4,287 (100.0%) |
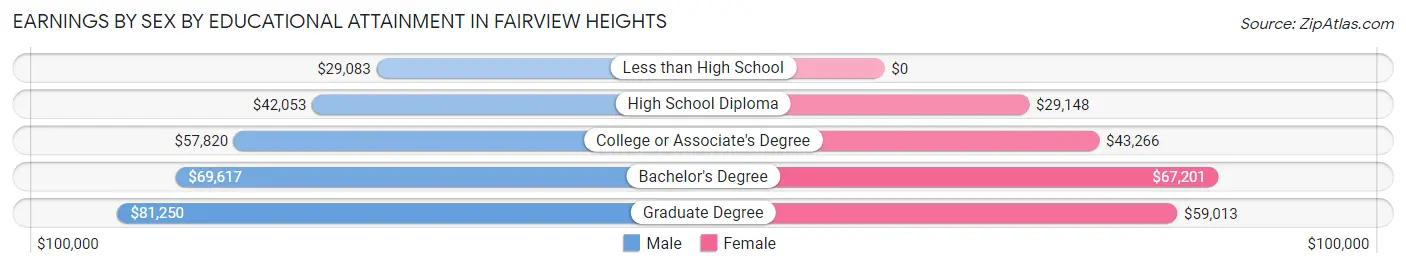
Earnings by Sex by Educational Attainment in Fairview Heights
Average earnings in Fairview Heights are $54,745 for men and $46,740 for women, a difference of 14.6%. Men with an educational attainment of graduate degree enjoy the highest average annual earnings of $81,250, while those with less than high school education earn the least with $29,083. Women with an educational attainment of bachelor's degree earn the most with the average annual earnings of $67,201, while those with high school diploma education have the smallest earnings of $29,148.
| Educational Attainment | Male Income | Female Income |
| Less than High School | $29,083 | $0 |
| High School Diploma | $42,053 | $29,148 |
| College or Associate's Degree | $57,820 | $43,266 |
| Bachelor's Degree | $69,617 | $67,201 |
| Graduate Degree | $81,250 | $59,013 |
| Total | $54,745 | $46,740 |
Family Income in Fairview Heights
Family Income Brackets in Fairview Heights
According to the Fairview Heights family income data, there are 853 families falling into the $100,000 to $149,999 income range, which is the most common income bracket and makes up 21.3% of all families. Conversely, the $10,000 to $14,999 income bracket is the least frequent group with only 44 families (1.1%) belonging to this category.
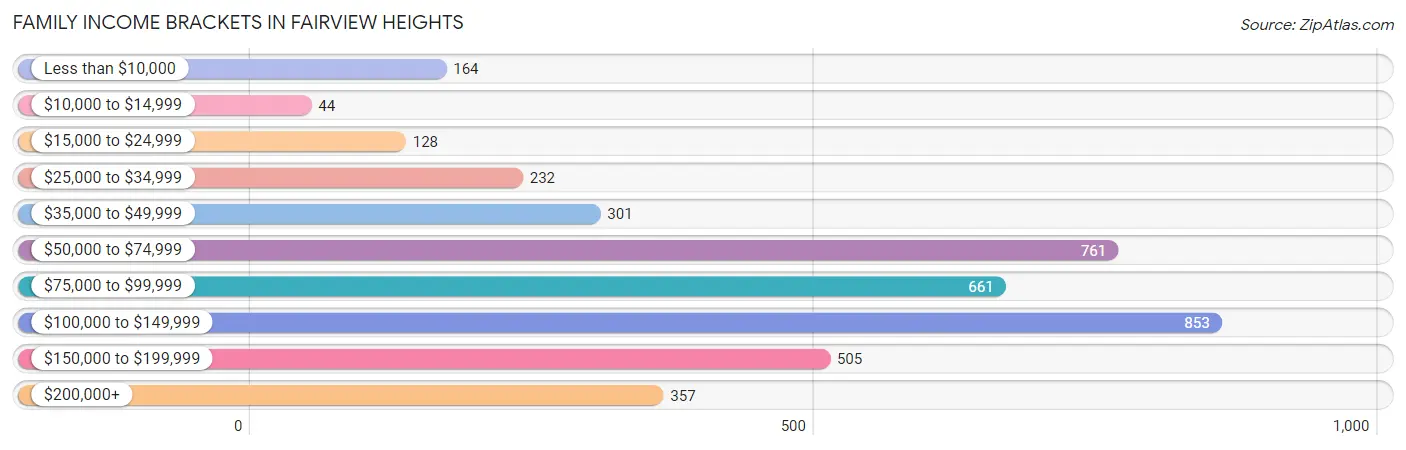
| Income Bracket | # Families | % Families |
| Less than $10,000 | 164 | 4.1% |
| $10,000 to $14,999 | 44 | 1.1% |
| $15,000 to $24,999 | 128 | 3.2% |
| $25,000 to $34,999 | 232 | 5.8% |
| $35,000 to $49,999 | 301 | 7.5% |
| $50,000 to $74,999 | 761 | 19.0% |
| $75,000 to $99,999 | 661 | 16.5% |
| $100,000 to $149,999 | 853 | 21.3% |
| $150,000 to $199,999 | 505 | 12.6% |
| $200,000+ | 357 | 8.9% |
Family Income by Famaliy Size in Fairview Heights
4-person families (507 | 12.7%) account for the highest median family income in Fairview Heights with $145,398 per family, while 2-person families (2,282 | 57.0%) have the highest median income of $39,120 per family member.
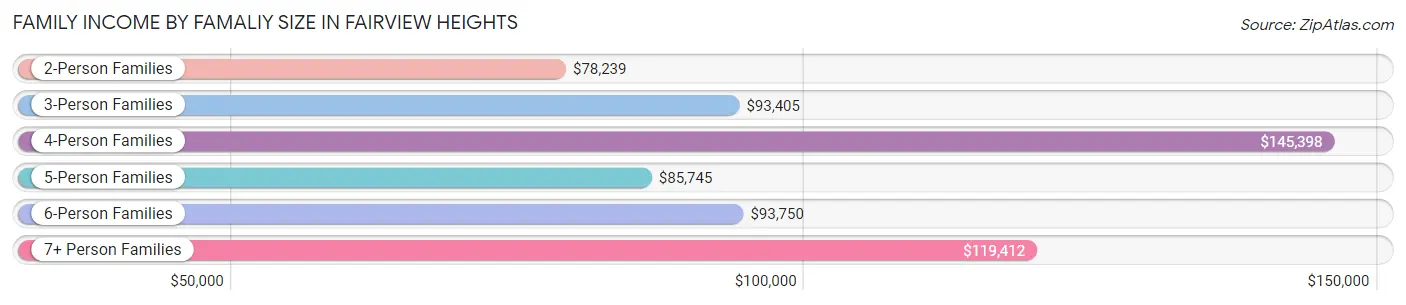
| Income Bracket | # Families | Median Income |
| 2-Person Families | 2,282 (57.0%) | $78,239 |
| 3-Person Families | 717 (17.9%) | $93,405 |
| 4-Person Families | 507 (12.7%) | $145,398 |
| 5-Person Families | 210 (5.2%) | $85,745 |
| 6-Person Families | 173 (4.3%) | $93,750 |
| 7+ Person Families | 118 (2.9%) | $119,412 |
| Total | 4,007 (100.0%) | $88,326 |
Family Income by Number of Earners in Fairview Heights
The median family income in Fairview Heights is $88,326, with families comprising 3+ earners (437) having the highest median family income of $144,917, while families with 1 earner (1,351) have the lowest median family income of $59,742, accounting for 10.9% and 33.7% of families, respectively.
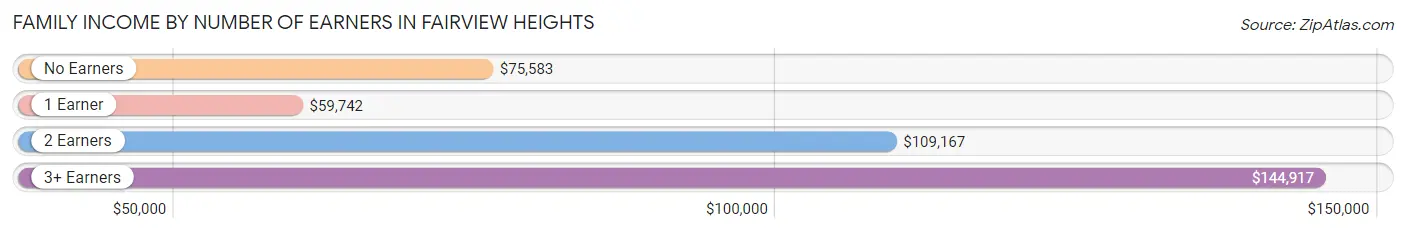
| Number of Earners | # Families | Median Income |
| No Earners | 623 (15.5%) | $75,583 |
| 1 Earner | 1,351 (33.7%) | $59,742 |
| 2 Earners | 1,596 (39.8%) | $109,167 |
| 3+ Earners | 437 (10.9%) | $144,917 |
| Total | 4,007 (100.0%) | $88,326 |
Household Income in Fairview Heights
Household Income Brackets in Fairview Heights
With 1,525 households falling in the category, the $75,000 to $99,999 income range is the most frequent in Fairview Heights, accounting for 21.7% of all households. In contrast, only 204 households (2.9%) fall into the $10,000 to $14,999 income bracket, making it the least populous group.
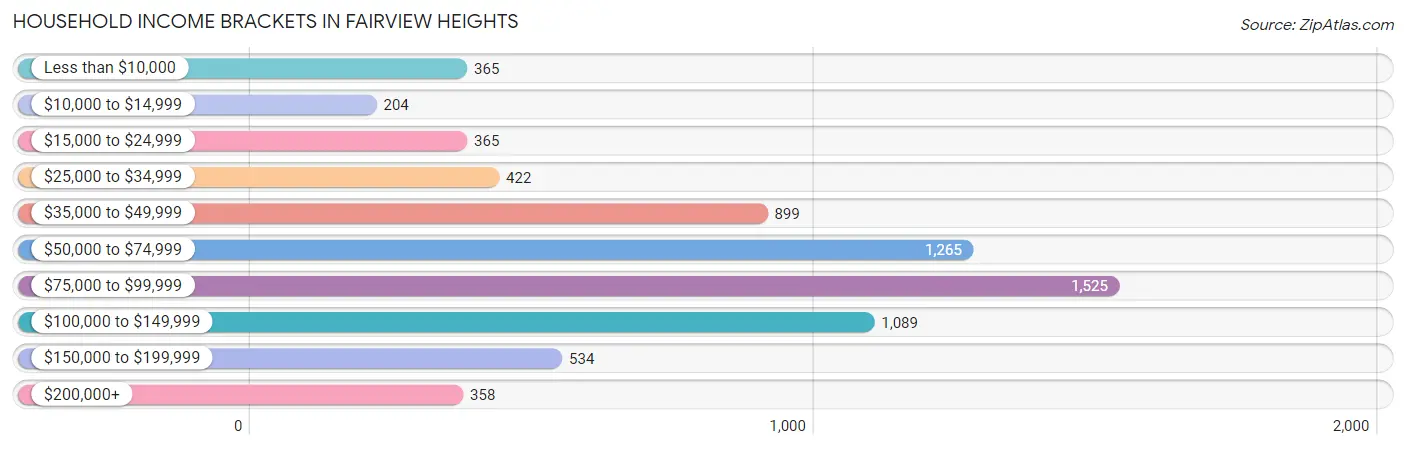
| Income Bracket | # Households | % Households |
| Less than $10,000 | 365 | 5.2% |
| $10,000 to $14,999 | 204 | 2.9% |
| $15,000 to $24,999 | 365 | 5.2% |
| $25,000 to $34,999 | 422 | 6.0% |
| $35,000 to $49,999 | 899 | 12.8% |
| $50,000 to $74,999 | 1,265 | 18.0% |
| $75,000 to $99,999 | 1,525 | 21.7% |
| $100,000 to $149,999 | 1,089 | 15.5% |
| $150,000 to $199,999 | 534 | 7.6% |
| $200,000+ | 358 | 5.1% |
Household Income by Householder Age in Fairview Heights
The median household income in Fairview Heights is $74,038, with the highest median household income of $78,841 found in the 65+ years age bracket for the primary householder. A total of 1,815 households (25.8%) fall into this category. Meanwhile, the 15 to 24 years age bracket for the primary householder has the lowest median household income of $44,926, with 341 households (4.9%) in this group.
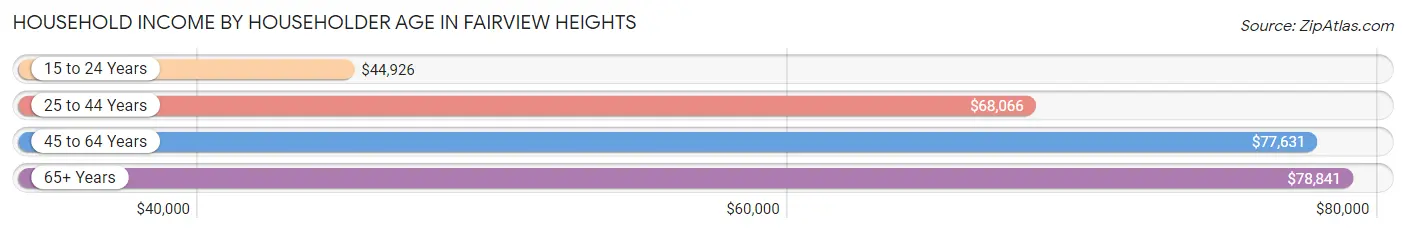
| Income Bracket | # Households | Median Income |
| 15 to 24 Years | 341 (4.9%) | $44,926 |
| 25 to 44 Years | 2,389 (34.0%) | $68,066 |
| 45 to 64 Years | 2,481 (35.3%) | $77,631 |
| 65+ Years | 1,815 (25.8%) | $78,841 |
| Total | 7,026 (100.0%) | $74,038 |
Poverty in Fairview Heights
Income Below Poverty by Sex and Age in Fairview Heights
With 8.7% poverty level for males and 10.2% for females among the residents of Fairview Heights, 5 year old males and 6 to 11 year old females are the most vulnerable to poverty, with 23 males (33.3%) and 177 females (27.8%) in their respective age groups living below the poverty level.
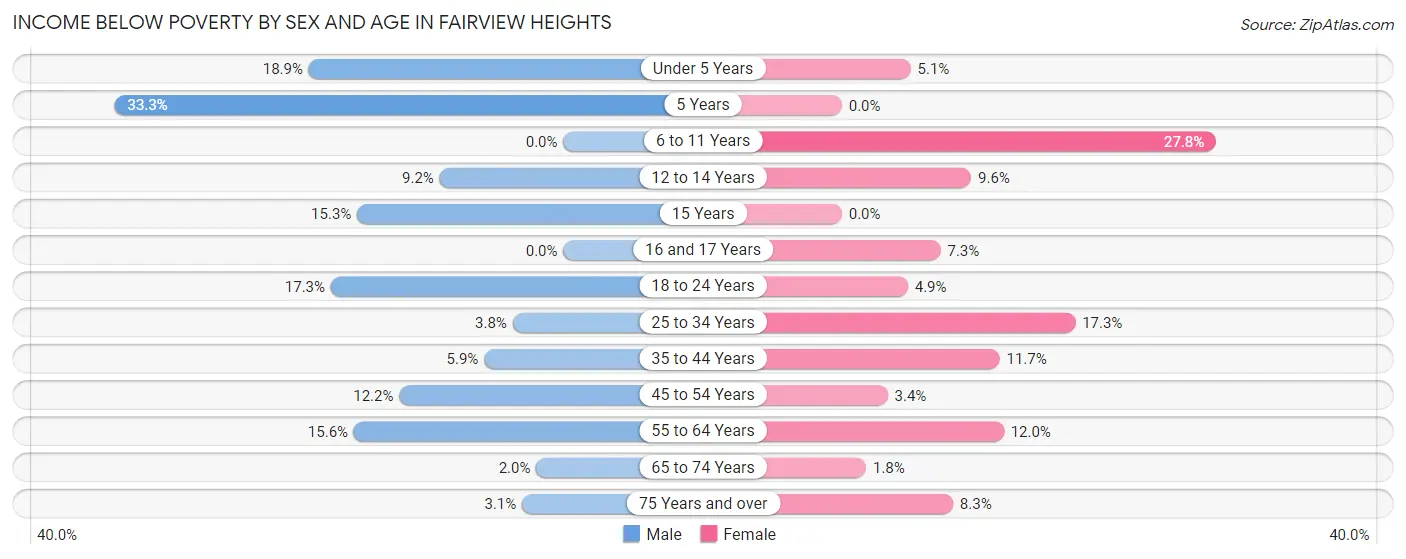
| Age Bracket | Male | Female |
| Under 5 Years | 79 (18.9%) | 17 (5.1%) |
| 5 Years | 23 (33.3%) | 0 (0.0%) |
| 6 to 11 Years | 0 (0.0%) | 177 (27.8%) |
| 12 to 14 Years | 39 (9.2%) | 24 (9.6%) |
| 15 Years | 15 (15.3%) | 0 (0.0%) |
| 16 and 17 Years | 0 (0.0%) | 17 (7.3%) |
| 18 to 24 Years | 140 (17.3%) | 33 (4.9%) |
| 25 to 34 Years | 32 (3.8%) | 173 (17.3%) |
| 35 to 44 Years | 67 (5.9%) | 138 (11.7%) |
| 45 to 54 Years | 128 (12.2%) | 37 (3.4%) |
| 55 to 64 Years | 170 (15.5%) | 138 (12.0%) |
| 65 to 74 Years | 17 (2.0%) | 13 (1.8%) |
| 75 Years and over | 14 (3.1%) | 48 (8.3%) |
| Total | 724 (8.7%) | 815 (10.2%) |
Income Above Poverty by Sex and Age in Fairview Heights
According to the poverty statistics in Fairview Heights, males aged 6 to 11 years and females aged 5 years are the age groups that are most secure financially, with 100.0% of males and 100.0% of females in these age groups living above the poverty line.
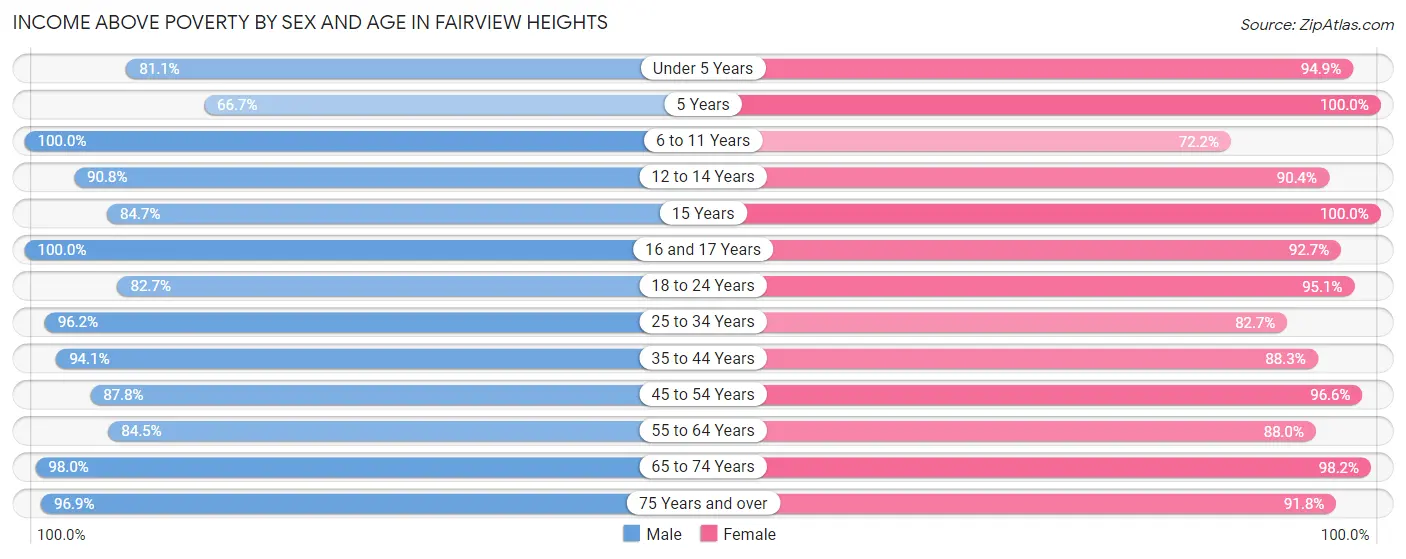
| Age Bracket | Male | Female |
| Under 5 Years | 339 (81.1%) | 316 (94.9%) |
| 5 Years | 46 (66.7%) | 79 (100.0%) |
| 6 to 11 Years | 690 (100.0%) | 460 (72.2%) |
| 12 to 14 Years | 386 (90.8%) | 226 (90.4%) |
| 15 Years | 83 (84.7%) | 46 (100.0%) |
| 16 and 17 Years | 340 (100.0%) | 215 (92.7%) |
| 18 to 24 Years | 671 (82.7%) | 641 (95.1%) |
| 25 to 34 Years | 818 (96.2%) | 825 (82.7%) |
| 35 to 44 Years | 1,072 (94.1%) | 1,040 (88.3%) |
| 45 to 54 Years | 923 (87.8%) | 1,051 (96.6%) |
| 55 to 64 Years | 923 (84.5%) | 1,010 (88.0%) |
| 65 to 74 Years | 830 (98.0%) | 710 (98.2%) |
| 75 Years and over | 443 (96.9%) | 534 (91.7%) |
| Total | 7,564 (91.3%) | 7,153 (89.8%) |
Income Below Poverty Among Married-Couple Families in Fairview Heights
The poverty statistics for married-couple families in Fairview Heights show that 0.5% or 15 of the total 2,793 families live below the poverty line. Families with no children have the highest poverty rate of 0.8%, comprising of 15 families. On the other hand, families with 1 or 2 children have the lowest poverty rate of 0.0%, which includes 0 families.
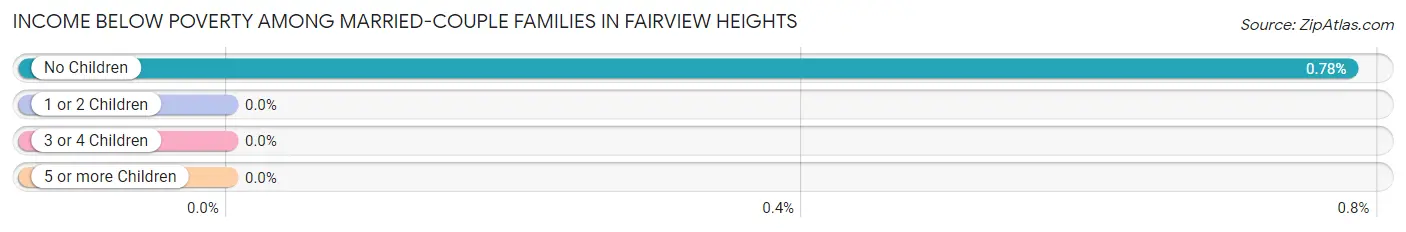
| Children | Above Poverty | Below Poverty |
| No Children | 1,909 (99.2%) | 15 (0.8%) |
| 1 or 2 Children | 528 (100.0%) | 0 (0.0%) |
| 3 or 4 Children | 294 (100.0%) | 0 (0.0%) |
| 5 or more Children | 47 (100.0%) | 0 (0.0%) |
| Total | 2,778 (99.5%) | 15 (0.5%) |
Income Below Poverty Among Single-Parent Households in Fairview Heights
According to the poverty data in Fairview Heights, 12.8% or 28 single-father households and 22.0% or 219 single-mother households are living below the poverty line. Among single-father households, those with no children have the highest poverty rate, with 12 households (54.5%) experiencing poverty. Likewise, among single-mother households, those with 1 or 2 children have the highest poverty rate, with 177 households (28.4%) falling below the poverty line.
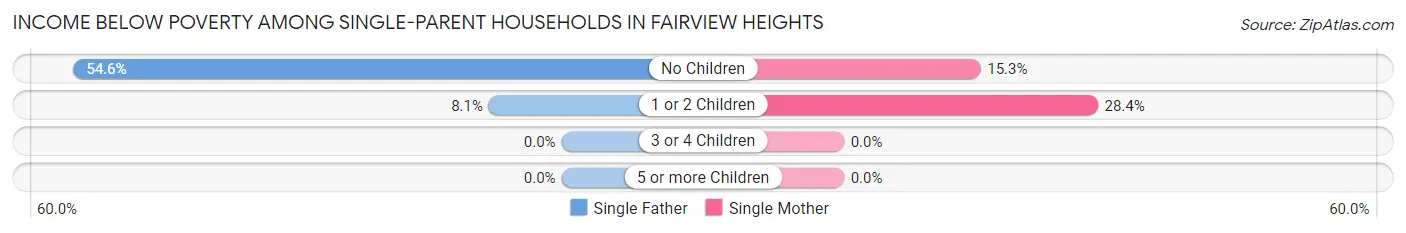
| Children | Single Father | Single Mother |
| No Children | 12 (54.5%) | 42 (15.3%) |
| 1 or 2 Children | 16 (8.1%) | 177 (28.4%) |
| 3 or 4 Children | 0 (0.0%) | 0 (0.0%) |
| 5 or more Children | 0 (0.0%) | 0 (0.0%) |
| Total | 28 (12.8%) | 219 (22.0%) |
Income Below Poverty Among Married-Couple vs Single-Parent Households in Fairview Heights
The poverty data for Fairview Heights shows that 15 of the married-couple family households (0.5%) and 247 of the single-parent households (20.3%) are living below the poverty level. Within the married-couple family households, those with no children have the highest poverty rate, with 15 households (0.8%) falling below the poverty line. Among the single-parent households, those with 1 or 2 children have the highest poverty rate, with 193 household (23.5%) living below poverty.
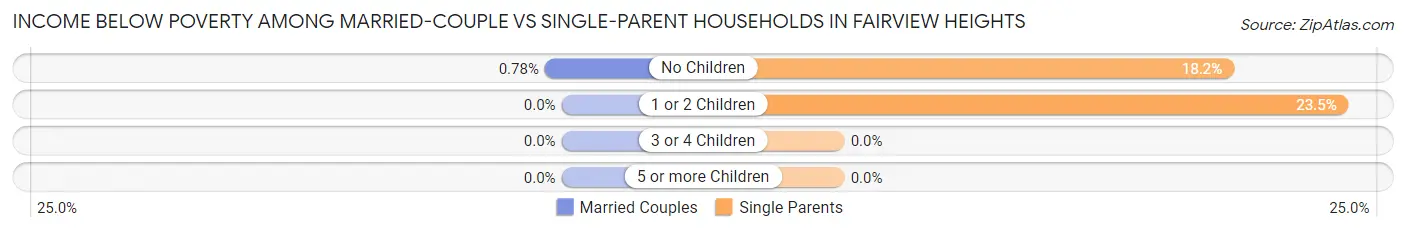
| Children | Married-Couple Families | Single-Parent Households |
| No Children | 15 (0.8%) | 54 (18.2%) |
| 1 or 2 Children | 0 (0.0%) | 193 (23.5%) |
| 3 or 4 Children | 0 (0.0%) | 0 (0.0%) |
| 5 or more Children | 0 (0.0%) | 0 (0.0%) |
| Total | 15 (0.5%) | 247 (20.3%) |
Race in Fairview Heights
The most populous races in Fairview Heights are White / Caucasian (9,118 | 55.7%), Black / African American (4,951 | 30.3%), and Two or more Races (1,953 | 11.9%).
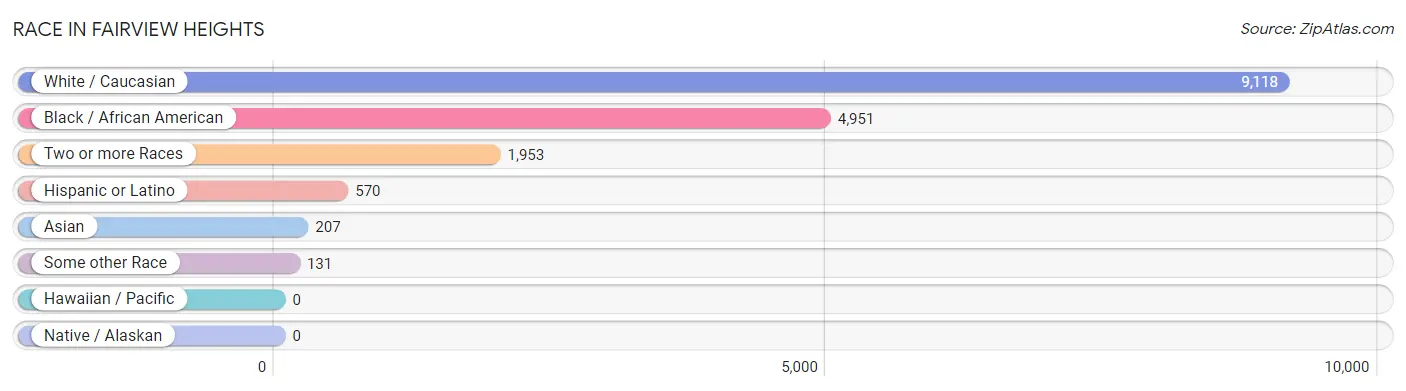
| Race | # Population | % Population |
| Asian | 207 | 1.3% |
| Black / African American | 4,951 | 30.3% |
| Hawaiian / Pacific | 0 | 0.0% |
| Hispanic or Latino | 570 | 3.5% |
| Native / Alaskan | 0 | 0.0% |
| White / Caucasian | 9,118 | 55.7% |
| Two or more Races | 1,953 | 11.9% |
| Some other Race | 131 | 0.8% |
| Total | 16,360 | 100.0% |
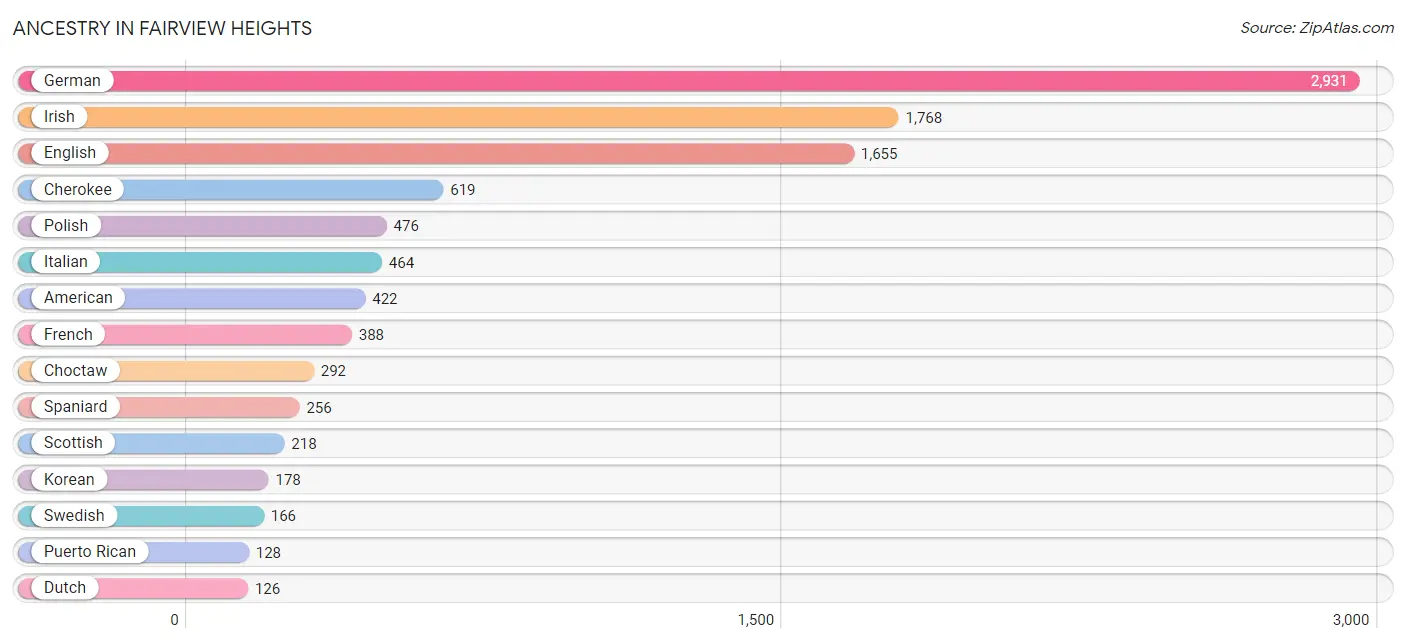
Ancestry in Fairview Heights
The most populous ancestries reported in Fairview Heights are German (2,931 | 17.9%), Irish (1,768 | 10.8%), English (1,655 | 10.1%), Cherokee (619 | 3.8%), and Polish (476 | 2.9%), together accounting for 45.5% of all Fairview Heights residents.
| Ancestry | # Population | % Population |
| African | 60 | 0.4% |
| American | 422 | 2.6% |
| Austrian | 58 | 0.4% |
| Belgian | 14 | 0.1% |
| Bhutanese | 25 | 0.2% |
| Brazilian | 31 | 0.2% |
| British | 72 | 0.4% |
| Burmese | 116 | 0.7% |
| Canadian | 8 | 0.1% |
| Central American | 15 | 0.1% |
| Cherokee | 619 | 3.8% |
| Choctaw | 292 | 1.8% |
| Colombian | 14 | 0.1% |
| Creek | 16 | 0.1% |
| Croatian | 24 | 0.2% |
| Czech | 109 | 0.7% |
| Czechoslovakian | 30 | 0.2% |
| Danish | 83 | 0.5% |
| Dominican | 21 | 0.1% |
| Dutch | 126 | 0.8% |
| Eastern European | 42 | 0.3% |
| English | 1,655 | 10.1% |
| European | 21 | 0.1% |
| Finnish | 13 | 0.1% |
| French | 388 | 2.4% |
| French Canadian | 121 | 0.7% |
| German | 2,931 | 17.9% |
| Greek | 93 | 0.6% |
| Haitian | 8 | 0.1% |
| Hungarian | 10 | 0.1% |
| Indian (Asian) | 119 | 0.7% |
| Irish | 1,768 | 10.8% |
| Italian | 464 | 2.8% |
| Jamaican | 19 | 0.1% |
| Korean | 178 | 1.1% |
| Latvian | 18 | 0.1% |
| Lithuanian | 60 | 0.4% |
| Mexican | 88 | 0.5% |
| Nigerian | 12 | 0.1% |
| Norwegian | 107 | 0.6% |
| Pakistani | 8 | 0.1% |
| Panamanian | 15 | 0.1% |
| Polish | 476 | 2.9% |
| Portuguese | 122 | 0.7% |
| Puerto Rican | 128 | 0.8% |
| Romanian | 10 | 0.1% |
| Russian | 53 | 0.3% |
| Scotch-Irish | 95 | 0.6% |
| Scottish | 218 | 1.3% |
| Slovak | 68 | 0.4% |
| South American | 14 | 0.1% |
| Spaniard | 256 | 1.6% |
| Spanish | 9 | 0.1% |
| Subsaharan African | 72 | 0.4% |
| Swedish | 166 | 1.0% |
| Swiss | 26 | 0.2% |
| Thai | 13 | 0.1% |
| Ukrainian | 13 | 0.1% |
| Welsh | 99 | 0.6% |
| West Indian | 34 | 0.2% | View All 60 Rows |
Immigrants in Fairview Heights
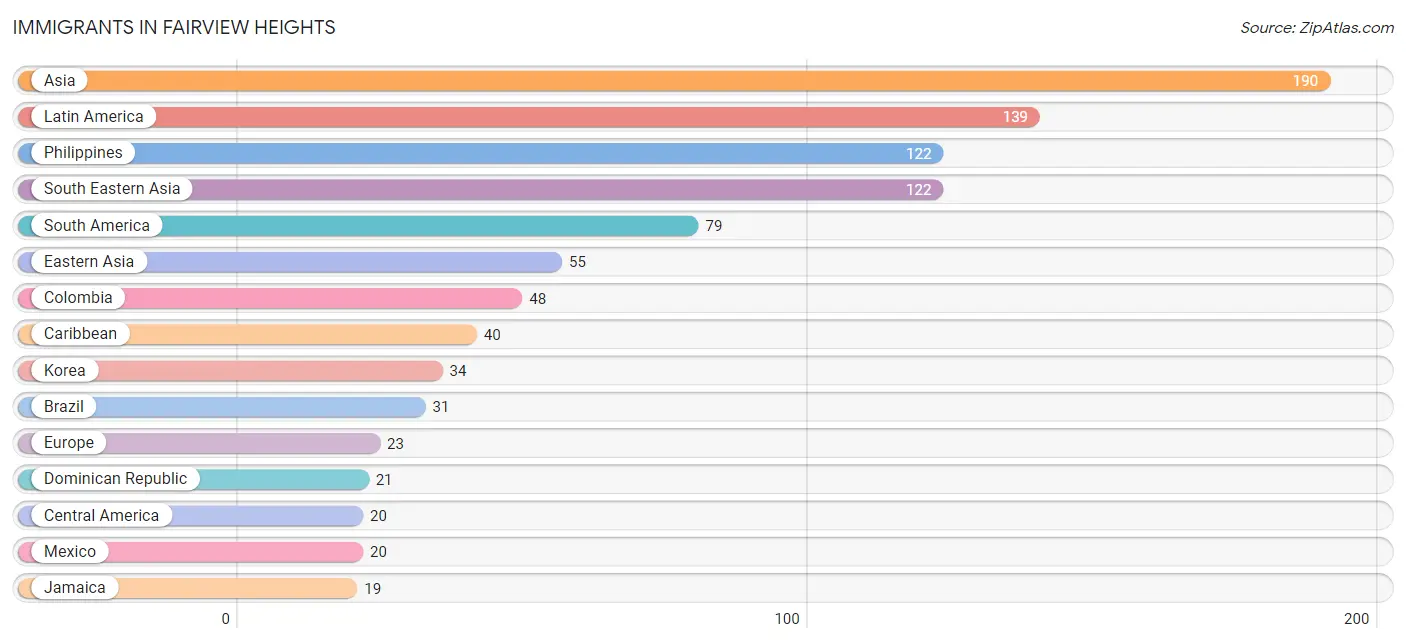
The most numerous immigrant groups reported in Fairview Heights came from Asia (190 | 1.2%), Latin America (139 | 0.9%), Philippines (122 | 0.7%), South Eastern Asia (122 | 0.7%), and South America (79 | 0.5%), together accounting for 4.0% of all Fairview Heights residents.
| Immigration Origin | # Population | % Population |
| Africa | 12 | 0.1% |
| Asia | 190 | 1.2% |
| Brazil | 31 | 0.2% |
| Canada | 8 | 0.1% |
| Caribbean | 40 | 0.2% |
| Central America | 20 | 0.1% |
| China | 15 | 0.1% |
| Colombia | 48 | 0.3% |
| Dominican Republic | 21 | 0.1% |
| Eastern Asia | 55 | 0.3% |
| Europe | 23 | 0.1% |
| Germany | 13 | 0.1% |
| India | 13 | 0.1% |
| Jamaica | 19 | 0.1% |
| Japan | 6 | 0.0% |
| Korea | 34 | 0.2% |
| Latin America | 139 | 0.9% |
| Mexico | 20 | 0.1% |
| Nigeria | 12 | 0.1% |
| Philippines | 122 | 0.7% |
| South America | 79 | 0.5% |
| South Central Asia | 13 | 0.1% |
| South Eastern Asia | 122 | 0.7% |
| Southern Europe | 10 | 0.1% |
| Spain | 10 | 0.1% |
| Taiwan | 15 | 0.1% |
| Western Africa | 12 | 0.1% |
| Western Europe | 13 | 0.1% | View All 28 Rows |
Sex and Age in Fairview Heights
Sex and Age in Fairview Heights
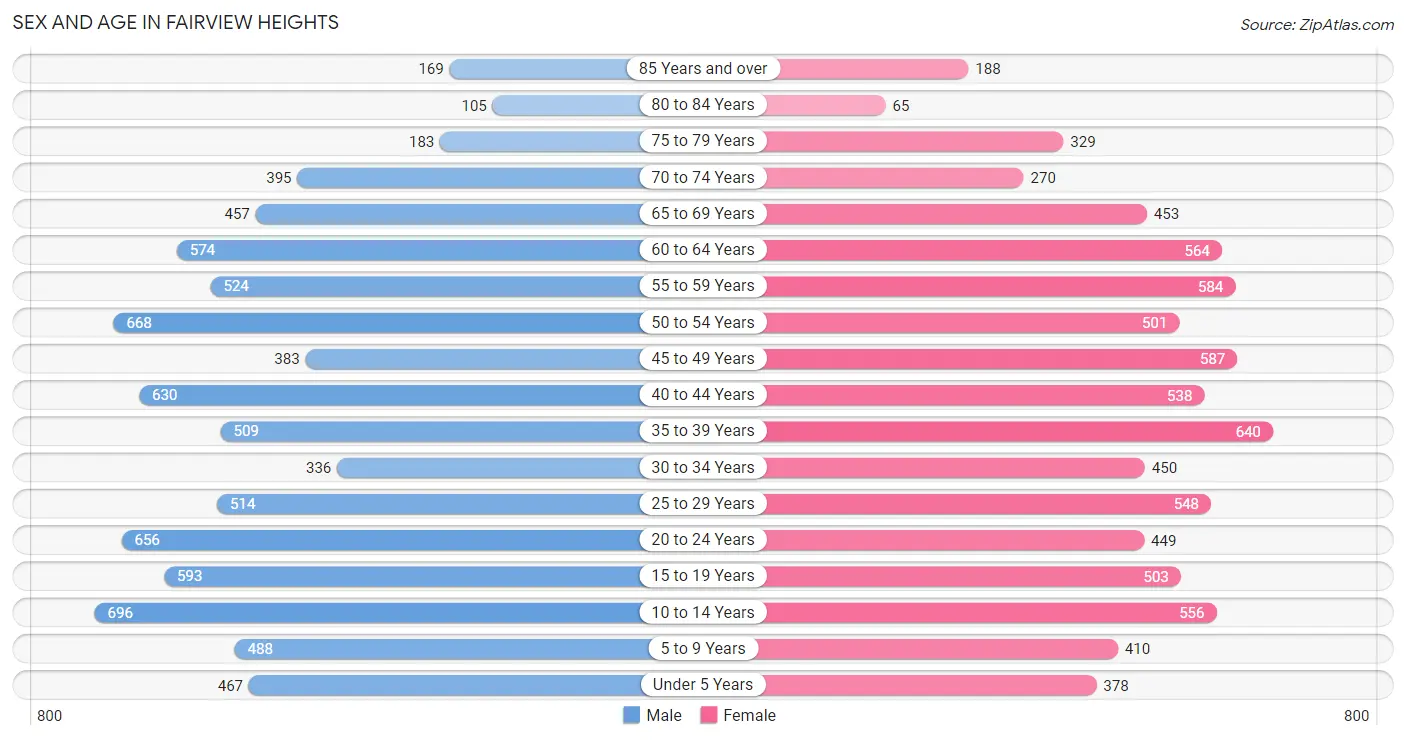
The most populous age groups in Fairview Heights are 10 to 14 Years (696 | 8.3%) for men and 35 to 39 Years (640 | 8.0%) for women.
| Age Bracket | Male | Female |
| Under 5 Years | 467 (5.6%) | 378 (4.7%) |
| 5 to 9 Years | 488 (5.9%) | 410 (5.1%) |
| 10 to 14 Years | 696 (8.3%) | 556 (6.9%) |
| 15 to 19 Years | 593 (7.1%) | 503 (6.3%) |
| 20 to 24 Years | 656 (7.9%) | 449 (5.6%) |
| 25 to 29 Years | 514 (6.2%) | 548 (6.8%) |
| 30 to 34 Years | 336 (4.0%) | 450 (5.6%) |
| 35 to 39 Years | 509 (6.1%) | 640 (8.0%) |
| 40 to 44 Years | 630 (7.5%) | 538 (6.7%) |
| 45 to 49 Years | 383 (4.6%) | 587 (7.3%) |
| 50 to 54 Years | 668 (8.0%) | 501 (6.2%) |
| 55 to 59 Years | 524 (6.3%) | 584 (7.3%) |
| 60 to 64 Years | 574 (6.9%) | 564 (7.0%) |
| 65 to 69 Years | 457 (5.5%) | 453 (5.7%) |
| 70 to 74 Years | 395 (4.7%) | 270 (3.4%) |
| 75 to 79 Years | 183 (2.2%) | 329 (4.1%) |
| 80 to 84 Years | 105 (1.3%) | 65 (0.8%) |
| 85 Years and over | 169 (2.0%) | 188 (2.4%) |
| Total | 8,347 (100.0%) | 8,013 (100.0%) |
Families and Households in Fairview Heights
Median Family Size in Fairview Heights
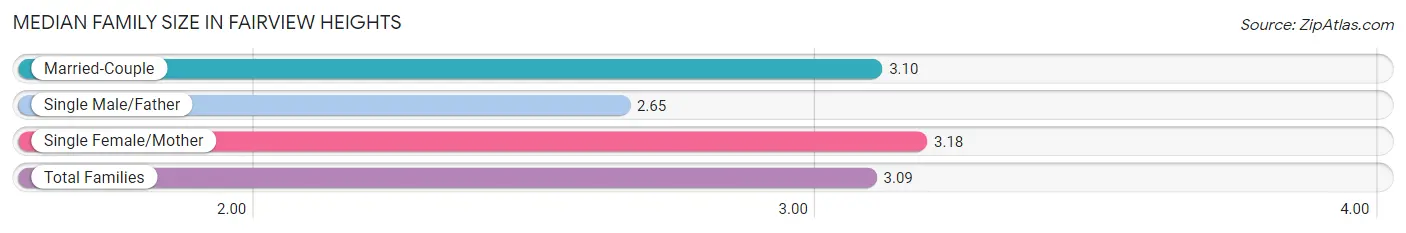
The median family size in Fairview Heights is 3.09 persons per family, with single female/mother families (995 | 24.8%) accounting for the largest median family size of 3.18 persons per family. On the other hand, single male/father families (219 | 5.5%) represent the smallest median family size with 2.65 persons per family.
| Family Type | # Families | Family Size |
| Married-Couple | 2,793 (69.7%) | 3.10 |
| Single Male/Father | 219 (5.5%) | 2.65 |
| Single Female/Mother | 995 (24.8%) | 3.18 |
| Total Families | 4,007 (100.0%) | 3.09 |
Median Household Size in Fairview Heights
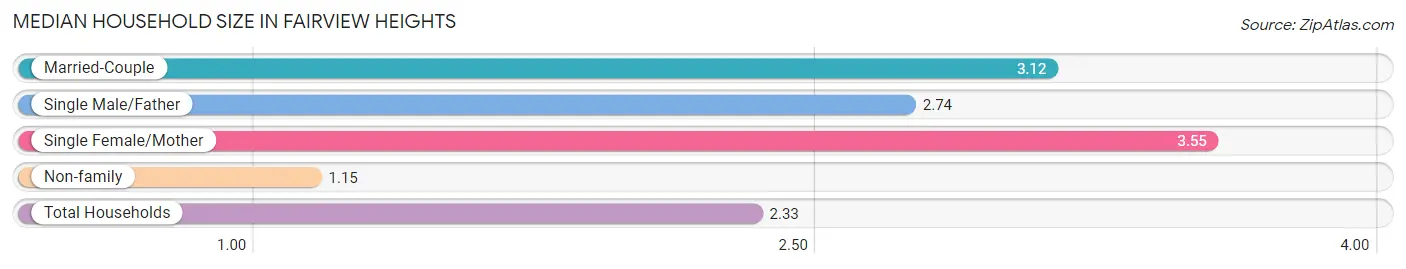
The median household size in Fairview Heights is 2.33 persons per household, with single female/mother households (995 | 14.2%) accounting for the largest median household size of 3.55 persons per household. non-family households (3,019 | 43.0%) represent the smallest median household size with 1.15 persons per household.
| Household Type | # Households | Household Size |
| Married-Couple | 2,793 (39.8%) | 3.12 |
| Single Male/Father | 219 (3.1%) | 2.74 |
| Single Female/Mother | 995 (14.2%) | 3.55 |
| Non-family | 3,019 (43.0%) | 1.15 |
| Total Households | 7,026 (100.0%) | 2.33 |
Household Size by Marriage Status in Fairview Heights
Out of a total of 7,026 households in Fairview Heights, 4,007 (57.0%) are family households, while 3,019 (43.0%) are nonfamily households. The most numerous type of family households are 2-person households, comprising 2,181, and the most common type of nonfamily households are 1-person households, comprising 2,575.
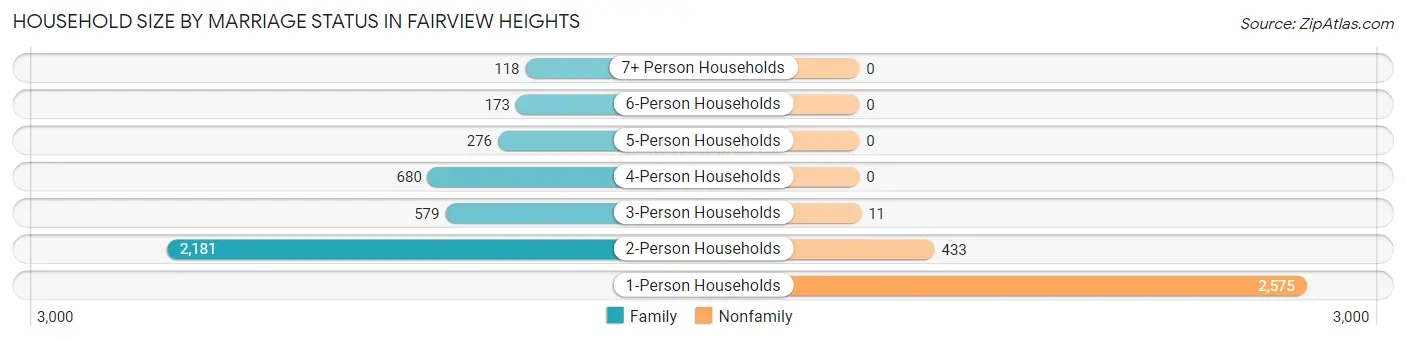
| Household Size | Family Households | Nonfamily Households |
| 1-Person Households | - | 2,575 (36.6%) |
| 2-Person Households | 2,181 (31.0%) | 433 (6.2%) |
| 3-Person Households | 579 (8.2%) | 11 (0.2%) |
| 4-Person Households | 680 (9.7%) | 0 (0.0%) |
| 5-Person Households | 276 (3.9%) | 0 (0.0%) |
| 6-Person Households | 173 (2.5%) | 0 (0.0%) |
| 7+ Person Households | 118 (1.7%) | 0 (0.0%) |
| Total | 4,007 (57.0%) | 3,019 (43.0%) |
Female Fertility in Fairview Heights
Fertility by Age in Fairview Heights
Average fertility rate in Fairview Heights is 67.0 births per 1,000 women. Women in the age bracket of 20 to 34 years have the highest fertility rate with 85.0 births per 1,000 women. Women in the age bracket of 20 to 34 years acount for 48.8% of all women with births.
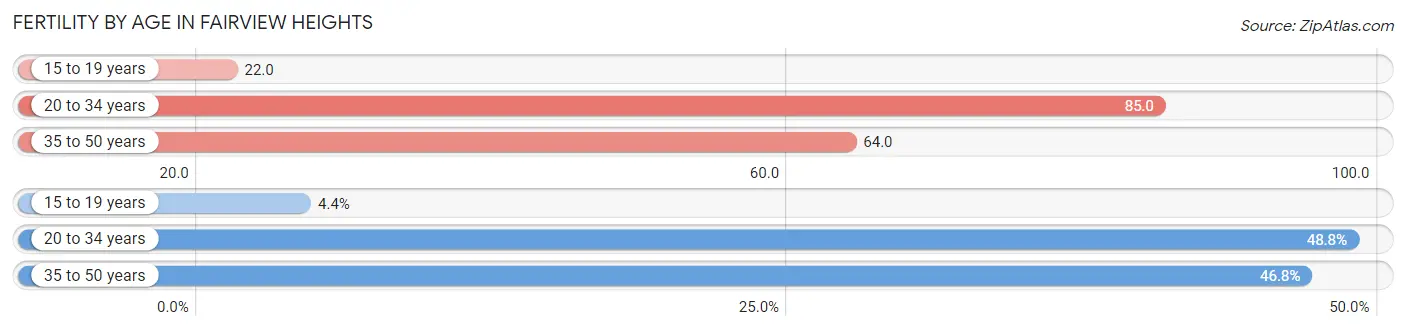
| Age Bracket | Women with Births | Births / 1,000 Women |
| 15 to 19 years | 11 (4.4%) | 22.0 |
| 20 to 34 years | 123 (48.8%) | 85.0 |
| 35 to 50 years | 118 (46.8%) | 64.0 |
| Total | 252 (100.0%) | 67.0 |
Fertility by Age by Marriage Status in Fairview Heights
70.6% of women with births (252) in Fairview Heights are married. The highest percentage of unmarried women with births falls into 15 to 19 years age bracket with 100.0% of them unmarried at the time of birth, while the lowest percentage of unmarried women with births belong to 35 to 50 years age bracket with 0.0% of them unmarried.
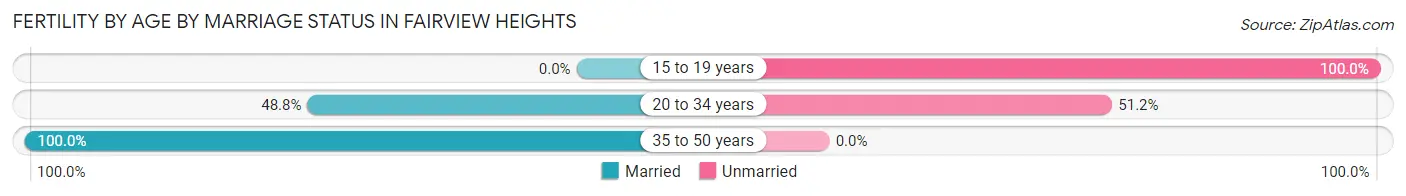
| Age Bracket | Married | Unmarried |
| 15 to 19 years | 0 (0.0%) | 11 (100.0%) |
| 20 to 34 years | 60 (48.8%) | 63 (51.2%) |
| 35 to 50 years | 118 (100.0%) | 0 (0.0%) |
| Total | 178 (70.6%) | 74 (29.4%) |
Fertility by Education in Fairview Heights
Average fertility rate in Fairview Heights is 67.0 births per 1,000 women. Women with the education attainment of graduate degree have the highest fertility rate of 218.0 births per 1,000 women, while women with the education attainment of less than high school have the lowest fertility at 17.0 births per 1,000 women. Women with the education attainment of graduate degree represent 33.3% of all women with births.
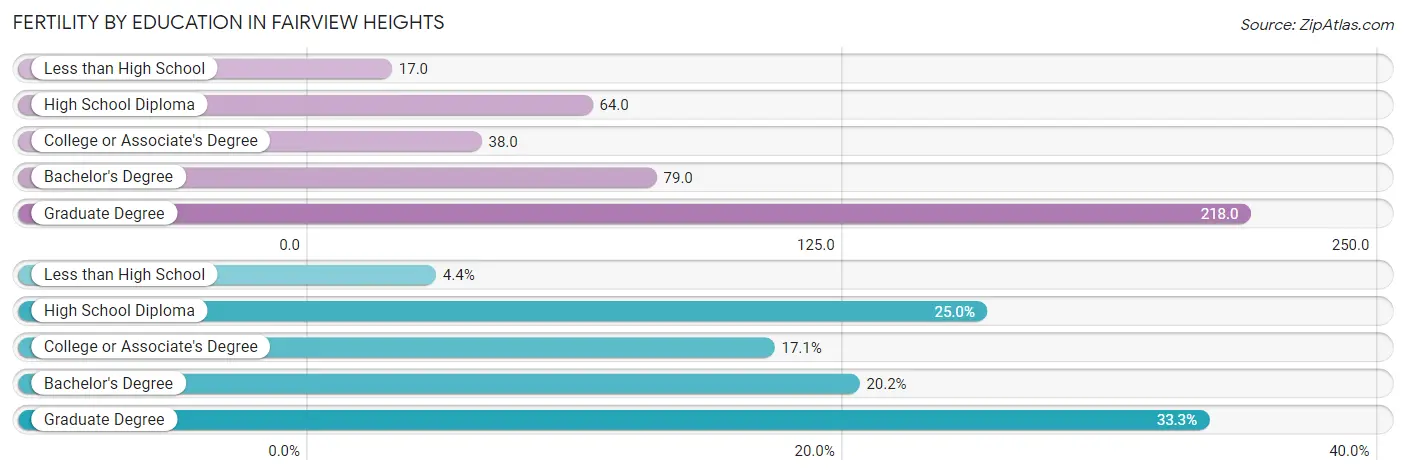
| Educational Attainment | Women with Births | Births / 1,000 Women |
| Less than High School | 11 (4.4%) | 17.0 |
| High School Diploma | 63 (25.0%) | 64.0 |
| College or Associate's Degree | 43 (17.1%) | 38.0 |
| Bachelor's Degree | 51 (20.2%) | 79.0 |
| Graduate Degree | 84 (33.3%) | 218.0 |
| Total | 252 (100.0%) | 67.0 |
Fertility by Education by Marriage Status in Fairview Heights
29.4% of women with births in Fairview Heights are unmarried. Women with the educational attainment of college or associate's degree are most likely to be married with 100.0% of them married at childbirth, while women with the educational attainment of less than high school are least likely to be married with 100.0% of them unmarried at childbirth.
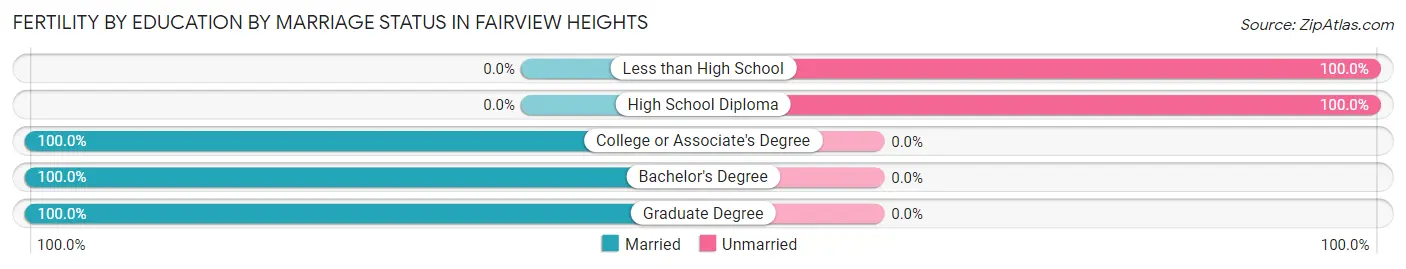
| Educational Attainment | Married | Unmarried |
| Less than High School | 0 (0.0%) | 11 (100.0%) |
| High School Diploma | 0 (0.0%) | 63 (100.0%) |
| College or Associate's Degree | 43 (100.0%) | 0 (0.0%) |
| Bachelor's Degree | 51 (100.0%) | 0 (0.0%) |
| Graduate Degree | 84 (100.0%) | 0 (0.0%) |
| Total | 178 (70.6%) | 74 (29.4%) |
Employment Characteristics in Fairview Heights
Employment by Class of Employer in Fairview Heights
Among the 8,085 employed individuals in Fairview Heights, private company employees (5,254 | 65.0%), federal government employees (845 | 10.4%), and not-for-profit organizations (585 | 7.2%) make up the most common classes of employment.
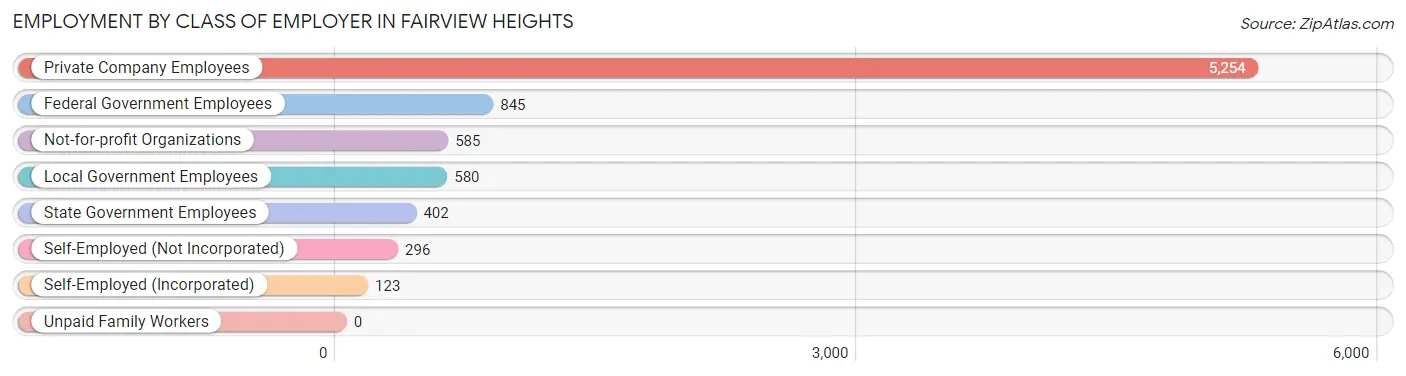
| Employer Class | # Employees | % Employees |
| Private Company Employees | 5,254 | 65.0% |
| Self-Employed (Incorporated) | 123 | 1.5% |
| Self-Employed (Not Incorporated) | 296 | 3.7% |
| Not-for-profit Organizations | 585 | 7.2% |
| Local Government Employees | 580 | 7.2% |
| State Government Employees | 402 | 5.0% |
| Federal Government Employees | 845 | 10.4% |
| Unpaid Family Workers | 0 | 0.0% |
| Total | 8,085 | 100.0% |
Employment Status by Age in Fairview Heights
According to the labor force statistics for Fairview Heights, out of the total population over 16 years of age (13,221), 66.5% or 8,792 individuals are in the labor force, with 6.0% or 528 of them unemployed. The age group with the highest labor force participation rate is 30 to 34 years, with 95.2% or 748 individuals in the labor force. Within the labor force, the 16 to 19 years age range has the highest percentage of unemployed individuals, with 24.5% or 165 of them being unemployed.
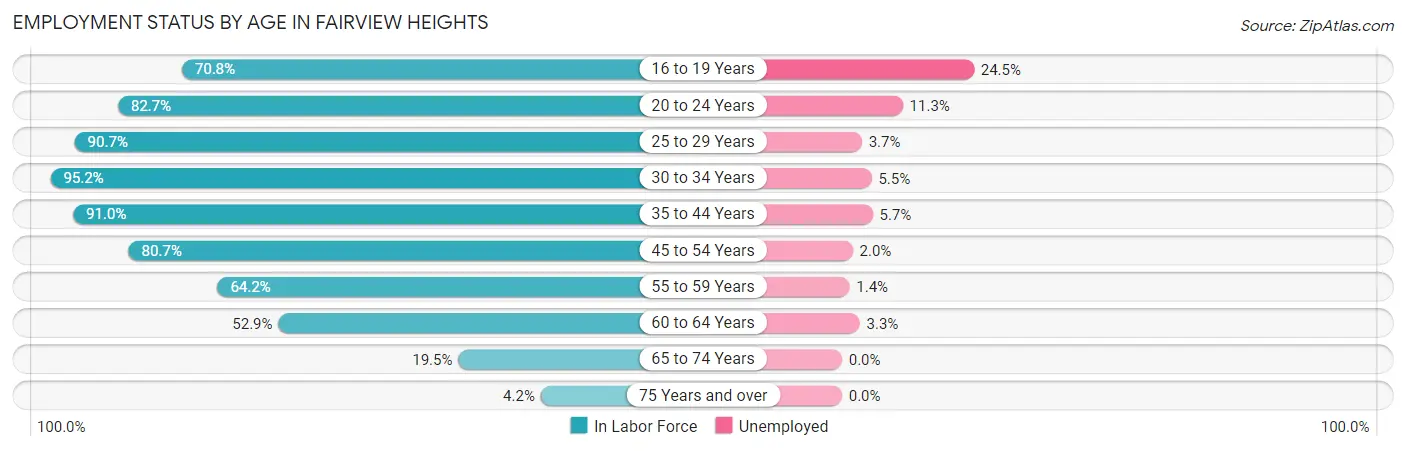
| Age Bracket | In Labor Force | Unemployed |
| 16 to 19 Years | 674 (70.8%) | 165 (24.5%) |
| 20 to 24 Years | 914 (82.7%) | 103 (11.3%) |
| 25 to 29 Years | 963 (90.7%) | 36 (3.7%) |
| 30 to 34 Years | 748 (95.2%) | 41 (5.5%) |
| 35 to 44 Years | 2,108 (91.0%) | 120 (5.7%) |
| 45 to 54 Years | 1,726 (80.7%) | 35 (2.0%) |
| 55 to 59 Years | 711 (64.2%) | 10 (1.4%) |
| 60 to 64 Years | 602 (52.9%) | 20 (3.3%) |
| 65 to 74 Years | 307 (19.5%) | 0 (0.0%) |
| 75 Years and over | 44 (4.2%) | 0 (0.0%) |
| Total | 8,792 (66.5%) | 528 (6.0%) |
Employment Status by Educational Attainment in Fairview Heights
According to labor force statistics for Fairview Heights, 80.2% of individuals (6,857) out of the total population between 25 and 64 years of age (8,550) are in the labor force, with 3.8% or 261 of them being unemployed. The group with the highest labor force participation rate are those with the educational attainment of bachelor's degree or higher, with 90.8% or 2,404 individuals in the labor force. Within the labor force, individuals with less than high school education have the highest percentage of unemployment, with 6.3% or 20 of them being unemployed.
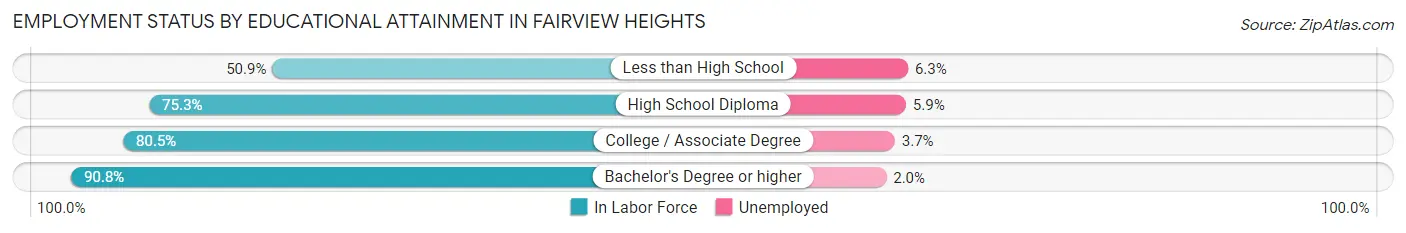
| Educational Attainment | In Labor Force | Unemployed |
| Less than High School | 317 (50.9%) | 39 (6.3%) |
| High School Diploma | 1,641 (75.3%) | 129 (5.9%) |
| College / Associate Degree | 2,496 (80.5%) | 115 (3.7%) |
| Bachelor's Degree or higher | 2,404 (90.8%) | 53 (2.0%) |
| Total | 6,857 (80.2%) | 325 (3.8%) |
Employment Occupations by Sex in Fairview Heights
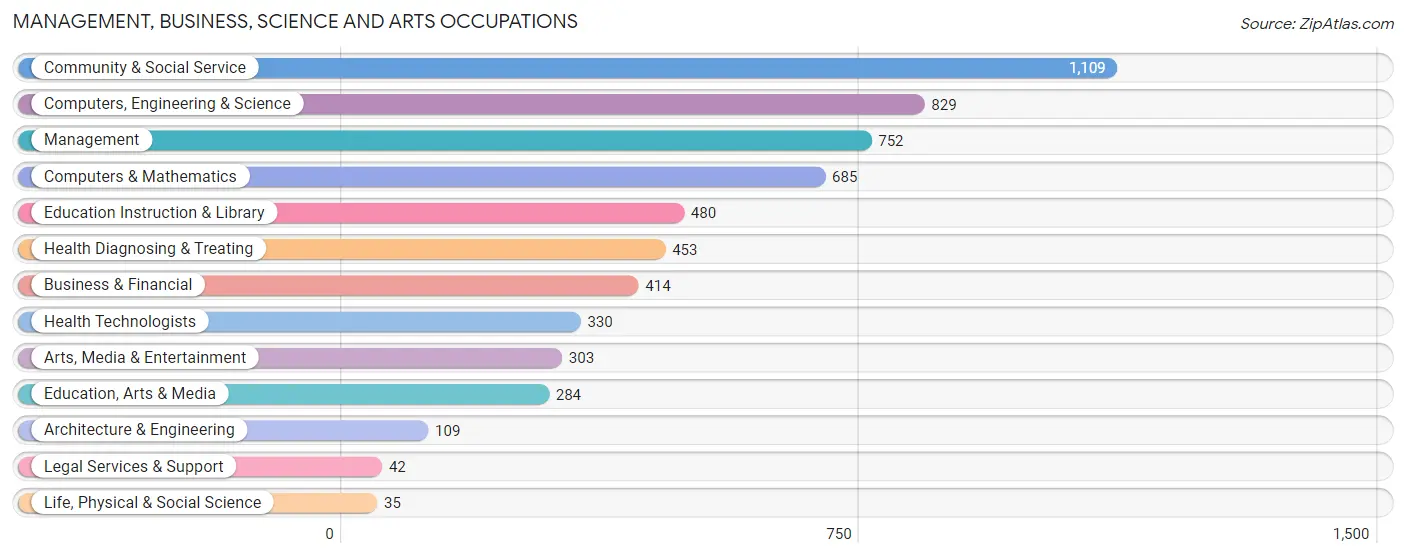
Management, Business, Science and Arts Occupations
The most common Management, Business, Science and Arts occupations in Fairview Heights are Community & Social Service (1,109 | 13.8%), Computers, Engineering & Science (829 | 10.3%), Management (752 | 9.3%), Computers & Mathematics (685 | 8.5%), and Education Instruction & Library (480 | 6.0%).
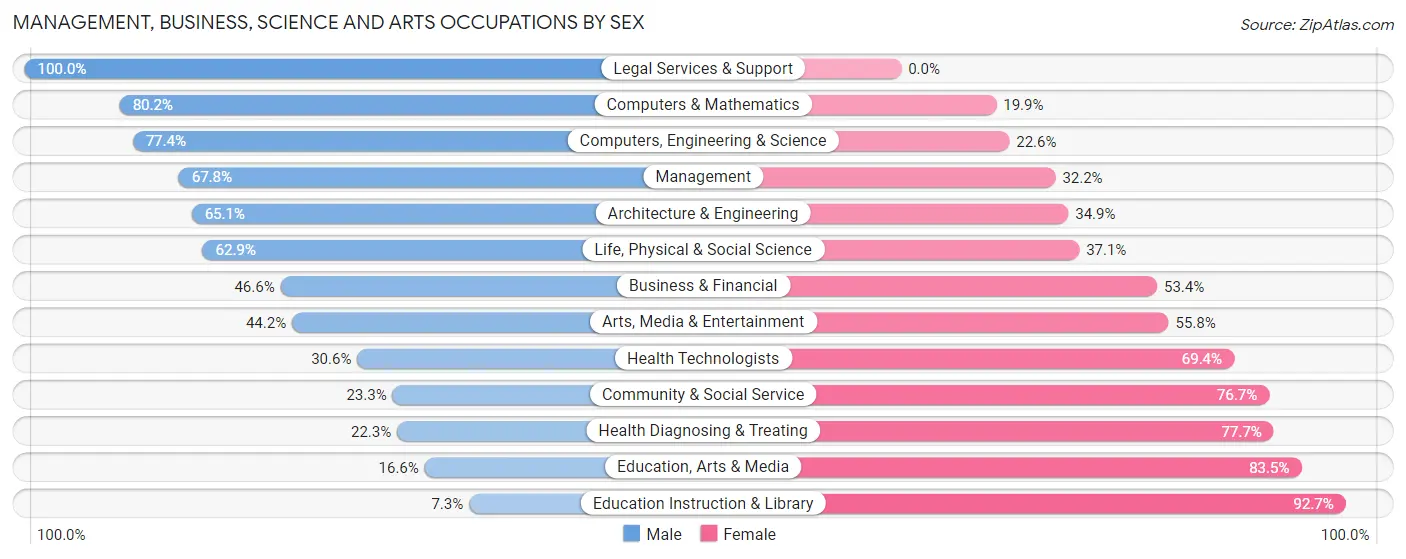
Management, Business, Science and Arts Occupations by Sex
Within the Management, Business, Science and Arts occupations in Fairview Heights, the most male-oriented occupations are Legal Services & Support (100.0%), Computers & Mathematics (80.1%), and Computers, Engineering & Science (77.4%), while the most female-oriented occupations are Education Instruction & Library (92.7%), Education, Arts & Media (83.5%), and Health Diagnosing & Treating (77.7%).
| Occupation | Male | Female |
| Management | 510 (67.8%) | 242 (32.2%) |
| Business & Financial | 193 (46.6%) | 221 (53.4%) |
| Computers, Engineering & Science | 642 (77.4%) | 187 (22.6%) |
| Computers & Mathematics | 549 (80.1%) | 136 (19.9%) |
| Architecture & Engineering | 71 (65.1%) | 38 (34.9%) |
| Life, Physical & Social Science | 22 (62.9%) | 13 (37.1%) |
| Community & Social Service | 258 (23.3%) | 851 (76.7%) |
| Education, Arts & Media | 47 (16.6%) | 237 (83.5%) |
| Legal Services & Support | 42 (100.0%) | 0 (0.0%) |
| Education Instruction & Library | 35 (7.3%) | 445 (92.7%) |
| Arts, Media & Entertainment | 134 (44.2%) | 169 (55.8%) |
| Health Diagnosing & Treating | 101 (22.3%) | 352 (77.7%) |
| Health Technologists | 101 (30.6%) | 229 (69.4%) |
| Total (Category) | 1,704 (47.9%) | 1,853 (52.1%) |
| Total (Overall) | 4,094 (50.9%) | 3,949 (49.1%) |
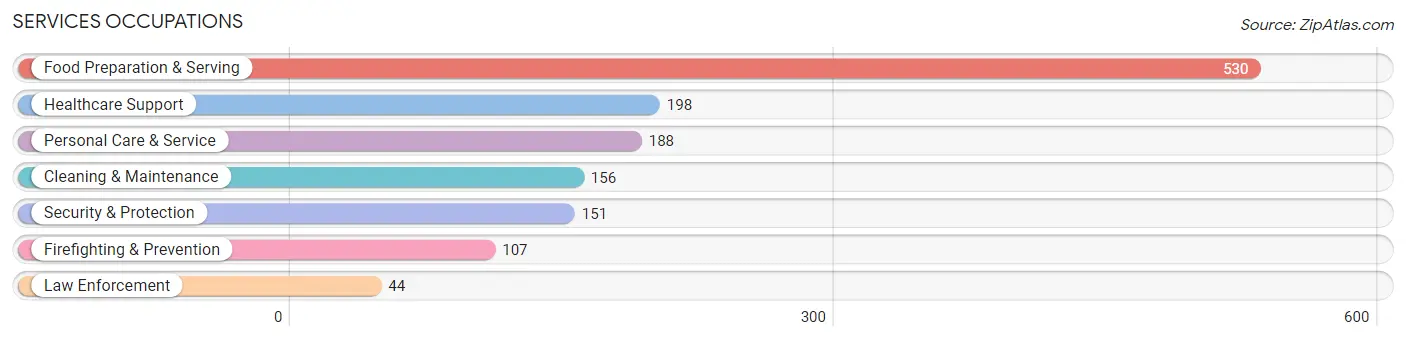
Services Occupations
The most common Services occupations in Fairview Heights are Food Preparation & Serving (530 | 6.6%), Healthcare Support (198 | 2.5%), Personal Care & Service (188 | 2.3%), Cleaning & Maintenance (156 | 1.9%), and Security & Protection (151 | 1.9%).
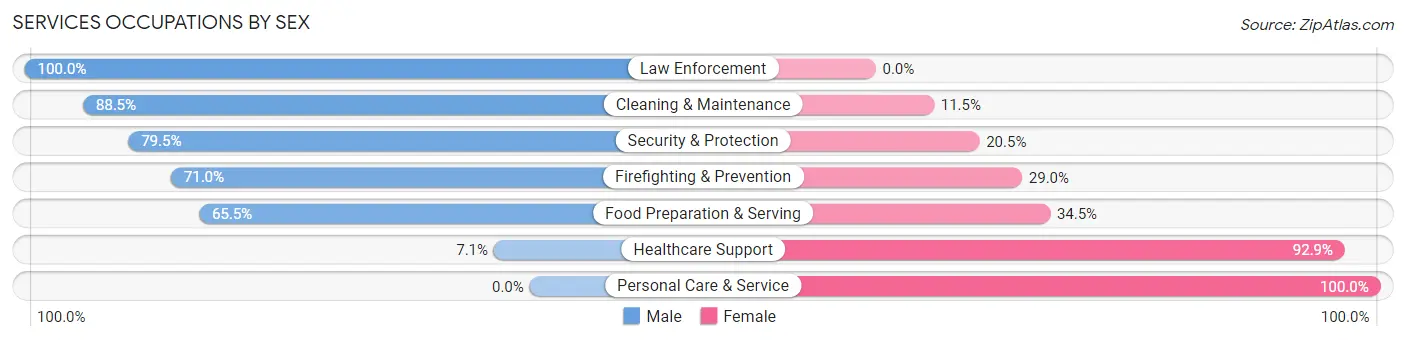
Services Occupations by Sex
Within the Services occupations in Fairview Heights, the most male-oriented occupations are Law Enforcement (100.0%), Cleaning & Maintenance (88.5%), and Security & Protection (79.5%), while the most female-oriented occupations are Personal Care & Service (100.0%), Healthcare Support (92.9%), and Food Preparation & Serving (34.5%).
| Occupation | Male | Female |
| Healthcare Support | 14 (7.1%) | 184 (92.9%) |
| Security & Protection | 120 (79.5%) | 31 (20.5%) |
| Firefighting & Prevention | 76 (71.0%) | 31 (29.0%) |
| Law Enforcement | 44 (100.0%) | 0 (0.0%) |
| Food Preparation & Serving | 347 (65.5%) | 183 (34.5%) |
| Cleaning & Maintenance | 138 (88.5%) | 18 (11.5%) |
| Personal Care & Service | 0 (0.0%) | 188 (100.0%) |
| Total (Category) | 619 (50.6%) | 604 (49.4%) |
| Total (Overall) | 4,094 (50.9%) | 3,949 (49.1%) |
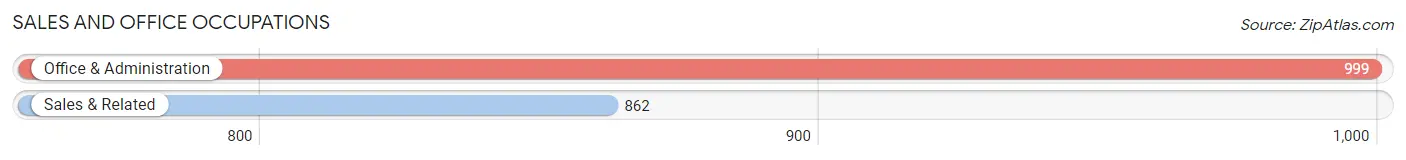
Sales and Office Occupations
The most common Sales and Office occupations in Fairview Heights are Office & Administration (999 | 12.4%), and Sales & Related (862 | 10.7%).
Sales and Office Occupations by Sex
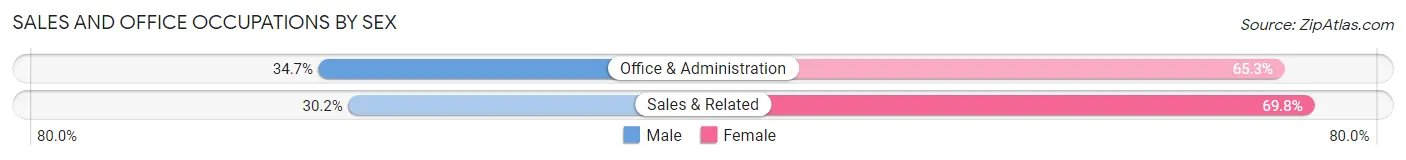
| Occupation | Male | Female |
| Sales & Related | 260 (30.2%) | 602 (69.8%) |
| Office & Administration | 347 (34.7%) | 652 (65.3%) |
| Total (Category) | 607 (32.6%) | 1,254 (67.4%) |
| Total (Overall) | 4,094 (50.9%) | 3,949 (49.1%) |
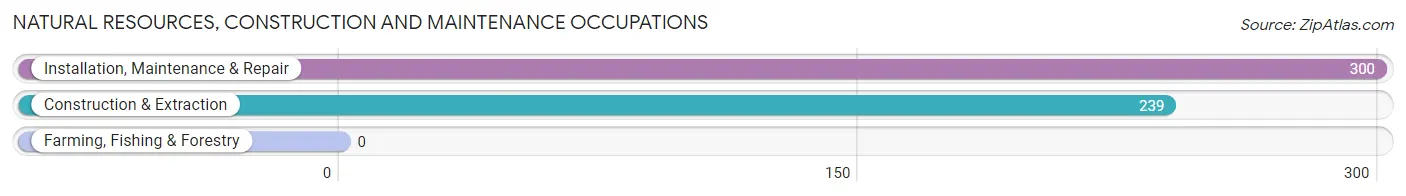
Natural Resources, Construction and Maintenance Occupations
The most common Natural Resources, Construction and Maintenance occupations in Fairview Heights are Installation, Maintenance & Repair (300 | 3.7%), and Construction & Extraction (239 | 3.0%).
Natural Resources, Construction and Maintenance Occupations by Sex
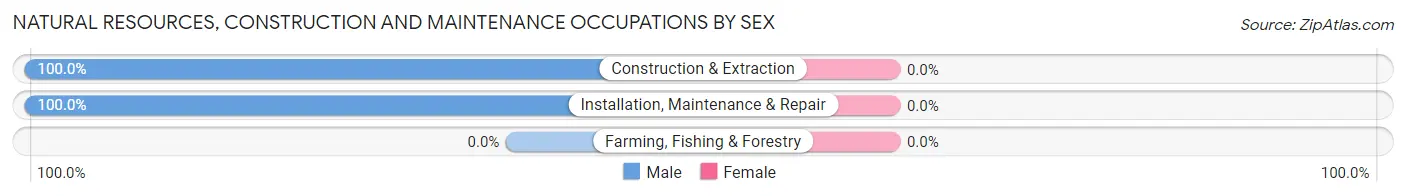
| Occupation | Male | Female |
| Farming, Fishing & Forestry | 0 (0.0%) | 0 (0.0%) |
| Construction & Extraction | 239 (100.0%) | 0 (0.0%) |
| Installation, Maintenance & Repair | 300 (100.0%) | 0 (0.0%) |
| Total (Category) | 539 (100.0%) | 0 (0.0%) |
| Total (Overall) | 4,094 (50.9%) | 3,949 (49.1%) |
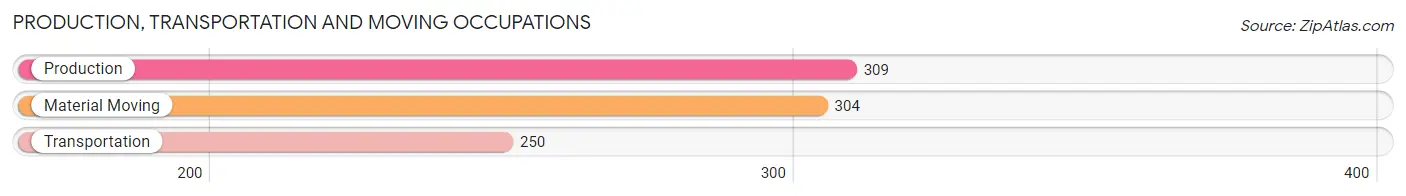
Production, Transportation and Moving Occupations
The most common Production, Transportation and Moving occupations in Fairview Heights are Production (309 | 3.8%), Material Moving (304 | 3.8%), and Transportation (250 | 3.1%).
Production, Transportation and Moving Occupations by Sex
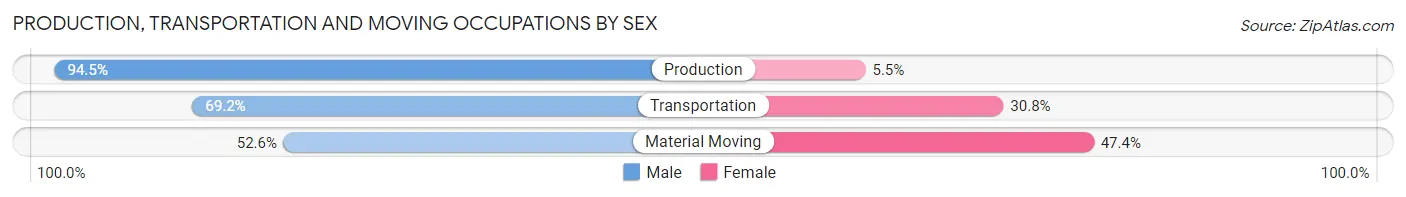
| Occupation | Male | Female |
| Production | 292 (94.5%) | 17 (5.5%) |
| Transportation | 173 (69.2%) | 77 (30.8%) |
| Material Moving | 160 (52.6%) | 144 (47.4%) |
| Total (Category) | 625 (72.4%) | 238 (27.6%) |
| Total (Overall) | 4,094 (50.9%) | 3,949 (49.1%) |
Employment Industries by Sex in Fairview Heights
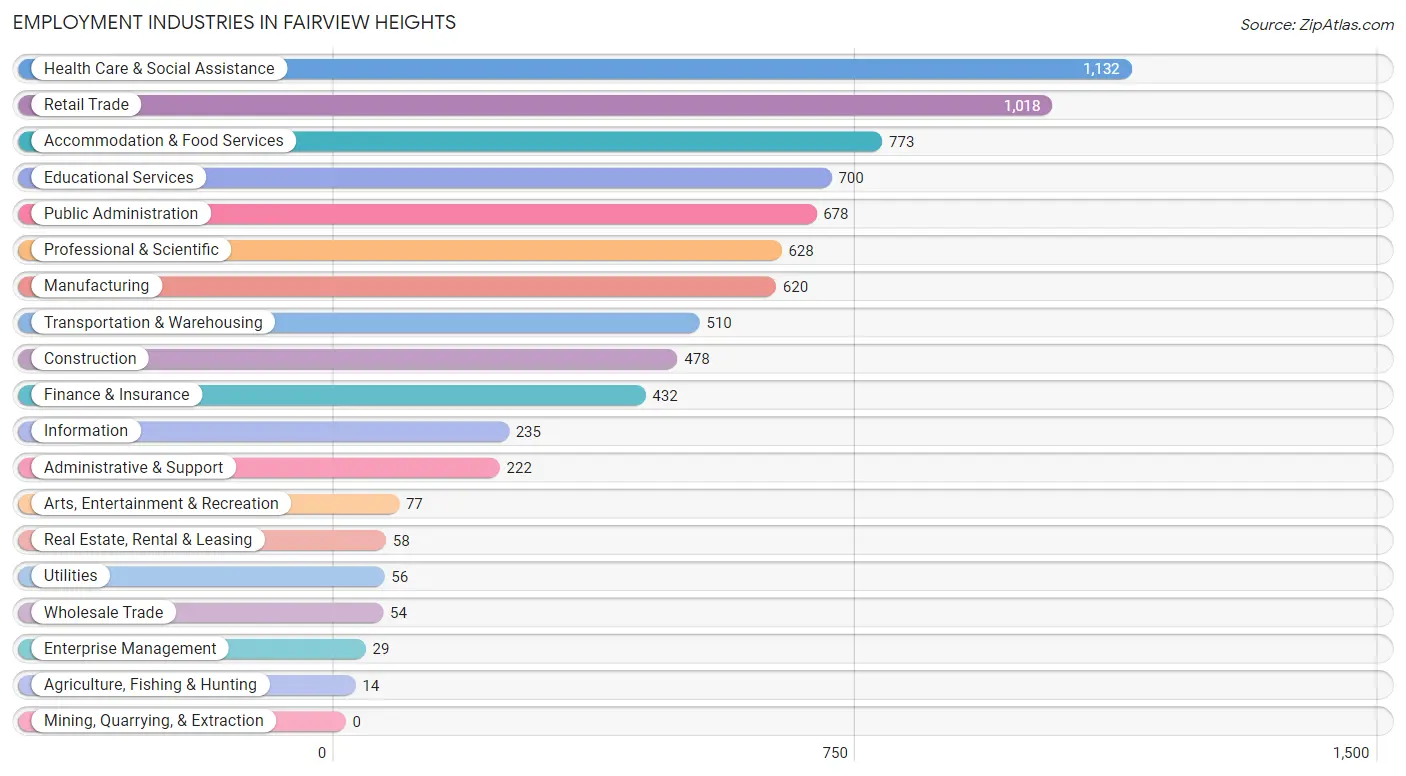
Employment Industries in Fairview Heights
The major employment industries in Fairview Heights include Health Care & Social Assistance (1,132 | 14.1%), Retail Trade (1,018 | 12.7%), Accommodation & Food Services (773 | 9.6%), Educational Services (700 | 8.7%), and Public Administration (678 | 8.4%).
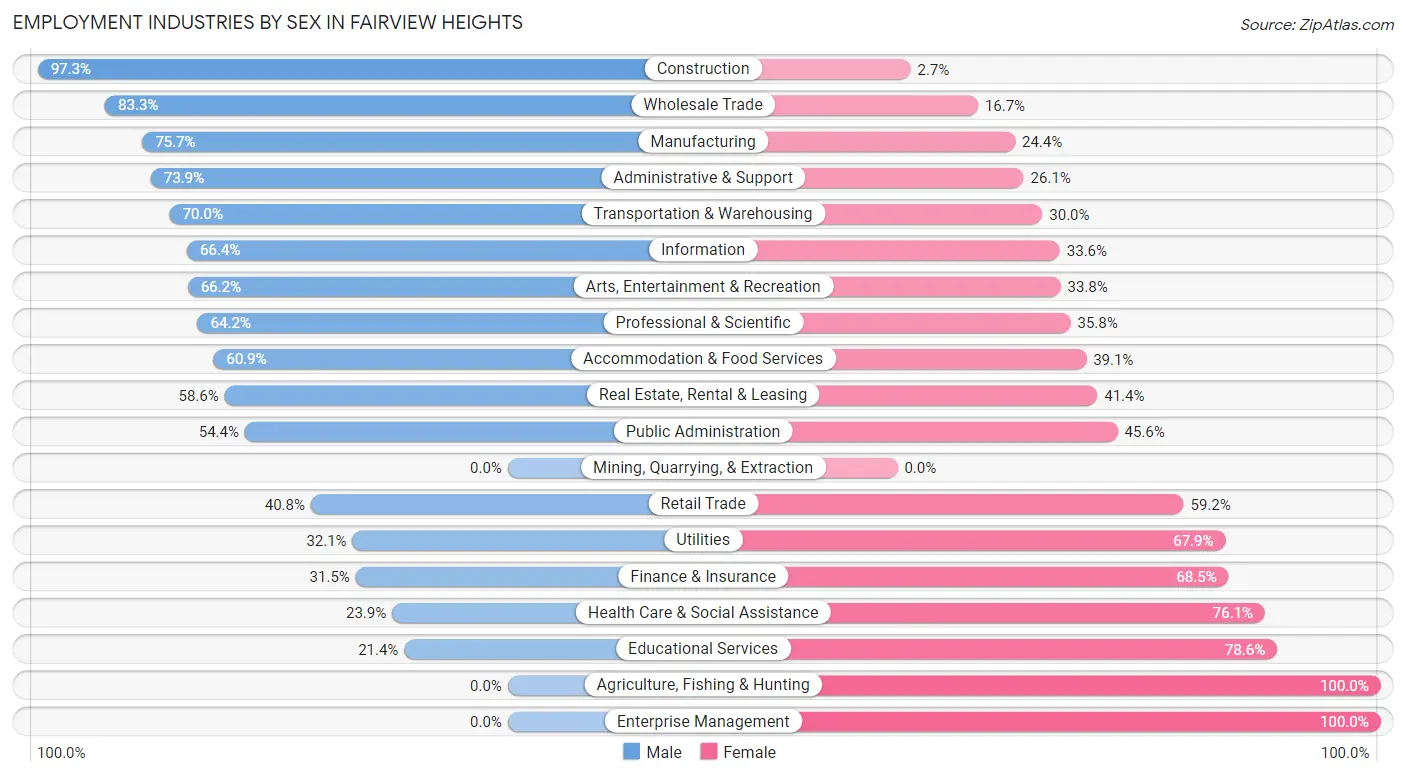
Employment Industries by Sex in Fairview Heights
The Fairview Heights industries that see more men than women are Construction (97.3%), Wholesale Trade (83.3%), and Manufacturing (75.6%), whereas the industries that tend to have a higher number of women are Agriculture, Fishing & Hunting (100.0%), Enterprise Management (100.0%), and Educational Services (78.6%).
| Industry | Male | Female |
| Agriculture, Fishing & Hunting | 0 (0.0%) | 14 (100.0%) |
| Mining, Quarrying, & Extraction | 0 (0.0%) | 0 (0.0%) |
| Construction | 465 (97.3%) | 13 (2.7%) |
| Manufacturing | 469 (75.6%) | 151 (24.3%) |
| Wholesale Trade | 45 (83.3%) | 9 (16.7%) |
| Retail Trade | 415 (40.8%) | 603 (59.2%) |
| Transportation & Warehousing | 357 (70.0%) | 153 (30.0%) |
| Utilities | 18 (32.1%) | 38 (67.9%) |
| Information | 156 (66.4%) | 79 (33.6%) |
| Finance & Insurance | 136 (31.5%) | 296 (68.5%) |
| Real Estate, Rental & Leasing | 34 (58.6%) | 24 (41.4%) |
| Professional & Scientific | 403 (64.2%) | 225 (35.8%) |
| Enterprise Management | 0 (0.0%) | 29 (100.0%) |
| Administrative & Support | 164 (73.9%) | 58 (26.1%) |
| Educational Services | 150 (21.4%) | 550 (78.6%) |
| Health Care & Social Assistance | 271 (23.9%) | 861 (76.1%) |
| Arts, Entertainment & Recreation | 51 (66.2%) | 26 (33.8%) |
| Accommodation & Food Services | 471 (60.9%) | 302 (39.1%) |
| Public Administration | 369 (54.4%) | 309 (45.6%) |
| Total | 4,094 (50.9%) | 3,949 (49.1%) |
Education in Fairview Heights
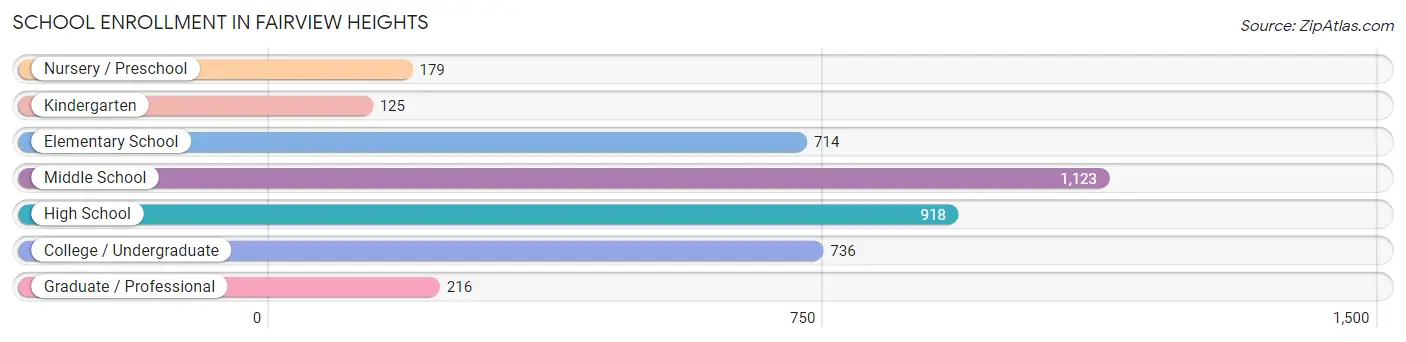
School Enrollment in Fairview Heights
The most common levels of schooling among the 4,011 students in Fairview Heights are middle school (1,123 | 28.0%), high school (918 | 22.9%), and college / undergraduate (736 | 18.3%).
| School Level | # Students | % Students |
| Nursery / Preschool | 179 | 4.5% |
| Kindergarten | 125 | 3.1% |
| Elementary School | 714 | 17.8% |
| Middle School | 1,123 | 28.0% |
| High School | 918 | 22.9% |
| College / Undergraduate | 736 | 18.3% |
| Graduate / Professional | 216 | 5.4% |
| Total | 4,011 | 100.0% |
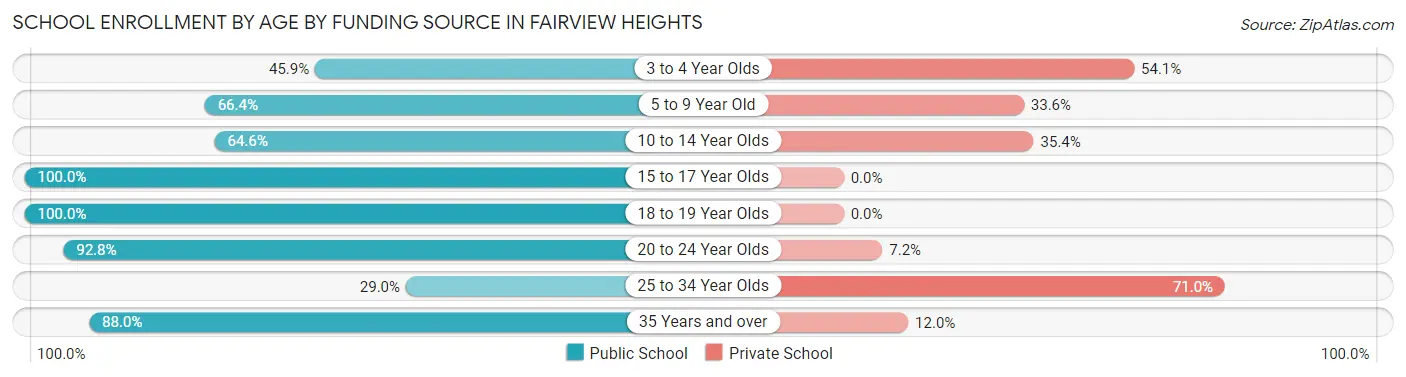
School Enrollment by Age by Funding Source in Fairview Heights
Out of a total of 4,011 students who are enrolled in schools in Fairview Heights, 935 (23.3%) attend a private institution, while the remaining 3,076 (76.7%) are enrolled in public schools. The age group of 25 to 34 year olds has the highest likelihood of being enrolled in private schools, with 49 (71.0% in the age bracket) enrolled. Conversely, the age group of 15 to 17 year olds has the lowest likelihood of being enrolled in a private school, with 711 (100.0% in the age bracket) attending a public institution.
| Age Bracket | Public School | Private School |
| 3 to 4 Year Olds | 56 (45.9%) | 66 (54.1%) |
| 5 to 9 Year Old | 576 (66.4%) | 291 (33.6%) |
| 10 to 14 Year Olds | 809 (64.6%) | 443 (35.4%) |
| 15 to 17 Year Olds | 711 (100.0%) | 0 (0.0%) |
| 18 to 19 Year Olds | 116 (100.0%) | 0 (0.0%) |
| 20 to 24 Year Olds | 386 (92.8%) | 30 (7.2%) |
| 25 to 34 Year Olds | 20 (29.0%) | 49 (71.0%) |
| 35 Years and over | 403 (88.0%) | 55 (12.0%) |
| Total | 3,076 (76.7%) | 935 (23.3%) |
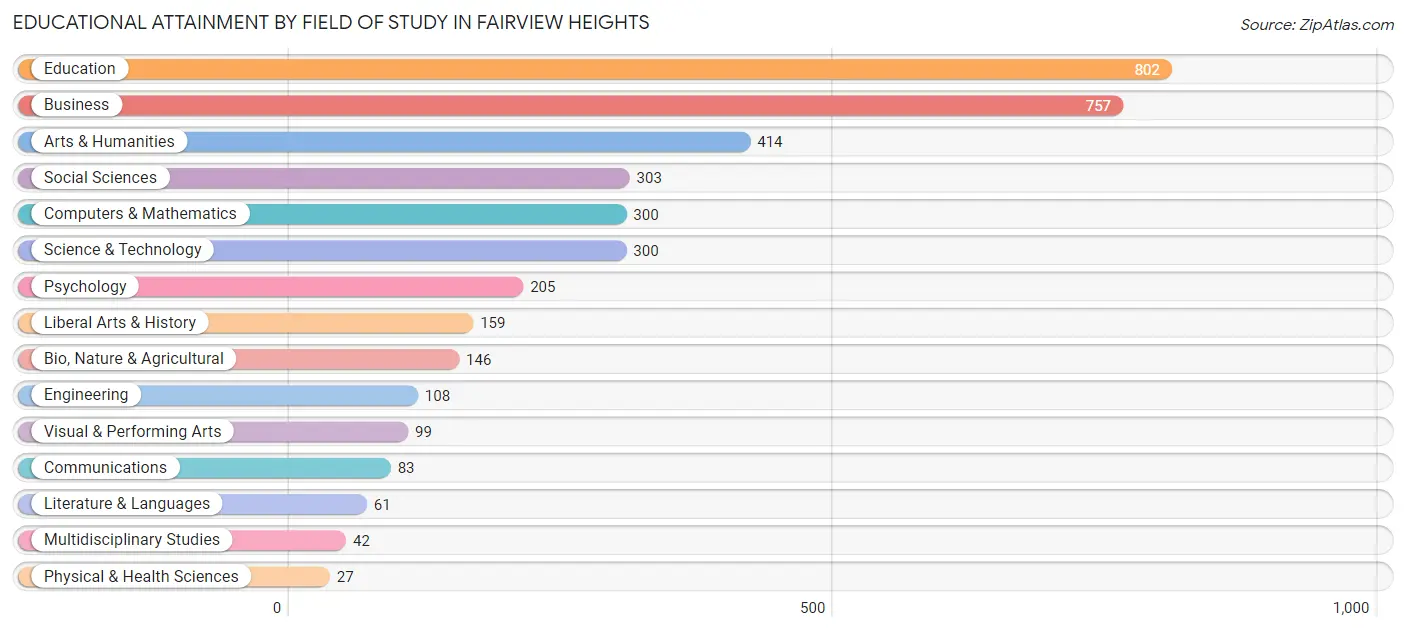
Educational Attainment by Field of Study in Fairview Heights
Education (802 | 21.1%), business (757 | 19.9%), arts & humanities (414 | 10.9%), social sciences (303 | 8.0%), and computers & mathematics (300 | 7.9%) are the most common fields of study among 3,806 individuals in Fairview Heights who have obtained a bachelor's degree or higher.
| Field of Study | # Graduates | % Graduates |
| Computers & Mathematics | 300 | 7.9% |
| Bio, Nature & Agricultural | 146 | 3.8% |
| Physical & Health Sciences | 27 | 0.7% |
| Psychology | 205 | 5.4% |
| Social Sciences | 303 | 8.0% |
| Engineering | 108 | 2.8% |
| Multidisciplinary Studies | 42 | 1.1% |
| Science & Technology | 300 | 7.9% |
| Business | 757 | 19.9% |
| Education | 802 | 21.1% |
| Literature & Languages | 61 | 1.6% |
| Liberal Arts & History | 159 | 4.2% |
| Visual & Performing Arts | 99 | 2.6% |
| Communications | 83 | 2.2% |
| Arts & Humanities | 414 | 10.9% |
| Total | 3,806 | 100.0% |
Transportation & Commute in Fairview Heights
Vehicle Availability by Sex in Fairview Heights
The most prevalent vehicle ownership categories in Fairview Heights are males with 2 vehicles (1,600, accounting for 37.4%) and females with 2 vehicles (1,468, making up 42.1%).

| Vehicles Available | Male | Female |
| No Vehicle | 65 (1.5%) | 97 (2.5%) |
| 1 Vehicle | 1,114 (26.0%) | 955 (25.1%) |
| 2 Vehicles | 1,600 (37.4%) | 1,468 (38.6%) |
| 3 Vehicles | 865 (20.2%) | 990 (26.0%) |
| 4 Vehicles | 609 (14.2%) | 246 (6.5%) |
| 5 or more Vehicles | 29 (0.7%) | 47 (1.2%) |
| Total | 4,282 (100.0%) | 3,803 (100.0%) |
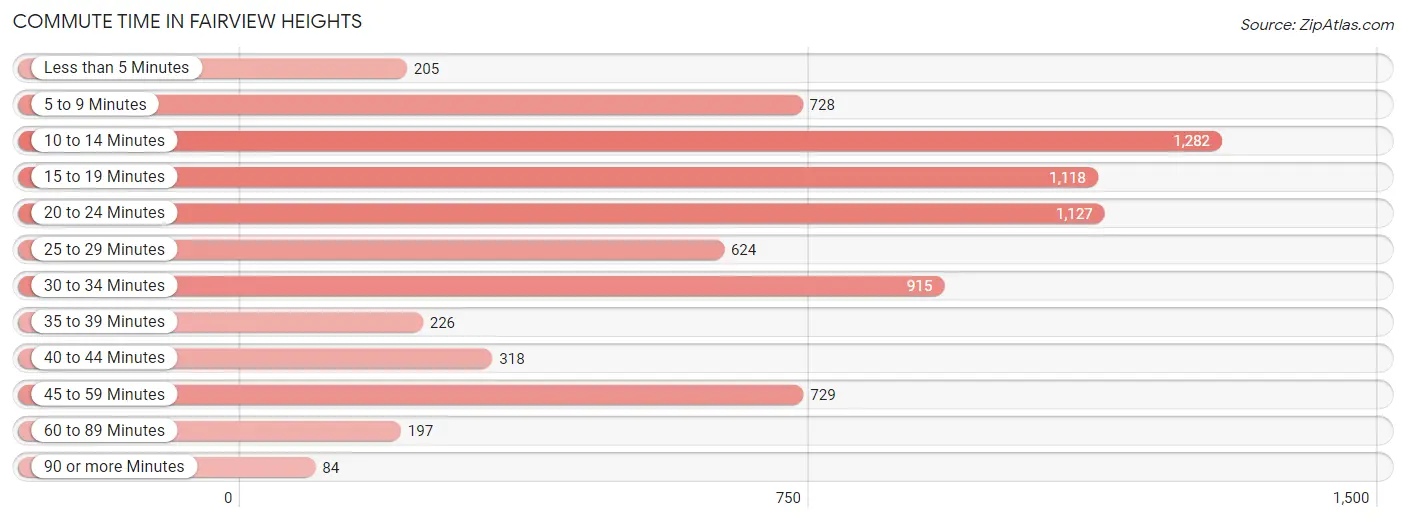
Commute Time in Fairview Heights
The most frequently occuring commute durations in Fairview Heights are 10 to 14 minutes (1,282 commuters, 17.0%), 20 to 24 minutes (1,127 commuters, 14.9%), and 15 to 19 minutes (1,118 commuters, 14.8%).
| Commute Time | # Commuters | % Commuters |
| Less than 5 Minutes | 205 | 2.7% |
| 5 to 9 Minutes | 728 | 9.6% |
| 10 to 14 Minutes | 1,282 | 17.0% |
| 15 to 19 Minutes | 1,118 | 14.8% |
| 20 to 24 Minutes | 1,127 | 14.9% |
| 25 to 29 Minutes | 624 | 8.3% |
| 30 to 34 Minutes | 915 | 12.1% |
| 35 to 39 Minutes | 226 | 3.0% |
| 40 to 44 Minutes | 318 | 4.2% |
| 45 to 59 Minutes | 729 | 9.7% |
| 60 to 89 Minutes | 197 | 2.6% |
| 90 or more Minutes | 84 | 1.1% |
Commute Time by Sex in Fairview Heights
The most common commute times in Fairview Heights are 20 to 24 minutes (741 commuters, 18.1%) for males and 10 to 14 minutes (733 commuters, 21.2%) for females.
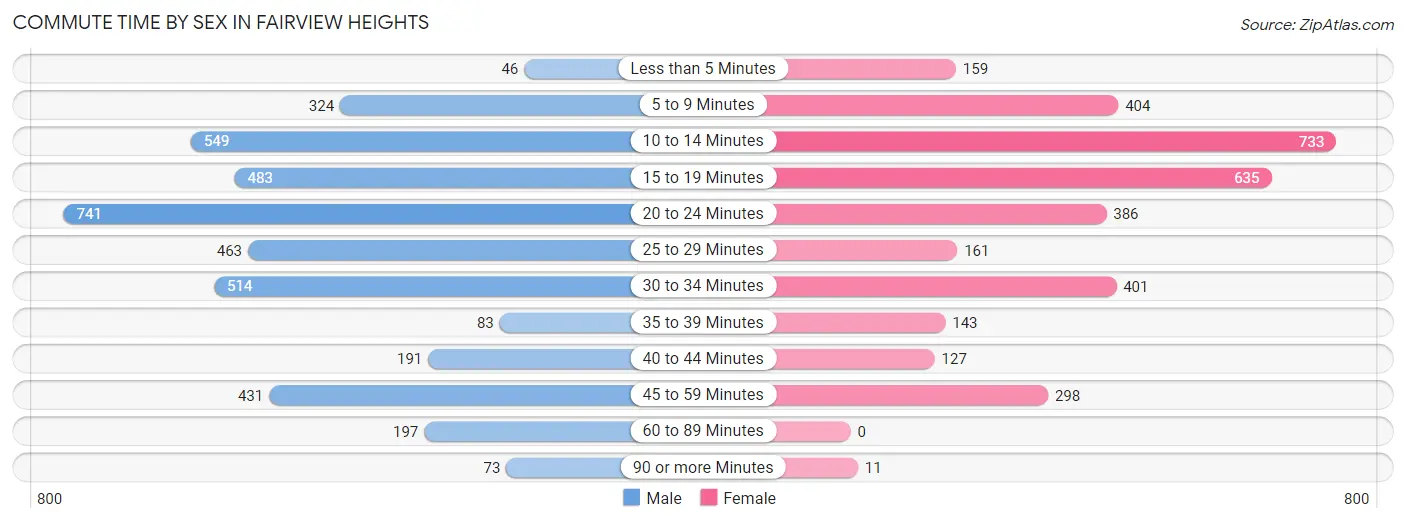
| Commute Time | Male | Female |
| Less than 5 Minutes | 46 (1.1%) | 159 (4.6%) |
| 5 to 9 Minutes | 324 (7.9%) | 404 (11.7%) |
| 10 to 14 Minutes | 549 (13.4%) | 733 (21.2%) |
| 15 to 19 Minutes | 483 (11.8%) | 635 (18.4%) |
| 20 to 24 Minutes | 741 (18.1%) | 386 (11.2%) |
| 25 to 29 Minutes | 463 (11.3%) | 161 (4.7%) |
| 30 to 34 Minutes | 514 (12.6%) | 401 (11.6%) |
| 35 to 39 Minutes | 83 (2.0%) | 143 (4.1%) |
| 40 to 44 Minutes | 191 (4.7%) | 127 (3.7%) |
| 45 to 59 Minutes | 431 (10.5%) | 298 (8.6%) |
| 60 to 89 Minutes | 197 (4.8%) | 0 (0.0%) |
| 90 or more Minutes | 73 (1.8%) | 11 (0.3%) |
Time of Departure to Work by Sex in Fairview Heights
The most frequent times of departure to work in Fairview Heights are 6:30 AM to 6:59 AM (720, 17.6%) for males and 7:30 AM to 7:59 AM (667, 19.3%) for females.
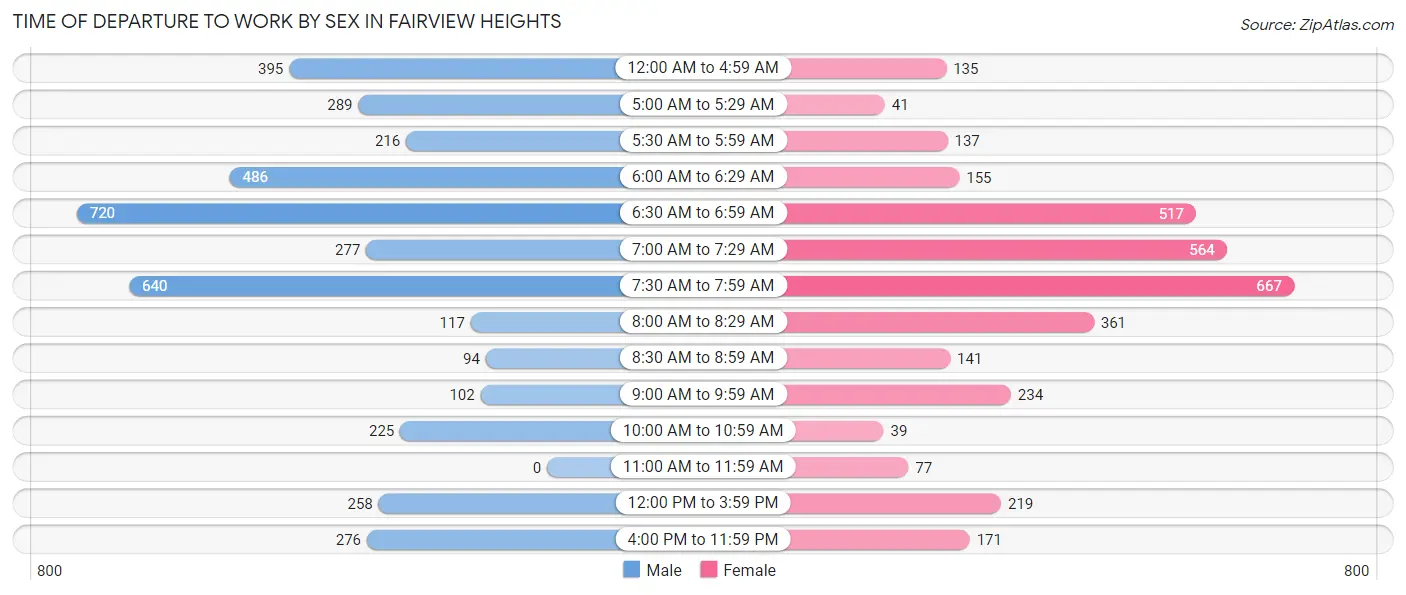
| Time of Departure | Male | Female |
| 12:00 AM to 4:59 AM | 395 (9.7%) | 135 (3.9%) |
| 5:00 AM to 5:29 AM | 289 (7.1%) | 41 (1.2%) |
| 5:30 AM to 5:59 AM | 216 (5.3%) | 137 (4.0%) |
| 6:00 AM to 6:29 AM | 486 (11.9%) | 155 (4.5%) |
| 6:30 AM to 6:59 AM | 720 (17.6%) | 517 (14.9%) |
| 7:00 AM to 7:29 AM | 277 (6.8%) | 564 (16.3%) |
| 7:30 AM to 7:59 AM | 640 (15.6%) | 667 (19.3%) |
| 8:00 AM to 8:29 AM | 117 (2.9%) | 361 (10.4%) |
| 8:30 AM to 8:59 AM | 94 (2.3%) | 141 (4.1%) |
| 9:00 AM to 9:59 AM | 102 (2.5%) | 234 (6.8%) |
| 10:00 AM to 10:59 AM | 225 (5.5%) | 39 (1.1%) |
| 11:00 AM to 11:59 AM | 0 (0.0%) | 77 (2.2%) |
| 12:00 PM to 3:59 PM | 258 (6.3%) | 219 (6.3%) |
| 4:00 PM to 11:59 PM | 276 (6.7%) | 171 (5.0%) |
| Total | 4,095 (100.0%) | 3,458 (100.0%) |
Housing Occupancy in Fairview Heights
Occupancy by Ownership in Fairview Heights
Of the total 7,026 dwellings in Fairview Heights, owner-occupied units account for 4,463 (63.5%), while renter-occupied units make up 2,563 (36.5%).
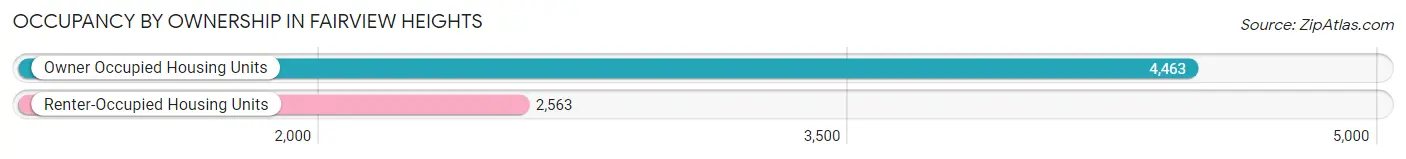
| Occupancy | # Housing Units | % Housing Units |
| Owner Occupied Housing Units | 4,463 | 63.5% |
| Renter-Occupied Housing Units | 2,563 | 36.5% |
| Total Occupied Housing Units | 7,026 | 100.0% |
Occupancy by Household Size in Fairview Heights
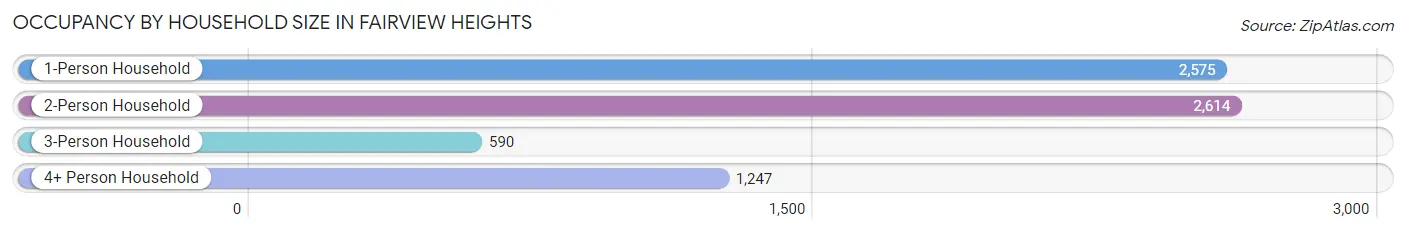
| Household Size | # Housing Units | % Housing Units |
| 1-Person Household | 2,575 | 36.6% |
| 2-Person Household | 2,614 | 37.2% |
| 3-Person Household | 590 | 8.4% |
| 4+ Person Household | 1,247 | 17.7% |
| Total Housing Units | 7,026 | 100.0% |
Occupancy by Ownership by Household Size in Fairview Heights
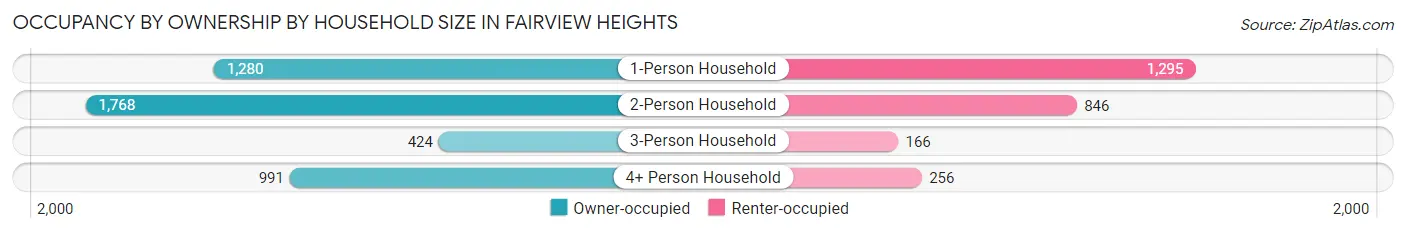
| Household Size | Owner-occupied | Renter-occupied |
| 1-Person Household | 1,280 (49.7%) | 1,295 (50.3%) |
| 2-Person Household | 1,768 (67.6%) | 846 (32.4%) |
| 3-Person Household | 424 (71.9%) | 166 (28.1%) |
| 4+ Person Household | 991 (79.5%) | 256 (20.5%) |
| Total Housing Units | 4,463 (63.5%) | 2,563 (36.5%) |
Occupancy by Educational Attainment in Fairview Heights
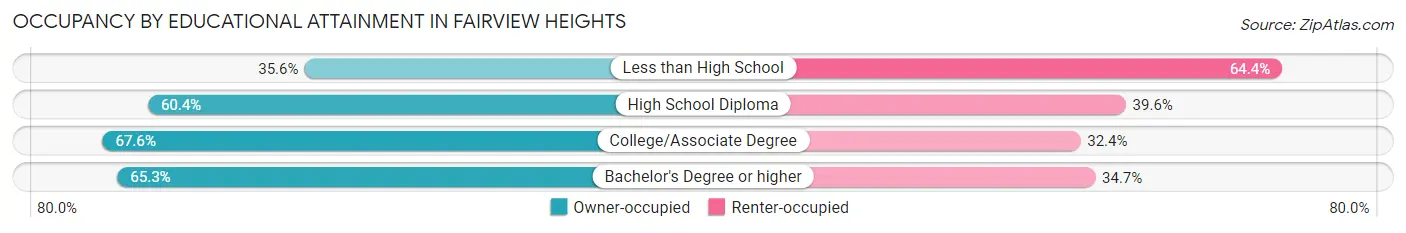
| Household Size | Owner-occupied | Renter-occupied |
| Less than High School | 139 (35.6%) | 251 (64.4%) |
| High School Diploma | 846 (60.4%) | 554 (39.6%) |
| College/Associate Degree | 1,728 (67.6%) | 827 (32.4%) |
| Bachelor's Degree or higher | 1,750 (65.3%) | 931 (34.7%) |
Occupancy by Age of Householder in Fairview Heights
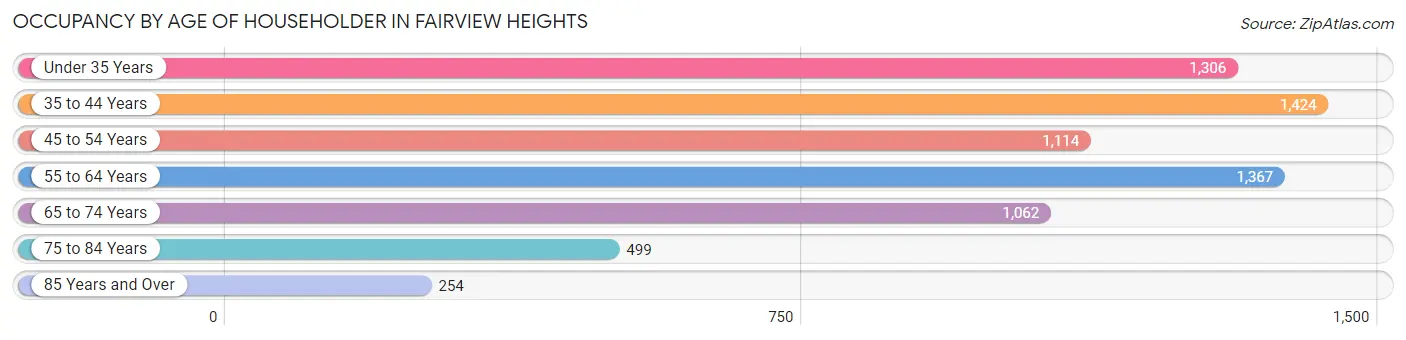
| Age Bracket | # Households | % Households |
| Under 35 Years | 1,306 | 18.6% |
| 35 to 44 Years | 1,424 | 20.3% |
| 45 to 54 Years | 1,114 | 15.9% |
| 55 to 64 Years | 1,367 | 19.5% |
| 65 to 74 Years | 1,062 | 15.1% |
| 75 to 84 Years | 499 | 7.1% |
| 85 Years and Over | 254 | 3.6% |
| Total | 7,026 | 100.0% |
Housing Finances in Fairview Heights
Median Income by Occupancy in Fairview Heights
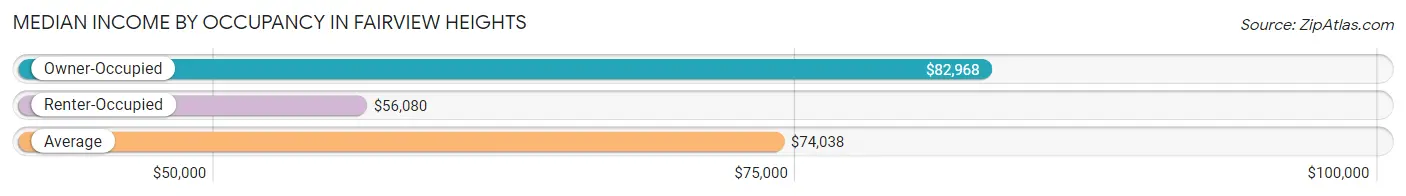
| Occupancy Type | # Households | Median Income |
| Owner-Occupied | 4,463 (63.5%) | $82,968 |
| Renter-Occupied | 2,563 (36.5%) | $56,080 |
| Average | 7,026 (100.0%) | $74,038 |
Occupancy by Householder Income Bracket in Fairview Heights
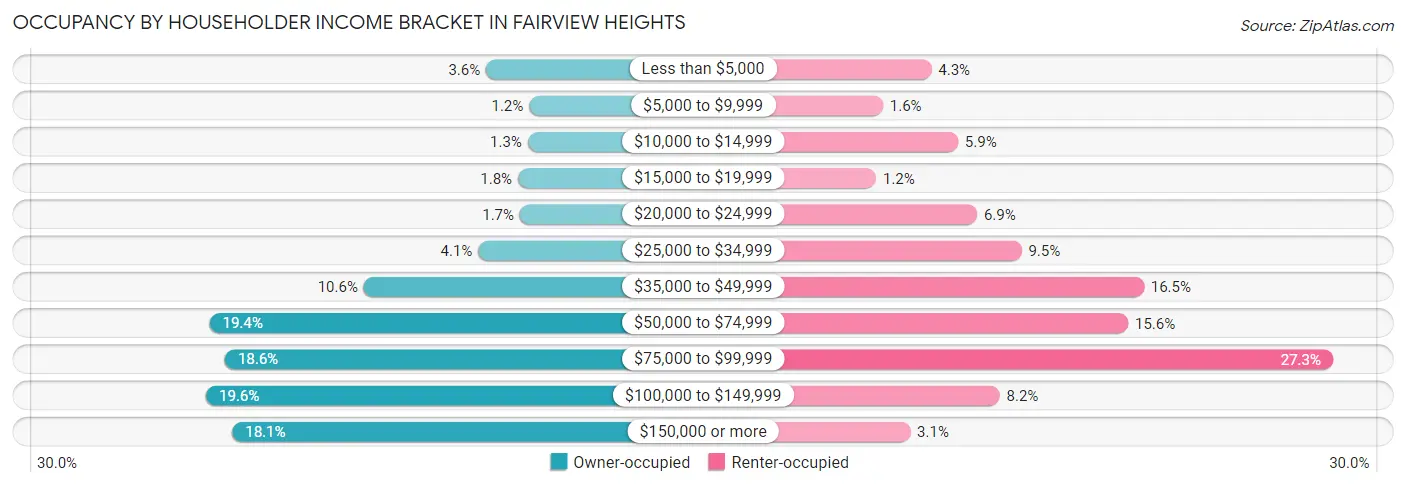
| Income Bracket | Owner-occupied | Renter-occupied |
| Less than $5,000 | 162 (3.6%) | 111 (4.3%) |
| $5,000 to $9,999 | 52 (1.2%) | 40 (1.6%) |
| $10,000 to $14,999 | 56 (1.3%) | 150 (5.9%) |
| $15,000 to $19,999 | 81 (1.8%) | 30 (1.2%) |
| $20,000 to $24,999 | 76 (1.7%) | 178 (6.9%) |
| $25,000 to $34,999 | 182 (4.1%) | 243 (9.5%) |
| $35,000 to $49,999 | 474 (10.6%) | 422 (16.5%) |
| $50,000 to $74,999 | 867 (19.4%) | 399 (15.6%) |
| $75,000 to $99,999 | 828 (18.5%) | 699 (27.3%) |
| $100,000 to $149,999 | 876 (19.6%) | 211 (8.2%) |
| $150,000 or more | 809 (18.1%) | 80 (3.1%) |
| Total | 4,463 (100.0%) | 2,563 (100.0%) |
Monthly Housing Cost Tiers in Fairview Heights
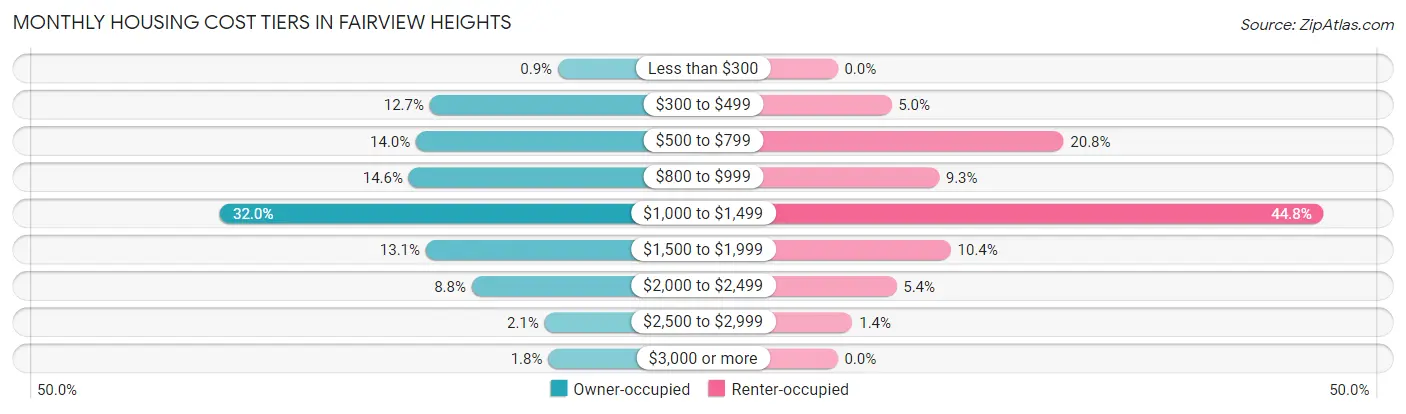
| Monthly Cost | Owner-occupied | Renter-occupied |
| Less than $300 | 40 (0.9%) | 0 (0.0%) |
| $300 to $499 | 567 (12.7%) | 127 (5.0%) |
| $500 to $799 | 623 (14.0%) | 533 (20.8%) |
| $800 to $999 | 653 (14.6%) | 239 (9.3%) |
| $1,000 to $1,499 | 1,428 (32.0%) | 1,147 (44.8%) |
| $1,500 to $1,999 | 583 (13.1%) | 267 (10.4%) |
| $2,000 to $2,499 | 394 (8.8%) | 139 (5.4%) |
| $2,500 to $2,999 | 95 (2.1%) | 35 (1.4%) |
| $3,000 or more | 80 (1.8%) | 0 (0.0%) |
| Total | 4,463 (100.0%) | 2,563 (100.0%) |
Physical Housing Characteristics in Fairview Heights
Housing Structures in Fairview Heights
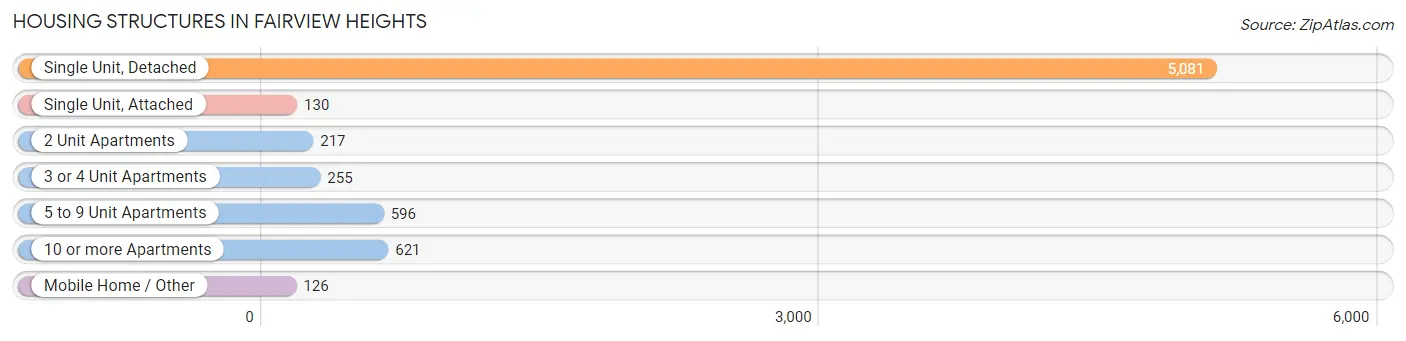
| Structure Type | # Housing Units | % Housing Units |
| Single Unit, Detached | 5,081 | 72.3% |
| Single Unit, Attached | 130 | 1.8% |
| 2 Unit Apartments | 217 | 3.1% |
| 3 or 4 Unit Apartments | 255 | 3.6% |
| 5 to 9 Unit Apartments | 596 | 8.5% |
| 10 or more Apartments | 621 | 8.8% |
| Mobile Home / Other | 126 | 1.8% |
| Total | 7,026 | 100.0% |
Housing Structures by Occupancy in Fairview Heights
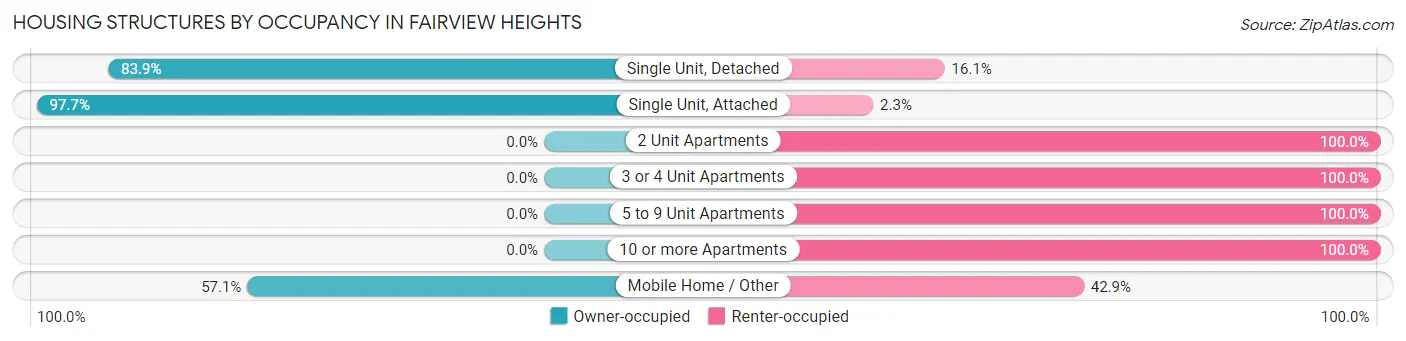
| Structure Type | Owner-occupied | Renter-occupied |
| Single Unit, Detached | 4,264 (83.9%) | 817 (16.1%) |
| Single Unit, Attached | 127 (97.7%) | 3 (2.3%) |
| 2 Unit Apartments | 0 (0.0%) | 217 (100.0%) |
| 3 or 4 Unit Apartments | 0 (0.0%) | 255 (100.0%) |
| 5 to 9 Unit Apartments | 0 (0.0%) | 596 (100.0%) |
| 10 or more Apartments | 0 (0.0%) | 621 (100.0%) |
| Mobile Home / Other | 72 (57.1%) | 54 (42.9%) |
| Total | 4,463 (63.5%) | 2,563 (36.5%) |
Housing Structures by Number of Rooms in Fairview Heights
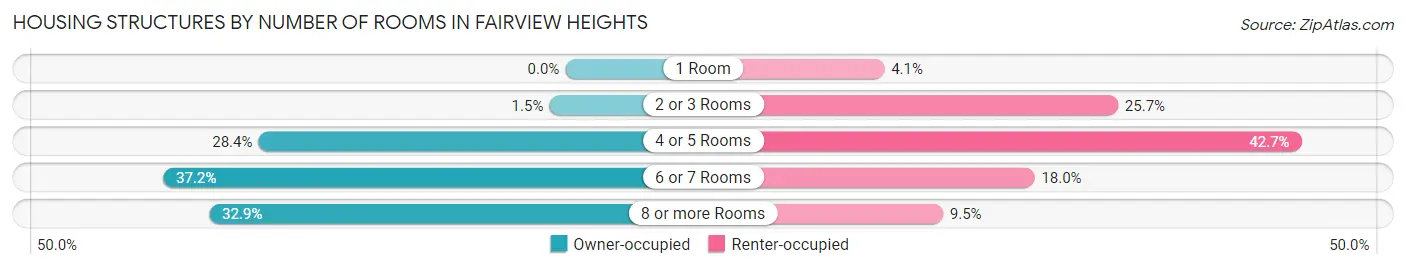
| Number of Rooms | Owner-occupied | Renter-occupied |
| 1 Room | 0 (0.0%) | 105 (4.1%) |
| 2 or 3 Rooms | 66 (1.5%) | 659 (25.7%) |
| 4 or 5 Rooms | 1,267 (28.4%) | 1,094 (42.7%) |
| 6 or 7 Rooms | 1,660 (37.2%) | 461 (18.0%) |
| 8 or more Rooms | 1,470 (32.9%) | 244 (9.5%) |
| Total | 4,463 (100.0%) | 2,563 (100.0%) |
Housing Structure by Heating Type in Fairview Heights
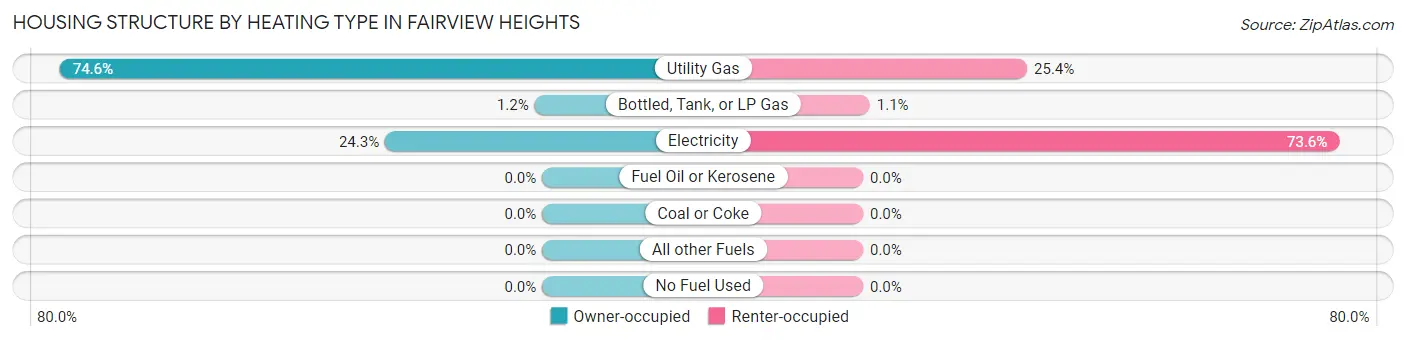
| Heating Type | Owner-occupied | Renter-occupied |
| Utility Gas | 3,327 (74.6%) | 650 (25.4%) |
| Bottled, Tank, or LP Gas | 52 (1.2%) | 27 (1.1%) |
| Electricity | 1,084 (24.3%) | 1,886 (73.6%) |
| Fuel Oil or Kerosene | 0 (0.0%) | 0 (0.0%) |
| Coal or Coke | 0 (0.0%) | 0 (0.0%) |
| All other Fuels | 0 (0.0%) | 0 (0.0%) |
| No Fuel Used | 0 (0.0%) | 0 (0.0%) |
| Total | 4,463 (100.0%) | 2,563 (100.0%) |
Household Vehicle Usage in Fairview Heights
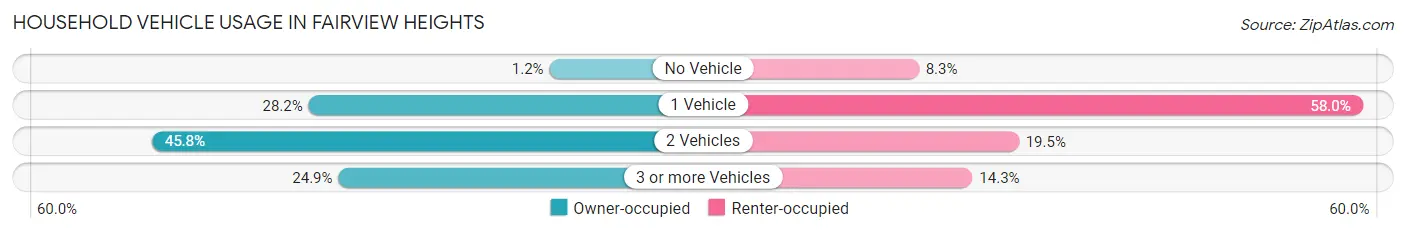
| Vehicles per Household | Owner-occupied | Renter-occupied |
| No Vehicle | 54 (1.2%) | 212 (8.3%) |
| 1 Vehicle | 1,258 (28.2%) | 1,486 (58.0%) |
| 2 Vehicles | 2,042 (45.8%) | 499 (19.5%) |
| 3 or more Vehicles | 1,109 (24.8%) | 366 (14.3%) |
| Total | 4,463 (100.0%) | 2,563 (100.0%) |
Real Estate & Mortgages in Fairview Heights
Real Estate and Mortgage Overview in Fairview Heights
| Characteristic | Without Mortgage | With Mortgage |
| Housing Units | 1,485 | 2,978 |
| Median Property Value | $136,300 | $163,900 |
| Median Household Income | $69,570 | $626 |
| Monthly Housing Costs | $572 | $80 |
| Real Estate Taxes | $2,634 | $105 |
Property Value by Mortgage Status in Fairview Heights
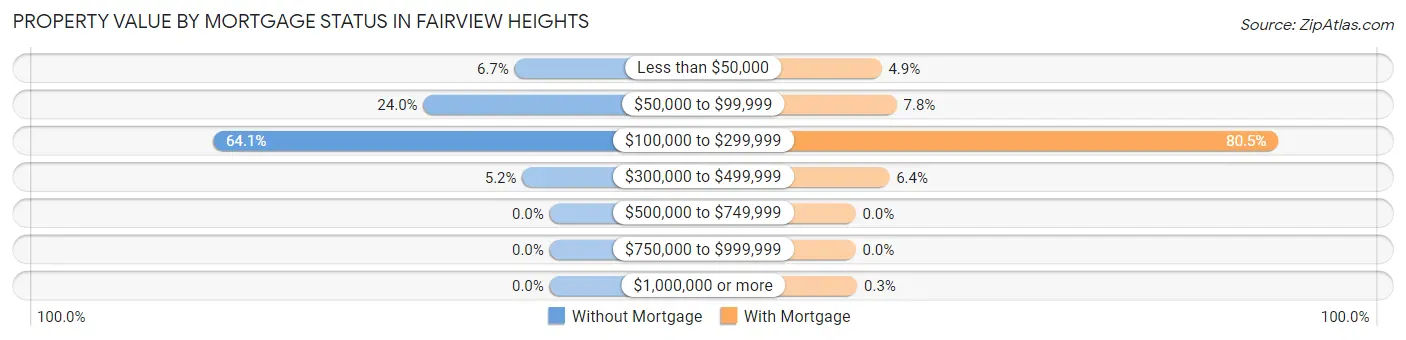
| Property Value | Without Mortgage | With Mortgage |
| Less than $50,000 | 99 (6.7%) | 147 (4.9%) |
| $50,000 to $99,999 | 357 (24.0%) | 233 (7.8%) |
| $100,000 to $299,999 | 952 (64.1%) | 2,398 (80.5%) |
| $300,000 to $499,999 | 77 (5.2%) | 191 (6.4%) |
| $500,000 to $749,999 | 0 (0.0%) | 0 (0.0%) |
| $750,000 to $999,999 | 0 (0.0%) | 0 (0.0%) |
| $1,000,000 or more | 0 (0.0%) | 9 (0.3%) |
| Total | 1,485 (100.0%) | 2,978 (100.0%) |
Household Income by Mortgage Status in Fairview Heights
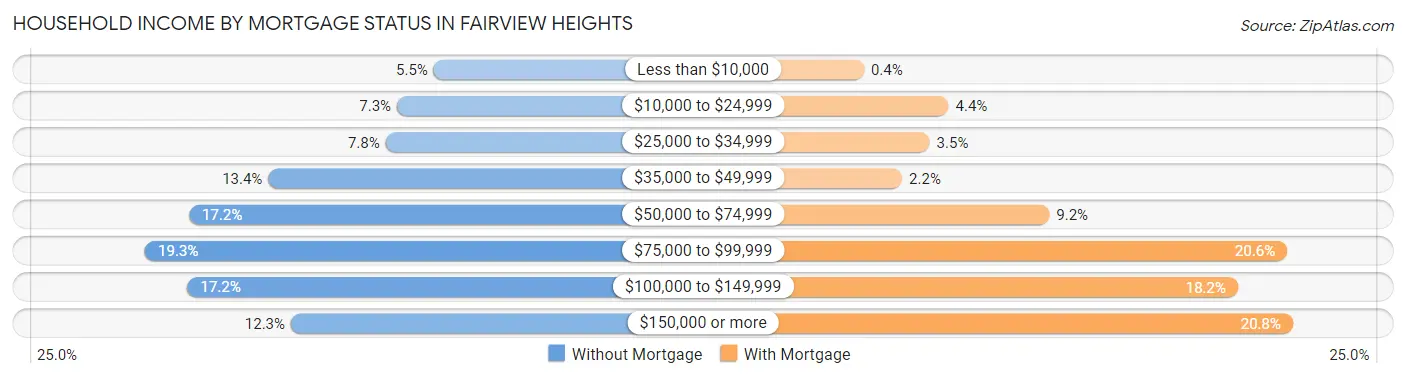
| Household Income | Without Mortgage | With Mortgage |
| Less than $10,000 | 82 (5.5%) | 12 (0.4%) |
| $10,000 to $24,999 | 108 (7.3%) | 132 (4.4%) |
| $25,000 to $34,999 | 116 (7.8%) | 105 (3.5%) |
| $35,000 to $49,999 | 199 (13.4%) | 66 (2.2%) |
| $50,000 to $74,999 | 255 (17.2%) | 275 (9.2%) |
| $75,000 to $99,999 | 286 (19.3%) | 612 (20.5%) |
| $100,000 to $149,999 | 256 (17.2%) | 542 (18.2%) |
| $150,000 or more | 183 (12.3%) | 620 (20.8%) |
| Total | 1,485 (100.0%) | 2,978 (100.0%) |
Property Value to Household Income Ratio in Fairview Heights
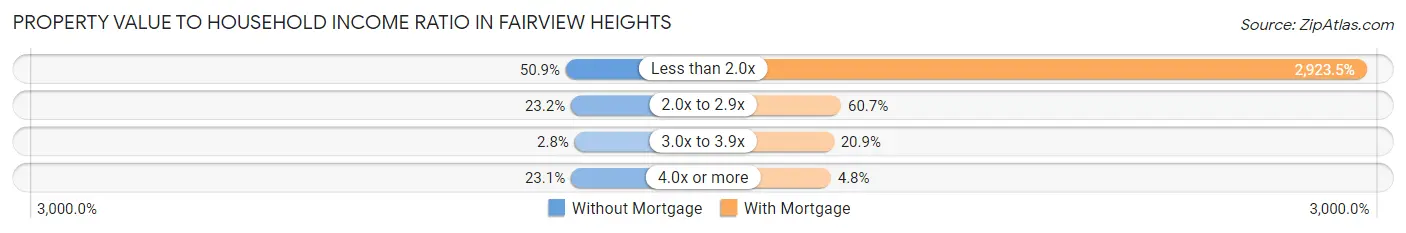
| Value-to-Income Ratio | Without Mortgage | With Mortgage |
| Less than 2.0x | 756 (50.9%) | 87,063 (2,923.5%) |
| 2.0x to 2.9x | 344 (23.2%) | 1,807 (60.7%) |
| 3.0x to 3.9x | 42 (2.8%) | 621 (20.8%) |
| 4.0x or more | 343 (23.1%) | 142 (4.8%) |
| Total | 1,485 (100.0%) | 2,978 (100.0%) |
Real Estate Taxes by Mortgage Status in Fairview Heights
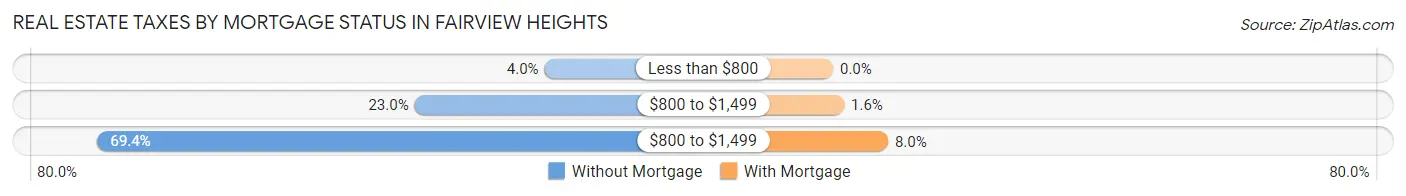
| Property Taxes | Without Mortgage | With Mortgage |
| Less than $800 | 60 (4.0%) | 0 (0.0%) |
| $800 to $1,499 | 342 (23.0%) | 48 (1.6%) |
| $800 to $1,499 | 1,030 (69.4%) | 239 (8.0%) |
| Total | 1,485 (100.0%) | 2,978 (100.0%) |
Health & Disability in Fairview Heights
Health Insurance Coverage by Age in Fairview Heights
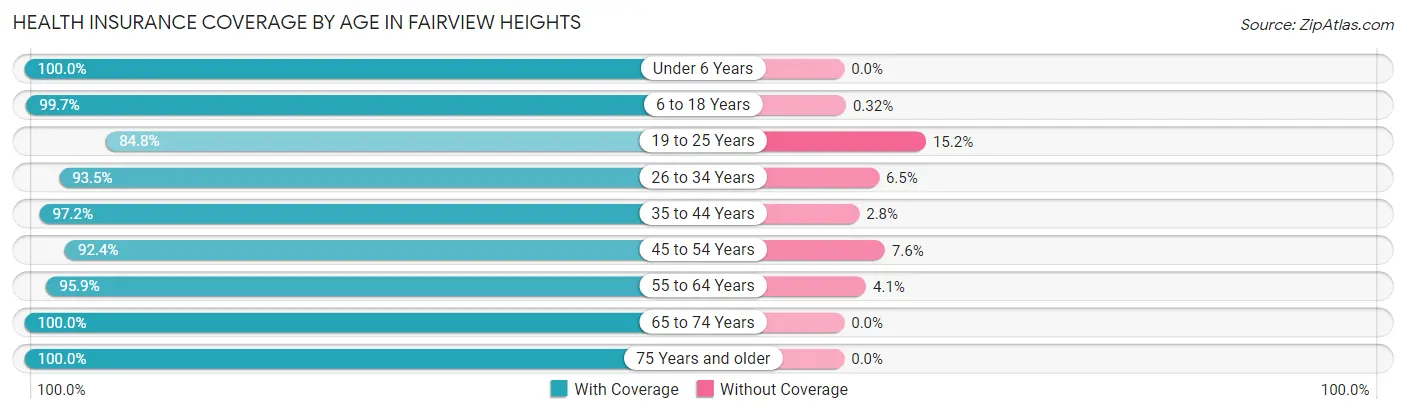
| Age Bracket | With Coverage | Without Coverage |
| Under 6 Years | 993 (100.0%) | 0 (0.0%) |
| 6 to 18 Years | 2,843 (99.7%) | 9 (0.3%) |
| 19 to 25 Years | 1,291 (84.8%) | 232 (15.2%) |
| 26 to 34 Years | 1,434 (93.5%) | 99 (6.5%) |
| 35 to 44 Years | 2,161 (97.2%) | 62 (2.8%) |
| 45 to 54 Years | 1,977 (92.4%) | 162 (7.6%) |
| 55 to 64 Years | 2,150 (95.9%) | 91 (4.1%) |
| 65 to 74 Years | 1,570 (100.0%) | 0 (0.0%) |
| 75 Years and older | 1,039 (100.0%) | 0 (0.0%) |
| Total | 15,458 (95.9%) | 655 (4.1%) |
Health Insurance Coverage by Citizenship Status in Fairview Heights
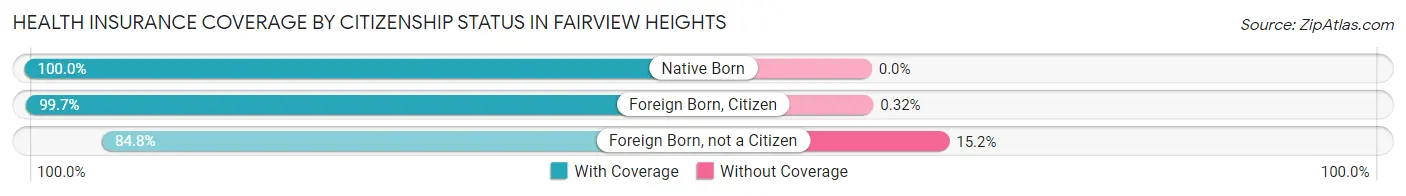
| Citizenship Status | With Coverage | Without Coverage |
| Native Born | 993 (100.0%) | 0 (0.0%) |
| Foreign Born, Citizen | 2,843 (99.7%) | 9 (0.3%) |
| Foreign Born, not a Citizen | 1,291 (84.8%) | 232 (15.2%) |
Health Insurance Coverage by Household Income in Fairview Heights
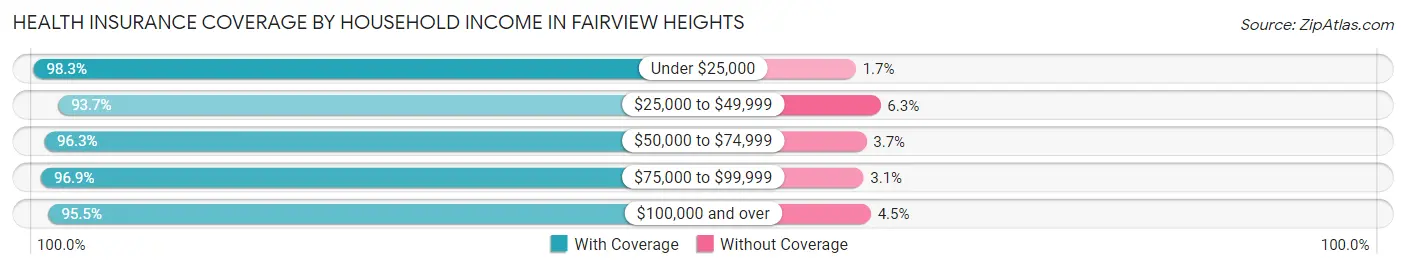
| Household Income | With Coverage | Without Coverage |
| Under $25,000 | 1,652 (98.3%) | 28 (1.7%) |
| $25,000 to $49,999 | 2,351 (93.7%) | 158 (6.3%) |
| $50,000 to $74,999 | 2,679 (96.3%) | 102 (3.7%) |
| $75,000 to $99,999 | 2,970 (96.9%) | 95 (3.1%) |
| $100,000 and over | 5,801 (95.5%) | 272 (4.5%) |
Public vs Private Health Insurance Coverage by Age in Fairview Heights
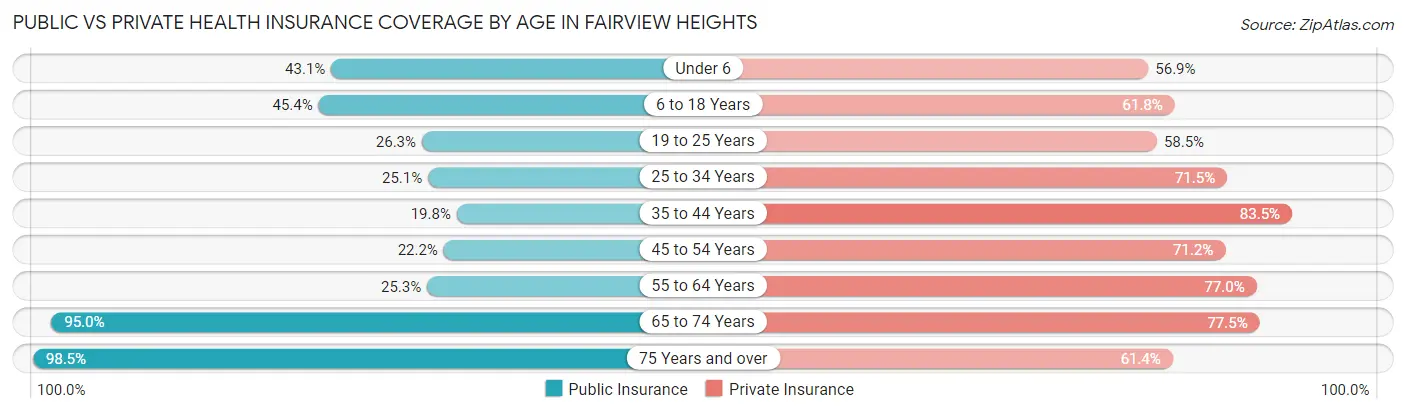
| Age Bracket | Public Insurance | Private Insurance |
| Under 6 | 428 (43.1%) | 565 (56.9%) |
| 6 to 18 Years | 1,296 (45.4%) | 1,762 (61.8%) |
| 19 to 25 Years | 400 (26.3%) | 891 (58.5%) |
| 25 to 34 Years | 385 (25.1%) | 1,096 (71.5%) |
| 35 to 44 Years | 440 (19.8%) | 1,857 (83.5%) |
| 45 to 54 Years | 475 (22.2%) | 1,522 (71.2%) |
| 55 to 64 Years | 567 (25.3%) | 1,725 (77.0%) |
| 65 to 74 Years | 1,492 (95.0%) | 1,217 (77.5%) |
| 75 Years and over | 1,023 (98.5%) | 638 (61.4%) |
| Total | 6,506 (40.4%) | 11,273 (70.0%) |
Disability Status by Sex by Age in Fairview Heights
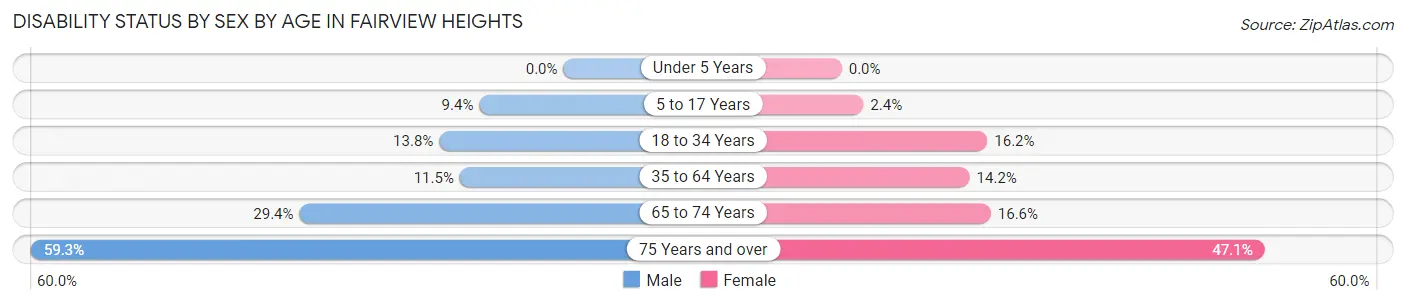
| Age Bracket | Male | Female |
| Under 5 Years | 0 (0.0%) | 0 (0.0%) |
| 5 to 17 Years | 152 (9.4%) | 30 (2.4%) |
| 18 to 34 Years | 210 (13.8%) | 271 (16.2%) |
| 35 to 64 Years | 368 (11.5%) | 486 (14.2%) |
| 65 to 74 Years | 249 (29.4%) | 120 (16.6%) |
| 75 Years and over | 271 (59.3%) | 274 (47.1%) |
Disability Class by Sex by Age in Fairview Heights
Disability Class: Hearing Difficulty
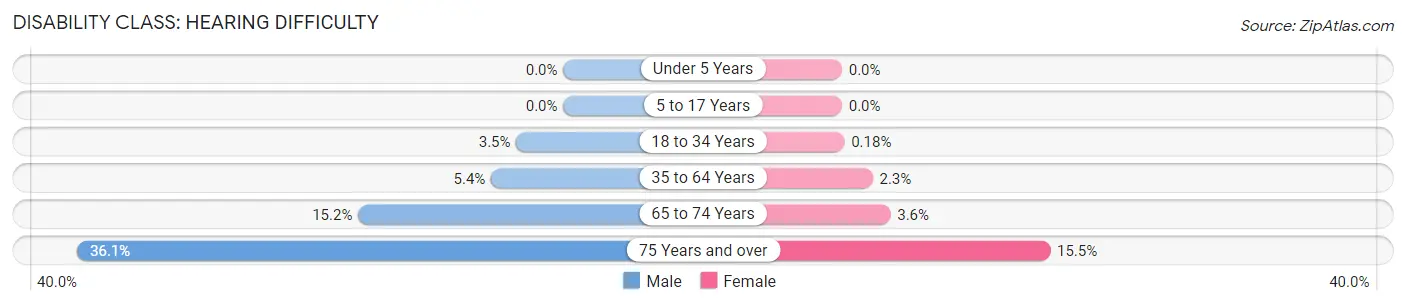
| Age Bracket | Male | Female |
| Under 5 Years | 0 (0.0%) | 0 (0.0%) |
| 5 to 17 Years | 0 (0.0%) | 0 (0.0%) |
| 18 to 34 Years | 53 (3.5%) | 3 (0.2%) |
| 35 to 64 Years | 171 (5.4%) | 78 (2.3%) |
| 65 to 74 Years | 129 (15.2%) | 26 (3.6%) |
| 75 Years and over | 165 (36.1%) | 90 (15.5%) |
Disability Class: Vision Difficulty
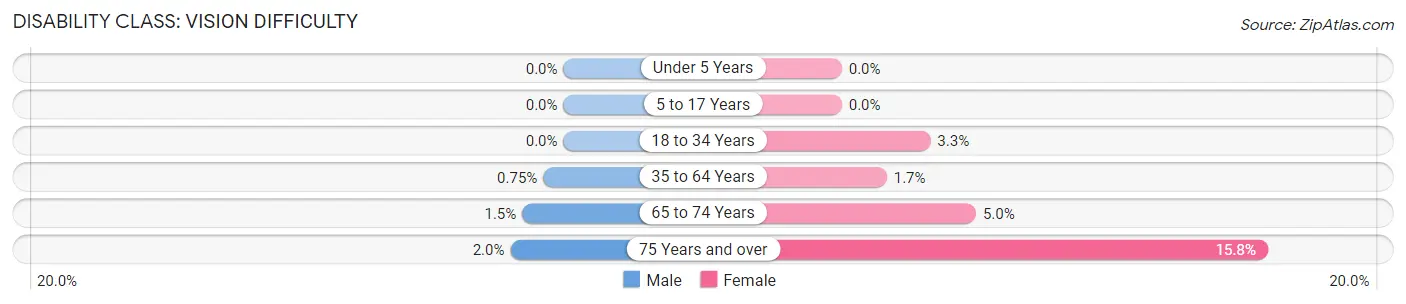
| Age Bracket | Male | Female |
| Under 5 Years | 0 (0.0%) | 0 (0.0%) |
| 5 to 17 Years | 0 (0.0%) | 0 (0.0%) |
| 18 to 34 Years | 0 (0.0%) | 55 (3.3%) |
| 35 to 64 Years | 24 (0.7%) | 57 (1.7%) |
| 65 to 74 Years | 13 (1.5%) | 36 (5.0%) |
| 75 Years and over | 9 (2.0%) | 92 (15.8%) |
Disability Class: Cognitive Difficulty
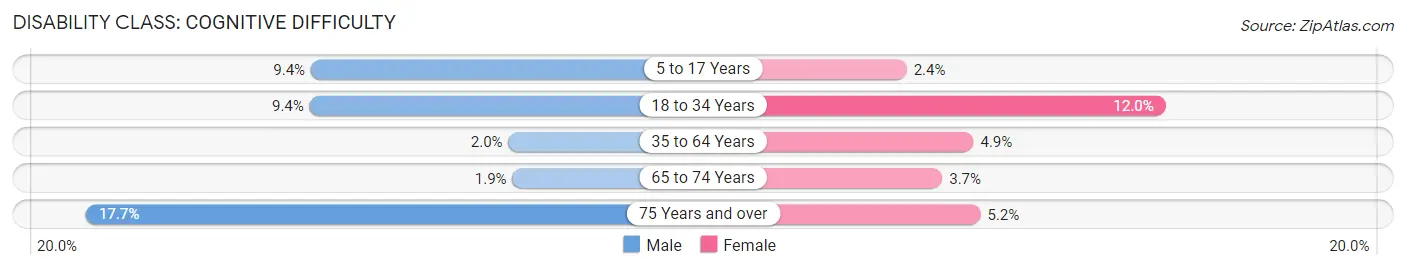
| Age Bracket | Male | Female |
| 5 to 17 Years | 152 (9.4%) | 30 (2.4%) |
| 18 to 34 Years | 143 (9.4%) | 201 (12.0%) |
| 35 to 64 Years | 65 (2.0%) | 167 (4.9%) |
| 65 to 74 Years | 16 (1.9%) | 27 (3.7%) |
| 75 Years and over | 81 (17.7%) | 30 (5.1%) |
Disability Class: Ambulatory Difficulty
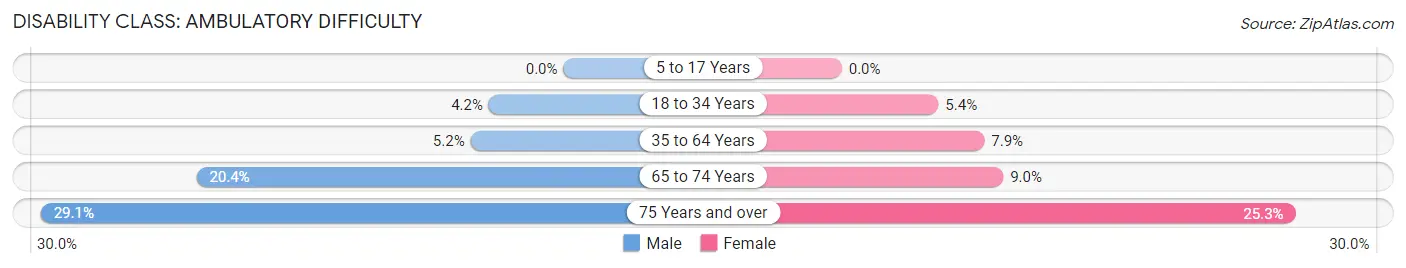
| Age Bracket | Male | Female |
| 5 to 17 Years | 0 (0.0%) | 0 (0.0%) |
| 18 to 34 Years | 63 (4.2%) | 90 (5.4%) |
| 35 to 64 Years | 165 (5.2%) | 271 (7.9%) |
| 65 to 74 Years | 173 (20.4%) | 65 (9.0%) |
| 75 Years and over | 133 (29.1%) | 147 (25.3%) |
Disability Class: Self-Care Difficulty
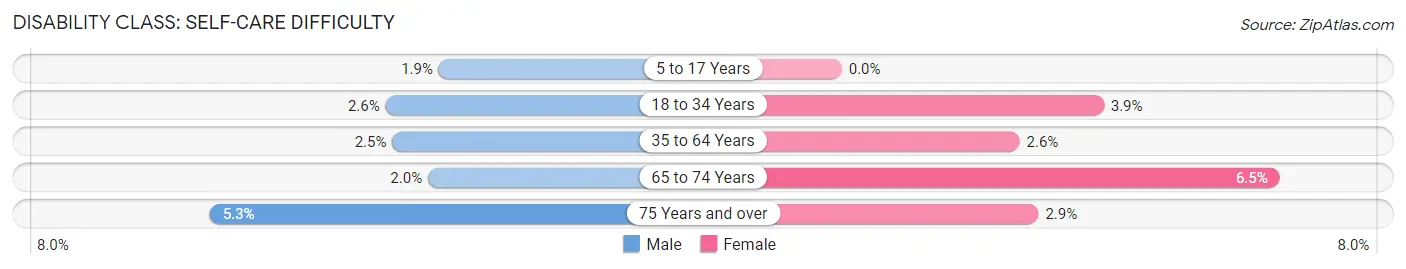
| Age Bracket | Male | Female |
| 5 to 17 Years | 30 (1.8%) | 0 (0.0%) |
| 18 to 34 Years | 40 (2.6%) | 65 (3.9%) |
| 35 to 64 Years | 81 (2.5%) | 90 (2.6%) |
| 65 to 74 Years | 17 (2.0%) | 47 (6.5%) |
| 75 Years and over | 24 (5.2%) | 17 (2.9%) |
Technology Access in Fairview Heights
Computing Device Access in Fairview Heights
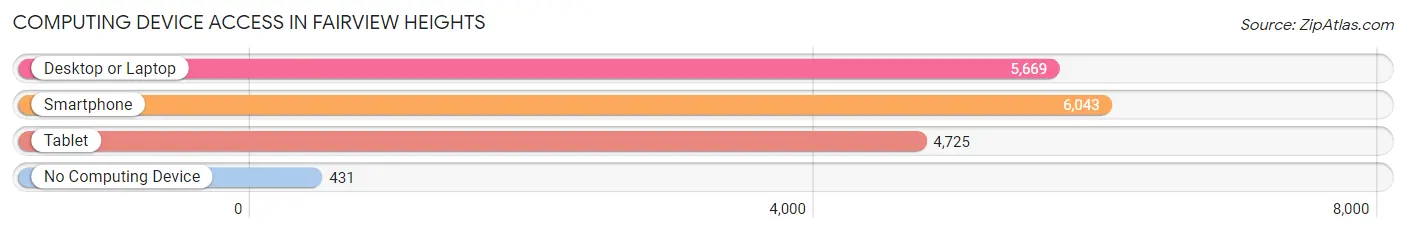
| Device Type | # Households | % Households |
| Desktop or Laptop | 5,669 | 80.7% |
| Smartphone | 6,043 | 86.0% |
| Tablet | 4,725 | 67.2% |
| No Computing Device | 431 | 6.1% |
| Total | 7,026 | 100.0% |
Internet Access in Fairview Heights
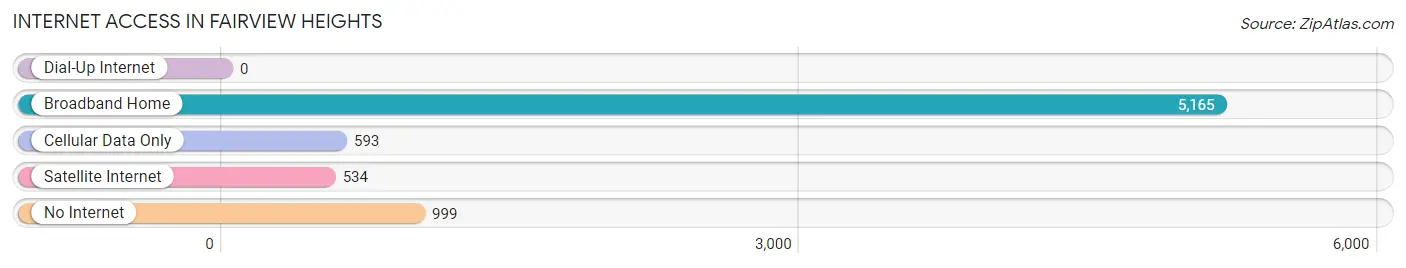
| Internet Type | # Households | % Households |
| Dial-Up Internet | 0 | 0.0% |
| Broadband Home | 5,165 | 73.5% |
| Cellular Data Only | 593 | 8.4% |
| Satellite Internet | 534 | 7.6% |
| No Internet | 999 | 14.2% |
| Total | 7,026 | 100.0% |
Fairview Heights Summary
History
The history of Fairview Heights, Illinois dates back to the early 1800s when the area was first settled by European immigrants. The first settlers were mostly German and Irish immigrants who were attracted to the area due to its fertile soil and abundant natural resources. The first permanent settlement in the area was established in 1818 by a man named John B. Fairview, who gave the area its name.
In the early 1900s, the area began to experience rapid growth due to the development of the railroad and the growth of the coal mining industry. This led to the establishment of several small towns in the area, including Fairview Heights. The town was officially incorporated in 1949 and has since grown to become one of the largest cities in the St. Clair County area.
Geography
Fairview Heights is located in St. Clair County, Illinois, approximately 20 miles east of St. Louis, Missouri. The city is situated on the banks of the Mississippi River and is bordered by the cities of Belleville, O’Fallon, and Shiloh. The city covers an area of approximately 8.5 square miles and has a population of approximately 17,000 people.
The city is divided into several distinct neighborhoods, including the historic downtown area, the residential neighborhoods of Fairview Heights, and the commercial and industrial areas of the city. The city is also home to several parks and recreational areas, including the Fairview Heights Park, the Fairview Heights Sports Complex, and the Fairview Heights Nature Preserve.
Economy
Fairview Heights is home to a diverse economy that is largely driven by the retail and service industries. The city is home to several large retail stores, including Walmart, Target, and Kohl’s, as well as numerous smaller shops and restaurants. The city is also home to several industrial and manufacturing companies, including the Fairview Heights Industrial Park and the Fairview Heights Business Park.
The city is also home to several educational institutions, including the Southwestern Illinois College, the University of Illinois at Springfield, and the Southern Illinois University Edwardsville. The city is also home to several healthcare facilities, including the Memorial Hospital of St. Clair County and the St. Elizabeth’s Medical Center.
Demographics
As of the 2010 census, the population of Fairview Heights was 16,945. The racial makeup of the city was 79.3% White, 14.2% African American, 0.3% Native American, 1.7% Asian, 0.1% Pacific Islander, and 4.4% from other races. The median household income in the city was $50,945, and the median family income was $60,945.
The city is home to a diverse population, with a variety of religious and cultural backgrounds. The city is home to several churches, including the First Baptist Church of Fairview Heights, the Church of the Nazarene, and the St. Paul Lutheran Church. The city is also home to several cultural organizations, including the Fairview Heights Arts Council and the Fairview Heights Historical Society.
Common Questions
What is Per Capita Income in Fairview Heights?
Per Capita income in Fairview Heights is $37,540.
What is the Median Family Income in Fairview Heights?
Median Family Income in Fairview Heights is $88,326.
What is the Median Household income in Fairview Heights?
Median Household Income in Fairview Heights is $74,038.
What is Income or Wage Gap in Fairview Heights?
Income or Wage Gap in Fairview Heights is 23.6%.
Women in Fairview Heights earn 76.4 cents for every dollar earned by a man.
What is Inequality or Gini Index in Fairview Heights?
Inequality or Gini Index in Fairview Heights is 0.40.
What is the Total Population of Fairview Heights?
Total Population of Fairview Heights is 16,360.
What is the Total Male Population of Fairview Heights?
Total Male Population of Fairview Heights is 8,347.
What is the Total Female Population of Fairview Heights?
Total Female Population of Fairview Heights is 8,013.
What is the Ratio of Males per 100 Females in Fairview Heights?
There are 104.17 Males per 100 Females in Fairview Heights.
What is the Ratio of Females per 100 Males in Fairview Heights?
There are 96.00 Females per 100 Males in Fairview Heights.
What is the Median Population Age in Fairview Heights?
Median Population Age in Fairview Heights is 40.0 Years.
What is the Average Family Size in Fairview Heights
Average Family Size in Fairview Heights is 3.1 People.
What is the Average Household Size in Fairview Heights
Average Household Size in Fairview Heights is 2.3 People.
How Large is the Labor Force in Fairview Heights?
There are 8,792 People in the Labor Forcein in Fairview Heights.
What is the Percentage of People in the Labor Force in Fairview Heights?
66.5% of People are in the Labor Force in Fairview Heights.
What is the Unemployment Rate in Fairview Heights?
Unemployment Rate in Fairview Heights is 6.0%.