Zip Codes with the Highest Percentage of Population Employed in Computer, Engineering & Science in Illinois
RELATED REPORTS & OPTIONS
Computer, Engineering & Science
Illinois
Compare Zip Codes
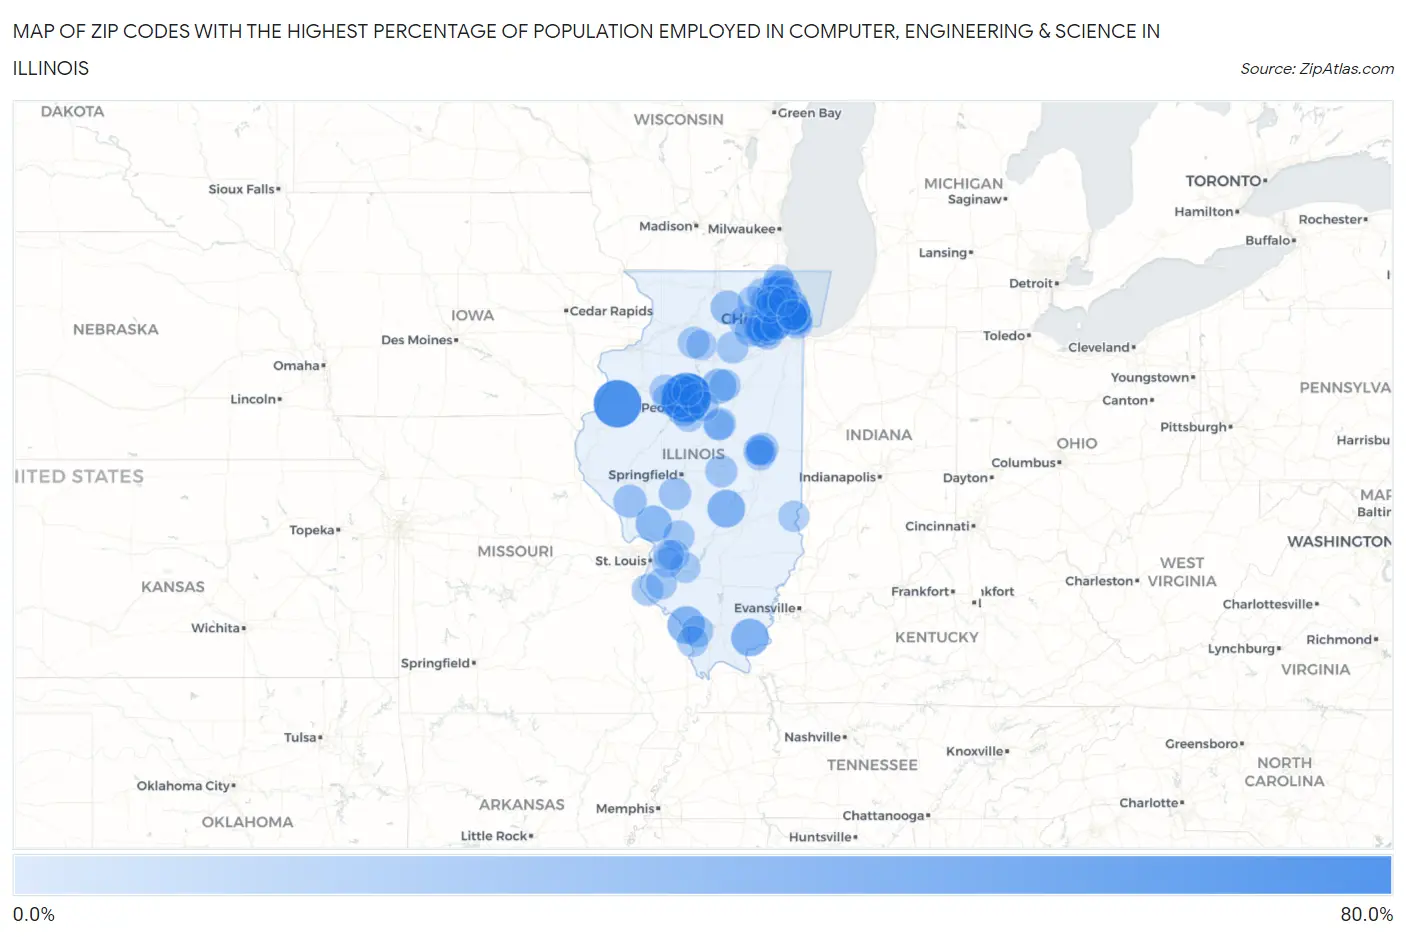
Map of Zip Codes with the Highest Percentage of Population Employed in Computer, Engineering & Science in Illinois
0.0%
80.0%
Zip Codes with the Highest Percentage of Population Employed in Computer, Engineering & Science in Illinois
| Zip Code | % Employed | vs State | vs National | |
| 1. | 61552 | 63.3% | 6.4%(+56.9)#1 | 6.8%(+56.6)#21 |
| 2. | 61478 | 57.7% | 6.4%(+51.3)#2 | 6.8%(+50.9)#22 |
| 3. | 61562 | 37.0% | 6.4%(+30.6)#3 | 6.8%(+30.3)#112 |
| 4. | 62438 | 30.3% | 6.4%(+23.9)#4 | 6.8%(+23.6)#174 |
| 5. | 62947 | 30.0% | 6.4%(+23.6)#5 | 6.8%(+23.2)#176 |
| 6. | 62950 | 29.9% | 6.4%(+23.4)#6 | 6.8%(+23.1)#180 |
| 7. | 62079 | 26.6% | 6.4%(+20.2)#7 | 6.8%(+19.8)#240 |
| 8. | 61602 | 23.0% | 6.4%(+16.6)#8 | 6.8%(+16.3)#344 |
| 9. | 61321 | 23.0% | 6.4%(+16.6)#9 | 6.8%(+16.3)#345 |
| 10. | 60195 | 21.1% | 6.4%(+14.7)#10 | 6.8%(+14.4)#431 |
| 11. | 60661 | 21.0% | 6.4%(+14.6)#11 | 6.8%(+14.3)#436 |
| 12. | 60604 | 20.3% | 6.4%(+13.9)#12 | 6.8%(+13.5)#484 |
| 13. | 60173 | 20.0% | 6.4%(+13.6)#13 | 6.8%(+13.3)#503 |
| 14. | 60111 | 20.0% | 6.4%(+13.6)#14 | 6.8%(+13.2)#509 |
| 15. | 61525 | 20.0% | 6.4%(+13.5)#15 | 6.8%(+13.2)#516 |
| 16. | 60603 | 19.8% | 6.4%(+13.4)#16 | 6.8%(+13.0)#526 |
| 17. | 60069 | 19.7% | 6.4%(+13.2)#17 | 6.8%(+12.9)#536 |
| 18. | 60089 | 19.4% | 6.4%(+13.0)#18 | 6.8%(+12.6)#561 |
| 19. | 60502 | 19.0% | 6.4%(+12.6)#19 | 6.8%(+12.2)#592 |
| 20. | 62050 | 18.5% | 6.4%(+12.1)#20 | 6.8%(+11.8)#633 |
| 21. | 60563 | 17.3% | 6.4%(+10.8)#21 | 6.8%(+10.5)#783 |
| 22. | 60192 | 16.9% | 6.4%(+10.5)#22 | 6.8%(+10.2)#820 |
| 23. | 61528 | 16.5% | 6.4%(+10.0)#23 | 6.8%(+9.71)#888 |
| 24. | 62689 | 16.2% | 6.4%(+9.72)#24 | 6.8%(+9.39)#932 |
| 25. | 60601 | 16.1% | 6.4%(+9.65)#25 | 6.8%(+9.32)#942 |
| 26. | 60564 | 16.0% | 6.4%(+9.55)#26 | 6.8%(+9.22)#956 |
| 27. | 60532 | 15.4% | 6.4%(+8.96)#27 | 6.8%(+8.63)#1,045 |
| 28. | 62523 | 15.4% | 6.4%(+8.95)#28 | 6.8%(+8.62)#1,049 |
| 29. | 60144 | 15.2% | 6.4%(+8.78)#29 | 6.8%(+8.45)#1,086 |
| 30. | 61615 | 15.2% | 6.4%(+8.76)#30 | 6.8%(+8.43)#1,091 |
| 31. | 61801 | 14.7% | 6.4%(+8.28)#31 | 6.8%(+7.96)#1,170 |
| 32. | 60605 | 14.7% | 6.4%(+8.23)#32 | 6.8%(+7.90)#1,184 |
| 33. | 61517 | 14.5% | 6.4%(+8.11)#33 | 6.8%(+7.78)#1,212 |
| 34. | 61704 | 14.4% | 6.4%(+7.97)#34 | 6.8%(+7.64)#1,242 |
| 35. | 60549 | 14.4% | 6.4%(+7.93)#35 | 6.8%(+7.60)#1,252 |
| 36. | 61349 | 14.3% | 6.4%(+7.85)#36 | 6.8%(+7.52)#1,263 |
| 37. | 62256 | 14.3% | 6.4%(+7.85)#37 | 6.8%(+7.52)#1,273 |
| 38. | 60490 | 14.1% | 6.4%(+7.66)#38 | 6.8%(+7.33)#1,311 |
| 39. | 62074 | 14.0% | 6.4%(+7.57)#39 | 6.8%(+7.24)#1,333 |
| 40. | 60061 | 14.0% | 6.4%(+7.52)#40 | 6.8%(+7.19)#1,350 |
| 41. | 62975 | 14.0% | 6.4%(+7.52)#41 | 6.8%(+7.19)#1,352 |
| 42. | 60606 | 13.5% | 6.4%(+7.06)#42 | 6.8%(+6.73)#1,479 |
| 43. | 62998 | 13.5% | 6.4%(+7.03)#43 | 6.8%(+6.70)#1,489 |
| 44. | 60503 | 13.5% | 6.4%(+7.02)#44 | 6.8%(+6.69)#1,490 |
| 45. | 60021 | 13.4% | 6.4%(+7.01)#45 | 6.8%(+6.68)#1,494 |
| 46. | 60642 | 13.3% | 6.4%(+6.91)#46 | 6.8%(+6.58)#1,518 |
| 47. | 61526 | 13.3% | 6.4%(+6.85)#47 | 6.8%(+6.52)#1,542 |
| 48. | 61333 | 13.2% | 6.4%(+6.75)#48 | 6.8%(+6.42)#1,574 |
| 49. | 62248 | 13.0% | 6.4%(+6.58)#49 | 6.8%(+6.25)#1,645 |
| 50. | 60611 | 12.8% | 6.4%(+6.34)#50 | 6.8%(+6.02)#1,720 |
| 51. | 61535 | 12.8% | 6.4%(+6.34)#51 | 6.8%(+6.01)#1,722 |
| 52. | 60602 | 12.8% | 6.4%(+6.33)#52 | 6.8%(+6.00)#1,724 |
| 53. | 60610 | 12.7% | 6.4%(+6.29)#53 | 6.8%(+5.96)#1,738 |
| 54. | 61874 | 12.4% | 6.4%(+5.96)#54 | 6.8%(+5.63)#1,862 |
| 55. | 60657 | 12.3% | 6.4%(+5.91)#55 | 6.8%(+5.58)#1,879 |
| 56. | 60504 | 12.3% | 6.4%(+5.88)#56 | 6.8%(+5.55)#1,893 |
| 57. | 60607 | 12.3% | 6.4%(+5.85)#57 | 6.8%(+5.52)#1,904 |
| 58. | 62477 | 12.2% | 6.4%(+5.78)#58 | 6.8%(+5.45)#1,938 |
| 59. | 60048 | 12.2% | 6.4%(+5.78)#59 | 6.8%(+5.45)#1,939 |
| 60. | 60616 | 12.2% | 6.4%(+5.77)#60 | 6.8%(+5.45)#1,944 |
| 61. | 60613 | 12.2% | 6.4%(+5.76)#61 | 6.8%(+5.43)#1,949 |
| 62. | 62281 | 12.1% | 6.4%(+5.67)#62 | 6.8%(+5.34)#1,989 |
| 63. | 60047 | 12.1% | 6.4%(+5.64)#63 | 6.8%(+5.32)#2,001 |
| 64. | 60201 | 12.1% | 6.4%(+5.62)#64 | 6.8%(+5.29)#2,013 |
| 65. | 62245 | 11.9% | 6.4%(+5.49)#65 | 6.8%(+5.16)#2,066 |
| 66. | 60565 | 11.9% | 6.4%(+5.42)#66 | 6.8%(+5.09)#2,106 |
| 67. | 61705 | 11.8% | 6.4%(+5.40)#67 | 6.8%(+5.07)#2,117 |
| 68. | 60044 | 11.8% | 6.4%(+5.37)#68 | 6.8%(+5.04)#2,132 |
| 69. | 60302 | 11.7% | 6.4%(+5.26)#69 | 6.8%(+4.93)#2,179 |
| 70. | 62269 | 11.7% | 6.4%(+5.23)#70 | 6.8%(+4.90)#2,203 |
| 71. | 60202 | 11.6% | 6.4%(+5.21)#71 | 6.8%(+4.88)#2,213 |
| 72. | 62294 | 11.5% | 6.4%(+5.11)#72 | 6.8%(+4.78)#2,273 |
| 73. | 61451 | 11.5% | 6.4%(+5.10)#73 | 6.8%(+4.77)#2,278 |
| 74. | 60062 | 11.5% | 6.4%(+5.06)#74 | 6.8%(+4.74)#2,298 |
| 75. | 61548 | 11.5% | 6.4%(+5.03)#75 | 6.8%(+4.70)#2,318 |
| 76. | 61820 | 11.4% | 6.4%(+4.93)#76 | 6.8%(+4.61)#2,366 |
| 77. | 60654 | 11.4% | 6.4%(+4.93)#77 | 6.8%(+4.61)#2,367 |
| 78. | 60143 | 11.3% | 6.4%(+4.91)#78 | 6.8%(+4.58)#2,378 |
| 79. | 60512 | 11.3% | 6.4%(+4.89)#79 | 6.8%(+4.56)#2,392 |
| 80. | 60304 | 11.3% | 6.4%(+4.85)#80 | 6.8%(+4.52)#2,420 |
| 81. | 60514 | 11.2% | 6.4%(+4.79)#81 | 6.8%(+4.46)#2,447 |
| 82. | 61822 | 11.1% | 6.4%(+4.63)#82 | 6.8%(+4.30)#2,532 |
| 83. | 60615 | 11.0% | 6.4%(+4.56)#83 | 6.8%(+4.23)#2,569 |
| 84. | 60540 | 11.0% | 6.4%(+4.52)#84 | 6.8%(+4.19)#2,600 |
| 85. | 60004 | 10.9% | 6.4%(+4.51)#85 | 6.8%(+4.18)#2,606 |
| 86. | 60614 | 10.9% | 6.4%(+4.50)#86 | 6.8%(+4.17)#2,612 |
| 87. | 60005 | 10.8% | 6.4%(+4.39)#87 | 6.8%(+4.06)#2,664 |
| 88. | 61330 | 10.8% | 6.4%(+4.39)#88 | 6.8%(+4.06)#2,666 |
| 89. | 60031 | 10.8% | 6.4%(+4.37)#89 | 6.8%(+4.04)#2,677 |
| 90. | 60559 | 10.7% | 6.4%(+4.27)#90 | 6.8%(+3.94)#2,723 |
| 91. | 60640 | 10.7% | 6.4%(+4.27)#91 | 6.8%(+3.94)#2,726 |
| 92. | 60136 | 10.6% | 6.4%(+4.21)#92 | 6.8%(+3.88)#2,765 |
| 93. | 60622 | 10.5% | 6.4%(+4.03)#93 | 6.8%(+3.70)#2,891 |
| 94. | 60040 | 10.5% | 6.4%(+4.03)#94 | 6.8%(+3.70)#2,893 |
| 95. | 60193 | 10.5% | 6.4%(+4.02)#95 | 6.8%(+3.69)#2,896 |
| 96. | 60067 | 10.4% | 6.4%(+4.01)#96 | 6.8%(+3.68)#2,906 |
| 97. | 60026 | 10.4% | 6.4%(+3.99)#97 | 6.8%(+3.66)#2,912 |
| 98. | 61530 | 10.3% | 6.4%(+3.89)#98 | 6.8%(+3.56)#2,977 |
| 99. | 61523 | 10.3% | 6.4%(+3.87)#99 | 6.8%(+3.54)#2,993 |
| 100. | 60647 | 10.2% | 6.4%(+3.79)#100 | 6.8%(+3.46)#3,049 |
Common Questions
What are the Top 10 Zip Codes with the Highest Percentage of Population Employed in Computer, Engineering & Science in Illinois?
Top 10 Zip Codes with the Highest Percentage of Population Employed in Computer, Engineering & Science in Illinois are:
What zip code has the Highest Percentage of Population Employed in Computer, Engineering & Science in Illinois?
61552 has the Highest Percentage of Population Employed in Computer, Engineering & Science in Illinois with 63.3%.
What is the Percentage of Population Employed in Computer, Engineering & Science in the State of Illinois?
Percentage of Population Employed in Computer, Engineering & Science in Illinois is 6.4%.
What is the Percentage of Population Employed in Computer, Engineering & Science in the United States?
Percentage of Population Employed in Computer, Engineering & Science in the United States is 6.8%.