Rome, IL Map & Demographics
Rome Map
Rome Overview
$36,476
PER CAPITA INCOME
$104,044
AVG FAMILY INCOME
$83,533
AVG HOUSEHOLD INCOME
32.2%
WAGE / INCOME GAP [ % ]
67.8¢/ $1
WAGE / INCOME GAP [ $ ]
0.32
INEQUALITY / GINI INDEX
1,605
TOTAL POPULATION
867
MALE POPULATION
738
FEMALE POPULATION
117.48
MALES / 100 FEMALES
85.12
FEMALES / 100 MALES
41.1
MEDIAN AGE
3.2
AVG FAMILY SIZE
2.4
AVG HOUSEHOLD SIZE
884
LABOR FORCE [ PEOPLE ]
71.9%
PERCENT IN LABOR FORCE
Rome Zip Codes
Rome Area Codes
Income in Rome
Income Overview in Rome
Per Capita Income in Rome is $36,476, while median incomes of families and households are $104,044 and $83,533 respectively.
| Characteristic | Number | Measure |
| Per Capita Income | 1,605 | $36,476 |
| Median Family Income | 407 | $104,044 |
| Mean Family Income | 407 | $112,296 |
| Median Household Income | 659 | $83,533 |
| Mean Household Income | 659 | $88,892 |
| Income Deficit | 407 | $0 |
| Wage / Income Gap (%) | 1,605 | 32.16% |
| Wage / Income Gap ($) | 1,605 | 67.84¢ per $1 |
| Gini / Inequality Index | 1,605 | 0.32 |
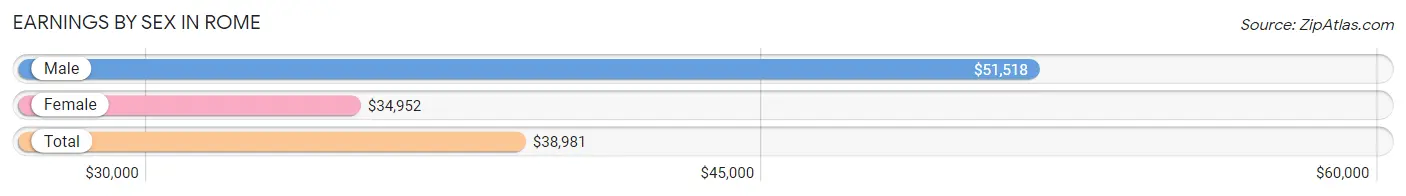
Earnings by Sex in Rome
Average Earnings in Rome are $38,981, $51,518 for men and $34,952 for women, a difference of 32.2%.
| Sex | Number | Average Earnings |
| Male | 513 (55.9%) | $51,518 |
| Female | 404 (44.1%) | $34,952 |
| Total | 917 (100.0%) | $38,981 |
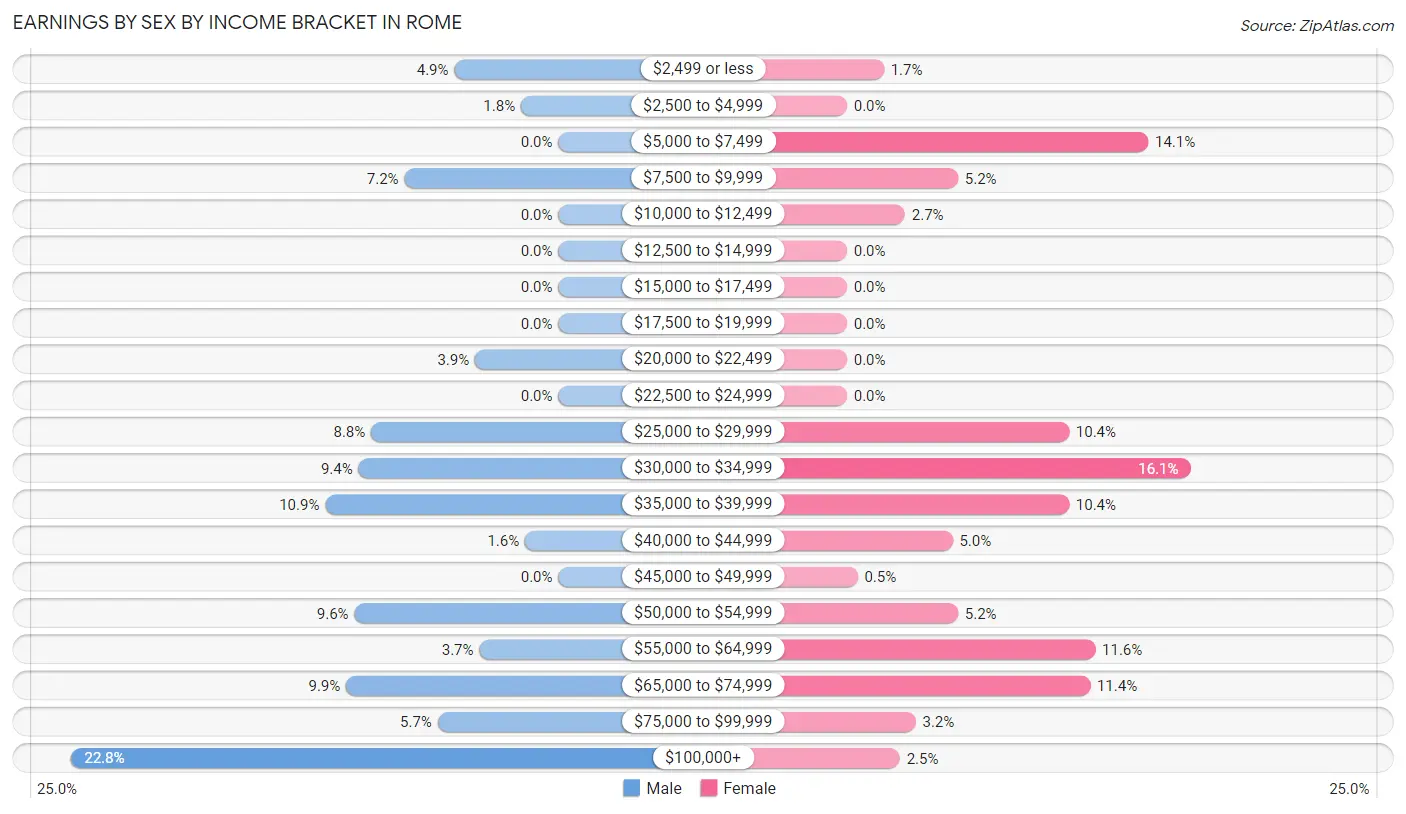
Earnings by Sex by Income Bracket in Rome
The most common earnings brackets in Rome are $100,000+ for men (117 | 22.8%) and $30,000 to $34,999 for women (65 | 16.1%).
| Income | Male | Female |
| $2,499 or less | 25 (4.9%) | 7 (1.7%) |
| $2,500 to $4,999 | 9 (1.8%) | 0 (0.0%) |
| $5,000 to $7,499 | 0 (0.0%) | 57 (14.1%) |
| $7,500 to $9,999 | 37 (7.2%) | 21 (5.2%) |
| $10,000 to $12,499 | 0 (0.0%) | 11 (2.7%) |
| $12,500 to $14,999 | 0 (0.0%) | 0 (0.0%) |
| $15,000 to $17,499 | 0 (0.0%) | 0 (0.0%) |
| $17,500 to $19,999 | 0 (0.0%) | 0 (0.0%) |
| $20,000 to $22,499 | 20 (3.9%) | 0 (0.0%) |
| $22,500 to $24,999 | 0 (0.0%) | 0 (0.0%) |
| $25,000 to $29,999 | 45 (8.8%) | 42 (10.4%) |
| $30,000 to $34,999 | 48 (9.4%) | 65 (16.1%) |
| $35,000 to $39,999 | 56 (10.9%) | 42 (10.4%) |
| $40,000 to $44,999 | 8 (1.6%) | 20 (5.0%) |
| $45,000 to $49,999 | 0 (0.0%) | 2 (0.5%) |
| $50,000 to $54,999 | 49 (9.6%) | 21 (5.2%) |
| $55,000 to $64,999 | 19 (3.7%) | 47 (11.6%) |
| $65,000 to $74,999 | 51 (9.9%) | 46 (11.4%) |
| $75,000 to $99,999 | 29 (5.7%) | 13 (3.2%) |
| $100,000+ | 117 (22.8%) | 10 (2.5%) |
| Total | 513 (100.0%) | 404 (100.0%) |
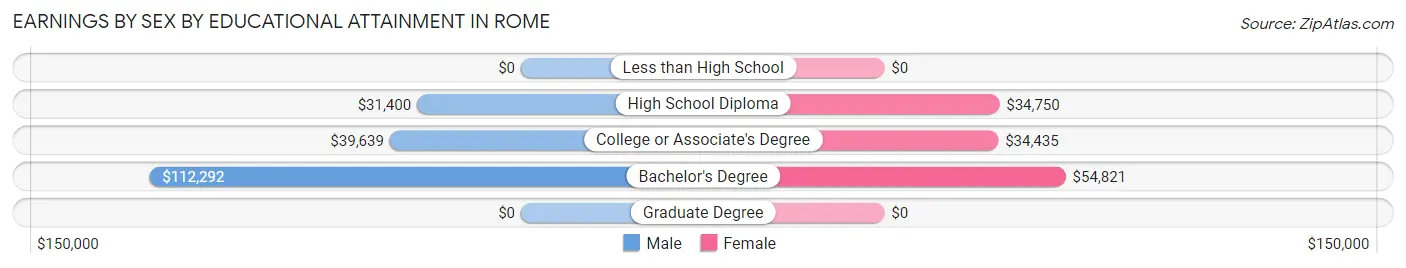
Earnings by Sex by Educational Attainment in Rome
Average earnings in Rome are $52,500 for men and $36,964 for women, a difference of 29.6%. Men with an educational attainment of bachelor's degree enjoy the highest average annual earnings of $112,292, while those with high school diploma education earn the least with $31,400. Women with an educational attainment of bachelor's degree earn the most with the average annual earnings of $54,821, while those with college or associate's degree education have the smallest earnings of $34,435.
| Educational Attainment | Male Income | Female Income |
| Less than High School | - | - |
| High School Diploma | $31,400 | $34,750 |
| College or Associate's Degree | $39,639 | $34,435 |
| Bachelor's Degree | $112,292 | $54,821 |
| Graduate Degree | - | - |
| Total | $52,500 | $36,964 |
Family Income in Rome
Family Income Brackets in Rome
According to the Rome family income data, there are 142 families falling into the $100,000 to $149,999 income range, which is the most common income bracket and makes up 34.9% of all families.
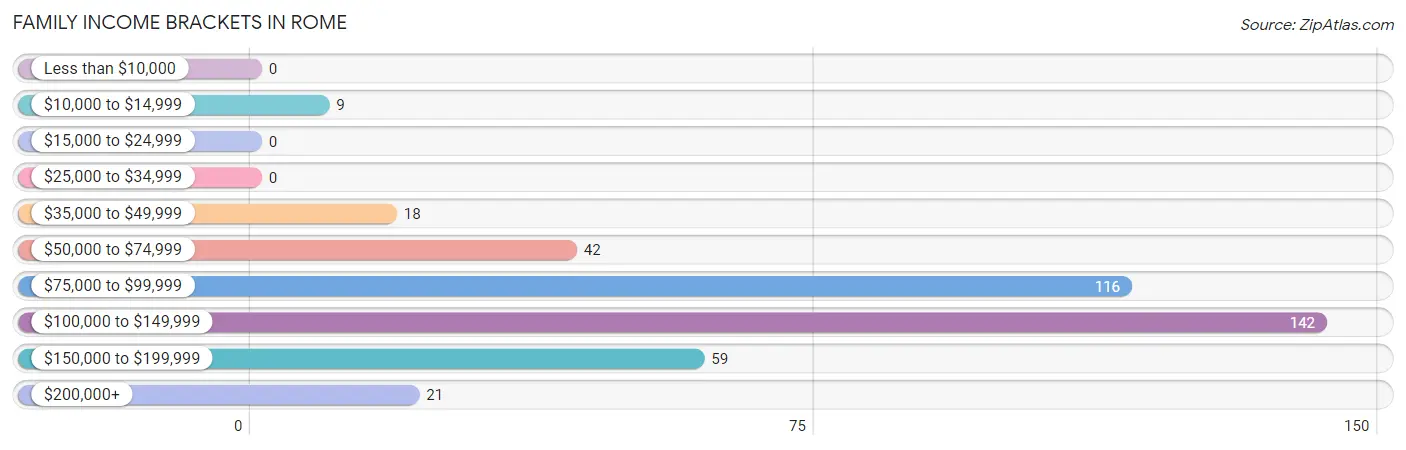
| Income Bracket | # Families | % Families |
| Less than $10,000 | 0 | 0.0% |
| $10,000 to $14,999 | 9 | 2.2% |
| $15,000 to $24,999 | 0 | 0.0% |
| $25,000 to $34,999 | 0 | 0.0% |
| $35,000 to $49,999 | 18 | 4.4% |
| $50,000 to $74,999 | 42 | 10.3% |
| $75,000 to $99,999 | 116 | 28.5% |
| $100,000 to $149,999 | 142 | 34.9% |
| $150,000 to $199,999 | 59 | 14.5% |
| $200,000+ | 21 | 5.2% |
Family Income by Famaliy Size in Rome
3-person families (86 | 21.1%) account for the highest median family income in Rome with $149,516 per family, while 2-person families (152 | 37.3%) have the highest median income of $51,397 per family member.
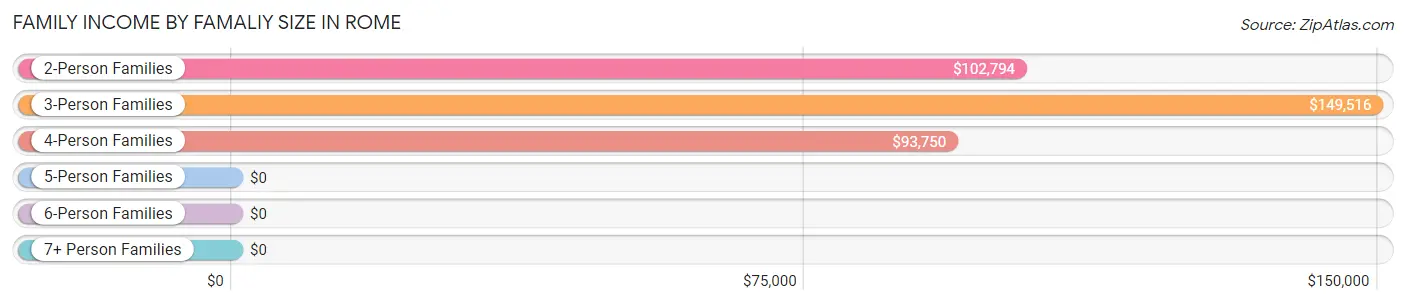
| Income Bracket | # Families | Median Income |
| 2-Person Families | 152 (37.3%) | $102,794 |
| 3-Person Families | 86 (21.1%) | $149,516 |
| 4-Person Families | 90 (22.1%) | $93,750 |
| 5-Person Families | 79 (19.4%) | $0 |
| 6-Person Families | 0 (0.0%) | $0 |
| 7+ Person Families | 0 (0.0%) | $0 |
| Total | 407 (100.0%) | $104,044 |
Family Income by Number of Earners in Rome
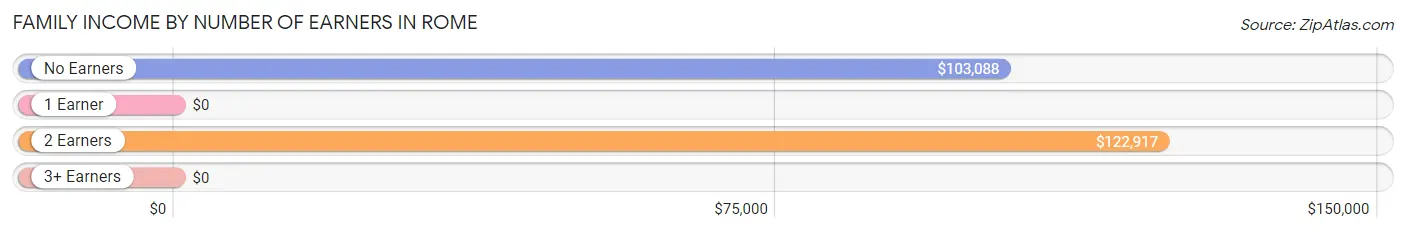
| Number of Earners | # Families | Median Income |
| No Earners | 26 (6.4%) | $103,088 |
| 1 Earner | 65 (16.0%) | $0 |
| 2 Earners | 298 (73.2%) | $122,917 |
| 3+ Earners | 18 (4.4%) | $0 |
| Total | 407 (100.0%) | $104,044 |
Household Income in Rome
Household Income Brackets in Rome
With 177 households falling in the category, the $100,000 to $149,999 income range is the most frequent in Rome, accounting for 26.9% of all households. In contrast, only 8 households (1.2%) fall into the $25,000 to $34,999 income bracket, making it the least populous group.
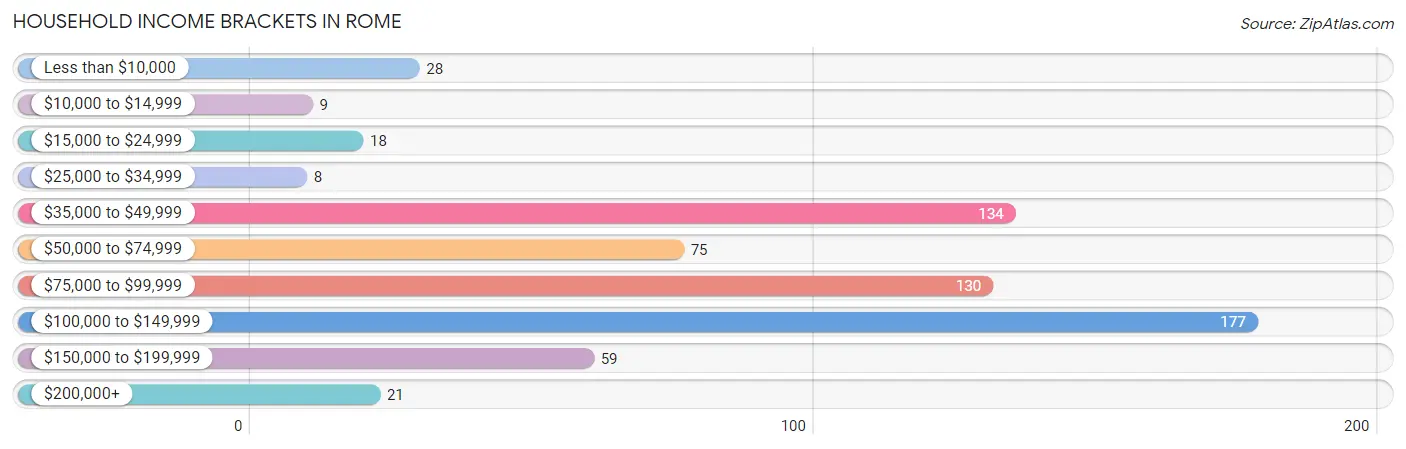
| Income Bracket | # Households | % Households |
| Less than $10,000 | 28 | 4.2% |
| $10,000 to $14,999 | 9 | 1.4% |
| $15,000 to $24,999 | 18 | 2.7% |
| $25,000 to $34,999 | 8 | 1.2% |
| $35,000 to $49,999 | 134 | 20.3% |
| $50,000 to $74,999 | 75 | 11.4% |
| $75,000 to $99,999 | 130 | 19.7% |
| $100,000 to $149,999 | 177 | 26.9% |
| $150,000 to $199,999 | 59 | 9.0% |
| $200,000+ | 21 | 3.2% |
Household Income by Householder Age in Rome
The median household income in Rome is $83,533, with the highest median household income of $116,307 found in the 45 to 64 years age bracket for the primary householder. A total of 275 households (41.7%) fall into this category. Meanwhile, the 15 to 24 years age bracket for the primary householder has the lowest median household income of $0, with 12 households (1.8%) in this group.
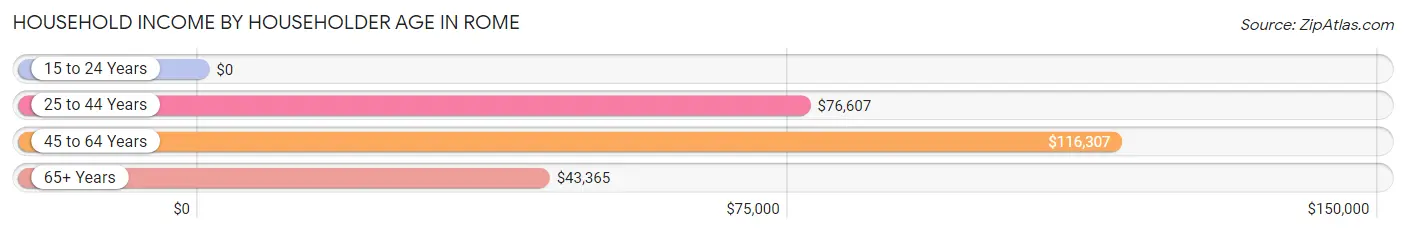
| Income Bracket | # Households | Median Income |
| 15 to 24 Years | 12 (1.8%) | $0 |
| 25 to 44 Years | 195 (29.6%) | $76,607 |
| 45 to 64 Years | 275 (41.7%) | $116,307 |
| 65+ Years | 177 (26.9%) | $43,365 |
| Total | 659 (100.0%) | $83,533 |
Poverty in Rome
Income Below Poverty by Sex and Age in Rome
With 4.6% poverty level for males and 5.4% for females among the residents of Rome, 65 to 74 year old males and 12 to 14 year old females are the most vulnerable to poverty, with 28 males (30.1%) and 10 females (90.9%) in their respective age groups living below the poverty level.
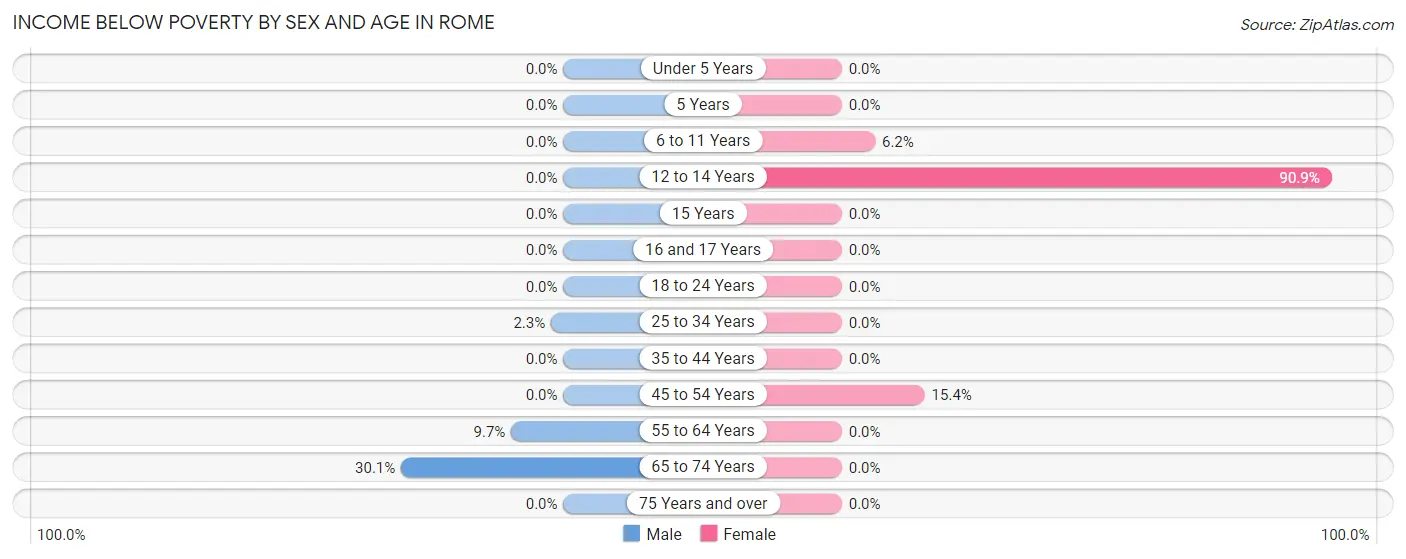
| Age Bracket | Male | Female |
| Under 5 Years | 0 (0.0%) | 0 (0.0%) |
| 5 Years | 0 (0.0%) | 0 (0.0%) |
| 6 to 11 Years | 0 (0.0%) | 10 (6.2%) |
| 12 to 14 Years | 0 (0.0%) | 10 (90.9%) |
| 15 Years | 0 (0.0%) | 0 (0.0%) |
| 16 and 17 Years | 0 (0.0%) | 0 (0.0%) |
| 18 to 24 Years | 0 (0.0%) | 0 (0.0%) |
| 25 to 34 Years | 3 (2.3%) | 0 (0.0%) |
| 35 to 44 Years | 0 (0.0%) | 0 (0.0%) |
| 45 to 54 Years | 0 (0.0%) | 20 (15.4%) |
| 55 to 64 Years | 9 (9.7%) | 0 (0.0%) |
| 65 to 74 Years | 28 (30.1%) | 0 (0.0%) |
| 75 Years and over | 0 (0.0%) | 0 (0.0%) |
| Total | 40 (4.6%) | 40 (5.4%) |
Income Above Poverty by Sex and Age in Rome
According to the poverty statistics in Rome, males aged under 5 years and females aged under 5 years are the age groups that are most secure financially, with 100.0% of males and 100.0% of females in these age groups living above the poverty line.
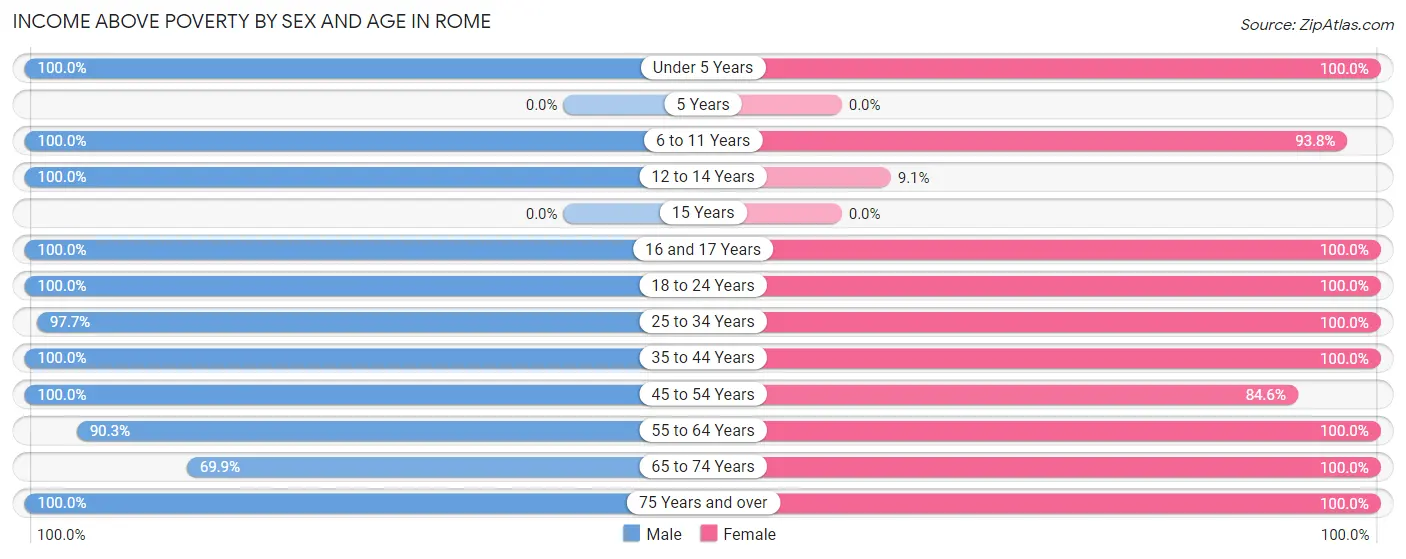
| Age Bracket | Male | Female |
| Under 5 Years | 33 (100.0%) | 27 (100.0%) |
| 5 Years | 0 (0.0%) | 0 (0.0%) |
| 6 to 11 Years | 51 (100.0%) | 152 (93.8%) |
| 12 to 14 Years | 92 (100.0%) | 1 (9.1%) |
| 15 Years | 0 (0.0%) | 0 (0.0%) |
| 16 and 17 Years | 43 (100.0%) | 7 (100.0%) |
| 18 to 24 Years | 41 (100.0%) | 33 (100.0%) |
| 25 to 34 Years | 128 (97.7%) | 91 (100.0%) |
| 35 to 44 Years | 93 (100.0%) | 134 (100.0%) |
| 45 to 54 Years | 142 (100.0%) | 110 (84.6%) |
| 55 to 64 Years | 84 (90.3%) | 59 (100.0%) |
| 65 to 74 Years | 65 (69.9%) | 64 (100.0%) |
| 75 Years and over | 55 (100.0%) | 20 (100.0%) |
| Total | 827 (95.4%) | 698 (94.6%) |
Income Below Poverty Among Married-Couple Families in Rome
The poverty statistics for married-couple families in Rome show that 2.4% or 9 of the total 370 families live below the poverty line. Families with 1 or 2 children have the highest poverty rate of 6.9%, comprising of 9 families. On the other hand, families with no children have the lowest poverty rate of 0.0%, which includes 0 families.
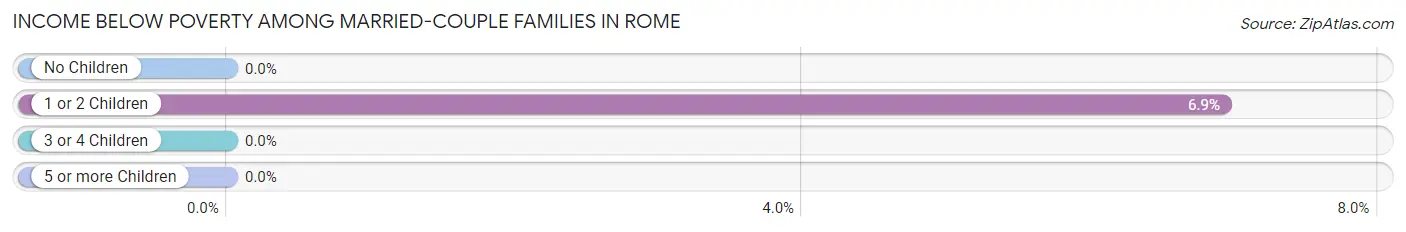
| Children | Above Poverty | Below Poverty |
| No Children | 161 (100.0%) | 0 (0.0%) |
| 1 or 2 Children | 121 (93.1%) | 9 (6.9%) |
| 3 or 4 Children | 79 (100.0%) | 0 (0.0%) |
| 5 or more Children | 0 (0.0%) | 0 (0.0%) |
| Total | 361 (97.6%) | 9 (2.4%) |
Income Below Poverty Among Single-Parent Households in Rome
| Children | Single Father | Single Mother |
| No Children | 0 (0.0%) | 0 (0.0%) |
| 1 or 2 Children | 0 (0.0%) | 0 (0.0%) |
| 3 or 4 Children | 0 (0.0%) | 0 (0.0%) |
| 5 or more Children | 0 (0.0%) | 0 (0.0%) |
| Total | 0 (0.0%) | 0 (0.0%) |
Income Below Poverty Among Married-Couple vs Single-Parent Households in Rome
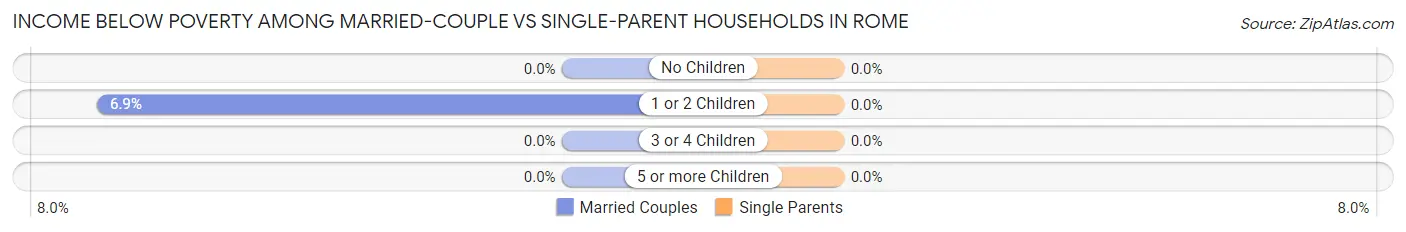
| Children | Married-Couple Families | Single-Parent Households |
| No Children | 0 (0.0%) | 0 (0.0%) |
| 1 or 2 Children | 9 (6.9%) | 0 (0.0%) |
| 3 or 4 Children | 0 (0.0%) | 0 (0.0%) |
| 5 or more Children | 0 (0.0%) | 0 (0.0%) |
| Total | 9 (2.4%) | 0 (0.0%) |
Race in Rome
The most populous races in Rome are White / Caucasian (1,572 | 97.9%), Hispanic or Latino (51 | 3.2%), and Some other Race (20 | 1.3%).
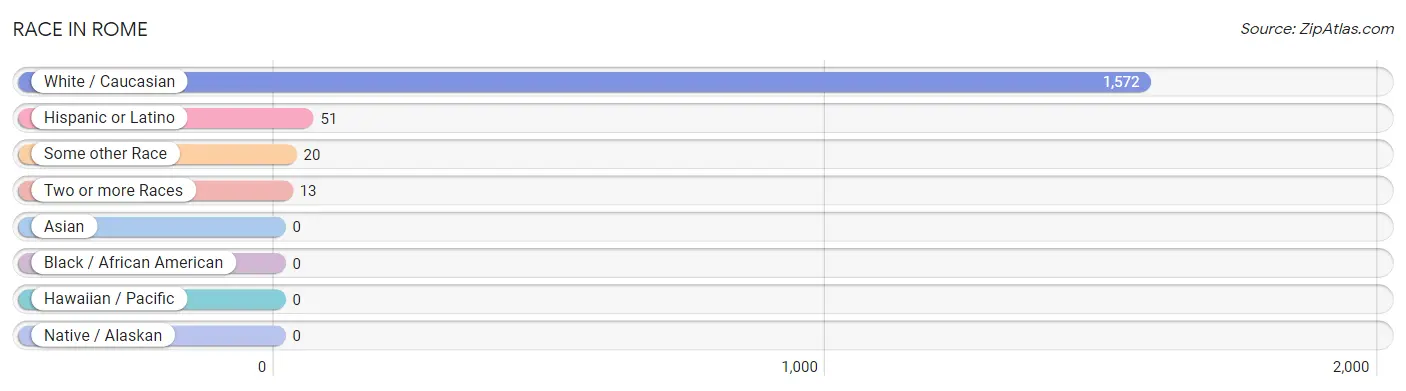
| Race | # Population | % Population |
| Asian | 0 | 0.0% |
| Black / African American | 0 | 0.0% |
| Hawaiian / Pacific | 0 | 0.0% |
| Hispanic or Latino | 51 | 3.2% |
| Native / Alaskan | 0 | 0.0% |
| White / Caucasian | 1,572 | 97.9% |
| Two or more Races | 13 | 0.8% |
| Some other Race | 20 | 1.3% |
| Total | 1,605 | 100.0% |
Ancestry in Rome
The most populous ancestries reported in Rome are German (432 | 26.9%), American (345 | 21.5%), Irish (175 | 10.9%), English (135 | 8.4%), and Polish (73 | 4.5%), together accounting for 72.3% of all Rome residents.
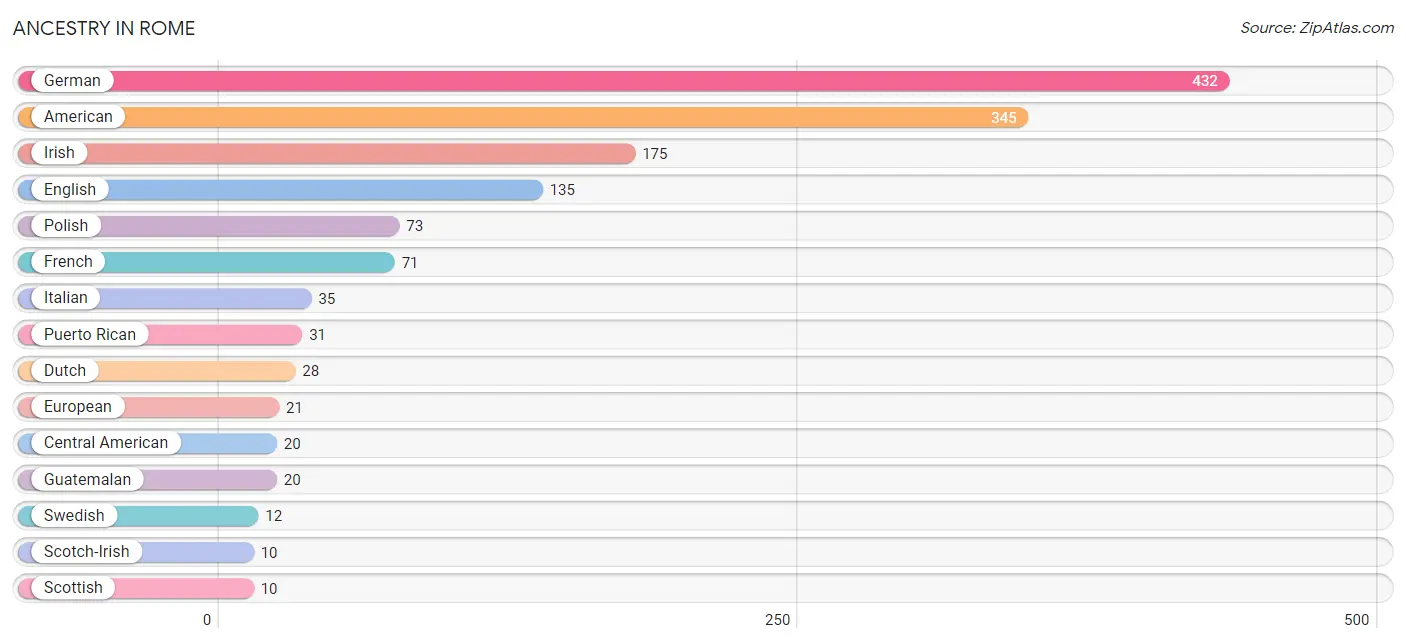
| Ancestry | # Population | % Population |
| American | 345 | 21.5% |
| Austrian | 9 | 0.6% |
| British | 8 | 0.5% |
| Central American | 20 | 1.3% |
| Dutch | 28 | 1.7% |
| English | 135 | 8.4% |
| European | 21 | 1.3% |
| French | 71 | 4.4% |
| German | 432 | 26.9% |
| Guatemalan | 20 | 1.3% |
| Irish | 175 | 10.9% |
| Italian | 35 | 2.2% |
| Norwegian | 2 | 0.1% |
| Polish | 73 | 4.5% |
| Portuguese | 2 | 0.1% |
| Puerto Rican | 31 | 1.9% |
| Scotch-Irish | 10 | 0.6% |
| Scottish | 10 | 0.6% |
| Swedish | 12 | 0.7% |
| Swiss | 8 | 0.5% | View All 20 Rows |
Immigrants in Rome
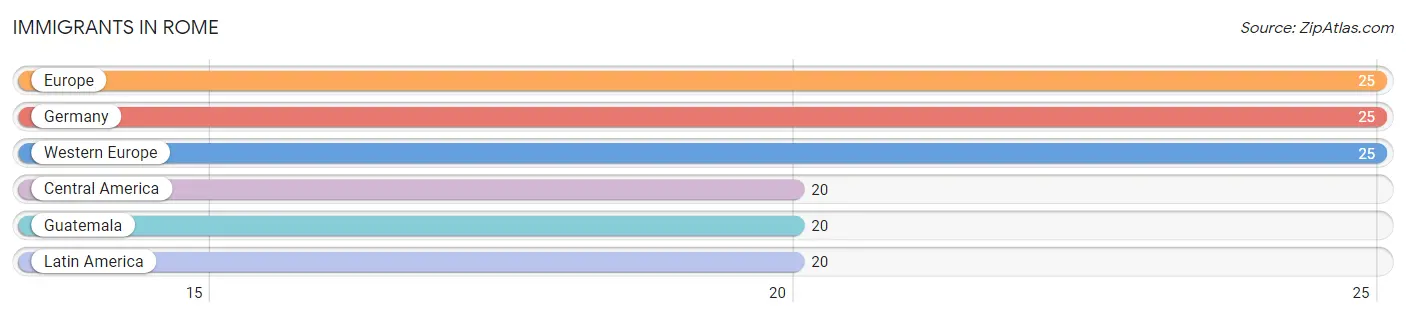
The most numerous immigrant groups reported in Rome came from Europe (25 | 1.6%), Germany (25 | 1.6%), Western Europe (25 | 1.6%), Central America (20 | 1.3%), and Guatemala (20 | 1.3%), together accounting for 7.2% of all Rome residents.
| Immigration Origin | # Population | % Population |
| Central America | 20 | 1.3% |
| Europe | 25 | 1.6% |
| Germany | 25 | 1.6% |
| Guatemala | 20 | 1.3% |
| Latin America | 20 | 1.3% |
| Western Europe | 25 | 1.6% | View All 6 Rows |
Sex and Age in Rome
Sex and Age in Rome
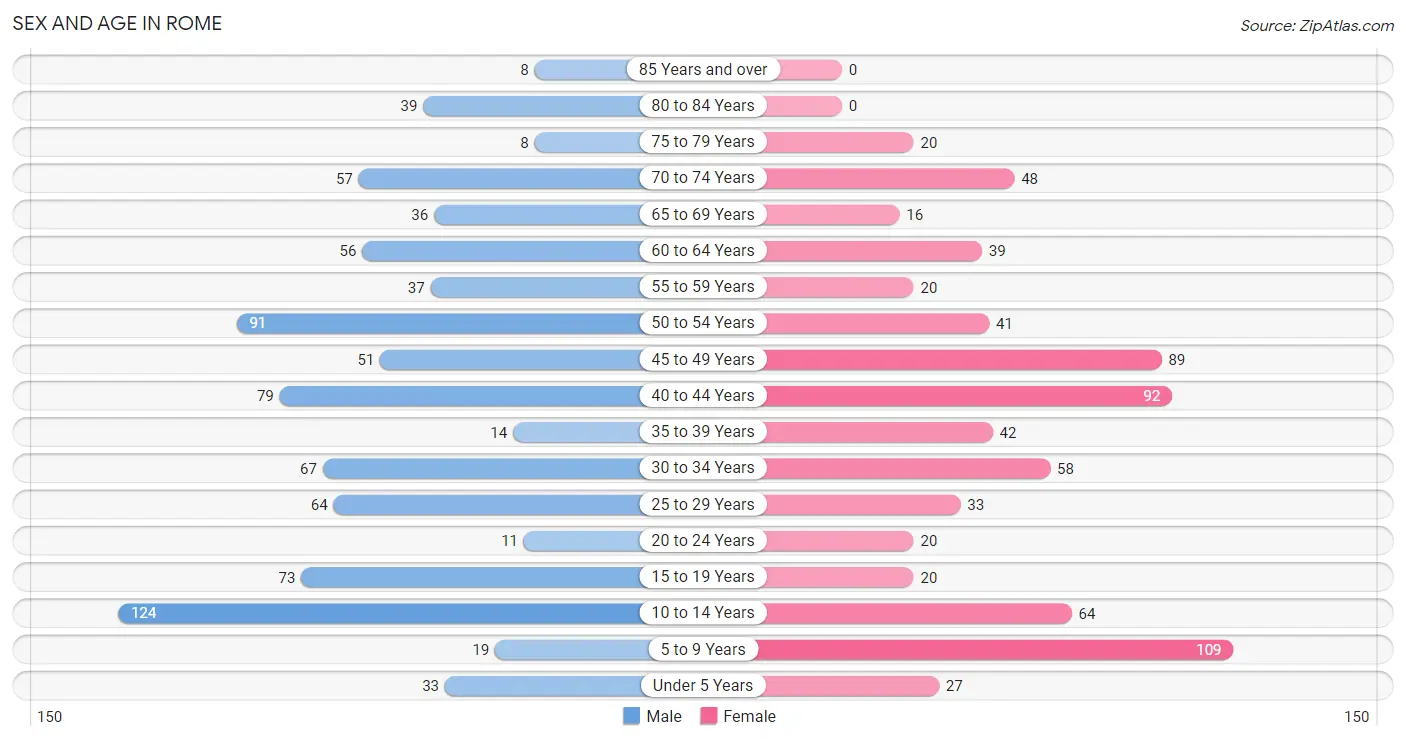
The most populous age groups in Rome are 10 to 14 Years (124 | 14.3%) for men and 5 to 9 Years (109 | 14.8%) for women.
| Age Bracket | Male | Female |
| Under 5 Years | 33 (3.8%) | 27 (3.7%) |
| 5 to 9 Years | 19 (2.2%) | 109 (14.8%) |
| 10 to 14 Years | 124 (14.3%) | 64 (8.7%) |
| 15 to 19 Years | 73 (8.4%) | 20 (2.7%) |
| 20 to 24 Years | 11 (1.3%) | 20 (2.7%) |
| 25 to 29 Years | 64 (7.4%) | 33 (4.5%) |
| 30 to 34 Years | 67 (7.7%) | 58 (7.9%) |
| 35 to 39 Years | 14 (1.6%) | 42 (5.7%) |
| 40 to 44 Years | 79 (9.1%) | 92 (12.5%) |
| 45 to 49 Years | 51 (5.9%) | 89 (12.1%) |
| 50 to 54 Years | 91 (10.5%) | 41 (5.6%) |
| 55 to 59 Years | 37 (4.3%) | 20 (2.7%) |
| 60 to 64 Years | 56 (6.5%) | 39 (5.3%) |
| 65 to 69 Years | 36 (4.2%) | 16 (2.2%) |
| 70 to 74 Years | 57 (6.6%) | 48 (6.5%) |
| 75 to 79 Years | 8 (0.9%) | 20 (2.7%) |
| 80 to 84 Years | 39 (4.5%) | 0 (0.0%) |
| 85 Years and over | 8 (0.9%) | 0 (0.0%) |
| Total | 867 (100.0%) | 738 (100.0%) |
Families and Households in Rome
Median Family Size in Rome
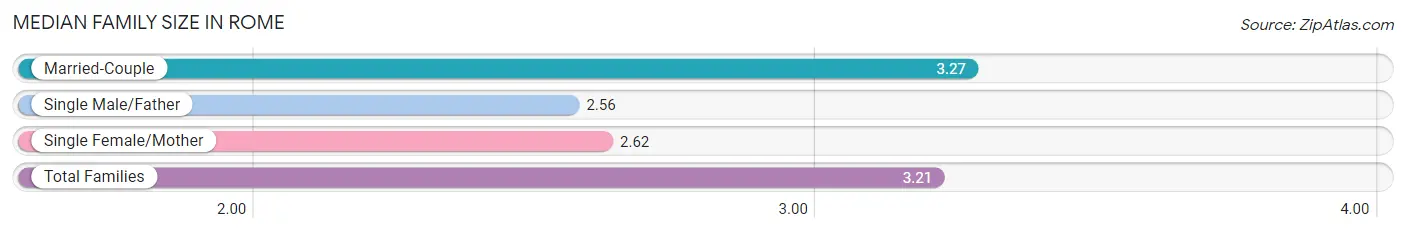
The median family size in Rome is 3.21 persons per family, with married-couple families (370 | 90.9%) accounting for the largest median family size of 3.27 persons per family. On the other hand, single male/father families (16 | 3.9%) represent the smallest median family size with 2.56 persons per family.
| Family Type | # Families | Family Size |
| Married-Couple | 370 (90.9%) | 3.27 |
| Single Male/Father | 16 (3.9%) | 2.56 |
| Single Female/Mother | 21 (5.2%) | 2.62 |
| Total Families | 407 (100.0%) | 3.21 |
Median Household Size in Rome
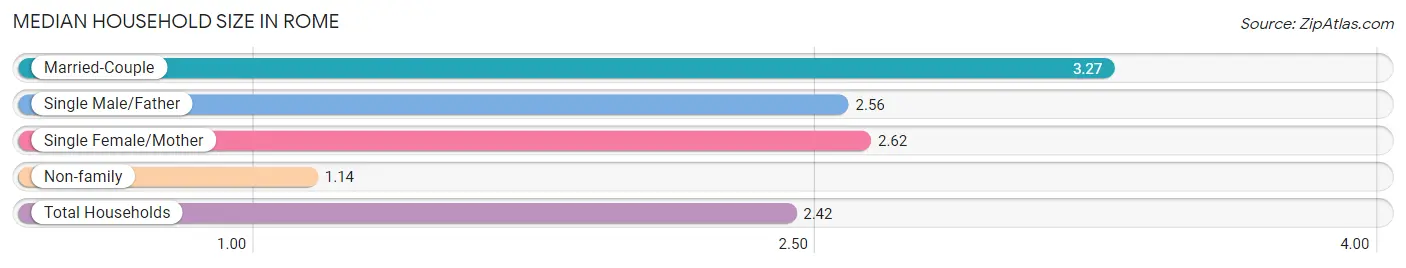
The median household size in Rome is 2.42 persons per household, with married-couple households (370 | 56.1%) accounting for the largest median household size of 3.27 persons per household. non-family households (252 | 38.2%) represent the smallest median household size with 1.14 persons per household.
| Household Type | # Households | Household Size |
| Married-Couple | 370 (56.1%) | 3.27 |
| Single Male/Father | 16 (2.4%) | 2.56 |
| Single Female/Mother | 21 (3.2%) | 2.62 |
| Non-family | 252 (38.2%) | 1.14 |
| Total Households | 659 (100.0%) | 2.42 |
Household Size by Marriage Status in Rome
Out of a total of 659 households in Rome, 407 (61.8%) are family households, while 252 (38.2%) are nonfamily households. The most numerous type of family households are 2-person households, comprising 152, and the most common type of nonfamily households are 1-person households, comprising 214.
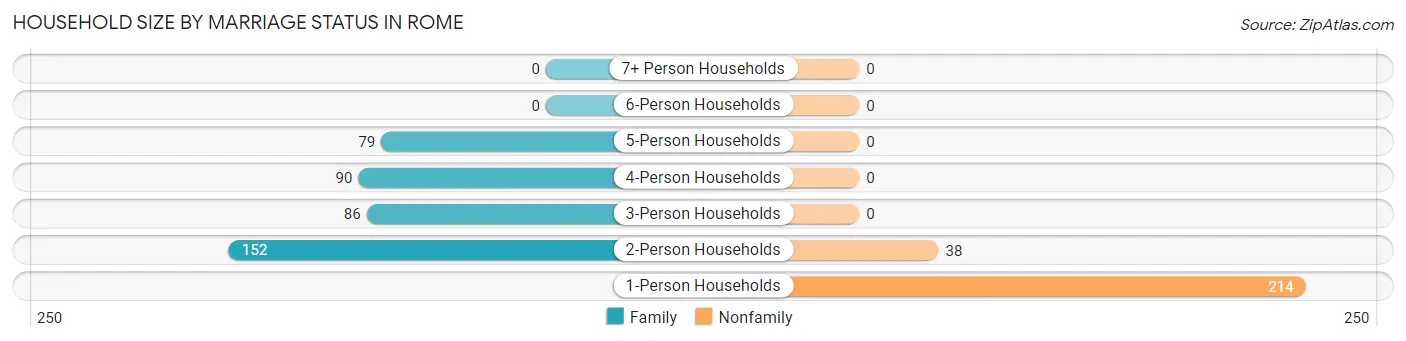
| Household Size | Family Households | Nonfamily Households |
| 1-Person Households | - | 214 (32.5%) |
| 2-Person Households | 152 (23.1%) | 38 (5.8%) |
| 3-Person Households | 86 (13.1%) | 0 (0.0%) |
| 4-Person Households | 90 (13.7%) | 0 (0.0%) |
| 5-Person Households | 79 (12.0%) | 0 (0.0%) |
| 6-Person Households | 0 (0.0%) | 0 (0.0%) |
| 7+ Person Households | 0 (0.0%) | 0 (0.0%) |
| Total | 407 (61.8%) | 252 (38.2%) |
Female Fertility in Rome
Fertility by Age in Rome
Average fertility rate in Rome is 82.0 births per 1,000 women. Women in the age bracket of 20 to 34 years have the highest fertility rate with 261.0 births per 1,000 women. Women in the age bracket of 20 to 34 years acount for 100.0% of all women with births.
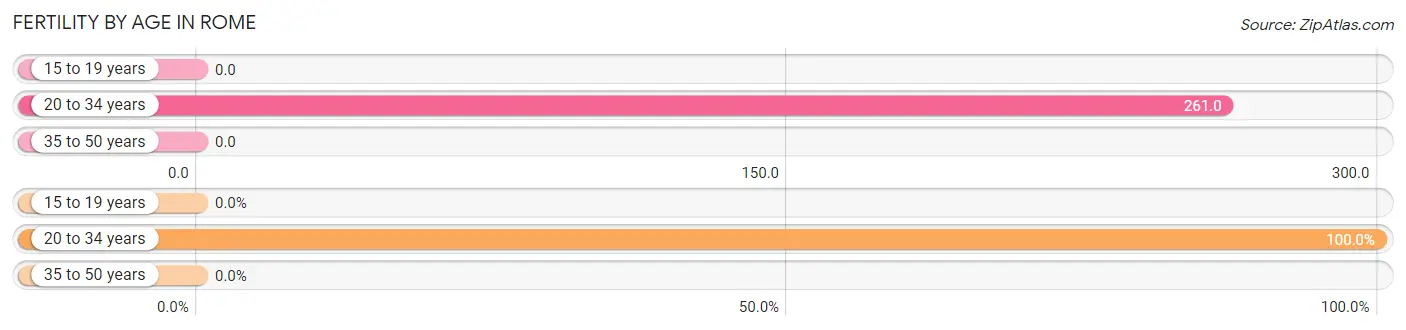
| Age Bracket | Women with Births | Births / 1,000 Women |
| 15 to 19 years | 0 (0.0%) | 0.0 |
| 20 to 34 years | 29 (100.0%) | 261.0 |
| 35 to 50 years | 0 (0.0%) | 0.0 |
| Total | 29 (100.0%) | 82.0 |
Fertility by Age by Marriage Status in Rome
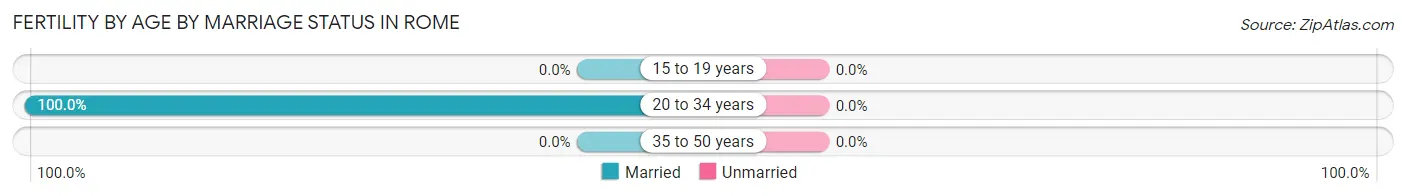
| Age Bracket | Married | Unmarried |
| 15 to 19 years | 0 (0.0%) | 0 (0.0%) |
| 20 to 34 years | 29 (100.0%) | 0 (0.0%) |
| 35 to 50 years | 0 (0.0%) | 0 (0.0%) |
| Total | 29 (100.0%) | 0 (0.0%) |
Fertility by Education in Rome
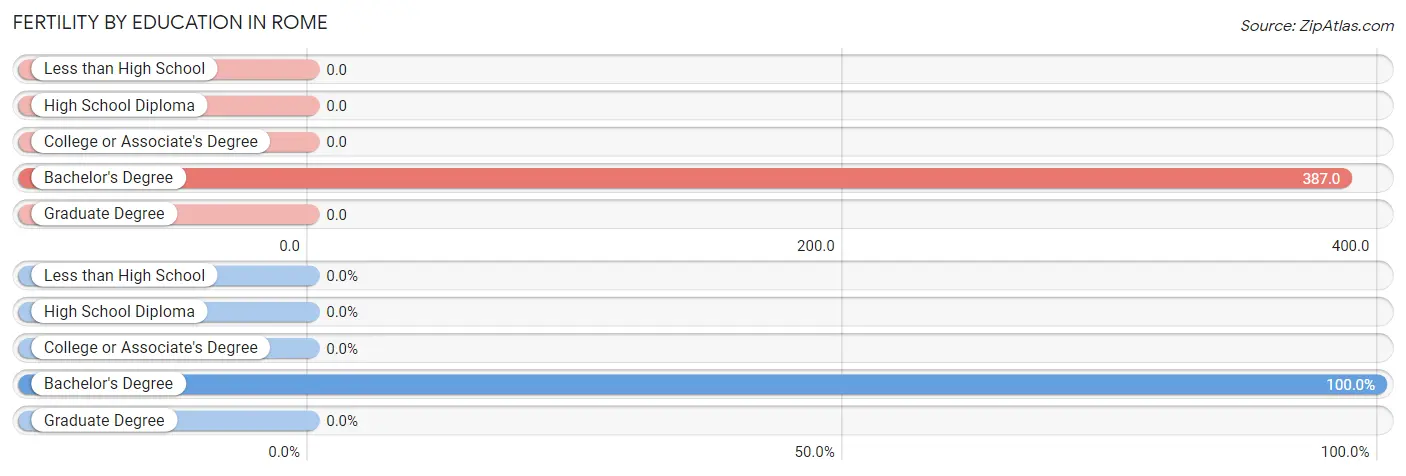
| Educational Attainment | Women with Births | Births / 1,000 Women |
| Less than High School | 0 (0.0%) | 0.0 |
| High School Diploma | 0 (0.0%) | 0.0 |
| College or Associate's Degree | 0 (0.0%) | 0.0 |
| Bachelor's Degree | 29 (100.0%) | 387.0 |
| Graduate Degree | 0 (0.0%) | 0.0 |
| Total | 29 (100.0%) | 82.0 |
Fertility by Education by Marriage Status in Rome
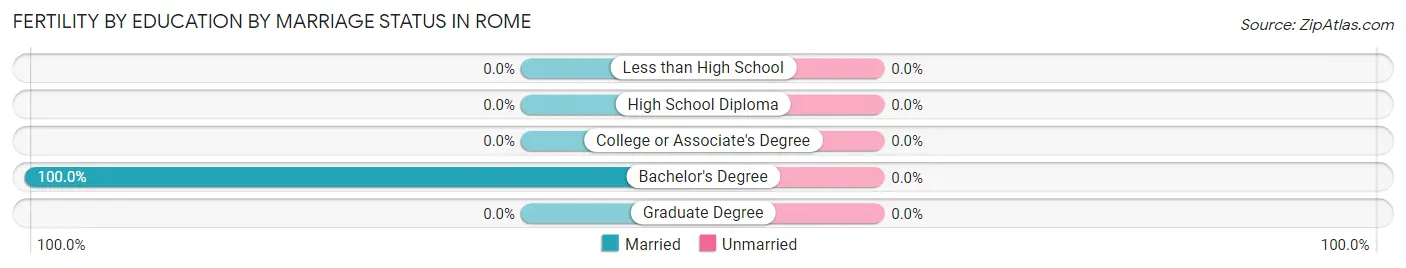
| Educational Attainment | Married | Unmarried |
| Less than High School | 0 (0.0%) | 0 (0.0%) |
| High School Diploma | 0 (0.0%) | 0 (0.0%) |
| College or Associate's Degree | 0 (0.0%) | 0 (0.0%) |
| Bachelor's Degree | 29 (100.0%) | 0 (0.0%) |
| Graduate Degree | 0 (0.0%) | 0 (0.0%) |
| Total | 29 (100.0%) | 0 (0.0%) |
Employment Characteristics in Rome
Employment by Class of Employer in Rome
Among the 876 employed individuals in Rome, private company employees (520 | 59.4%), local government employees (132 | 15.1%), and not-for-profit organizations (109 | 12.4%) make up the most common classes of employment.
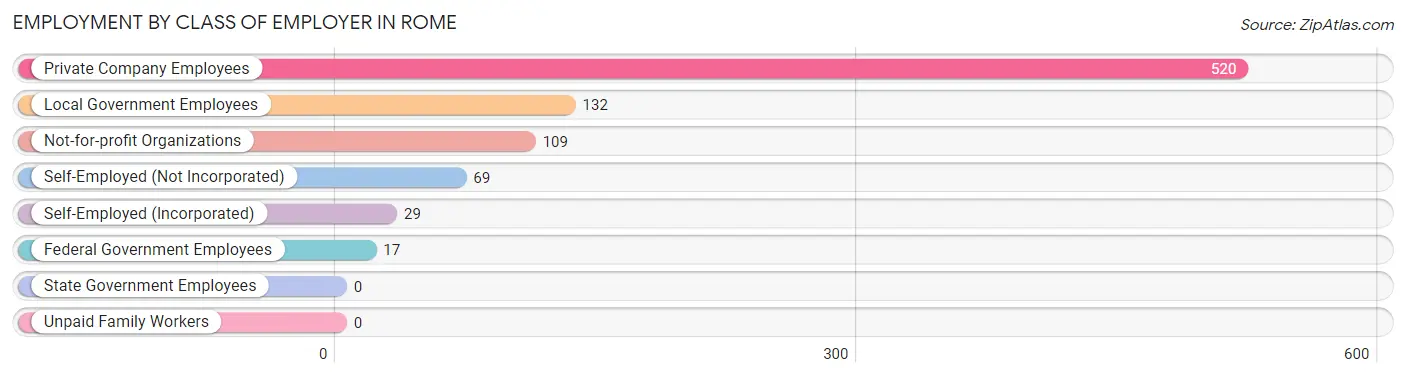
| Employer Class | # Employees | % Employees |
| Private Company Employees | 520 | 59.4% |
| Self-Employed (Incorporated) | 29 | 3.3% |
| Self-Employed (Not Incorporated) | 69 | 7.9% |
| Not-for-profit Organizations | 109 | 12.4% |
| Local Government Employees | 132 | 15.1% |
| State Government Employees | 0 | 0.0% |
| Federal Government Employees | 17 | 1.9% |
| Unpaid Family Workers | 0 | 0.0% |
| Total | 876 | 100.0% |
Employment Status by Age in Rome
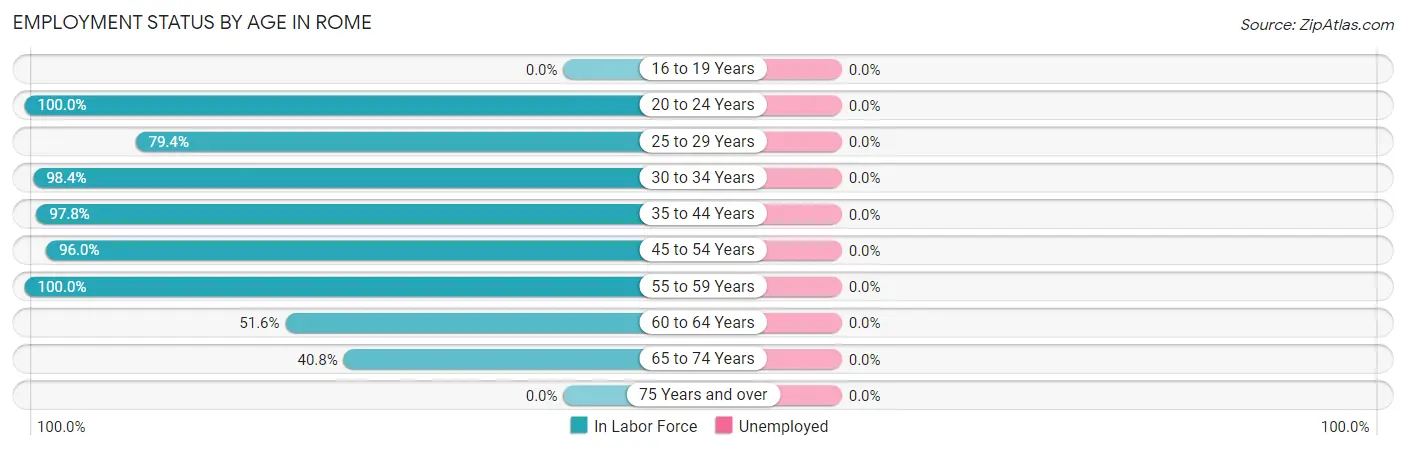
| Age Bracket | In Labor Force | Unemployed |
| 16 to 19 Years | 0 (0.0%) | 0 (0.0%) |
| 20 to 24 Years | 31 (100.0%) | 0 (0.0%) |
| 25 to 29 Years | 77 (79.4%) | 0 (0.0%) |
| 30 to 34 Years | 123 (98.4%) | 0 (0.0%) |
| 35 to 44 Years | 222 (97.8%) | 0 (0.0%) |
| 45 to 54 Years | 261 (96.0%) | 0 (0.0%) |
| 55 to 59 Years | 57 (100.0%) | 0 (0.0%) |
| 60 to 64 Years | 49 (51.6%) | 0 (0.0%) |
| 65 to 74 Years | 64 (40.8%) | 0 (0.0%) |
| 75 Years and over | 0 (0.0%) | 0 (0.0%) |
| Total | 884 (71.9%) | 0 (0.0%) |
Employment Status by Educational Attainment in Rome
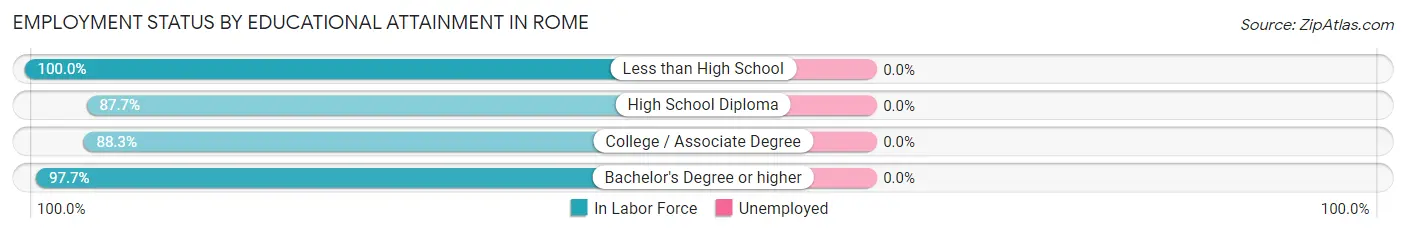
| Educational Attainment | In Labor Force | Unemployed |
| Less than High School | 29 (100.0%) | 0 (0.0%) |
| High School Diploma | 185 (87.7%) | 0 (0.0%) |
| College / Associate Degree | 406 (88.3%) | 0 (0.0%) |
| Bachelor's Degree or higher | 169 (97.7%) | 0 (0.0%) |
| Total | 789 (90.4%) | 0 (0.0%) |
Employment Occupations by Sex in Rome
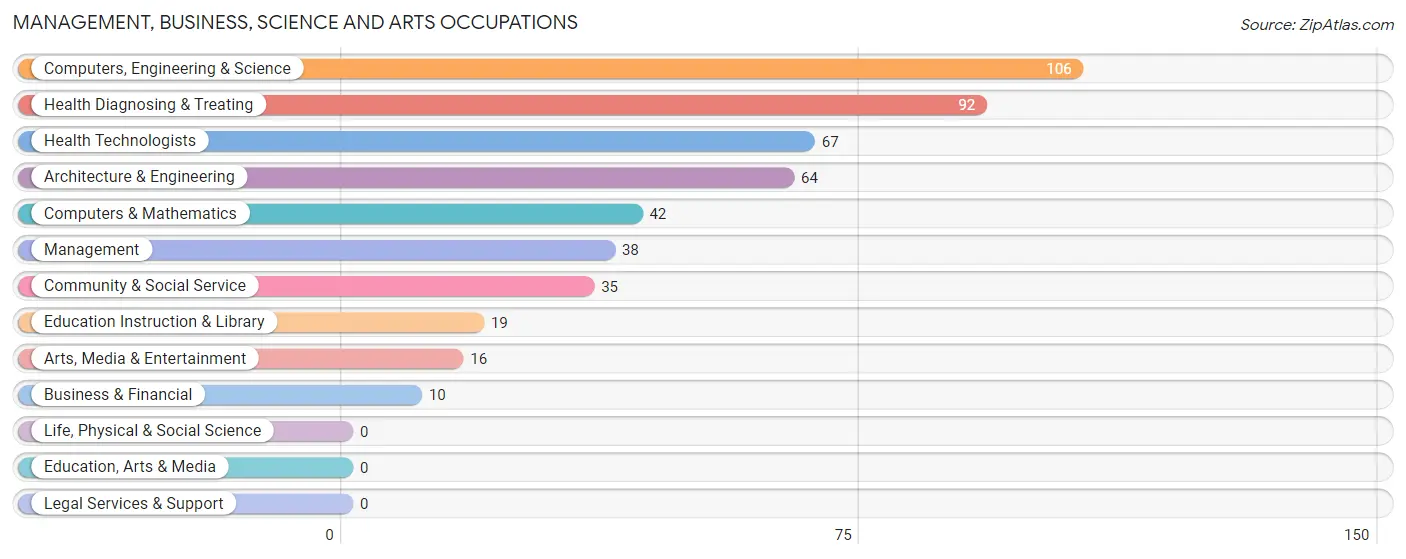
Management, Business, Science and Arts Occupations
The most common Management, Business, Science and Arts occupations in Rome are Computers, Engineering & Science (106 | 12.0%), Health Diagnosing & Treating (92 | 10.4%), Health Technologists (67 | 7.6%), Architecture & Engineering (64 | 7.2%), and Computers & Mathematics (42 | 4.8%).
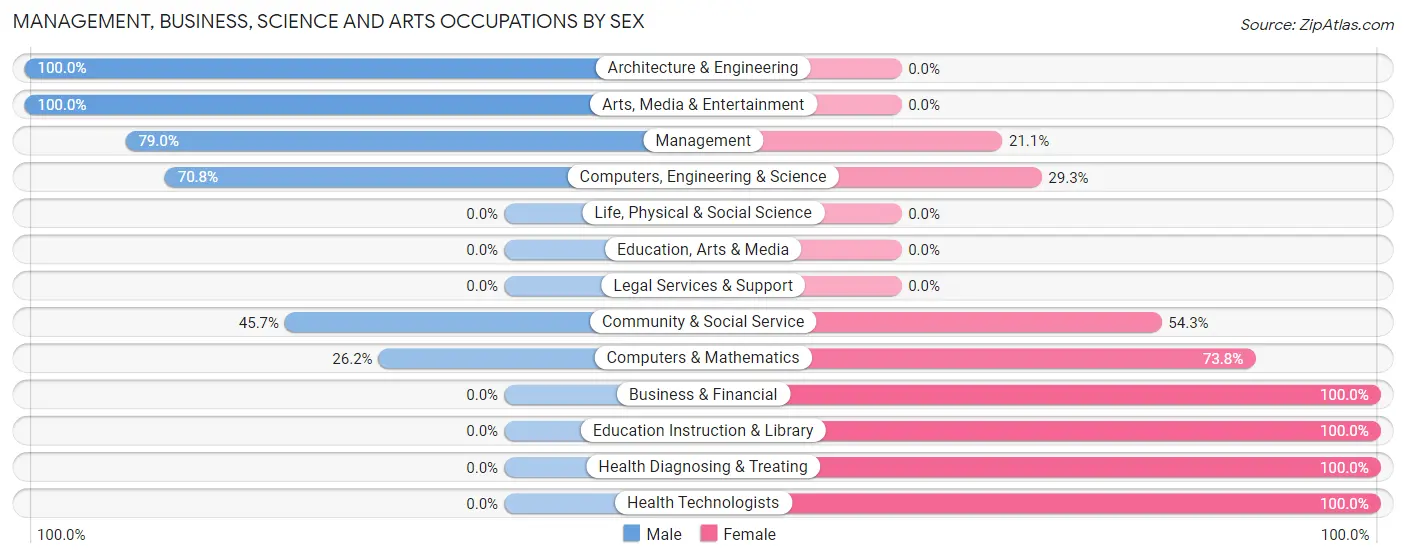
Management, Business, Science and Arts Occupations by Sex
Within the Management, Business, Science and Arts occupations in Rome, the most male-oriented occupations are Architecture & Engineering (100.0%), Arts, Media & Entertainment (100.0%), and Management (78.9%), while the most female-oriented occupations are Business & Financial (100.0%), Education Instruction & Library (100.0%), and Health Diagnosing & Treating (100.0%).
| Occupation | Male | Female |
| Management | 30 (78.9%) | 8 (21.0%) |
| Business & Financial | 0 (0.0%) | 10 (100.0%) |
| Computers, Engineering & Science | 75 (70.8%) | 31 (29.2%) |
| Computers & Mathematics | 11 (26.2%) | 31 (73.8%) |
| Architecture & Engineering | 64 (100.0%) | 0 (0.0%) |
| Life, Physical & Social Science | 0 (0.0%) | 0 (0.0%) |
| Community & Social Service | 16 (45.7%) | 19 (54.3%) |
| Education, Arts & Media | 0 (0.0%) | 0 (0.0%) |
| Legal Services & Support | 0 (0.0%) | 0 (0.0%) |
| Education Instruction & Library | 0 (0.0%) | 19 (100.0%) |
| Arts, Media & Entertainment | 16 (100.0%) | 0 (0.0%) |
| Health Diagnosing & Treating | 0 (0.0%) | 92 (100.0%) |
| Health Technologists | 0 (0.0%) | 67 (100.0%) |
| Total (Category) | 121 (43.1%) | 160 (56.9%) |
| Total (Overall) | 504 (57.0%) | 380 (43.0%) |
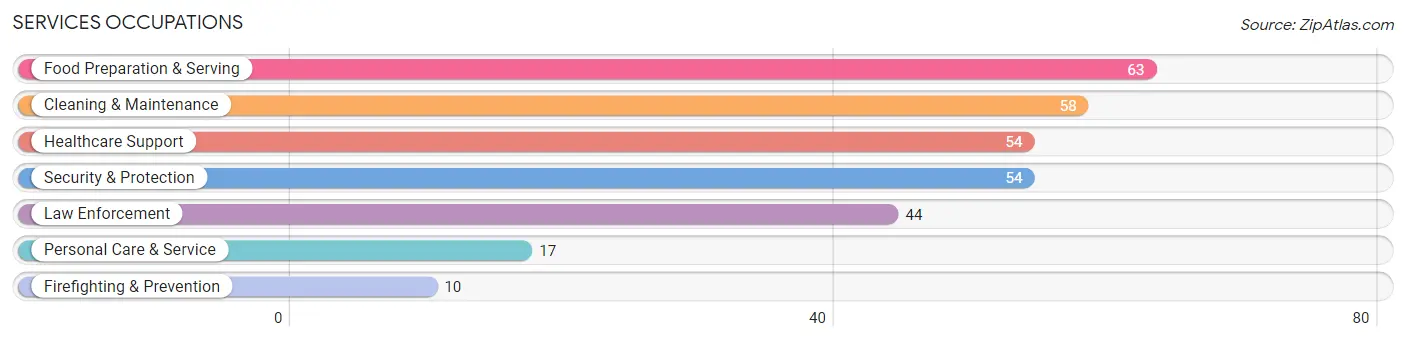
Services Occupations
The most common Services occupations in Rome are Food Preparation & Serving (63 | 7.1%), Cleaning & Maintenance (58 | 6.6%), Healthcare Support (54 | 6.1%), Security & Protection (54 | 6.1%), and Law Enforcement (44 | 5.0%).
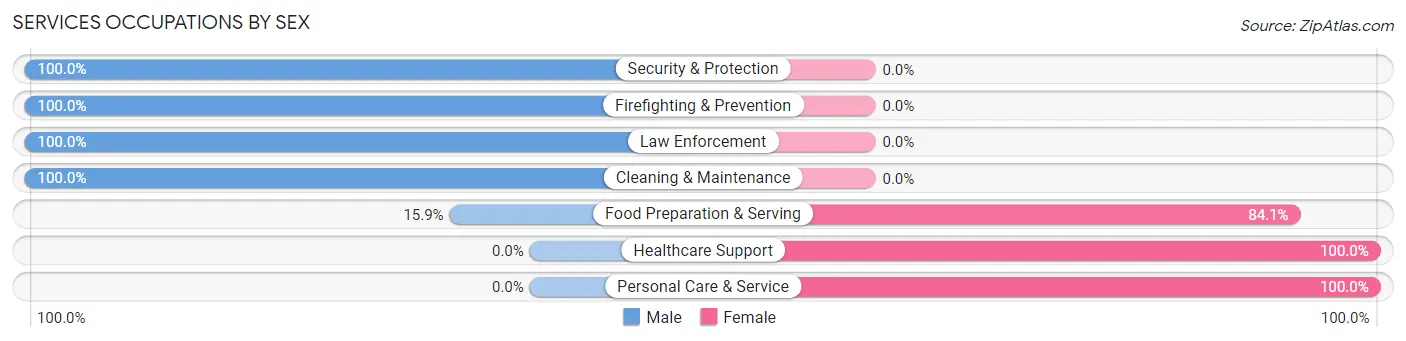
Services Occupations by Sex
Within the Services occupations in Rome, the most male-oriented occupations are Security & Protection (100.0%), Firefighting & Prevention (100.0%), and Law Enforcement (100.0%), while the most female-oriented occupations are Healthcare Support (100.0%), Personal Care & Service (100.0%), and Food Preparation & Serving (84.1%).
| Occupation | Male | Female |
| Healthcare Support | 0 (0.0%) | 54 (100.0%) |
| Security & Protection | 54 (100.0%) | 0 (0.0%) |
| Firefighting & Prevention | 10 (100.0%) | 0 (0.0%) |
| Law Enforcement | 44 (100.0%) | 0 (0.0%) |
| Food Preparation & Serving | 10 (15.9%) | 53 (84.1%) |
| Cleaning & Maintenance | 58 (100.0%) | 0 (0.0%) |
| Personal Care & Service | 0 (0.0%) | 17 (100.0%) |
| Total (Category) | 122 (49.6%) | 124 (50.4%) |
| Total (Overall) | 504 (57.0%) | 380 (43.0%) |
Sales and Office Occupations
The most common Sales and Office occupations in Rome are Office & Administration (134 | 15.2%), and Sales & Related (19 | 2.1%).
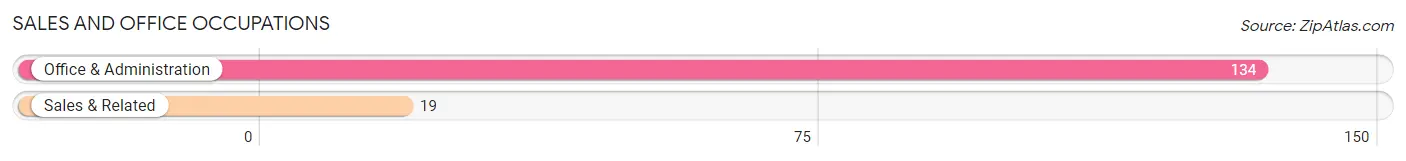
Sales and Office Occupations by Sex

| Occupation | Male | Female |
| Sales & Related | 19 (100.0%) | 0 (0.0%) |
| Office & Administration | 38 (28.4%) | 96 (71.6%) |
| Total (Category) | 57 (37.2%) | 96 (62.7%) |
| Total (Overall) | 504 (57.0%) | 380 (43.0%) |
Natural Resources, Construction and Maintenance Occupations
The most common Natural Resources, Construction and Maintenance occupations in Rome are Construction & Extraction (53 | 6.0%), and Installation, Maintenance & Repair (37 | 4.2%).
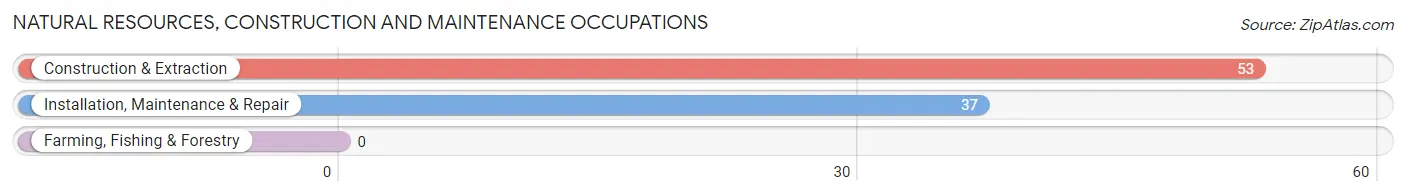
Natural Resources, Construction and Maintenance Occupations by Sex
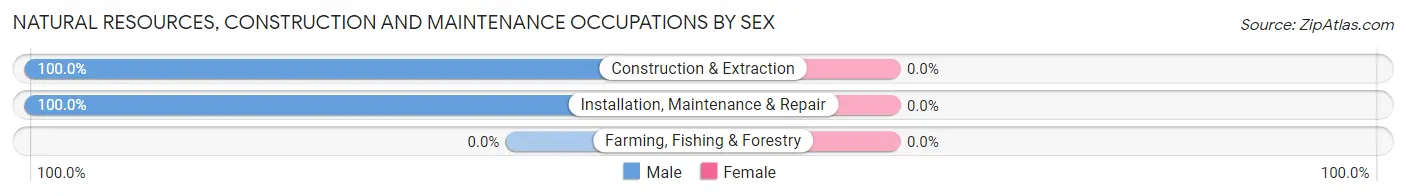
| Occupation | Male | Female |
| Farming, Fishing & Forestry | 0 (0.0%) | 0 (0.0%) |
| Construction & Extraction | 53 (100.0%) | 0 (0.0%) |
| Installation, Maintenance & Repair | 37 (100.0%) | 0 (0.0%) |
| Total (Category) | 90 (100.0%) | 0 (0.0%) |
| Total (Overall) | 504 (57.0%) | 380 (43.0%) |
Production, Transportation and Moving Occupations
The most common Production, Transportation and Moving occupations in Rome are Material Moving (43 | 4.9%), Transportation (37 | 4.2%), and Production (34 | 3.8%).
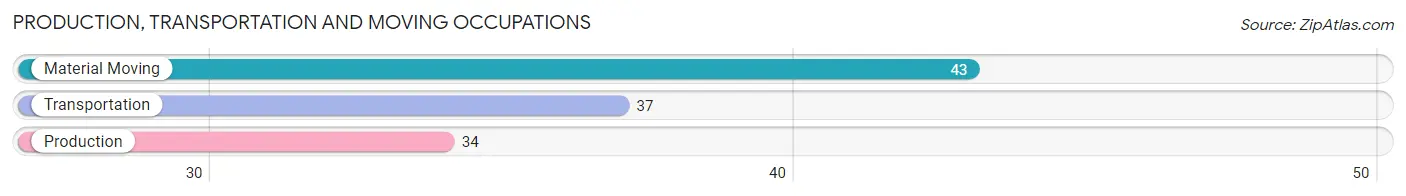
Production, Transportation and Moving Occupations by Sex
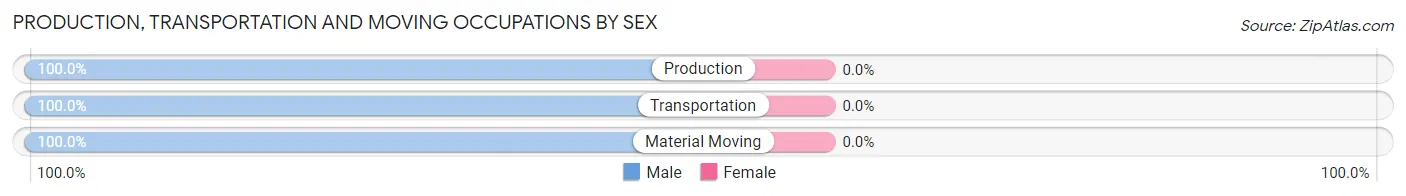
| Occupation | Male | Female |
| Production | 34 (100.0%) | 0 (0.0%) |
| Transportation | 37 (100.0%) | 0 (0.0%) |
| Material Moving | 43 (100.0%) | 0 (0.0%) |
| Total (Category) | 114 (100.0%) | 0 (0.0%) |
| Total (Overall) | 504 (57.0%) | 380 (43.0%) |
Employment Industries by Sex in Rome
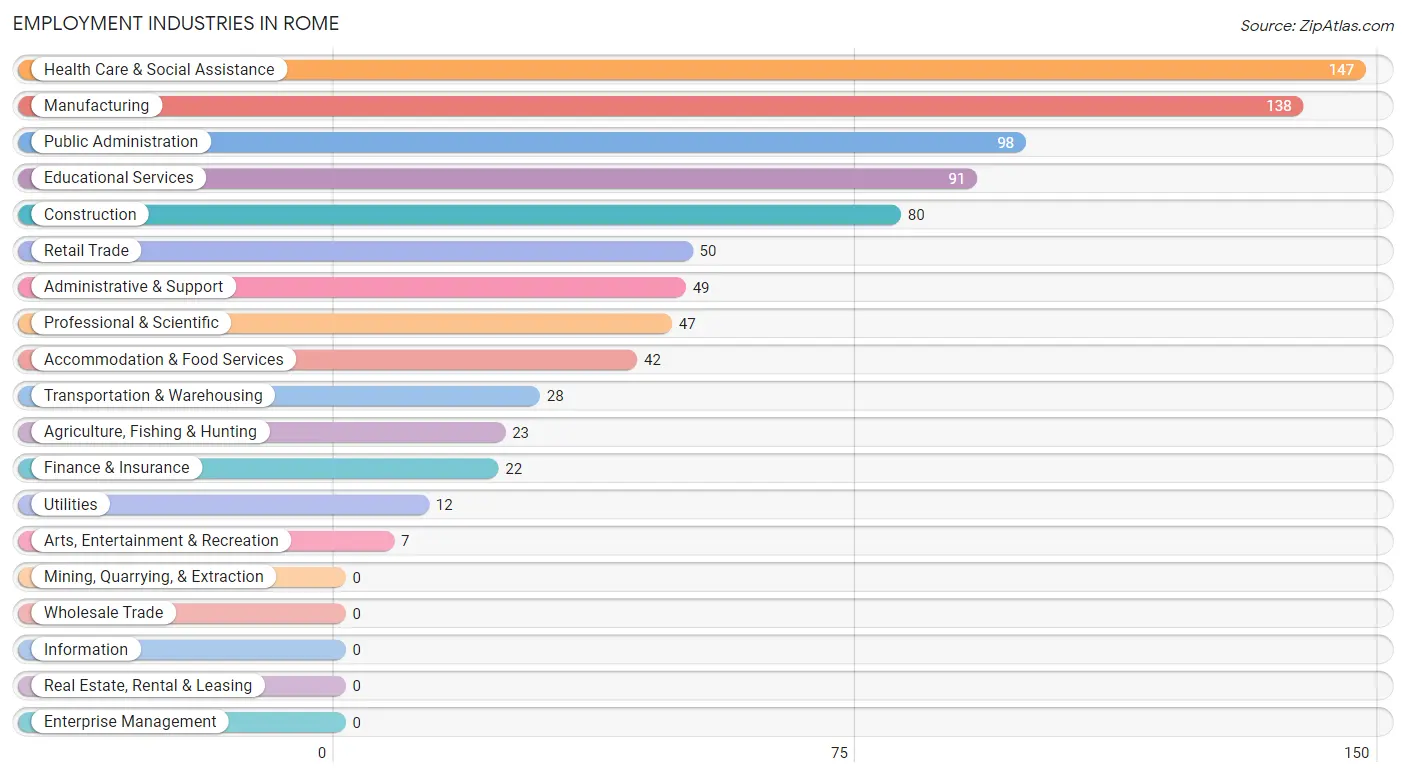
Employment Industries in Rome
The major employment industries in Rome include Health Care & Social Assistance (147 | 16.6%), Manufacturing (138 | 15.6%), Public Administration (98 | 11.1%), Educational Services (91 | 10.3%), and Construction (80 | 9.0%).
Employment Industries by Sex in Rome
The Rome industries that see more men than women are Agriculture, Fishing & Hunting (100.0%), Transportation & Warehousing (100.0%), and Utilities (100.0%), whereas the industries that tend to have a higher number of women are Finance & Insurance (100.0%), Health Care & Social Assistance (100.0%), and Arts, Entertainment & Recreation (100.0%).
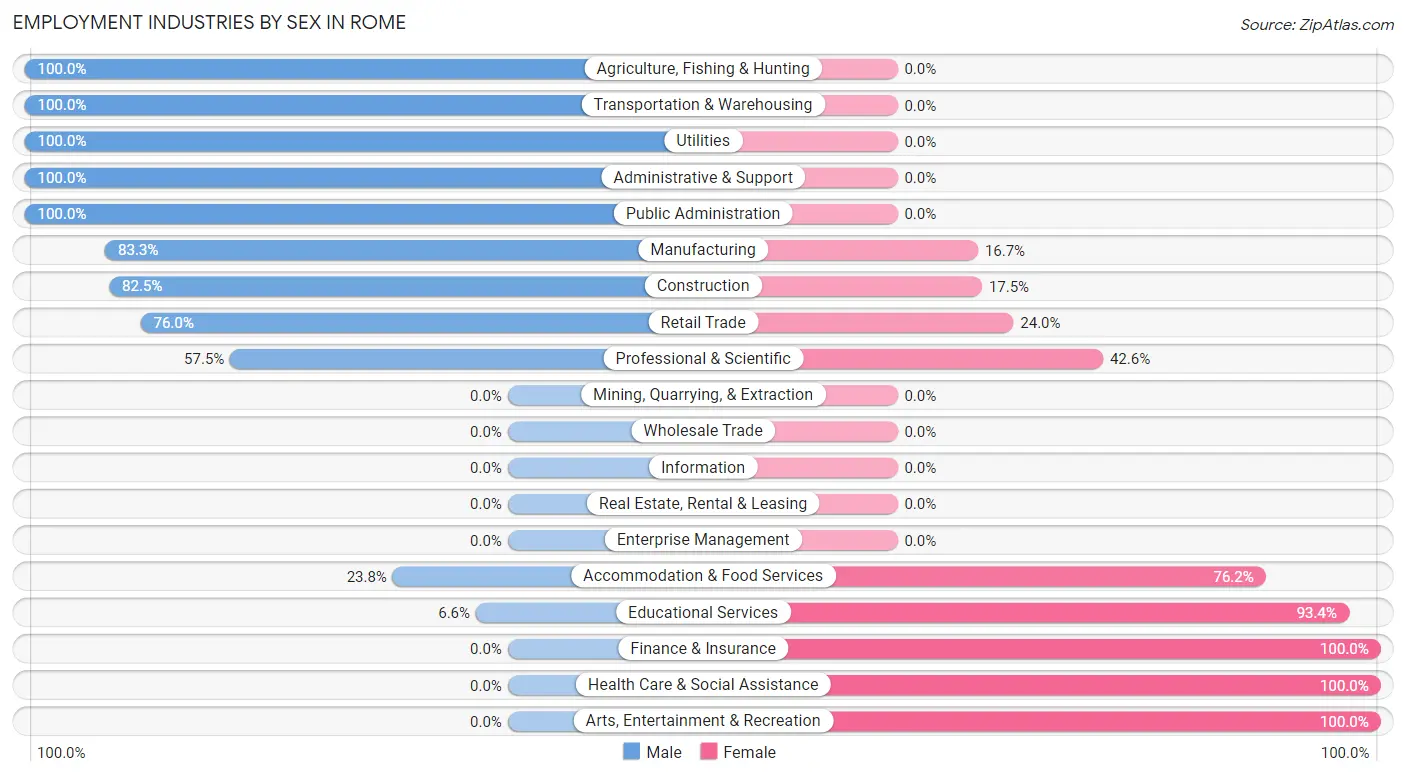
| Industry | Male | Female |
| Agriculture, Fishing & Hunting | 23 (100.0%) | 0 (0.0%) |
| Mining, Quarrying, & Extraction | 0 (0.0%) | 0 (0.0%) |
| Construction | 66 (82.5%) | 14 (17.5%) |
| Manufacturing | 115 (83.3%) | 23 (16.7%) |
| Wholesale Trade | 0 (0.0%) | 0 (0.0%) |
| Retail Trade | 38 (76.0%) | 12 (24.0%) |
| Transportation & Warehousing | 28 (100.0%) | 0 (0.0%) |
| Utilities | 12 (100.0%) | 0 (0.0%) |
| Information | 0 (0.0%) | 0 (0.0%) |
| Finance & Insurance | 0 (0.0%) | 22 (100.0%) |
| Real Estate, Rental & Leasing | 0 (0.0%) | 0 (0.0%) |
| Professional & Scientific | 27 (57.5%) | 20 (42.5%) |
| Enterprise Management | 0 (0.0%) | 0 (0.0%) |
| Administrative & Support | 49 (100.0%) | 0 (0.0%) |
| Educational Services | 6 (6.6%) | 85 (93.4%) |
| Health Care & Social Assistance | 0 (0.0%) | 147 (100.0%) |
| Arts, Entertainment & Recreation | 0 (0.0%) | 7 (100.0%) |
| Accommodation & Food Services | 10 (23.8%) | 32 (76.2%) |
| Public Administration | 98 (100.0%) | 0 (0.0%) |
| Total | 504 (57.0%) | 380 (43.0%) |
Education in Rome
School Enrollment in Rome
The most common levels of schooling among the 481 students in Rome are middle school (165 | 34.3%), college / undergraduate (102 | 21.2%), and elementary school (85 | 17.7%).
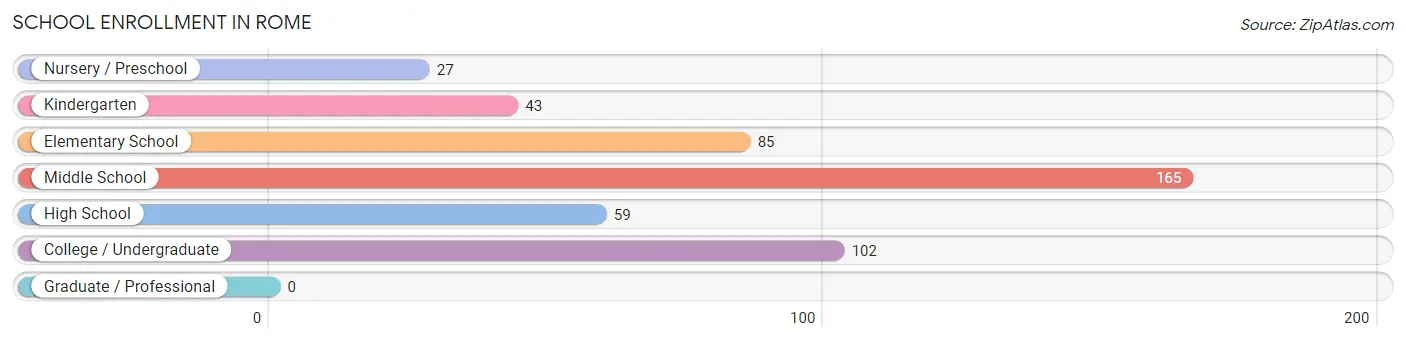
| School Level | # Students | % Students |
| Nursery / Preschool | 27 | 5.6% |
| Kindergarten | 43 | 8.9% |
| Elementary School | 85 | 17.7% |
| Middle School | 165 | 34.3% |
| High School | 59 | 12.3% |
| College / Undergraduate | 102 | 21.2% |
| Graduate / Professional | 0 | 0.0% |
| Total | 481 | 100.0% |
School Enrollment by Age by Funding Source in Rome
Out of a total of 481 students who are enrolled in schools in Rome, 8 (1.7%) attend a private institution, while the remaining 473 (98.3%) are enrolled in public schools. The age group of 18 to 19 year olds has the highest likelihood of being enrolled in private schools, with 8 (18.6% in the age bracket) enrolled. Conversely, the age group of 3 to 4 year olds has the lowest likelihood of being enrolled in a private school, with 27 (100.0% in the age bracket) attending a public institution.
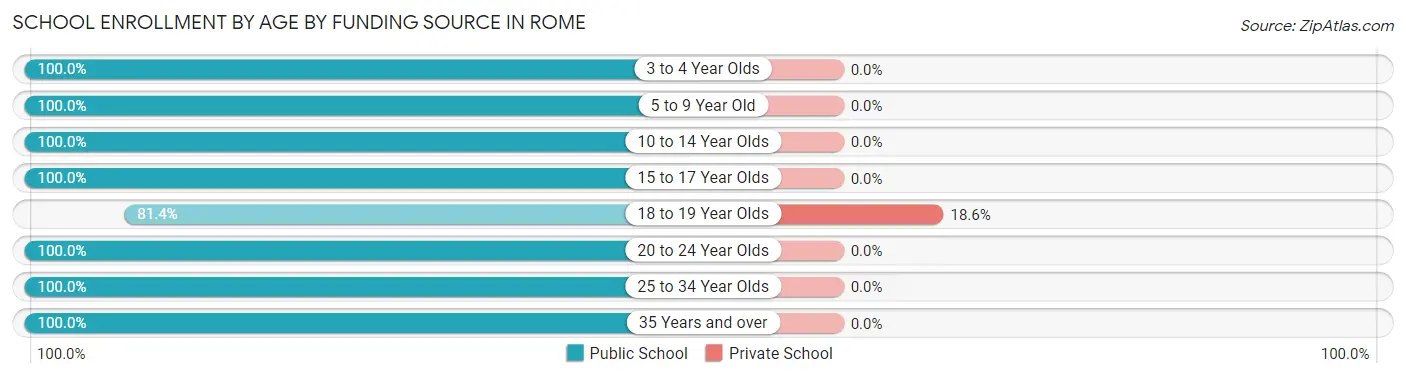
| Age Bracket | Public School | Private School |
| 3 to 4 Year Olds | 27 (100.0%) | 0 (0.0%) |
| 5 to 9 Year Old | 128 (100.0%) | 0 (0.0%) |
| 10 to 14 Year Olds | 166 (100.0%) | 0 (0.0%) |
| 15 to 17 Year Olds | 50 (100.0%) | 0 (0.0%) |
| 18 to 19 Year Olds | 35 (81.4%) | 8 (18.6%) |
| 20 to 24 Year Olds | 12 (100.0%) | 0 (0.0%) |
| 25 to 34 Year Olds | 13 (100.0%) | 0 (0.0%) |
| 35 Years and over | 42 (100.0%) | 0 (0.0%) |
| Total | 473 (98.3%) | 8 (1.7%) |
Educational Attainment by Field of Study in Rome
Business (49 | 19.9%), engineering (42 | 17.1%), science & technology (41 | 16.7%), education (41 | 16.7%), and bio, nature & agricultural (40 | 16.3%) are the most common fields of study among 246 individuals in Rome who have obtained a bachelor's degree or higher.
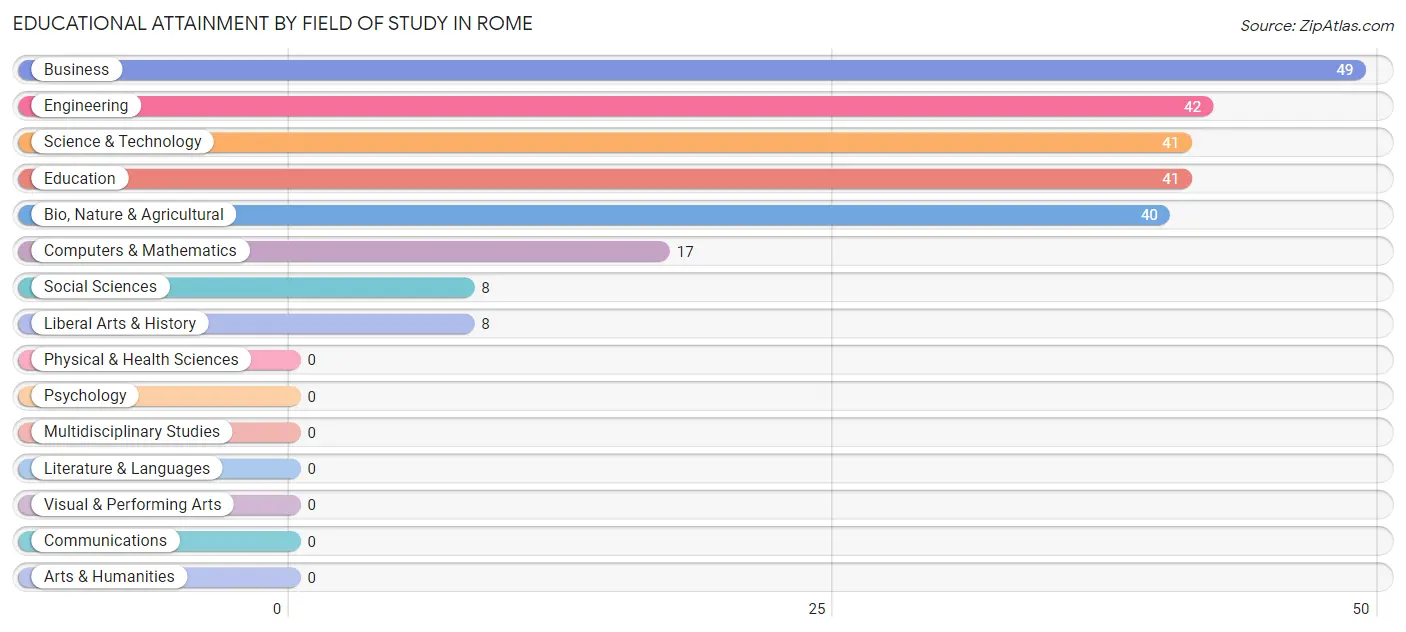
| Field of Study | # Graduates | % Graduates |
| Computers & Mathematics | 17 | 6.9% |
| Bio, Nature & Agricultural | 40 | 16.3% |
| Physical & Health Sciences | 0 | 0.0% |
| Psychology | 0 | 0.0% |
| Social Sciences | 8 | 3.3% |
| Engineering | 42 | 17.1% |
| Multidisciplinary Studies | 0 | 0.0% |
| Science & Technology | 41 | 16.7% |
| Business | 49 | 19.9% |
| Education | 41 | 16.7% |
| Literature & Languages | 0 | 0.0% |
| Liberal Arts & History | 8 | 3.3% |
| Visual & Performing Arts | 0 | 0.0% |
| Communications | 0 | 0.0% |
| Arts & Humanities | 0 | 0.0% |
| Total | 246 | 100.0% |
Transportation & Commute in Rome
Vehicle Availability by Sex in Rome
The most prevalent vehicle ownership categories in Rome are males with 2 vehicles (305, accounting for 60.5%) and females with 2 vehicles (210, making up 82.0%).
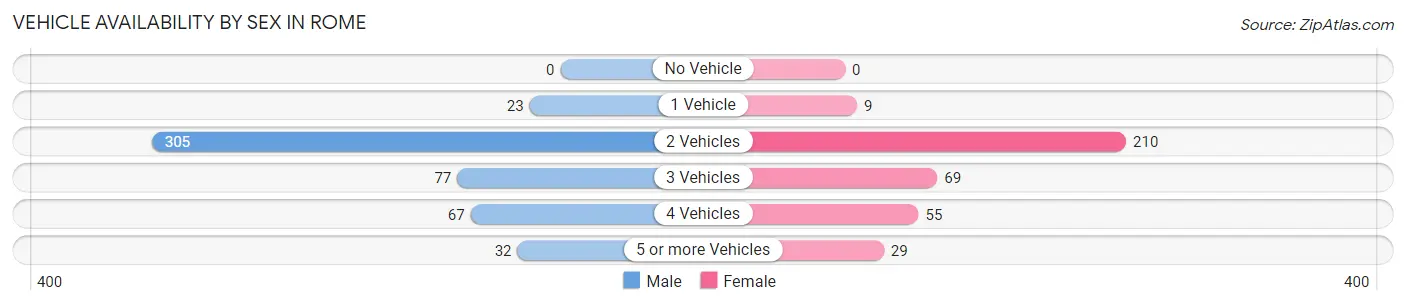
| Vehicles Available | Male | Female |
| No Vehicle | 0 (0.0%) | 0 (0.0%) |
| 1 Vehicle | 23 (4.6%) | 9 (2.4%) |
| 2 Vehicles | 305 (60.5%) | 210 (56.5%) |
| 3 Vehicles | 77 (15.3%) | 69 (18.5%) |
| 4 Vehicles | 67 (13.3%) | 55 (14.8%) |
| 5 or more Vehicles | 32 (6.4%) | 29 (7.8%) |
| Total | 504 (100.0%) | 372 (100.0%) |
Commute Time in Rome
The most frequently occuring commute durations in Rome are 15 to 19 minutes (163 commuters, 20.4%), 25 to 29 minutes (158 commuters, 19.8%), and 20 to 24 minutes (105 commuters, 13.1%).
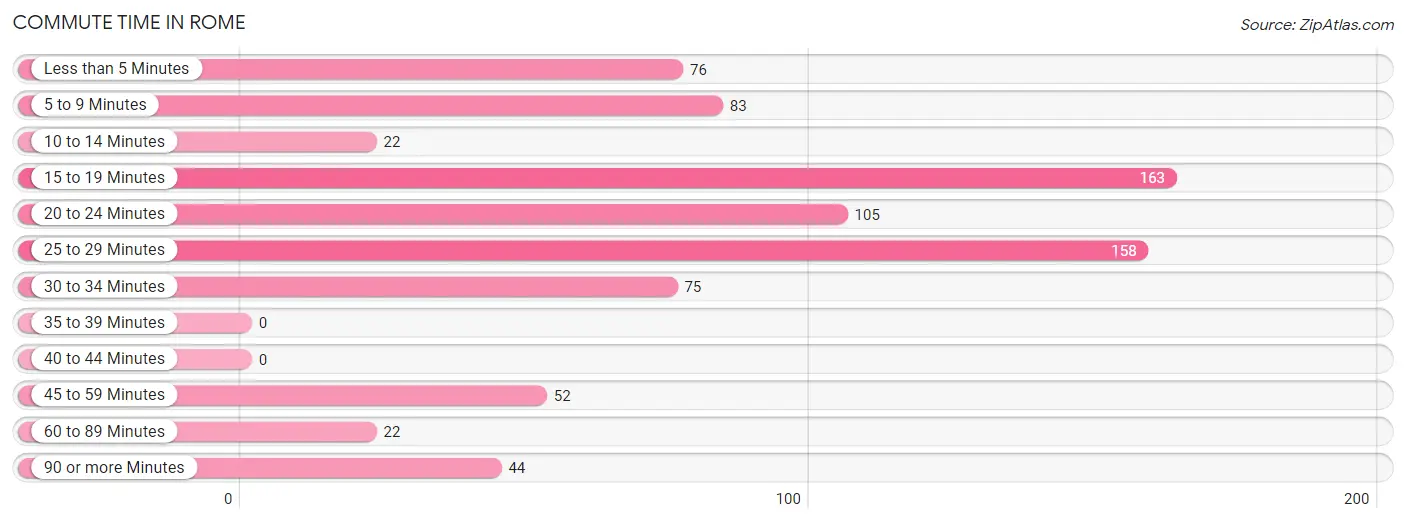
| Commute Time | # Commuters | % Commuters |
| Less than 5 Minutes | 76 | 9.5% |
| 5 to 9 Minutes | 83 | 10.4% |
| 10 to 14 Minutes | 22 | 2.8% |
| 15 to 19 Minutes | 163 | 20.4% |
| 20 to 24 Minutes | 105 | 13.1% |
| 25 to 29 Minutes | 158 | 19.8% |
| 30 to 34 Minutes | 75 | 9.4% |
| 35 to 39 Minutes | 0 | 0.0% |
| 40 to 44 Minutes | 0 | 0.0% |
| 45 to 59 Minutes | 52 | 6.5% |
| 60 to 89 Minutes | 22 | 2.8% |
| 90 or more Minutes | 44 | 5.5% |
Commute Time by Sex in Rome
The most common commute times in Rome are 15 to 19 minutes (91 commuters, 19.4%) for males and 25 to 29 minutes (113 commuters, 34.2%) for females.
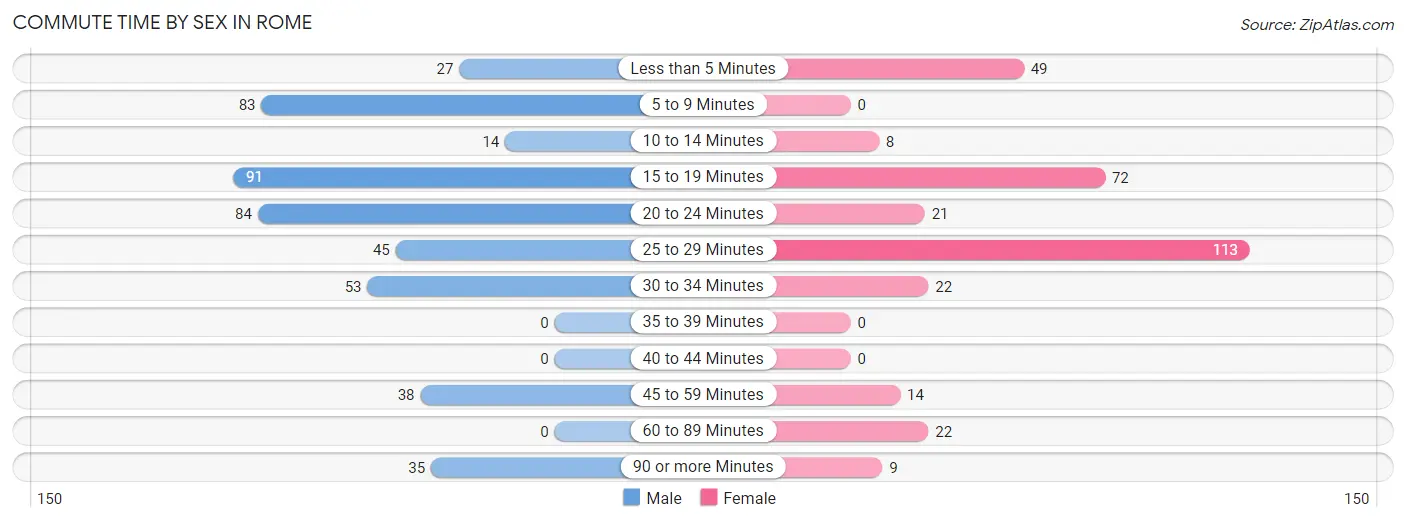
| Commute Time | Male | Female |
| Less than 5 Minutes | 27 (5.7%) | 49 (14.8%) |
| 5 to 9 Minutes | 83 (17.7%) | 0 (0.0%) |
| 10 to 14 Minutes | 14 (3.0%) | 8 (2.4%) |
| 15 to 19 Minutes | 91 (19.4%) | 72 (21.8%) |
| 20 to 24 Minutes | 84 (17.9%) | 21 (6.4%) |
| 25 to 29 Minutes | 45 (9.6%) | 113 (34.2%) |
| 30 to 34 Minutes | 53 (11.3%) | 22 (6.7%) |
| 35 to 39 Minutes | 0 (0.0%) | 0 (0.0%) |
| 40 to 44 Minutes | 0 (0.0%) | 0 (0.0%) |
| 45 to 59 Minutes | 38 (8.1%) | 14 (4.2%) |
| 60 to 89 Minutes | 0 (0.0%) | 22 (6.7%) |
| 90 or more Minutes | 35 (7.4%) | 9 (2.7%) |
Time of Departure to Work by Sex in Rome
The most frequent times of departure to work in Rome are 6:00 AM to 6:29 AM (108, 23.0%) for males and 5:30 AM to 5:59 AM (82, 24.8%) for females.
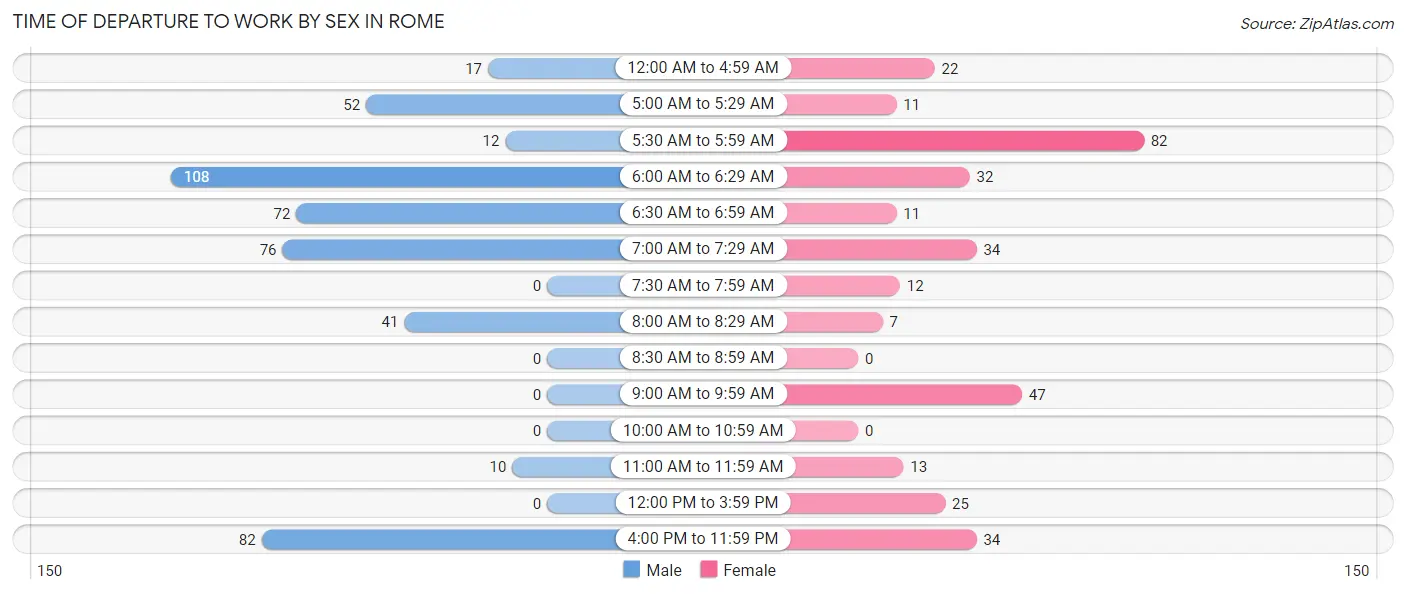
| Time of Departure | Male | Female |
| 12:00 AM to 4:59 AM | 17 (3.6%) | 22 (6.7%) |
| 5:00 AM to 5:29 AM | 52 (11.1%) | 11 (3.3%) |
| 5:30 AM to 5:59 AM | 12 (2.5%) | 82 (24.8%) |
| 6:00 AM to 6:29 AM | 108 (23.0%) | 32 (9.7%) |
| 6:30 AM to 6:59 AM | 72 (15.3%) | 11 (3.3%) |
| 7:00 AM to 7:29 AM | 76 (16.2%) | 34 (10.3%) |
| 7:30 AM to 7:59 AM | 0 (0.0%) | 12 (3.6%) |
| 8:00 AM to 8:29 AM | 41 (8.7%) | 7 (2.1%) |
| 8:30 AM to 8:59 AM | 0 (0.0%) | 0 (0.0%) |
| 9:00 AM to 9:59 AM | 0 (0.0%) | 47 (14.2%) |
| 10:00 AM to 10:59 AM | 0 (0.0%) | 0 (0.0%) |
| 11:00 AM to 11:59 AM | 10 (2.1%) | 13 (3.9%) |
| 12:00 PM to 3:59 PM | 0 (0.0%) | 25 (7.6%) |
| 4:00 PM to 11:59 PM | 82 (17.4%) | 34 (10.3%) |
| Total | 470 (100.0%) | 330 (100.0%) |
Housing Occupancy in Rome
Occupancy by Ownership in Rome
Of the total 659 dwellings in Rome, owner-occupied units account for 553 (83.9%), while renter-occupied units make up 106 (16.1%).
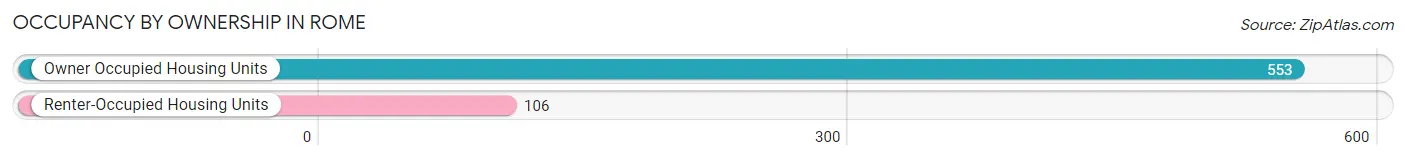
| Occupancy | # Housing Units | % Housing Units |
| Owner Occupied Housing Units | 553 | 83.9% |
| Renter-Occupied Housing Units | 106 | 16.1% |
| Total Occupied Housing Units | 659 | 100.0% |
Occupancy by Household Size in Rome
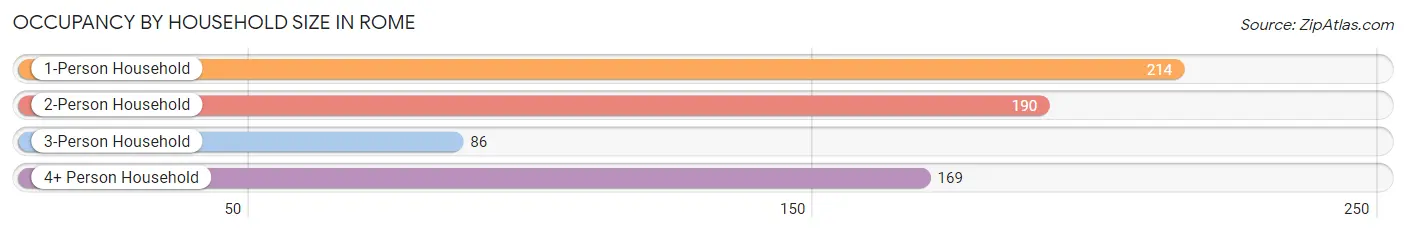
| Household Size | # Housing Units | % Housing Units |
| 1-Person Household | 214 | 32.5% |
| 2-Person Household | 190 | 28.8% |
| 3-Person Household | 86 | 13.1% |
| 4+ Person Household | 169 | 25.6% |
| Total Housing Units | 659 | 100.0% |
Occupancy by Ownership by Household Size in Rome
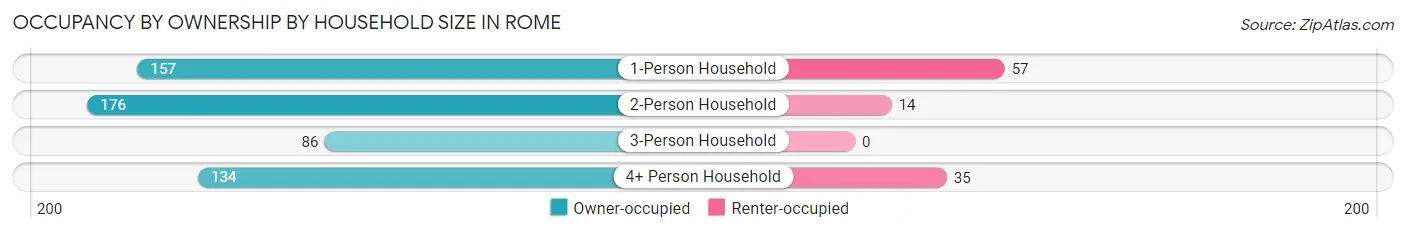
| Household Size | Owner-occupied | Renter-occupied |
| 1-Person Household | 157 (73.4%) | 57 (26.6%) |
| 2-Person Household | 176 (92.6%) | 14 (7.4%) |
| 3-Person Household | 86 (100.0%) | 0 (0.0%) |
| 4+ Person Household | 134 (79.3%) | 35 (20.7%) |
| Total Housing Units | 553 (83.9%) | 106 (16.1%) |
Occupancy by Educational Attainment in Rome
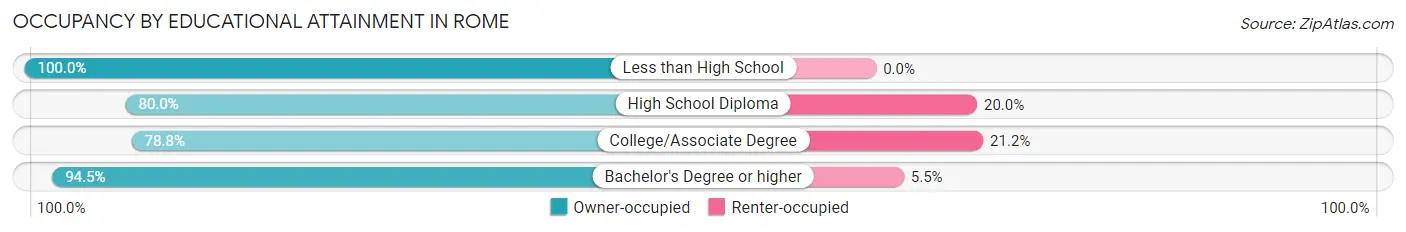
| Household Size | Owner-occupied | Renter-occupied |
| Less than High School | 41 (100.0%) | 0 (0.0%) |
| High School Diploma | 140 (80.0%) | 35 (20.0%) |
| College/Associate Degree | 234 (78.8%) | 63 (21.2%) |
| Bachelor's Degree or higher | 138 (94.5%) | 8 (5.5%) |
Occupancy by Age of Householder in Rome
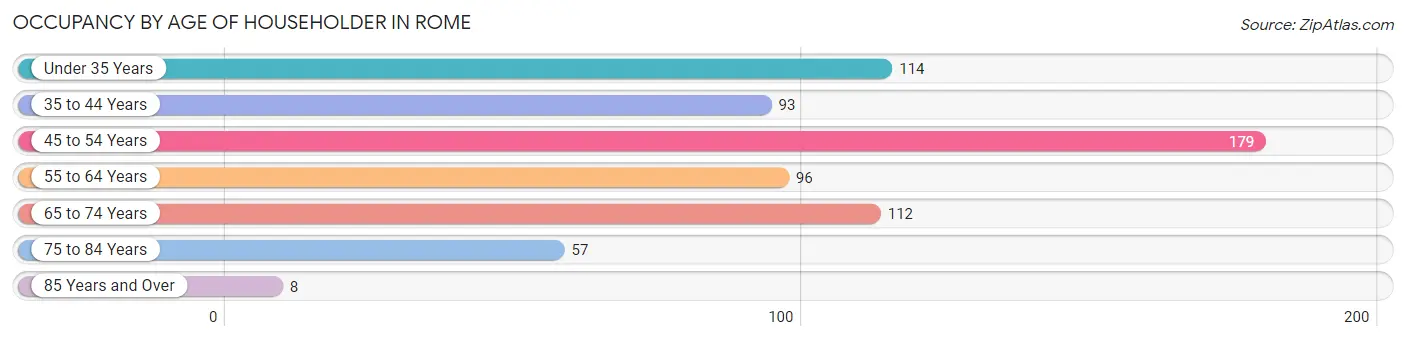
| Age Bracket | # Households | % Households |
| Under 35 Years | 114 | 17.3% |
| 35 to 44 Years | 93 | 14.1% |
| 45 to 54 Years | 179 | 27.2% |
| 55 to 64 Years | 96 | 14.6% |
| 65 to 74 Years | 112 | 17.0% |
| 75 to 84 Years | 57 | 8.6% |
| 85 Years and Over | 8 | 1.2% |
| Total | 659 | 100.0% |
Housing Finances in Rome
Median Income by Occupancy in Rome
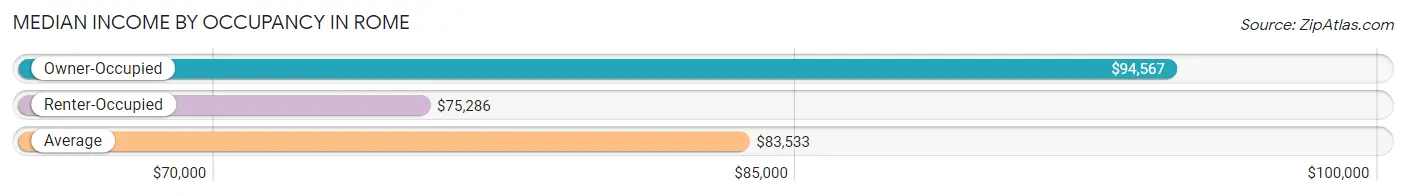
| Occupancy Type | # Households | Median Income |
| Owner-Occupied | 553 (83.9%) | $94,567 |
| Renter-Occupied | 106 (16.1%) | $75,286 |
| Average | 659 (100.0%) | $83,533 |
Occupancy by Householder Income Bracket in Rome
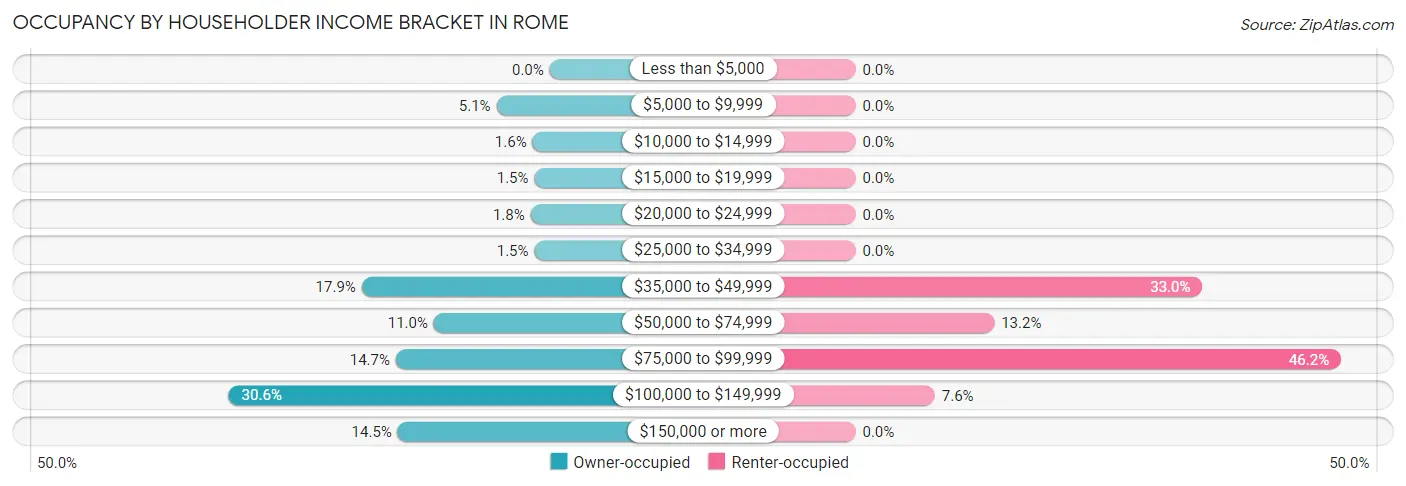
| Income Bracket | Owner-occupied | Renter-occupied |
| Less than $5,000 | 0 (0.0%) | 0 (0.0%) |
| $5,000 to $9,999 | 28 (5.1%) | 0 (0.0%) |
| $10,000 to $14,999 | 9 (1.6%) | 0 (0.0%) |
| $15,000 to $19,999 | 8 (1.5%) | 0 (0.0%) |
| $20,000 to $24,999 | 10 (1.8%) | 0 (0.0%) |
| $25,000 to $34,999 | 8 (1.5%) | 0 (0.0%) |
| $35,000 to $49,999 | 99 (17.9%) | 35 (33.0%) |
| $50,000 to $74,999 | 61 (11.0%) | 14 (13.2%) |
| $75,000 to $99,999 | 81 (14.6%) | 49 (46.2%) |
| $100,000 to $149,999 | 169 (30.6%) | 8 (7.5%) |
| $150,000 or more | 80 (14.5%) | 0 (0.0%) |
| Total | 553 (100.0%) | 106 (100.0%) |
Monthly Housing Cost Tiers in Rome
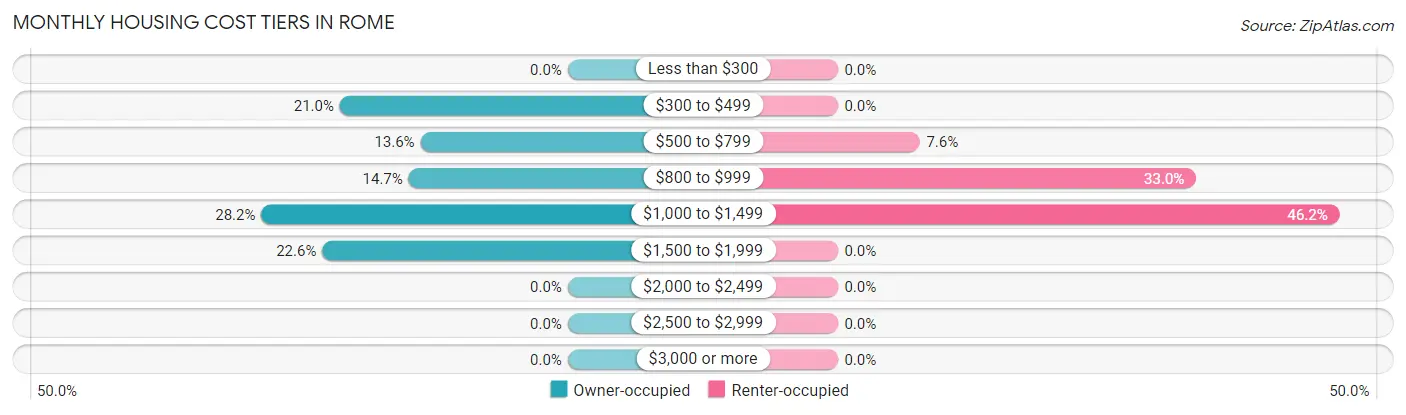
| Monthly Cost | Owner-occupied | Renter-occupied |
| Less than $300 | 0 (0.0%) | 0 (0.0%) |
| $300 to $499 | 116 (21.0%) | 0 (0.0%) |
| $500 to $799 | 75 (13.6%) | 8 (7.5%) |
| $800 to $999 | 81 (14.6%) | 35 (33.0%) |
| $1,000 to $1,499 | 156 (28.2%) | 49 (46.2%) |
| $1,500 to $1,999 | 125 (22.6%) | 0 (0.0%) |
| $2,000 to $2,499 | 0 (0.0%) | 0 (0.0%) |
| $2,500 to $2,999 | 0 (0.0%) | 0 (0.0%) |
| $3,000 or more | 0 (0.0%) | 0 (0.0%) |
| Total | 553 (100.0%) | 106 (100.0%) |
Physical Housing Characteristics in Rome
Housing Structures in Rome
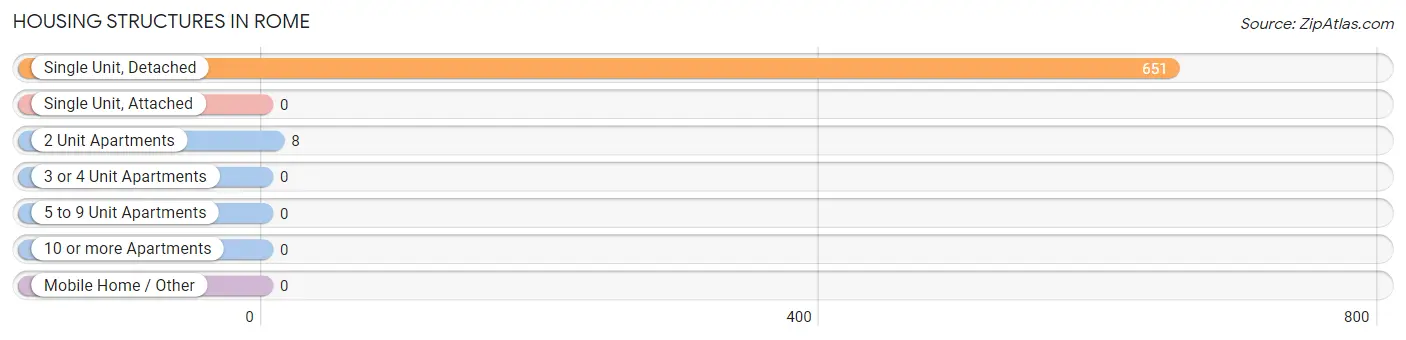
| Structure Type | # Housing Units | % Housing Units |
| Single Unit, Detached | 651 | 98.8% |
| Single Unit, Attached | 0 | 0.0% |
| 2 Unit Apartments | 8 | 1.2% |
| 3 or 4 Unit Apartments | 0 | 0.0% |
| 5 to 9 Unit Apartments | 0 | 0.0% |
| 10 or more Apartments | 0 | 0.0% |
| Mobile Home / Other | 0 | 0.0% |
| Total | 659 | 100.0% |
Housing Structures by Occupancy in Rome
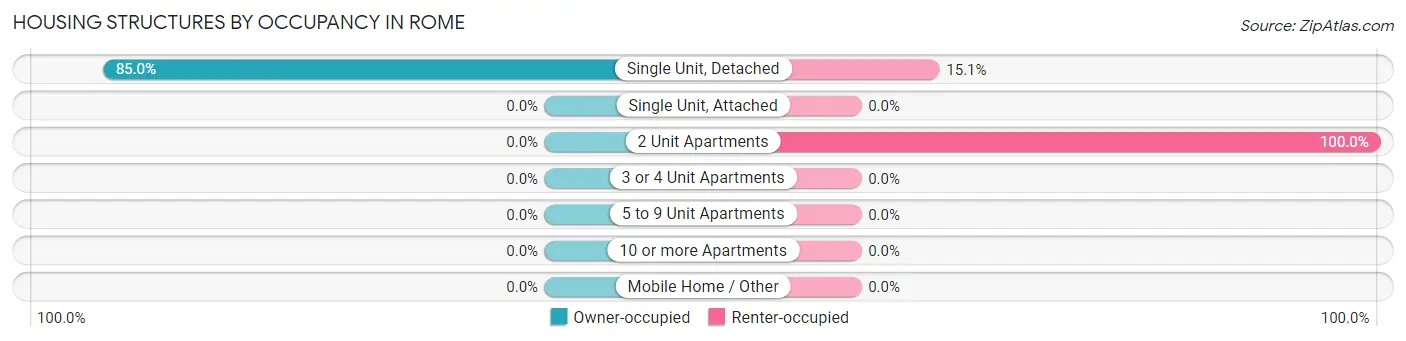
| Structure Type | Owner-occupied | Renter-occupied |
| Single Unit, Detached | 553 (85.0%) | 98 (15.0%) |
| Single Unit, Attached | 0 (0.0%) | 0 (0.0%) |
| 2 Unit Apartments | 0 (0.0%) | 8 (100.0%) |
| 3 or 4 Unit Apartments | 0 (0.0%) | 0 (0.0%) |
| 5 to 9 Unit Apartments | 0 (0.0%) | 0 (0.0%) |
| 10 or more Apartments | 0 (0.0%) | 0 (0.0%) |
| Mobile Home / Other | 0 (0.0%) | 0 (0.0%) |
| Total | 553 (83.9%) | 106 (16.1%) |
Housing Structures by Number of Rooms in Rome
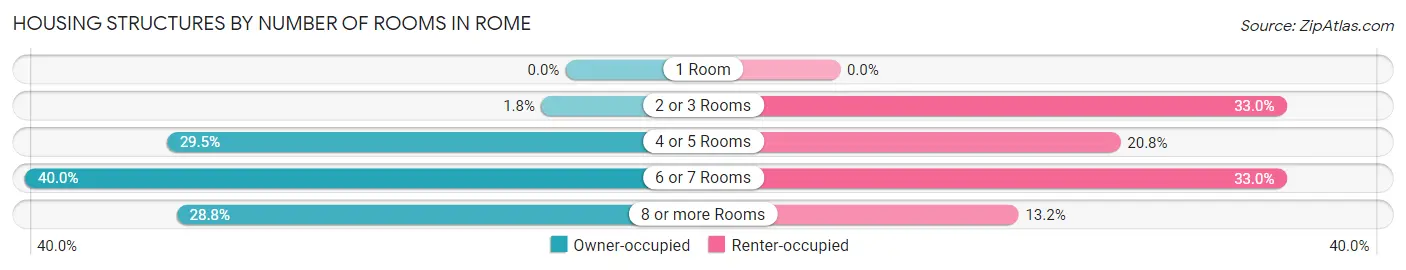
| Number of Rooms | Owner-occupied | Renter-occupied |
| 1 Room | 0 (0.0%) | 0 (0.0%) |
| 2 or 3 Rooms | 10 (1.8%) | 35 (33.0%) |
| 4 or 5 Rooms | 163 (29.5%) | 22 (20.7%) |
| 6 or 7 Rooms | 221 (40.0%) | 35 (33.0%) |
| 8 or more Rooms | 159 (28.7%) | 14 (13.2%) |
| Total | 553 (100.0%) | 106 (100.0%) |
Housing Structure by Heating Type in Rome
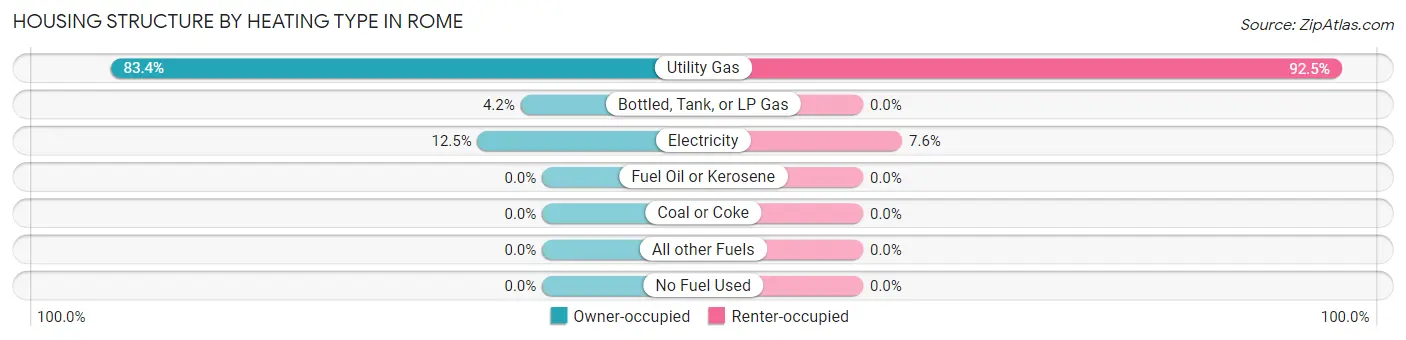
| Heating Type | Owner-occupied | Renter-occupied |
| Utility Gas | 461 (83.4%) | 98 (92.4%) |
| Bottled, Tank, or LP Gas | 23 (4.2%) | 0 (0.0%) |
| Electricity | 69 (12.5%) | 8 (7.5%) |
| Fuel Oil or Kerosene | 0 (0.0%) | 0 (0.0%) |
| Coal or Coke | 0 (0.0%) | 0 (0.0%) |
| All other Fuels | 0 (0.0%) | 0 (0.0%) |
| No Fuel Used | 0 (0.0%) | 0 (0.0%) |
| Total | 553 (100.0%) | 106 (100.0%) |
Household Vehicle Usage in Rome
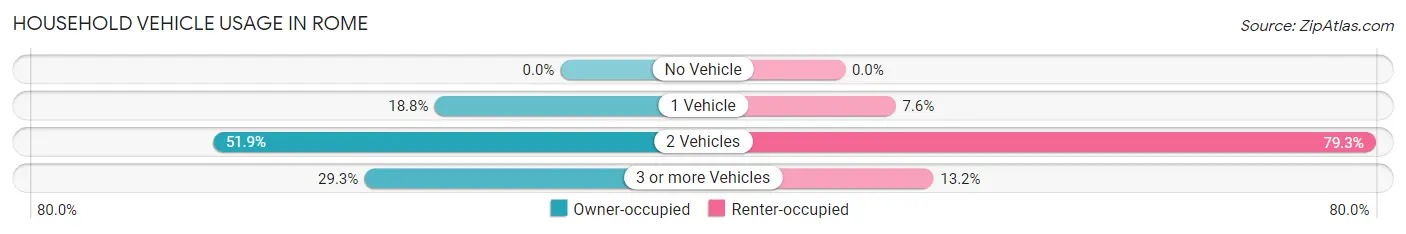
| Vehicles per Household | Owner-occupied | Renter-occupied |
| No Vehicle | 0 (0.0%) | 0 (0.0%) |
| 1 Vehicle | 104 (18.8%) | 8 (7.5%) |
| 2 Vehicles | 287 (51.9%) | 84 (79.2%) |
| 3 or more Vehicles | 162 (29.3%) | 14 (13.2%) |
| Total | 553 (100.0%) | 106 (100.0%) |
Real Estate & Mortgages in Rome
Real Estate and Mortgage Overview in Rome
| Characteristic | Without Mortgage | With Mortgage |
| Housing Units | 201 | 352 |
| Median Property Value | $133,600 | $159,100 |
| Median Household Income | $43,831 | $70 |
| Monthly Housing Costs | $481 | $0 |
| Real Estate Taxes | $2,630 | $23 |
Property Value by Mortgage Status in Rome
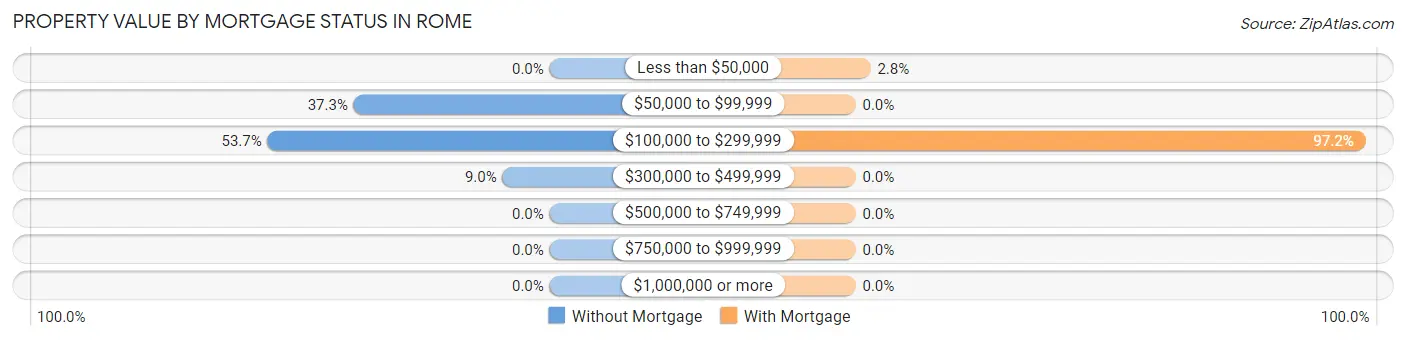
| Property Value | Without Mortgage | With Mortgage |
| Less than $50,000 | 0 (0.0%) | 10 (2.8%) |
| $50,000 to $99,999 | 75 (37.3%) | 0 (0.0%) |
| $100,000 to $299,999 | 108 (53.7%) | 342 (97.2%) |
| $300,000 to $499,999 | 18 (9.0%) | 0 (0.0%) |
| $500,000 to $749,999 | 0 (0.0%) | 0 (0.0%) |
| $750,000 to $999,999 | 0 (0.0%) | 0 (0.0%) |
| $1,000,000 or more | 0 (0.0%) | 0 (0.0%) |
| Total | 201 (100.0%) | 352 (100.0%) |
Household Income by Mortgage Status in Rome
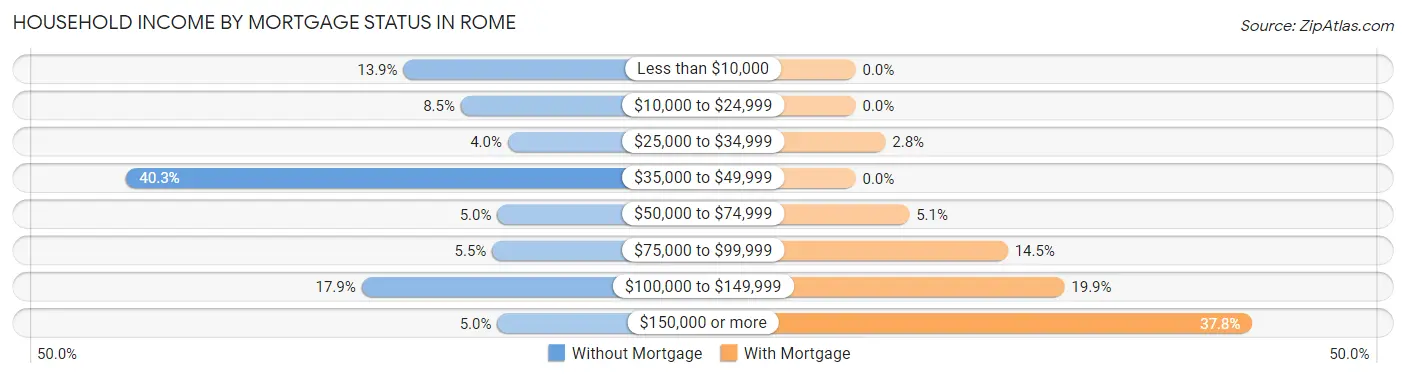
| Household Income | Without Mortgage | With Mortgage |
| Less than $10,000 | 28 (13.9%) | 0 (0.0%) |
| $10,000 to $24,999 | 17 (8.5%) | 0 (0.0%) |
| $25,000 to $34,999 | 8 (4.0%) | 10 (2.8%) |
| $35,000 to $49,999 | 81 (40.3%) | 0 (0.0%) |
| $50,000 to $74,999 | 10 (5.0%) | 18 (5.1%) |
| $75,000 to $99,999 | 11 (5.5%) | 51 (14.5%) |
| $100,000 to $149,999 | 36 (17.9%) | 70 (19.9%) |
| $150,000 or more | 10 (5.0%) | 133 (37.8%) |
| Total | 201 (100.0%) | 352 (100.0%) |
Property Value to Household Income Ratio in Rome
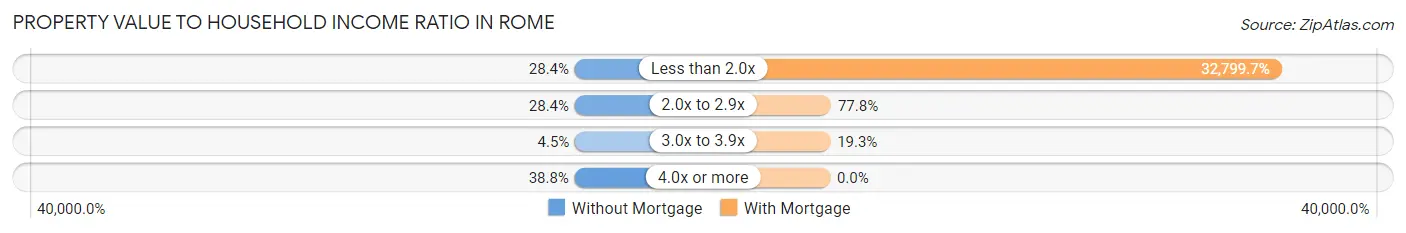
| Value-to-Income Ratio | Without Mortgage | With Mortgage |
| Less than 2.0x | 57 (28.4%) | 115,455 (32,799.7%) |
| 2.0x to 2.9x | 57 (28.4%) | 274 (77.8%) |
| 3.0x to 3.9x | 9 (4.5%) | 68 (19.3%) |
| 4.0x or more | 78 (38.8%) | 0 (0.0%) |
| Total | 201 (100.0%) | 352 (100.0%) |
Real Estate Taxes by Mortgage Status in Rome
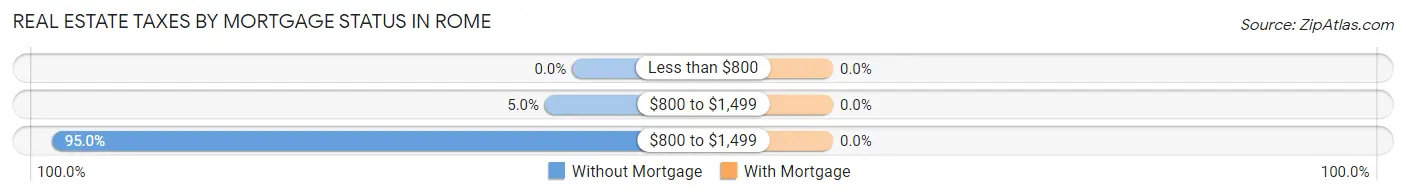
| Property Taxes | Without Mortgage | With Mortgage |
| Less than $800 | 0 (0.0%) | 0 (0.0%) |
| $800 to $1,499 | 10 (5.0%) | 0 (0.0%) |
| $800 to $1,499 | 191 (95.0%) | 0 (0.0%) |
| Total | 201 (100.0%) | 352 (100.0%) |
Health & Disability in Rome
Health Insurance Coverage by Age in Rome
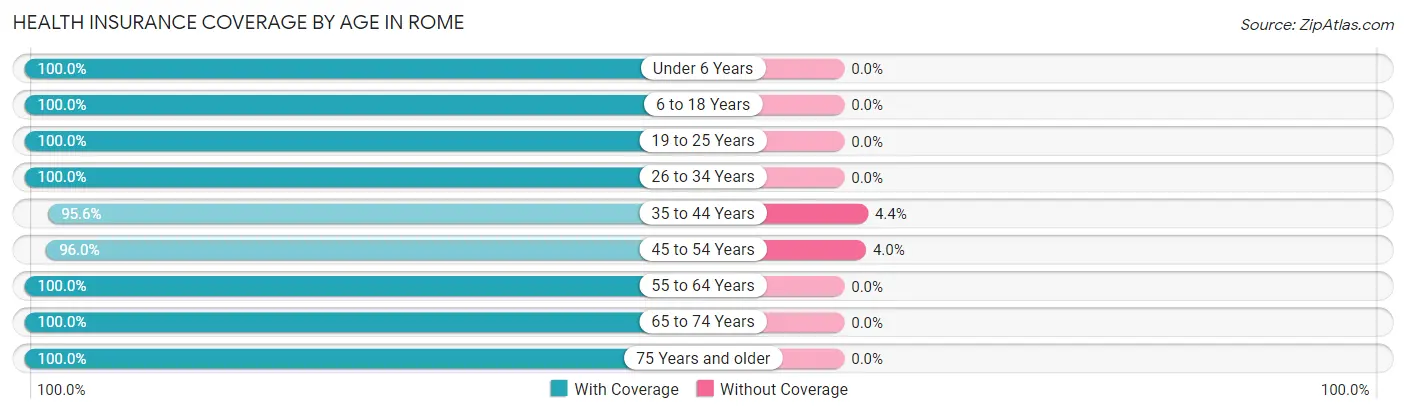
| Age Bracket | With Coverage | Without Coverage |
| Under 6 Years | 60 (100.0%) | 0 (0.0%) |
| 6 to 18 Years | 374 (100.0%) | 0 (0.0%) |
| 19 to 25 Years | 118 (100.0%) | 0 (0.0%) |
| 26 to 34 Years | 170 (100.0%) | 0 (0.0%) |
| 35 to 44 Years | 217 (95.6%) | 10 (4.4%) |
| 45 to 54 Years | 261 (96.0%) | 11 (4.0%) |
| 55 to 64 Years | 152 (100.0%) | 0 (0.0%) |
| 65 to 74 Years | 157 (100.0%) | 0 (0.0%) |
| 75 Years and older | 75 (100.0%) | 0 (0.0%) |
| Total | 1,584 (98.7%) | 21 (1.3%) |
Health Insurance Coverage by Citizenship Status in Rome
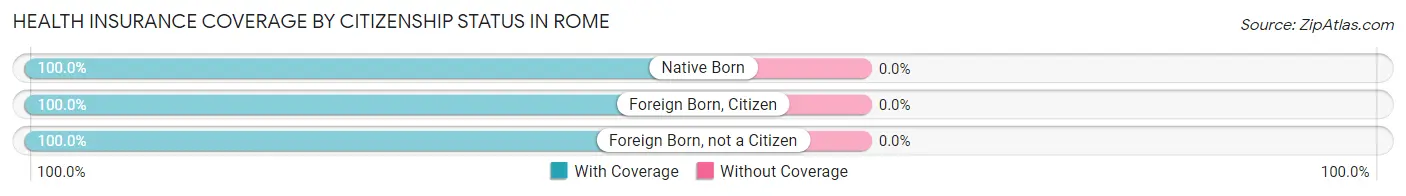
| Citizenship Status | With Coverage | Without Coverage |
| Native Born | 60 (100.0%) | 0 (0.0%) |
| Foreign Born, Citizen | 374 (100.0%) | 0 (0.0%) |
| Foreign Born, not a Citizen | 118 (100.0%) | 0 (0.0%) |
Health Insurance Coverage by Household Income in Rome
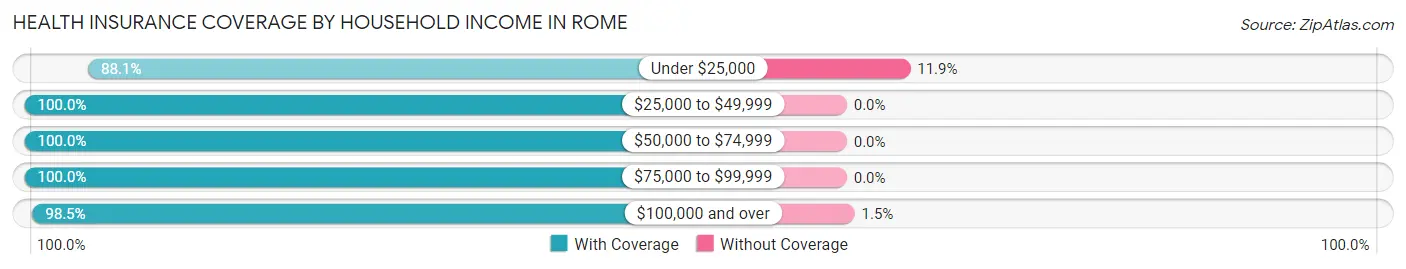
| Household Income | With Coverage | Without Coverage |
| Under $25,000 | 74 (88.1%) | 10 (11.9%) |
| $25,000 to $49,999 | 169 (100.0%) | 0 (0.0%) |
| $50,000 to $74,999 | 177 (100.0%) | 0 (0.0%) |
| $75,000 to $99,999 | 408 (100.0%) | 0 (0.0%) |
| $100,000 and over | 744 (98.5%) | 11 (1.5%) |
Public vs Private Health Insurance Coverage by Age in Rome
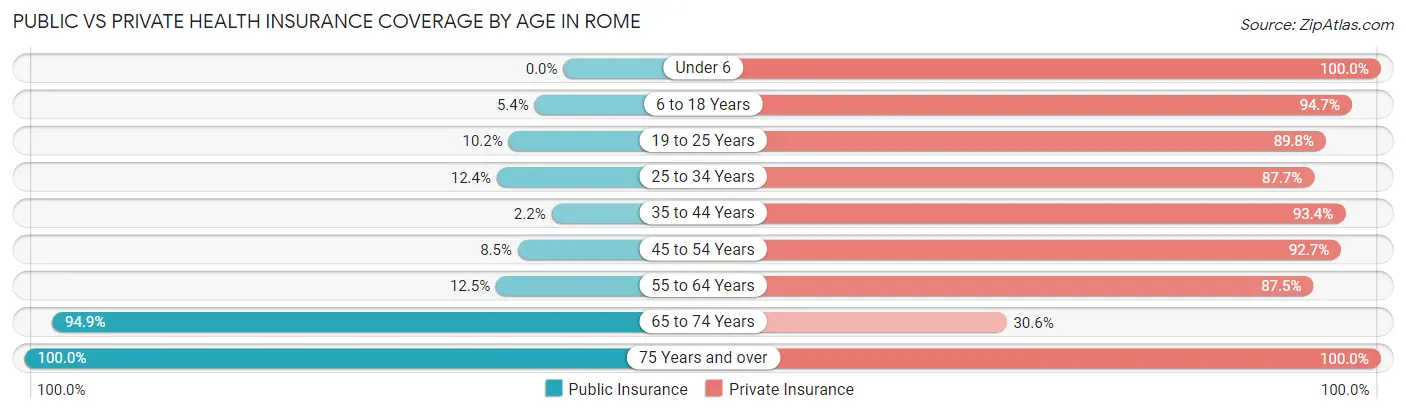
| Age Bracket | Public Insurance | Private Insurance |
| Under 6 | 0 (0.0%) | 60 (100.0%) |
| 6 to 18 Years | 20 (5.3%) | 354 (94.7%) |
| 19 to 25 Years | 12 (10.2%) | 106 (89.8%) |
| 25 to 34 Years | 21 (12.3%) | 149 (87.6%) |
| 35 to 44 Years | 5 (2.2%) | 212 (93.4%) |
| 45 to 54 Years | 23 (8.5%) | 252 (92.6%) |
| 55 to 64 Years | 19 (12.5%) | 133 (87.5%) |
| 65 to 74 Years | 149 (94.9%) | 48 (30.6%) |
| 75 Years and over | 75 (100.0%) | 75 (100.0%) |
| Total | 324 (20.2%) | 1,389 (86.5%) |
Disability Status by Sex by Age in Rome
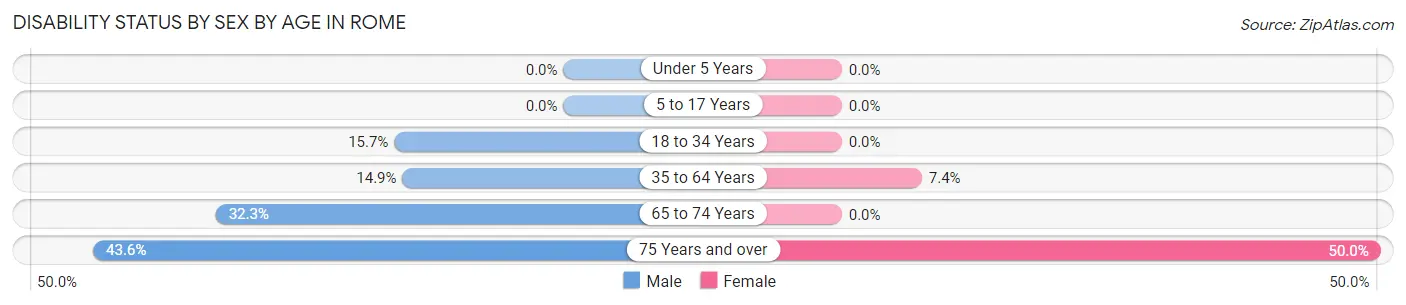
| Age Bracket | Male | Female |
| Under 5 Years | 0 (0.0%) | 0 (0.0%) |
| 5 to 17 Years | 0 (0.0%) | 0 (0.0%) |
| 18 to 34 Years | 27 (15.7%) | 0 (0.0%) |
| 35 to 64 Years | 49 (14.9%) | 24 (7.4%) |
| 65 to 74 Years | 30 (32.3%) | 0 (0.0%) |
| 75 Years and over | 24 (43.6%) | 10 (50.0%) |
Disability Class by Sex by Age in Rome
Disability Class: Hearing Difficulty
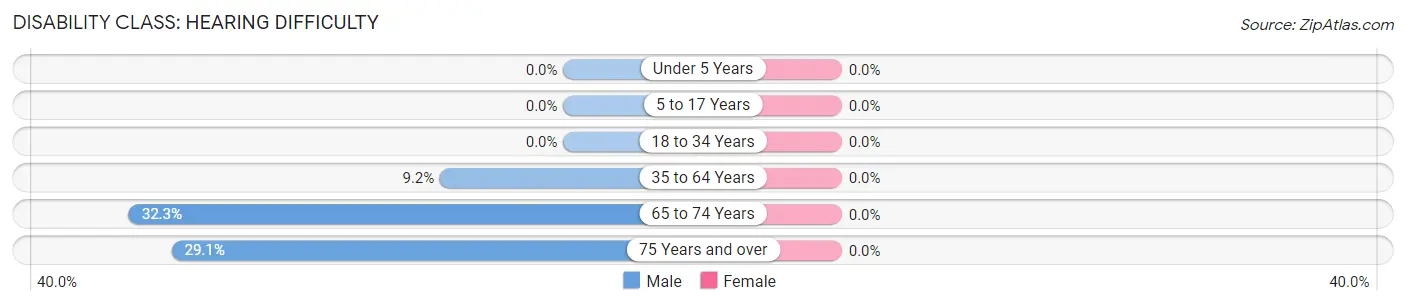
| Age Bracket | Male | Female |
| Under 5 Years | 0 (0.0%) | 0 (0.0%) |
| 5 to 17 Years | 0 (0.0%) | 0 (0.0%) |
| 18 to 34 Years | 0 (0.0%) | 0 (0.0%) |
| 35 to 64 Years | 30 (9.1%) | 0 (0.0%) |
| 65 to 74 Years | 30 (32.3%) | 0 (0.0%) |
| 75 Years and over | 16 (29.1%) | 0 (0.0%) |
Disability Class: Vision Difficulty
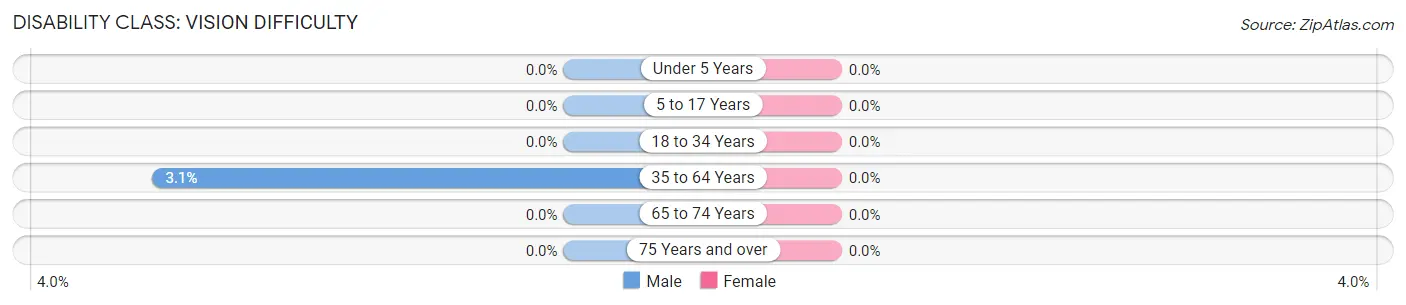
| Age Bracket | Male | Female |
| Under 5 Years | 0 (0.0%) | 0 (0.0%) |
| 5 to 17 Years | 0 (0.0%) | 0 (0.0%) |
| 18 to 34 Years | 0 (0.0%) | 0 (0.0%) |
| 35 to 64 Years | 10 (3.0%) | 0 (0.0%) |
| 65 to 74 Years | 0 (0.0%) | 0 (0.0%) |
| 75 Years and over | 0 (0.0%) | 0 (0.0%) |
Disability Class: Cognitive Difficulty
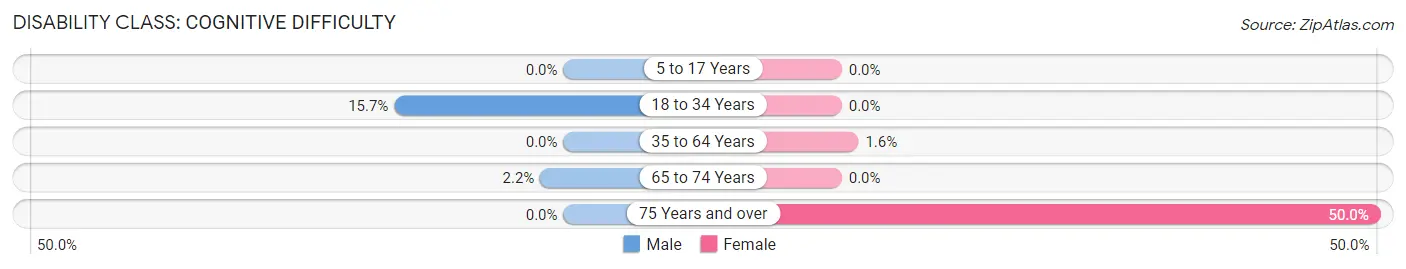
| Age Bracket | Male | Female |
| 5 to 17 Years | 0 (0.0%) | 0 (0.0%) |
| 18 to 34 Years | 27 (15.7%) | 0 (0.0%) |
| 35 to 64 Years | 0 (0.0%) | 5 (1.5%) |
| 65 to 74 Years | 2 (2.1%) | 0 (0.0%) |
| 75 Years and over | 0 (0.0%) | 10 (50.0%) |
Disability Class: Ambulatory Difficulty
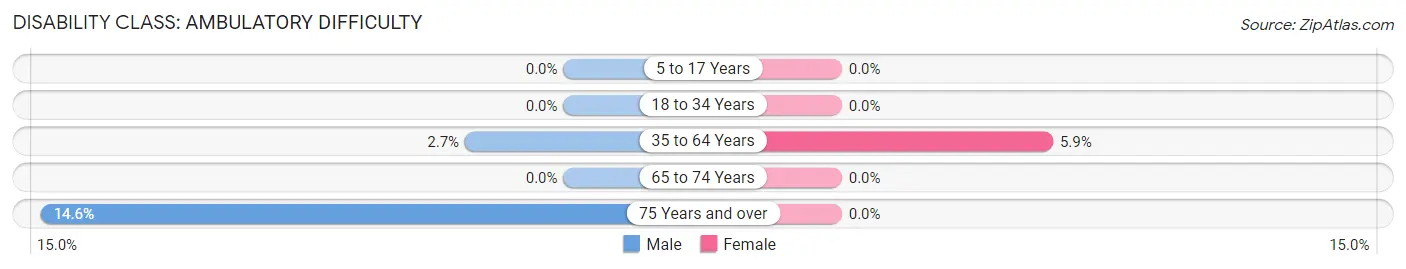
| Age Bracket | Male | Female |
| 5 to 17 Years | 0 (0.0%) | 0 (0.0%) |
| 18 to 34 Years | 0 (0.0%) | 0 (0.0%) |
| 35 to 64 Years | 9 (2.7%) | 19 (5.9%) |
| 65 to 74 Years | 0 (0.0%) | 0 (0.0%) |
| 75 Years and over | 8 (14.5%) | 0 (0.0%) |
Disability Class: Self-Care Difficulty
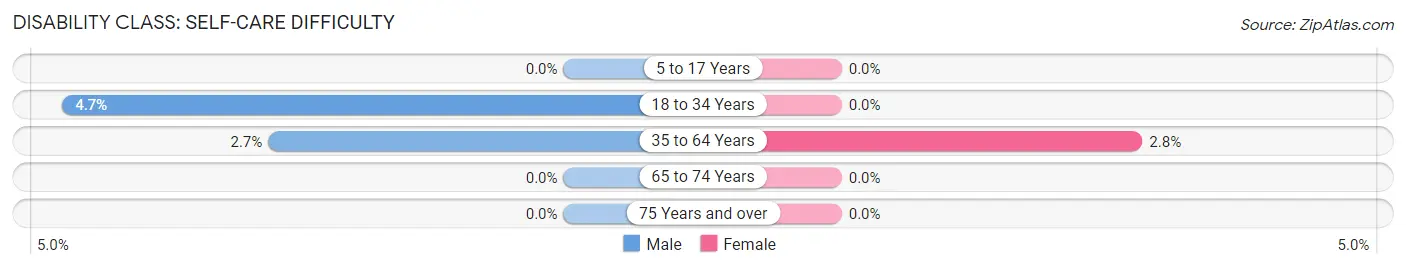
| Age Bracket | Male | Female |
| 5 to 17 Years | 0 (0.0%) | 0 (0.0%) |
| 18 to 34 Years | 8 (4.6%) | 0 (0.0%) |
| 35 to 64 Years | 9 (2.7%) | 9 (2.8%) |
| 65 to 74 Years | 0 (0.0%) | 0 (0.0%) |
| 75 Years and over | 0 (0.0%) | 0 (0.0%) |
Technology Access in Rome
Computing Device Access in Rome
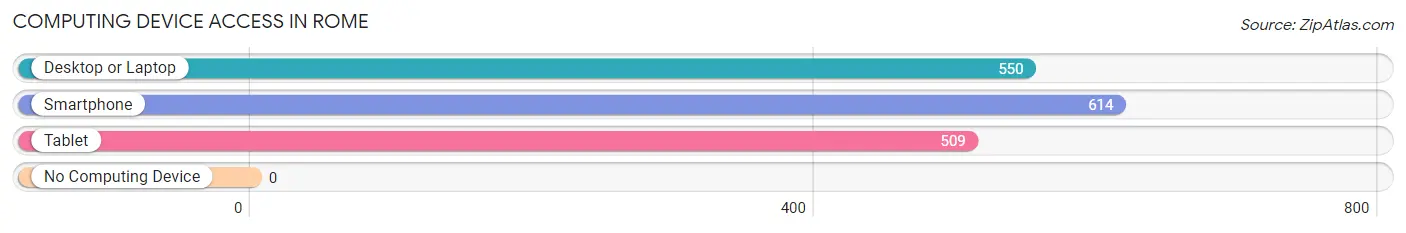
| Device Type | # Households | % Households |
| Desktop or Laptop | 550 | 83.5% |
| Smartphone | 614 | 93.2% |
| Tablet | 509 | 77.2% |
| No Computing Device | 0 | 0.0% |
| Total | 659 | 100.0% |
Internet Access in Rome
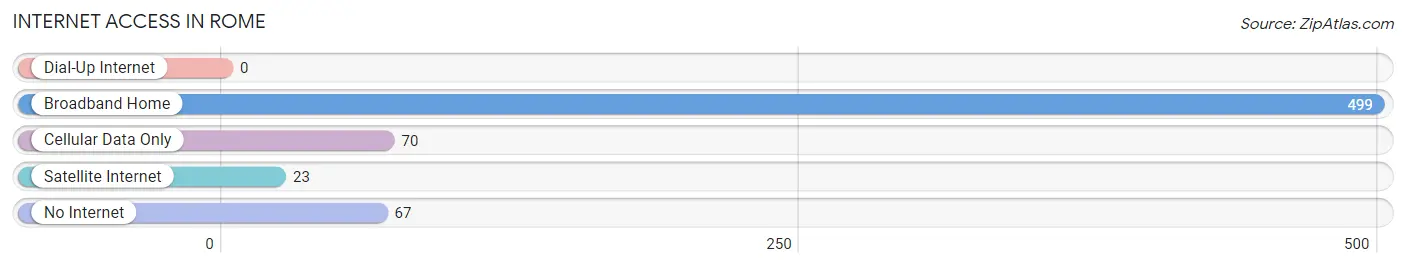
| Internet Type | # Households | % Households |
| Dial-Up Internet | 0 | 0.0% |
| Broadband Home | 499 | 75.7% |
| Cellular Data Only | 70 | 10.6% |
| Satellite Internet | 23 | 3.5% |
| No Internet | 67 | 10.2% |
| Total | 659 | 100.0% |
Rome Summary
Rome, Illinois is a small city located in the northern part of the state, in Kendall County. It is situated on the banks of the Fox River, and is part of the Chicago metropolitan area. The city has a population of approximately 8,000 people, and is known for its historic downtown area, which is home to a variety of shops, restaurants, and other businesses.
Geography
Rome is located in the northern part of Illinois, in Kendall County. It is situated on the banks of the Fox River, and is part of the Chicago metropolitan area. The city has a total area of 4.2 square miles, all of which is land. The terrain is mostly flat, with some rolling hills in the area. The climate is humid continental, with hot summers and cold winters.
History
Rome was first settled in 1834 by a group of settlers from New York. The city was named after the ancient city of Rome, and was incorporated in 1837. In the late 19th century, the city became a popular tourist destination, due to its proximity to Chicago. The city was also home to a number of factories, including a paper mill, a flour mill, and a brickyard.
In the early 20th century, the city experienced a period of growth, as new businesses and industries moved into the area. The city was also home to a number of notable figures, including the inventor of the electric light bulb, Thomas Edison.
Economy
Rome’s economy is largely based on manufacturing and agriculture. The city is home to a number of factories, including a paper mill, a flour mill, and a brickyard. The city is also home to a number of agricultural businesses, including dairy farms, grain elevators, and vegetable farms.
The city is also home to a number of retail businesses, including a variety of shops, restaurants, and other businesses. The city is also home to a number of medical facilities, including a hospital and a number of clinics.
Demographics
Rome has a population of approximately 8,000 people, according to the 2010 census. The population is largely white, with a small percentage of African Americans, Hispanics, and other ethnicities. The median household income is $50,000, and the median age is 38.
Conclusion
Rome, Illinois is a small city located in the northern part of the state, in Kendall County. It is situated on the banks of the Fox River, and is part of the Chicago metropolitan area. The city has a population of approximately 8,000 people, and is known for its historic downtown area, which is home to a variety of shops, restaurants, and other businesses. The city’s economy is largely based on manufacturing and agriculture, and the city is home to a number of retail businesses, medical facilities, and other businesses. The population is largely white, with a small percentage of African Americans, Hispanics, and other ethnicities.
Common Questions
What is Per Capita Income in Rome?
Per Capita income in Rome is $36,476.
What is the Median Family Income in Rome?
Median Family Income in Rome is $104,044.
What is the Median Household income in Rome?
Median Household Income in Rome is $83,533.
What is Income or Wage Gap in Rome?
Income or Wage Gap in Rome is 32.2%.
Women in Rome earn 67.8 cents for every dollar earned by a man.
What is Inequality or Gini Index in Rome?
Inequality or Gini Index in Rome is 0.32.
What is the Total Population of Rome?
Total Population of Rome is 1,605.
What is the Total Male Population of Rome?
Total Male Population of Rome is 867.
What is the Total Female Population of Rome?
Total Female Population of Rome is 738.
What is the Ratio of Males per 100 Females in Rome?
There are 117.48 Males per 100 Females in Rome.
What is the Ratio of Females per 100 Males in Rome?
There are 85.12 Females per 100 Males in Rome.
What is the Median Population Age in Rome?
Median Population Age in Rome is 41.1 Years.
What is the Average Family Size in Rome
Average Family Size in Rome is 3.2 People.
What is the Average Household Size in Rome
Average Household Size in Rome is 2.4 People.
How Large is the Labor Force in Rome?
There are 884 People in the Labor Forcein in Rome.
What is the Percentage of People in the Labor Force in Rome?
71.9% of People are in the Labor Force in Rome.