Zip Codes with the Highest Percentage of Population Employed in Computer, Engineering & Science in Arlington Heights, IL
RELATED REPORTS & OPTIONS
Computer, Engineering & Science
Arlington Heights
Compare Zip Codes
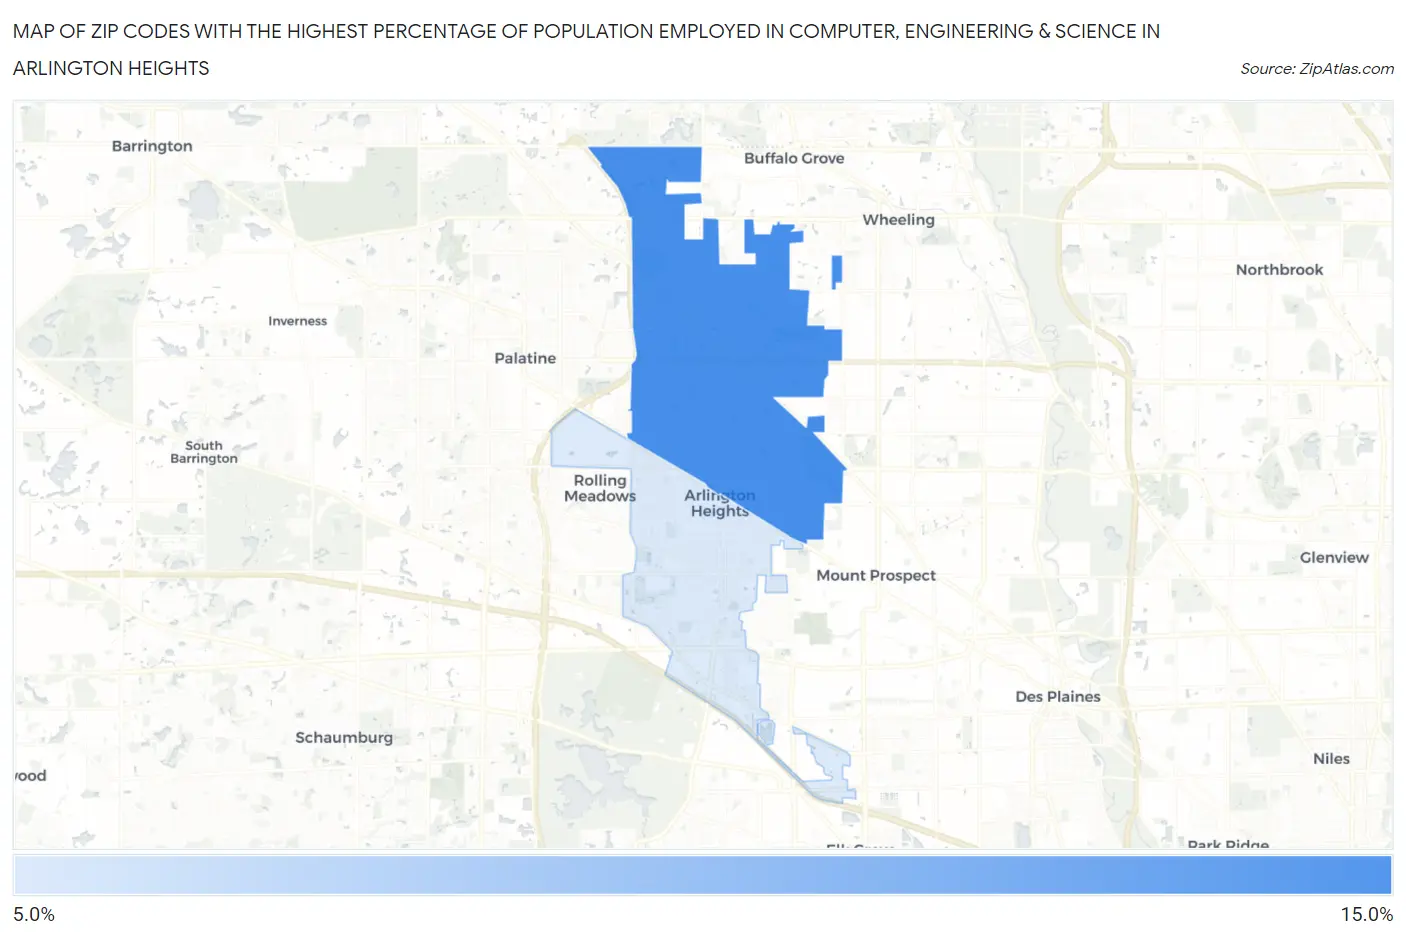
Map of Zip Codes with the Highest Percentage of Population Employed in Computer, Engineering & Science in Arlington Heights
10.8%
10.9%
Zip Codes with the Highest Percentage of Population Employed in Computer, Engineering & Science in Arlington Heights, IL
| Zip Code | % Employed | vs State | vs National | |
| 1. | 60004 | 10.9% | 6.4%(+4.51)#85 | 6.8%(+4.18)#2,606 |
| 2. | 60005 | 10.8% | 6.4%(+4.39)#87 | 6.8%(+4.06)#2,664 |
1
Common Questions
What are the Top Zip Codes with the Highest Percentage of Population Employed in Computer, Engineering & Science in Arlington Heights, IL?
Top Zip Codes with the Highest Percentage of Population Employed in Computer, Engineering & Science in Arlington Heights, IL are:
What zip code has the Highest Percentage of Population Employed in Computer, Engineering & Science in Arlington Heights, IL?
60004 has the Highest Percentage of Population Employed in Computer, Engineering & Science in Arlington Heights, IL with 10.9%.
What is the Percentage of Population Employed in Computer, Engineering & Science in Arlington Heights, IL?
Percentage of Population Employed in Computer, Engineering & Science in Arlington Heights is 11.4%.
What is the Percentage of Population Employed in Computer, Engineering & Science in Illinois?
Percentage of Population Employed in Computer, Engineering & Science in Illinois is 6.4%.
What is the Percentage of Population Employed in Computer, Engineering & Science in the United States?
Percentage of Population Employed in Computer, Engineering & Science in the United States is 6.8%.