Schaumburg, IL Map & Demographics
Schaumburg Map
Schaumburg Overview
$46,922
PER CAPITA INCOME
$108,109
AVG FAMILY INCOME
$92,818
AVG HOUSEHOLD INCOME
29.7%
WAGE / INCOME GAP [ % ]
70.3¢/ $1
WAGE / INCOME GAP [ $ ]
0.40
INEQUALITY / GINI INDEX
77,571
TOTAL POPULATION
38,289
MALE POPULATION
39,282
FEMALE POPULATION
97.47
MALES / 100 FEMALES
102.59
FEMALES / 100 MALES
39.0
MEDIAN AGE
3.1
AVG FAMILY SIZE
2.4
AVG HOUSEHOLD SIZE
42,855
LABOR FORCE [ PEOPLE ]
69.8%
PERCENT IN LABOR FORCE
3.9%
UNEMPLOYMENT RATE
Income in Schaumburg
Income Overview in Schaumburg
Per Capita Income in Schaumburg is $46,922, while median incomes of families and households are $108,109 and $92,818 respectively.
| Characteristic | Number | Measure |
| Per Capita Income | 77,571 | $46,922 |
| Median Family Income | 19,946 | $108,109 |
| Mean Family Income | 19,946 | $131,816 |
| Median Household Income | 31,977 | $92,818 |
| Mean Household Income | 31,977 | $112,254 |
| Income Deficit | 19,946 | $0 |
| Wage / Income Gap (%) | 77,571 | 29.74% |
| Wage / Income Gap ($) | 77,571 | 70.26¢ per $1 |
| Gini / Inequality Index | 77,571 | 0.40 |
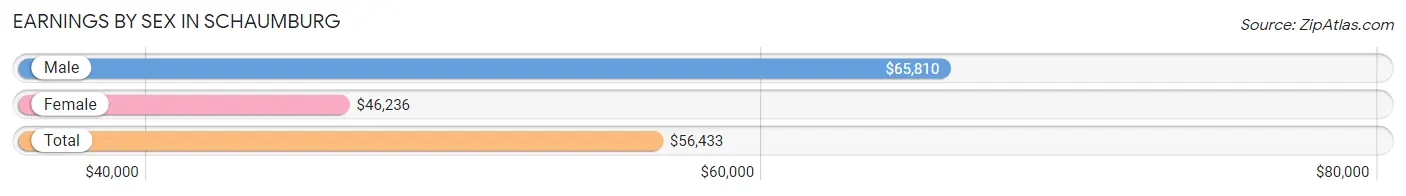
Earnings by Sex in Schaumburg
Average Earnings in Schaumburg are $56,433, $65,810 for men and $46,236 for women, a difference of 29.7%.
| Sex | Number | Average Earnings |
| Male | 23,239 (52.9%) | $65,810 |
| Female | 20,683 (47.1%) | $46,236 |
| Total | 43,922 (100.0%) | $56,433 |
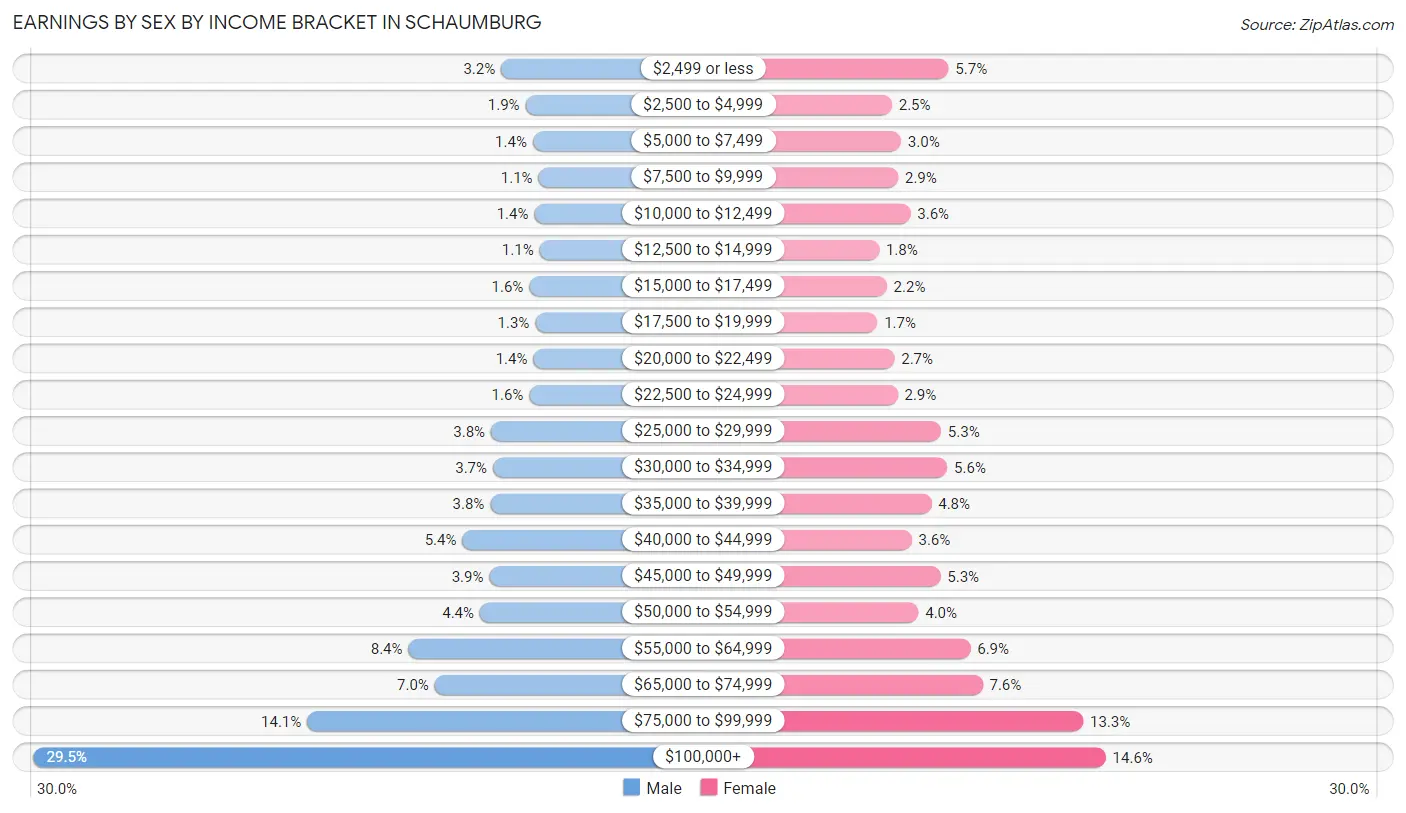
Earnings by Sex by Income Bracket in Schaumburg
The most common earnings brackets in Schaumburg are $100,000+ for men (6,854 | 29.5%) and $100,000+ for women (3,009 | 14.5%).
| Income | Male | Female |
| $2,499 or less | 748 (3.2%) | 1,180 (5.7%) |
| $2,500 to $4,999 | 429 (1.8%) | 523 (2.5%) |
| $5,000 to $7,499 | 334 (1.4%) | 629 (3.0%) |
| $7,500 to $9,999 | 260 (1.1%) | 595 (2.9%) |
| $10,000 to $12,499 | 314 (1.3%) | 739 (3.6%) |
| $12,500 to $14,999 | 246 (1.1%) | 375 (1.8%) |
| $15,000 to $17,499 | 381 (1.6%) | 463 (2.2%) |
| $17,500 to $19,999 | 302 (1.3%) | 354 (1.7%) |
| $20,000 to $22,499 | 327 (1.4%) | 552 (2.7%) |
| $22,500 to $24,999 | 381 (1.6%) | 590 (2.9%) |
| $25,000 to $29,999 | 881 (3.8%) | 1,095 (5.3%) |
| $30,000 to $34,999 | 856 (3.7%) | 1,166 (5.6%) |
| $35,000 to $39,999 | 890 (3.8%) | 983 (4.8%) |
| $40,000 to $44,999 | 1,255 (5.4%) | 752 (3.6%) |
| $45,000 to $49,999 | 902 (3.9%) | 1,088 (5.3%) |
| $50,000 to $54,999 | 1,024 (4.4%) | 831 (4.0%) |
| $55,000 to $64,999 | 1,959 (8.4%) | 1,435 (6.9%) |
| $65,000 to $74,999 | 1,614 (7.0%) | 1,578 (7.6%) |
| $75,000 to $99,999 | 3,282 (14.1%) | 2,746 (13.3%) |
| $100,000+ | 6,854 (29.5%) | 3,009 (14.5%) |
| Total | 23,239 (100.0%) | 20,683 (100.0%) |
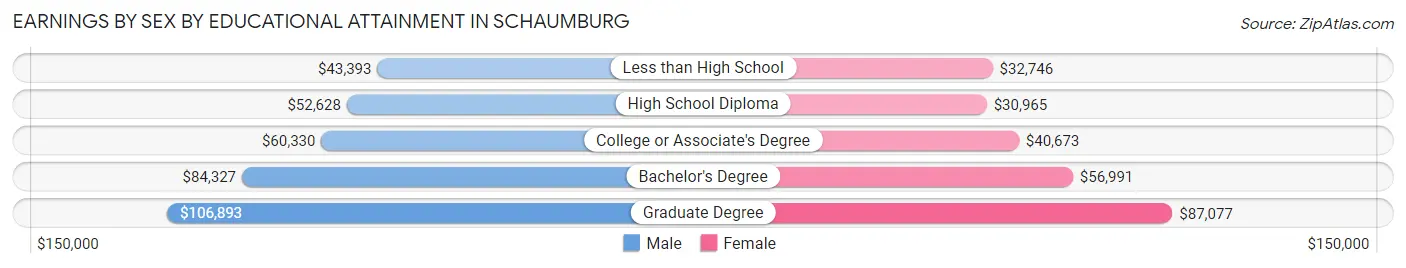
Earnings by Sex by Educational Attainment in Schaumburg
Average earnings in Schaumburg are $71,258 for men and $50,875 for women, a difference of 28.6%. Men with an educational attainment of graduate degree enjoy the highest average annual earnings of $106,893, while those with less than high school education earn the least with $43,393. Women with an educational attainment of graduate degree earn the most with the average annual earnings of $87,077, while those with high school diploma education have the smallest earnings of $30,965.
| Educational Attainment | Male Income | Female Income |
| Less than High School | $43,393 | $32,746 |
| High School Diploma | $52,628 | $30,965 |
| College or Associate's Degree | $60,330 | $40,673 |
| Bachelor's Degree | $84,327 | $56,991 |
| Graduate Degree | $106,893 | $87,077 |
| Total | $71,258 | $50,875 |
Family Income in Schaumburg
Family Income Brackets in Schaumburg
According to the Schaumburg family income data, there are 5,186 families falling into the $100,000 to $149,999 income range, which is the most common income bracket and makes up 26.0% of all families. Conversely, the $10,000 to $14,999 income bracket is the least frequent group with only 80 families (0.4%) belonging to this category.
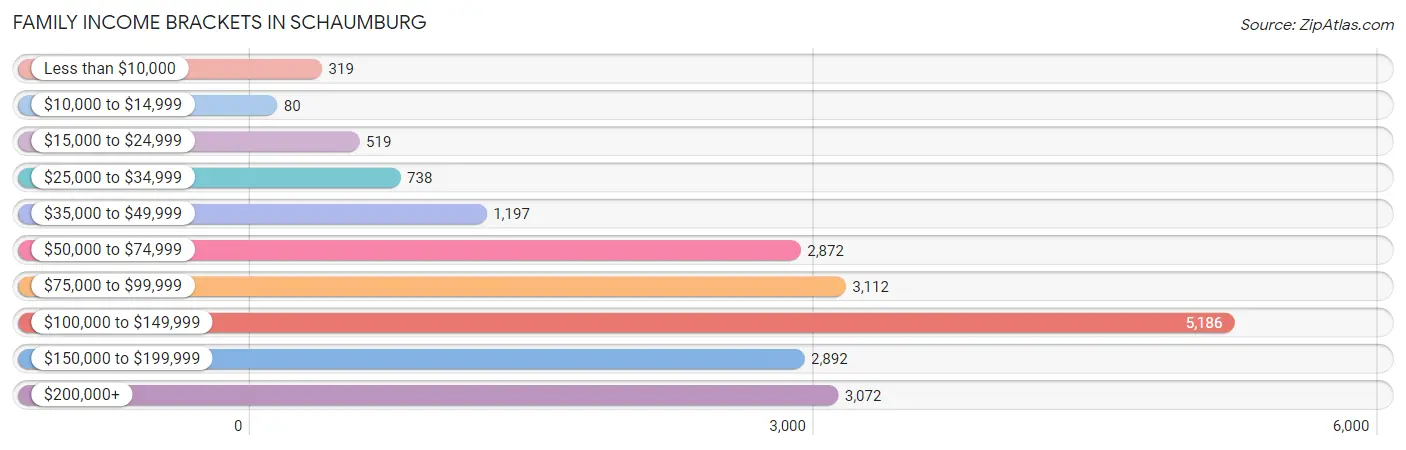
| Income Bracket | # Families | % Families |
| Less than $10,000 | 319 | 1.6% |
| $10,000 to $14,999 | 80 | 0.4% |
| $15,000 to $24,999 | 519 | 2.6% |
| $25,000 to $34,999 | 738 | 3.7% |
| $35,000 to $49,999 | 1,197 | 6.0% |
| $50,000 to $74,999 | 2,872 | 14.4% |
| $75,000 to $99,999 | 3,112 | 15.6% |
| $100,000 to $149,999 | 5,186 | 26.0% |
| $150,000 to $199,999 | 2,892 | 14.5% |
| $200,000+ | 3,072 | 15.4% |
Family Income by Famaliy Size in Schaumburg
6-person families (362 | 1.8%) account for the highest median family income in Schaumburg with $152,857 per family, while 2-person families (8,462 | 42.4%) have the highest median income of $47,346 per family member.
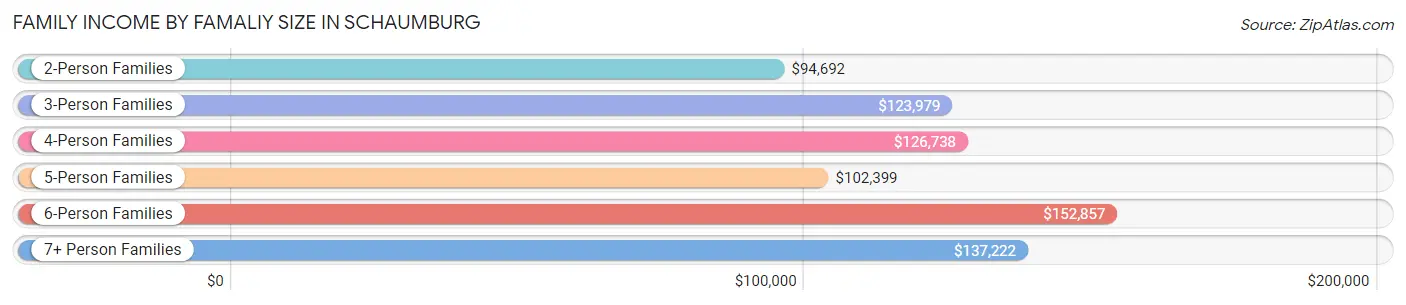
| Income Bracket | # Families | Median Income |
| 2-Person Families | 8,462 (42.4%) | $94,692 |
| 3-Person Families | 5,062 (25.4%) | $123,979 |
| 4-Person Families | 4,109 (20.6%) | $126,738 |
| 5-Person Families | 1,647 (8.3%) | $102,399 |
| 6-Person Families | 362 (1.8%) | $152,857 |
| 7+ Person Families | 304 (1.5%) | $137,222 |
| Total | 19,946 (100.0%) | $108,109 |
Family Income by Number of Earners in Schaumburg
The median family income in Schaumburg is $108,109, with families comprising 3+ earners (2,472) having the highest median family income of $154,000, while families with no earners (1,867) have the lowest median family income of $58,165, accounting for 12.4% and 9.4% of families, respectively.
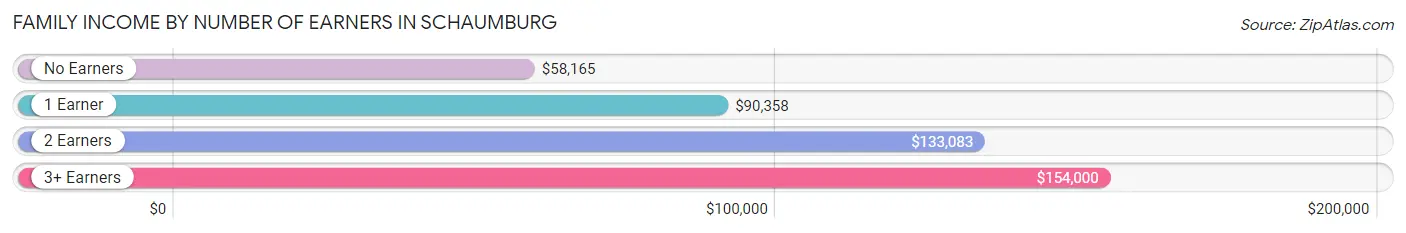
| Number of Earners | # Families | Median Income |
| No Earners | 1,867 (9.4%) | $58,165 |
| 1 Earner | 6,457 (32.4%) | $90,358 |
| 2 Earners | 9,150 (45.9%) | $133,083 |
| 3+ Earners | 2,472 (12.4%) | $154,000 |
| Total | 19,946 (100.0%) | $108,109 |
Household Income in Schaumburg
Household Income Brackets in Schaumburg
With 7,579 households falling in the category, the $100,000 to $149,999 income range is the most frequent in Schaumburg, accounting for 23.7% of all households. In contrast, only 544 households (1.7%) fall into the $10,000 to $14,999 income bracket, making it the least populous group.
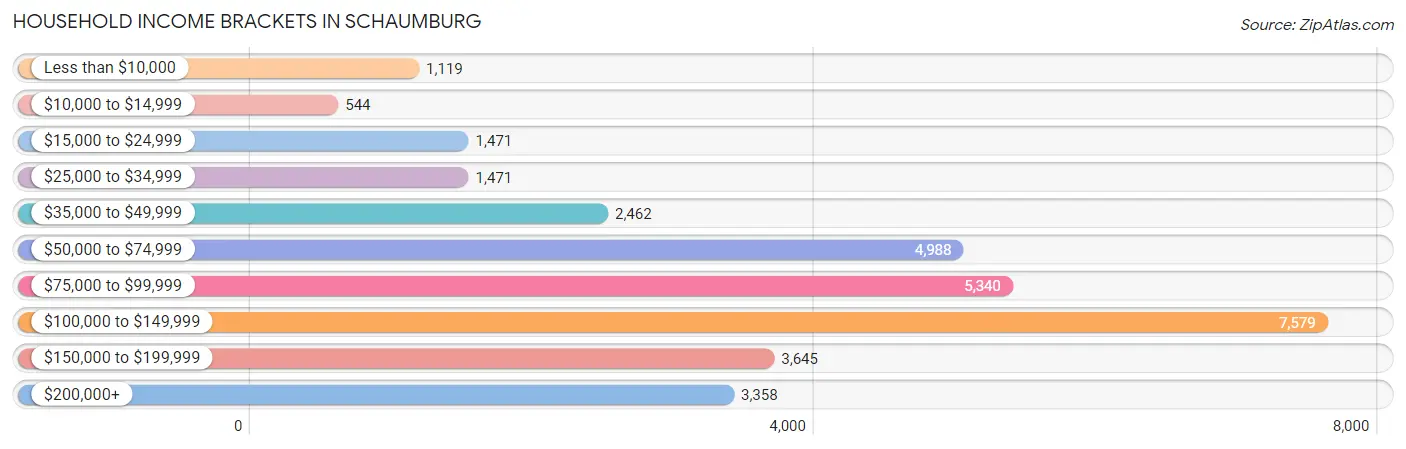
| Income Bracket | # Households | % Households |
| Less than $10,000 | 1,119 | 3.5% |
| $10,000 to $14,999 | 544 | 1.7% |
| $15,000 to $24,999 | 1,471 | 4.6% |
| $25,000 to $34,999 | 1,471 | 4.6% |
| $35,000 to $49,999 | 2,462 | 7.7% |
| $50,000 to $74,999 | 4,988 | 15.6% |
| $75,000 to $99,999 | 5,340 | 16.7% |
| $100,000 to $149,999 | 7,579 | 23.7% |
| $150,000 to $199,999 | 3,645 | 11.4% |
| $200,000+ | 3,358 | 10.5% |
Household Income by Householder Age in Schaumburg
The median household income in Schaumburg is $92,818, with the highest median household income of $104,365 found in the 45 to 64 years age bracket for the primary householder. A total of 11,528 households (36.0%) fall into this category. Meanwhile, the 65+ years age bracket for the primary householder has the lowest median household income of $64,243, with 7,195 households (22.5%) in this group.
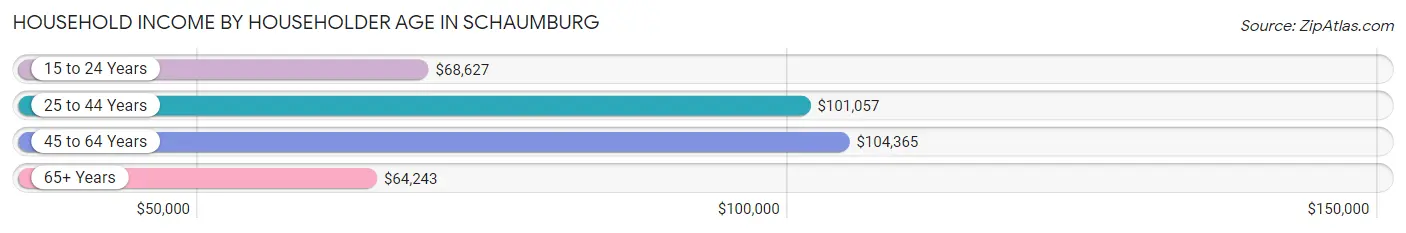
| Income Bracket | # Households | Median Income |
| 15 to 24 Years | 881 (2.8%) | $68,627 |
| 25 to 44 Years | 12,373 (38.7%) | $101,057 |
| 45 to 64 Years | 11,528 (36.0%) | $104,365 |
| 65+ Years | 7,195 (22.5%) | $64,243 |
| Total | 31,977 (100.0%) | $92,818 |
Poverty in Schaumburg
Income Below Poverty by Sex and Age in Schaumburg
With 5.1% poverty level for males and 7.3% for females among the residents of Schaumburg, 12 to 14 year old males and 15 year old females are the most vulnerable to poverty, with 131 males (9.1%) and 96 females (19.5%) in their respective age groups living below the poverty level.
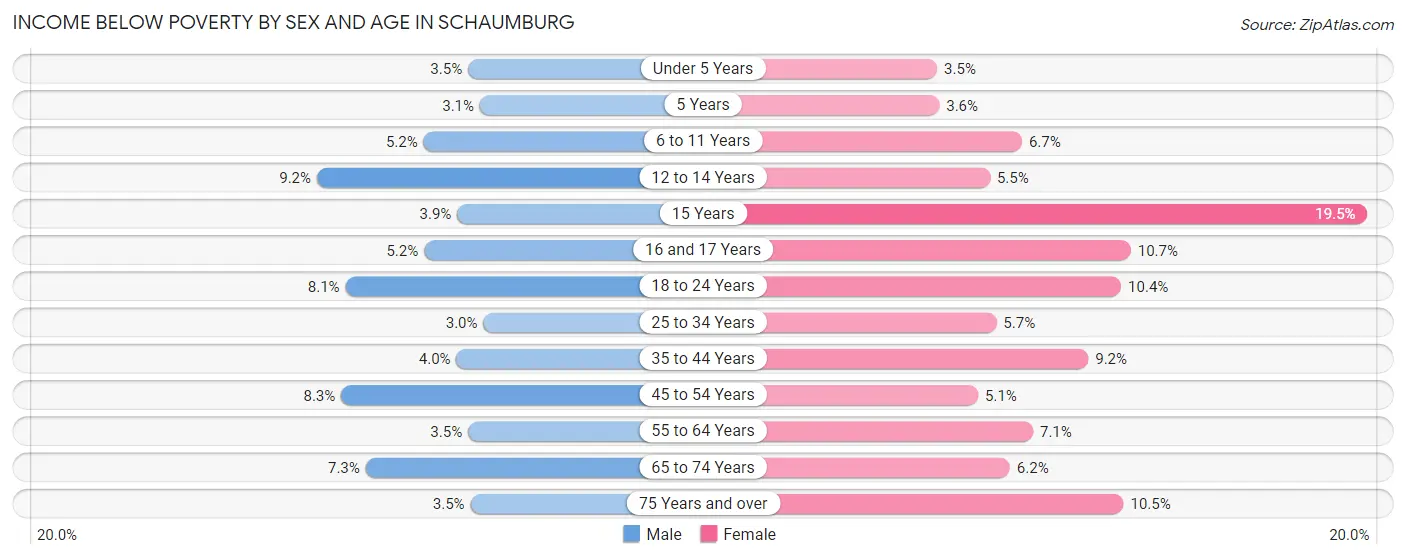
| Age Bracket | Male | Female |
| Under 5 Years | 92 (3.5%) | 78 (3.5%) |
| 5 Years | 13 (3.1%) | 23 (3.6%) |
| 6 to 11 Years | 201 (5.2%) | 185 (6.7%) |
| 12 to 14 Years | 131 (9.1%) | 68 (5.5%) |
| 15 Years | 20 (3.9%) | 96 (19.5%) |
| 16 and 17 Years | 35 (5.2%) | 112 (10.7%) |
| 18 to 24 Years | 209 (8.1%) | 255 (10.4%) |
| 25 to 34 Years | 157 (3.0%) | 321 (5.7%) |
| 35 to 44 Years | 251 (4.0%) | 561 (9.1%) |
| 45 to 54 Years | 404 (8.3%) | 224 (5.1%) |
| 55 to 64 Years | 163 (3.5%) | 374 (7.1%) |
| 65 to 74 Years | 216 (7.3%) | 222 (6.2%) |
| 75 Years and over | 72 (3.5%) | 326 (10.5%) |
| Total | 1,964 (5.1%) | 2,845 (7.3%) |
Income Above Poverty by Sex and Age in Schaumburg
According to the poverty statistics in Schaumburg, males aged 25 to 34 years and females aged under 5 years are the age groups that are most secure financially, with 97.0% of males and 96.5% of females in these age groups living above the poverty line.
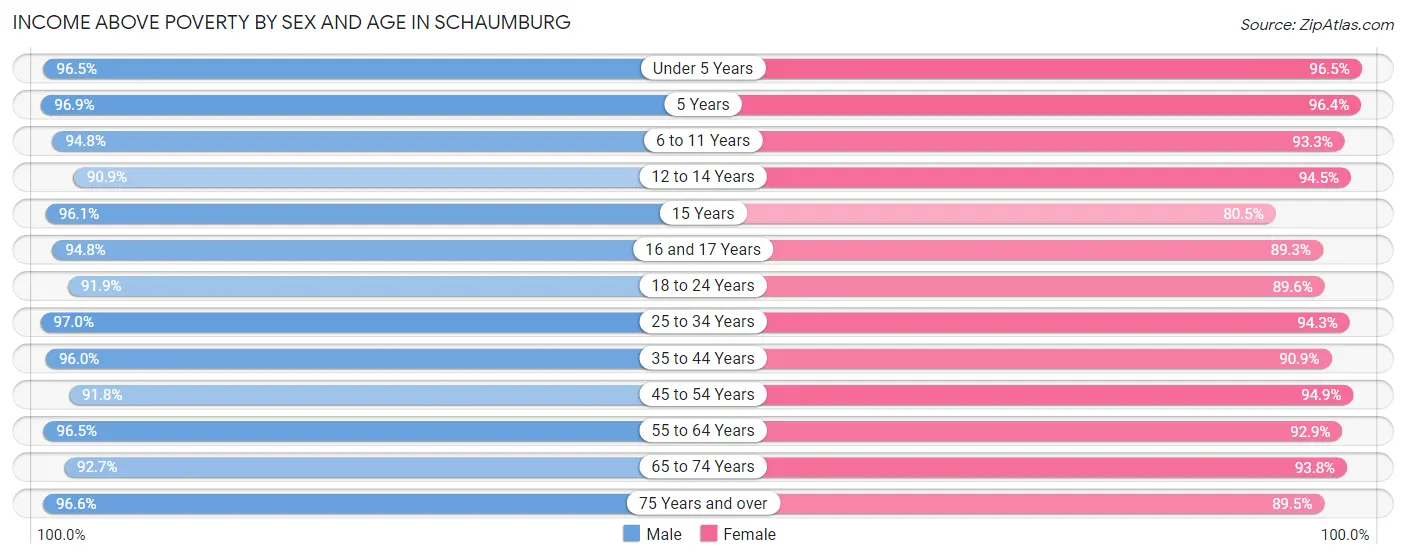
| Age Bracket | Male | Female |
| Under 5 Years | 2,506 (96.5%) | 2,128 (96.5%) |
| 5 Years | 406 (96.9%) | 612 (96.4%) |
| 6 to 11 Years | 3,672 (94.8%) | 2,582 (93.3%) |
| 12 to 14 Years | 1,301 (90.8%) | 1,168 (94.5%) |
| 15 Years | 488 (96.1%) | 396 (80.5%) |
| 16 and 17 Years | 642 (94.8%) | 932 (89.3%) |
| 18 to 24 Years | 2,375 (91.9%) | 2,205 (89.6%) |
| 25 to 34 Years | 5,126 (97.0%) | 5,269 (94.3%) |
| 35 to 44 Years | 6,077 (96.0%) | 5,568 (90.8%) |
| 45 to 54 Years | 4,494 (91.7%) | 4,203 (94.9%) |
| 55 to 64 Years | 4,441 (96.5%) | 4,894 (92.9%) |
| 65 to 74 Years | 2,728 (92.7%) | 3,337 (93.8%) |
| 75 Years and over | 2,014 (96.6%) | 2,790 (89.5%) |
| Total | 36,270 (94.9%) | 36,084 (92.7%) |
Income Below Poverty Among Married-Couple Families in Schaumburg
The poverty statistics for married-couple families in Schaumburg show that 4.1% or 653 of the total 15,985 families live below the poverty line. Families with 5 or more children have the highest poverty rate of 8.6%, comprising of 8 families. On the other hand, families with 3 or 4 children have the lowest poverty rate of 2.4%, which includes 22 families.
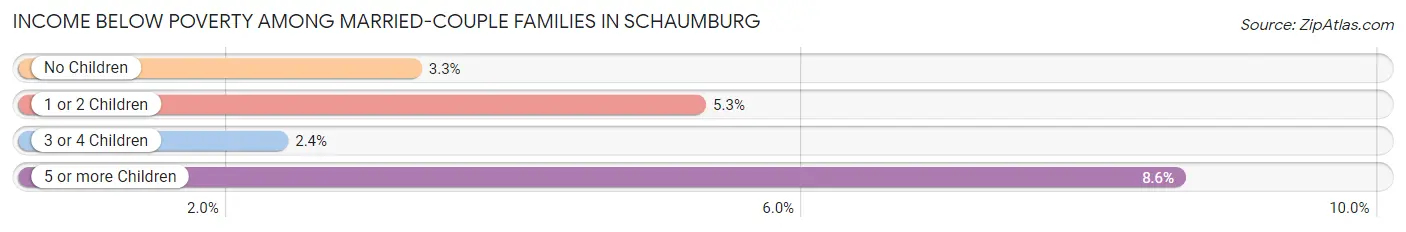
| Children | Above Poverty | Below Poverty |
| No Children | 8,011 (96.7%) | 272 (3.3%) |
| 1 or 2 Children | 6,323 (94.7%) | 351 (5.3%) |
| 3 or 4 Children | 913 (97.7%) | 22 (2.4%) |
| 5 or more Children | 85 (91.4%) | 8 (8.6%) |
| Total | 15,332 (95.9%) | 653 (4.1%) |
Income Below Poverty Among Single-Parent Households in Schaumburg
According to the poverty data in Schaumburg, 3.2% or 36 single-father households and 7.3% or 208 single-mother households are living below the poverty line. Among single-father households, those with no children have the highest poverty rate, with 36 households (5.1%) experiencing poverty. Likewise, among single-mother households, those with 3 or 4 children have the highest poverty rate, with 80 households (26.1%) falling below the poverty line.
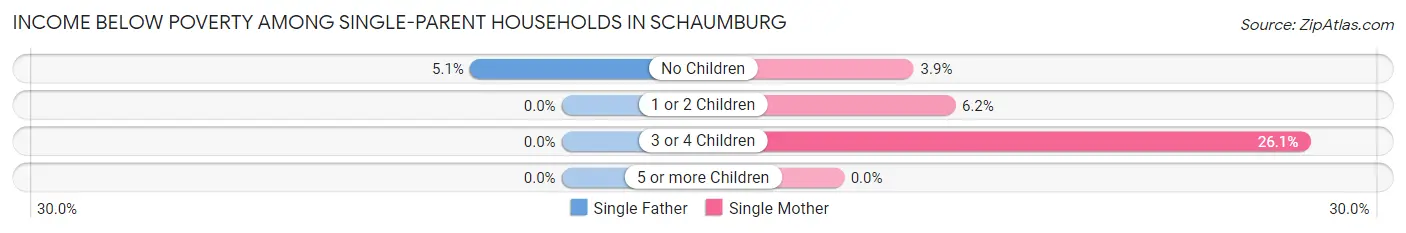
| Children | Single Father | Single Mother |
| No Children | 36 (5.1%) | 50 (3.9%) |
| 1 or 2 Children | 0 (0.0%) | 78 (6.2%) |
| 3 or 4 Children | 0 (0.0%) | 80 (26.1%) |
| 5 or more Children | 0 (0.0%) | 0 (0.0%) |
| Total | 36 (3.2%) | 208 (7.3%) |
Income Below Poverty Among Married-Couple vs Single-Parent Households in Schaumburg
The poverty data for Schaumburg shows that 653 of the married-couple family households (4.1%) and 244 of the single-parent households (6.2%) are living below the poverty level. Within the married-couple family households, those with 5 or more children have the highest poverty rate, with 8 households (8.6%) falling below the poverty line. Among the single-parent households, those with 3 or 4 children have the highest poverty rate, with 80 household (19.7%) living below poverty.
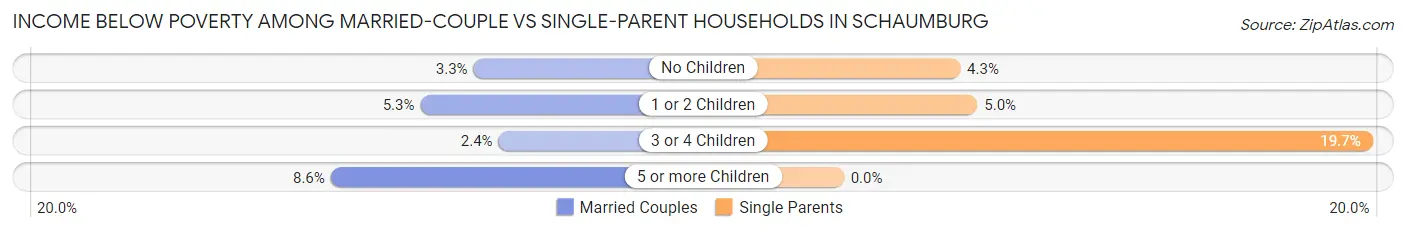
| Children | Married-Couple Families | Single-Parent Households |
| No Children | 272 (3.3%) | 86 (4.3%) |
| 1 or 2 Children | 351 (5.3%) | 78 (5.0%) |
| 3 or 4 Children | 22 (2.4%) | 80 (19.7%) |
| 5 or more Children | 8 (8.6%) | 0 (0.0%) |
| Total | 653 (4.1%) | 244 (6.2%) |
Race in Schaumburg
The most populous races in Schaumburg are White / Caucasian (44,163 | 56.9%), Asian (19,052 | 24.6%), and Hispanic or Latino (9,052 | 11.7%).
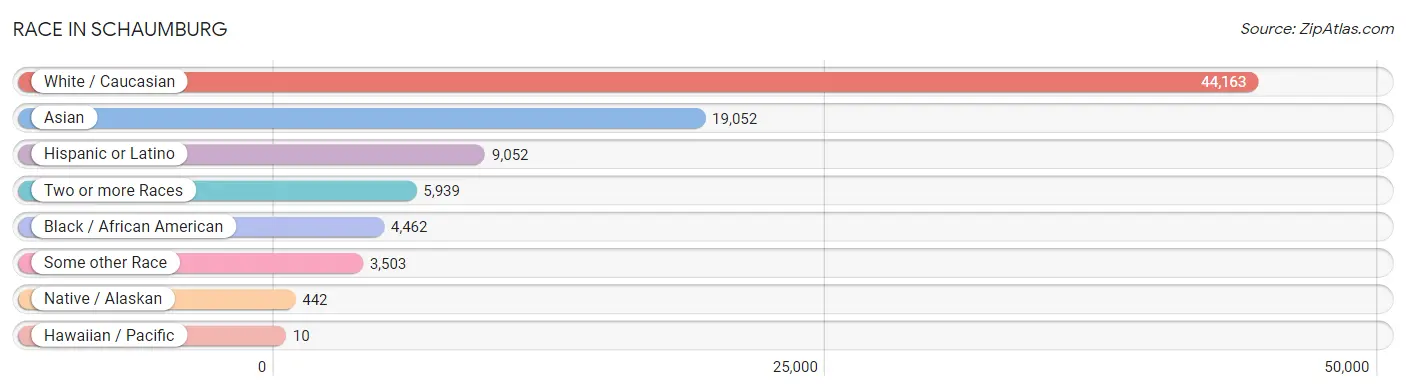
| Race | # Population | % Population |
| Asian | 19,052 | 24.6% |
| Black / African American | 4,462 | 5.8% |
| Hawaiian / Pacific | 10 | 0.0% |
| Hispanic or Latino | 9,052 | 11.7% |
| Native / Alaskan | 442 | 0.6% |
| White / Caucasian | 44,163 | 56.9% |
| Two or more Races | 5,939 | 7.7% |
| Some other Race | 3,503 | 4.5% |
| Total | 77,571 | 100.0% |
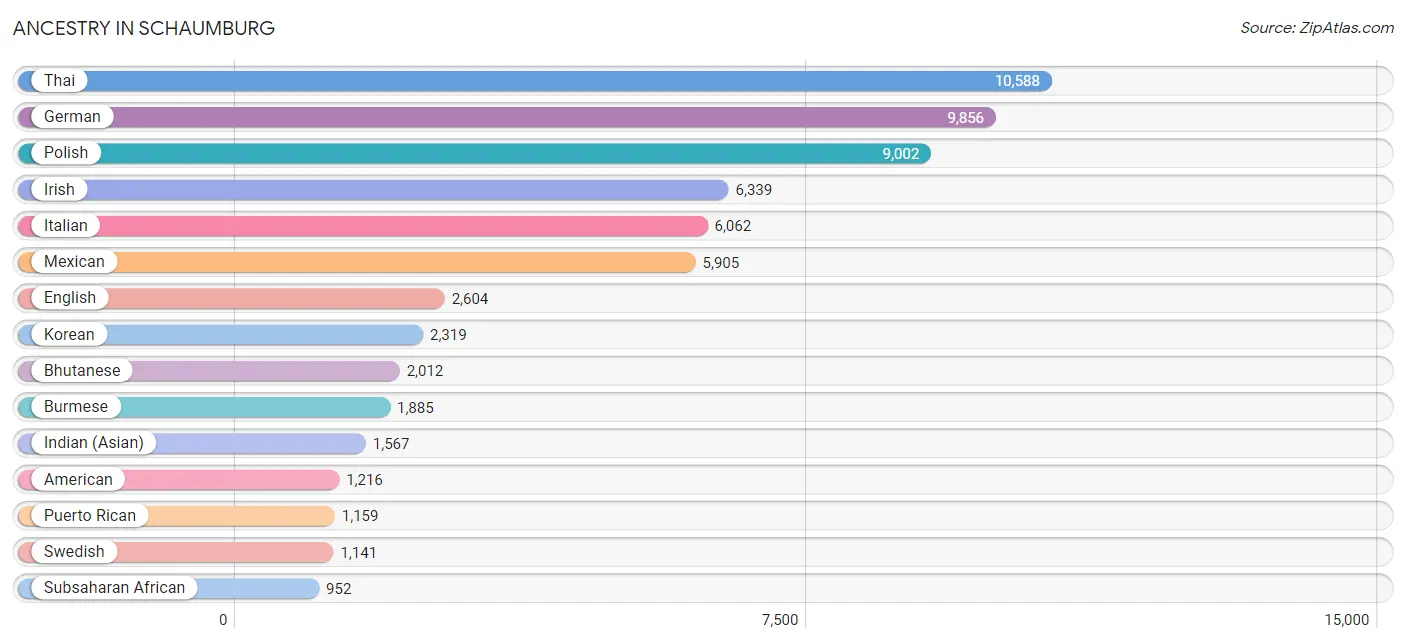
Ancestry in Schaumburg
The most populous ancestries reported in Schaumburg are Thai (10,588 | 13.7%), German (9,856 | 12.7%), Polish (9,002 | 11.6%), Irish (6,339 | 8.2%), and Italian (6,062 | 7.8%), together accounting for 53.9% of all Schaumburg residents.
| Ancestry | # Population | % Population |
| Afghan | 37 | 0.1% |
| African | 75 | 0.1% |
| Albanian | 143 | 0.2% |
| Alsatian | 30 | 0.0% |
| American | 1,216 | 1.6% |
| Arab | 393 | 0.5% |
| Argentinean | 56 | 0.1% |
| Armenian | 91 | 0.1% |
| Assyrian / Chaldean / Syriac | 98 | 0.1% |
| Australian | 12 | 0.0% |
| Austrian | 138 | 0.2% |
| Bangladeshi | 8 | 0.0% |
| Belgian | 100 | 0.1% |
| Bhutanese | 2,012 | 2.6% |
| Blackfeet | 26 | 0.0% |
| Brazilian | 278 | 0.4% |
| British | 215 | 0.3% |
| Bulgarian | 794 | 1.0% |
| Burmese | 1,885 | 2.4% |
| Cambodian | 192 | 0.3% |
| Canadian | 22 | 0.0% |
| Celtic | 6 | 0.0% |
| Central American | 426 | 0.5% |
| Central American Indian | 142 | 0.2% |
| Cherokee | 107 | 0.1% |
| Chilean | 40 | 0.1% |
| Chippewa | 4 | 0.0% |
| Choctaw | 12 | 0.0% |
| Colombian | 169 | 0.2% |
| Croatian | 428 | 0.5% |
| Crow | 21 | 0.0% |
| Cuban | 389 | 0.5% |
| Czech | 705 | 0.9% |
| Czechoslovakian | 103 | 0.1% |
| Danish | 341 | 0.4% |
| Dominican | 38 | 0.1% |
| Dutch | 488 | 0.6% |
| Eastern European | 144 | 0.2% |
| Ecuadorian | 111 | 0.1% |
| English | 2,604 | 3.4% |
| Ethiopian | 67 | 0.1% |
| European | 688 | 0.9% |
| Filipino | 101 | 0.1% |
| Finnish | 80 | 0.1% |
| French | 659 | 0.9% |
| French Canadian | 101 | 0.1% |
| German | 9,856 | 12.7% |
| Ghanaian | 27 | 0.0% |
| Greek | 757 | 1.0% |
| Guamanian / Chamorro | 6 | 0.0% |
| Guatemalan | 177 | 0.2% |
| Honduran | 84 | 0.1% |
| Hungarian | 275 | 0.4% |
| Indian (Asian) | 1,567 | 2.0% |
| Iranian | 112 | 0.1% |
| Iraqi | 49 | 0.1% |
| Irish | 6,339 | 8.2% |
| Iroquois | 11 | 0.0% |
| Israeli | 13 | 0.0% |
| Italian | 6,062 | 7.8% |
| Jamaican | 348 | 0.4% |
| Japanese | 89 | 0.1% |
| Jordanian | 164 | 0.2% |
| Korean | 2,319 | 3.0% |
| Laotian | 53 | 0.1% |
| Lithuanian | 418 | 0.5% |
| Luxembourger | 19 | 0.0% |
| Macedonian | 149 | 0.2% |
| Malaysian | 58 | 0.1% |
| Mexican | 5,905 | 7.6% |
| Mexican American Indian | 156 | 0.2% |
| Mongolian | 102 | 0.1% |
| Moroccan | 60 | 0.1% |
| Native Hawaiian | 4 | 0.0% |
| Navajo | 31 | 0.0% |
| Nicaraguan | 42 | 0.1% |
| Nigerian | 217 | 0.3% |
| Northern European | 47 | 0.1% |
| Norwegian | 888 | 1.1% |
| Pakistani | 49 | 0.1% |
| Palestinian | 159 | 0.2% |
| Peruvian | 170 | 0.2% |
| Polish | 9,002 | 11.6% |
| Portuguese | 163 | 0.2% |
| Pueblo | 10 | 0.0% |
| Puerto Rican | 1,159 | 1.5% |
| Romanian | 632 | 0.8% |
| Russian | 594 | 0.8% |
| Salvadoran | 123 | 0.2% |
| Scandinavian | 169 | 0.2% |
| Scotch-Irish | 200 | 0.3% |
| Scottish | 602 | 0.8% |
| Serbian | 206 | 0.3% |
| Sioux | 6 | 0.0% |
| Slavic | 31 | 0.0% |
| Slovak | 200 | 0.3% |
| Somali | 134 | 0.2% |
| South African | 362 | 0.5% |
| South American | 745 | 1.0% |
| Spaniard | 250 | 0.3% |
| Spanish | 91 | 0.1% |
| Sri Lankan | 74 | 0.1% |
| Subsaharan African | 952 | 1.2% |
| Swedish | 1,141 | 1.5% |
| Swiss | 109 | 0.1% |
| Syrian | 9 | 0.0% |
| Thai | 10,588 | 13.7% |
| Turkish | 299 | 0.4% |
| Ugandan | 44 | 0.1% |
| Ukrainian | 521 | 0.7% |
| Venezuelan | 199 | 0.3% |
| Vietnamese | 7 | 0.0% |
| Welsh | 208 | 0.3% |
| Yugoslavian | 371 | 0.5% | View All 114 Rows |
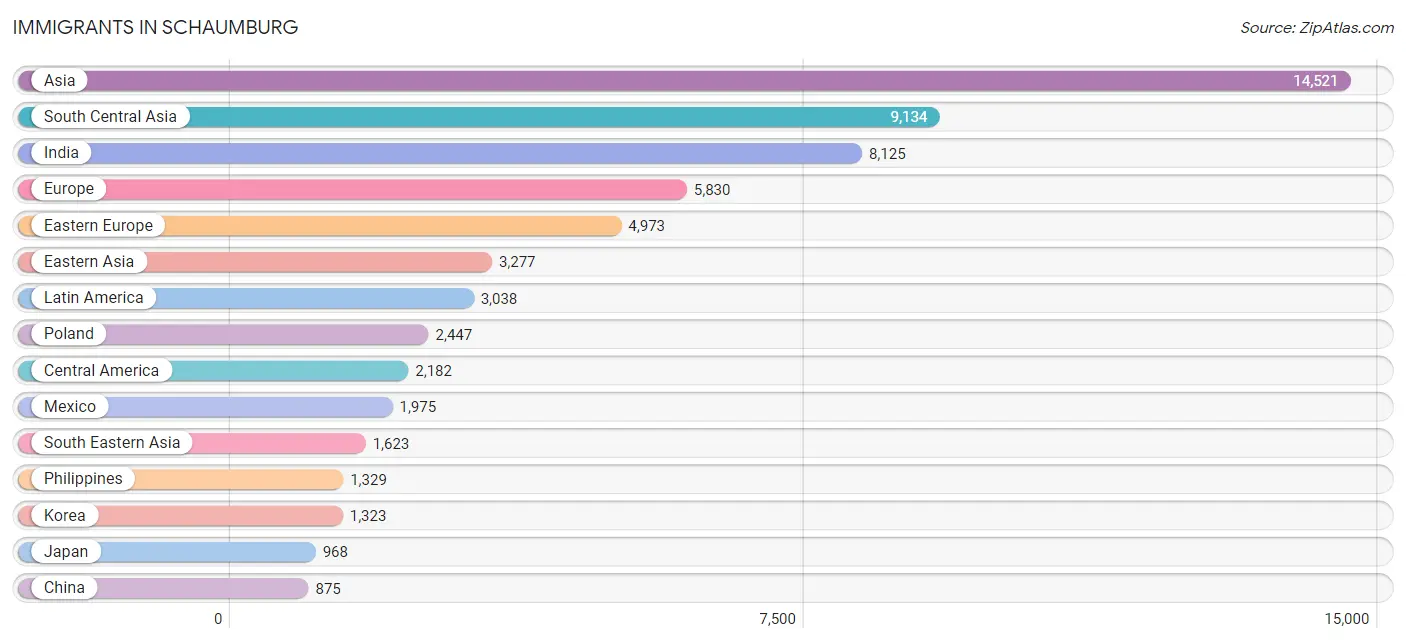
Immigrants in Schaumburg
The most numerous immigrant groups reported in Schaumburg came from Asia (14,521 | 18.7%), South Central Asia (9,134 | 11.8%), India (8,125 | 10.5%), Europe (5,830 | 7.5%), and Eastern Europe (4,973 | 6.4%), together accounting for 54.9% of all Schaumburg residents.
| Immigration Origin | # Population | % Population |
| Afghanistan | 44 | 0.1% |
| Africa | 792 | 1.0% |
| Albania | 122 | 0.2% |
| Argentina | 32 | 0.0% |
| Armenia | 24 | 0.0% |
| Asia | 14,521 | 18.7% |
| Australia | 32 | 0.0% |
| Bangladesh | 21 | 0.0% |
| Belarus | 23 | 0.0% |
| Belgium | 20 | 0.0% |
| Bosnia and Herzegovina | 267 | 0.3% |
| Brazil | 306 | 0.4% |
| Bulgaria | 615 | 0.8% |
| Cambodia | 53 | 0.1% |
| Canada | 134 | 0.2% |
| Caribbean | 181 | 0.2% |
| Central America | 2,182 | 2.8% |
| Chile | 19 | 0.0% |
| China | 875 | 1.1% |
| Colombia | 58 | 0.1% |
| Croatia | 12 | 0.0% |
| Cuba | 57 | 0.1% |
| Czechoslovakia | 22 | 0.0% |
| Dominican Republic | 18 | 0.0% |
| Eastern Africa | 309 | 0.4% |
| Eastern Asia | 3,277 | 4.2% |
| Eastern Europe | 4,973 | 6.4% |
| Ecuador | 22 | 0.0% |
| Egypt | 10 | 0.0% |
| England | 70 | 0.1% |
| Ethiopia | 35 | 0.1% |
| Europe | 5,830 | 7.5% |
| France | 14 | 0.0% |
| Germany | 207 | 0.3% |
| Greece | 99 | 0.1% |
| Guatemala | 74 | 0.1% |
| Haiti | 10 | 0.0% |
| Honduras | 110 | 0.1% |
| Hong Kong | 108 | 0.1% |
| India | 8,125 | 10.5% |
| Indonesia | 27 | 0.0% |
| Iran | 44 | 0.1% |
| Iraq | 52 | 0.1% |
| Ireland | 22 | 0.0% |
| Israel | 13 | 0.0% |
| Italy | 124 | 0.2% |
| Jamaica | 96 | 0.1% |
| Japan | 968 | 1.3% |
| Jordan | 12 | 0.0% |
| Kazakhstan | 191 | 0.3% |
| Kenya | 40 | 0.1% |
| Korea | 1,323 | 1.7% |
| Laos | 8 | 0.0% |
| Latin America | 3,038 | 3.9% |
| Lithuania | 81 | 0.1% |
| Malaysia | 52 | 0.1% |
| Mexico | 1,975 | 2.5% |
| Middle Africa | 39 | 0.1% |
| Moldova | 204 | 0.3% |
| Morocco | 20 | 0.0% |
| Nepal | 73 | 0.1% |
| Netherlands | 9 | 0.0% |
| Nicaragua | 23 | 0.0% |
| Nigeria | 125 | 0.2% |
| North Macedonia | 84 | 0.1% |
| Northern Africa | 41 | 0.1% |
| Northern Europe | 217 | 0.3% |
| Norway | 7 | 0.0% |
| Oceania | 32 | 0.0% |
| Pakistan | 582 | 0.7% |
| Peru | 109 | 0.1% |
| Philippines | 1,329 | 1.7% |
| Poland | 2,447 | 3.2% |
| Portugal | 49 | 0.1% |
| Romania | 232 | 0.3% |
| Russia | 141 | 0.2% |
| Saudi Arabia | 17 | 0.0% |
| Scotland | 27 | 0.0% |
| Serbia | 49 | 0.1% |
| Singapore | 6 | 0.0% |
| Somalia | 83 | 0.1% |
| South Africa | 268 | 0.4% |
| South America | 675 | 0.9% |
| South Central Asia | 9,134 | 11.8% |
| South Eastern Asia | 1,623 | 2.1% |
| Southern Europe | 390 | 0.5% |
| Spain | 113 | 0.2% |
| Sweden | 8 | 0.0% |
| Syria | 28 | 0.0% |
| Taiwan | 87 | 0.1% |
| Thailand | 18 | 0.0% |
| Turkey | 328 | 0.4% |
| Uganda | 70 | 0.1% |
| Ukraine | 526 | 0.7% |
| Uzbekistan | 22 | 0.0% |
| Venezuela | 129 | 0.2% |
| Vietnam | 130 | 0.2% |
| Western Africa | 125 | 0.2% |
| Western Asia | 487 | 0.6% |
| Western Europe | 250 | 0.3% | View All 100 Rows |
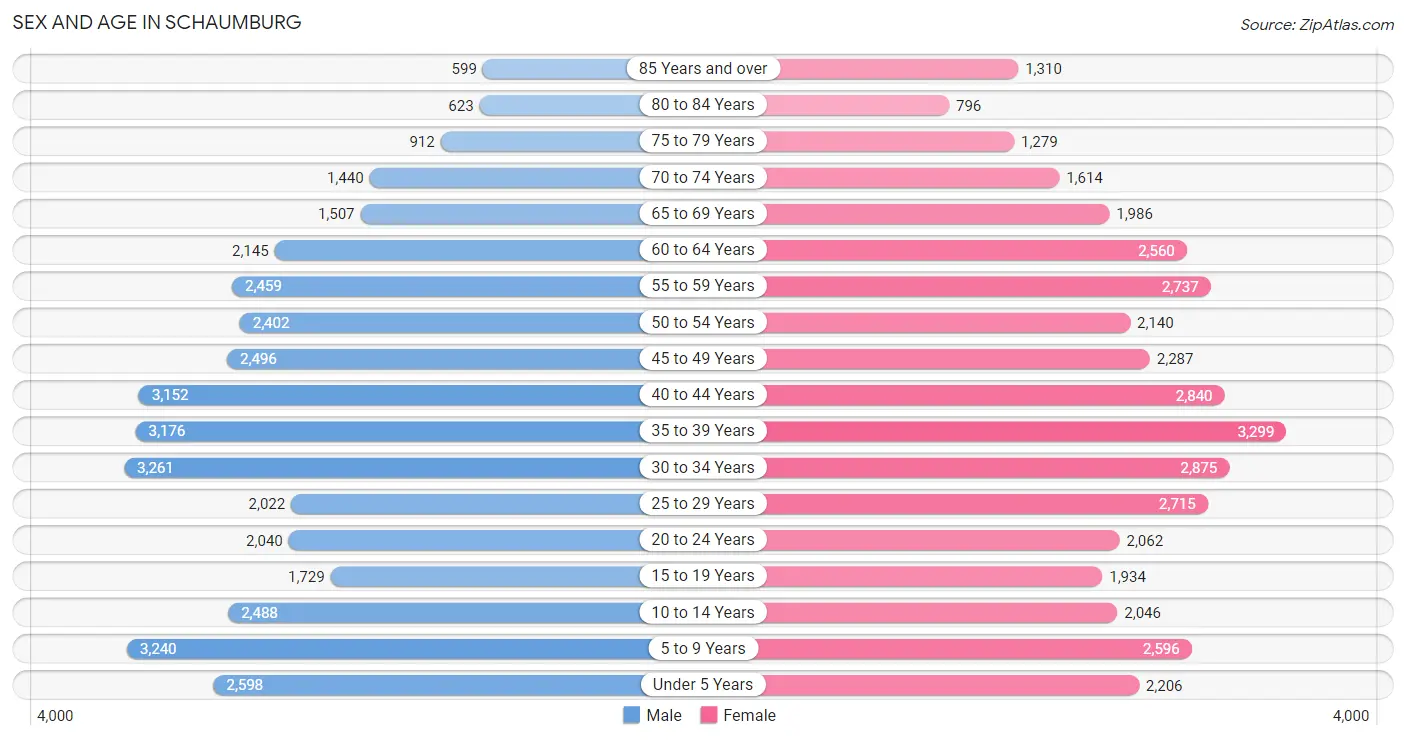
Sex and Age in Schaumburg
Sex and Age in Schaumburg
The most populous age groups in Schaumburg are 30 to 34 Years (3,261 | 8.5%) for men and 35 to 39 Years (3,299 | 8.4%) for women.
| Age Bracket | Male | Female |
| Under 5 Years | 2,598 (6.8%) | 2,206 (5.6%) |
| 5 to 9 Years | 3,240 (8.5%) | 2,596 (6.6%) |
| 10 to 14 Years | 2,488 (6.5%) | 2,046 (5.2%) |
| 15 to 19 Years | 1,729 (4.5%) | 1,934 (4.9%) |
| 20 to 24 Years | 2,040 (5.3%) | 2,062 (5.2%) |
| 25 to 29 Years | 2,022 (5.3%) | 2,715 (6.9%) |
| 30 to 34 Years | 3,261 (8.5%) | 2,875 (7.3%) |
| 35 to 39 Years | 3,176 (8.3%) | 3,299 (8.4%) |
| 40 to 44 Years | 3,152 (8.2%) | 2,840 (7.2%) |
| 45 to 49 Years | 2,496 (6.5%) | 2,287 (5.8%) |
| 50 to 54 Years | 2,402 (6.3%) | 2,140 (5.4%) |
| 55 to 59 Years | 2,459 (6.4%) | 2,737 (7.0%) |
| 60 to 64 Years | 2,145 (5.6%) | 2,560 (6.5%) |
| 65 to 69 Years | 1,507 (3.9%) | 1,986 (5.1%) |
| 70 to 74 Years | 1,440 (3.8%) | 1,614 (4.1%) |
| 75 to 79 Years | 912 (2.4%) | 1,279 (3.3%) |
| 80 to 84 Years | 623 (1.6%) | 796 (2.0%) |
| 85 Years and over | 599 (1.6%) | 1,310 (3.3%) |
| Total | 38,289 (100.0%) | 39,282 (100.0%) |
Families and Households in Schaumburg
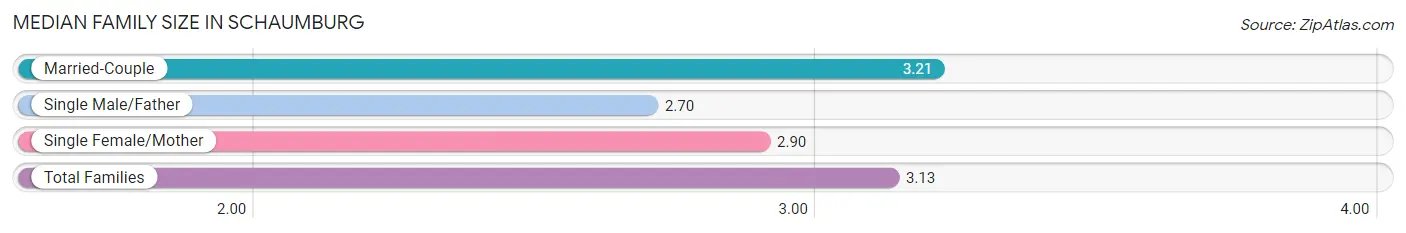
Median Family Size in Schaumburg
The median family size in Schaumburg is 3.13 persons per family, with married-couple families (15,985 | 80.1%) accounting for the largest median family size of 3.21 persons per family. On the other hand, single male/father families (1,112 | 5.6%) represent the smallest median family size with 2.70 persons per family.
| Family Type | # Families | Family Size |
| Married-Couple | 15,985 (80.1%) | 3.21 |
| Single Male/Father | 1,112 (5.6%) | 2.70 |
| Single Female/Mother | 2,849 (14.3%) | 2.90 |
| Total Families | 19,946 (100.0%) | 3.13 |
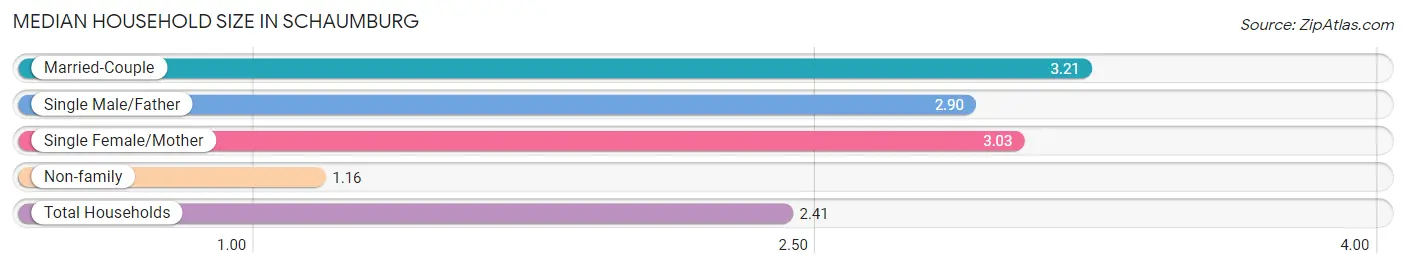
Median Household Size in Schaumburg
The median household size in Schaumburg is 2.41 persons per household, with married-couple households (15,985 | 50.0%) accounting for the largest median household size of 3.21 persons per household. non-family households (12,031 | 37.6%) represent the smallest median household size with 1.16 persons per household.
| Household Type | # Households | Household Size |
| Married-Couple | 15,985 (50.0%) | 3.21 |
| Single Male/Father | 1,112 (3.5%) | 2.90 |
| Single Female/Mother | 2,849 (8.9%) | 3.03 |
| Non-family | 12,031 (37.6%) | 1.16 |
| Total Households | 31,977 (100.0%) | 2.41 |
Household Size by Marriage Status in Schaumburg
Out of a total of 31,977 households in Schaumburg, 19,946 (62.4%) are family households, while 12,031 (37.6%) are nonfamily households. The most numerous type of family households are 2-person households, comprising 8,234, and the most common type of nonfamily households are 1-person households, comprising 10,370.
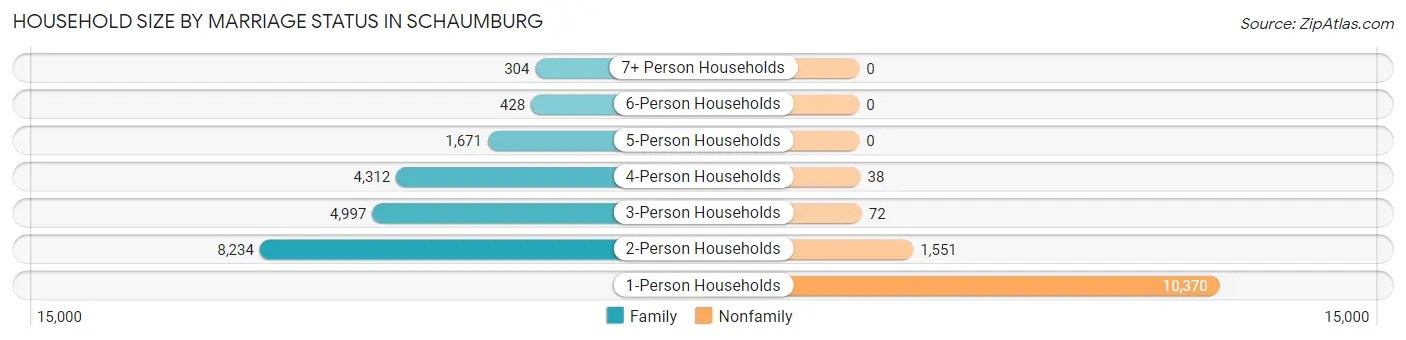
| Household Size | Family Households | Nonfamily Households |
| 1-Person Households | - | 10,370 (32.4%) |
| 2-Person Households | 8,234 (25.8%) | 1,551 (4.9%) |
| 3-Person Households | 4,997 (15.6%) | 72 (0.2%) |
| 4-Person Households | 4,312 (13.5%) | 38 (0.1%) |
| 5-Person Households | 1,671 (5.2%) | 0 (0.0%) |
| 6-Person Households | 428 (1.3%) | 0 (0.0%) |
| 7+ Person Households | 304 (0.9%) | 0 (0.0%) |
| Total | 19,946 (62.4%) | 12,031 (37.6%) |
Female Fertility in Schaumburg
Fertility by Age in Schaumburg
Average fertility rate in Schaumburg is 36.0 births per 1,000 women. Women in the age bracket of 20 to 34 years have the highest fertility rate with 45.0 births per 1,000 women. Women in the age bracket of 20 to 34 years acount for 50.7% of all women with births.
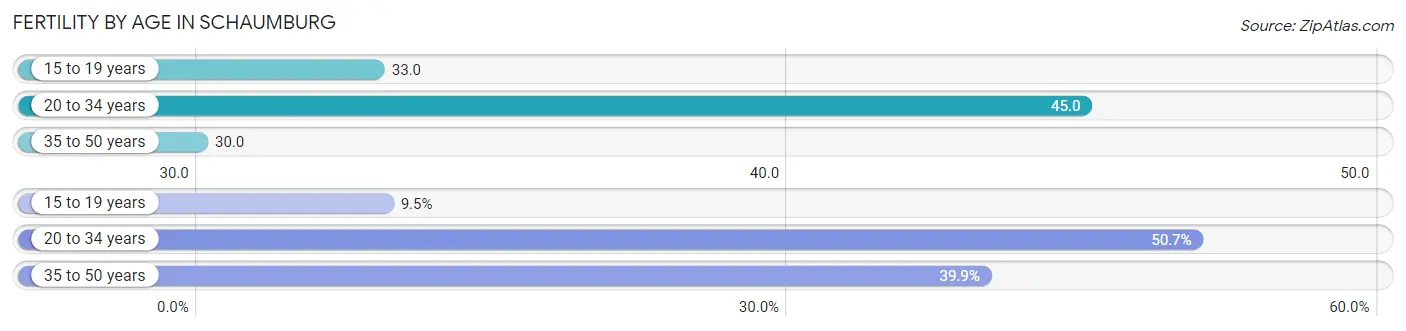
| Age Bracket | Women with Births | Births / 1,000 Women |
| 15 to 19 years | 64 (9.5%) | 33.0 |
| 20 to 34 years | 343 (50.7%) | 45.0 |
| 35 to 50 years | 270 (39.9%) | 30.0 |
| Total | 677 (100.0%) | 36.0 |
Fertility by Age by Marriage Status in Schaumburg
74.6% of women with births (677) in Schaumburg are married. The highest percentage of unmarried women with births falls into 15 to 19 years age bracket with 100.0% of them unmarried at the time of birth, while the lowest percentage of unmarried women with births belong to 35 to 50 years age bracket with 13.0% of them unmarried.
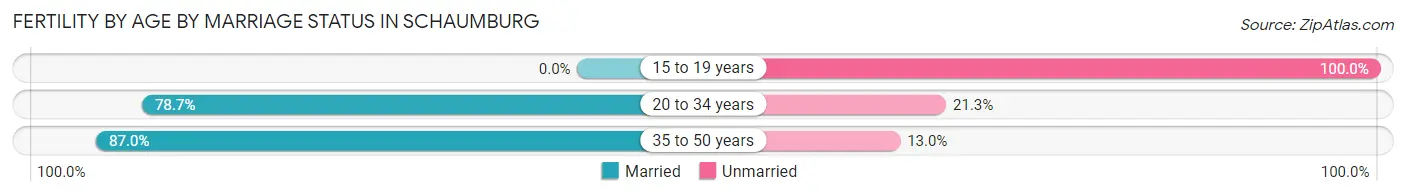
| Age Bracket | Married | Unmarried |
| 15 to 19 years | 0 (0.0%) | 64 (100.0%) |
| 20 to 34 years | 270 (78.7%) | 73 (21.3%) |
| 35 to 50 years | 235 (87.0%) | 35 (13.0%) |
| Total | 505 (74.6%) | 172 (25.4%) |
Fertility by Education in Schaumburg
Average fertility rate in Schaumburg is 36.0 births per 1,000 women. Women with the education attainment of graduate degree have the highest fertility rate of 50.0 births per 1,000 women, while women with the education attainment of college or associate's degree have the lowest fertility at 16.0 births per 1,000 women. Women with the education attainment of bachelor's degree represent 34.4% of all women with births.
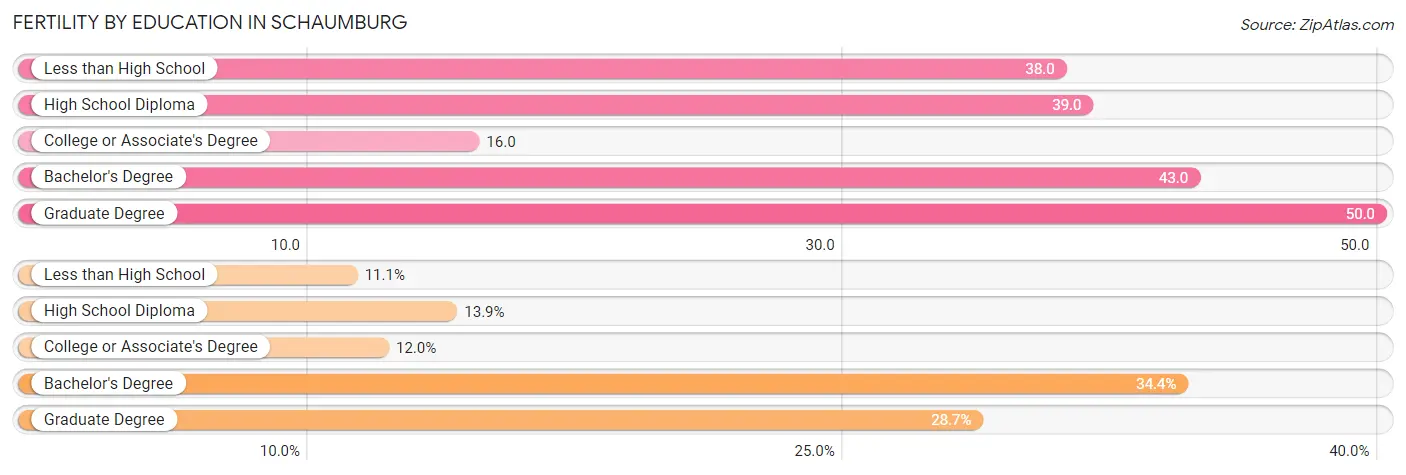
| Educational Attainment | Women with Births | Births / 1,000 Women |
| Less than High School | 75 (11.1%) | 38.0 |
| High School Diploma | 94 (13.9%) | 39.0 |
| College or Associate's Degree | 81 (12.0%) | 16.0 |
| Bachelor's Degree | 233 (34.4%) | 43.0 |
| Graduate Degree | 194 (28.7%) | 50.0 |
| Total | 677 (100.0%) | 36.0 |
Fertility by Education by Marriage Status in Schaumburg
25.4% of women with births in Schaumburg are unmarried. Women with the educational attainment of graduate degree are most likely to be married with 100.0% of them married at childbirth, while women with the educational attainment of less than high school are least likely to be married with 85.3% of them unmarried at childbirth.
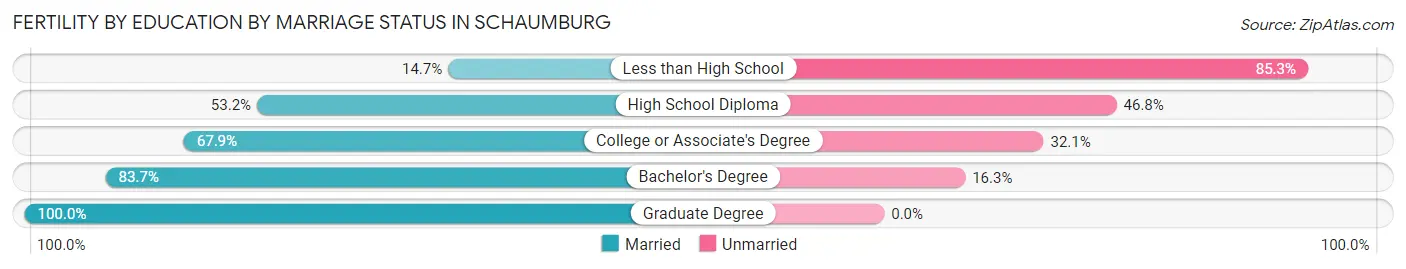
| Educational Attainment | Married | Unmarried |
| Less than High School | 11 (14.7%) | 64 (85.3%) |
| High School Diploma | 50 (53.2%) | 44 (46.8%) |
| College or Associate's Degree | 55 (67.9%) | 26 (32.1%) |
| Bachelor's Degree | 195 (83.7%) | 38 (16.3%) |
| Graduate Degree | 194 (100.0%) | 0 (0.0%) |
| Total | 505 (74.6%) | 172 (25.4%) |
Employment Characteristics in Schaumburg
Employment by Class of Employer in Schaumburg
Among the 40,532 employed individuals in Schaumburg, private company employees (30,429 | 75.1%), not-for-profit organizations (2,987 | 7.4%), and local government employees (2,282 | 5.6%) make up the most common classes of employment.
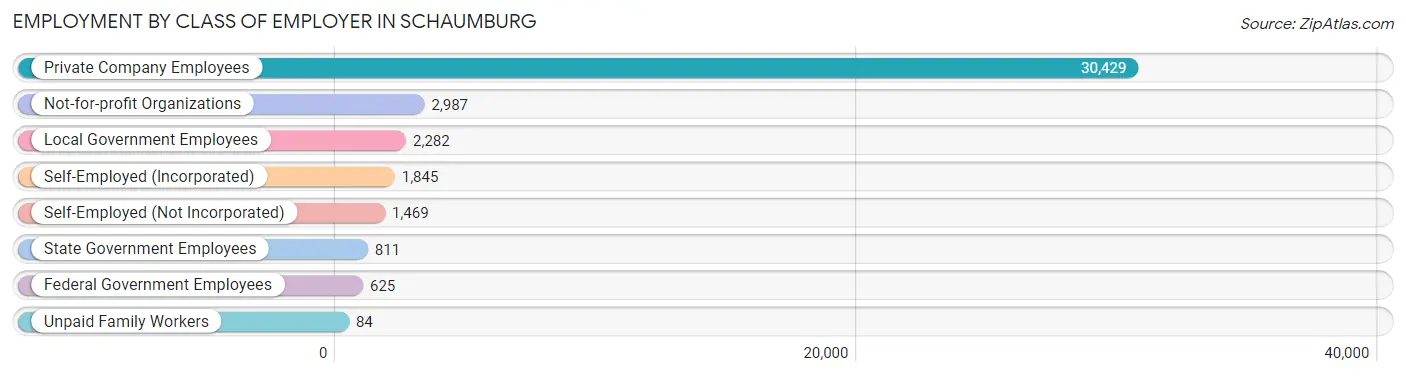
| Employer Class | # Employees | % Employees |
| Private Company Employees | 30,429 | 75.1% |
| Self-Employed (Incorporated) | 1,845 | 4.5% |
| Self-Employed (Not Incorporated) | 1,469 | 3.6% |
| Not-for-profit Organizations | 2,987 | 7.4% |
| Local Government Employees | 2,282 | 5.6% |
| State Government Employees | 811 | 2.0% |
| Federal Government Employees | 625 | 1.5% |
| Unpaid Family Workers | 84 | 0.2% |
| Total | 40,532 | 100.0% |
Employment Status by Age in Schaumburg
According to the labor force statistics for Schaumburg, out of the total population over 16 years of age (61,397), 69.8% or 42,855 individuals are in the labor force, with 3.9% or 1,671 of them unemployed. The age group with the highest labor force participation rate is 30 to 34 years, with 87.2% or 5,351 individuals in the labor force. Within the labor force, the 16 to 19 years age range has the highest percentage of unemployed individuals, with 10.3% or 100 of them being unemployed.
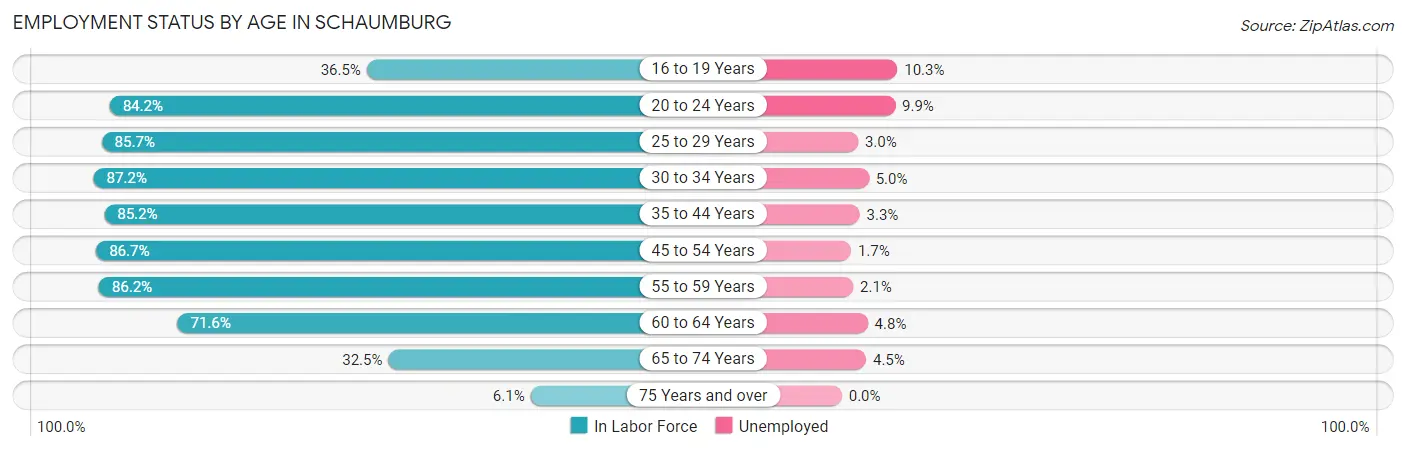
| Age Bracket | In Labor Force | Unemployed |
| 16 to 19 Years | 972 (36.5%) | 100 (10.3%) |
| 20 to 24 Years | 3,454 (84.2%) | 342 (9.9%) |
| 25 to 29 Years | 4,060 (85.7%) | 122 (3.0%) |
| 30 to 34 Years | 5,351 (87.2%) | 268 (5.0%) |
| 35 to 44 Years | 10,622 (85.2%) | 351 (3.3%) |
| 45 to 54 Years | 8,085 (86.7%) | 137 (1.7%) |
| 55 to 59 Years | 4,479 (86.2%) | 94 (2.1%) |
| 60 to 64 Years | 3,369 (71.6%) | 162 (4.8%) |
| 65 to 74 Years | 2,128 (32.5%) | 96 (4.5%) |
| 75 Years and over | 337 (6.1%) | 0 (0.0%) |
| Total | 42,855 (69.8%) | 1,671 (3.9%) |
Employment Status by Educational Attainment in Schaumburg
According to labor force statistics for Schaumburg, 84.5% of individuals (35,968) out of the total population between 25 and 64 years of age (42,566) are in the labor force, with 3.2% or 1,151 of them being unemployed. The group with the highest labor force participation rate are those with the educational attainment of college / associate degree, with 86.6% or 10,152 individuals in the labor force. Within the labor force, individuals with less than high school education have the highest percentage of unemployment, with 6.6% or 46 of them being unemployed.
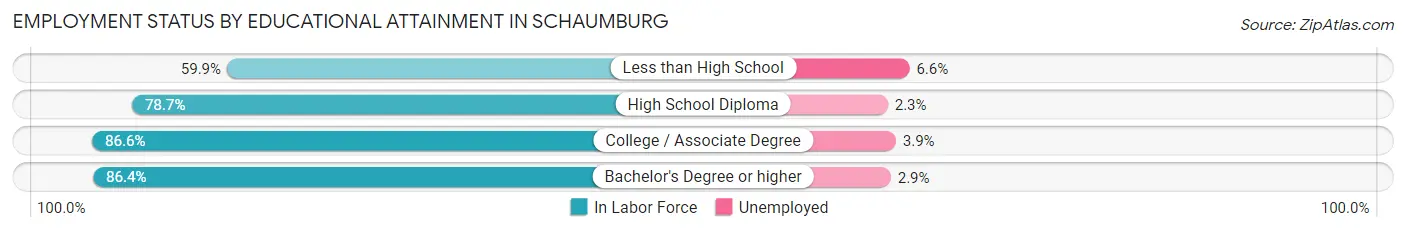
| Educational Attainment | In Labor Force | Unemployed |
| Less than High School | 694 (59.9%) | 76 (6.6%) |
| High School Diploma | 5,583 (78.7%) | 163 (2.3%) |
| College / Associate Degree | 10,152 (86.6%) | 457 (3.9%) |
| Bachelor's Degree or higher | 19,519 (86.4%) | 655 (2.9%) |
| Total | 35,968 (84.5%) | 1,362 (3.2%) |
Employment Occupations by Sex in Schaumburg
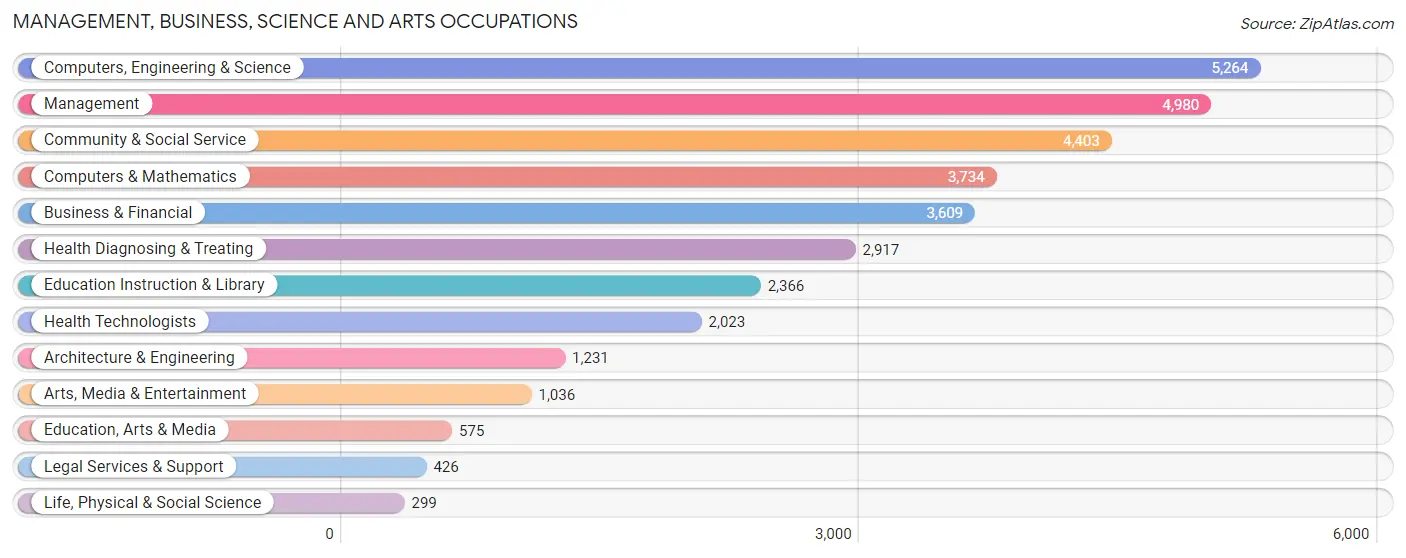
Management, Business, Science and Arts Occupations
The most common Management, Business, Science and Arts occupations in Schaumburg are Computers, Engineering & Science (5,264 | 12.8%), Management (4,980 | 12.1%), Community & Social Service (4,403 | 10.7%), Computers & Mathematics (3,734 | 9.1%), and Business & Financial (3,609 | 8.8%).
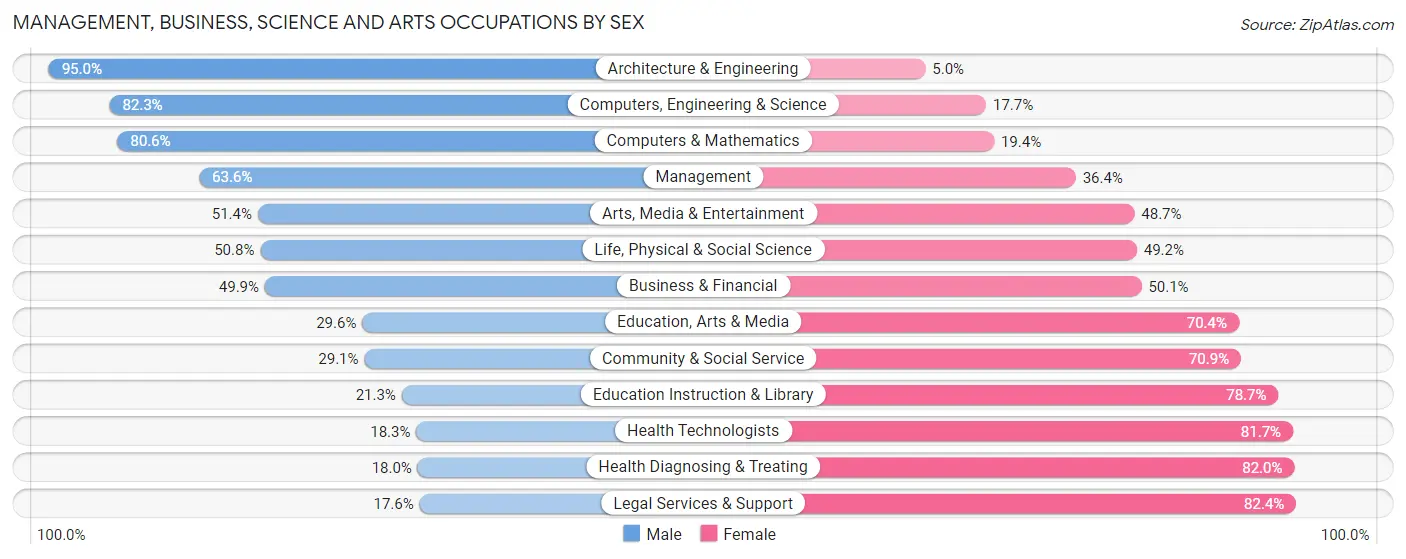
Management, Business, Science and Arts Occupations by Sex
Within the Management, Business, Science and Arts occupations in Schaumburg, the most male-oriented occupations are Architecture & Engineering (95.0%), Computers, Engineering & Science (82.3%), and Computers & Mathematics (80.6%), while the most female-oriented occupations are Legal Services & Support (82.4%), Health Diagnosing & Treating (82.0%), and Health Technologists (81.7%).
| Occupation | Male | Female |
| Management | 3,167 (63.6%) | 1,813 (36.4%) |
| Business & Financial | 1,800 (49.9%) | 1,809 (50.1%) |
| Computers, Engineering & Science | 4,332 (82.3%) | 932 (17.7%) |
| Computers & Mathematics | 3,011 (80.6%) | 723 (19.4%) |
| Architecture & Engineering | 1,169 (95.0%) | 62 (5.0%) |
| Life, Physical & Social Science | 152 (50.8%) | 147 (49.2%) |
| Community & Social Service | 1,282 (29.1%) | 3,121 (70.9%) |
| Education, Arts & Media | 170 (29.6%) | 405 (70.4%) |
| Legal Services & Support | 75 (17.6%) | 351 (82.4%) |
| Education Instruction & Library | 505 (21.3%) | 1,861 (78.7%) |
| Arts, Media & Entertainment | 532 (51.3%) | 504 (48.6%) |
| Health Diagnosing & Treating | 525 (18.0%) | 2,392 (82.0%) |
| Health Technologists | 370 (18.3%) | 1,653 (81.7%) |
| Total (Category) | 11,106 (52.4%) | 10,067 (47.5%) |
| Total (Overall) | 21,930 (53.4%) | 19,172 (46.6%) |
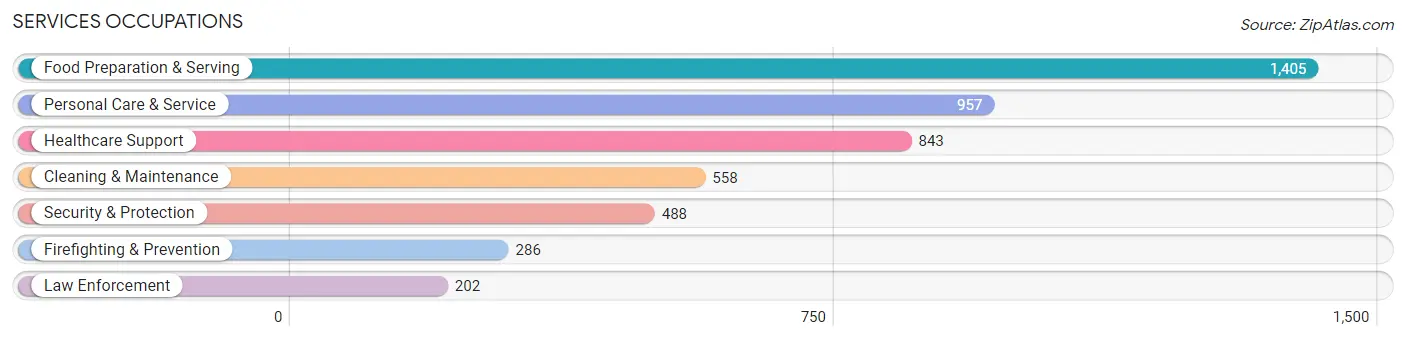
Services Occupations
The most common Services occupations in Schaumburg are Food Preparation & Serving (1,405 | 3.4%), Personal Care & Service (957 | 2.3%), Healthcare Support (843 | 2.1%), Cleaning & Maintenance (558 | 1.4%), and Security & Protection (488 | 1.2%).
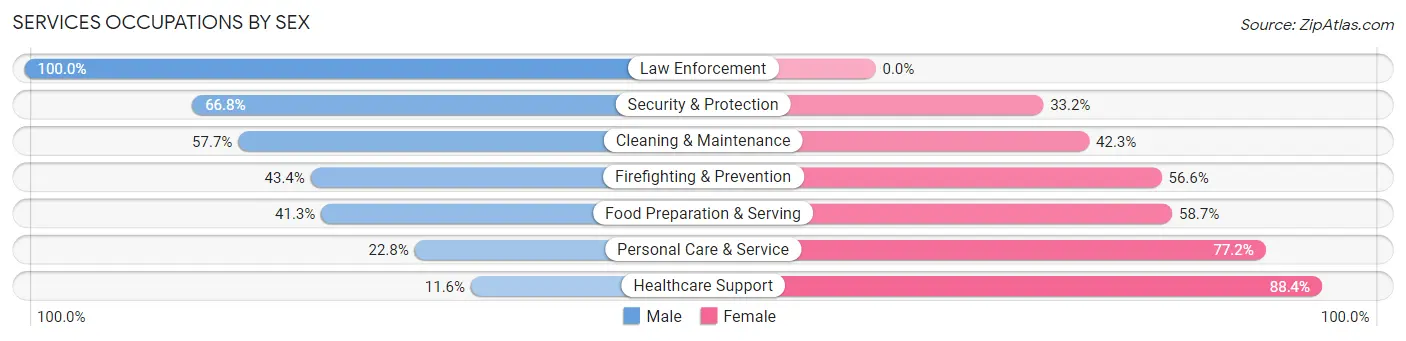
Services Occupations by Sex
Within the Services occupations in Schaumburg, the most male-oriented occupations are Law Enforcement (100.0%), Security & Protection (66.8%), and Cleaning & Maintenance (57.7%), while the most female-oriented occupations are Healthcare Support (88.4%), Personal Care & Service (77.2%), and Food Preparation & Serving (58.7%).
| Occupation | Male | Female |
| Healthcare Support | 98 (11.6%) | 745 (88.4%) |
| Security & Protection | 326 (66.8%) | 162 (33.2%) |
| Firefighting & Prevention | 124 (43.4%) | 162 (56.6%) |
| Law Enforcement | 202 (100.0%) | 0 (0.0%) |
| Food Preparation & Serving | 580 (41.3%) | 825 (58.7%) |
| Cleaning & Maintenance | 322 (57.7%) | 236 (42.3%) |
| Personal Care & Service | 218 (22.8%) | 739 (77.2%) |
| Total (Category) | 1,544 (36.3%) | 2,707 (63.7%) |
| Total (Overall) | 21,930 (53.4%) | 19,172 (46.6%) |
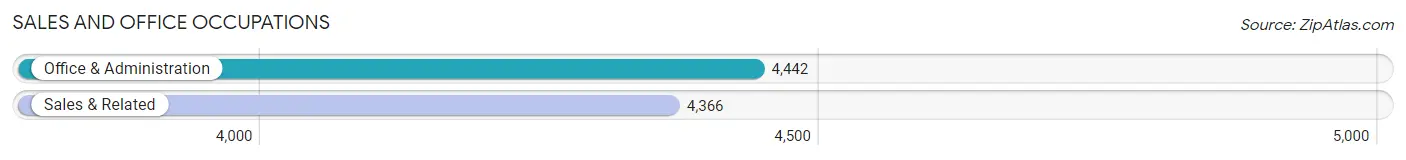
Sales and Office Occupations
The most common Sales and Office occupations in Schaumburg are Office & Administration (4,442 | 10.8%), and Sales & Related (4,366 | 10.6%).
Sales and Office Occupations by Sex
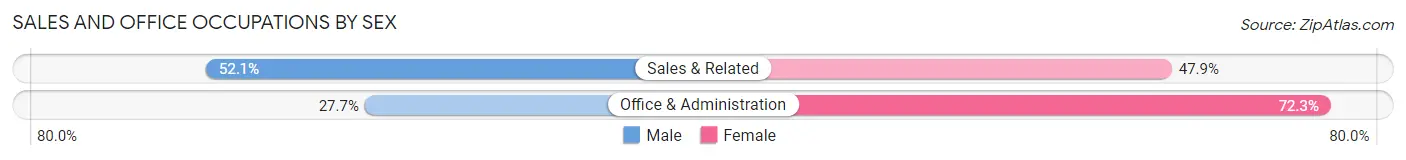
| Occupation | Male | Female |
| Sales & Related | 2,275 (52.1%) | 2,091 (47.9%) |
| Office & Administration | 1,229 (27.7%) | 3,213 (72.3%) |
| Total (Category) | 3,504 (39.8%) | 5,304 (60.2%) |
| Total (Overall) | 21,930 (53.4%) | 19,172 (46.6%) |
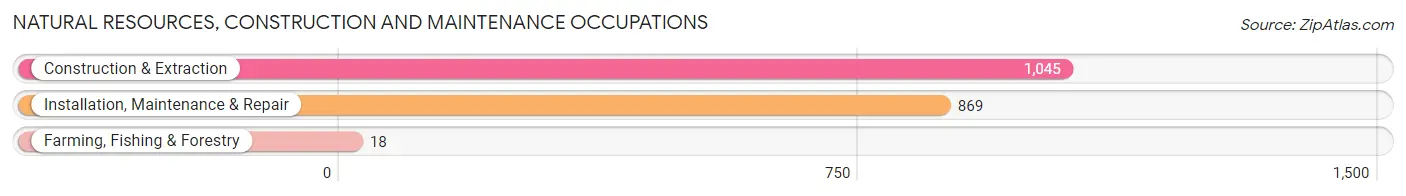
Natural Resources, Construction and Maintenance Occupations
The most common Natural Resources, Construction and Maintenance occupations in Schaumburg are Construction & Extraction (1,045 | 2.5%), Installation, Maintenance & Repair (869 | 2.1%), and Farming, Fishing & Forestry (18 | 0.0%).
Natural Resources, Construction and Maintenance Occupations by Sex
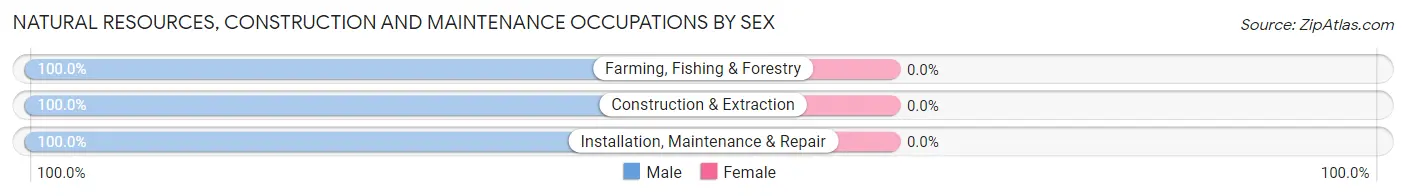
| Occupation | Male | Female |
| Farming, Fishing & Forestry | 18 (100.0%) | 0 (0.0%) |
| Construction & Extraction | 1,045 (100.0%) | 0 (0.0%) |
| Installation, Maintenance & Repair | 869 (100.0%) | 0 (0.0%) |
| Total (Category) | 1,932 (100.0%) | 0 (0.0%) |
| Total (Overall) | 21,930 (53.4%) | 19,172 (46.6%) |
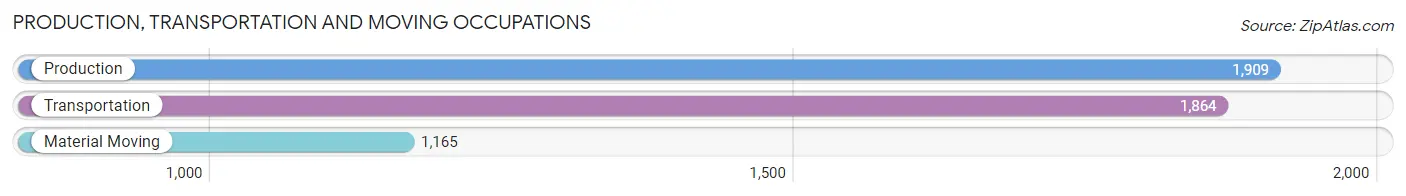
Production, Transportation and Moving Occupations
The most common Production, Transportation and Moving occupations in Schaumburg are Production (1,909 | 4.6%), Transportation (1,864 | 4.5%), and Material Moving (1,165 | 2.8%).
Production, Transportation and Moving Occupations by Sex
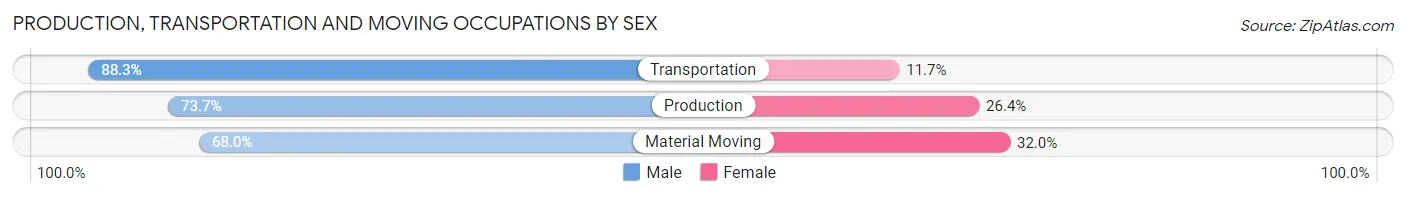
| Occupation | Male | Female |
| Production | 1,406 (73.7%) | 503 (26.4%) |
| Transportation | 1,646 (88.3%) | 218 (11.7%) |
| Material Moving | 792 (68.0%) | 373 (32.0%) |
| Total (Category) | 3,844 (77.8%) | 1,094 (22.2%) |
| Total (Overall) | 21,930 (53.4%) | 19,172 (46.6%) |
Employment Industries by Sex in Schaumburg
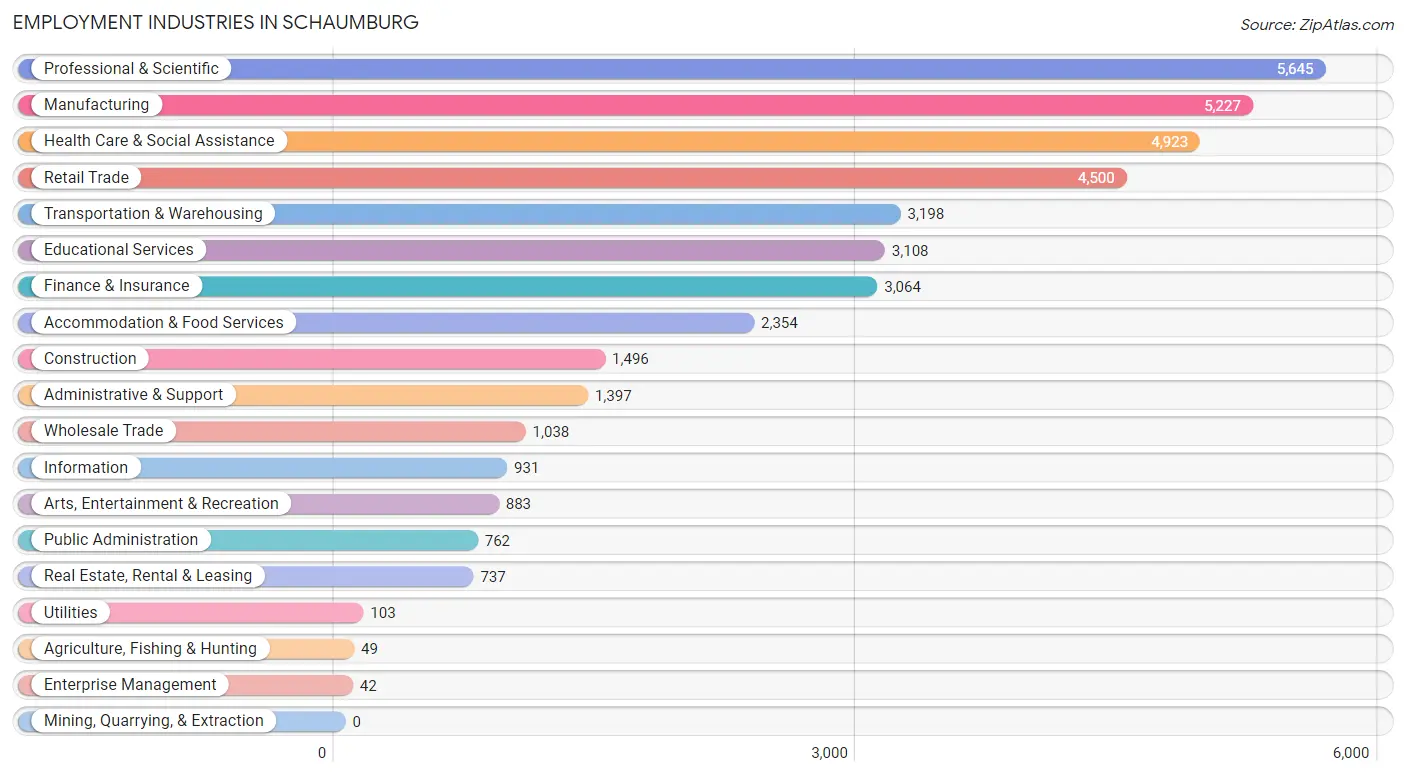
Employment Industries in Schaumburg
The major employment industries in Schaumburg include Professional & Scientific (5,645 | 13.7%), Manufacturing (5,227 | 12.7%), Health Care & Social Assistance (4,923 | 12.0%), Retail Trade (4,500 | 11.0%), and Transportation & Warehousing (3,198 | 7.8%).
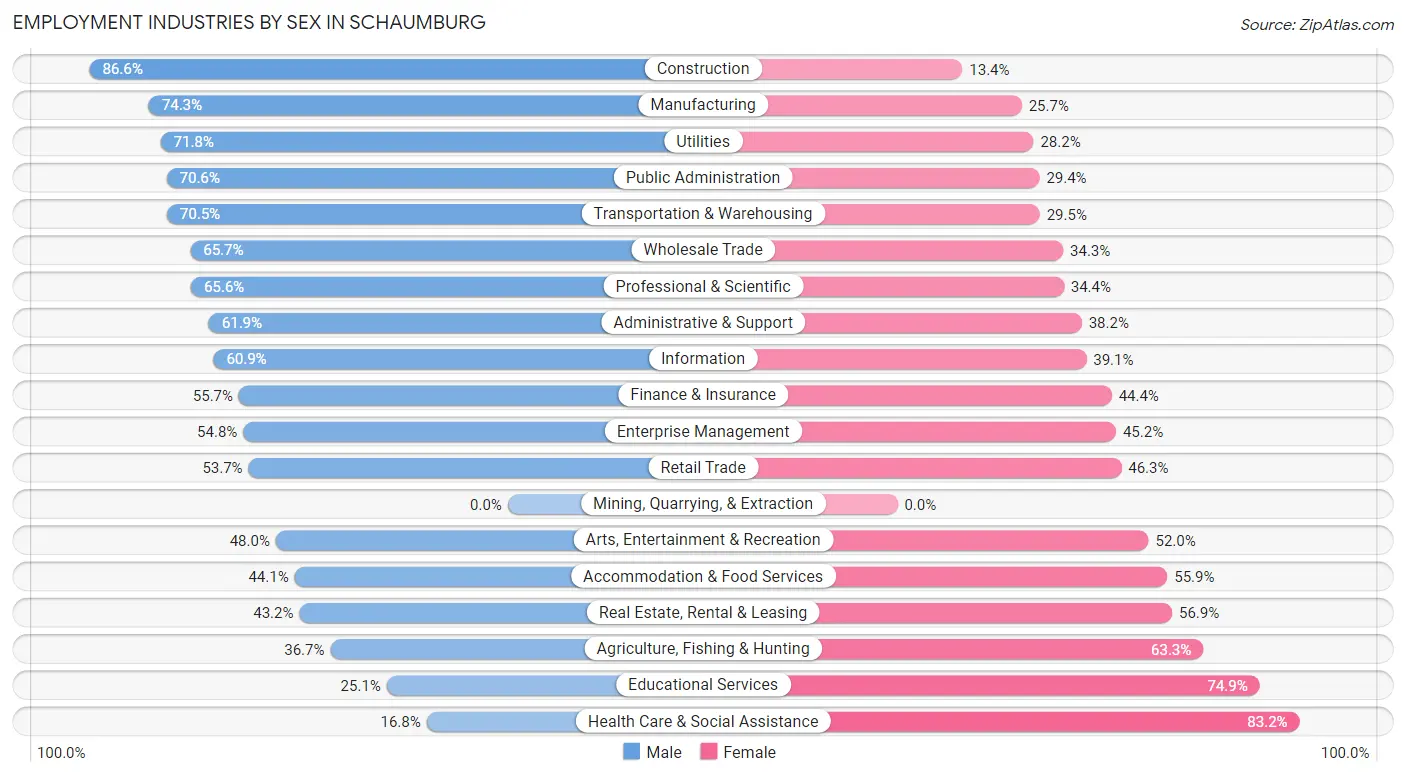
Employment Industries by Sex in Schaumburg
The Schaumburg industries that see more men than women are Construction (86.6%), Manufacturing (74.3%), and Utilities (71.8%), whereas the industries that tend to have a higher number of women are Health Care & Social Assistance (83.2%), Educational Services (74.9%), and Agriculture, Fishing & Hunting (63.3%).
| Industry | Male | Female |
| Agriculture, Fishing & Hunting | 18 (36.7%) | 31 (63.3%) |
| Mining, Quarrying, & Extraction | 0 (0.0%) | 0 (0.0%) |
| Construction | 1,295 (86.6%) | 201 (13.4%) |
| Manufacturing | 3,882 (74.3%) | 1,345 (25.7%) |
| Wholesale Trade | 682 (65.7%) | 356 (34.3%) |
| Retail Trade | 2,415 (53.7%) | 2,085 (46.3%) |
| Transportation & Warehousing | 2,256 (70.5%) | 942 (29.5%) |
| Utilities | 74 (71.8%) | 29 (28.2%) |
| Information | 567 (60.9%) | 364 (39.1%) |
| Finance & Insurance | 1,705 (55.6%) | 1,359 (44.4%) |
| Real Estate, Rental & Leasing | 318 (43.1%) | 419 (56.9%) |
| Professional & Scientific | 3,701 (65.6%) | 1,944 (34.4%) |
| Enterprise Management | 23 (54.8%) | 19 (45.2%) |
| Administrative & Support | 864 (61.9%) | 533 (38.2%) |
| Educational Services | 779 (25.1%) | 2,329 (74.9%) |
| Health Care & Social Assistance | 827 (16.8%) | 4,096 (83.2%) |
| Arts, Entertainment & Recreation | 424 (48.0%) | 459 (52.0%) |
| Accommodation & Food Services | 1,039 (44.1%) | 1,315 (55.9%) |
| Public Administration | 538 (70.6%) | 224 (29.4%) |
| Total | 21,930 (53.4%) | 19,172 (46.6%) |
Education in Schaumburg
School Enrollment in Schaumburg
The most common levels of schooling among the 17,613 students in Schaumburg are elementary school (4,109 | 23.3%), middle school (3,602 | 20.4%), and high school (3,361 | 19.1%).
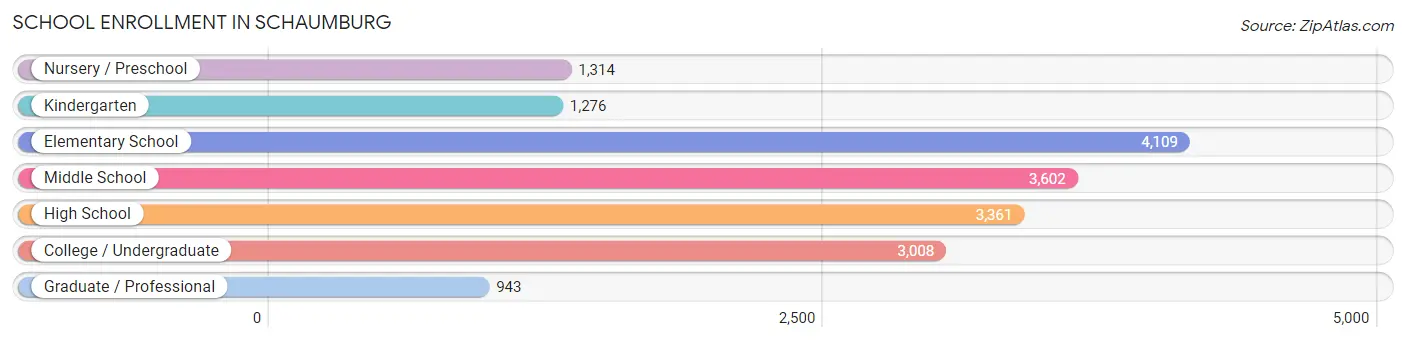
| School Level | # Students | % Students |
| Nursery / Preschool | 1,314 | 7.5% |
| Kindergarten | 1,276 | 7.2% |
| Elementary School | 4,109 | 23.3% |
| Middle School | 3,602 | 20.4% |
| High School | 3,361 | 19.1% |
| College / Undergraduate | 3,008 | 17.1% |
| Graduate / Professional | 943 | 5.3% |
| Total | 17,613 | 100.0% |
School Enrollment by Age by Funding Source in Schaumburg
Out of a total of 17,613 students who are enrolled in schools in Schaumburg, 2,325 (13.2%) attend a private institution, while the remaining 15,288 (86.8%) are enrolled in public schools. The age group of 3 to 4 year olds has the highest likelihood of being enrolled in private schools, with 461 (45.8% in the age bracket) enrolled. Conversely, the age group of 10 to 14 year olds has the lowest likelihood of being enrolled in a private school, with 4,322 (97.2% in the age bracket) attending a public institution.
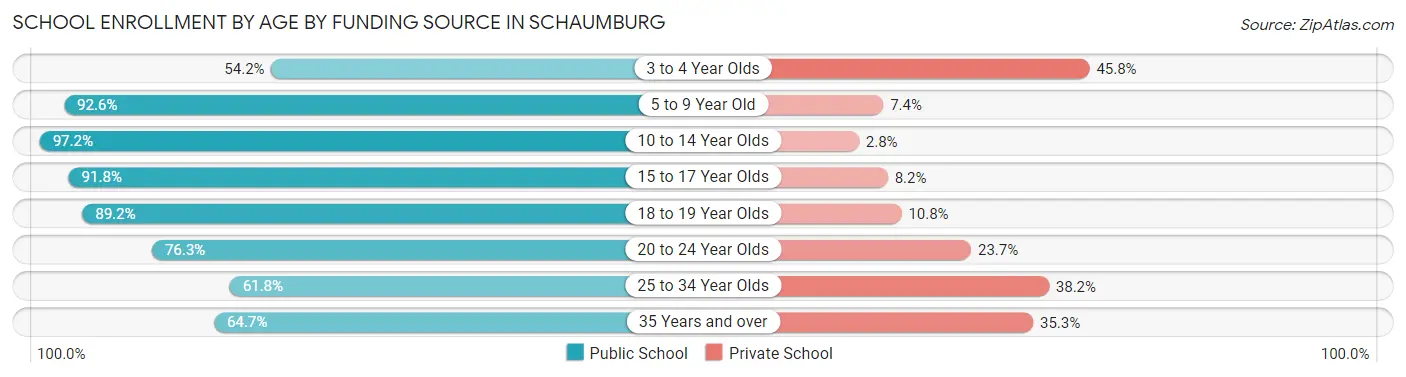
| Age Bracket | Public School | Private School |
| 3 to 4 Year Olds | 546 (54.2%) | 461 (45.8%) |
| 5 to 9 Year Old | 4,987 (92.6%) | 397 (7.4%) |
| 10 to 14 Year Olds | 4,322 (97.2%) | 126 (2.8%) |
| 15 to 17 Year Olds | 2,325 (91.8%) | 208 (8.2%) |
| 18 to 19 Year Olds | 796 (89.2%) | 96 (10.8%) |
| 20 to 24 Year Olds | 1,160 (76.3%) | 361 (23.7%) |
| 25 to 34 Year Olds | 632 (61.8%) | 391 (38.2%) |
| 35 Years and over | 521 (64.7%) | 284 (35.3%) |
| Total | 15,288 (86.8%) | 2,325 (13.2%) |
Educational Attainment by Field of Study in Schaumburg
Business (6,116 | 21.6%), engineering (4,127 | 14.5%), computers & mathematics (2,719 | 9.6%), science & technology (2,634 | 9.3%), and education (2,477 | 8.7%) are the most common fields of study among 28,371 individuals in Schaumburg who have obtained a bachelor's degree or higher.
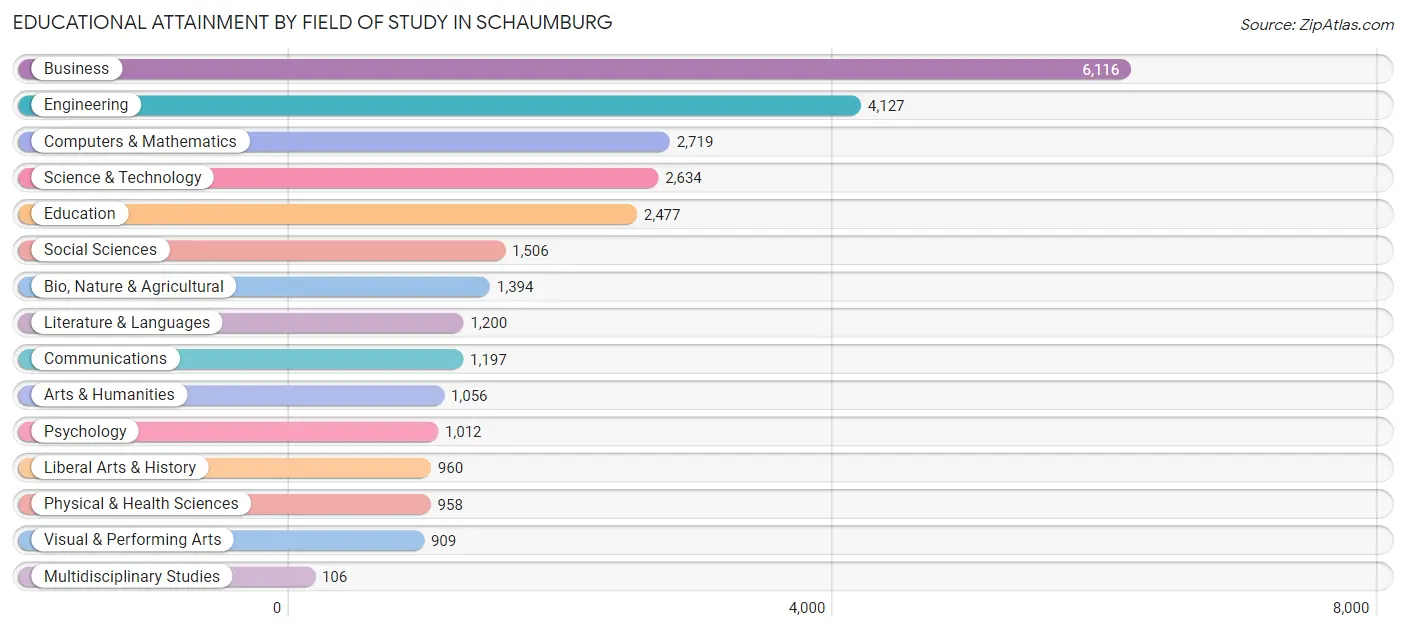
| Field of Study | # Graduates | % Graduates |
| Computers & Mathematics | 2,719 | 9.6% |
| Bio, Nature & Agricultural | 1,394 | 4.9% |
| Physical & Health Sciences | 958 | 3.4% |
| Psychology | 1,012 | 3.6% |
| Social Sciences | 1,506 | 5.3% |
| Engineering | 4,127 | 14.5% |
| Multidisciplinary Studies | 106 | 0.4% |
| Science & Technology | 2,634 | 9.3% |
| Business | 6,116 | 21.6% |
| Education | 2,477 | 8.7% |
| Literature & Languages | 1,200 | 4.2% |
| Liberal Arts & History | 960 | 3.4% |
| Visual & Performing Arts | 909 | 3.2% |
| Communications | 1,197 | 4.2% |
| Arts & Humanities | 1,056 | 3.7% |
| Total | 28,371 | 100.0% |
Transportation & Commute in Schaumburg
Vehicle Availability by Sex in Schaumburg
The most prevalent vehicle ownership categories in Schaumburg are males with 2 vehicles (10,349, accounting for 47.3%) and females with 2 vehicles (8,039, making up 55.5%).
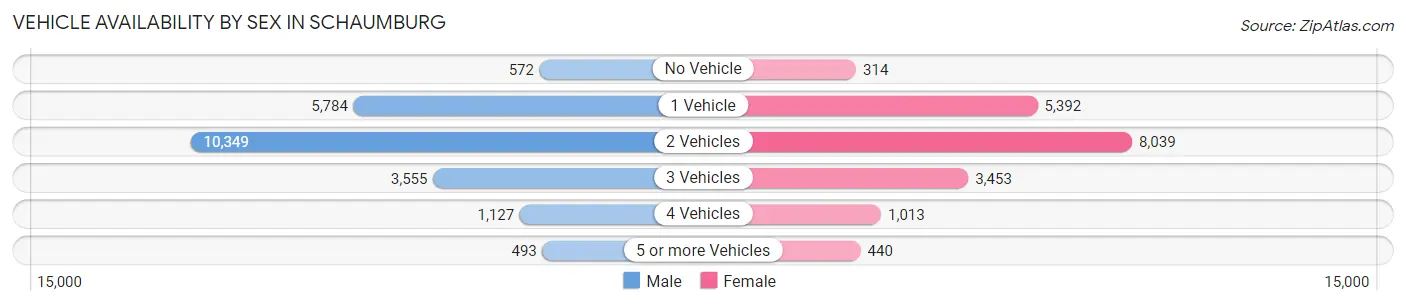
| Vehicles Available | Male | Female |
| No Vehicle | 572 (2.6%) | 314 (1.7%) |
| 1 Vehicle | 5,784 (26.4%) | 5,392 (28.9%) |
| 2 Vehicles | 10,349 (47.3%) | 8,039 (43.1%) |
| 3 Vehicles | 3,555 (16.3%) | 3,453 (18.5%) |
| 4 Vehicles | 1,127 (5.1%) | 1,013 (5.4%) |
| 5 or more Vehicles | 493 (2.2%) | 440 (2.4%) |
| Total | 21,880 (100.0%) | 18,651 (100.0%) |
Commute Time in Schaumburg
The most frequently occuring commute durations in Schaumburg are 20 to 24 minutes (5,166 commuters, 15.0%), 30 to 34 minutes (4,961 commuters, 14.4%), and 15 to 19 minutes (4,899 commuters, 14.2%).
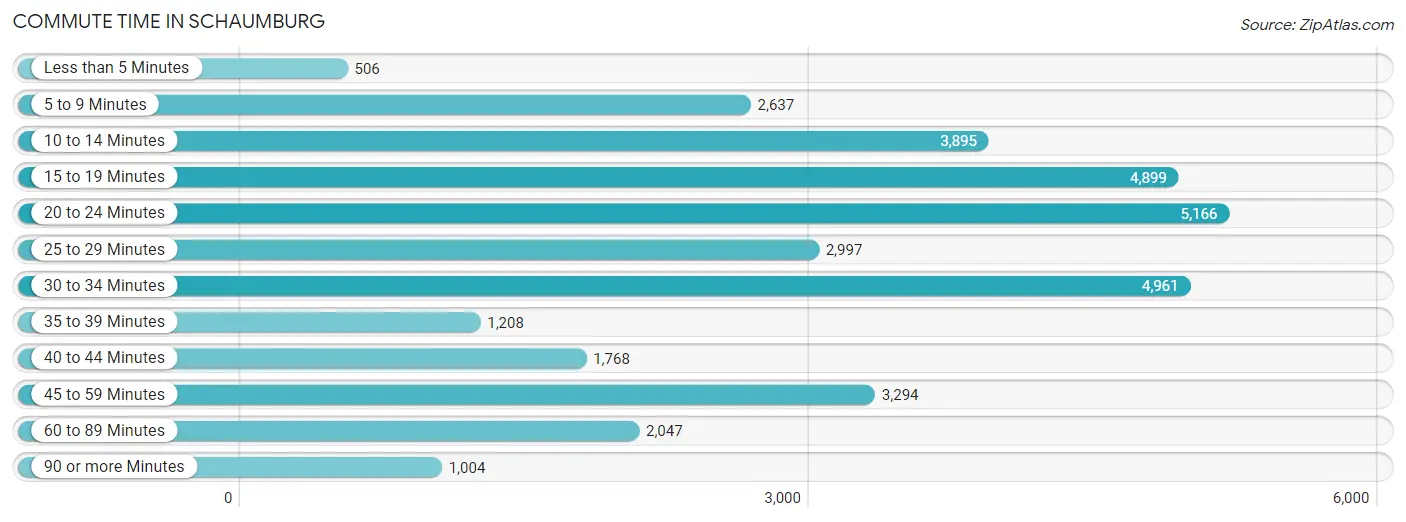
| Commute Time | # Commuters | % Commuters |
| Less than 5 Minutes | 506 | 1.5% |
| 5 to 9 Minutes | 2,637 | 7.7% |
| 10 to 14 Minutes | 3,895 | 11.3% |
| 15 to 19 Minutes | 4,899 | 14.2% |
| 20 to 24 Minutes | 5,166 | 15.0% |
| 25 to 29 Minutes | 2,997 | 8.7% |
| 30 to 34 Minutes | 4,961 | 14.4% |
| 35 to 39 Minutes | 1,208 | 3.5% |
| 40 to 44 Minutes | 1,768 | 5.1% |
| 45 to 59 Minutes | 3,294 | 9.6% |
| 60 to 89 Minutes | 2,047 | 5.9% |
| 90 or more Minutes | 1,004 | 2.9% |
Commute Time by Sex in Schaumburg
The most common commute times in Schaumburg are 30 to 34 minutes (2,858 commuters, 15.4%) for males and 15 to 19 minutes (2,546 commuters, 16.1%) for females.
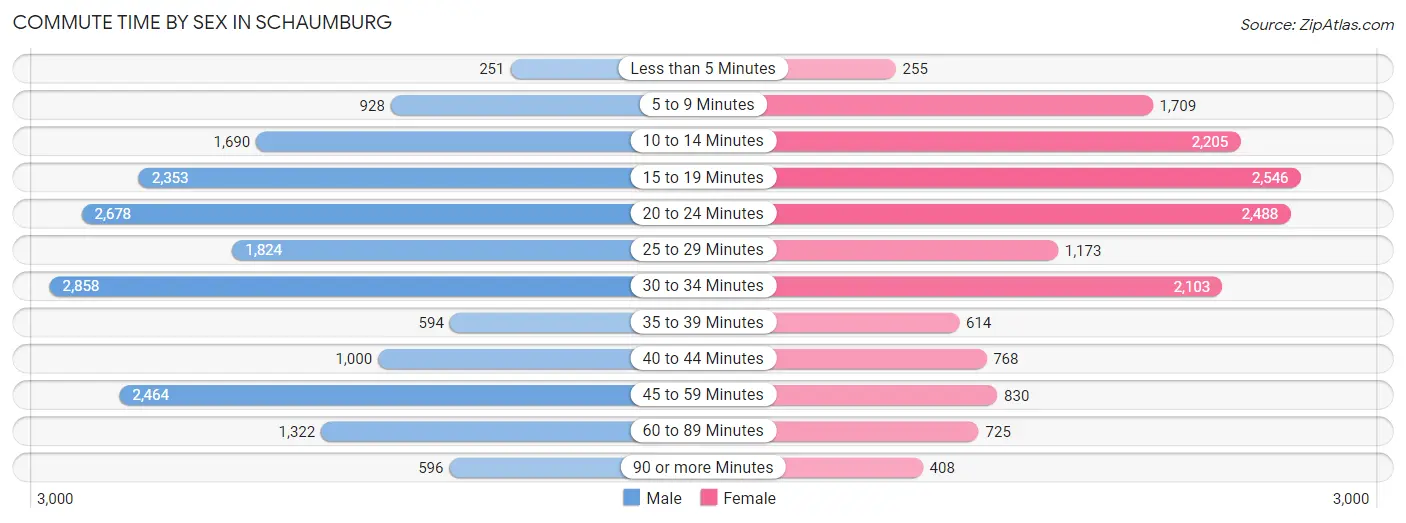
| Commute Time | Male | Female |
| Less than 5 Minutes | 251 (1.3%) | 255 (1.6%) |
| 5 to 9 Minutes | 928 (5.0%) | 1,709 (10.8%) |
| 10 to 14 Minutes | 1,690 (9.1%) | 2,205 (13.9%) |
| 15 to 19 Minutes | 2,353 (12.7%) | 2,546 (16.1%) |
| 20 to 24 Minutes | 2,678 (14.4%) | 2,488 (15.7%) |
| 25 to 29 Minutes | 1,824 (9.8%) | 1,173 (7.4%) |
| 30 to 34 Minutes | 2,858 (15.4%) | 2,103 (13.3%) |
| 35 to 39 Minutes | 594 (3.2%) | 614 (3.9%) |
| 40 to 44 Minutes | 1,000 (5.4%) | 768 (4.9%) |
| 45 to 59 Minutes | 2,464 (13.3%) | 830 (5.2%) |
| 60 to 89 Minutes | 1,322 (7.1%) | 725 (4.6%) |
| 90 or more Minutes | 596 (3.2%) | 408 (2.6%) |
Time of Departure to Work by Sex in Schaumburg
The most frequent times of departure to work in Schaumburg are 7:00 AM to 7:29 AM (2,438, 13.1%) for males and 7:00 AM to 7:29 AM (2,818, 17.8%) for females.
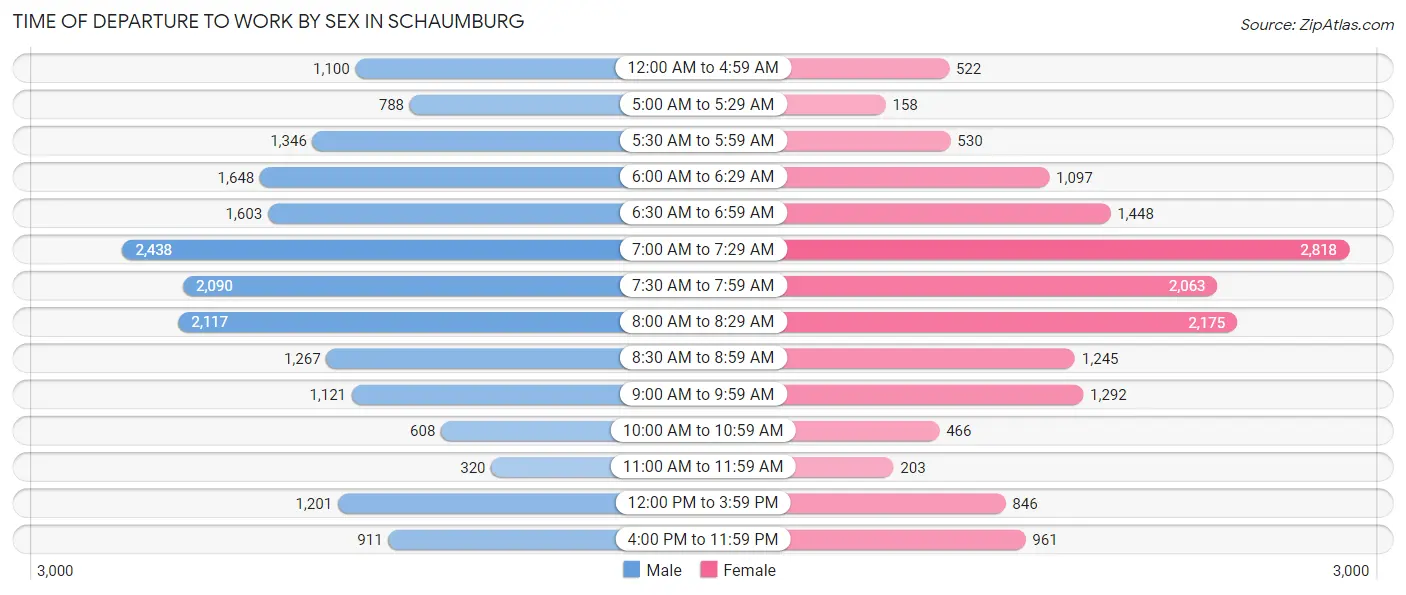
| Time of Departure | Male | Female |
| 12:00 AM to 4:59 AM | 1,100 (5.9%) | 522 (3.3%) |
| 5:00 AM to 5:29 AM | 788 (4.3%) | 158 (1.0%) |
| 5:30 AM to 5:59 AM | 1,346 (7.2%) | 530 (3.4%) |
| 6:00 AM to 6:29 AM | 1,648 (8.9%) | 1,097 (6.9%) |
| 6:30 AM to 6:59 AM | 1,603 (8.6%) | 1,448 (9.1%) |
| 7:00 AM to 7:29 AM | 2,438 (13.1%) | 2,818 (17.8%) |
| 7:30 AM to 7:59 AM | 2,090 (11.3%) | 2,063 (13.0%) |
| 8:00 AM to 8:29 AM | 2,117 (11.4%) | 2,175 (13.7%) |
| 8:30 AM to 8:59 AM | 1,267 (6.8%) | 1,245 (7.9%) |
| 9:00 AM to 9:59 AM | 1,121 (6.0%) | 1,292 (8.2%) |
| 10:00 AM to 10:59 AM | 608 (3.3%) | 466 (2.9%) |
| 11:00 AM to 11:59 AM | 320 (1.7%) | 203 (1.3%) |
| 12:00 PM to 3:59 PM | 1,201 (6.5%) | 846 (5.3%) |
| 4:00 PM to 11:59 PM | 911 (4.9%) | 961 (6.1%) |
| Total | 18,558 (100.0%) | 15,824 (100.0%) |
Housing Occupancy in Schaumburg
Occupancy by Ownership in Schaumburg
Of the total 31,977 dwellings in Schaumburg, owner-occupied units account for 19,561 (61.2%), while renter-occupied units make up 12,416 (38.8%).
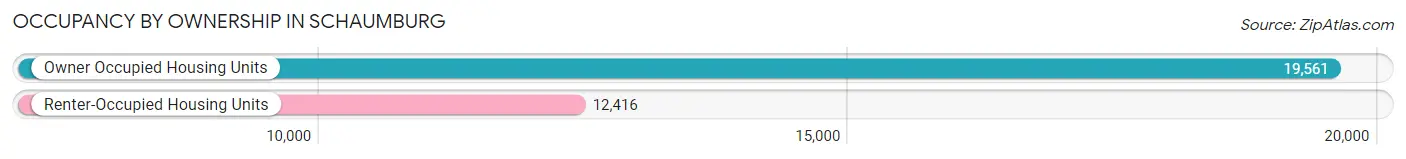
| Occupancy | # Housing Units | % Housing Units |
| Owner Occupied Housing Units | 19,561 | 61.2% |
| Renter-Occupied Housing Units | 12,416 | 38.8% |
| Total Occupied Housing Units | 31,977 | 100.0% |
Occupancy by Household Size in Schaumburg
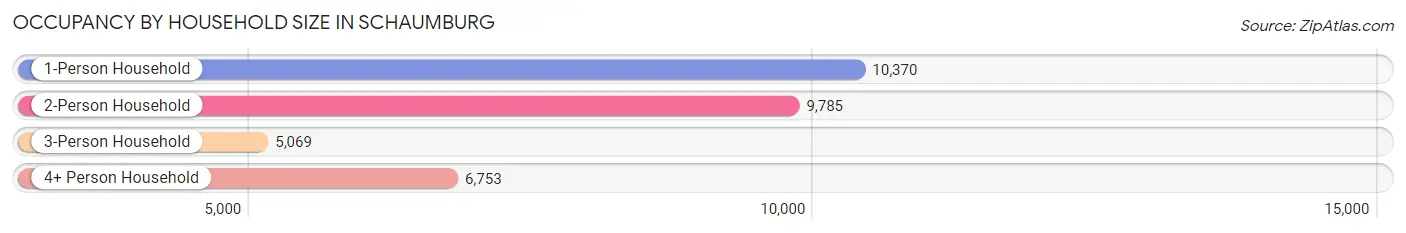
| Household Size | # Housing Units | % Housing Units |
| 1-Person Household | 10,370 | 32.4% |
| 2-Person Household | 9,785 | 30.6% |
| 3-Person Household | 5,069 | 15.9% |
| 4+ Person Household | 6,753 | 21.1% |
| Total Housing Units | 31,977 | 100.0% |
Occupancy by Ownership by Household Size in Schaumburg
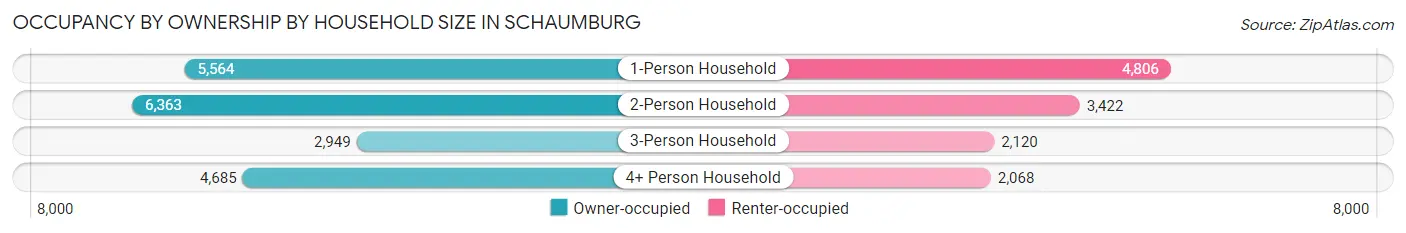
| Household Size | Owner-occupied | Renter-occupied |
| 1-Person Household | 5,564 (53.6%) | 4,806 (46.4%) |
| 2-Person Household | 6,363 (65.0%) | 3,422 (35.0%) |
| 3-Person Household | 2,949 (58.2%) | 2,120 (41.8%) |
| 4+ Person Household | 4,685 (69.4%) | 2,068 (30.6%) |
| Total Housing Units | 19,561 (61.2%) | 12,416 (38.8%) |
Occupancy by Educational Attainment in Schaumburg
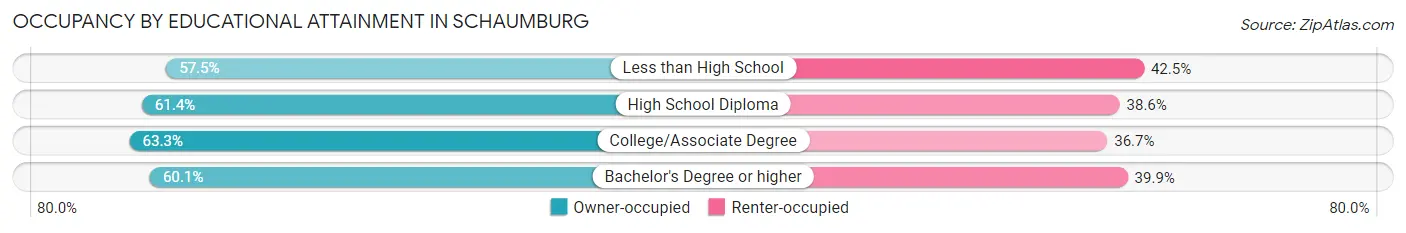
| Household Size | Owner-occupied | Renter-occupied |
| Less than High School | 528 (57.5%) | 390 (42.5%) |
| High School Diploma | 3,342 (61.4%) | 2,102 (38.6%) |
| College/Associate Degree | 5,753 (63.3%) | 3,330 (36.7%) |
| Bachelor's Degree or higher | 9,938 (60.1%) | 6,594 (39.9%) |
Occupancy by Age of Householder in Schaumburg
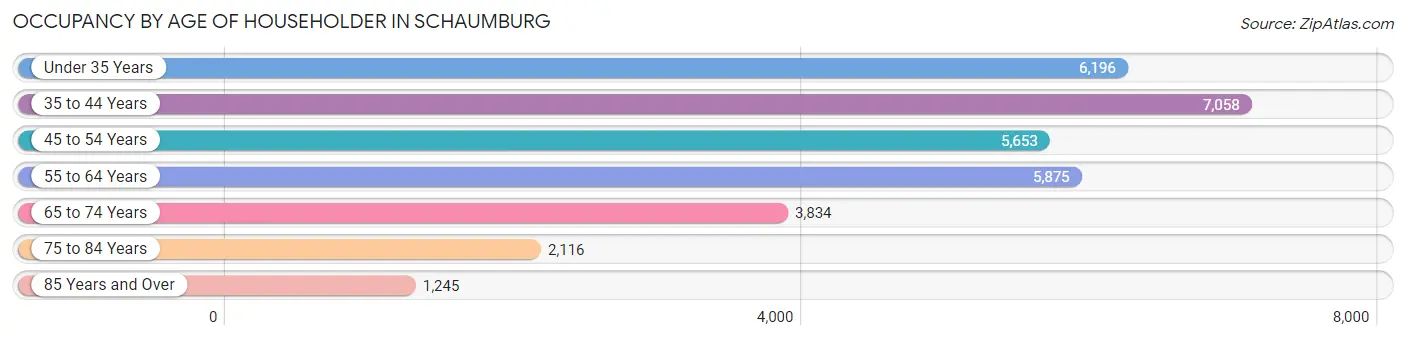
| Age Bracket | # Households | % Households |
| Under 35 Years | 6,196 | 19.4% |
| 35 to 44 Years | 7,058 | 22.1% |
| 45 to 54 Years | 5,653 | 17.7% |
| 55 to 64 Years | 5,875 | 18.4% |
| 65 to 74 Years | 3,834 | 12.0% |
| 75 to 84 Years | 2,116 | 6.6% |
| 85 Years and Over | 1,245 | 3.9% |
| Total | 31,977 | 100.0% |
Housing Finances in Schaumburg
Median Income by Occupancy in Schaumburg
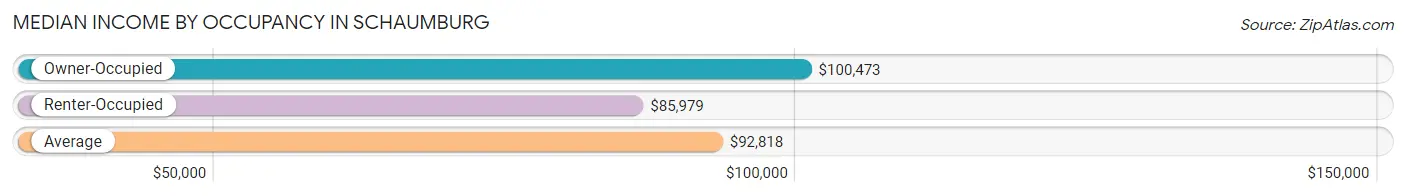
| Occupancy Type | # Households | Median Income |
| Owner-Occupied | 19,561 (61.2%) | $100,473 |
| Renter-Occupied | 12,416 (38.8%) | $85,979 |
| Average | 31,977 (100.0%) | $92,818 |
Occupancy by Householder Income Bracket in Schaumburg
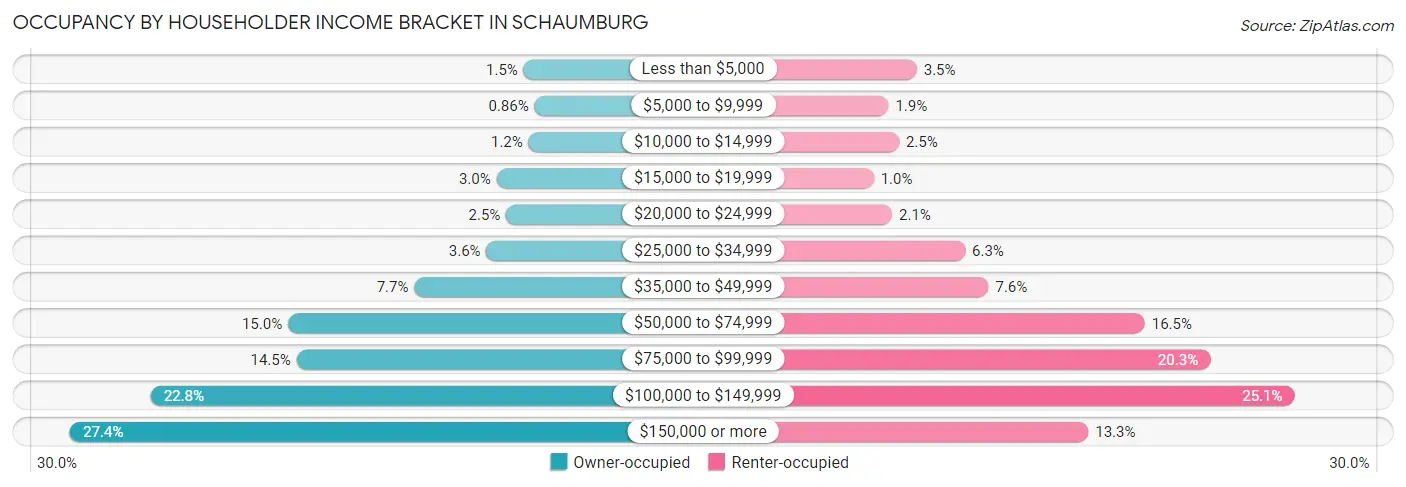
| Income Bracket | Owner-occupied | Renter-occupied |
| Less than $5,000 | 289 (1.5%) | 434 (3.5%) |
| $5,000 to $9,999 | 168 (0.9%) | 234 (1.9%) |
| $10,000 to $14,999 | 234 (1.2%) | 308 (2.5%) |
| $15,000 to $19,999 | 593 (3.0%) | 129 (1.0%) |
| $20,000 to $24,999 | 486 (2.5%) | 260 (2.1%) |
| $25,000 to $34,999 | 707 (3.6%) | 777 (6.3%) |
| $35,000 to $49,999 | 1,513 (7.7%) | 944 (7.6%) |
| $50,000 to $74,999 | 2,925 (14.9%) | 2,052 (16.5%) |
| $75,000 to $99,999 | 2,829 (14.5%) | 2,514 (20.3%) |
| $100,000 to $149,999 | 4,458 (22.8%) | 3,113 (25.1%) |
| $150,000 or more | 5,359 (27.4%) | 1,651 (13.3%) |
| Total | 19,561 (100.0%) | 12,416 (100.0%) |
Monthly Housing Cost Tiers in Schaumburg
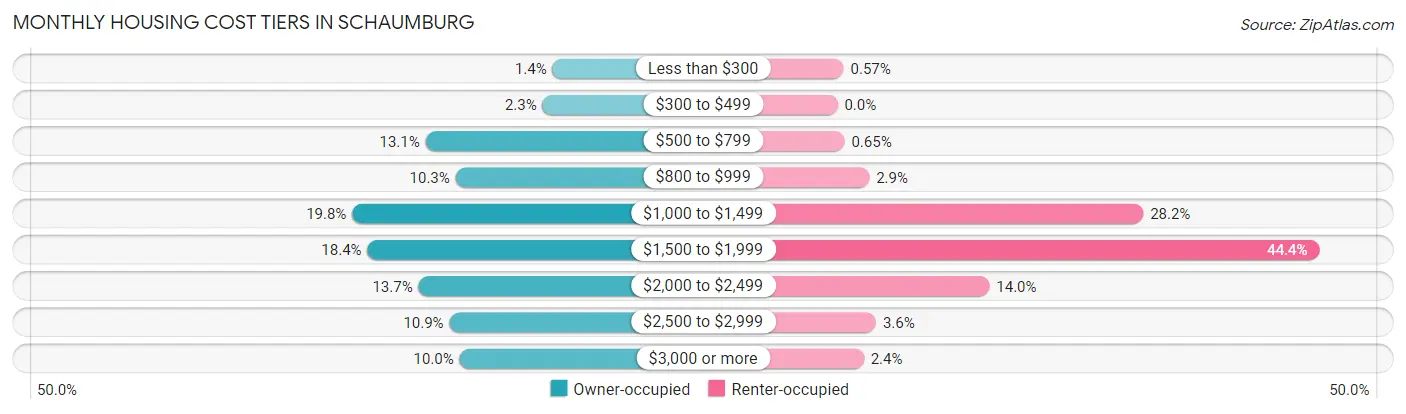
| Monthly Cost | Owner-occupied | Renter-occupied |
| Less than $300 | 273 (1.4%) | 71 (0.6%) |
| $300 to $499 | 454 (2.3%) | 0 (0.0%) |
| $500 to $799 | 2,561 (13.1%) | 81 (0.6%) |
| $800 to $999 | 2,019 (10.3%) | 364 (2.9%) |
| $1,000 to $1,499 | 3,881 (19.8%) | 3,495 (28.1%) |
| $1,500 to $1,999 | 3,607 (18.4%) | 5,508 (44.4%) |
| $2,000 to $2,499 | 2,688 (13.7%) | 1,737 (14.0%) |
| $2,500 to $2,999 | 2,130 (10.9%) | 441 (3.5%) |
| $3,000 or more | 1,948 (10.0%) | 301 (2.4%) |
| Total | 19,561 (100.0%) | 12,416 (100.0%) |
Physical Housing Characteristics in Schaumburg
Housing Structures in Schaumburg
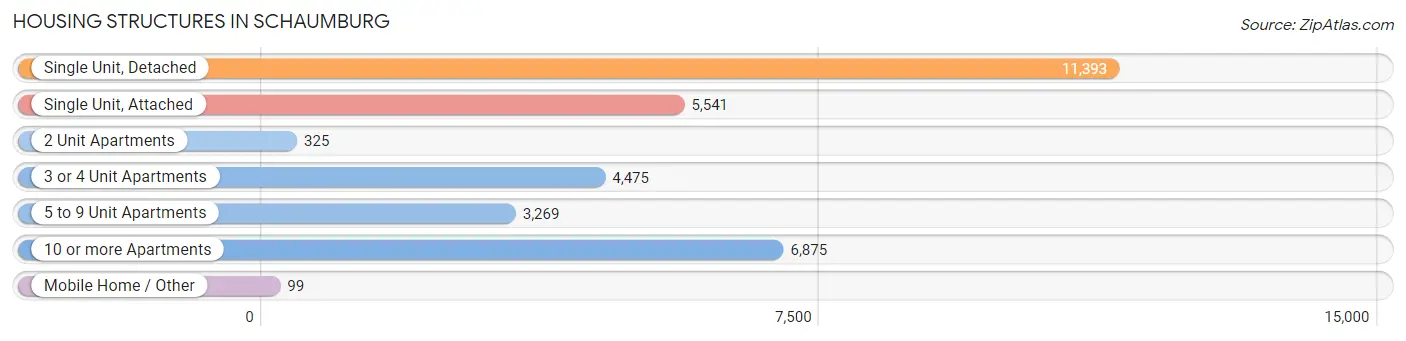
| Structure Type | # Housing Units | % Housing Units |
| Single Unit, Detached | 11,393 | 35.6% |
| Single Unit, Attached | 5,541 | 17.3% |
| 2 Unit Apartments | 325 | 1.0% |
| 3 or 4 Unit Apartments | 4,475 | 14.0% |
| 5 to 9 Unit Apartments | 3,269 | 10.2% |
| 10 or more Apartments | 6,875 | 21.5% |
| Mobile Home / Other | 99 | 0.3% |
| Total | 31,977 | 100.0% |
Housing Structures by Occupancy in Schaumburg
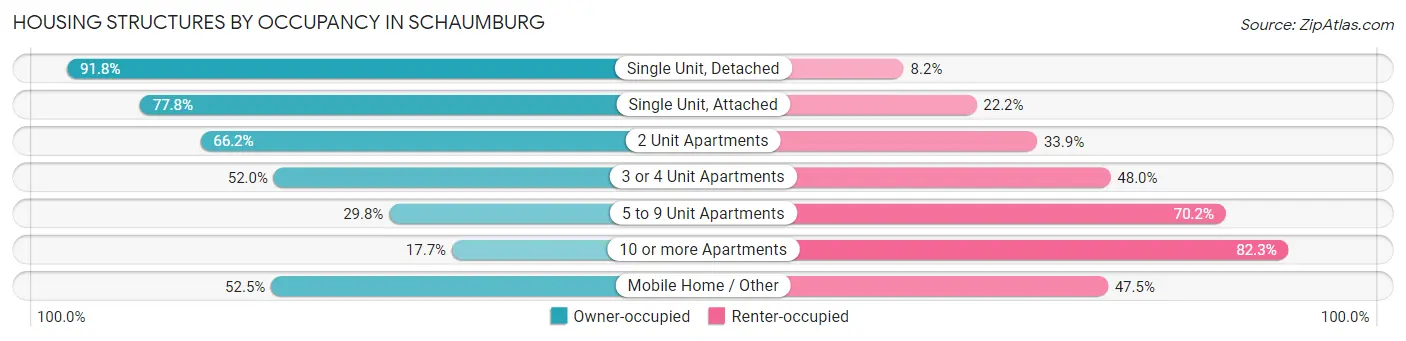
| Structure Type | Owner-occupied | Renter-occupied |
| Single Unit, Detached | 10,461 (91.8%) | 932 (8.2%) |
| Single Unit, Attached | 4,312 (77.8%) | 1,229 (22.2%) |
| 2 Unit Apartments | 215 (66.1%) | 110 (33.9%) |
| 3 or 4 Unit Apartments | 2,328 (52.0%) | 2,147 (48.0%) |
| 5 to 9 Unit Apartments | 974 (29.8%) | 2,295 (70.2%) |
| 10 or more Apartments | 1,219 (17.7%) | 5,656 (82.3%) |
| Mobile Home / Other | 52 (52.5%) | 47 (47.5%) |
| Total | 19,561 (61.2%) | 12,416 (38.8%) |
Housing Structures by Number of Rooms in Schaumburg
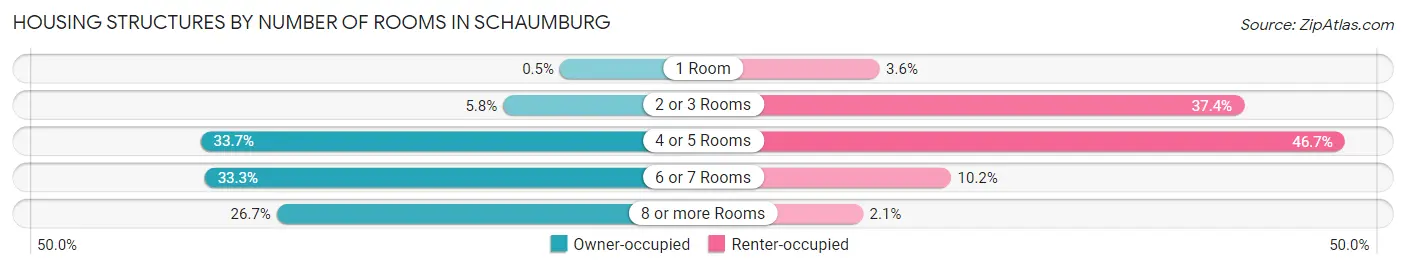
| Number of Rooms | Owner-occupied | Renter-occupied |
| 1 Room | 98 (0.5%) | 451 (3.6%) |
| 2 or 3 Rooms | 1,125 (5.8%) | 4,638 (37.4%) |
| 4 or 5 Rooms | 6,595 (33.7%) | 5,795 (46.7%) |
| 6 or 7 Rooms | 6,522 (33.3%) | 1,271 (10.2%) |
| 8 or more Rooms | 5,221 (26.7%) | 261 (2.1%) |
| Total | 19,561 (100.0%) | 12,416 (100.0%) |
Housing Structure by Heating Type in Schaumburg
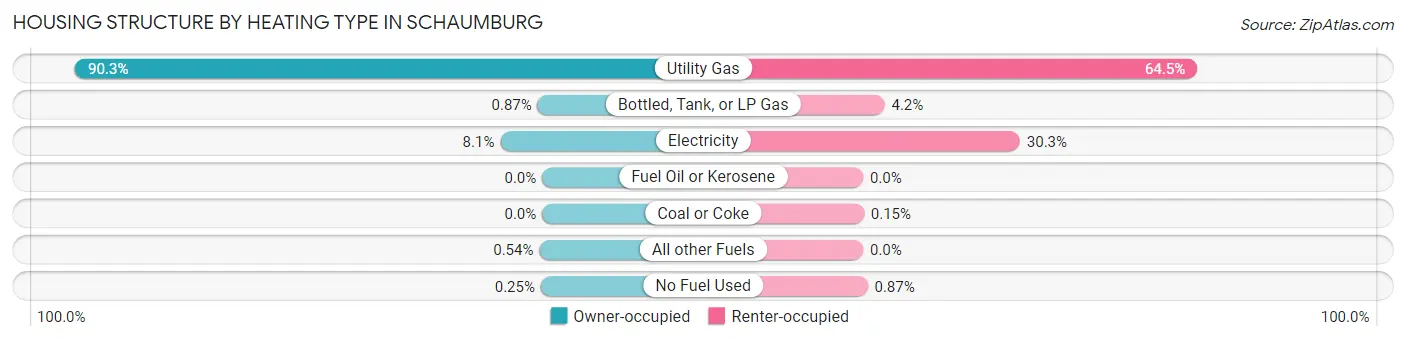
| Heating Type | Owner-occupied | Renter-occupied |
| Utility Gas | 17,654 (90.2%) | 8,012 (64.5%) |
| Bottled, Tank, or LP Gas | 171 (0.9%) | 515 (4.2%) |
| Electricity | 1,582 (8.1%) | 3,762 (30.3%) |
| Fuel Oil or Kerosene | 0 (0.0%) | 0 (0.0%) |
| Coal or Coke | 0 (0.0%) | 19 (0.2%) |
| All other Fuels | 106 (0.5%) | 0 (0.0%) |
| No Fuel Used | 48 (0.3%) | 108 (0.9%) |
| Total | 19,561 (100.0%) | 12,416 (100.0%) |
Household Vehicle Usage in Schaumburg
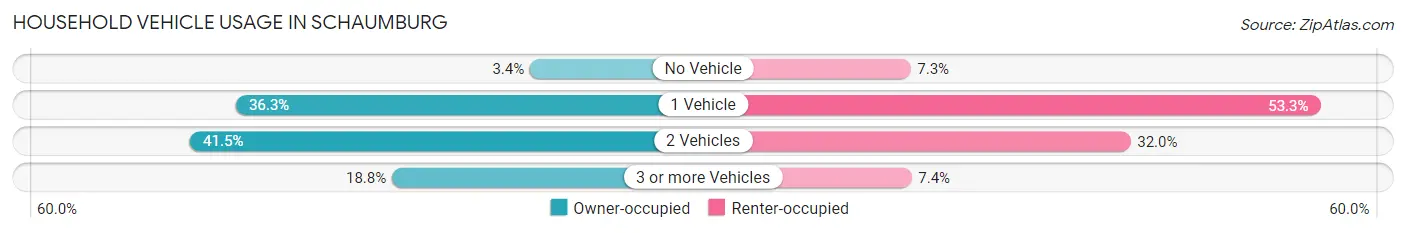
| Vehicles per Household | Owner-occupied | Renter-occupied |
| No Vehicle | 662 (3.4%) | 910 (7.3%) |
| 1 Vehicle | 7,104 (36.3%) | 6,612 (53.2%) |
| 2 Vehicles | 8,109 (41.4%) | 3,970 (32.0%) |
| 3 or more Vehicles | 3,686 (18.8%) | 924 (7.4%) |
| Total | 19,561 (100.0%) | 12,416 (100.0%) |
Real Estate & Mortgages in Schaumburg
Real Estate and Mortgage Overview in Schaumburg
| Characteristic | Without Mortgage | With Mortgage |
| Housing Units | 6,378 | 13,183 |
| Median Property Value | $287,400 | $308,600 |
| Median Household Income | $75,860 | $4,147 |
| Monthly Housing Costs | $827 | $1,920 |
| Real Estate Taxes | $6,007 | $165 |
Property Value by Mortgage Status in Schaumburg
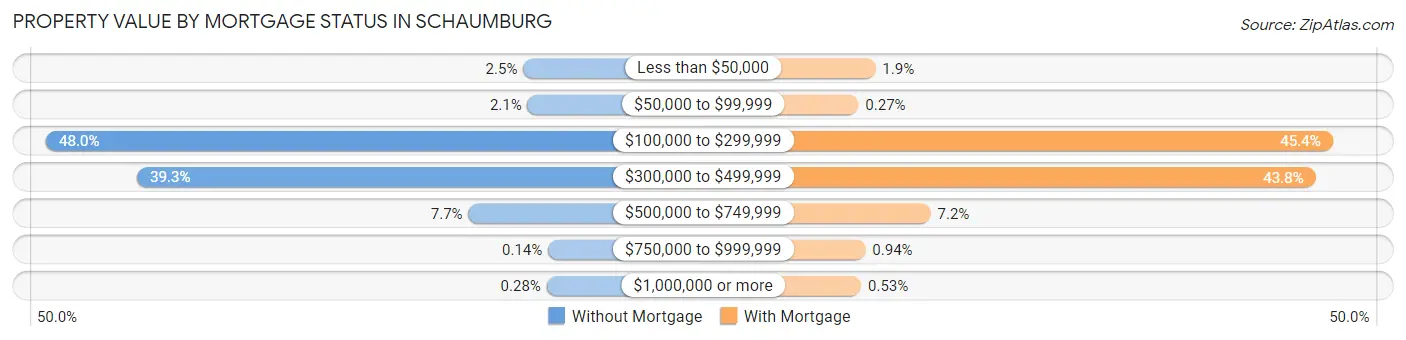
| Property Value | Without Mortgage | With Mortgage |
| Less than $50,000 | 160 (2.5%) | 249 (1.9%) |
| $50,000 to $99,999 | 134 (2.1%) | 36 (0.3%) |
| $100,000 to $299,999 | 3,058 (47.9%) | 5,988 (45.4%) |
| $300,000 to $499,999 | 2,506 (39.3%) | 5,774 (43.8%) |
| $500,000 to $749,999 | 493 (7.7%) | 942 (7.1%) |
| $750,000 to $999,999 | 9 (0.1%) | 124 (0.9%) |
| $1,000,000 or more | 18 (0.3%) | 70 (0.5%) |
| Total | 6,378 (100.0%) | 13,183 (100.0%) |
Household Income by Mortgage Status in Schaumburg
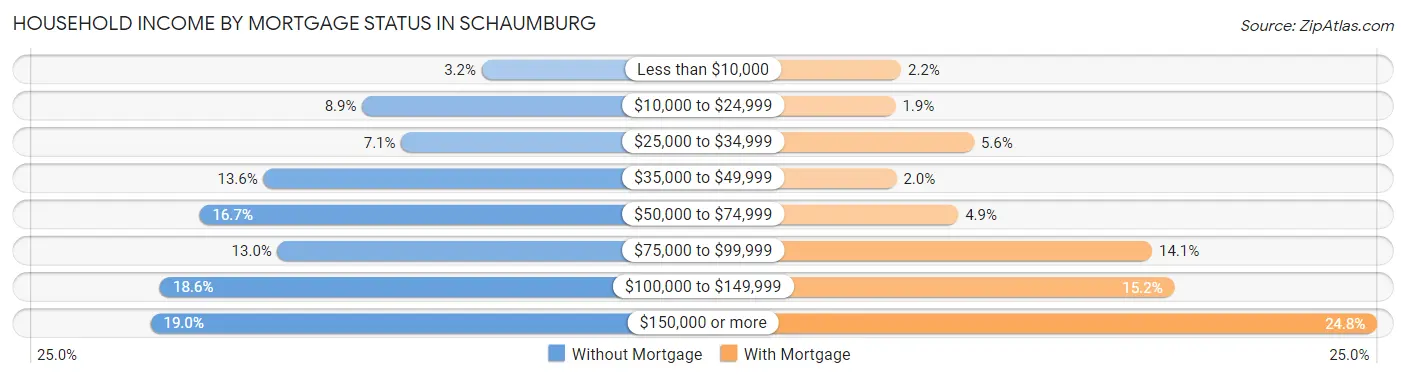
| Household Income | Without Mortgage | With Mortgage |
| Less than $10,000 | 206 (3.2%) | 286 (2.2%) |
| $10,000 to $24,999 | 569 (8.9%) | 251 (1.9%) |
| $25,000 to $34,999 | 450 (7.1%) | 744 (5.6%) |
| $35,000 to $49,999 | 869 (13.6%) | 257 (1.9%) |
| $50,000 to $74,999 | 1,063 (16.7%) | 644 (4.9%) |
| $75,000 to $99,999 | 826 (13.0%) | 1,862 (14.1%) |
| $100,000 to $149,999 | 1,183 (18.5%) | 2,003 (15.2%) |
| $150,000 or more | 1,212 (19.0%) | 3,275 (24.8%) |
| Total | 6,378 (100.0%) | 13,183 (100.0%) |
Property Value to Household Income Ratio in Schaumburg
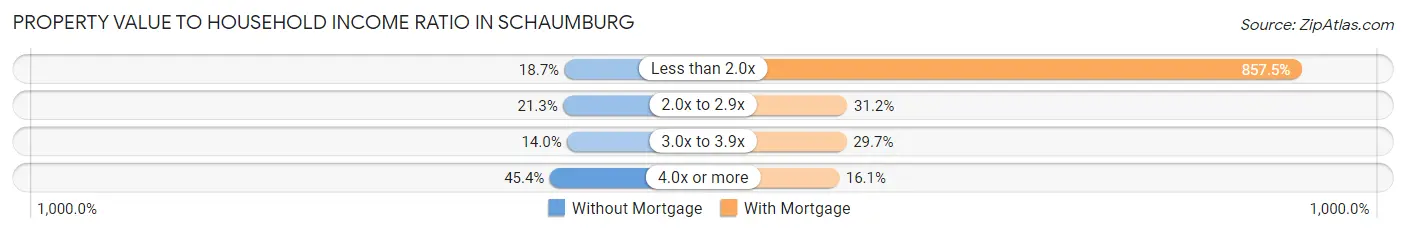
| Value-to-Income Ratio | Without Mortgage | With Mortgage |
| Less than 2.0x | 1,194 (18.7%) | 113,050 (857.5%) |
| 2.0x to 2.9x | 1,356 (21.3%) | 4,112 (31.2%) |
| 3.0x to 3.9x | 895 (14.0%) | 3,909 (29.6%) |
| 4.0x or more | 2,898 (45.4%) | 2,121 (16.1%) |
| Total | 6,378 (100.0%) | 13,183 (100.0%) |
Real Estate Taxes by Mortgage Status in Schaumburg
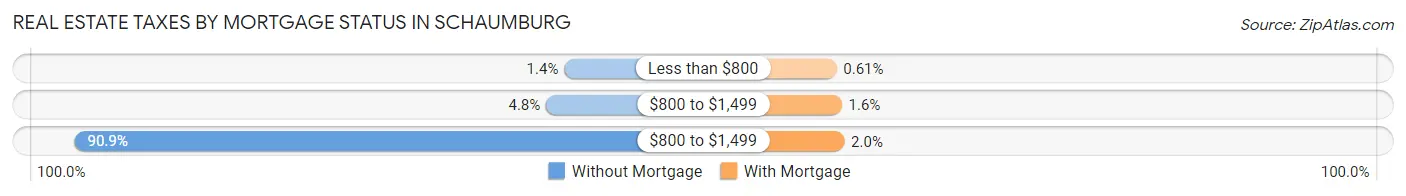
| Property Taxes | Without Mortgage | With Mortgage |
| Less than $800 | 92 (1.4%) | 81 (0.6%) |
| $800 to $1,499 | 303 (4.8%) | 206 (1.6%) |
| $800 to $1,499 | 5,796 (90.9%) | 268 (2.0%) |
| Total | 6,378 (100.0%) | 13,183 (100.0%) |
Health & Disability in Schaumburg
Health Insurance Coverage by Age in Schaumburg
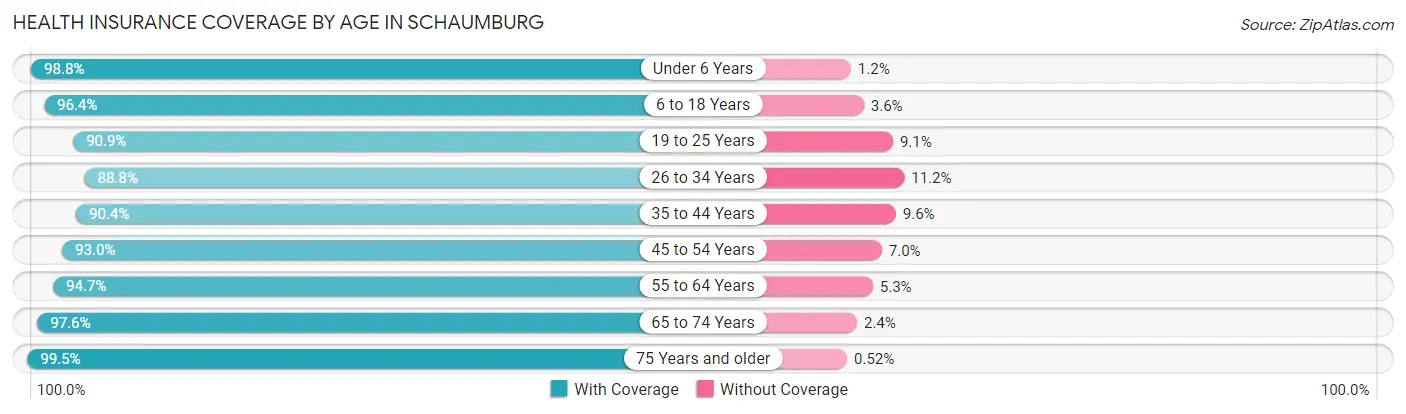
| Age Bracket | With Coverage | Without Coverage |
| Under 6 Years | 5,790 (98.8%) | 72 (1.2%) |
| 6 to 18 Years | 12,002 (96.4%) | 454 (3.6%) |
| 19 to 25 Years | 5,152 (90.9%) | 514 (9.1%) |
| 26 to 34 Years | 8,722 (88.8%) | 1,099 (11.2%) |
| 35 to 44 Years | 11,197 (90.4%) | 1,190 (9.6%) |
| 45 to 54 Years | 8,671 (93.0%) | 654 (7.0%) |
| 55 to 64 Years | 9,346 (94.7%) | 526 (5.3%) |
| 65 to 74 Years | 6,348 (97.6%) | 155 (2.4%) |
| 75 Years and older | 5,175 (99.5%) | 27 (0.5%) |
| Total | 72,403 (93.9%) | 4,691 (6.1%) |
Health Insurance Coverage by Citizenship Status in Schaumburg
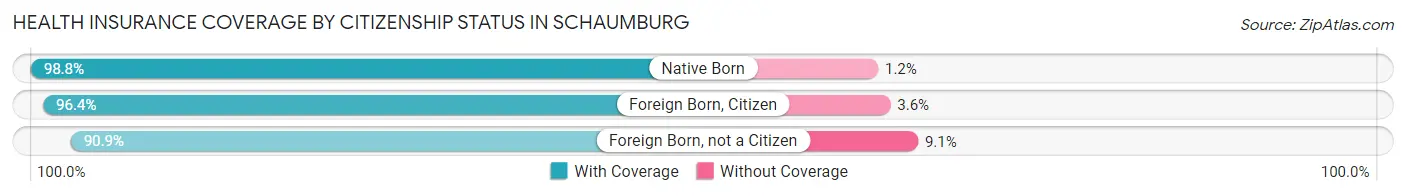
| Citizenship Status | With Coverage | Without Coverage |
| Native Born | 5,790 (98.8%) | 72 (1.2%) |
| Foreign Born, Citizen | 12,002 (96.4%) | 454 (3.6%) |
| Foreign Born, not a Citizen | 5,152 (90.9%) | 514 (9.1%) |
Health Insurance Coverage by Household Income in Schaumburg
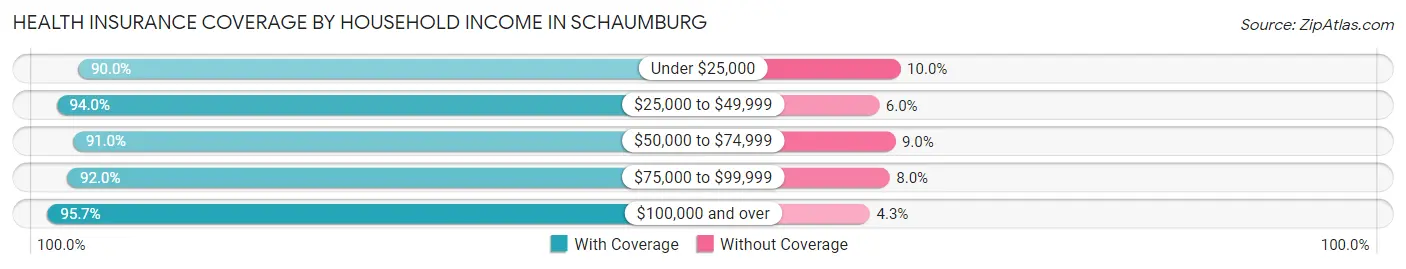
| Household Income | With Coverage | Without Coverage |
| Under $25,000 | 4,456 (90.0%) | 495 (10.0%) |
| $25,000 to $49,999 | 6,857 (94.0%) | 438 (6.0%) |
| $50,000 to $74,999 | 10,260 (91.0%) | 1,017 (9.0%) |
| $75,000 to $99,999 | 11,105 (92.0%) | 962 (8.0%) |
| $100,000 and over | 39,717 (95.7%) | 1,770 (4.3%) |
Public vs Private Health Insurance Coverage by Age in Schaumburg
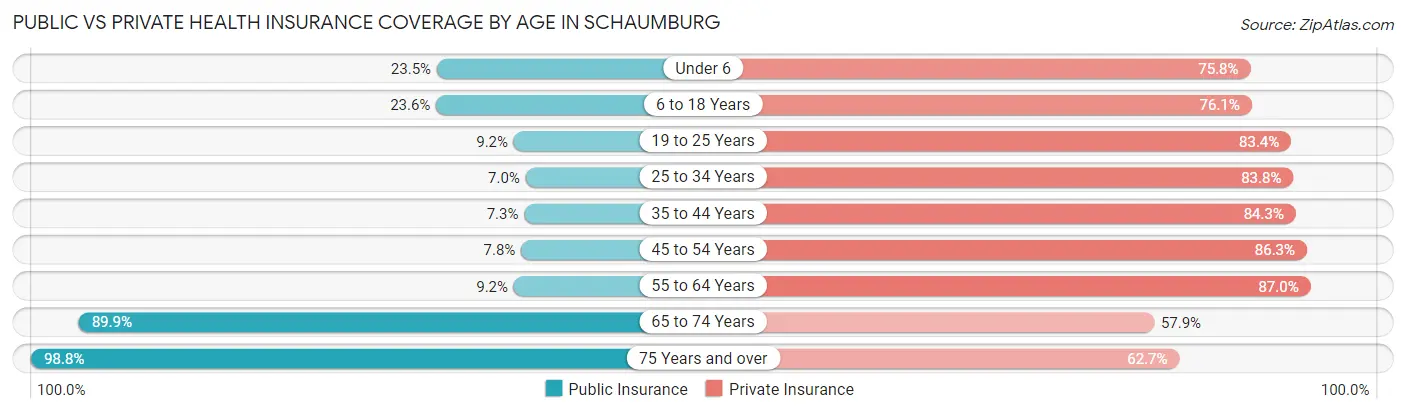
| Age Bracket | Public Insurance | Private Insurance |
| Under 6 | 1,376 (23.5%) | 4,445 (75.8%) |
| 6 to 18 Years | 2,940 (23.6%) | 9,475 (76.1%) |
| 19 to 25 Years | 520 (9.2%) | 4,725 (83.4%) |
| 25 to 34 Years | 686 (7.0%) | 8,229 (83.8%) |
| 35 to 44 Years | 898 (7.2%) | 10,436 (84.3%) |
| 45 to 54 Years | 730 (7.8%) | 8,049 (86.3%) |
| 55 to 64 Years | 906 (9.2%) | 8,588 (87.0%) |
| 65 to 74 Years | 5,849 (89.9%) | 3,768 (57.9%) |
| 75 Years and over | 5,140 (98.8%) | 3,259 (62.6%) |
| Total | 19,045 (24.7%) | 60,974 (79.1%) |
Disability Status by Sex by Age in Schaumburg
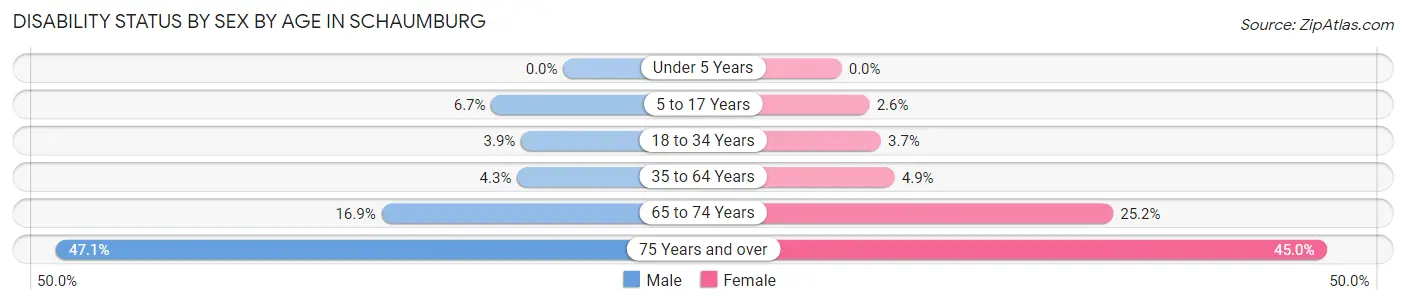
| Age Bracket | Male | Female |
| Under 5 Years | 0 (0.0%) | 0 (0.0%) |
| 5 to 17 Years | 462 (6.7%) | 160 (2.6%) |
| 18 to 34 Years | 307 (3.9%) | 294 (3.6%) |
| 35 to 64 Years | 675 (4.3%) | 778 (4.9%) |
| 65 to 74 Years | 497 (16.9%) | 897 (25.2%) |
| 75 Years and over | 982 (47.1%) | 1,401 (45.0%) |
Disability Class by Sex by Age in Schaumburg
Disability Class: Hearing Difficulty
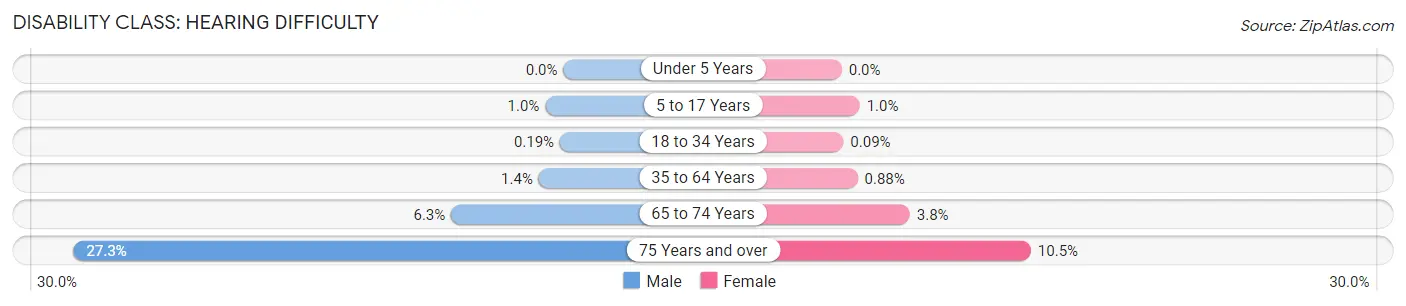
| Age Bracket | Male | Female |
| Under 5 Years | 0 (0.0%) | 0 (0.0%) |
| 5 to 17 Years | 70 (1.0%) | 62 (1.0%) |
| 18 to 34 Years | 15 (0.2%) | 7 (0.1%) |
| 35 to 64 Years | 216 (1.4%) | 140 (0.9%) |
| 65 to 74 Years | 184 (6.2%) | 135 (3.8%) |
| 75 Years and over | 569 (27.3%) | 328 (10.5%) |
Disability Class: Vision Difficulty
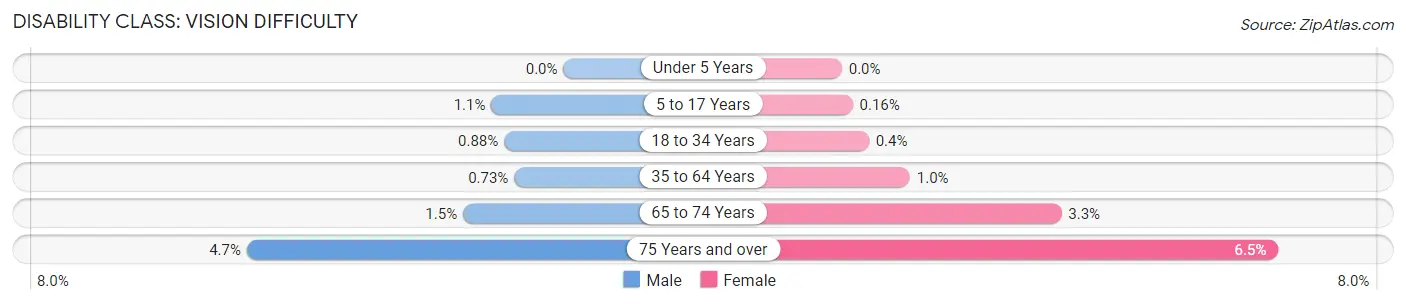
| Age Bracket | Male | Female |
| Under 5 Years | 0 (0.0%) | 0 (0.0%) |
| 5 to 17 Years | 74 (1.1%) | 10 (0.2%) |
| 18 to 34 Years | 69 (0.9%) | 32 (0.4%) |
| 35 to 64 Years | 115 (0.7%) | 160 (1.0%) |
| 65 to 74 Years | 44 (1.5%) | 116 (3.3%) |
| 75 Years and over | 98 (4.7%) | 202 (6.5%) |
Disability Class: Cognitive Difficulty
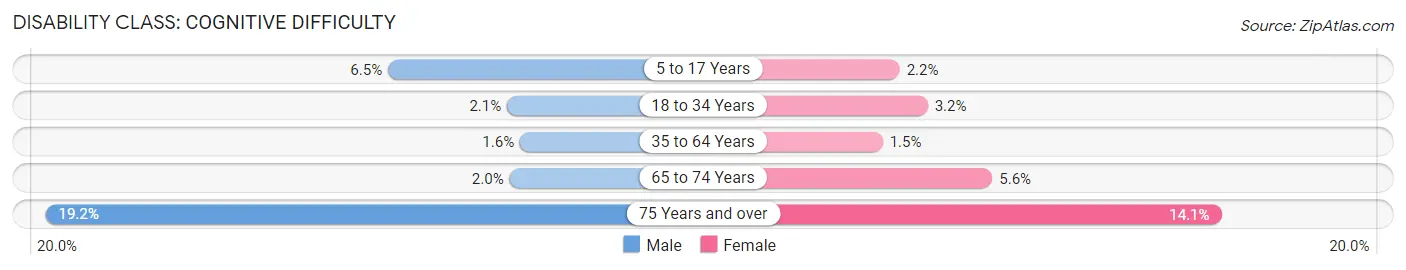
| Age Bracket | Male | Female |
| 5 to 17 Years | 450 (6.5%) | 133 (2.1%) |
| 18 to 34 Years | 164 (2.1%) | 257 (3.2%) |
| 35 to 64 Years | 253 (1.6%) | 240 (1.5%) |
| 65 to 74 Years | 59 (2.0%) | 199 (5.6%) |
| 75 Years and over | 401 (19.2%) | 439 (14.1%) |
Disability Class: Ambulatory Difficulty
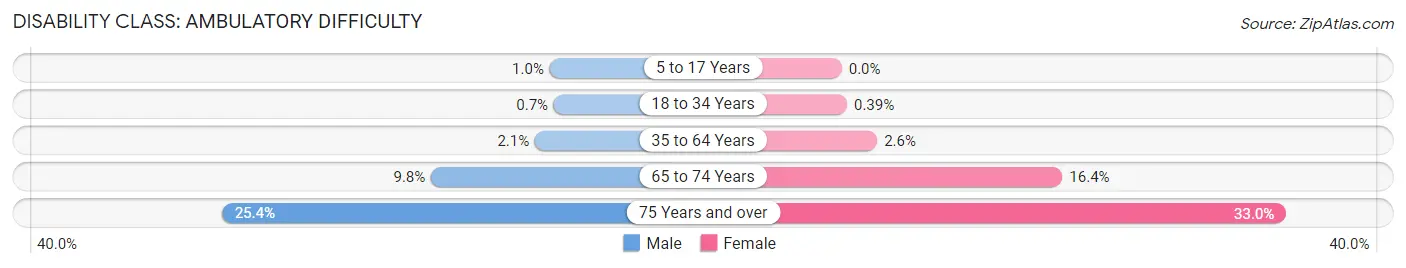
| Age Bracket | Male | Female |
| 5 to 17 Years | 70 (1.0%) | 0 (0.0%) |
| 18 to 34 Years | 55 (0.7%) | 31 (0.4%) |
| 35 to 64 Years | 331 (2.1%) | 416 (2.6%) |
| 65 to 74 Years | 289 (9.8%) | 583 (16.4%) |
| 75 Years and over | 529 (25.4%) | 1,028 (33.0%) |
Disability Class: Self-Care Difficulty
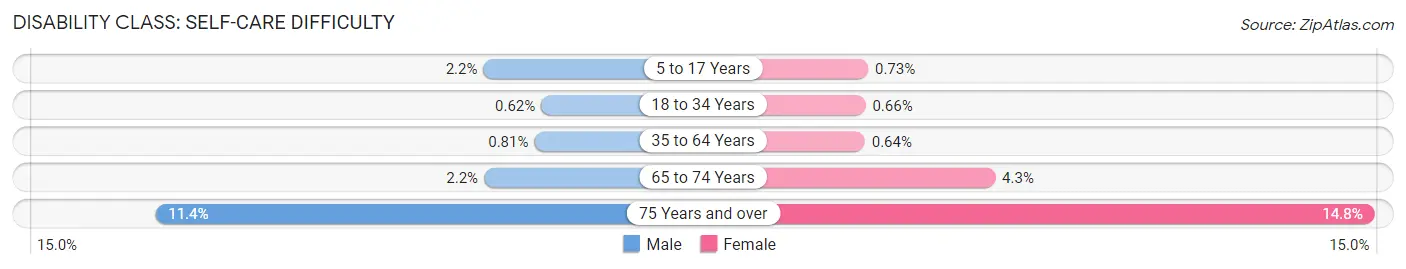
| Age Bracket | Male | Female |
| 5 to 17 Years | 154 (2.2%) | 45 (0.7%) |
| 18 to 34 Years | 49 (0.6%) | 53 (0.7%) |
| 35 to 64 Years | 127 (0.8%) | 101 (0.6%) |
| 65 to 74 Years | 65 (2.2%) | 152 (4.3%) |
| 75 Years and over | 237 (11.4%) | 462 (14.8%) |
Technology Access in Schaumburg
Computing Device Access in Schaumburg
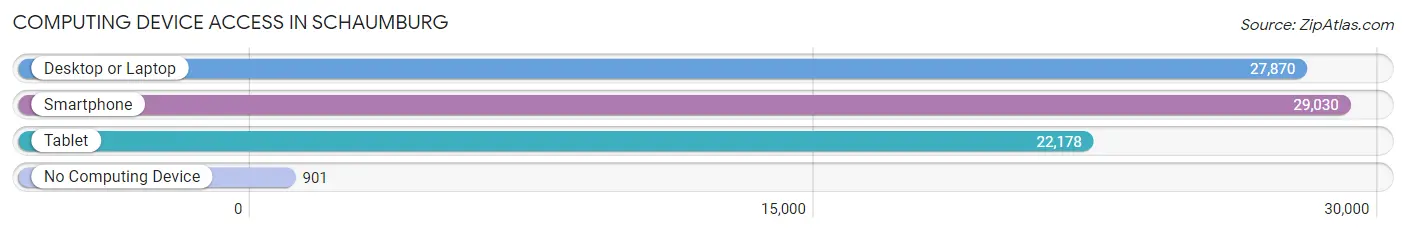
| Device Type | # Households | % Households |
| Desktop or Laptop | 27,870 | 87.2% |
| Smartphone | 29,030 | 90.8% |
| Tablet | 22,178 | 69.4% |
| No Computing Device | 901 | 2.8% |
| Total | 31,977 | 100.0% |
Internet Access in Schaumburg
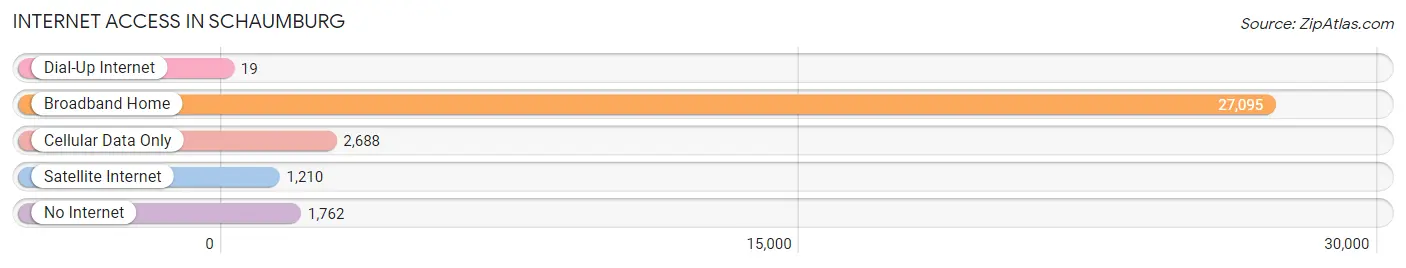
| Internet Type | # Households | % Households |
| Dial-Up Internet | 19 | 0.1% |
| Broadband Home | 27,095 | 84.7% |
| Cellular Data Only | 2,688 | 8.4% |
| Satellite Internet | 1,210 | 3.8% |
| No Internet | 1,762 | 5.5% |
| Total | 31,977 | 100.0% |
Schaumburg Summary
Schaumburg, Illinois is a village located in Cook and DuPage counties in the state of Illinois. It is a part of the Chicago metropolitan area and is located approximately 25 miles northwest of downtown Chicago. The village has a population of 74,227 as of the 2010 census, making it the largest community in the state of Illinois outside of the city of Chicago.
History
Schaumburg was first settled in the early 1800s by German immigrants who were looking for a place to farm. The village was originally known as Sarah’s Grove, named after the wife of one of the first settlers, John Meacham. The village was officially incorporated in 1956 and was named after the German town of Schaumberg, which was the hometown of the Meacham family.
Geography
Schaumburg is located in the northeastern part of Illinois, in Cook and DuPage counties. It is bordered by Hoffman Estates to the north, Elk Grove Village to the east, Rolling Meadows to the south, and Hanover Park to the west. The village covers an area of 19.3 square miles and has a population density of 3,817 people per square mile.
Economy
Schaumburg is home to a variety of businesses and industries, including retail, manufacturing, and technology. The village is home to the headquarters of Motorola Solutions, Zurich North America, and the American Academy of Pediatrics. It is also home to the Woodfield Mall, one of the largest shopping malls in the United States.
Demographics
As of the 2010 census, Schaumburg had a population of 74,227. The racial makeup of the village was 68.2% White, 8.3% African American, 0.3% Native American, 14.3% Asian, and 4.2% from other races. Hispanic or Latino of any race were 11.7% of the population. The median household income was $76,843 and the median family income was $90,945.
Schaumburg is a diverse community with a variety of cultures and backgrounds. The village is home to a large number of immigrants from India, China, and other countries. The village also has a large number of residents who are of German, Irish, and Polish descent.
Schaumburg is a vibrant and growing community that is home to a variety of businesses and industries. The village is a great place to live, work, and play, and is a great place to call home.
Common Questions
What is Per Capita Income in Schaumburg?
Per Capita income in Schaumburg is $46,922.
What is the Median Family Income in Schaumburg?
Median Family Income in Schaumburg is $108,109.
What is the Median Household income in Schaumburg?
Median Household Income in Schaumburg is $92,818.
What is Income or Wage Gap in Schaumburg?
Income or Wage Gap in Schaumburg is 29.7%.
Women in Schaumburg earn 70.3 cents for every dollar earned by a man.
What is Inequality or Gini Index in Schaumburg?
Inequality or Gini Index in Schaumburg is 0.40.
What is the Total Population of Schaumburg?
Total Population of Schaumburg is 77,571.
What is the Total Male Population of Schaumburg?
Total Male Population of Schaumburg is 38,289.
What is the Total Female Population of Schaumburg?
Total Female Population of Schaumburg is 39,282.
What is the Ratio of Males per 100 Females in Schaumburg?
There are 97.47 Males per 100 Females in Schaumburg.
What is the Ratio of Females per 100 Males in Schaumburg?
There are 102.59 Females per 100 Males in Schaumburg.
What is the Median Population Age in Schaumburg?
Median Population Age in Schaumburg is 39.0 Years.
What is the Average Family Size in Schaumburg
Average Family Size in Schaumburg is 3.1 People.
What is the Average Household Size in Schaumburg
Average Household Size in Schaumburg is 2.4 People.
How Large is the Labor Force in Schaumburg?
There are 42,855 People in the Labor Forcein in Schaumburg.
What is the Percentage of People in the Labor Force in Schaumburg?
69.8% of People are in the Labor Force in Schaumburg.
What is the Unemployment Rate in Schaumburg?
Unemployment Rate in Schaumburg is 3.9%.