Zip Codes with the Highest Percentage of Population Employed in Computer, Engineering & Science in Champaign, IL
RELATED REPORTS & OPTIONS
Computer, Engineering & Science
Champaign
Compare Zip Codes
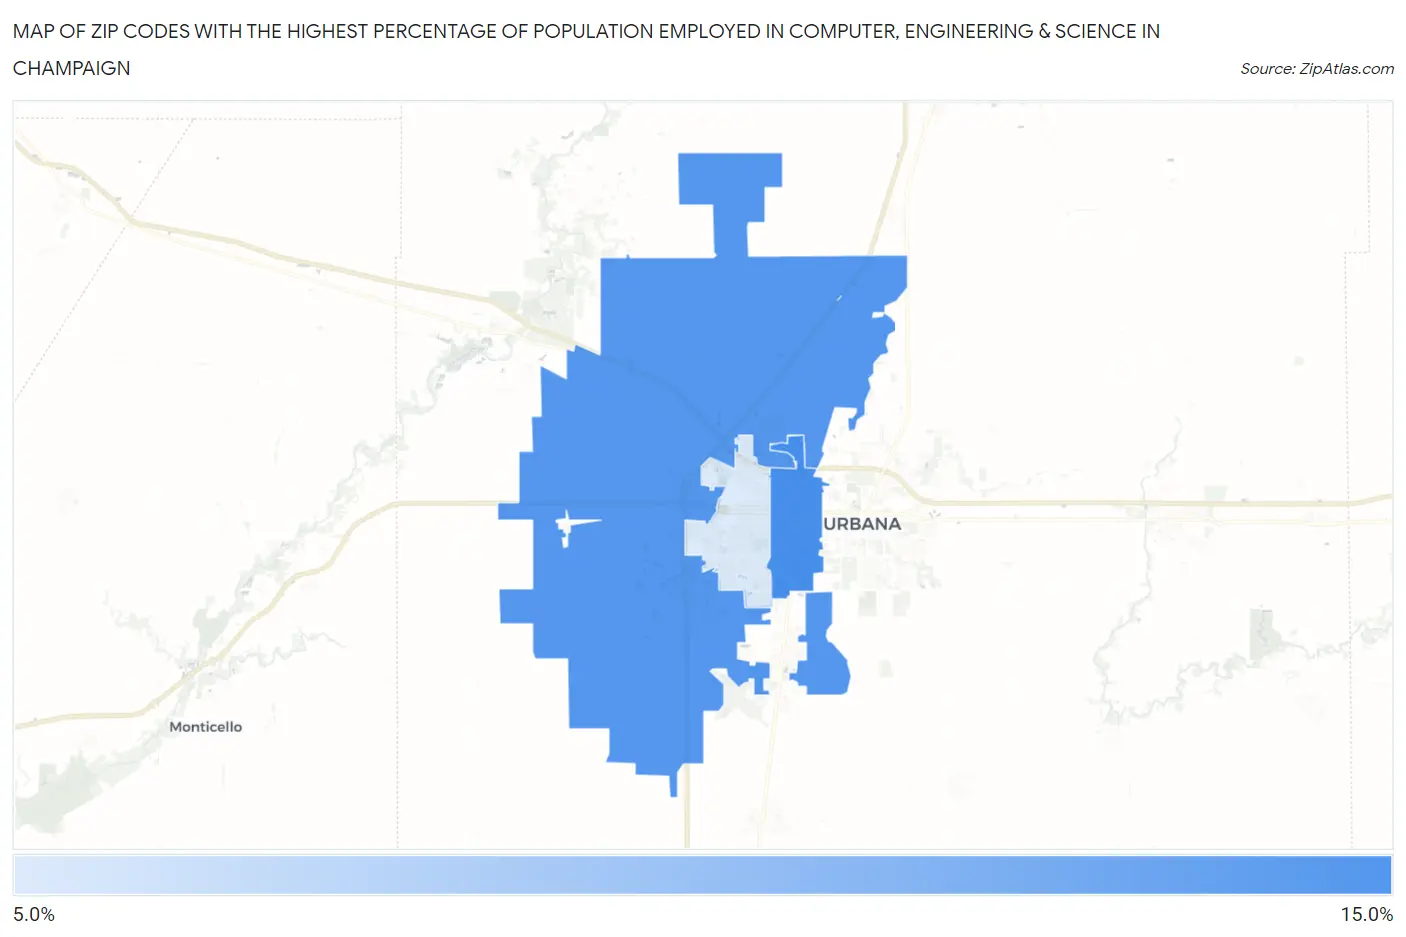
Map of Zip Codes with the Highest Percentage of Population Employed in Computer, Engineering & Science in Champaign
8.1%
11.4%
Zip Codes with the Highest Percentage of Population Employed in Computer, Engineering & Science in Champaign, IL
| Zip Code | % Employed | vs State | vs National | |
| 1. | 61820 | 11.4% | 6.4%(+4.93)#76 | 6.8%(+4.61)#2,366 |
| 2. | 61822 | 11.1% | 6.4%(+4.63)#82 | 6.8%(+4.30)#2,532 |
| 3. | 61821 | 8.1% | 6.4%(+1.68)#176 | 6.8%(+1.36)#5,097 |
1
Common Questions
What are the Top Zip Codes with the Highest Percentage of Population Employed in Computer, Engineering & Science in Champaign, IL?
Top Zip Codes with the Highest Percentage of Population Employed in Computer, Engineering & Science in Champaign, IL are:
What zip code has the Highest Percentage of Population Employed in Computer, Engineering & Science in Champaign, IL?
61820 has the Highest Percentage of Population Employed in Computer, Engineering & Science in Champaign, IL with 11.4%.
What is the Percentage of Population Employed in Computer, Engineering & Science in Champaign, IL?
Percentage of Population Employed in Computer, Engineering & Science in Champaign is 10.4%.
What is the Percentage of Population Employed in Computer, Engineering & Science in Illinois?
Percentage of Population Employed in Computer, Engineering & Science in Illinois is 6.4%.
What is the Percentage of Population Employed in Computer, Engineering & Science in the United States?
Percentage of Population Employed in Computer, Engineering & Science in the United States is 6.8%.