Zip Codes with the Highest Percentage of Population Employed in Computer, Engineering & Science in Plainfield, IL
RELATED REPORTS & OPTIONS
Computer, Engineering & Science
Plainfield
Compare Zip Codes
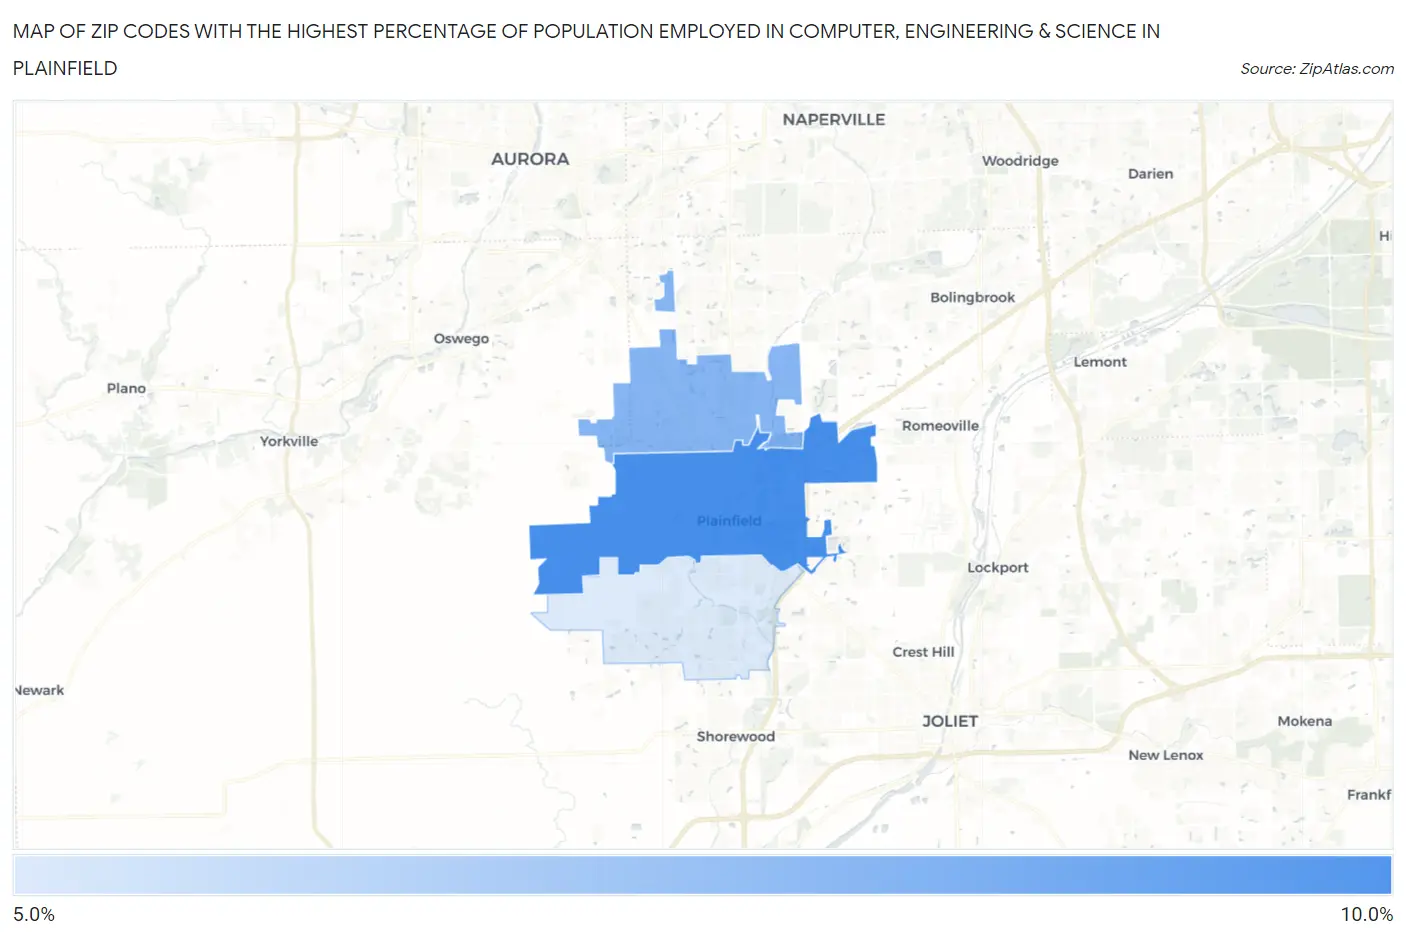
Map of Zip Codes with the Highest Percentage of Population Employed in Computer, Engineering & Science in Plainfield
5.5%
9.8%
Zip Codes with the Highest Percentage of Population Employed in Computer, Engineering & Science in Plainfield, IL
| Zip Code | % Employed | vs State | vs National | |
| 1. | 60544 | 9.8% | 6.4%(+3.32)#110 | 6.8%(+2.99)#3,404 |
| 2. | 60585 | 7.9% | 6.4%(+1.50)#188 | 6.8%(+1.17)#5,360 |
| 3. | 60586 | 5.5% | 6.4%(-0.965)#385 | 6.8%(-1.29)#10,138 |
1
Common Questions
What are the Top Zip Codes with the Highest Percentage of Population Employed in Computer, Engineering & Science in Plainfield, IL?
Top Zip Codes with the Highest Percentage of Population Employed in Computer, Engineering & Science in Plainfield, IL are:
What zip code has the Highest Percentage of Population Employed in Computer, Engineering & Science in Plainfield, IL?
60544 has the Highest Percentage of Population Employed in Computer, Engineering & Science in Plainfield, IL with 9.8%.
What is the Percentage of Population Employed in Computer, Engineering & Science in Plainfield, IL?
Percentage of Population Employed in Computer, Engineering & Science in Plainfield is 8.3%.
What is the Percentage of Population Employed in Computer, Engineering & Science in Illinois?
Percentage of Population Employed in Computer, Engineering & Science in Illinois is 6.4%.
What is the Percentage of Population Employed in Computer, Engineering & Science in the United States?
Percentage of Population Employed in Computer, Engineering & Science in the United States is 6.8%.