Port Byron, IL Map & Demographics
Port Byron Map
Port Byron Overview
$46,069
PER CAPITA INCOME
$113,558
AVG FAMILY INCOME
$92,159
AVG HOUSEHOLD INCOME
61.4%
WAGE / INCOME GAP [ % ]
38.6¢/ $1
WAGE / INCOME GAP [ $ ]
0.42
INEQUALITY / GINI INDEX
1,904
TOTAL POPULATION
978
MALE POPULATION
926
FEMALE POPULATION
105.62
MALES / 100 FEMALES
94.68
FEMALES / 100 MALES
42.6
MEDIAN AGE
3.1
AVG FAMILY SIZE
2.5
AVG HOUSEHOLD SIZE
911
LABOR FORCE [ PEOPLE ]
61.0%
PERCENT IN LABOR FORCE
3.4%
UNEMPLOYMENT RATE
Port Byron Zip Codes
Port Byron Area Codes
Income in Port Byron
Income Overview in Port Byron
Per Capita Income in Port Byron is $46,069, while median incomes of families and households are $113,558 and $92,159 respectively.
| Characteristic | Number | Measure |
| Per Capita Income | 1,904 | $46,069 |
| Median Family Income | 519 | $113,558 |
| Mean Family Income | 519 | $135,644 |
| Median Household Income | 755 | $92,159 |
| Mean Household Income | 755 | $113,506 |
| Income Deficit | 519 | $0 |
| Wage / Income Gap (%) | 1,904 | 61.41% |
| Wage / Income Gap ($) | 1,904 | 38.59¢ per $1 |
| Gini / Inequality Index | 1,904 | 0.42 |
Earnings by Sex in Port Byron
Average Earnings in Port Byron are $53,854, $80,987 for men and $31,250 for women, a difference of 61.4%.
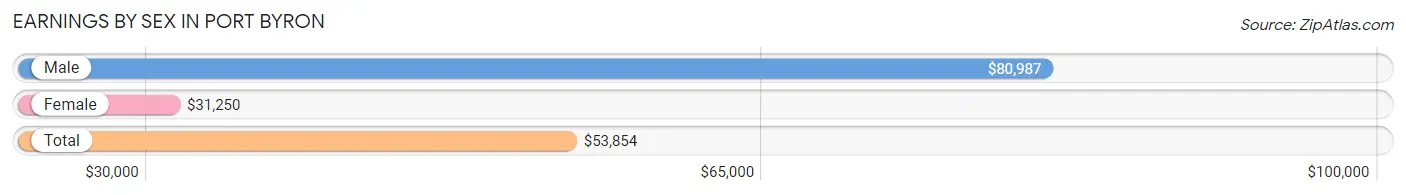
| Sex | Number | Average Earnings |
| Male | 503 (51.4%) | $80,987 |
| Female | 476 (48.6%) | $31,250 |
| Total | 979 (100.0%) | $53,854 |
Earnings by Sex by Income Bracket in Port Byron
The most common earnings brackets in Port Byron are $100,000+ for men (189 | 37.6%) and $25,000 to $29,999 for women (68 | 14.3%).
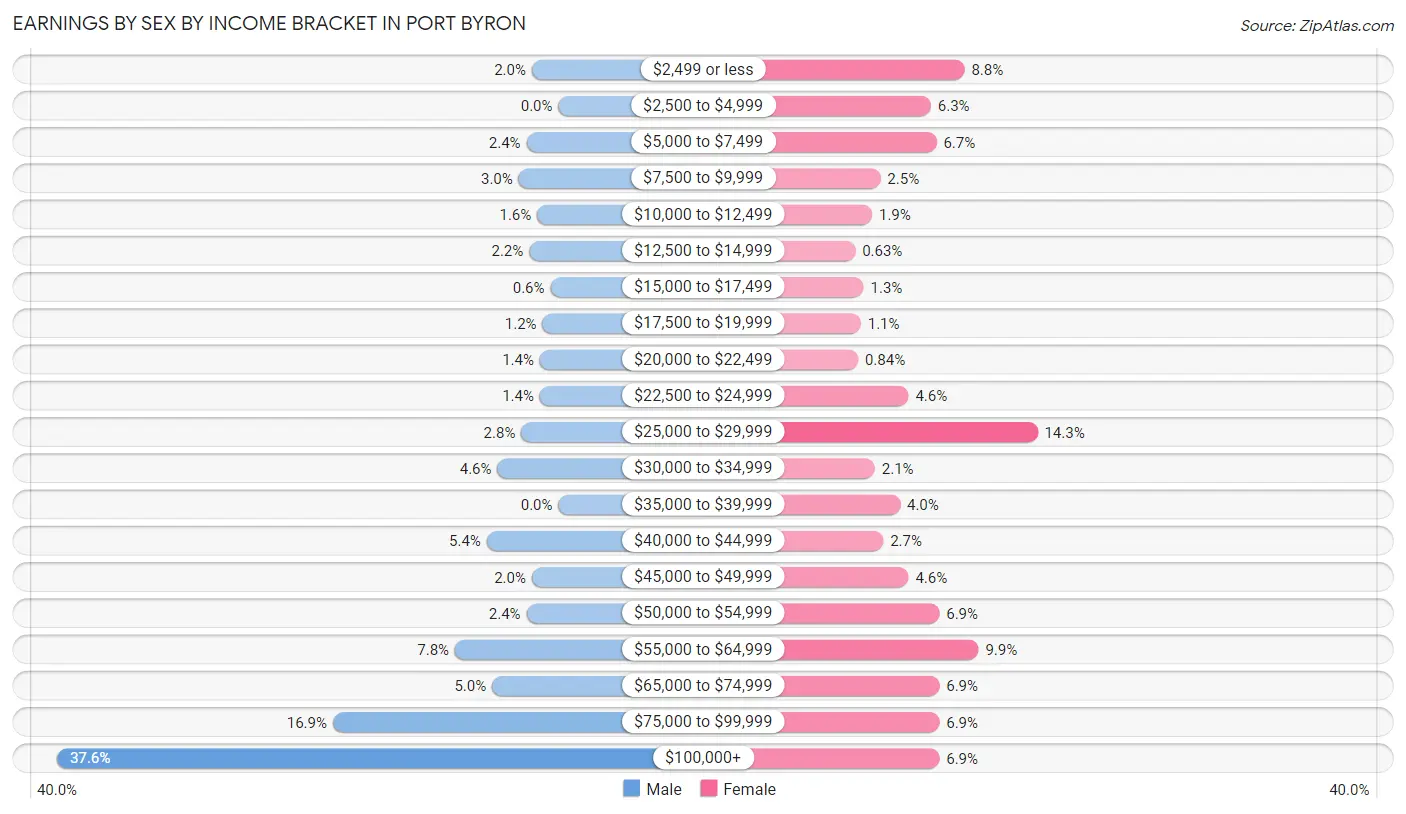
| Income | Male | Female |
| $2,499 or less | 10 (2.0%) | 42 (8.8%) |
| $2,500 to $4,999 | 0 (0.0%) | 30 (6.3%) |
| $5,000 to $7,499 | 12 (2.4%) | 32 (6.7%) |
| $7,500 to $9,999 | 15 (3.0%) | 12 (2.5%) |
| $10,000 to $12,499 | 8 (1.6%) | 9 (1.9%) |
| $12,500 to $14,999 | 11 (2.2%) | 3 (0.6%) |
| $15,000 to $17,499 | 3 (0.6%) | 6 (1.3%) |
| $17,500 to $19,999 | 6 (1.2%) | 5 (1.1%) |
| $20,000 to $22,499 | 7 (1.4%) | 4 (0.8%) |
| $22,500 to $24,999 | 7 (1.4%) | 22 (4.6%) |
| $25,000 to $29,999 | 14 (2.8%) | 68 (14.3%) |
| $30,000 to $34,999 | 23 (4.6%) | 10 (2.1%) |
| $35,000 to $39,999 | 0 (0.0%) | 19 (4.0%) |
| $40,000 to $44,999 | 27 (5.4%) | 13 (2.7%) |
| $45,000 to $49,999 | 10 (2.0%) | 22 (4.6%) |
| $50,000 to $54,999 | 12 (2.4%) | 33 (6.9%) |
| $55,000 to $64,999 | 39 (7.7%) | 47 (9.9%) |
| $65,000 to $74,999 | 25 (5.0%) | 33 (6.9%) |
| $75,000 to $99,999 | 85 (16.9%) | 33 (6.9%) |
| $100,000+ | 189 (37.6%) | 33 (6.9%) |
| Total | 503 (100.0%) | 476 (100.0%) |
Earnings by Sex by Educational Attainment in Port Byron
Average earnings in Port Byron are $88,750 for men and $41,607 for women, a difference of 53.1%. Men with an educational attainment of graduate degree enjoy the highest average annual earnings of $112,813, while those with less than high school education earn the least with $41,667. Women with an educational attainment of graduate degree earn the most with the average annual earnings of $57,109, while those with high school diploma education have the smallest earnings of $22,813.
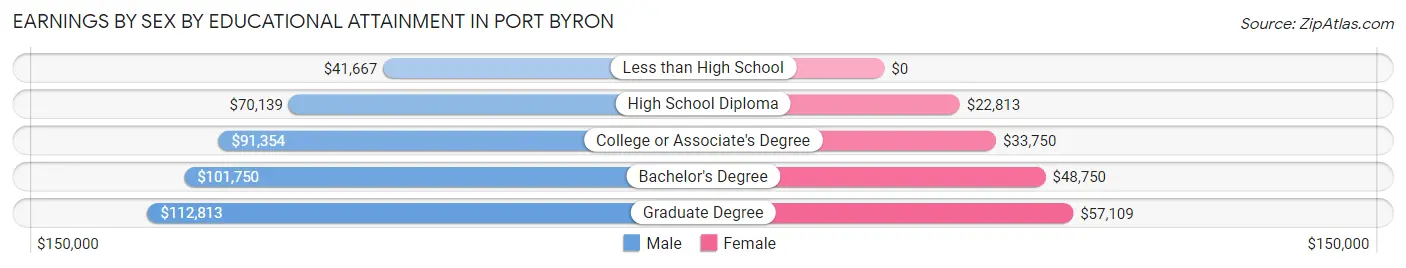
| Educational Attainment | Male Income | Female Income |
| Less than High School | $41,667 | $0 |
| High School Diploma | $70,139 | $22,813 |
| College or Associate's Degree | $91,354 | $33,750 |
| Bachelor's Degree | $101,750 | $48,750 |
| Graduate Degree | $112,813 | $57,109 |
| Total | $88,750 | $41,607 |
Family Income in Port Byron
Family Income Brackets in Port Byron
According to the Port Byron family income data, there are 132 families falling into the $100,000 to $149,999 income range, which is the most common income bracket and makes up 25.4% of all families. Conversely, the $10,000 to $14,999 income bracket is the least frequent group with only 6 families (1.2%) belonging to this category.
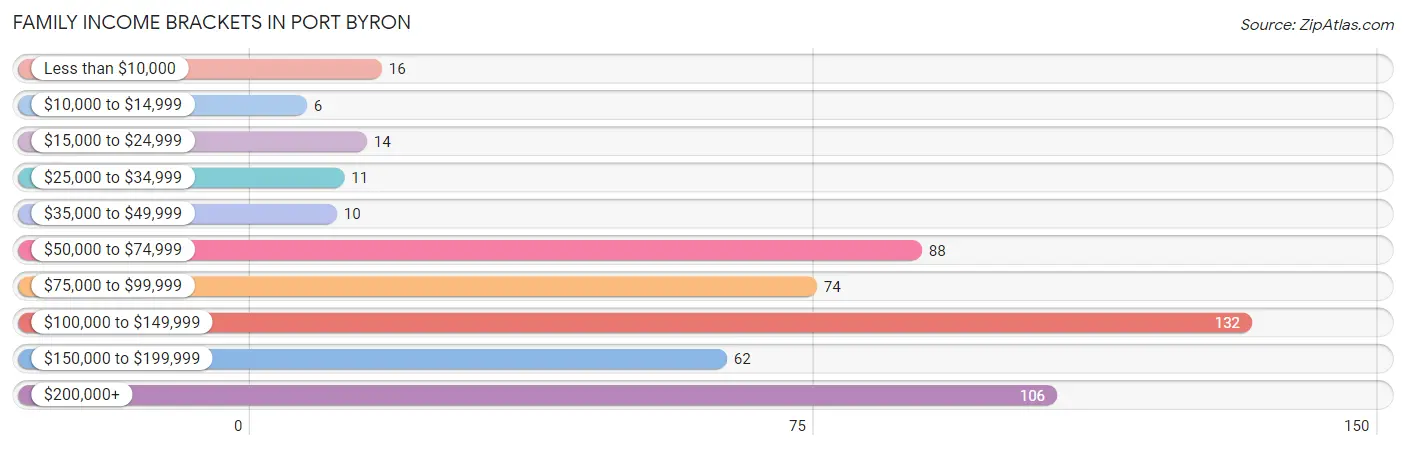
| Income Bracket | # Families | % Families |
| Less than $10,000 | 16 | 3.1% |
| $10,000 to $14,999 | 6 | 1.2% |
| $15,000 to $24,999 | 14 | 2.7% |
| $25,000 to $34,999 | 11 | 2.1% |
| $35,000 to $49,999 | 10 | 1.9% |
| $50,000 to $74,999 | 88 | 17.0% |
| $75,000 to $99,999 | 74 | 14.3% |
| $100,000 to $149,999 | 132 | 25.4% |
| $150,000 to $199,999 | 62 | 11.9% |
| $200,000+ | 106 | 20.4% |
Family Income by Famaliy Size in Port Byron
4-person families (129 | 24.9%) account for the highest median family income in Port Byron with $163,750 per family, while 2-person families (252 | 48.5%) have the highest median income of $44,375 per family member.
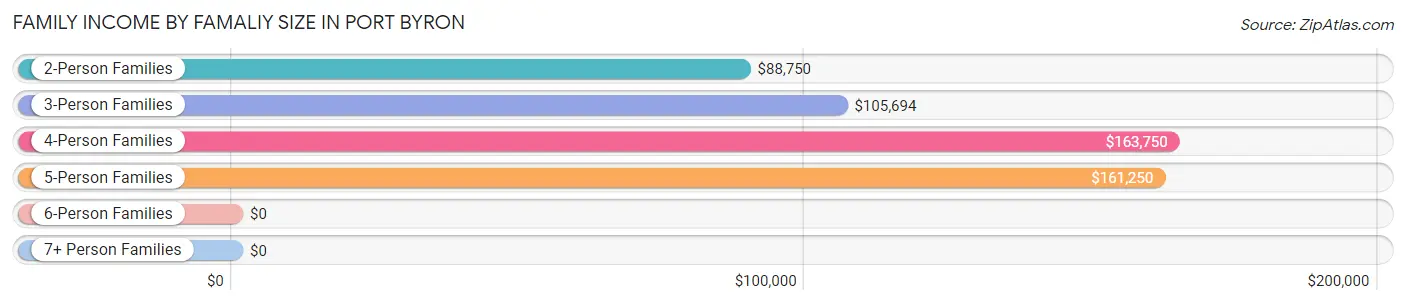
| Income Bracket | # Families | Median Income |
| 2-Person Families | 252 (48.5%) | $88,750 |
| 3-Person Families | 103 (19.9%) | $105,694 |
| 4-Person Families | 129 (24.9%) | $163,750 |
| 5-Person Families | 32 (6.2%) | $161,250 |
| 6-Person Families | 2 (0.4%) | $0 |
| 7+ Person Families | 1 (0.2%) | $0 |
| Total | 519 (100.0%) | $113,558 |
Family Income by Number of Earners in Port Byron
The median family income in Port Byron is $113,558, with families comprising 3+ earners (46) having the highest median family income of $206,250, while families with no earners (62) have the lowest median family income of $67,500, accounting for 8.9% and 11.9% of families, respectively.
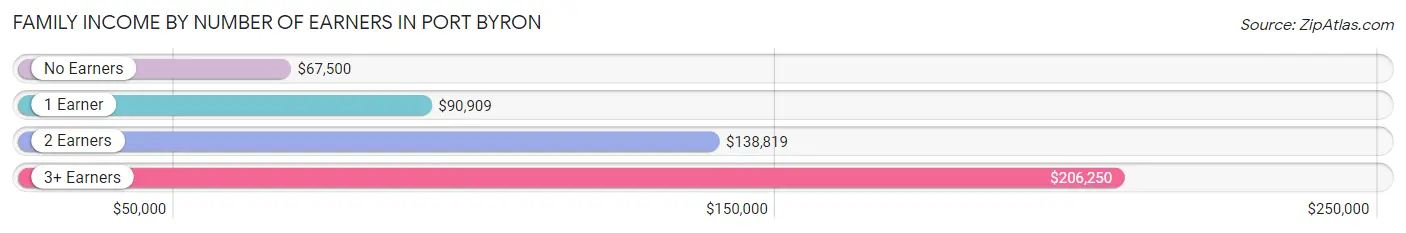
| Number of Earners | # Families | Median Income |
| No Earners | 62 (11.9%) | $67,500 |
| 1 Earner | 198 (38.2%) | $90,909 |
| 2 Earners | 213 (41.0%) | $138,819 |
| 3+ Earners | 46 (8.9%) | $206,250 |
| Total | 519 (100.0%) | $113,558 |
Household Income in Port Byron
Household Income Brackets in Port Byron
With 167 households falling in the category, the $100,000 to $149,999 income range is the most frequent in Port Byron, accounting for 22.1% of all households. In contrast, only 22 households (2.9%) fall into the $10,000 to $14,999 income bracket, making it the least populous group.
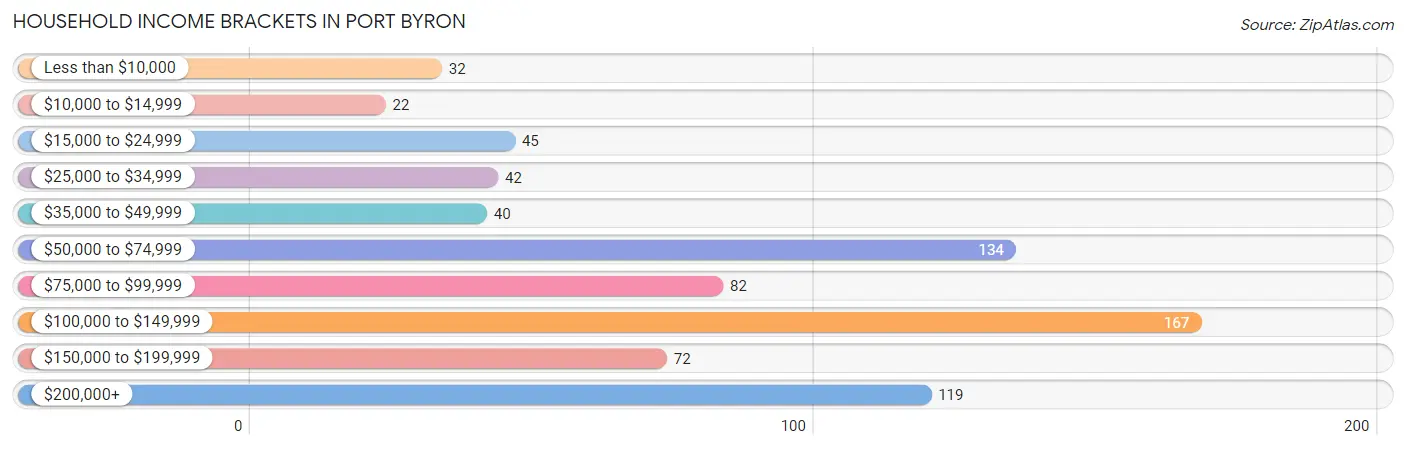
| Income Bracket | # Households | % Households |
| Less than $10,000 | 32 | 4.2% |
| $10,000 to $14,999 | 22 | 2.9% |
| $15,000 to $24,999 | 45 | 6.0% |
| $25,000 to $34,999 | 42 | 5.6% |
| $35,000 to $49,999 | 40 | 5.3% |
| $50,000 to $74,999 | 134 | 17.7% |
| $75,000 to $99,999 | 82 | 10.9% |
| $100,000 to $149,999 | 167 | 22.1% |
| $150,000 to $199,999 | 72 | 9.5% |
| $200,000+ | 119 | 15.8% |
Household Income by Householder Age in Port Byron
The median household income in Port Byron is $92,159, with the highest median household income of $135,000 found in the 25 to 44 years age bracket for the primary householder. A total of 210 households (27.8%) fall into this category. Meanwhile, the 15 to 24 years age bracket for the primary householder has the lowest median household income of $0, with 15 households (2.0%) in this group.
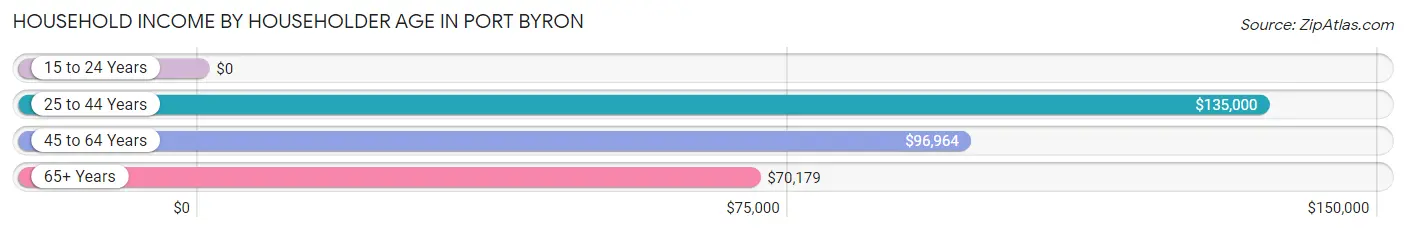
| Income Bracket | # Households | Median Income |
| 15 to 24 Years | 15 (2.0%) | $0 |
| 25 to 44 Years | 210 (27.8%) | $135,000 |
| 45 to 64 Years | 311 (41.2%) | $96,964 |
| 65+ Years | 219 (29.0%) | $70,179 |
| Total | 755 (100.0%) | $92,159 |
Poverty in Port Byron
Income Below Poverty by Sex and Age in Port Byron
With 6.2% poverty level for males and 9.2% for females among the residents of Port Byron, 25 to 34 year old males and 15 year old females are the most vulnerable to poverty, with 16 males (17.6%) and 8 females (57.1%) in their respective age groups living below the poverty level.
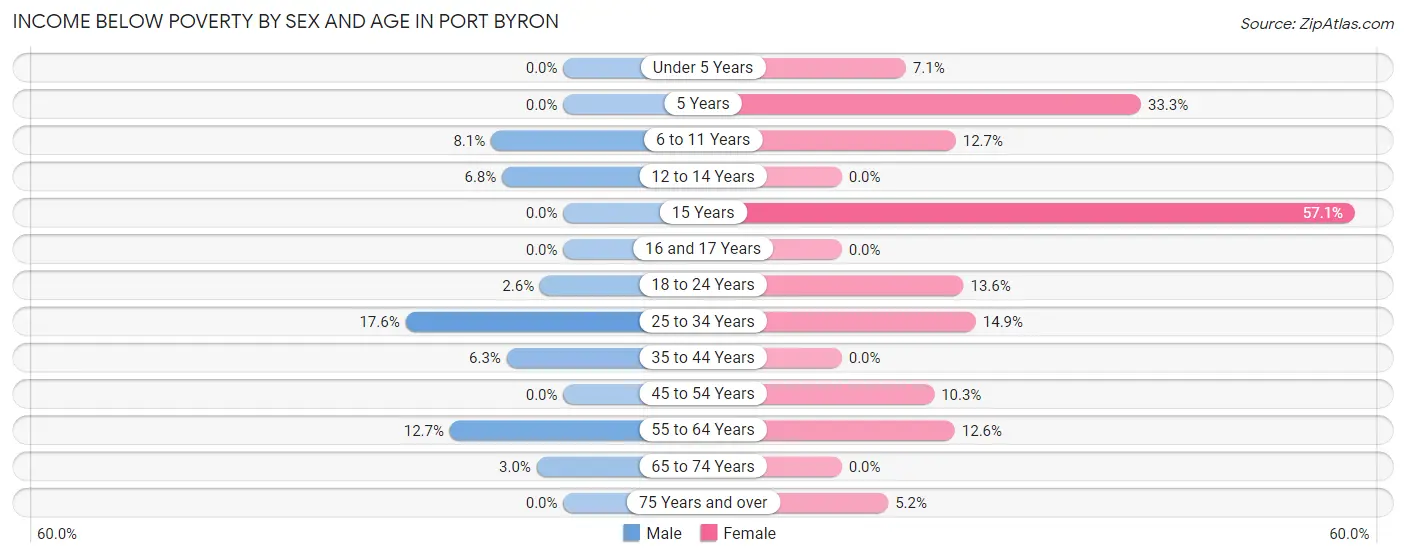
| Age Bracket | Male | Female |
| Under 5 Years | 0 (0.0%) | 4 (7.1%) |
| 5 Years | 0 (0.0%) | 3 (33.3%) |
| 6 to 11 Years | 7 (8.1%) | 8 (12.7%) |
| 12 to 14 Years | 3 (6.8%) | 0 (0.0%) |
| 15 Years | 0 (0.0%) | 8 (57.1%) |
| 16 and 17 Years | 0 (0.0%) | 0 (0.0%) |
| 18 to 24 Years | 2 (2.6%) | 8 (13.6%) |
| 25 to 34 Years | 16 (17.6%) | 20 (14.9%) |
| 35 to 44 Years | 7 (6.3%) | 0 (0.0%) |
| 45 to 54 Years | 0 (0.0%) | 14 (10.3%) |
| 55 to 64 Years | 21 (12.7%) | 17 (12.6%) |
| 65 to 74 Years | 3 (3.0%) | 0 (0.0%) |
| 75 Years and over | 0 (0.0%) | 3 (5.2%) |
| Total | 59 (6.2%) | 85 (9.2%) |
Income Above Poverty by Sex and Age in Port Byron
According to the poverty statistics in Port Byron, males aged under 5 years and females aged 12 to 14 years are the age groups that are most secure financially, with 100.0% of males and 100.0% of females in these age groups living above the poverty line.
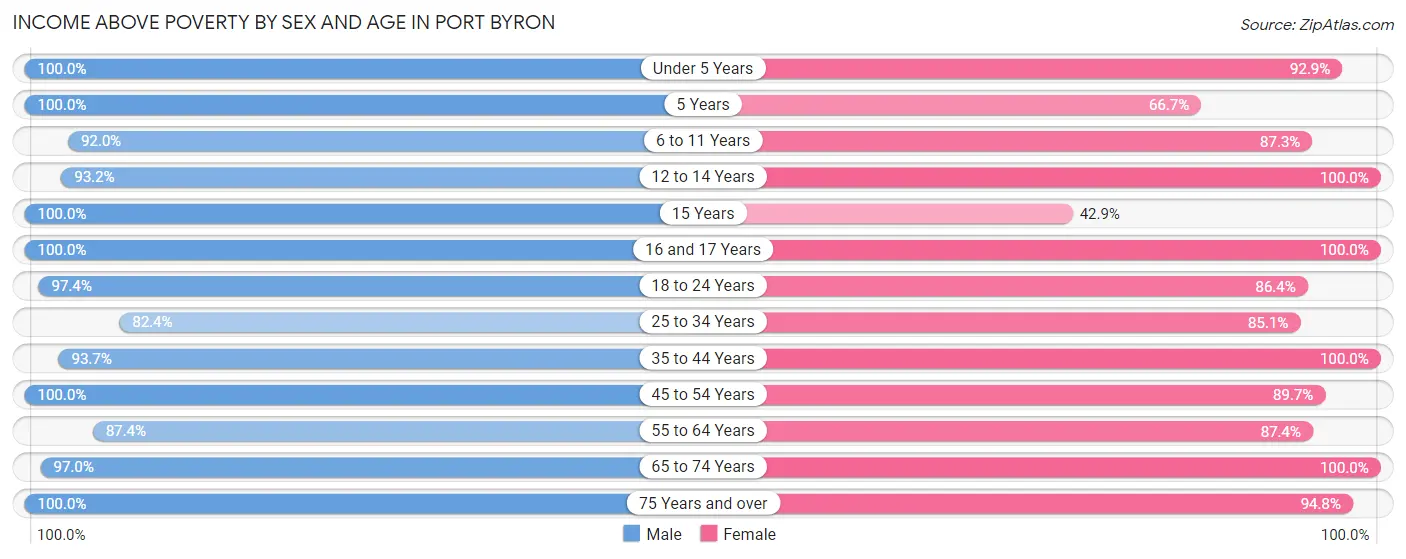
| Age Bracket | Male | Female |
| Under 5 Years | 47 (100.0%) | 52 (92.9%) |
| 5 Years | 20 (100.0%) | 6 (66.7%) |
| 6 to 11 Years | 80 (91.9%) | 55 (87.3%) |
| 12 to 14 Years | 41 (93.2%) | 35 (100.0%) |
| 15 Years | 13 (100.0%) | 6 (42.9%) |
| 16 and 17 Years | 12 (100.0%) | 39 (100.0%) |
| 18 to 24 Years | 75 (97.4%) | 51 (86.4%) |
| 25 to 34 Years | 75 (82.4%) | 114 (85.1%) |
| 35 to 44 Years | 104 (93.7%) | 82 (100.0%) |
| 45 to 54 Years | 126 (100.0%) | 122 (89.7%) |
| 55 to 64 Years | 145 (87.4%) | 118 (87.4%) |
| 65 to 74 Years | 98 (97.0%) | 106 (100.0%) |
| 75 Years and over | 61 (100.0%) | 55 (94.8%) |
| Total | 897 (93.8%) | 841 (90.8%) |
Income Below Poverty Among Married-Couple Families in Port Byron
The poverty statistics for married-couple families in Port Byron show that 5.0% or 22 of the total 438 families live below the poverty line. Families with 1 or 2 children have the highest poverty rate of 7.1%, comprising of 11 families. On the other hand, families with 3 or 4 children have the lowest poverty rate of 0.0%, which includes 0 families.
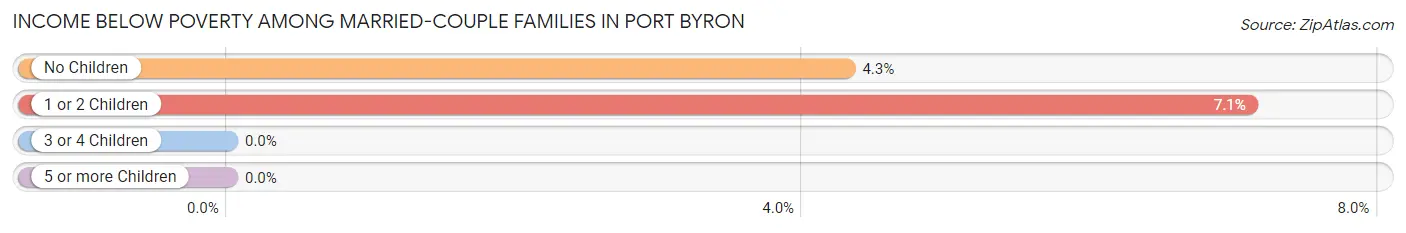
| Children | Above Poverty | Below Poverty |
| No Children | 245 (95.7%) | 11 (4.3%) |
| 1 or 2 Children | 144 (92.9%) | 11 (7.1%) |
| 3 or 4 Children | 26 (100.0%) | 0 (0.0%) |
| 5 or more Children | 1 (100.0%) | 0 (0.0%) |
| Total | 416 (95.0%) | 22 (5.0%) |
Income Below Poverty Among Single-Parent Households in Port Byron
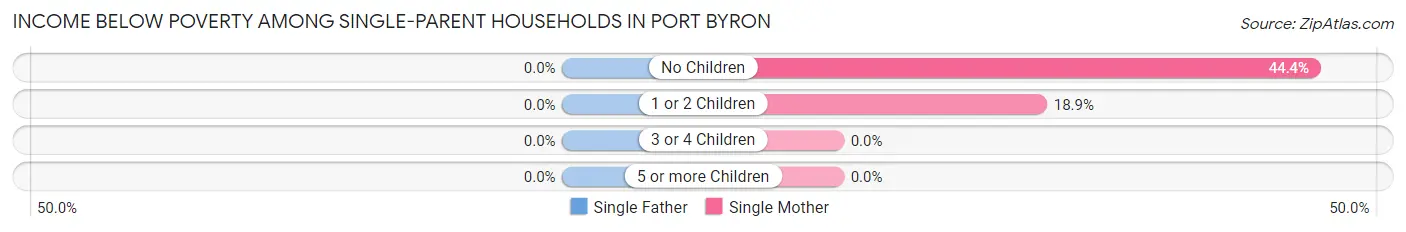
| Children | Single Father | Single Mother |
| No Children | 0 (0.0%) | 4 (44.4%) |
| 1 or 2 Children | 0 (0.0%) | 7 (18.9%) |
| 3 or 4 Children | 0 (0.0%) | 0 (0.0%) |
| 5 or more Children | 0 (0.0%) | 0 (0.0%) |
| Total | 0 (0.0%) | 11 (23.9%) |
Income Below Poverty Among Married-Couple vs Single-Parent Households in Port Byron
The poverty data for Port Byron shows that 22 of the married-couple family households (5.0%) and 11 of the single-parent households (13.6%) are living below the poverty level. Within the married-couple family households, those with 1 or 2 children have the highest poverty rate, with 11 households (7.1%) falling below the poverty line. Among the single-parent households, those with 1 or 2 children have the highest poverty rate, with 7 household (14.6%) living below poverty.
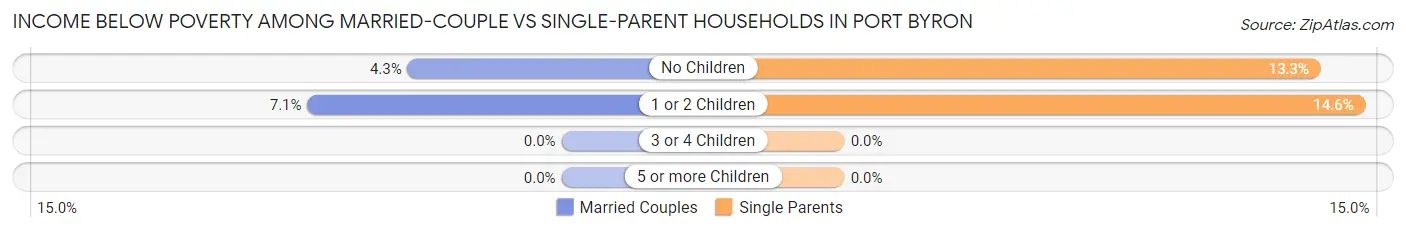
| Children | Married-Couple Families | Single-Parent Households |
| No Children | 11 (4.3%) | 4 (13.3%) |
| 1 or 2 Children | 11 (7.1%) | 7 (14.6%) |
| 3 or 4 Children | 0 (0.0%) | 0 (0.0%) |
| 5 or more Children | 0 (0.0%) | 0 (0.0%) |
| Total | 22 (5.0%) | 11 (13.6%) |
Race in Port Byron
The most populous races in Port Byron are White / Caucasian (1,786 | 93.8%), Hispanic or Latino (93 | 4.9%), and Two or more Races (82 | 4.3%).
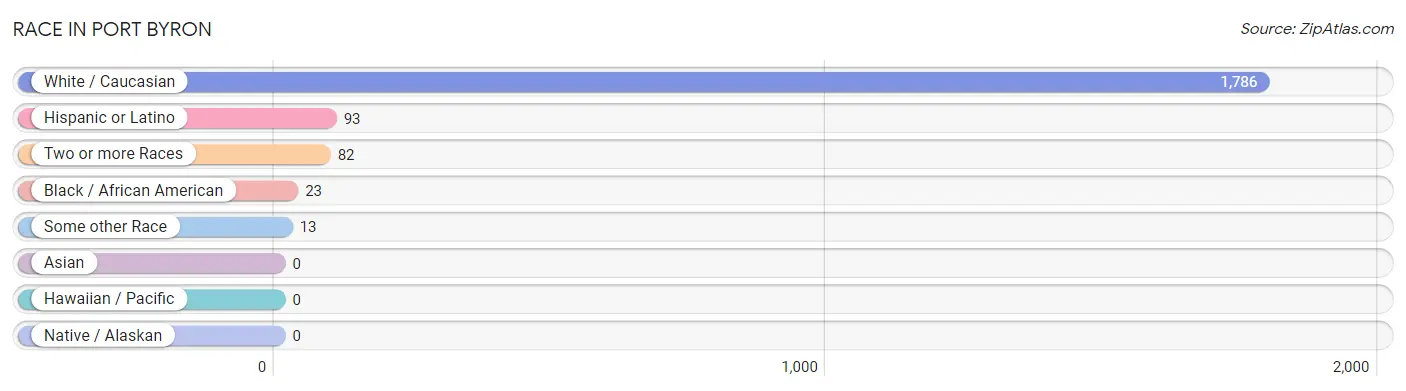
| Race | # Population | % Population |
| Asian | 0 | 0.0% |
| Black / African American | 23 | 1.2% |
| Hawaiian / Pacific | 0 | 0.0% |
| Hispanic or Latino | 93 | 4.9% |
| Native / Alaskan | 0 | 0.0% |
| White / Caucasian | 1,786 | 93.8% |
| Two or more Races | 82 | 4.3% |
| Some other Race | 13 | 0.7% |
| Total | 1,904 | 100.0% |
Ancestry in Port Byron
The most populous ancestries reported in Port Byron are German (613 | 32.2%), Irish (289 | 15.2%), English (209 | 11.0%), Swedish (137 | 7.2%), and Mexican (93 | 4.9%), together accounting for 70.4% of all Port Byron residents.
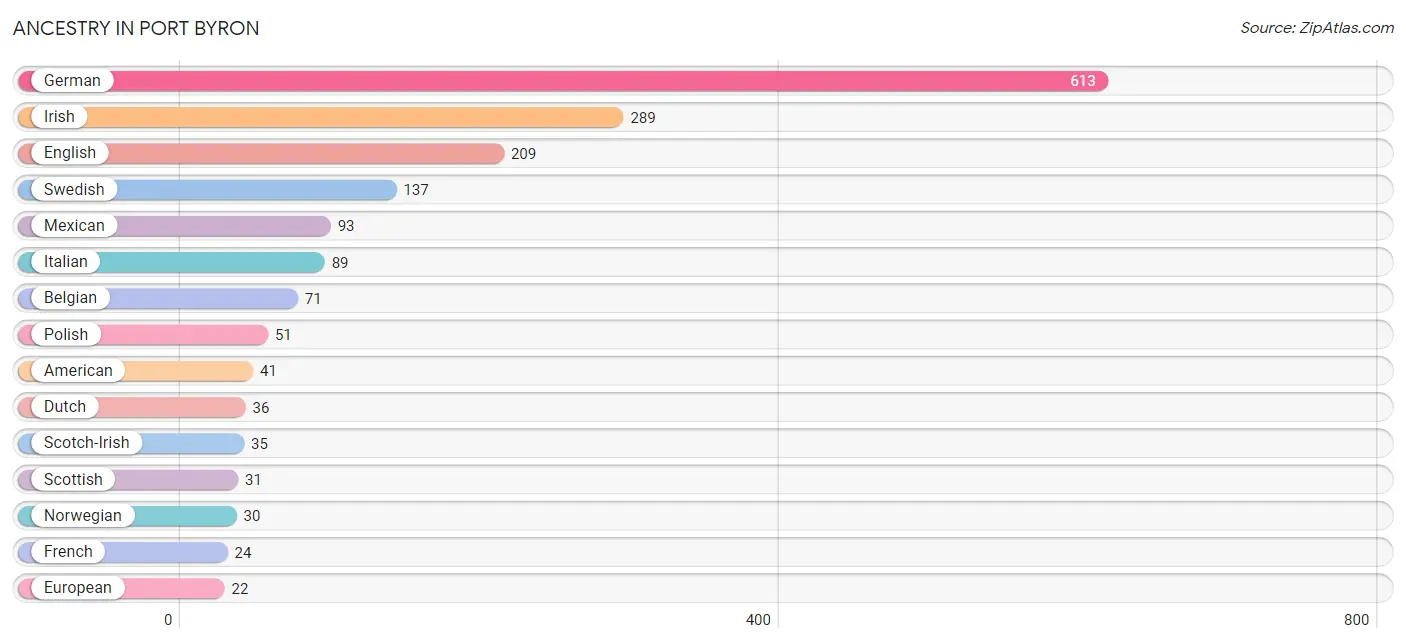
| Ancestry | # Population | % Population |
| African | 4 | 0.2% |
| American | 41 | 2.1% |
| Belgian | 71 | 3.7% |
| Bulgarian | 5 | 0.3% |
| Burmese | 6 | 0.3% |
| Canadian | 2 | 0.1% |
| Croatian | 5 | 0.3% |
| Czech | 4 | 0.2% |
| Dutch | 36 | 1.9% |
| English | 209 | 11.0% |
| European | 22 | 1.2% |
| French | 24 | 1.3% |
| French American Indian | 1 | 0.1% |
| French Canadian | 6 | 0.3% |
| German | 613 | 32.2% |
| Irish | 289 | 15.2% |
| Italian | 89 | 4.7% |
| Korean | 6 | 0.3% |
| Latvian | 7 | 0.4% |
| Lithuanian | 6 | 0.3% |
| Mexican | 93 | 4.9% |
| Norwegian | 30 | 1.6% |
| Polish | 51 | 2.7% |
| Romanian | 5 | 0.3% |
| Scandinavian | 11 | 0.6% |
| Scotch-Irish | 35 | 1.8% |
| Scottish | 31 | 1.6% |
| Slovene | 3 | 0.2% |
| Subsaharan African | 4 | 0.2% |
| Swedish | 137 | 7.2% |
| Swiss | 6 | 0.3% |
| Welsh | 8 | 0.4% | View All 32 Rows |
Immigrants in Port Byron
The most numerous immigrant groups reported in Port Byron came from Europe (30 | 1.6%), Eastern Europe (15 | 0.8%), Western Europe (15 | 0.8%), Poland (10 | 0.5%), and Central America (9 | 0.5%), together accounting for 4.2% of all Port Byron residents.
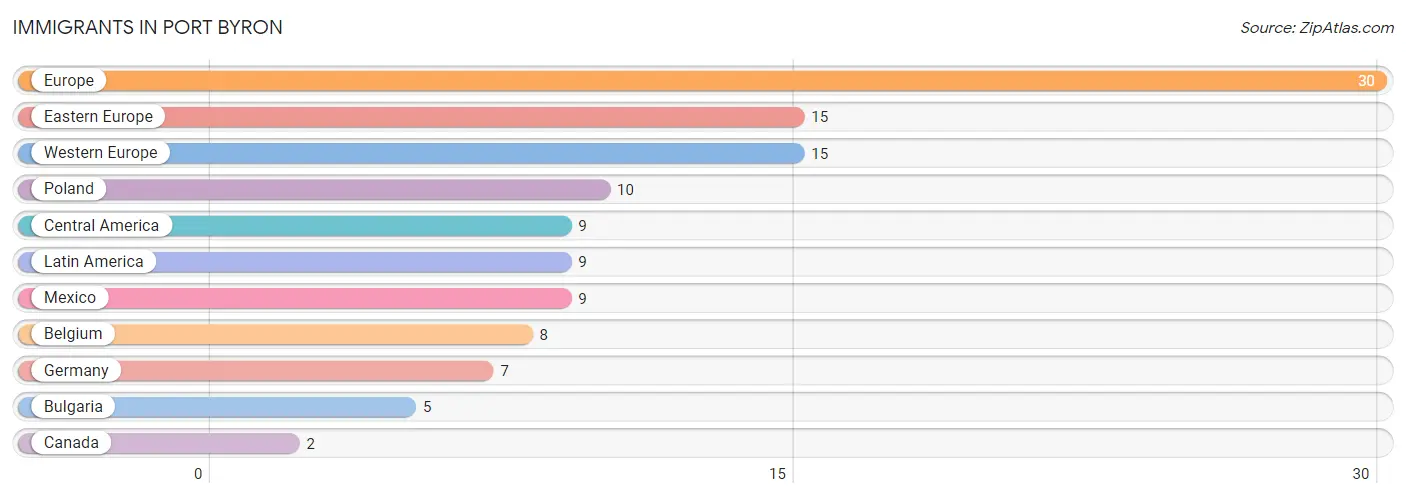
| Immigration Origin | # Population | % Population |
| Belgium | 8 | 0.4% |
| Bulgaria | 5 | 0.3% |
| Canada | 2 | 0.1% |
| Central America | 9 | 0.5% |
| Eastern Europe | 15 | 0.8% |
| Europe | 30 | 1.6% |
| Germany | 7 | 0.4% |
| Latin America | 9 | 0.5% |
| Mexico | 9 | 0.5% |
| Poland | 10 | 0.5% |
| Western Europe | 15 | 0.8% | View All 11 Rows |
Sex and Age in Port Byron
Sex and Age in Port Byron
The most populous age groups in Port Byron are 60 to 64 Years (103 | 10.5%) for men and 25 to 29 Years (85 | 9.2%) for women.
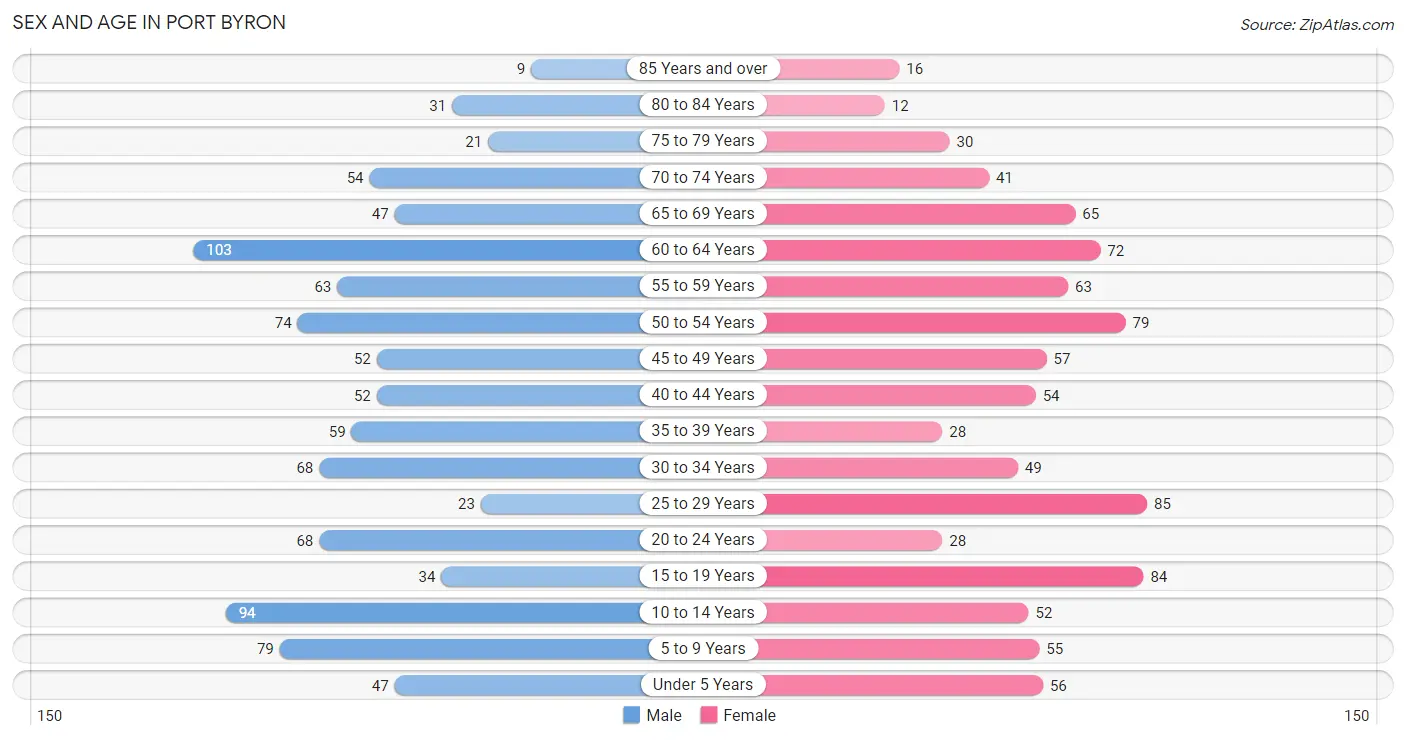
| Age Bracket | Male | Female |
| Under 5 Years | 47 (4.8%) | 56 (6.0%) |
| 5 to 9 Years | 79 (8.1%) | 55 (5.9%) |
| 10 to 14 Years | 94 (9.6%) | 52 (5.6%) |
| 15 to 19 Years | 34 (3.5%) | 84 (9.1%) |
| 20 to 24 Years | 68 (7.0%) | 28 (3.0%) |
| 25 to 29 Years | 23 (2.4%) | 85 (9.2%) |
| 30 to 34 Years | 68 (7.0%) | 49 (5.3%) |
| 35 to 39 Years | 59 (6.0%) | 28 (3.0%) |
| 40 to 44 Years | 52 (5.3%) | 54 (5.8%) |
| 45 to 49 Years | 52 (5.3%) | 57 (6.2%) |
| 50 to 54 Years | 74 (7.6%) | 79 (8.5%) |
| 55 to 59 Years | 63 (6.4%) | 63 (6.8%) |
| 60 to 64 Years | 103 (10.5%) | 72 (7.8%) |
| 65 to 69 Years | 47 (4.8%) | 65 (7.0%) |
| 70 to 74 Years | 54 (5.5%) | 41 (4.4%) |
| 75 to 79 Years | 21 (2.1%) | 30 (3.2%) |
| 80 to 84 Years | 31 (3.2%) | 12 (1.3%) |
| 85 Years and over | 9 (0.9%) | 16 (1.7%) |
| Total | 978 (100.0%) | 926 (100.0%) |
Families and Households in Port Byron
Median Family Size in Port Byron
The median family size in Port Byron is 3.06 persons per family, with married-couple families (438 | 84.4%) accounting for the largest median family size of 3.2 persons per family. On the other hand, single male/father families (35 | 6.7%) represent the smallest median family size with 2.14 persons per family.
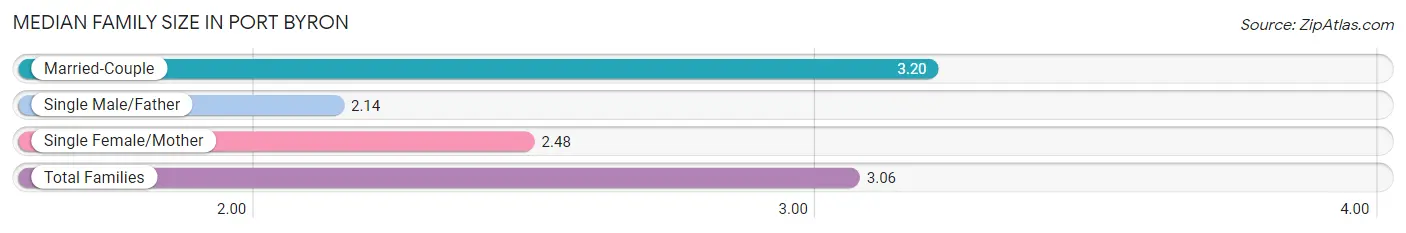
| Family Type | # Families | Family Size |
| Married-Couple | 438 (84.4%) | 3.20 |
| Single Male/Father | 35 (6.7%) | 2.14 |
| Single Female/Mother | 46 (8.9%) | 2.48 |
| Total Families | 519 (100.0%) | 3.06 |
Median Household Size in Port Byron
The median household size in Port Byron is 2.52 persons per household, with married-couple households (438 | 58.0%) accounting for the largest median household size of 3.27 persons per household. non-family households (236 | 31.3%) represent the smallest median household size with 1.17 persons per household.
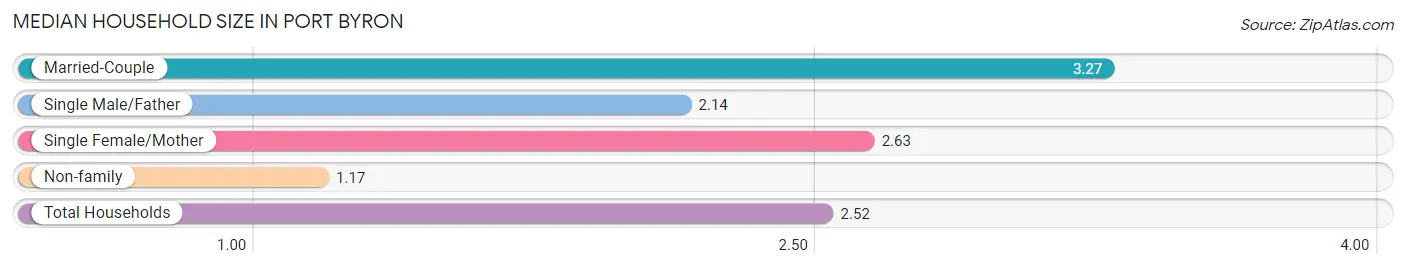
| Household Type | # Households | Household Size |
| Married-Couple | 438 (58.0%) | 3.27 |
| Single Male/Father | 35 (4.6%) | 2.14 |
| Single Female/Mother | 46 (6.1%) | 2.63 |
| Non-family | 236 (31.3%) | 1.17 |
| Total Households | 755 (100.0%) | 2.52 |
Household Size by Marriage Status in Port Byron
Out of a total of 755 households in Port Byron, 519 (68.7%) are family households, while 236 (31.3%) are nonfamily households. The most numerous type of family households are 2-person households, comprising 249, and the most common type of nonfamily households are 1-person households, comprising 203.
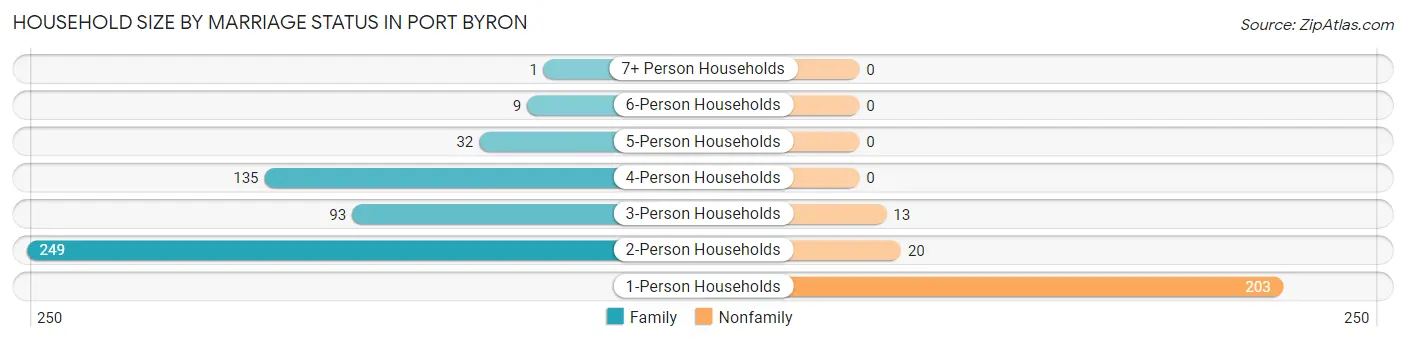
| Household Size | Family Households | Nonfamily Households |
| 1-Person Households | - | 203 (26.9%) |
| 2-Person Households | 249 (33.0%) | 20 (2.6%) |
| 3-Person Households | 93 (12.3%) | 13 (1.7%) |
| 4-Person Households | 135 (17.9%) | 0 (0.0%) |
| 5-Person Households | 32 (4.2%) | 0 (0.0%) |
| 6-Person Households | 9 (1.2%) | 0 (0.0%) |
| 7+ Person Households | 1 (0.1%) | 0 (0.0%) |
| Total | 519 (68.7%) | 236 (31.3%) |
Female Fertility in Port Byron
Fertility by Age in Port Byron
Average fertility rate in Port Byron is 42.0 births per 1,000 women. Women in the age bracket of 20 to 34 years have the highest fertility rate with 86.0 births per 1,000 women. Women in the age bracket of 20 to 34 years acount for 82.4% of all women with births.
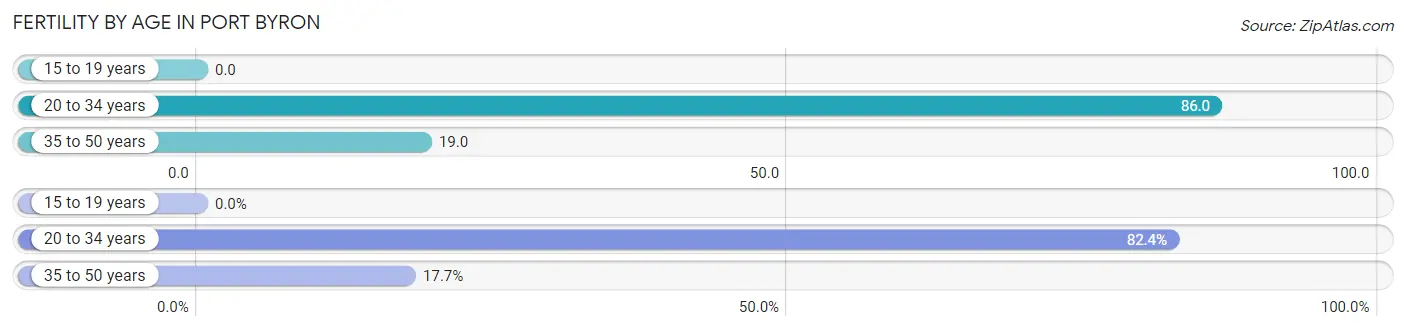
| Age Bracket | Women with Births | Births / 1,000 Women |
| 15 to 19 years | 0 (0.0%) | 0.0 |
| 20 to 34 years | 14 (82.4%) | 86.0 |
| 35 to 50 years | 3 (17.6%) | 19.0 |
| Total | 17 (100.0%) | 42.0 |
Fertility by Age by Marriage Status in Port Byron
41.2% of women with births (17) in Port Byron are married. The highest percentage of unmarried women with births falls into 20 to 34 years age bracket with 71.4% of them unmarried at the time of birth, while the lowest percentage of unmarried women with births belong to 35 to 50 years age bracket with 0.0% of them unmarried.
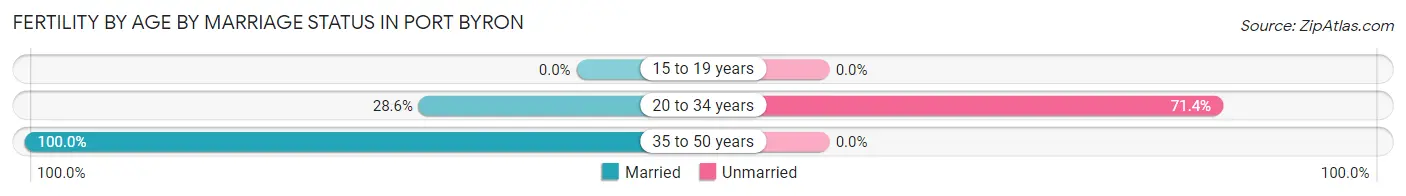
| Age Bracket | Married | Unmarried |
| 15 to 19 years | 0 (0.0%) | 0 (0.0%) |
| 20 to 34 years | 4 (28.6%) | 10 (71.4%) |
| 35 to 50 years | 3 (100.0%) | 0 (0.0%) |
| Total | 7 (41.2%) | 10 (58.8%) |
Fertility by Education in Port Byron
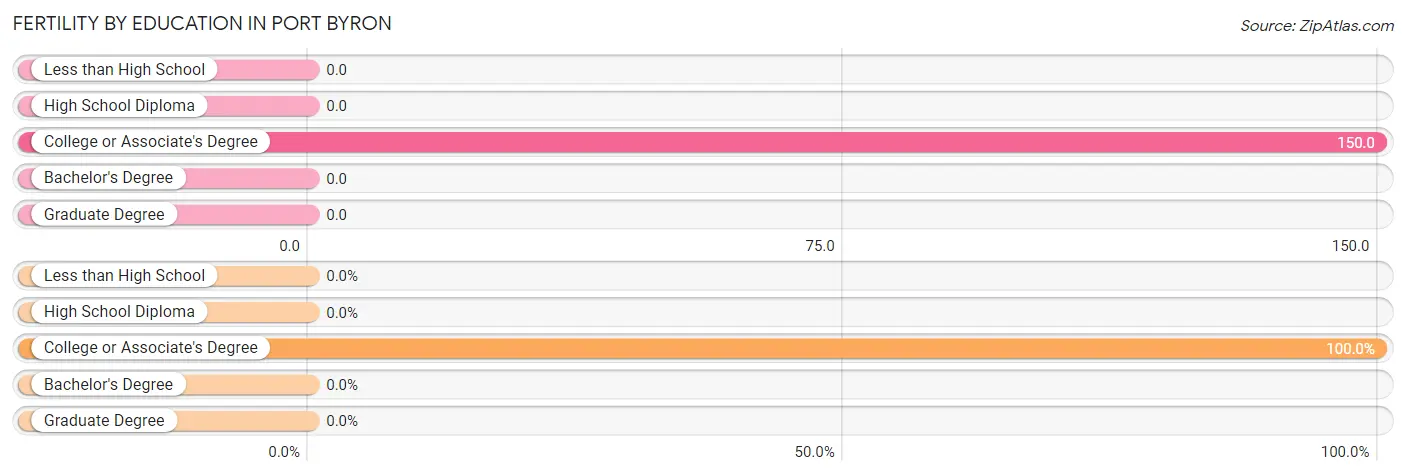
| Educational Attainment | Women with Births | Births / 1,000 Women |
| Less than High School | 0 (0.0%) | 0.0 |
| High School Diploma | 0 (0.0%) | 0.0 |
| College or Associate's Degree | 17 (100.0%) | 150.0 |
| Bachelor's Degree | 0 (0.0%) | 0.0 |
| Graduate Degree | 0 (0.0%) | 0.0 |
| Total | 17 (100.0%) | 42.0 |
Fertility by Education by Marriage Status in Port Byron
58.8% of women with births in Port Byron are unmarried. Women with the educational attainment of college or associate's degree are most likely to be married with 41.2% of them married at childbirth, while women with the educational attainment of college or associate's degree are least likely to be married with 58.8% of them unmarried at childbirth.
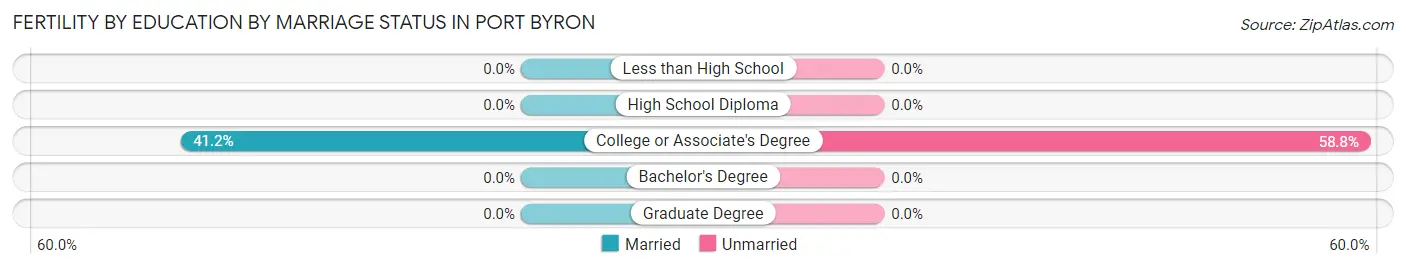
| Educational Attainment | Married | Unmarried |
| Less than High School | 0 (0.0%) | 0 (0.0%) |
| High School Diploma | 0 (0.0%) | 0 (0.0%) |
| College or Associate's Degree | 7 (41.2%) | 10 (58.8%) |
| Bachelor's Degree | 0 (0.0%) | 0 (0.0%) |
| Graduate Degree | 0 (0.0%) | 0 (0.0%) |
| Total | 7 (41.2%) | 10 (58.8%) |
Employment Characteristics in Port Byron
Employment by Class of Employer in Port Byron
Among the 868 employed individuals in Port Byron, private company employees (616 | 71.0%), not-for-profit organizations (76 | 8.8%), and local government employees (46 | 5.3%) make up the most common classes of employment.
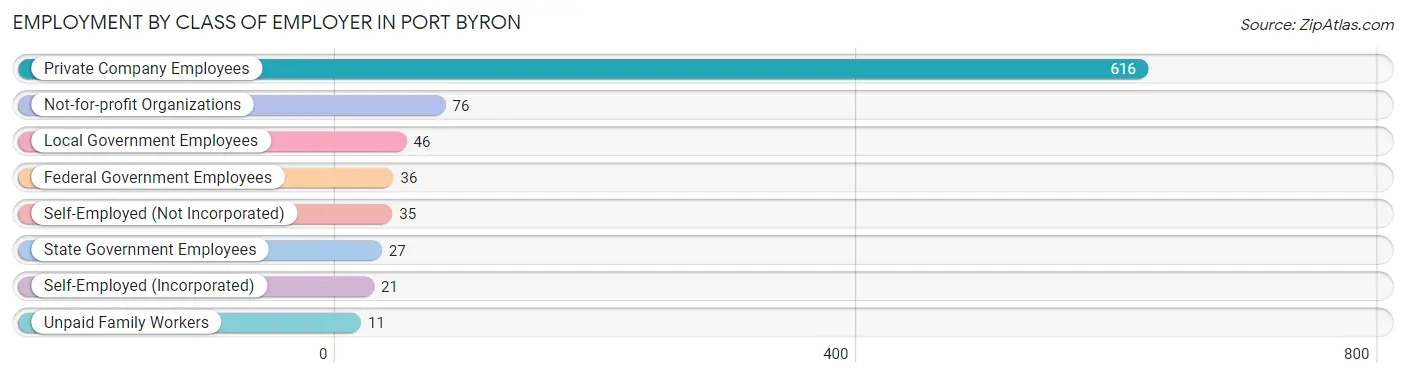
| Employer Class | # Employees | % Employees |
| Private Company Employees | 616 | 71.0% |
| Self-Employed (Incorporated) | 21 | 2.4% |
| Self-Employed (Not Incorporated) | 35 | 4.0% |
| Not-for-profit Organizations | 76 | 8.8% |
| Local Government Employees | 46 | 5.3% |
| State Government Employees | 27 | 3.1% |
| Federal Government Employees | 36 | 4.2% |
| Unpaid Family Workers | 11 | 1.3% |
| Total | 868 | 100.0% |
Employment Status by Age in Port Byron
According to the labor force statistics for Port Byron, out of the total population over 16 years of age (1,494), 61.0% or 911 individuals are in the labor force, with 3.4% or 31 of them unemployed. The age group with the highest labor force participation rate is 25 to 29 years, with 98.1% or 106 individuals in the labor force. Within the labor force, the 35 to 44 years age range has the highest percentage of unemployed individuals, with 12.9% or 19 of them being unemployed.
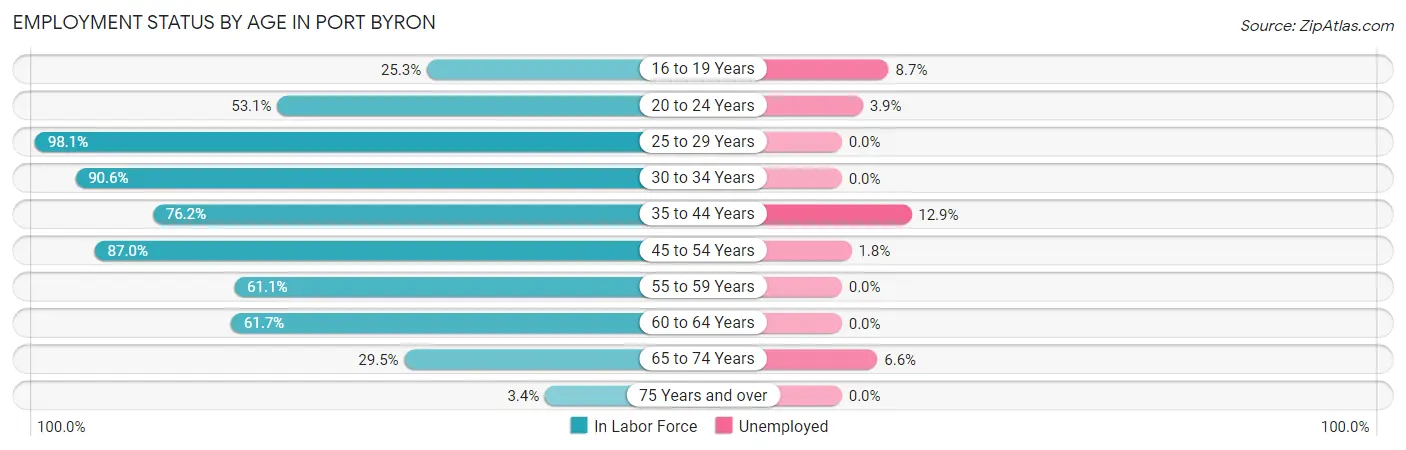
| Age Bracket | In Labor Force | Unemployed |
| 16 to 19 Years | 23 (25.3%) | 2 (8.7%) |
| 20 to 24 Years | 51 (53.1%) | 2 (3.9%) |
| 25 to 29 Years | 106 (98.1%) | 0 (0.0%) |
| 30 to 34 Years | 106 (90.6%) | 0 (0.0%) |
| 35 to 44 Years | 147 (76.2%) | 19 (12.9%) |
| 45 to 54 Years | 228 (87.0%) | 4 (1.8%) |
| 55 to 59 Years | 77 (61.1%) | 0 (0.0%) |
| 60 to 64 Years | 108 (61.7%) | 0 (0.0%) |
| 65 to 74 Years | 61 (29.5%) | 4 (6.6%) |
| 75 Years and over | 4 (3.4%) | 0 (0.0%) |
| Total | 911 (61.0%) | 31 (3.4%) |
Employment Status by Educational Attainment in Port Byron
According to labor force statistics for Port Byron, 78.7% of individuals (772) out of the total population between 25 and 64 years of age (981) are in the labor force, with 3.0% or 23 of them being unemployed. The group with the highest labor force participation rate are those with the educational attainment of bachelor's degree or higher, with 85.2% or 345 individuals in the labor force. Within the labor force, individuals with less than high school education have the highest percentage of unemployment, with 18.2% or 4 of them being unemployed.
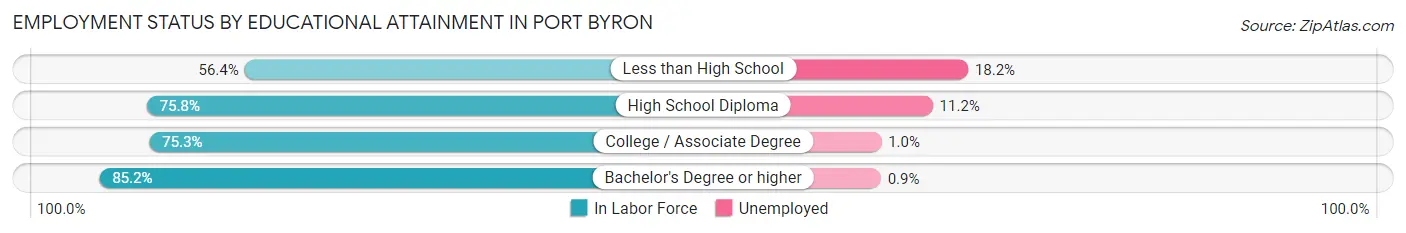
| Educational Attainment | In Labor Force | Unemployed |
| Less than High School | 22 (56.4%) | 7 (18.2%) |
| High School Diploma | 116 (75.8%) | 17 (11.2%) |
| College / Associate Degree | 289 (75.3%) | 4 (1.0%) |
| Bachelor's Degree or higher | 345 (85.2%) | 4 (0.9%) |
| Total | 772 (78.7%) | 29 (3.0%) |
Employment Occupations by Sex in Port Byron
Management, Business, Science and Arts Occupations
The most common Management, Business, Science and Arts occupations in Port Byron are Management (111 | 12.6%), Community & Social Service (99 | 11.3%), Computers, Engineering & Science (85 | 9.7%), Education Instruction & Library (72 | 8.2%), and Business & Financial (60 | 6.8%).
Management, Business, Science and Arts Occupations by Sex
Within the Management, Business, Science and Arts occupations in Port Byron, the most male-oriented occupations are Computers & Mathematics (100.0%), Computers, Engineering & Science (89.4%), and Architecture & Engineering (78.3%), while the most female-oriented occupations are Health Technologists (81.6%), Education, Arts & Media (81.2%), and Health Diagnosing & Treating (78.3%).
| Occupation | Male | Female |
| Management | 75 (67.6%) | 36 (32.4%) |
| Business & Financial | 18 (30.0%) | 42 (70.0%) |
| Computers, Engineering & Science | 76 (89.4%) | 9 (10.6%) |
| Computers & Mathematics | 51 (100.0%) | 0 (0.0%) |
| Architecture & Engineering | 18 (78.3%) | 5 (21.7%) |
| Life, Physical & Social Science | 7 (63.6%) | 4 (36.4%) |
| Community & Social Service | 25 (25.3%) | 74 (74.8%) |
| Education, Arts & Media | 3 (18.8%) | 13 (81.2%) |
| Legal Services & Support | 1 (25.0%) | 3 (75.0%) |
| Education Instruction & Library | 16 (22.2%) | 56 (77.8%) |
| Arts, Media & Entertainment | 5 (71.4%) | 2 (28.6%) |
| Health Diagnosing & Treating | 13 (21.7%) | 47 (78.3%) |
| Health Technologists | 9 (18.4%) | 40 (81.6%) |
| Total (Category) | 207 (49.9%) | 208 (50.1%) |
| Total (Overall) | 455 (51.7%) | 425 (48.3%) |
Services Occupations
The most common Services occupations in Port Byron are Food Preparation & Serving (45 | 5.1%), Personal Care & Service (45 | 5.1%), Healthcare Support (26 | 2.9%), Security & Protection (14 | 1.6%), and Cleaning & Maintenance (11 | 1.3%).
Services Occupations by Sex
Within the Services occupations in Port Byron, the most male-oriented occupations are Security & Protection (100.0%), Firefighting & Prevention (100.0%), and Law Enforcement (100.0%), while the most female-oriented occupations are Healthcare Support (100.0%), Personal Care & Service (100.0%), and Food Preparation & Serving (71.1%).
| Occupation | Male | Female |
| Healthcare Support | 0 (0.0%) | 26 (100.0%) |
| Security & Protection | 14 (100.0%) | 0 (0.0%) |
| Firefighting & Prevention | 10 (100.0%) | 0 (0.0%) |
| Law Enforcement | 4 (100.0%) | 0 (0.0%) |
| Food Preparation & Serving | 13 (28.9%) | 32 (71.1%) |
| Cleaning & Maintenance | 7 (63.6%) | 4 (36.4%) |
| Personal Care & Service | 0 (0.0%) | 45 (100.0%) |
| Total (Category) | 34 (24.1%) | 107 (75.9%) |
| Total (Overall) | 455 (51.7%) | 425 (48.3%) |
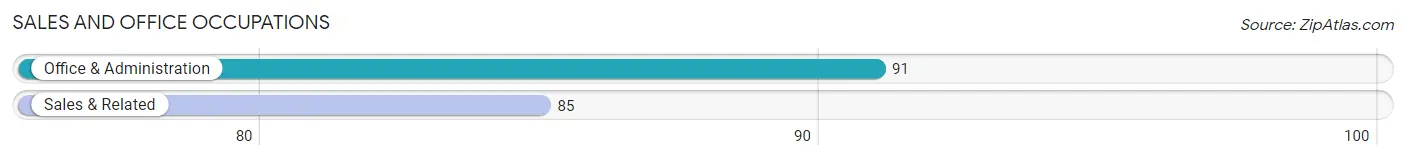
Sales and Office Occupations
The most common Sales and Office occupations in Port Byron are Office & Administration (91 | 10.3%), and Sales & Related (85 | 9.7%).
Sales and Office Occupations by Sex
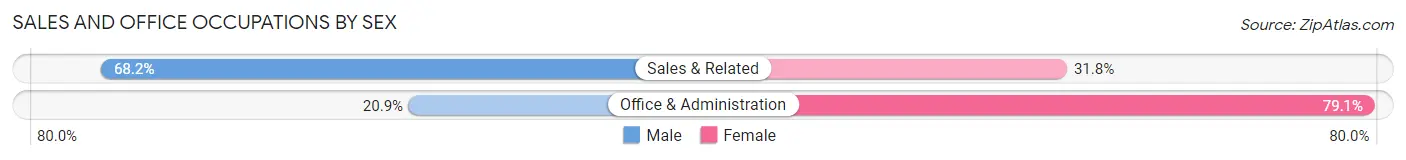
| Occupation | Male | Female |
| Sales & Related | 58 (68.2%) | 27 (31.8%) |
| Office & Administration | 19 (20.9%) | 72 (79.1%) |
| Total (Category) | 77 (43.8%) | 99 (56.2%) |
| Total (Overall) | 455 (51.7%) | 425 (48.3%) |
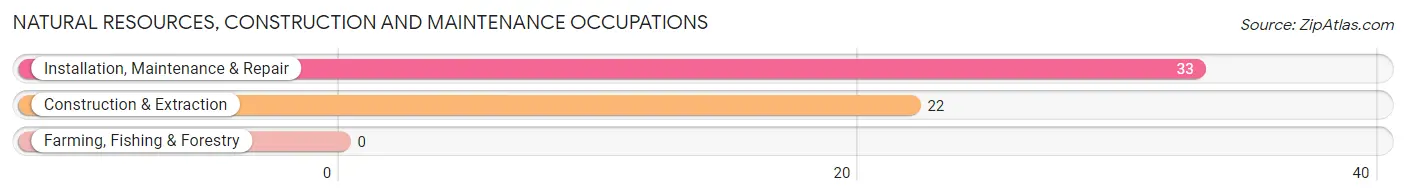
Natural Resources, Construction and Maintenance Occupations
The most common Natural Resources, Construction and Maintenance occupations in Port Byron are Installation, Maintenance & Repair (33 | 3.7%), and Construction & Extraction (22 | 2.5%).
Natural Resources, Construction and Maintenance Occupations by Sex
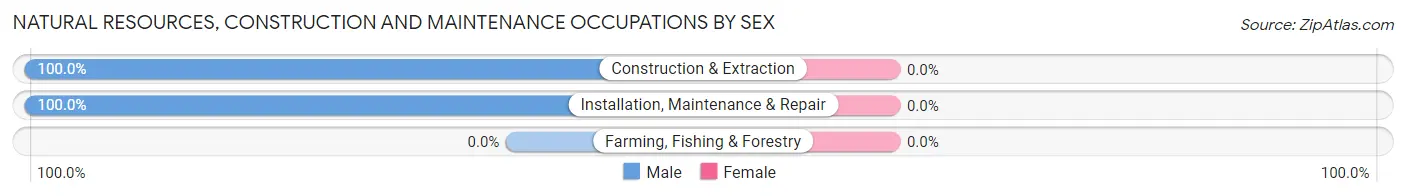
| Occupation | Male | Female |
| Farming, Fishing & Forestry | 0 (0.0%) | 0 (0.0%) |
| Construction & Extraction | 22 (100.0%) | 0 (0.0%) |
| Installation, Maintenance & Repair | 33 (100.0%) | 0 (0.0%) |
| Total (Category) | 55 (100.0%) | 0 (0.0%) |
| Total (Overall) | 455 (51.7%) | 425 (48.3%) |
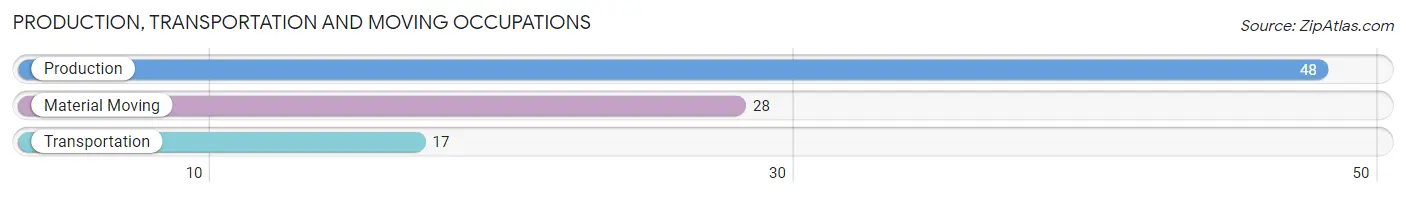
Production, Transportation and Moving Occupations
The most common Production, Transportation and Moving occupations in Port Byron are Production (48 | 5.4%), Material Moving (28 | 3.2%), and Transportation (17 | 1.9%).
Production, Transportation and Moving Occupations by Sex
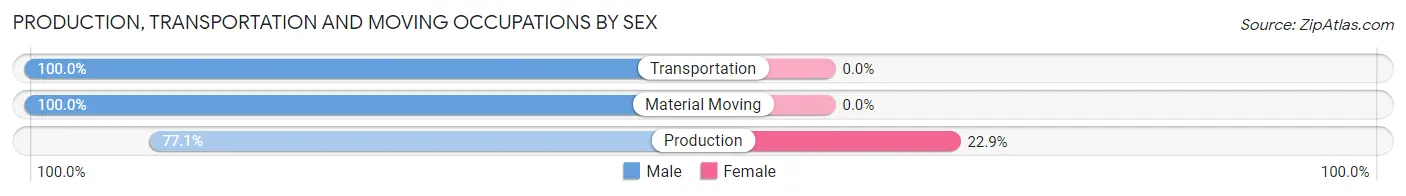
| Occupation | Male | Female |
| Production | 37 (77.1%) | 11 (22.9%) |
| Transportation | 17 (100.0%) | 0 (0.0%) |
| Material Moving | 28 (100.0%) | 0 (0.0%) |
| Total (Category) | 82 (88.2%) | 11 (11.8%) |
| Total (Overall) | 455 (51.7%) | 425 (48.3%) |
Employment Industries by Sex in Port Byron
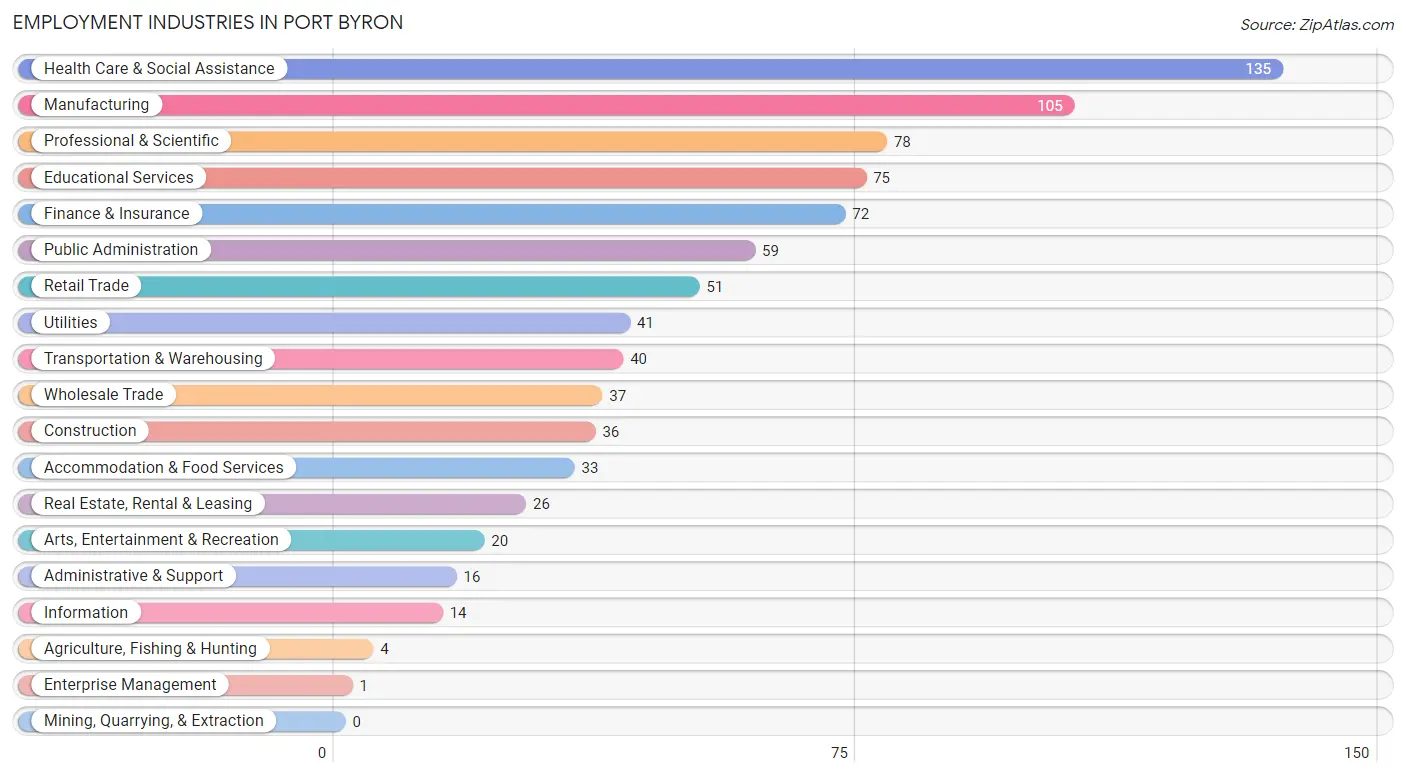
Employment Industries in Port Byron
The major employment industries in Port Byron include Health Care & Social Assistance (135 | 15.3%), Manufacturing (105 | 11.9%), Professional & Scientific (78 | 8.9%), Educational Services (75 | 8.5%), and Finance & Insurance (72 | 8.2%).
Employment Industries by Sex in Port Byron
The Port Byron industries that see more men than women are Agriculture, Fishing & Hunting (100.0%), Utilities (100.0%), and Enterprise Management (100.0%), whereas the industries that tend to have a higher number of women are Health Care & Social Assistance (90.4%), Accommodation & Food Services (81.8%), and Educational Services (72.0%).
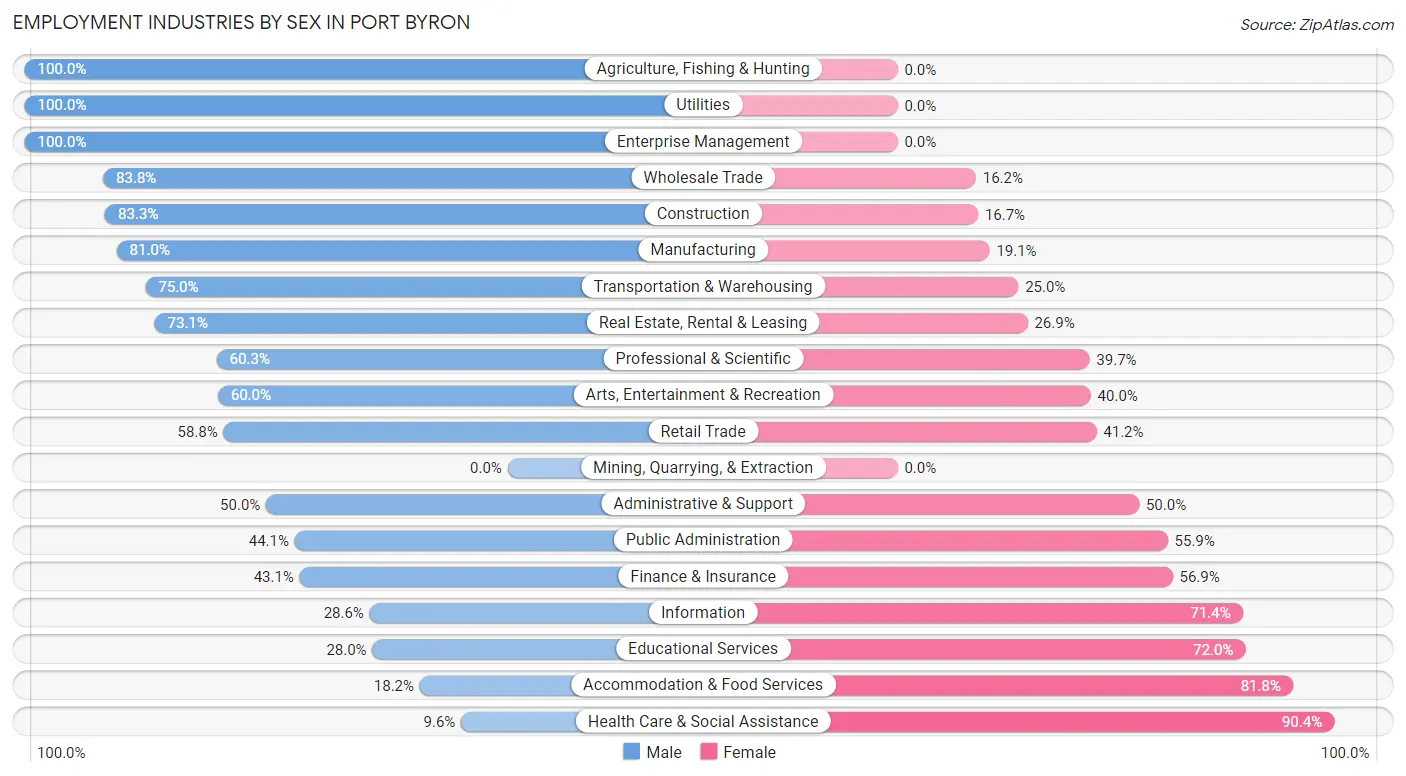
| Industry | Male | Female |
| Agriculture, Fishing & Hunting | 4 (100.0%) | 0 (0.0%) |
| Mining, Quarrying, & Extraction | 0 (0.0%) | 0 (0.0%) |
| Construction | 30 (83.3%) | 6 (16.7%) |
| Manufacturing | 85 (80.9%) | 20 (19.1%) |
| Wholesale Trade | 31 (83.8%) | 6 (16.2%) |
| Retail Trade | 30 (58.8%) | 21 (41.2%) |
| Transportation & Warehousing | 30 (75.0%) | 10 (25.0%) |
| Utilities | 41 (100.0%) | 0 (0.0%) |
| Information | 4 (28.6%) | 10 (71.4%) |
| Finance & Insurance | 31 (43.1%) | 41 (56.9%) |
| Real Estate, Rental & Leasing | 19 (73.1%) | 7 (26.9%) |
| Professional & Scientific | 47 (60.3%) | 31 (39.7%) |
| Enterprise Management | 1 (100.0%) | 0 (0.0%) |
| Administrative & Support | 8 (50.0%) | 8 (50.0%) |
| Educational Services | 21 (28.0%) | 54 (72.0%) |
| Health Care & Social Assistance | 13 (9.6%) | 122 (90.4%) |
| Arts, Entertainment & Recreation | 12 (60.0%) | 8 (40.0%) |
| Accommodation & Food Services | 6 (18.2%) | 27 (81.8%) |
| Public Administration | 26 (44.1%) | 33 (55.9%) |
| Total | 455 (51.7%) | 425 (48.3%) |
Education in Port Byron
School Enrollment in Port Byron
The most common levels of schooling among the 496 students in Port Byron are elementary school (141 | 28.4%), high school (115 | 23.2%), and middle school (99 | 20.0%).
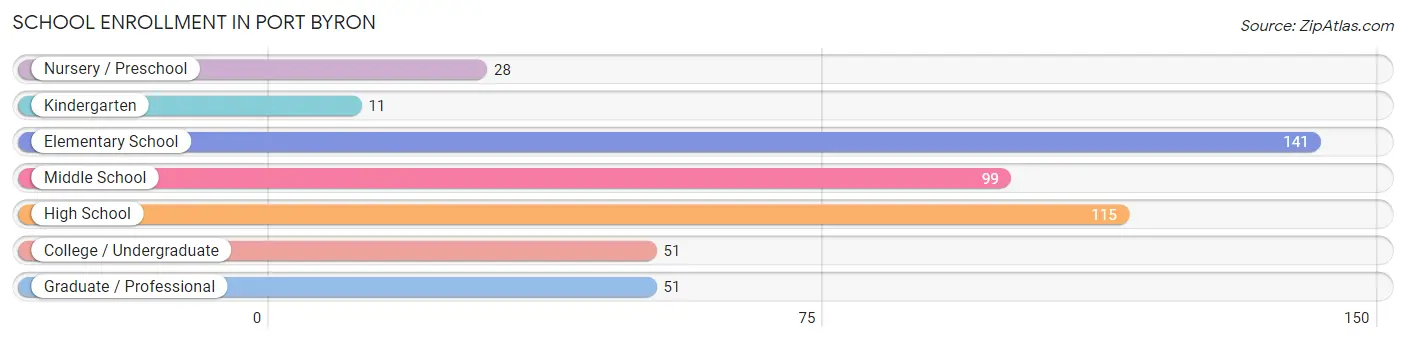
| School Level | # Students | % Students |
| Nursery / Preschool | 28 | 5.7% |
| Kindergarten | 11 | 2.2% |
| Elementary School | 141 | 28.4% |
| Middle School | 99 | 20.0% |
| High School | 115 | 23.2% |
| College / Undergraduate | 51 | 10.3% |
| Graduate / Professional | 51 | 10.3% |
| Total | 496 | 100.0% |
School Enrollment by Age by Funding Source in Port Byron
Out of a total of 496 students who are enrolled in schools in Port Byron, 94 (19.0%) attend a private institution, while the remaining 402 (81.0%) are enrolled in public schools. The age group of 25 to 34 year olds has the highest likelihood of being enrolled in private schools, with 38 (82.6% in the age bracket) enrolled. Conversely, the age group of 18 to 19 year olds has the lowest likelihood of being enrolled in a private school, with 38 (100.0% in the age bracket) attending a public institution.
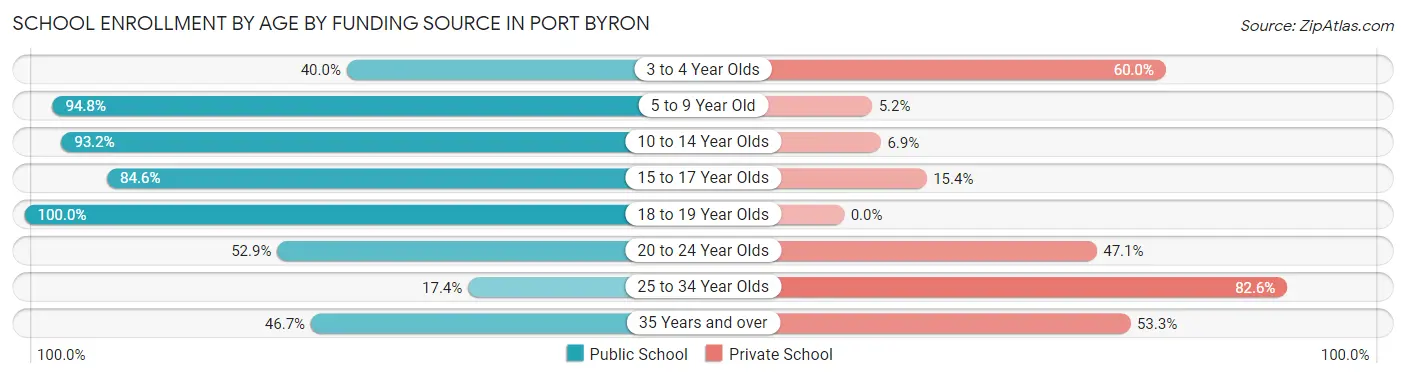
| Age Bracket | Public School | Private School |
| 3 to 4 Year Olds | 2 (40.0%) | 3 (60.0%) |
| 5 to 9 Year Old | 127 (94.8%) | 7 (5.2%) |
| 10 to 14 Year Olds | 136 (93.1%) | 10 (6.9%) |
| 15 to 17 Year Olds | 66 (84.6%) | 12 (15.4%) |
| 18 to 19 Year Olds | 38 (100.0%) | 0 (0.0%) |
| 20 to 24 Year Olds | 18 (52.9%) | 16 (47.1%) |
| 25 to 34 Year Olds | 8 (17.4%) | 38 (82.6%) |
| 35 Years and over | 7 (46.7%) | 8 (53.3%) |
| Total | 402 (81.0%) | 94 (19.0%) |
Educational Attainment by Field of Study in Port Byron
Business (104 | 18.9%), education (104 | 18.9%), science & technology (67 | 12.2%), engineering (62 | 11.3%), and liberal arts & history (39 | 7.1%) are the most common fields of study among 549 individuals in Port Byron who have obtained a bachelor's degree or higher.
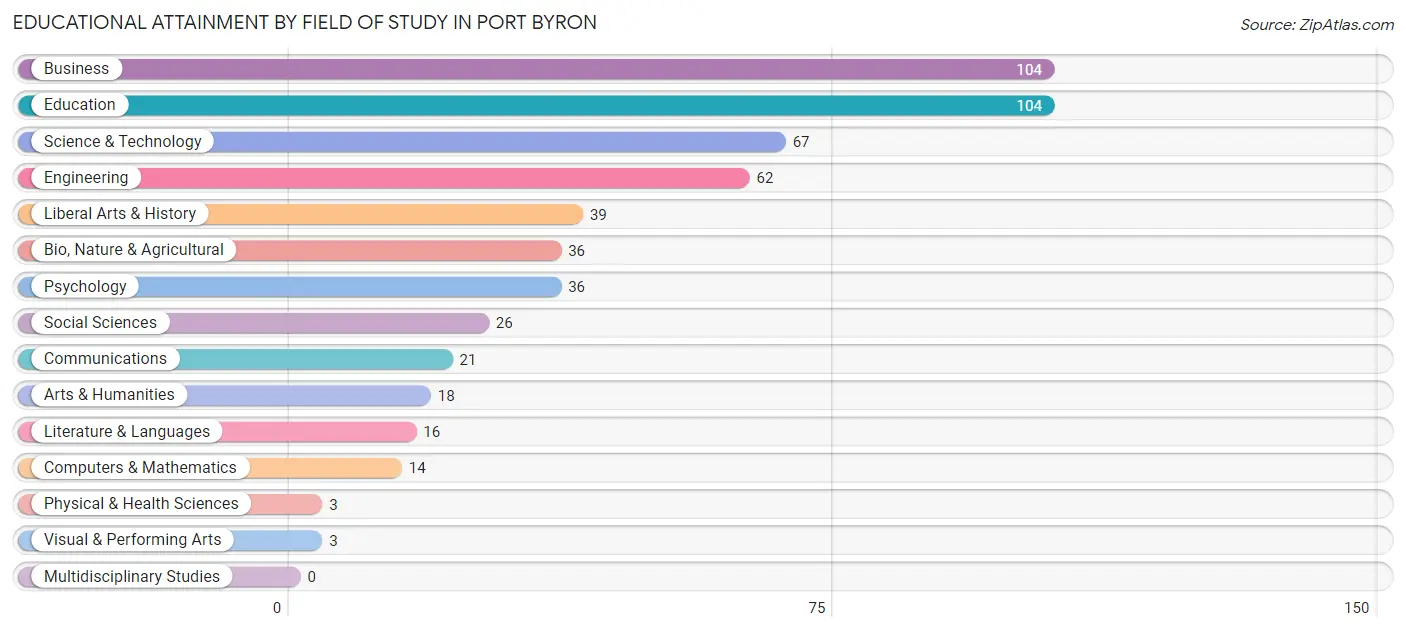
| Field of Study | # Graduates | % Graduates |
| Computers & Mathematics | 14 | 2.5% |
| Bio, Nature & Agricultural | 36 | 6.6% |
| Physical & Health Sciences | 3 | 0.5% |
| Psychology | 36 | 6.6% |
| Social Sciences | 26 | 4.7% |
| Engineering | 62 | 11.3% |
| Multidisciplinary Studies | 0 | 0.0% |
| Science & Technology | 67 | 12.2% |
| Business | 104 | 18.9% |
| Education | 104 | 18.9% |
| Literature & Languages | 16 | 2.9% |
| Liberal Arts & History | 39 | 7.1% |
| Visual & Performing Arts | 3 | 0.5% |
| Communications | 21 | 3.8% |
| Arts & Humanities | 18 | 3.3% |
| Total | 549 | 100.0% |
Transportation & Commute in Port Byron
Vehicle Availability by Sex in Port Byron
The most prevalent vehicle ownership categories in Port Byron are males with 2 vehicles (210, accounting for 46.5%) and females with 2 vehicles (184, making up 50.5%).
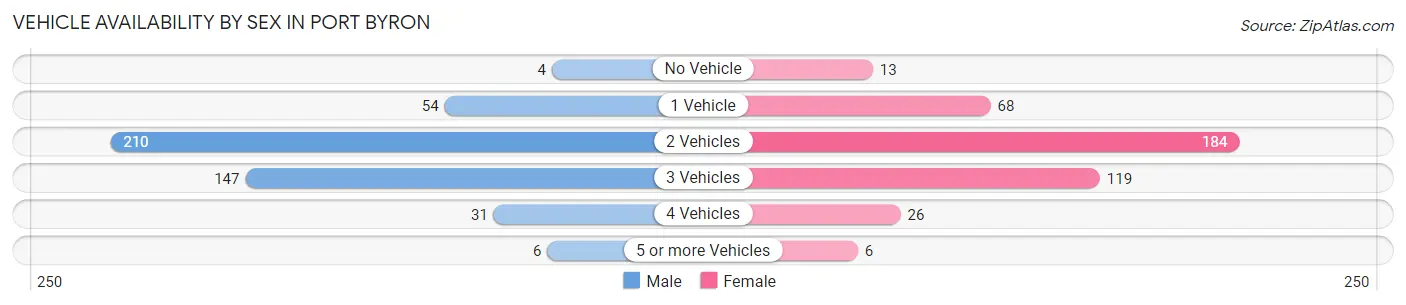
| Vehicles Available | Male | Female |
| No Vehicle | 4 (0.9%) | 13 (3.1%) |
| 1 Vehicle | 54 (11.9%) | 68 (16.4%) |
| 2 Vehicles | 210 (46.5%) | 184 (44.2%) |
| 3 Vehicles | 147 (32.5%) | 119 (28.6%) |
| 4 Vehicles | 31 (6.9%) | 26 (6.2%) |
| 5 or more Vehicles | 6 (1.3%) | 6 (1.4%) |
| Total | 452 (100.0%) | 416 (100.0%) |
Commute Time in Port Byron
The most frequently occuring commute durations in Port Byron are 20 to 24 minutes (253 commuters, 33.3%), 30 to 34 minutes (107 commuters, 14.1%), and 15 to 19 minutes (82 commuters, 10.8%).
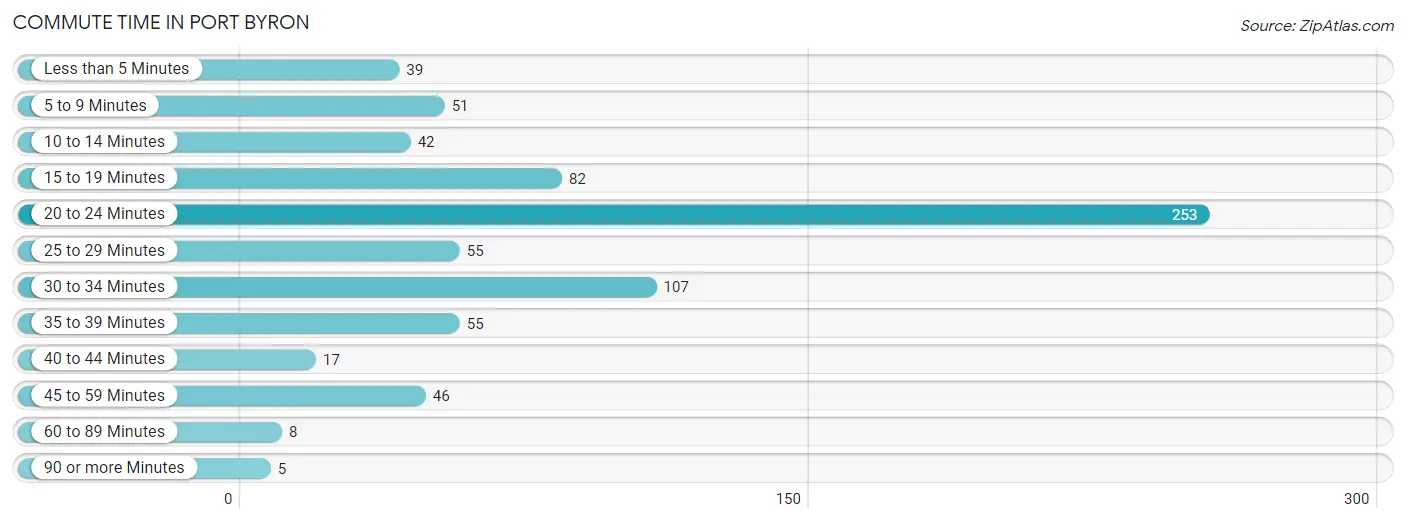
| Commute Time | # Commuters | % Commuters |
| Less than 5 Minutes | 39 | 5.1% |
| 5 to 9 Minutes | 51 | 6.7% |
| 10 to 14 Minutes | 42 | 5.5% |
| 15 to 19 Minutes | 82 | 10.8% |
| 20 to 24 Minutes | 253 | 33.3% |
| 25 to 29 Minutes | 55 | 7.2% |
| 30 to 34 Minutes | 107 | 14.1% |
| 35 to 39 Minutes | 55 | 7.2% |
| 40 to 44 Minutes | 17 | 2.2% |
| 45 to 59 Minutes | 46 | 6.0% |
| 60 to 89 Minutes | 8 | 1.1% |
| 90 or more Minutes | 5 | 0.7% |
Commute Time by Sex in Port Byron
The most common commute times in Port Byron are 20 to 24 minutes (110 commuters, 28.3%) for males and 20 to 24 minutes (143 commuters, 38.4%) for females.
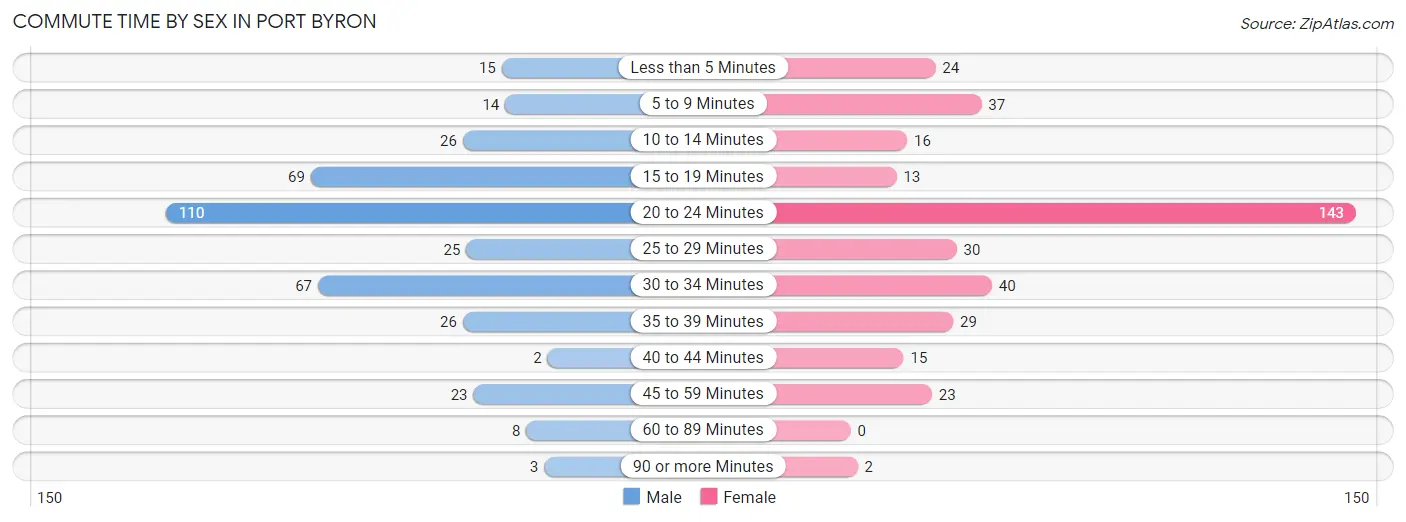
| Commute Time | Male | Female |
| Less than 5 Minutes | 15 (3.9%) | 24 (6.5%) |
| 5 to 9 Minutes | 14 (3.6%) | 37 (10.0%) |
| 10 to 14 Minutes | 26 (6.7%) | 16 (4.3%) |
| 15 to 19 Minutes | 69 (17.8%) | 13 (3.5%) |
| 20 to 24 Minutes | 110 (28.3%) | 143 (38.4%) |
| 25 to 29 Minutes | 25 (6.4%) | 30 (8.1%) |
| 30 to 34 Minutes | 67 (17.3%) | 40 (10.7%) |
| 35 to 39 Minutes | 26 (6.7%) | 29 (7.8%) |
| 40 to 44 Minutes | 2 (0.5%) | 15 (4.0%) |
| 45 to 59 Minutes | 23 (5.9%) | 23 (6.2%) |
| 60 to 89 Minutes | 8 (2.1%) | 0 (0.0%) |
| 90 or more Minutes | 3 (0.8%) | 2 (0.5%) |
Time of Departure to Work by Sex in Port Byron
The most frequent times of departure to work in Port Byron are 7:00 AM to 7:29 AM (70, 18.0%) for males and 7:00 AM to 7:29 AM (98, 26.3%) for females.
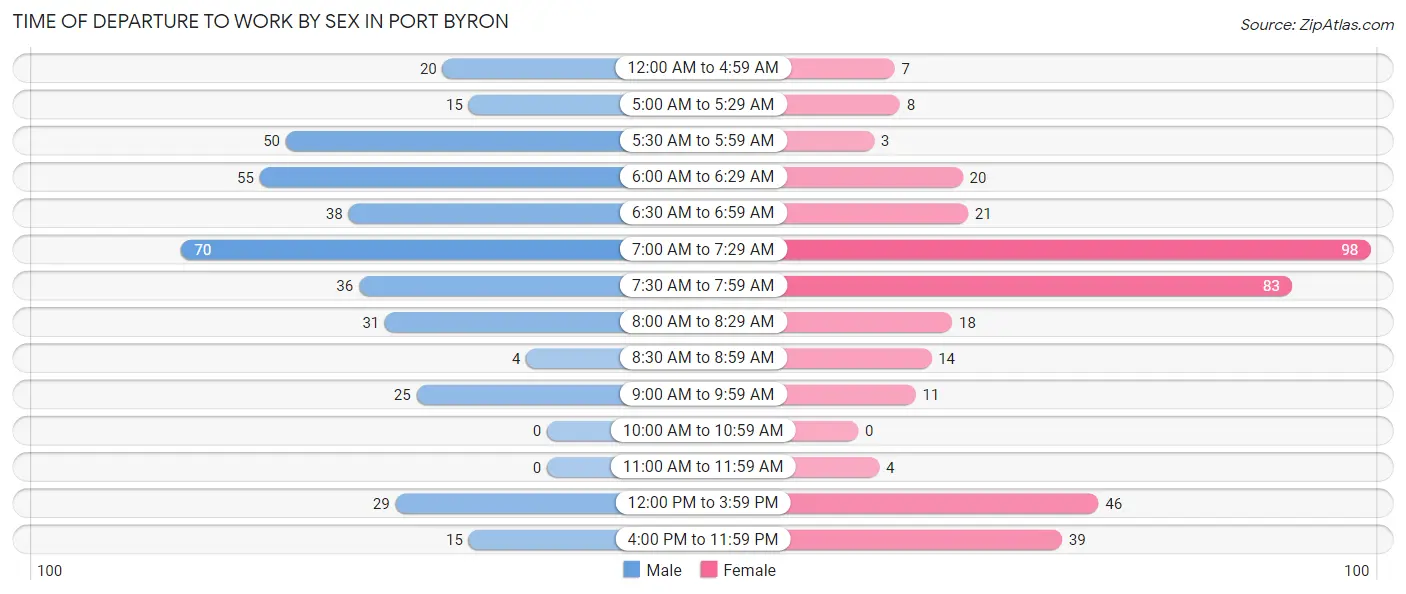
| Time of Departure | Male | Female |
| 12:00 AM to 4:59 AM | 20 (5.1%) | 7 (1.9%) |
| 5:00 AM to 5:29 AM | 15 (3.9%) | 8 (2.1%) |
| 5:30 AM to 5:59 AM | 50 (12.9%) | 3 (0.8%) |
| 6:00 AM to 6:29 AM | 55 (14.2%) | 20 (5.4%) |
| 6:30 AM to 6:59 AM | 38 (9.8%) | 21 (5.7%) |
| 7:00 AM to 7:29 AM | 70 (18.0%) | 98 (26.3%) |
| 7:30 AM to 7:59 AM | 36 (9.3%) | 83 (22.3%) |
| 8:00 AM to 8:29 AM | 31 (8.0%) | 18 (4.8%) |
| 8:30 AM to 8:59 AM | 4 (1.0%) | 14 (3.8%) |
| 9:00 AM to 9:59 AM | 25 (6.4%) | 11 (3.0%) |
| 10:00 AM to 10:59 AM | 0 (0.0%) | 0 (0.0%) |
| 11:00 AM to 11:59 AM | 0 (0.0%) | 4 (1.1%) |
| 12:00 PM to 3:59 PM | 29 (7.5%) | 46 (12.4%) |
| 4:00 PM to 11:59 PM | 15 (3.9%) | 39 (10.5%) |
| Total | 388 (100.0%) | 372 (100.0%) |
Housing Occupancy in Port Byron
Occupancy by Ownership in Port Byron
Of the total 755 dwellings in Port Byron, owner-occupied units account for 642 (85.0%), while renter-occupied units make up 113 (15.0%).
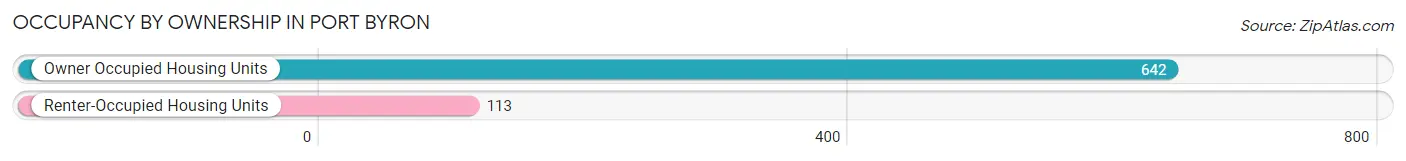
| Occupancy | # Housing Units | % Housing Units |
| Owner Occupied Housing Units | 642 | 85.0% |
| Renter-Occupied Housing Units | 113 | 15.0% |
| Total Occupied Housing Units | 755 | 100.0% |
Occupancy by Household Size in Port Byron
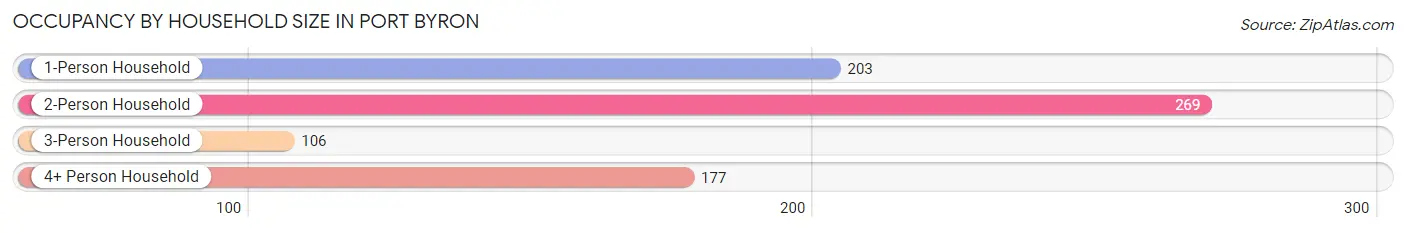
| Household Size | # Housing Units | % Housing Units |
| 1-Person Household | 203 | 26.9% |
| 2-Person Household | 269 | 35.6% |
| 3-Person Household | 106 | 14.0% |
| 4+ Person Household | 177 | 23.4% |
| Total Housing Units | 755 | 100.0% |
Occupancy by Ownership by Household Size in Port Byron
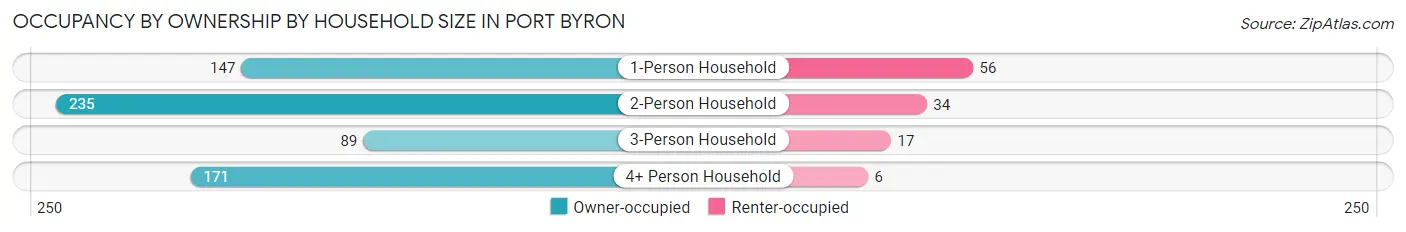
| Household Size | Owner-occupied | Renter-occupied |
| 1-Person Household | 147 (72.4%) | 56 (27.6%) |
| 2-Person Household | 235 (87.4%) | 34 (12.6%) |
| 3-Person Household | 89 (84.0%) | 17 (16.0%) |
| 4+ Person Household | 171 (96.6%) | 6 (3.4%) |
| Total Housing Units | 642 (85.0%) | 113 (15.0%) |
Occupancy by Educational Attainment in Port Byron
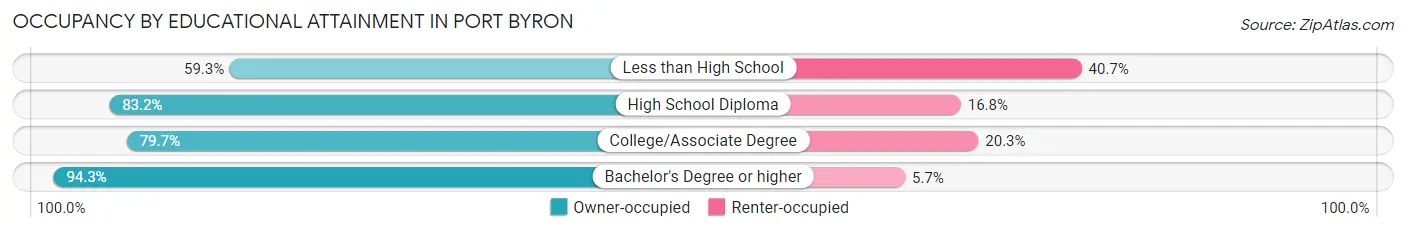
| Household Size | Owner-occupied | Renter-occupied |
| Less than High School | 16 (59.3%) | 11 (40.7%) |
| High School Diploma | 119 (83.2%) | 24 (16.8%) |
| College/Associate Degree | 244 (79.7%) | 62 (20.3%) |
| Bachelor's Degree or higher | 263 (94.3%) | 16 (5.7%) |
Occupancy by Age of Householder in Port Byron
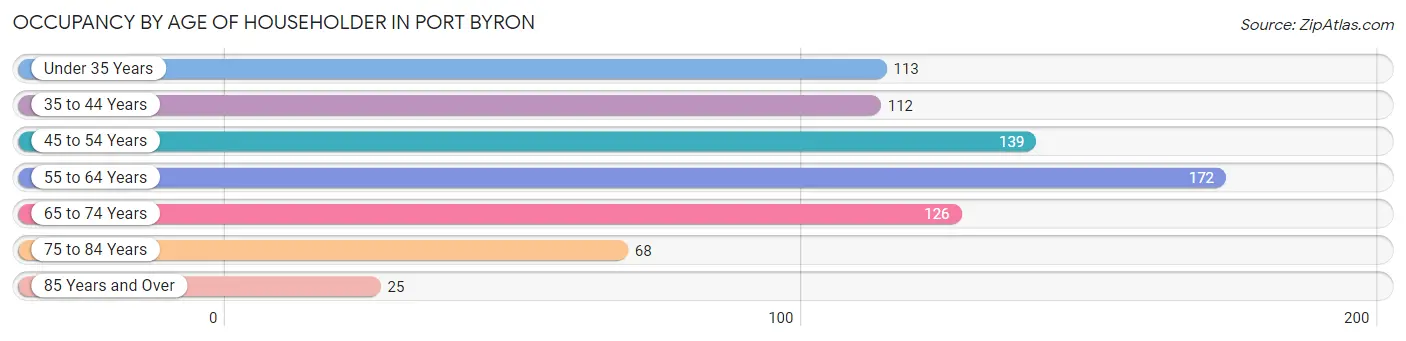
| Age Bracket | # Households | % Households |
| Under 35 Years | 113 | 15.0% |
| 35 to 44 Years | 112 | 14.8% |
| 45 to 54 Years | 139 | 18.4% |
| 55 to 64 Years | 172 | 22.8% |
| 65 to 74 Years | 126 | 16.7% |
| 75 to 84 Years | 68 | 9.0% |
| 85 Years and Over | 25 | 3.3% |
| Total | 755 | 100.0% |
Housing Finances in Port Byron
Median Income by Occupancy in Port Byron
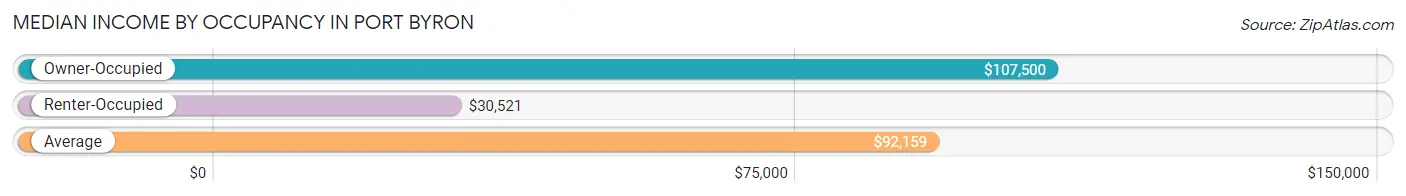
| Occupancy Type | # Households | Median Income |
| Owner-Occupied | 642 (85.0%) | $107,500 |
| Renter-Occupied | 113 (15.0%) | $30,521 |
| Average | 755 (100.0%) | $92,159 |
Occupancy by Householder Income Bracket in Port Byron
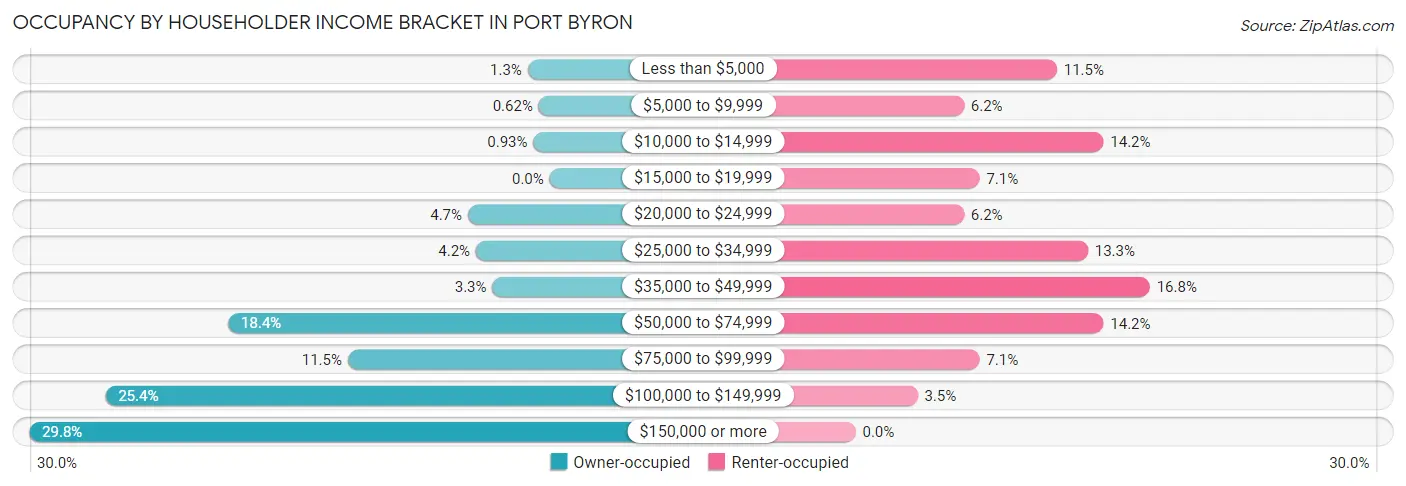
| Income Bracket | Owner-occupied | Renter-occupied |
| Less than $5,000 | 8 (1.3%) | 13 (11.5%) |
| $5,000 to $9,999 | 4 (0.6%) | 7 (6.2%) |
| $10,000 to $14,999 | 6 (0.9%) | 16 (14.2%) |
| $15,000 to $19,999 | 0 (0.0%) | 8 (7.1%) |
| $20,000 to $24,999 | 30 (4.7%) | 7 (6.2%) |
| $25,000 to $34,999 | 27 (4.2%) | 15 (13.3%) |
| $35,000 to $49,999 | 21 (3.3%) | 19 (16.8%) |
| $50,000 to $74,999 | 118 (18.4%) | 16 (14.2%) |
| $75,000 to $99,999 | 74 (11.5%) | 8 (7.1%) |
| $100,000 to $149,999 | 163 (25.4%) | 4 (3.5%) |
| $150,000 or more | 191 (29.7%) | 0 (0.0%) |
| Total | 642 (100.0%) | 113 (100.0%) |
Monthly Housing Cost Tiers in Port Byron
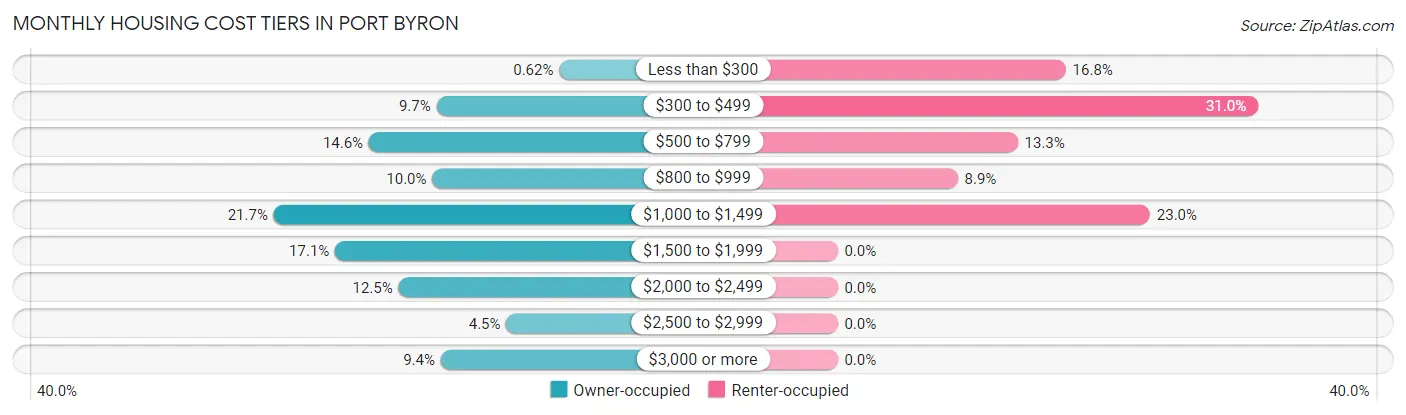
| Monthly Cost | Owner-occupied | Renter-occupied |
| Less than $300 | 4 (0.6%) | 19 (16.8%) |
| $300 to $499 | 62 (9.7%) | 35 (31.0%) |
| $500 to $799 | 94 (14.6%) | 15 (13.3%) |
| $800 to $999 | 64 (10.0%) | 10 (8.8%) |
| $1,000 to $1,499 | 139 (21.6%) | 26 (23.0%) |
| $1,500 to $1,999 | 110 (17.1%) | 0 (0.0%) |
| $2,000 to $2,499 | 80 (12.5%) | 0 (0.0%) |
| $2,500 to $2,999 | 29 (4.5%) | 0 (0.0%) |
| $3,000 or more | 60 (9.3%) | 0 (0.0%) |
| Total | 642 (100.0%) | 113 (100.0%) |
Physical Housing Characteristics in Port Byron
Housing Structures in Port Byron
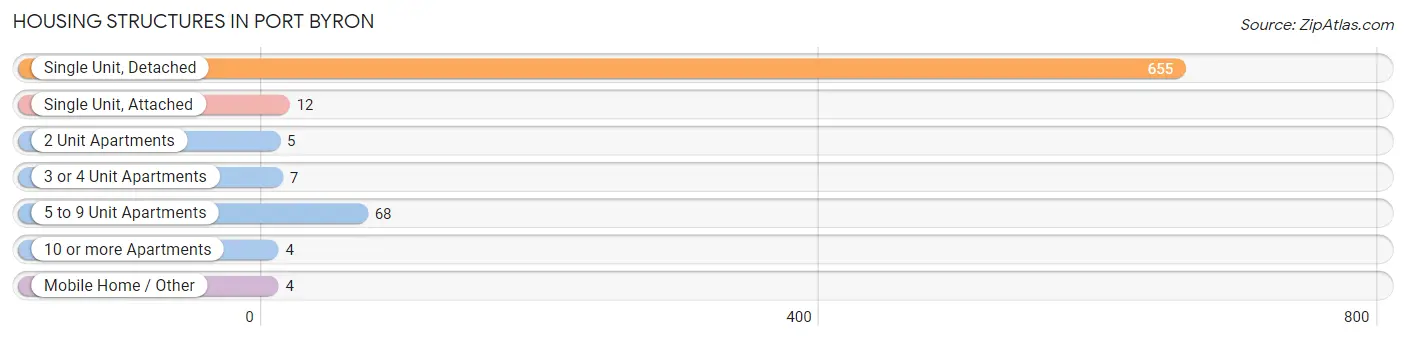
| Structure Type | # Housing Units | % Housing Units |
| Single Unit, Detached | 655 | 86.8% |
| Single Unit, Attached | 12 | 1.6% |
| 2 Unit Apartments | 5 | 0.7% |
| 3 or 4 Unit Apartments | 7 | 0.9% |
| 5 to 9 Unit Apartments | 68 | 9.0% |
| 10 or more Apartments | 4 | 0.5% |
| Mobile Home / Other | 4 | 0.5% |
| Total | 755 | 100.0% |
Housing Structures by Occupancy in Port Byron
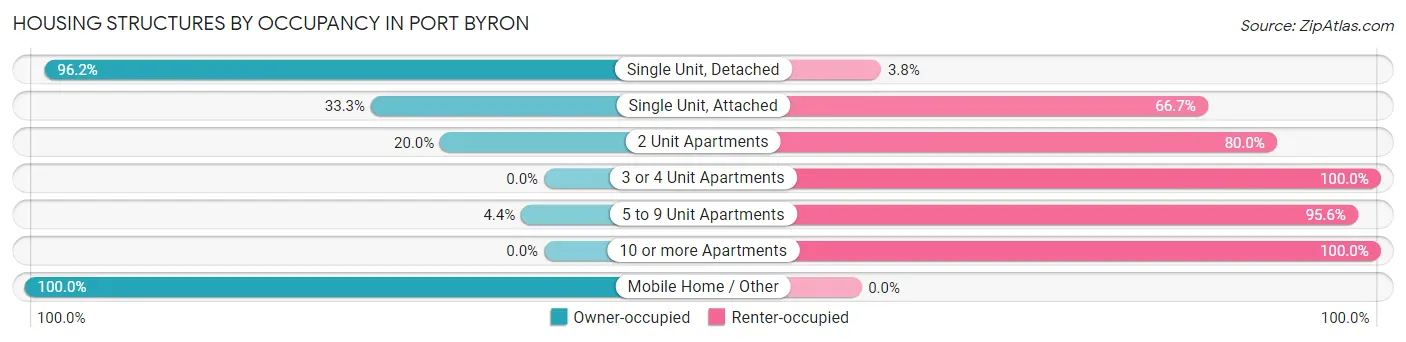
| Structure Type | Owner-occupied | Renter-occupied |
| Single Unit, Detached | 630 (96.2%) | 25 (3.8%) |
| Single Unit, Attached | 4 (33.3%) | 8 (66.7%) |
| 2 Unit Apartments | 1 (20.0%) | 4 (80.0%) |
| 3 or 4 Unit Apartments | 0 (0.0%) | 7 (100.0%) |
| 5 to 9 Unit Apartments | 3 (4.4%) | 65 (95.6%) |
| 10 or more Apartments | 0 (0.0%) | 4 (100.0%) |
| Mobile Home / Other | 4 (100.0%) | 0 (0.0%) |
| Total | 642 (85.0%) | 113 (15.0%) |
Housing Structures by Number of Rooms in Port Byron
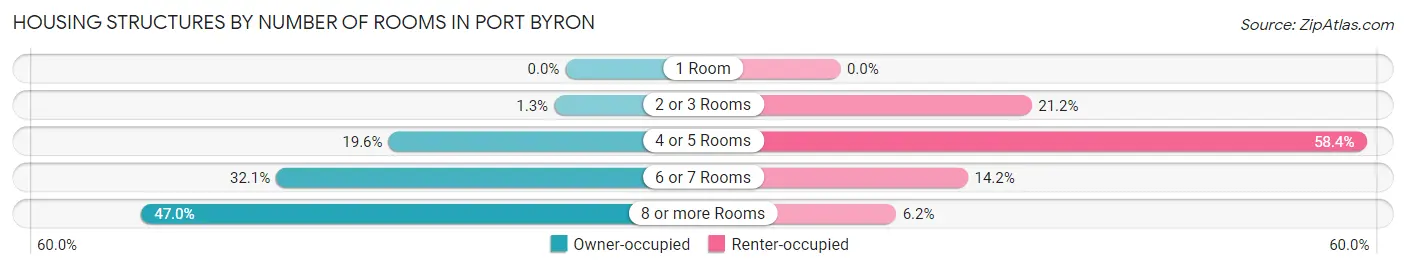
| Number of Rooms | Owner-occupied | Renter-occupied |
| 1 Room | 0 (0.0%) | 0 (0.0%) |
| 2 or 3 Rooms | 8 (1.3%) | 24 (21.2%) |
| 4 or 5 Rooms | 126 (19.6%) | 66 (58.4%) |
| 6 or 7 Rooms | 206 (32.1%) | 16 (14.2%) |
| 8 or more Rooms | 302 (47.0%) | 7 (6.2%) |
| Total | 642 (100.0%) | 113 (100.0%) |
Housing Structure by Heating Type in Port Byron
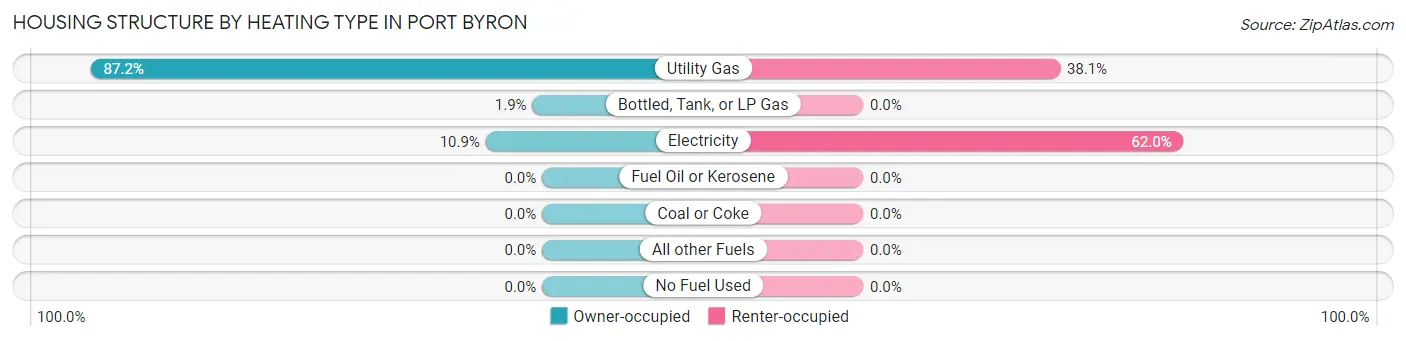
| Heating Type | Owner-occupied | Renter-occupied |
| Utility Gas | 560 (87.2%) | 43 (38.1%) |
| Bottled, Tank, or LP Gas | 12 (1.9%) | 0 (0.0%) |
| Electricity | 70 (10.9%) | 70 (62.0%) |
| Fuel Oil or Kerosene | 0 (0.0%) | 0 (0.0%) |
| Coal or Coke | 0 (0.0%) | 0 (0.0%) |
| All other Fuels | 0 (0.0%) | 0 (0.0%) |
| No Fuel Used | 0 (0.0%) | 0 (0.0%) |
| Total | 642 (100.0%) | 113 (100.0%) |
Household Vehicle Usage in Port Byron
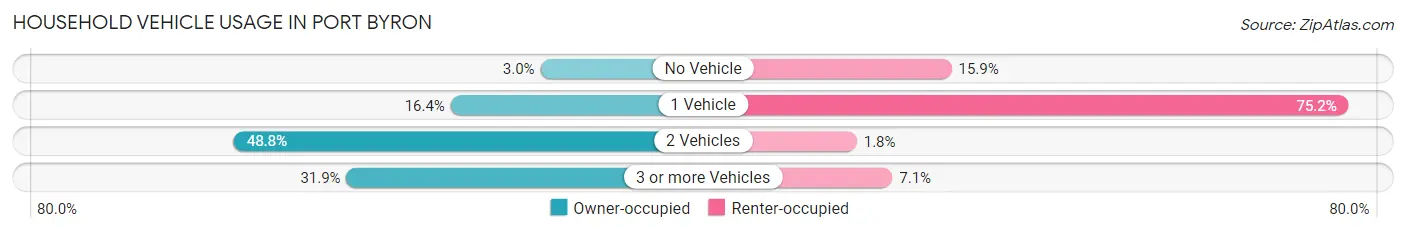
| Vehicles per Household | Owner-occupied | Renter-occupied |
| No Vehicle | 19 (3.0%) | 18 (15.9%) |
| 1 Vehicle | 105 (16.4%) | 85 (75.2%) |
| 2 Vehicles | 313 (48.7%) | 2 (1.8%) |
| 3 or more Vehicles | 205 (31.9%) | 8 (7.1%) |
| Total | 642 (100.0%) | 113 (100.0%) |
Real Estate & Mortgages in Port Byron
Real Estate and Mortgage Overview in Port Byron
| Characteristic | Without Mortgage | With Mortgage |
| Housing Units | 223 | 419 |
| Median Property Value | $204,200 | $267,600 |
| Median Household Income | $63,125 | $156 |
| Monthly Housing Costs | $684 | $60 |
| Real Estate Taxes | $4,059 | $4 |
Property Value by Mortgage Status in Port Byron
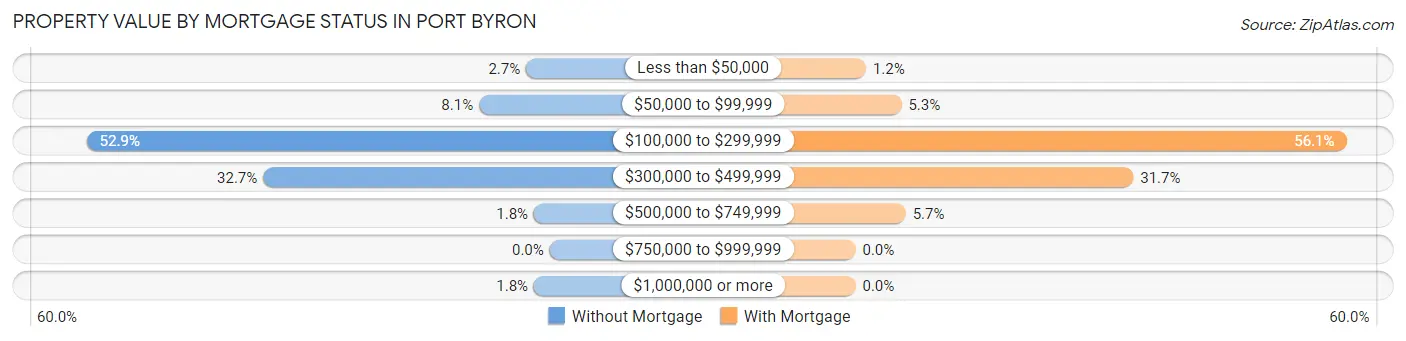
| Property Value | Without Mortgage | With Mortgage |
| Less than $50,000 | 6 (2.7%) | 5 (1.2%) |
| $50,000 to $99,999 | 18 (8.1%) | 22 (5.2%) |
| $100,000 to $299,999 | 118 (52.9%) | 235 (56.1%) |
| $300,000 to $499,999 | 73 (32.7%) | 133 (31.7%) |
| $500,000 to $749,999 | 4 (1.8%) | 24 (5.7%) |
| $750,000 to $999,999 | 0 (0.0%) | 0 (0.0%) |
| $1,000,000 or more | 4 (1.8%) | 0 (0.0%) |
| Total | 223 (100.0%) | 419 (100.0%) |
Household Income by Mortgage Status in Port Byron
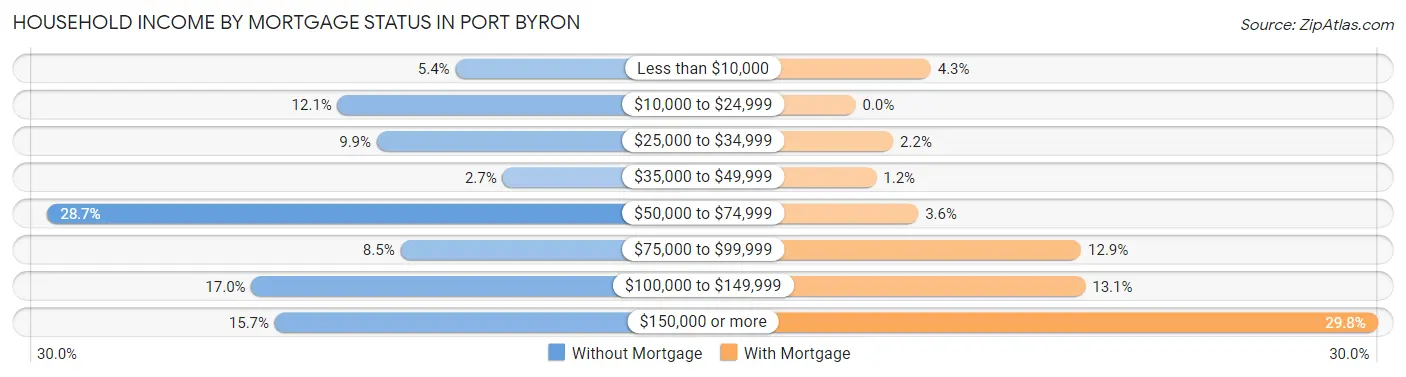
| Household Income | Without Mortgage | With Mortgage |
| Less than $10,000 | 12 (5.4%) | 18 (4.3%) |
| $10,000 to $24,999 | 27 (12.1%) | 0 (0.0%) |
| $25,000 to $34,999 | 22 (9.9%) | 9 (2.1%) |
| $35,000 to $49,999 | 6 (2.7%) | 5 (1.2%) |
| $50,000 to $74,999 | 64 (28.7%) | 15 (3.6%) |
| $75,000 to $99,999 | 19 (8.5%) | 54 (12.9%) |
| $100,000 to $149,999 | 38 (17.0%) | 55 (13.1%) |
| $150,000 or more | 35 (15.7%) | 125 (29.8%) |
| Total | 223 (100.0%) | 419 (100.0%) |
Property Value to Household Income Ratio in Port Byron
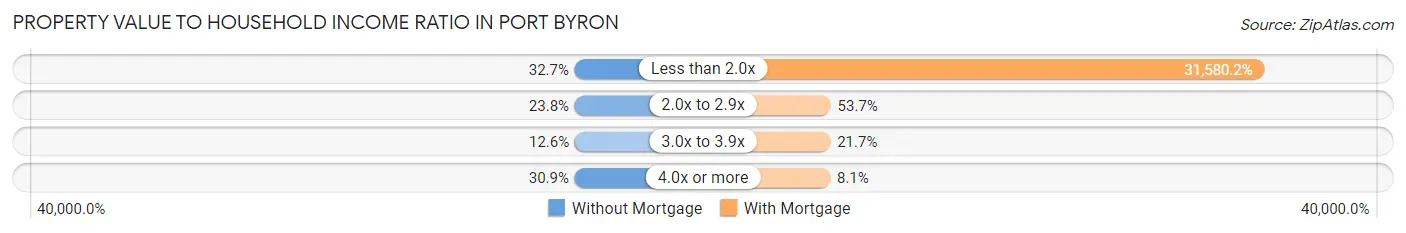
| Value-to-Income Ratio | Without Mortgage | With Mortgage |
| Less than 2.0x | 73 (32.7%) | 132,321 (31,580.2%) |
| 2.0x to 2.9x | 53 (23.8%) | 225 (53.7%) |
| 3.0x to 3.9x | 28 (12.6%) | 91 (21.7%) |
| 4.0x or more | 69 (30.9%) | 34 (8.1%) |
| Total | 223 (100.0%) | 419 (100.0%) |
Real Estate Taxes by Mortgage Status in Port Byron
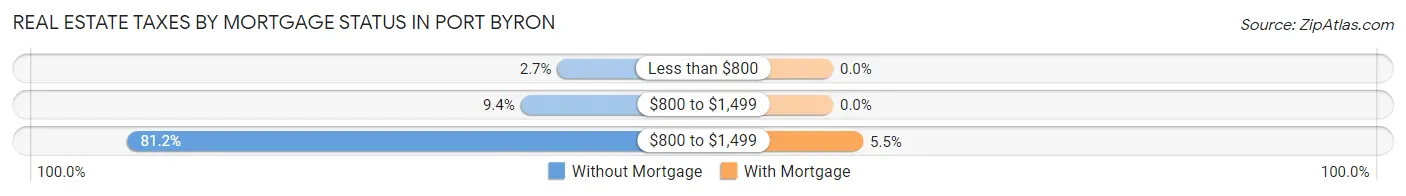
| Property Taxes | Without Mortgage | With Mortgage |
| Less than $800 | 6 (2.7%) | 0 (0.0%) |
| $800 to $1,499 | 21 (9.4%) | 0 (0.0%) |
| $800 to $1,499 | 181 (81.2%) | 23 (5.5%) |
| Total | 223 (100.0%) | 419 (100.0%) |
Health & Disability in Port Byron
Health Insurance Coverage by Age in Port Byron
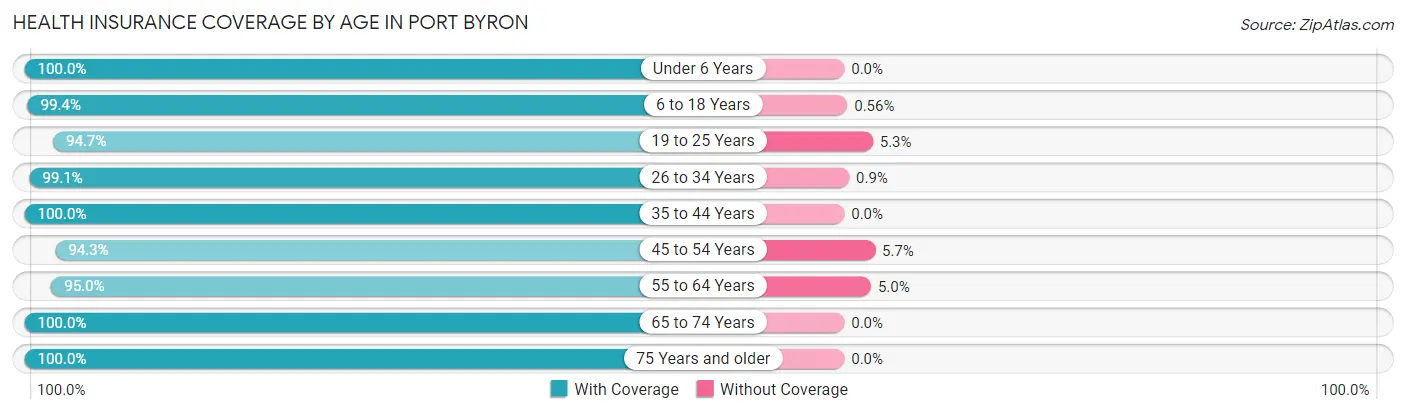
| Age Bracket | With Coverage | Without Coverage |
| Under 6 Years | 132 (100.0%) | 0 (0.0%) |
| 6 to 18 Years | 354 (99.4%) | 2 (0.6%) |
| 19 to 25 Years | 107 (94.7%) | 6 (5.3%) |
| 26 to 34 Years | 219 (99.1%) | 2 (0.9%) |
| 35 to 44 Years | 193 (100.0%) | 0 (0.0%) |
| 45 to 54 Years | 247 (94.3%) | 15 (5.7%) |
| 55 to 64 Years | 286 (95.0%) | 15 (5.0%) |
| 65 to 74 Years | 207 (100.0%) | 0 (0.0%) |
| 75 Years and older | 119 (100.0%) | 0 (0.0%) |
| Total | 1,864 (97.9%) | 40 (2.1%) |
Health Insurance Coverage by Citizenship Status in Port Byron
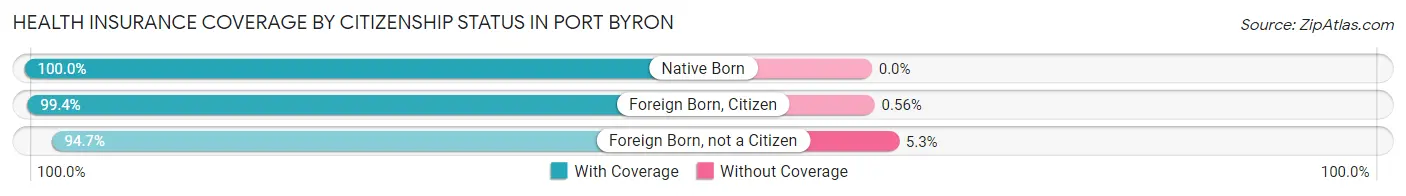
| Citizenship Status | With Coverage | Without Coverage |
| Native Born | 132 (100.0%) | 0 (0.0%) |
| Foreign Born, Citizen | 354 (99.4%) | 2 (0.6%) |
| Foreign Born, not a Citizen | 107 (94.7%) | 6 (5.3%) |
Health Insurance Coverage by Household Income in Port Byron
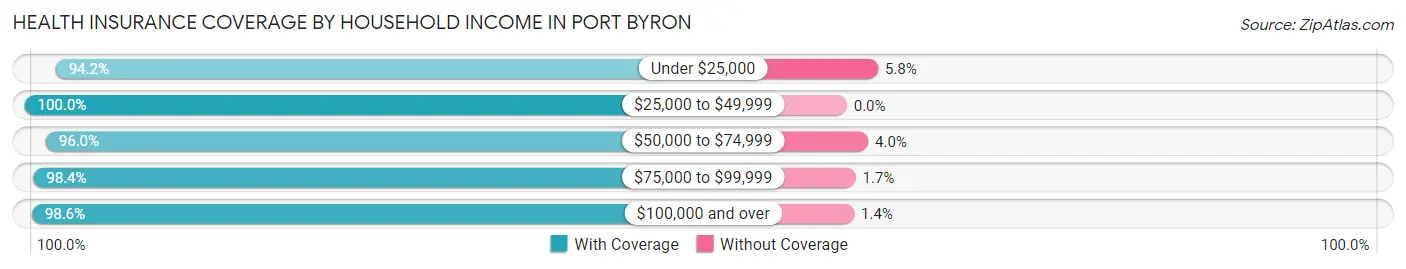
| Household Income | With Coverage | Without Coverage |
| Under $25,000 | 145 (94.2%) | 9 (5.8%) |
| $25,000 to $49,999 | 101 (100.0%) | 0 (0.0%) |
| $50,000 to $74,999 | 289 (96.0%) | 12 (4.0%) |
| $75,000 to $99,999 | 179 (98.4%) | 3 (1.7%) |
| $100,000 and over | 1,150 (98.6%) | 16 (1.4%) |
Public vs Private Health Insurance Coverage by Age in Port Byron
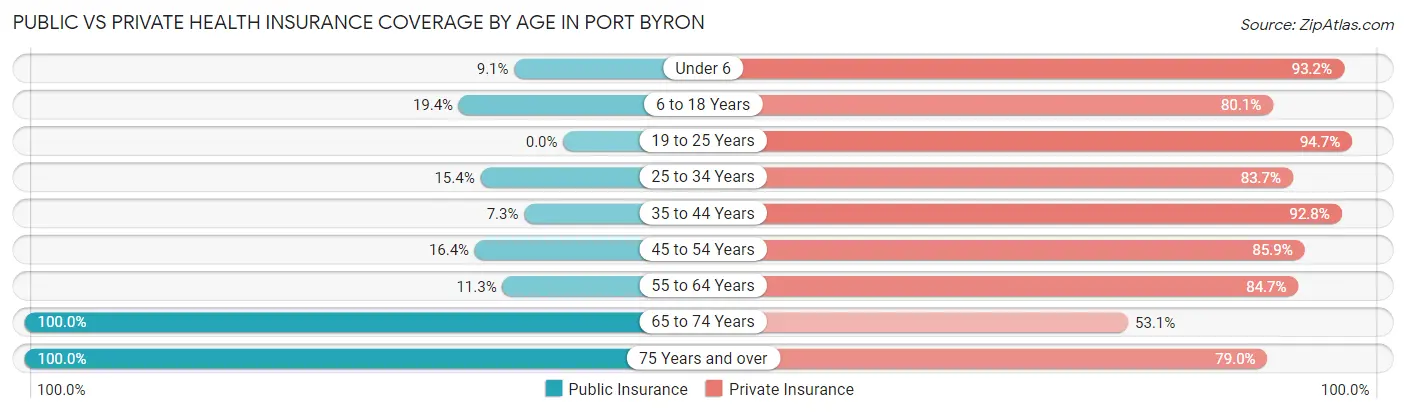
| Age Bracket | Public Insurance | Private Insurance |
| Under 6 | 12 (9.1%) | 123 (93.2%) |
| 6 to 18 Years | 69 (19.4%) | 285 (80.1%) |
| 19 to 25 Years | 0 (0.0%) | 107 (94.7%) |
| 25 to 34 Years | 34 (15.4%) | 185 (83.7%) |
| 35 to 44 Years | 14 (7.2%) | 179 (92.7%) |
| 45 to 54 Years | 43 (16.4%) | 225 (85.9%) |
| 55 to 64 Years | 34 (11.3%) | 255 (84.7%) |
| 65 to 74 Years | 207 (100.0%) | 110 (53.1%) |
| 75 Years and over | 119 (100.0%) | 94 (79.0%) |
| Total | 532 (27.9%) | 1,563 (82.1%) |
Disability Status by Sex by Age in Port Byron
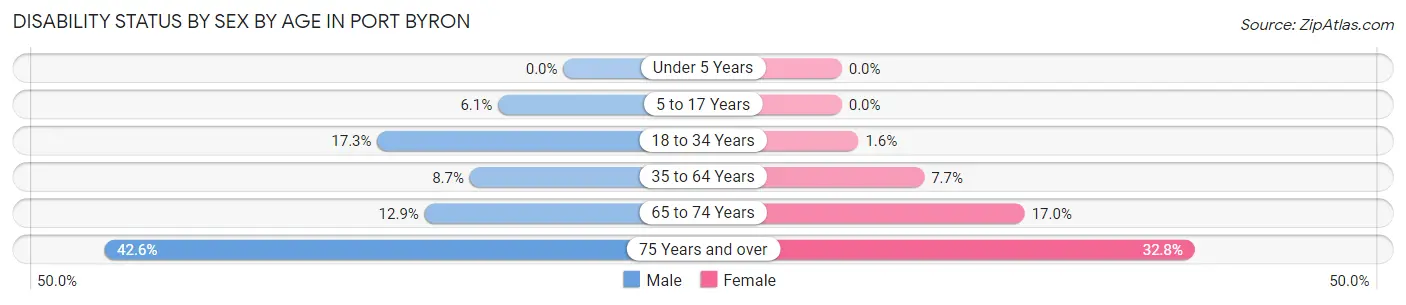
| Age Bracket | Male | Female |
| Under 5 Years | 0 (0.0%) | 0 (0.0%) |
| 5 to 17 Years | 12 (6.1%) | 0 (0.0%) |
| 18 to 34 Years | 29 (17.3%) | 3 (1.5%) |
| 35 to 64 Years | 35 (8.7%) | 27 (7.6%) |
| 65 to 74 Years | 13 (12.9%) | 18 (17.0%) |
| 75 Years and over | 26 (42.6%) | 19 (32.8%) |
Disability Class by Sex by Age in Port Byron
Disability Class: Hearing Difficulty
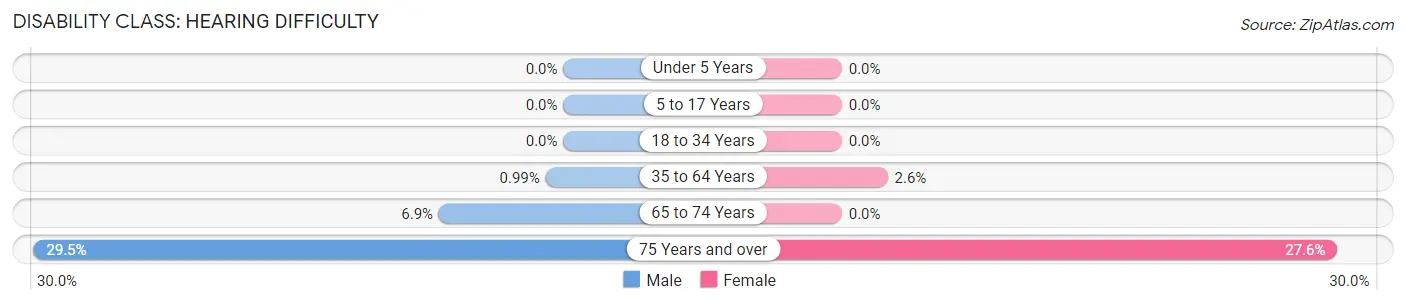
| Age Bracket | Male | Female |
| Under 5 Years | 0 (0.0%) | 0 (0.0%) |
| 5 to 17 Years | 0 (0.0%) | 0 (0.0%) |
| 18 to 34 Years | 0 (0.0%) | 0 (0.0%) |
| 35 to 64 Years | 4 (1.0%) | 9 (2.5%) |
| 65 to 74 Years | 7 (6.9%) | 0 (0.0%) |
| 75 Years and over | 18 (29.5%) | 16 (27.6%) |
Disability Class: Vision Difficulty
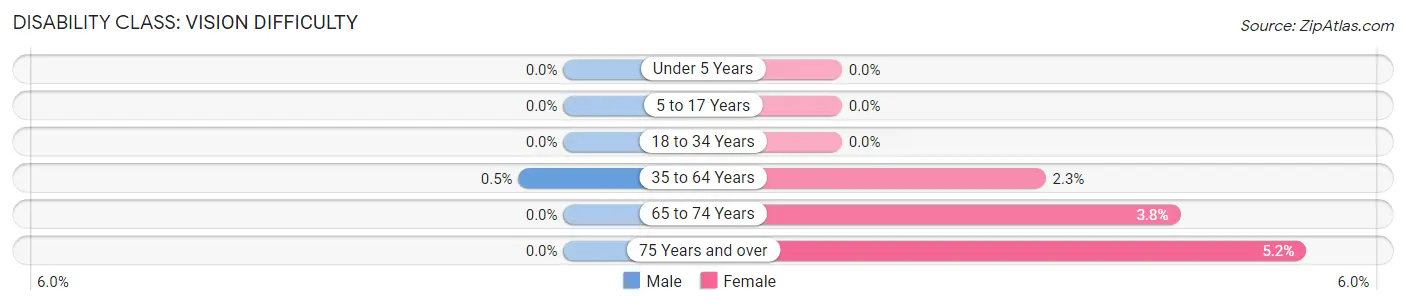
| Age Bracket | Male | Female |
| Under 5 Years | 0 (0.0%) | 0 (0.0%) |
| 5 to 17 Years | 0 (0.0%) | 0 (0.0%) |
| 18 to 34 Years | 0 (0.0%) | 0 (0.0%) |
| 35 to 64 Years | 2 (0.5%) | 8 (2.3%) |
| 65 to 74 Years | 0 (0.0%) | 4 (3.8%) |
| 75 Years and over | 0 (0.0%) | 3 (5.2%) |
Disability Class: Cognitive Difficulty
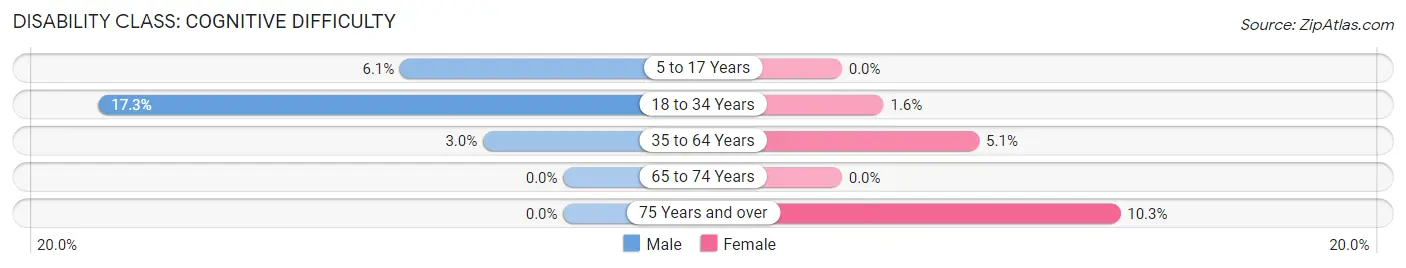
| Age Bracket | Male | Female |
| 5 to 17 Years | 12 (6.1%) | 0 (0.0%) |
| 18 to 34 Years | 29 (17.3%) | 3 (1.5%) |
| 35 to 64 Years | 12 (3.0%) | 18 (5.1%) |
| 65 to 74 Years | 0 (0.0%) | 0 (0.0%) |
| 75 Years and over | 0 (0.0%) | 6 (10.3%) |
Disability Class: Ambulatory Difficulty
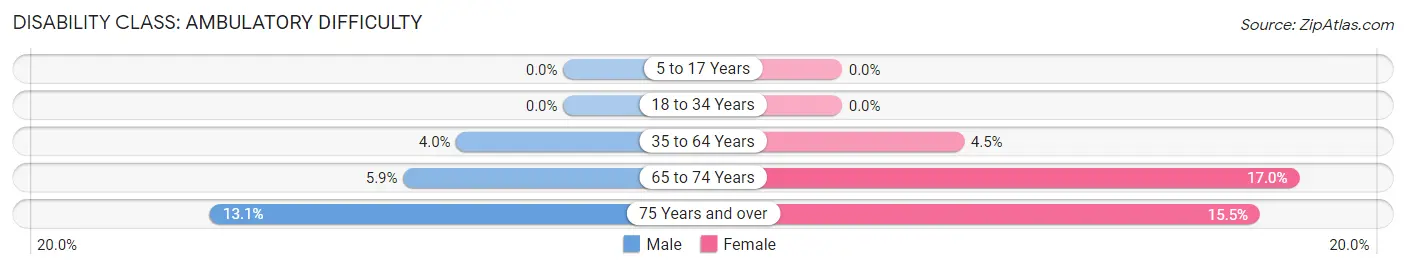
| Age Bracket | Male | Female |
| 5 to 17 Years | 0 (0.0%) | 0 (0.0%) |
| 18 to 34 Years | 0 (0.0%) | 0 (0.0%) |
| 35 to 64 Years | 16 (4.0%) | 16 (4.5%) |
| 65 to 74 Years | 6 (5.9%) | 18 (17.0%) |
| 75 Years and over | 8 (13.1%) | 9 (15.5%) |
Disability Class: Self-Care Difficulty
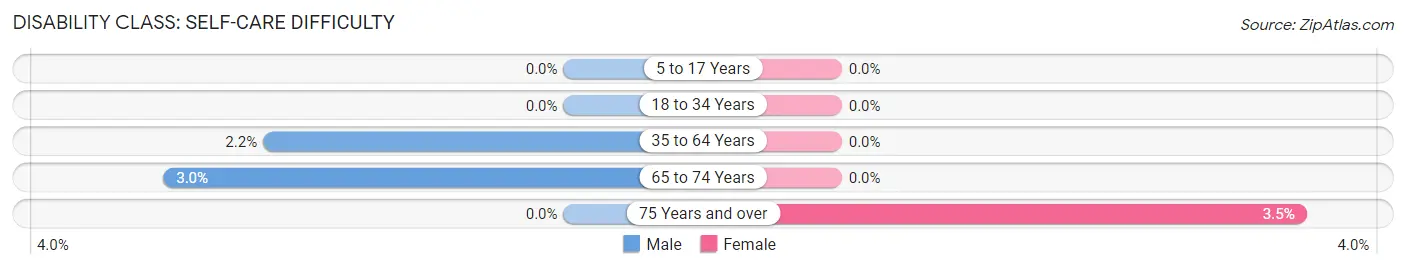
| Age Bracket | Male | Female |
| 5 to 17 Years | 0 (0.0%) | 0 (0.0%) |
| 18 to 34 Years | 0 (0.0%) | 0 (0.0%) |
| 35 to 64 Years | 9 (2.2%) | 0 (0.0%) |
| 65 to 74 Years | 3 (3.0%) | 0 (0.0%) |
| 75 Years and over | 0 (0.0%) | 2 (3.5%) |
Technology Access in Port Byron
Computing Device Access in Port Byron
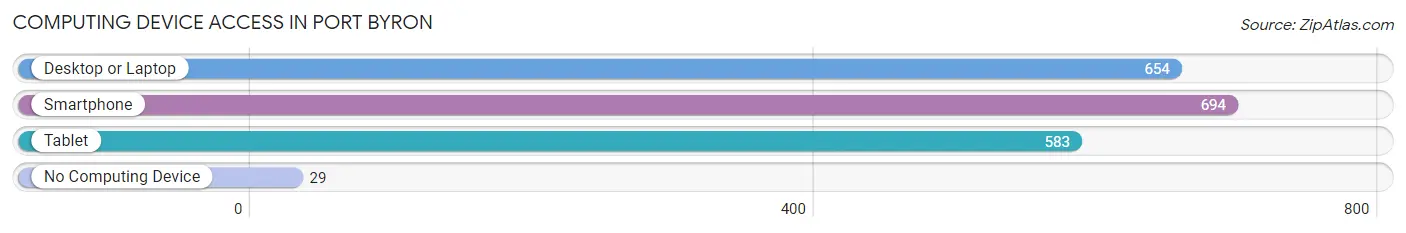
| Device Type | # Households | % Households |
| Desktop or Laptop | 654 | 86.6% |
| Smartphone | 694 | 91.9% |
| Tablet | 583 | 77.2% |
| No Computing Device | 29 | 3.8% |
| Total | 755 | 100.0% |
Internet Access in Port Byron
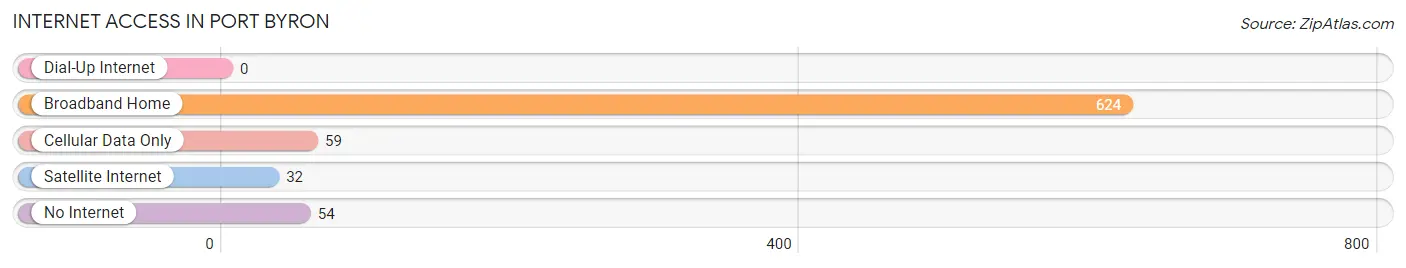
| Internet Type | # Households | % Households |
| Dial-Up Internet | 0 | 0.0% |
| Broadband Home | 624 | 82.7% |
| Cellular Data Only | 59 | 7.8% |
| Satellite Internet | 32 | 4.2% |
| No Internet | 54 | 7.1% |
| Total | 755 | 100.0% |
Port Byron Summary
History
Port Byron, Illinois is a small village located in Rock Island County, Illinois. It is situated on the banks of the Mississippi River, just south of the Quad Cities. The village was founded in 1836 by a group of settlers from New York, led by William and Mary Ann Port. The village was named after William Port, who was a prominent businessman in the area.
The village was originally a farming community, but it soon became a hub for riverboat traffic. The first steamboat to dock in Port Byron was the "John A. Dix" in 1837. The village was also home to a number of mills, including a grist mill, a saw mill, and a woolen mill.
In the late 19th century, the village began to grow and develop. The first school was built in 1867, and the first post office was established in 1868. The village was incorporated in 1872, and the first mayor was elected in 1873.
In the early 20th century, the village continued to grow and develop. The first bank was established in 1906, and the first telephone service was established in 1907. The village also had a number of businesses, including a hotel, a general store, a blacksmith shop, and a livery stable.
The village was also home to a number of churches, including the Methodist Episcopal Church, the Congregational Church, and the Presbyterian Church. The village also had a number of fraternal organizations, including the Masons, the Odd Fellows, and the Knights of Pythias.
The village was also home to a number of industries, including a brickyard, a canning factory, and a flour mill. The village also had a number of recreational activities, including a baseball team, a golf course, and a swimming pool.
Geography
Port Byron is located in Rock Island County, Illinois. It is situated on the banks of the Mississippi River, just south of the Quad Cities. The village is located at an elevation of 645 feet above sea level.
The village is located in a rural area, and is surrounded by farmland. The nearest major city is Moline, which is located about 10 miles to the north. The nearest airport is the Quad City International Airport, which is located about 25 miles to the north.
The village has a total area of 1.2 square miles, all of which is land. The village is located in the Central Standard Time Zone.
Economy
The economy of Port Byron is largely based on agriculture and tourism. The village is home to a number of farms, which produce a variety of crops, including corn, soybeans, and wheat. The village also has a number of tourist attractions, including the Port Byron Historical Museum, the Port Byron State Park, and the Port Byron Marina.
The village also has a number of businesses, including restaurants, retail stores, and service providers. The village is also home to a number of manufacturing companies, including a canning factory and a flour mill.
Demographics
As of the 2010 census, the population of Port Byron was 1,845. The population density was 1,521 people per square mile. The racial makeup of the village was 97.3% White, 0.7% African American, 0.2% Native American, 0.2% Asian, 0.2% from other races, and 1.6% from two or more races. Hispanic or Latino of any race were 1.2% of the population.
The median income for a household in the village was $45,938, and the median income for a family was $51,250. The per capita income for the village was $20,945. About 6.2% of families and 8.2% of the population were below the poverty line, including 10.2% of those under age 18 and 5.2% of those age 65 or over.
Common Questions
What is Per Capita Income in Port Byron?
Per Capita income in Port Byron is $46,069.
What is the Median Family Income in Port Byron?
Median Family Income in Port Byron is $113,558.
What is the Median Household income in Port Byron?
Median Household Income in Port Byron is $92,159.
What is Income or Wage Gap in Port Byron?
Income or Wage Gap in Port Byron is 61.4%.
Women in Port Byron earn 38.6 cents for every dollar earned by a man.
What is Inequality or Gini Index in Port Byron?
Inequality or Gini Index in Port Byron is 0.42.
What is the Total Population of Port Byron?
Total Population of Port Byron is 1,904.
What is the Total Male Population of Port Byron?
Total Male Population of Port Byron is 978.
What is the Total Female Population of Port Byron?
Total Female Population of Port Byron is 926.
What is the Ratio of Males per 100 Females in Port Byron?
There are 105.62 Males per 100 Females in Port Byron.
What is the Ratio of Females per 100 Males in Port Byron?
There are 94.68 Females per 100 Males in Port Byron.
What is the Median Population Age in Port Byron?
Median Population Age in Port Byron is 42.6 Years.
What is the Average Family Size in Port Byron
Average Family Size in Port Byron is 3.1 People.
What is the Average Household Size in Port Byron
Average Household Size in Port Byron is 2.5 People.
How Large is the Labor Force in Port Byron?
There are 911 People in the Labor Forcein in Port Byron.
What is the Percentage of People in the Labor Force in Port Byron?
61.0% of People are in the Labor Force in Port Byron.
What is the Unemployment Rate in Port Byron?
Unemployment Rate in Port Byron is 3.4%.