Norwood, IL Map & Demographics
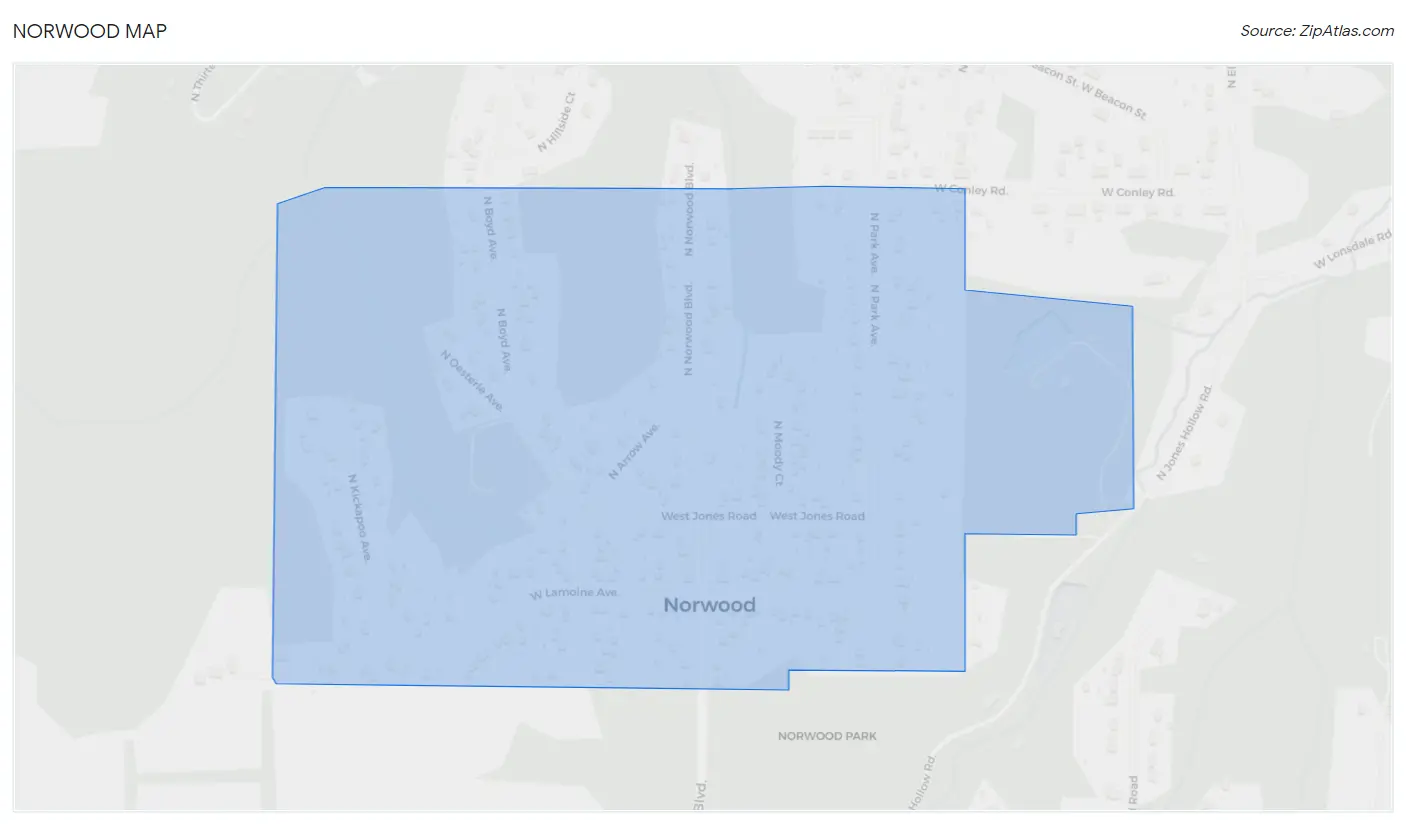
Norwood Map
Norwood Overview
$25,180
PER CAPITA INCOME
$88,750
AVG FAMILY INCOME
$64,500
AVG HOUSEHOLD INCOME
63.1%
WAGE / INCOME GAP [ % ]
36.9¢/ $1
WAGE / INCOME GAP [ $ ]
0.27
INEQUALITY / GINI INDEX
489
TOTAL POPULATION
255
MALE POPULATION
234
FEMALE POPULATION
108.97
MALES / 100 FEMALES
91.76
FEMALES / 100 MALES
36.4
MEDIAN AGE
2.9
AVG FAMILY SIZE
2.6
AVG HOUSEHOLD SIZE
245
LABOR FORCE [ PEOPLE ]
69.4%
PERCENT IN LABOR FORCE
2.9%
UNEMPLOYMENT RATE
Income in Norwood
Income Overview in Norwood
Per Capita Income in Norwood is $25,180, while median incomes of families and households are $88,750 and $64,500 respectively.
| Characteristic | Number | Measure |
| Per Capita Income | 489 | $25,180 |
| Median Family Income | 148 | $88,750 |
| Mean Family Income | 148 | $82,570 |
| Median Household Income | 188 | $64,500 |
| Mean Household Income | 188 | $74,808 |
| Income Deficit | 148 | $0 |
| Wage / Income Gap (%) | 489 | 63.05% |
| Wage / Income Gap ($) | 489 | 36.95¢ per $1 |
| Gini / Inequality Index | 489 | 0.27 |
Earnings by Sex in Norwood
Average Earnings in Norwood are $35,625, $58,864 for men and $21,750 for women, a difference of 63.0%.
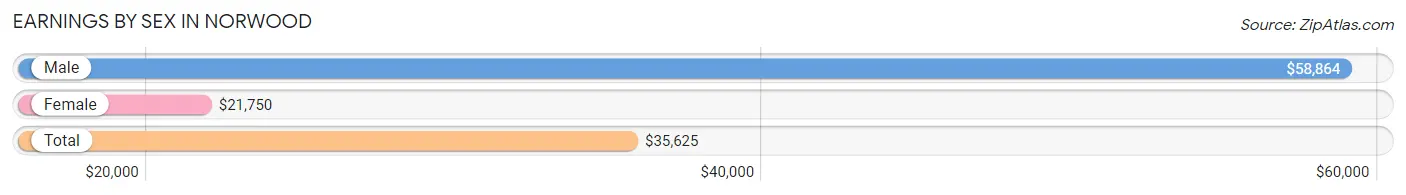
| Sex | Number | Average Earnings |
| Male | 134 (52.5%) | $58,864 |
| Female | 121 (47.4%) | $21,750 |
| Total | 255 (100.0%) | $35,625 |
Earnings by Sex by Income Bracket in Norwood
The most common earnings brackets in Norwood are $65,000 to $74,999 for men (43 | 32.1%) and $5,000 to $7,499 for women (18 | 14.9%).
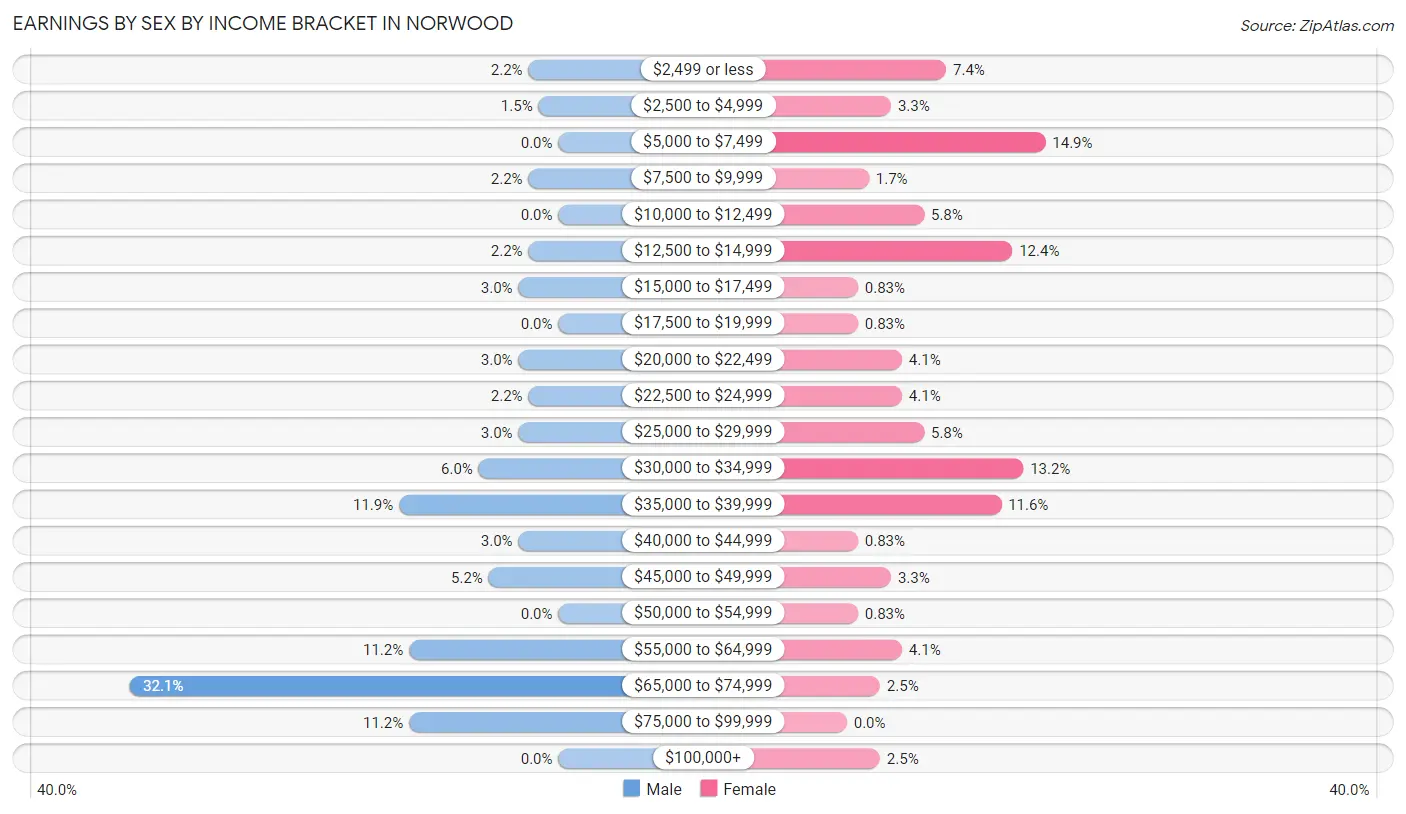
| Income | Male | Female |
| $2,499 or less | 3 (2.2%) | 9 (7.4%) |
| $2,500 to $4,999 | 2 (1.5%) | 4 (3.3%) |
| $5,000 to $7,499 | 0 (0.0%) | 18 (14.9%) |
| $7,500 to $9,999 | 3 (2.2%) | 2 (1.7%) |
| $10,000 to $12,499 | 0 (0.0%) | 7 (5.8%) |
| $12,500 to $14,999 | 3 (2.2%) | 15 (12.4%) |
| $15,000 to $17,499 | 4 (3.0%) | 1 (0.8%) |
| $17,500 to $19,999 | 0 (0.0%) | 1 (0.8%) |
| $20,000 to $22,499 | 4 (3.0%) | 5 (4.1%) |
| $22,500 to $24,999 | 3 (2.2%) | 5 (4.1%) |
| $25,000 to $29,999 | 4 (3.0%) | 7 (5.8%) |
| $30,000 to $34,999 | 8 (6.0%) | 16 (13.2%) |
| $35,000 to $39,999 | 16 (11.9%) | 14 (11.6%) |
| $40,000 to $44,999 | 4 (3.0%) | 1 (0.8%) |
| $45,000 to $49,999 | 7 (5.2%) | 4 (3.3%) |
| $50,000 to $54,999 | 0 (0.0%) | 1 (0.8%) |
| $55,000 to $64,999 | 15 (11.2%) | 5 (4.1%) |
| $65,000 to $74,999 | 43 (32.1%) | 3 (2.5%) |
| $75,000 to $99,999 | 15 (11.2%) | 0 (0.0%) |
| $100,000+ | 0 (0.0%) | 3 (2.5%) |
| Total | 134 (100.0%) | 121 (100.0%) |
Earnings by Sex by Educational Attainment in Norwood
Average earnings in Norwood are $59,886 for men and $29,583 for women, a difference of 50.6%. Men with an educational attainment of college or associate's degree enjoy the highest average annual earnings of $66,090, while those with less than high school education earn the least with $21,250. Women with an educational attainment of graduate degree earn the most with the average annual earnings of $65,417, while those with high school diploma education have the smallest earnings of $23,750.
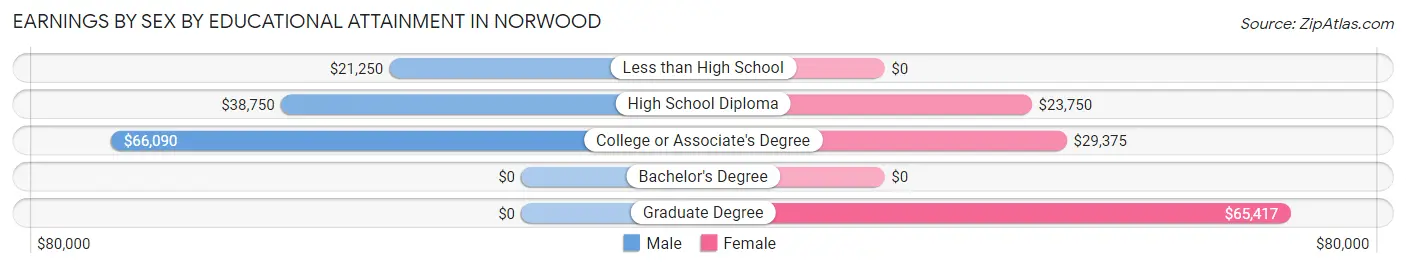
| Educational Attainment | Male Income | Female Income |
| Less than High School | $21,250 | $0 |
| High School Diploma | $38,750 | $23,750 |
| College or Associate's Degree | $66,090 | $29,375 |
| Bachelor's Degree | - | - |
| Graduate Degree | - | - |
| Total | $59,886 | $29,583 |
Family Income in Norwood
Family Income Brackets in Norwood
According to the Norwood family income data, there are 66 families falling into the $100,000 to $149,999 income range, which is the most common income bracket and makes up 44.6% of all families.
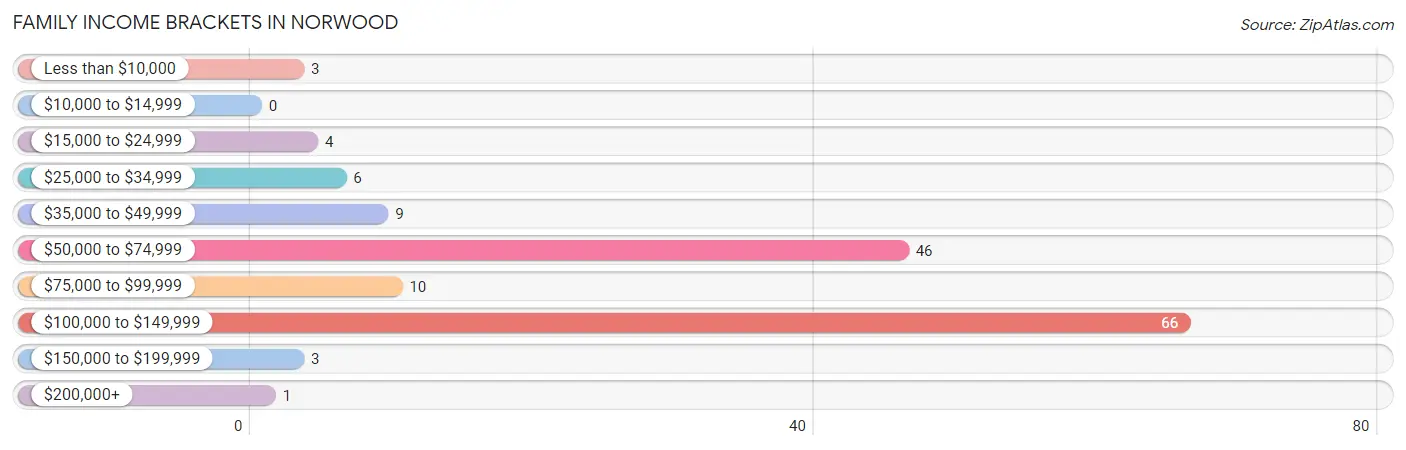
| Income Bracket | # Families | % Families |
| Less than $10,000 | 3 | 2.0% |
| $10,000 to $14,999 | 0 | 0.0% |
| $15,000 to $24,999 | 4 | 2.7% |
| $25,000 to $34,999 | 6 | 4.1% |
| $35,000 to $49,999 | 9 | 6.1% |
| $50,000 to $74,999 | 46 | 31.1% |
| $75,000 to $99,999 | 10 | 6.8% |
| $100,000 to $149,999 | 66 | 44.6% |
| $150,000 to $199,999 | 3 | 2.0% |
| $200,000+ | 1 | 0.7% |
Family Income by Famaliy Size in Norwood
2-person families (82 | 55.4%) account for the highest median family income in Norwood with $100,465 per family, while 2-person families (82 | 55.4%) have the highest median income of $50,232 per family member.
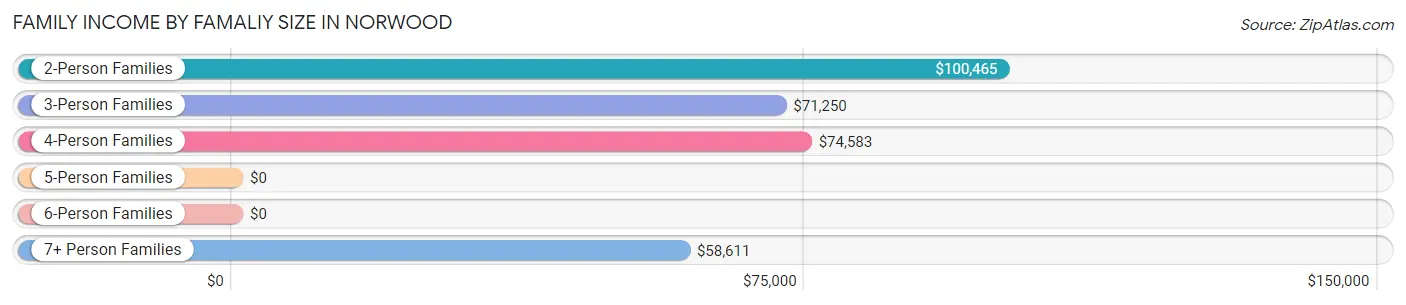
| Income Bracket | # Families | Median Income |
| 2-Person Families | 82 (55.4%) | $100,465 |
| 3-Person Families | 29 (19.6%) | $71,250 |
| 4-Person Families | 17 (11.5%) | $74,583 |
| 5-Person Families | 2 (1.3%) | $0 |
| 6-Person Families | 4 (2.7%) | $0 |
| 7+ Person Families | 14 (9.5%) | $58,611 |
| Total | 148 (100.0%) | $88,750 |
Family Income by Number of Earners in Norwood
The median family income in Norwood is $88,750, with families comprising 2 earners (76) having the highest median family income of $101,220, while families with no earners (18) have the lowest median family income of $44,500, accounting for 51.3% and 12.2% of families, respectively.
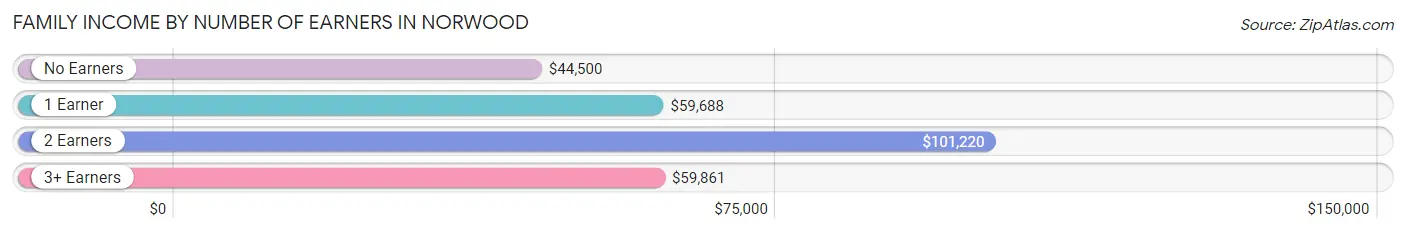
| Number of Earners | # Families | Median Income |
| No Earners | 18 (12.2%) | $44,500 |
| 1 Earner | 31 (20.9%) | $59,688 |
| 2 Earners | 76 (51.3%) | $101,220 |
| 3+ Earners | 23 (15.5%) | $59,861 |
| Total | 148 (100.0%) | $88,750 |
Household Income in Norwood
Household Income Brackets in Norwood
With 68 households falling in the category, the $100,000 to $149,999 income range is the most frequent in Norwood, accounting for 36.2% of all households. In contrast, only 1 households (0.5%) fall into the $10,000 to $14,999 income bracket, making it the least populous group.
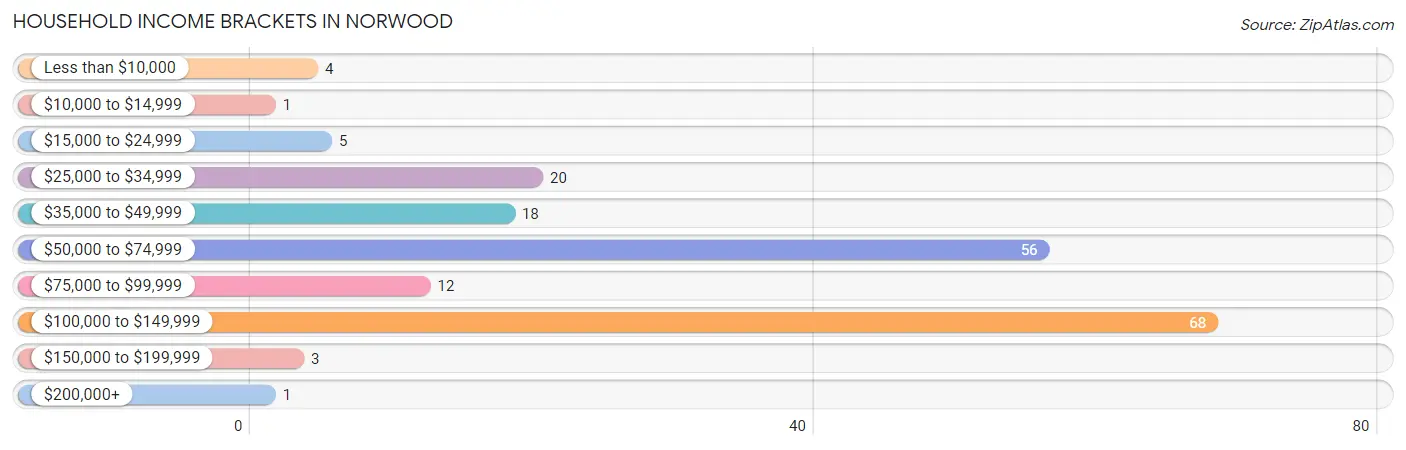
| Income Bracket | # Households | % Households |
| Less than $10,000 | 4 | 2.1% |
| $10,000 to $14,999 | 1 | 0.5% |
| $15,000 to $24,999 | 5 | 2.7% |
| $25,000 to $34,999 | 20 | 10.6% |
| $35,000 to $49,999 | 18 | 9.6% |
| $50,000 to $74,999 | 56 | 29.8% |
| $75,000 to $99,999 | 12 | 6.4% |
| $100,000 to $149,999 | 68 | 36.2% |
| $150,000 to $199,999 | 3 | 1.6% |
| $200,000+ | 1 | 0.5% |
Household Income by Householder Age in Norwood
The median household income in Norwood is $64,500, with the highest median household income of $100,872 found in the 45 to 64 years age bracket for the primary householder. A total of 88 households (46.8%) fall into this category.
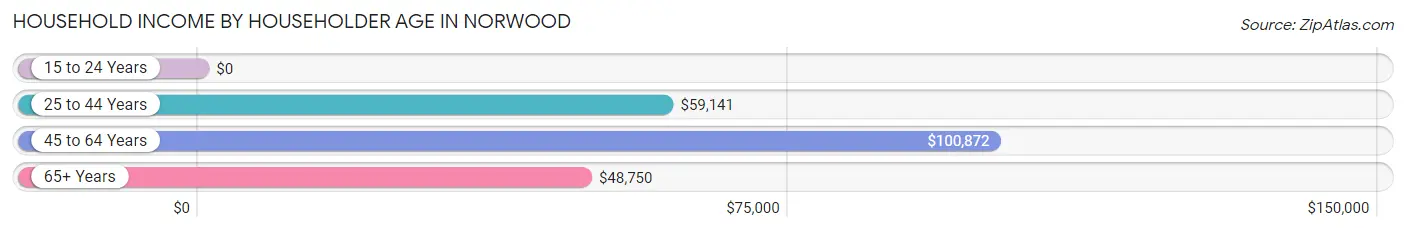
| Income Bracket | # Households | Median Income |
| 15 to 24 Years | 0 (0.0%) | $0 |
| 25 to 44 Years | 57 (30.3%) | $59,141 |
| 45 to 64 Years | 88 (46.8%) | $100,872 |
| 65+ Years | 43 (22.9%) | $48,750 |
| Total | 188 (100.0%) | $64,500 |
Poverty in Norwood
Income Below Poverty by Sex and Age in Norwood
With 7.6% poverty level for males and 13.3% for females among the residents of Norwood, 12 to 14 year old males and 5 year old females are the most vulnerable to poverty, with 5 males (41.7%) and 2 females (50.0%) in their respective age groups living below the poverty level.
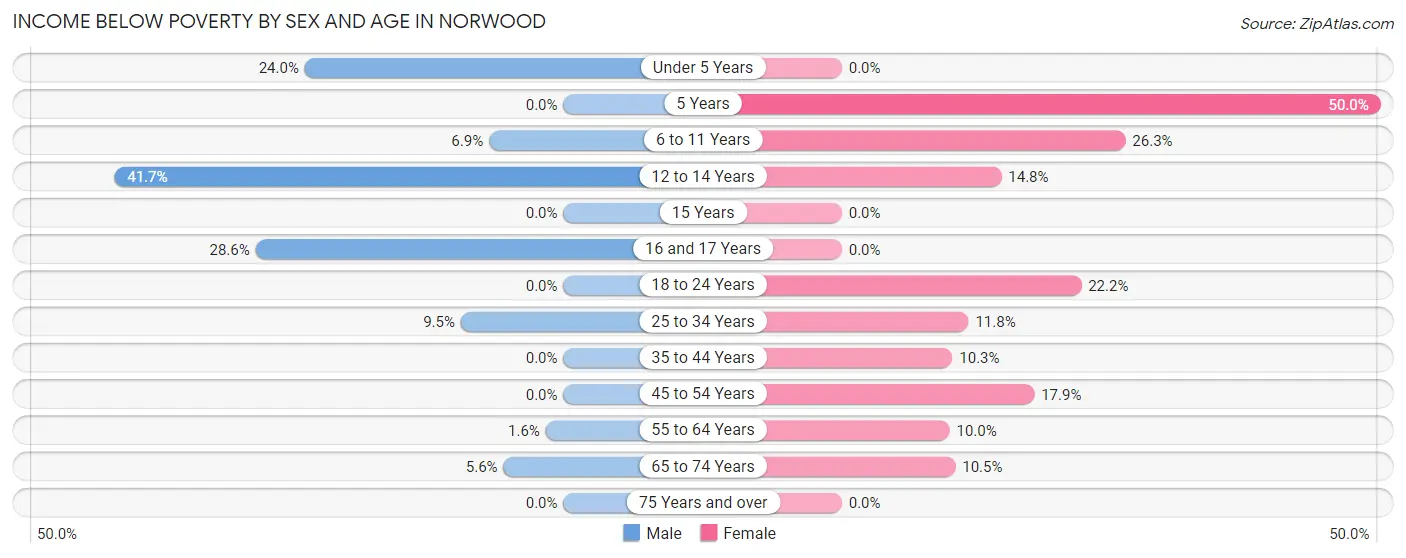
| Age Bracket | Male | Female |
| Under 5 Years | 6 (24.0%) | 0 (0.0%) |
| 5 Years | 0 (0.0%) | 2 (50.0%) |
| 6 to 11 Years | 2 (6.9%) | 5 (26.3%) |
| 12 to 14 Years | 5 (41.7%) | 4 (14.8%) |
| 15 Years | 0 (0.0%) | 0 (0.0%) |
| 16 and 17 Years | 2 (28.6%) | 0 (0.0%) |
| 18 to 24 Years | 0 (0.0%) | 4 (22.2%) |
| 25 to 34 Years | 2 (9.5%) | 2 (11.8%) |
| 35 to 44 Years | 0 (0.0%) | 4 (10.3%) |
| 45 to 54 Years | 0 (0.0%) | 5 (17.9%) |
| 55 to 64 Years | 1 (1.6%) | 3 (10.0%) |
| 65 to 74 Years | 1 (5.6%) | 2 (10.5%) |
| 75 Years and over | 0 (0.0%) | 0 (0.0%) |
| Total | 19 (7.6%) | 31 (13.3%) |
Income Above Poverty by Sex and Age in Norwood
According to the poverty statistics in Norwood, males aged 15 years and females aged under 5 years are the age groups that are most secure financially, with 100.0% of males and 100.0% of females in these age groups living above the poverty line.
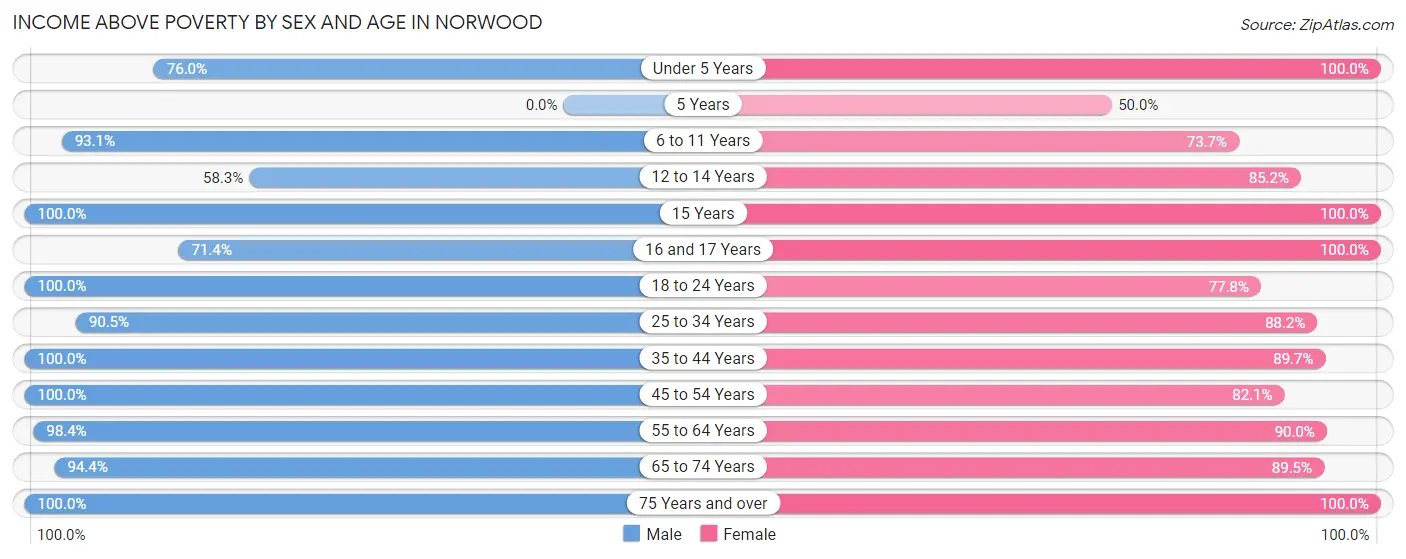
| Age Bracket | Male | Female |
| Under 5 Years | 19 (76.0%) | 1 (100.0%) |
| 5 Years | 0 (0.0%) | 2 (50.0%) |
| 6 to 11 Years | 27 (93.1%) | 14 (73.7%) |
| 12 to 14 Years | 7 (58.3%) | 23 (85.2%) |
| 15 Years | 12 (100.0%) | 3 (100.0%) |
| 16 and 17 Years | 5 (71.4%) | 15 (100.0%) |
| 18 to 24 Years | 7 (100.0%) | 14 (77.8%) |
| 25 to 34 Years | 19 (90.5%) | 15 (88.2%) |
| 35 to 44 Years | 30 (100.0%) | 35 (89.7%) |
| 45 to 54 Years | 12 (100.0%) | 23 (82.1%) |
| 55 to 64 Years | 60 (98.4%) | 27 (90.0%) |
| 65 to 74 Years | 17 (94.4%) | 17 (89.5%) |
| 75 Years and over | 17 (100.0%) | 14 (100.0%) |
| Total | 232 (92.4%) | 203 (86.8%) |
Income Below Poverty Among Married-Couple Families in Norwood
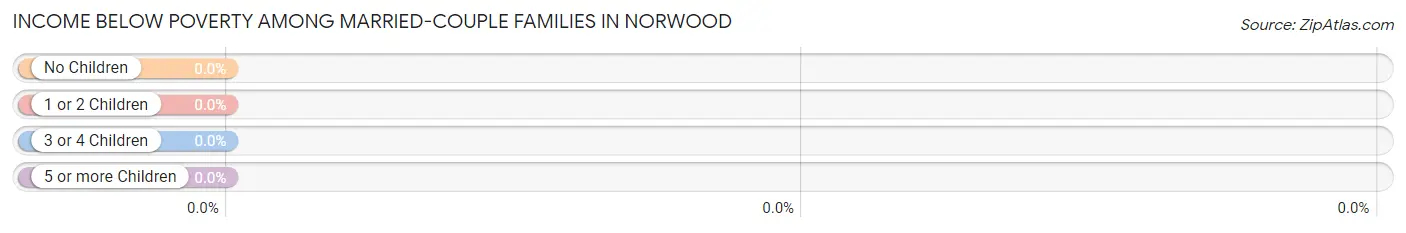
| Children | Above Poverty | Below Poverty |
| No Children | 46 (100.0%) | 0 (0.0%) |
| 1 or 2 Children | 23 (100.0%) | 0 (0.0%) |
| 3 or 4 Children | 7 (100.0%) | 0 (0.0%) |
| 5 or more Children | 9 (100.0%) | 0 (0.0%) |
| Total | 85 (100.0%) | 0 (0.0%) |
Income Below Poverty Among Single-Parent Households in Norwood
According to the poverty data in Norwood, 2.2% or 1 single-father households and 33.3% or 6 single-mother households are living below the poverty line. Among single-father households, those with no children have the highest poverty rate, with 1 households (2.4%) experiencing poverty. Likewise, among single-mother households, those with 5 or more children have the highest poverty rate, with 2 households (100.0%) falling below the poverty line.
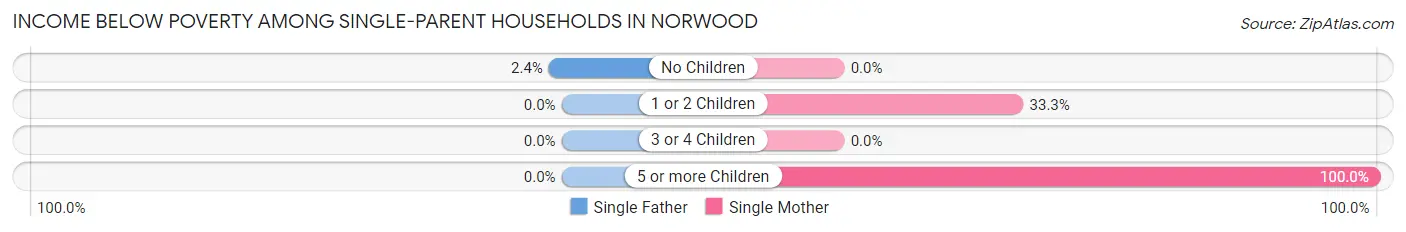
| Children | Single Father | Single Mother |
| No Children | 1 (2.4%) | 0 (0.0%) |
| 1 or 2 Children | 0 (0.0%) | 4 (33.3%) |
| 3 or 4 Children | 0 (0.0%) | 0 (0.0%) |
| 5 or more Children | 0 (0.0%) | 2 (100.0%) |
| Total | 1 (2.2%) | 6 (33.3%) |
Income Below Poverty Among Married-Couple vs Single-Parent Households in Norwood
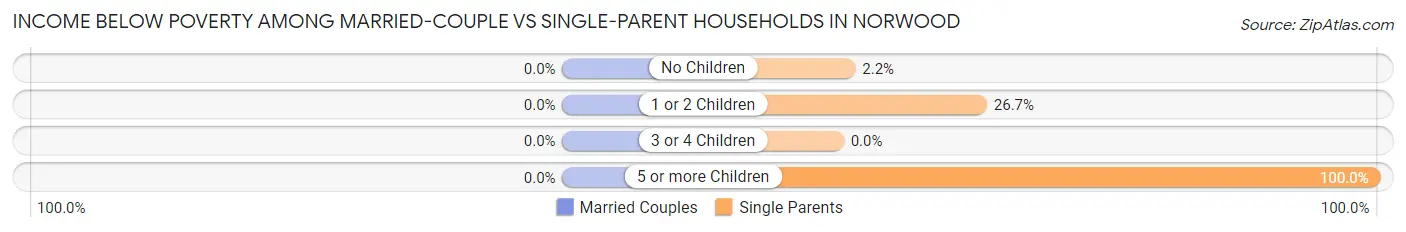
| Children | Married-Couple Families | Single-Parent Households |
| No Children | 0 (0.0%) | 1 (2.2%) |
| 1 or 2 Children | 0 (0.0%) | 4 (26.7%) |
| 3 or 4 Children | 0 (0.0%) | 0 (0.0%) |
| 5 or more Children | 0 (0.0%) | 2 (100.0%) |
| Total | 0 (0.0%) | 7 (11.1%) |
Race in Norwood
The most populous races in Norwood are White / Caucasian (389 | 79.5%), Two or more Races (90 | 18.4%), and Black / African American (8 | 1.6%).
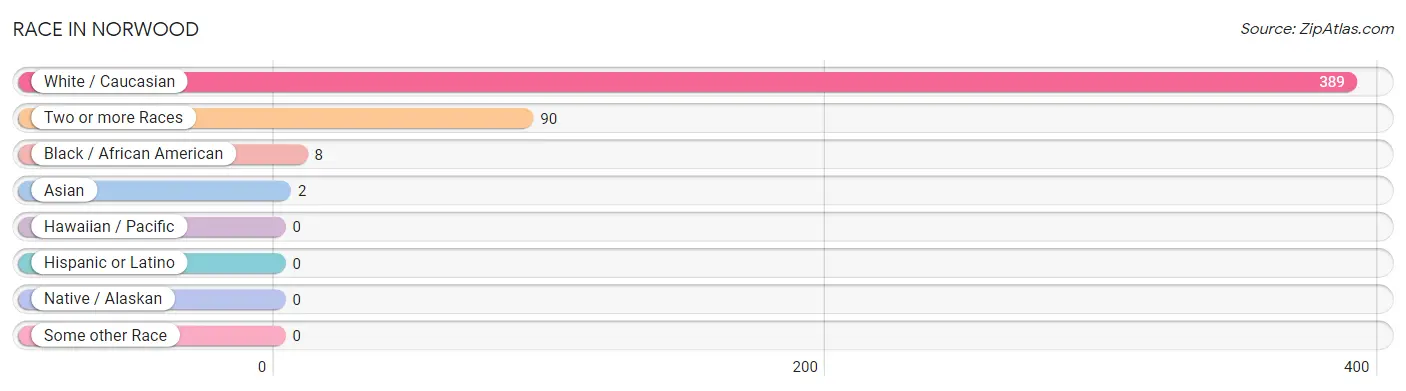
| Race | # Population | % Population |
| Asian | 2 | 0.4% |
| Black / African American | 8 | 1.6% |
| Hawaiian / Pacific | 0 | 0.0% |
| Hispanic or Latino | 0 | 0.0% |
| Native / Alaskan | 0 | 0.0% |
| White / Caucasian | 389 | 79.5% |
| Two or more Races | 90 | 18.4% |
| Some other Race | 0 | 0.0% |
| Total | 489 | 100.0% |
Ancestry in Norwood
The most populous ancestries reported in Norwood are German (91 | 18.6%), English (85 | 17.4%), Irish (49 | 10.0%), American (35 | 7.2%), and Italian (34 | 7.0%), together accounting for 60.1% of all Norwood residents.
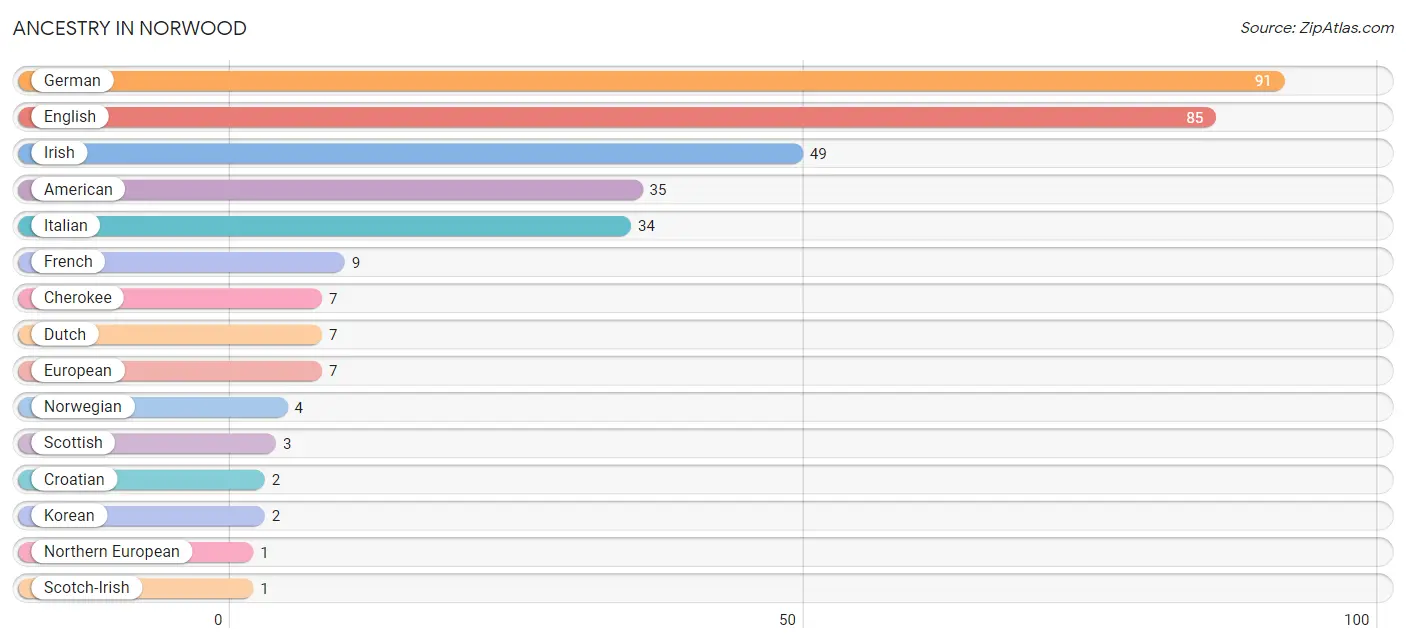
| Ancestry | # Population | % Population |
| American | 35 | 7.2% |
| Cherokee | 7 | 1.4% |
| Croatian | 2 | 0.4% |
| Dutch | 7 | 1.4% |
| English | 85 | 17.4% |
| European | 7 | 1.4% |
| French | 9 | 1.8% |
| German | 91 | 18.6% |
| Irish | 49 | 10.0% |
| Italian | 34 | 7.0% |
| Korean | 2 | 0.4% |
| Northern European | 1 | 0.2% |
| Norwegian | 4 | 0.8% |
| Scotch-Irish | 1 | 0.2% |
| Scottish | 3 | 0.6% | View All 15 Rows |
Immigrants in Norwood
The most numerous immigrant groups reported in Norwood came from Asia (2 | 0.4%), Philippines (2 | 0.4%), and South Eastern Asia (2 | 0.4%), together accounting for 1.2% of all Norwood residents.
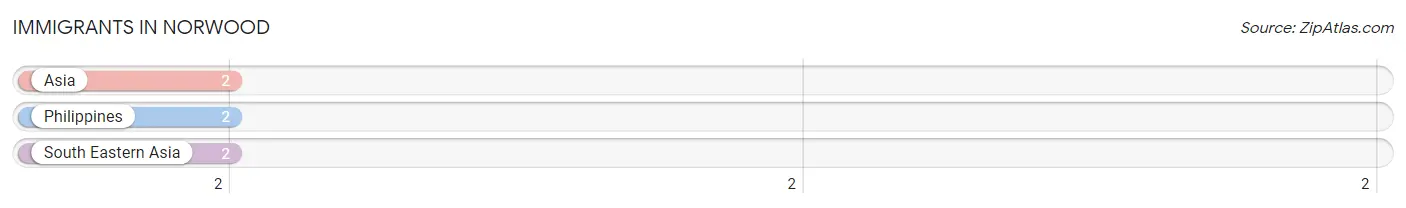
| Immigration Origin | # Population | % Population |
| Asia | 2 | 0.4% |
| Philippines | 2 | 0.4% |
| South Eastern Asia | 2 | 0.4% | View All 3 Rows |
Sex and Age in Norwood
Sex and Age in Norwood
The most populous age groups in Norwood are 55 to 59 Years (53 | 20.8%) for men and 10 to 14 Years (37 | 15.8%) for women.
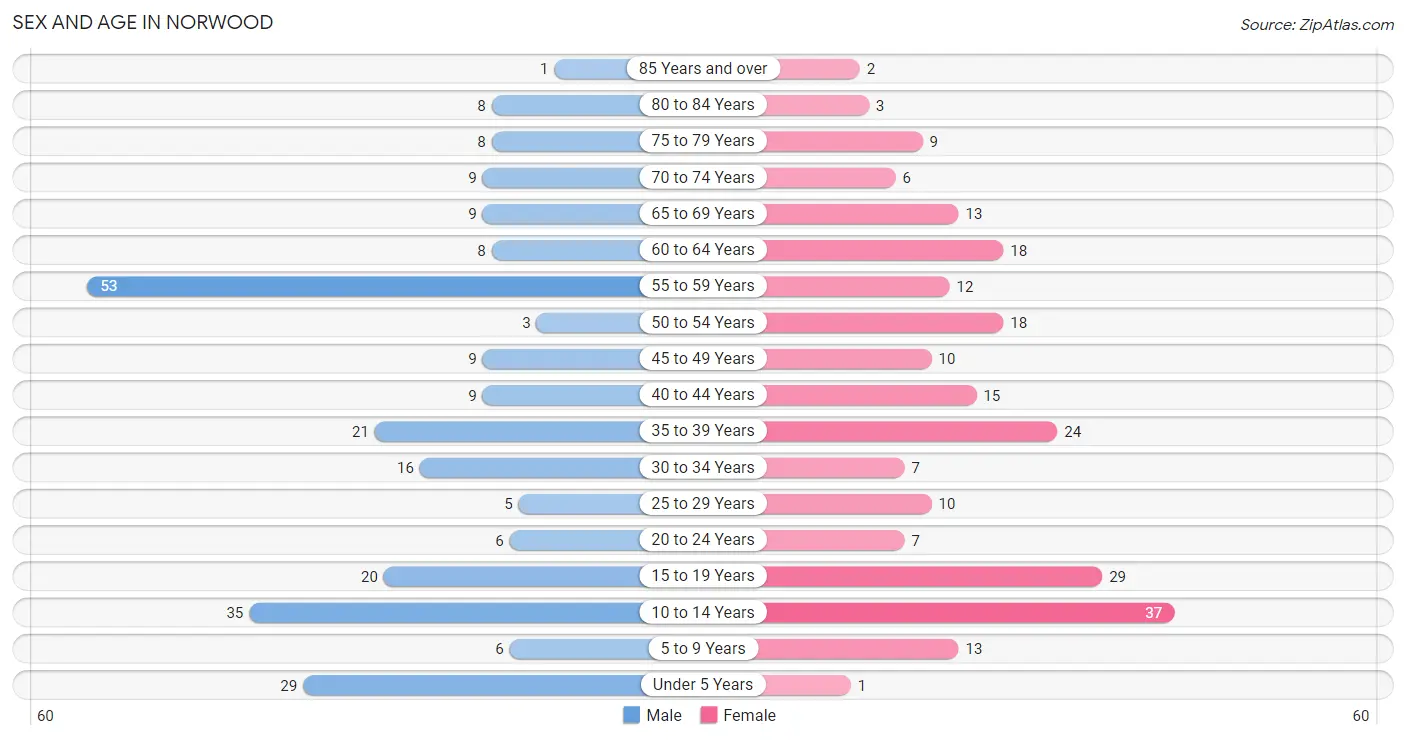
| Age Bracket | Male | Female |
| Under 5 Years | 29 (11.4%) | 1 (0.4%) |
| 5 to 9 Years | 6 (2.4%) | 13 (5.6%) |
| 10 to 14 Years | 35 (13.7%) | 37 (15.8%) |
| 15 to 19 Years | 20 (7.8%) | 29 (12.4%) |
| 20 to 24 Years | 6 (2.4%) | 7 (3.0%) |
| 25 to 29 Years | 5 (2.0%) | 10 (4.3%) |
| 30 to 34 Years | 16 (6.3%) | 7 (3.0%) |
| 35 to 39 Years | 21 (8.2%) | 24 (10.3%) |
| 40 to 44 Years | 9 (3.5%) | 15 (6.4%) |
| 45 to 49 Years | 9 (3.5%) | 10 (4.3%) |
| 50 to 54 Years | 3 (1.2%) | 18 (7.7%) |
| 55 to 59 Years | 53 (20.8%) | 12 (5.1%) |
| 60 to 64 Years | 8 (3.1%) | 18 (7.7%) |
| 65 to 69 Years | 9 (3.5%) | 13 (5.6%) |
| 70 to 74 Years | 9 (3.5%) | 6 (2.6%) |
| 75 to 79 Years | 8 (3.1%) | 9 (3.8%) |
| 80 to 84 Years | 8 (3.1%) | 3 (1.3%) |
| 85 Years and over | 1 (0.4%) | 2 (0.9%) |
| Total | 255 (100.0%) | 234 (100.0%) |
Families and Households in Norwood
Median Family Size in Norwood
The median family size in Norwood is 2.87 persons per family, with single female/mother families (18 | 12.2%) accounting for the largest median family size of 3.67 persons per family. On the other hand, single male/father families (45 | 30.4%) represent the smallest median family size with 1.47 persons per family.
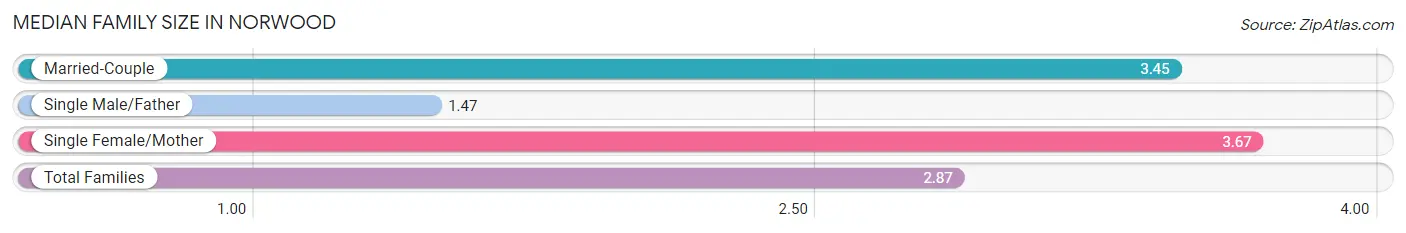
| Family Type | # Families | Family Size |
| Married-Couple | 85 (57.4%) | 3.45 |
| Single Male/Father | 45 (30.4%) | 1.47 |
| Single Female/Mother | 18 (12.2%) | 3.67 |
| Total Families | 148 (100.0%) | 2.87 |
Median Household Size in Norwood
The median household size in Norwood is 2.60 persons per household, with single female/mother households (18 | 9.6%) accounting for the largest median household size of 4.22 persons per household. non-family households (40 | 21.3%) represent the smallest median household size with 1.13 persons per household.
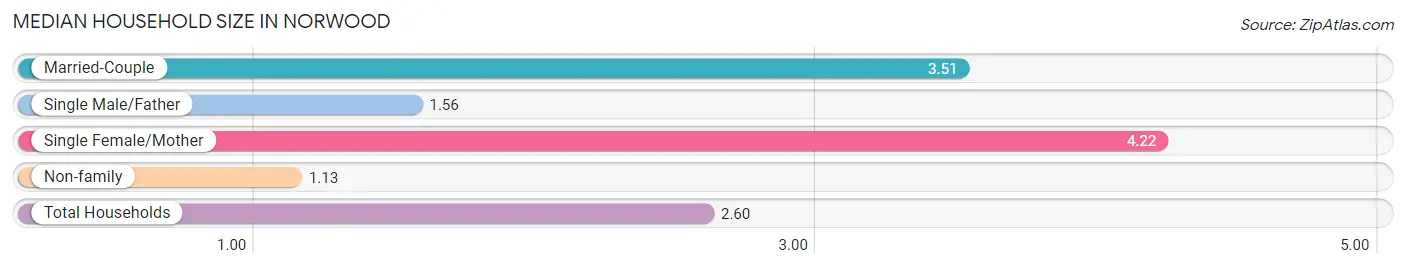
| Household Type | # Households | Household Size |
| Married-Couple | 85 (45.2%) | 3.51 |
| Single Male/Father | 45 (23.9%) | 1.56 |
| Single Female/Mother | 18 (9.6%) | 4.22 |
| Non-family | 40 (21.3%) | 1.13 |
| Total Households | 188 (100.0%) | 2.60 |
Household Size by Marriage Status in Norwood
Out of a total of 188 households in Norwood, 148 (78.7%) are family households, while 40 (21.3%) are nonfamily households. The most numerous type of family households are 2-person households, comprising 78, and the most common type of nonfamily households are 1-person households, comprising 35.
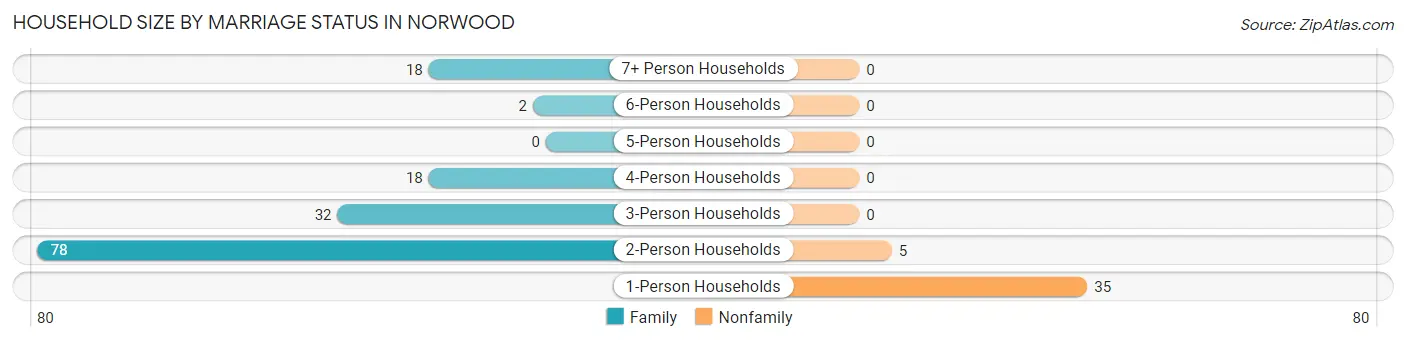
| Household Size | Family Households | Nonfamily Households |
| 1-Person Households | - | 35 (18.6%) |
| 2-Person Households | 78 (41.5%) | 5 (2.7%) |
| 3-Person Households | 32 (17.0%) | 0 (0.0%) |
| 4-Person Households | 18 (9.6%) | 0 (0.0%) |
| 5-Person Households | 0 (0.0%) | 0 (0.0%) |
| 6-Person Households | 2 (1.1%) | 0 (0.0%) |
| 7+ Person Households | 18 (9.6%) | 0 (0.0%) |
| Total | 148 (78.7%) | 40 (21.3%) |
Female Fertility in Norwood
Fertility by Age in Norwood
Average fertility rate in Norwood is 20.0 births per 1,000 women. Women in the age bracket of 20 to 34 years have the highest fertility rate with 83.0 births per 1,000 women. Women in the age bracket of 20 to 34 years acount for 100.0% of all women with births.
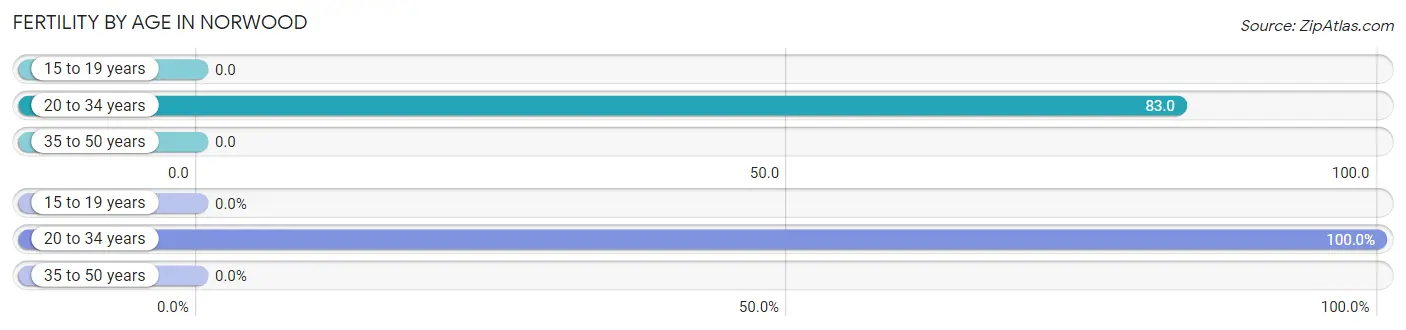
| Age Bracket | Women with Births | Births / 1,000 Women |
| 15 to 19 years | 0 (0.0%) | 0.0 |
| 20 to 34 years | 2 (100.0%) | 83.0 |
| 35 to 50 years | 0 (0.0%) | 0.0 |
| Total | 2 (100.0%) | 20.0 |
Fertility by Age by Marriage Status in Norwood
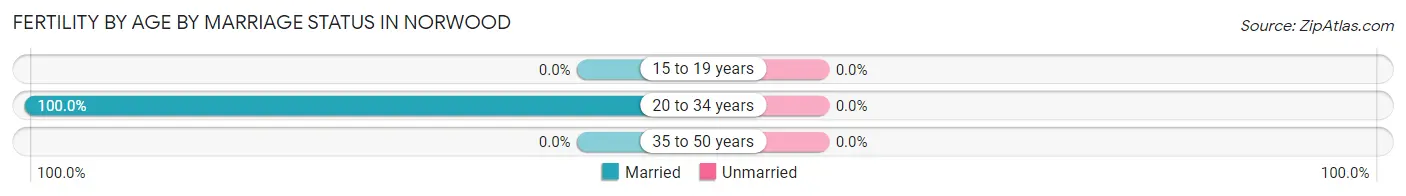
| Age Bracket | Married | Unmarried |
| 15 to 19 years | 0 (0.0%) | 0 (0.0%) |
| 20 to 34 years | 2 (100.0%) | 0 (0.0%) |
| 35 to 50 years | 0 (0.0%) | 0 (0.0%) |
| Total | 2 (100.0%) | 0 (0.0%) |
Fertility by Education in Norwood
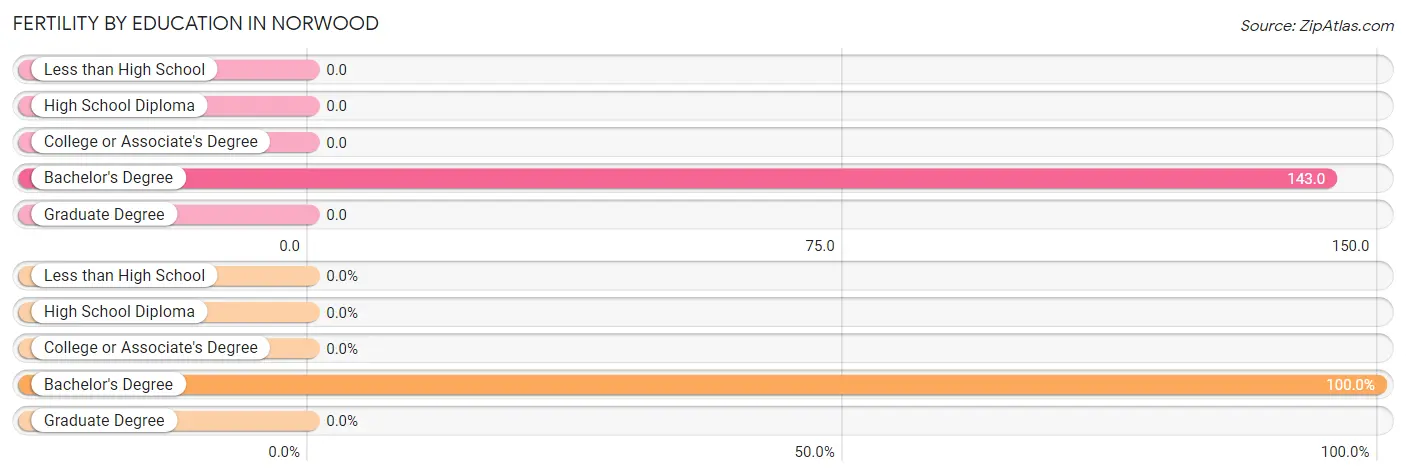
| Educational Attainment | Women with Births | Births / 1,000 Women |
| Less than High School | 0 (0.0%) | 0.0 |
| High School Diploma | 0 (0.0%) | 0.0 |
| College or Associate's Degree | 0 (0.0%) | 0.0 |
| Bachelor's Degree | 2 (100.0%) | 143.0 |
| Graduate Degree | 0 (0.0%) | 0.0 |
| Total | 2 (100.0%) | 20.0 |
Fertility by Education by Marriage Status in Norwood
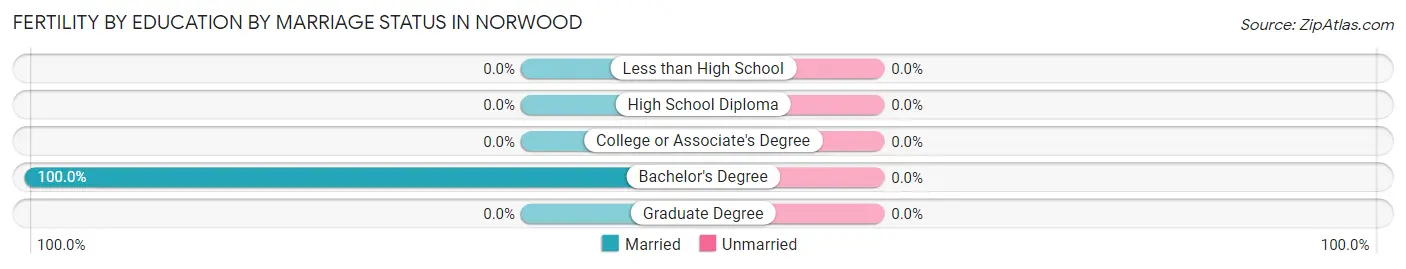
| Educational Attainment | Married | Unmarried |
| Less than High School | 0 (0.0%) | 0 (0.0%) |
| High School Diploma | 0 (0.0%) | 0 (0.0%) |
| College or Associate's Degree | 0 (0.0%) | 0 (0.0%) |
| Bachelor's Degree | 2 (100.0%) | 0 (0.0%) |
| Graduate Degree | 0 (0.0%) | 0 (0.0%) |
| Total | 2 (100.0%) | 0 (0.0%) |
Employment Characteristics in Norwood
Employment by Class of Employer in Norwood
Among the 235 employed individuals in Norwood, private company employees (174 | 74.0%), not-for-profit organizations (26 | 11.1%), and local government employees (17 | 7.2%) make up the most common classes of employment.
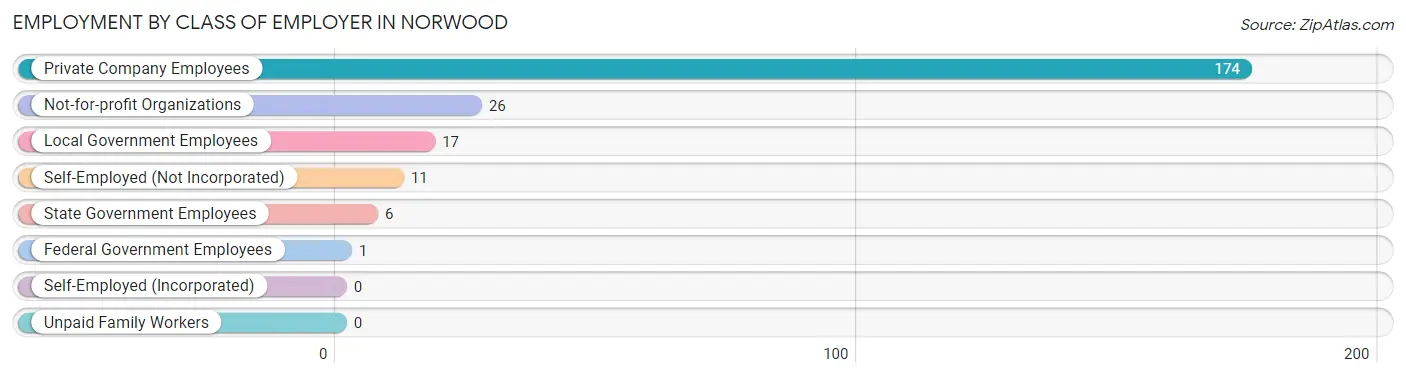
| Employer Class | # Employees | % Employees |
| Private Company Employees | 174 | 74.0% |
| Self-Employed (Incorporated) | 0 | 0.0% |
| Self-Employed (Not Incorporated) | 11 | 4.7% |
| Not-for-profit Organizations | 26 | 11.1% |
| Local Government Employees | 17 | 7.2% |
| State Government Employees | 6 | 2.5% |
| Federal Government Employees | 1 | 0.4% |
| Unpaid Family Workers | 0 | 0.0% |
| Total | 235 | 100.0% |
Employment Status by Age in Norwood
According to the labor force statistics for Norwood, out of the total population over 16 years of age (353), 69.4% or 245 individuals are in the labor force, with 2.9% or 7 of them unemployed. The age group with the highest labor force participation rate is 55 to 59 years, with 93.8% or 61 individuals in the labor force. Within the labor force, the 16 to 19 years age range has the highest percentage of unemployed individuals, with 14.8% or 4 of them being unemployed.
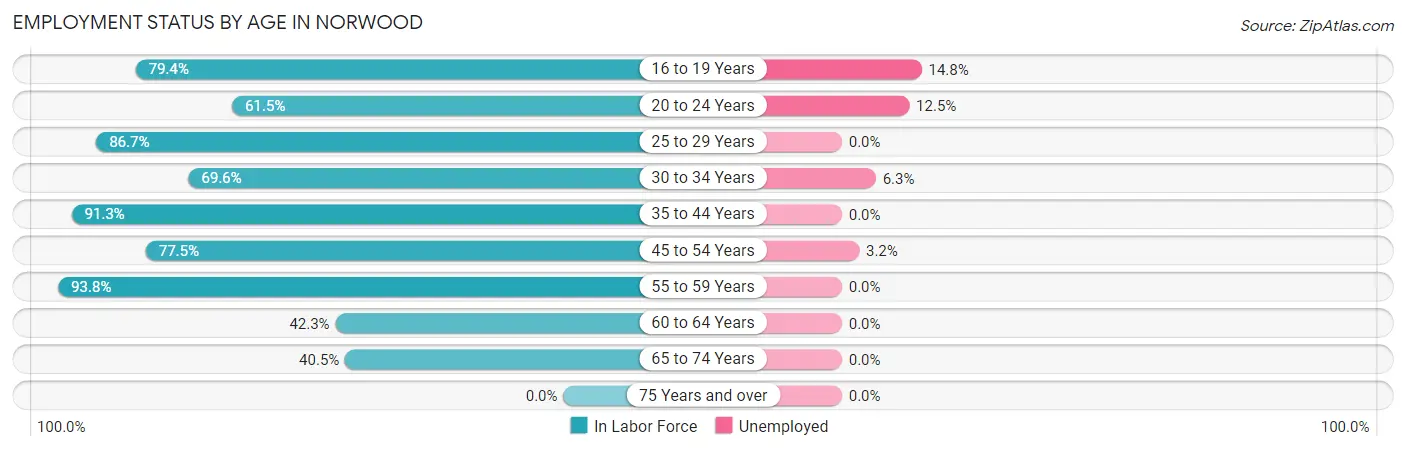
| Age Bracket | In Labor Force | Unemployed |
| 16 to 19 Years | 27 (79.4%) | 4 (14.8%) |
| 20 to 24 Years | 8 (61.5%) | 1 (12.5%) |
| 25 to 29 Years | 13 (86.7%) | 0 (0.0%) |
| 30 to 34 Years | 16 (69.6%) | 1 (6.3%) |
| 35 to 44 Years | 63 (91.3%) | 0 (0.0%) |
| 45 to 54 Years | 31 (77.5%) | 1 (3.2%) |
| 55 to 59 Years | 61 (93.8%) | 0 (0.0%) |
| 60 to 64 Years | 11 (42.3%) | 0 (0.0%) |
| 65 to 74 Years | 15 (40.5%) | 0 (0.0%) |
| 75 Years and over | 0 (0.0%) | 0 (0.0%) |
| Total | 245 (69.4%) | 7 (2.9%) |
Employment Status by Educational Attainment in Norwood
According to labor force statistics for Norwood, 81.9% of individuals (195) out of the total population between 25 and 64 years of age (238) are in the labor force, with 1.0% or 2 of them being unemployed. The group with the highest labor force participation rate are those with the educational attainment of college / associate degree, with 88.6% or 101 individuals in the labor force. Within the labor force, individuals with less than high school education have the highest percentage of unemployment, with 14.3% or 1 of them being unemployed.
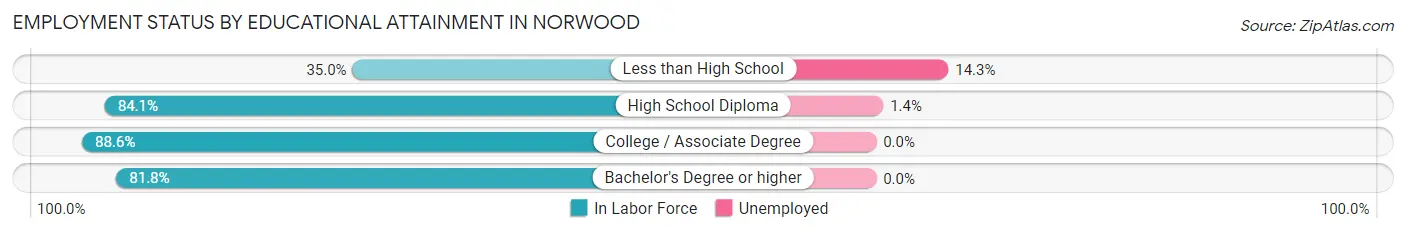
| Educational Attainment | In Labor Force | Unemployed |
| Less than High School | 7 (35.0%) | 3 (14.3%) |
| High School Diploma | 69 (84.1%) | 1 (1.4%) |
| College / Associate Degree | 101 (88.6%) | 0 (0.0%) |
| Bachelor's Degree or higher | 18 (81.8%) | 0 (0.0%) |
| Total | 195 (81.9%) | 2 (1.0%) |
Employment Occupations by Sex in Norwood
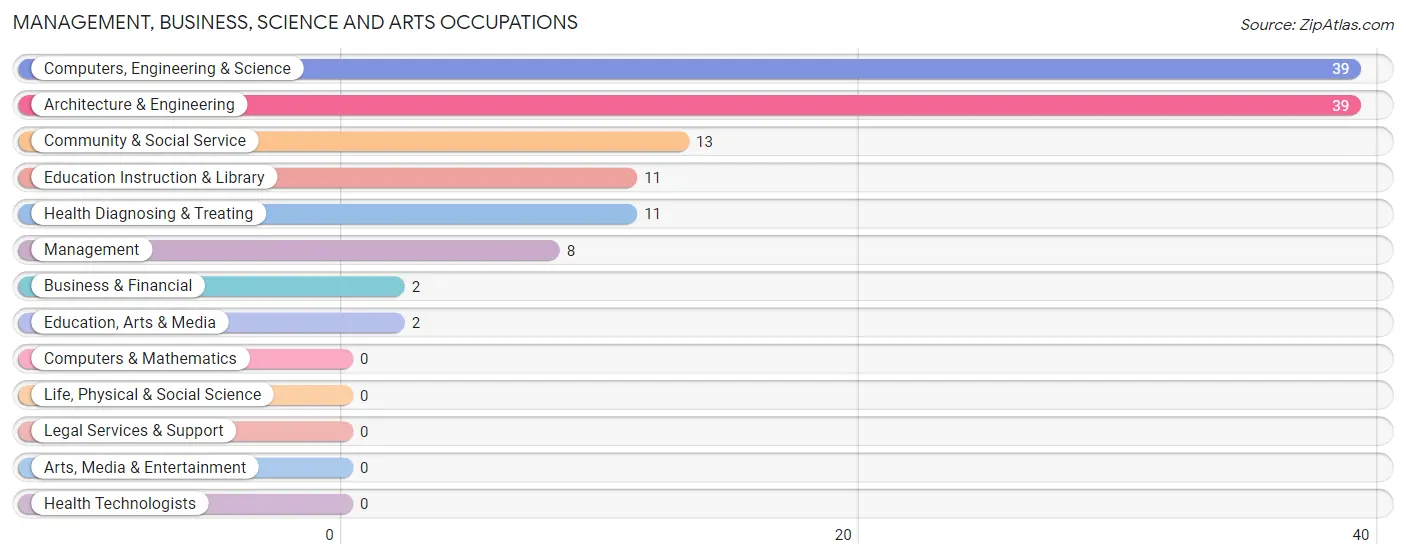
Management, Business, Science and Arts Occupations
The most common Management, Business, Science and Arts occupations in Norwood are Computers, Engineering & Science (39 | 16.4%), Architecture & Engineering (39 | 16.4%), Community & Social Service (13 | 5.5%), Education Instruction & Library (11 | 4.6%), and Health Diagnosing & Treating (11 | 4.6%).
Management, Business, Science and Arts Occupations by Sex
Within the Management, Business, Science and Arts occupations in Norwood, the most male-oriented occupations are Computers, Engineering & Science (100.0%), Architecture & Engineering (100.0%), and Management (75.0%), while the most female-oriented occupations are Business & Financial (100.0%), Education, Arts & Media (100.0%), and Community & Social Service (84.6%).
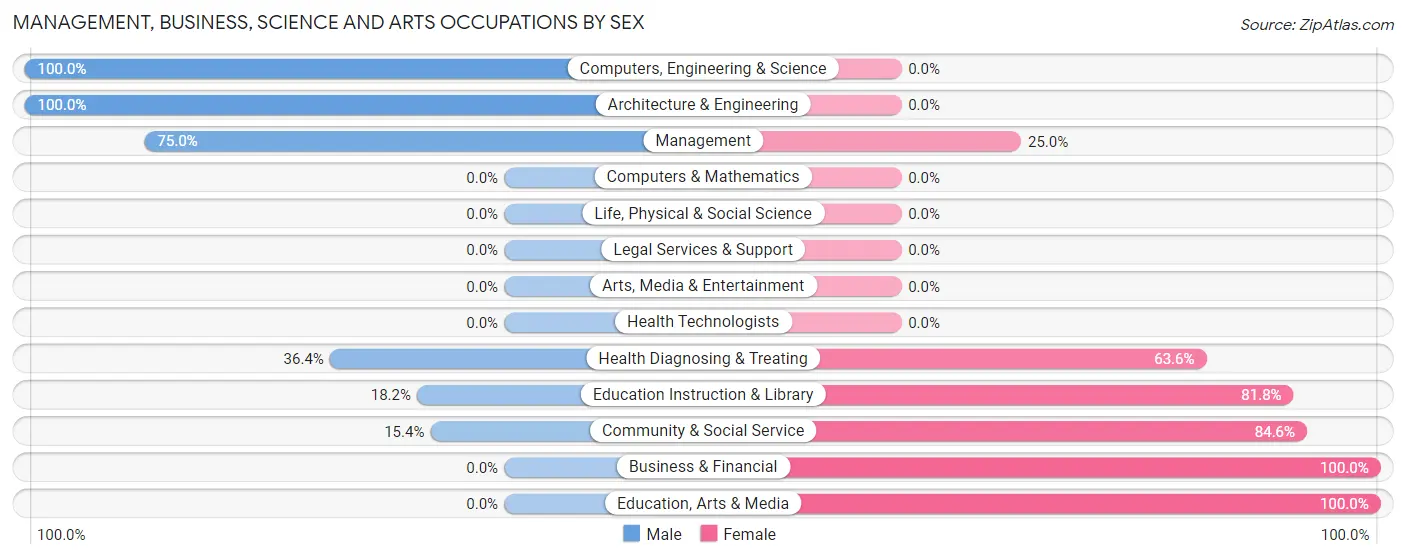
| Occupation | Male | Female |
| Management | 6 (75.0%) | 2 (25.0%) |
| Business & Financial | 0 (0.0%) | 2 (100.0%) |
| Computers, Engineering & Science | 39 (100.0%) | 0 (0.0%) |
| Computers & Mathematics | 0 (0.0%) | 0 (0.0%) |
| Architecture & Engineering | 39 (100.0%) | 0 (0.0%) |
| Life, Physical & Social Science | 0 (0.0%) | 0 (0.0%) |
| Community & Social Service | 2 (15.4%) | 11 (84.6%) |
| Education, Arts & Media | 0 (0.0%) | 2 (100.0%) |
| Legal Services & Support | 0 (0.0%) | 0 (0.0%) |
| Education Instruction & Library | 2 (18.2%) | 9 (81.8%) |
| Arts, Media & Entertainment | 0 (0.0%) | 0 (0.0%) |
| Health Diagnosing & Treating | 4 (36.4%) | 7 (63.6%) |
| Health Technologists | 0 (0.0%) | 0 (0.0%) |
| Total (Category) | 51 (69.9%) | 22 (30.1%) |
| Total (Overall) | 123 (51.7%) | 115 (48.3%) |
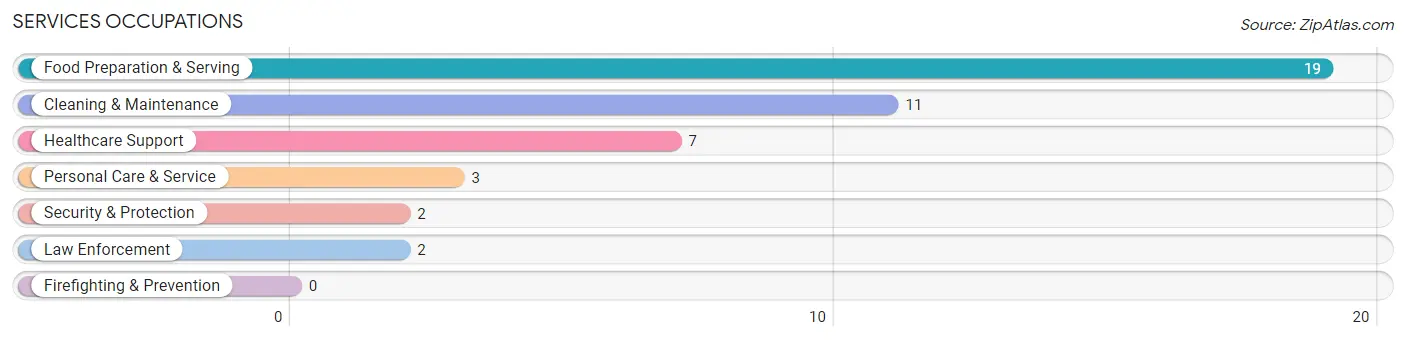
Services Occupations
The most common Services occupations in Norwood are Food Preparation & Serving (19 | 8.0%), Cleaning & Maintenance (11 | 4.6%), Healthcare Support (7 | 2.9%), Personal Care & Service (3 | 1.3%), and Security & Protection (2 | 0.8%).
Services Occupations by Sex
Within the Services occupations in Norwood, the most male-oriented occupations are Security & Protection (100.0%), Law Enforcement (100.0%), and Cleaning & Maintenance (63.6%), while the most female-oriented occupations are Healthcare Support (100.0%), Personal Care & Service (100.0%), and Food Preparation & Serving (84.2%).
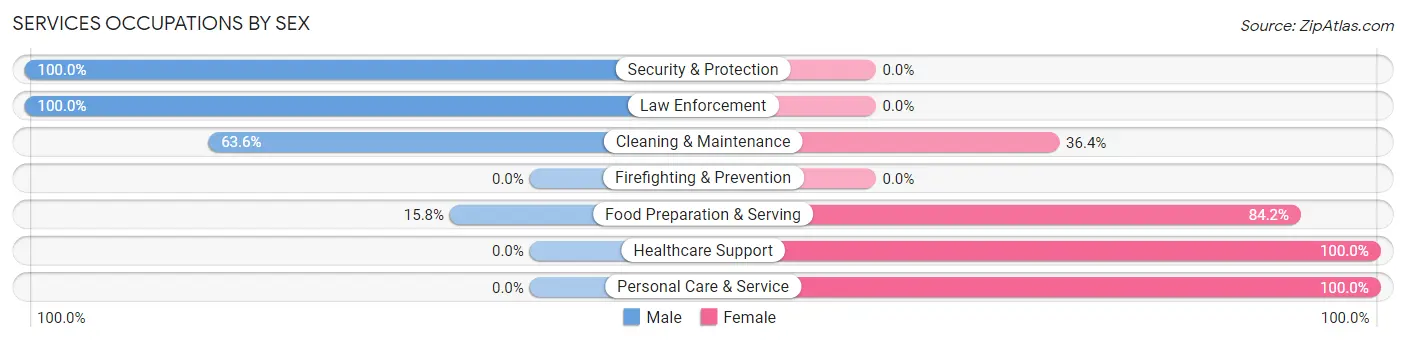
| Occupation | Male | Female |
| Healthcare Support | 0 (0.0%) | 7 (100.0%) |
| Security & Protection | 2 (100.0%) | 0 (0.0%) |
| Firefighting & Prevention | 0 (0.0%) | 0 (0.0%) |
| Law Enforcement | 2 (100.0%) | 0 (0.0%) |
| Food Preparation & Serving | 3 (15.8%) | 16 (84.2%) |
| Cleaning & Maintenance | 7 (63.6%) | 4 (36.4%) |
| Personal Care & Service | 0 (0.0%) | 3 (100.0%) |
| Total (Category) | 12 (28.6%) | 30 (71.4%) |
| Total (Overall) | 123 (51.7%) | 115 (48.3%) |
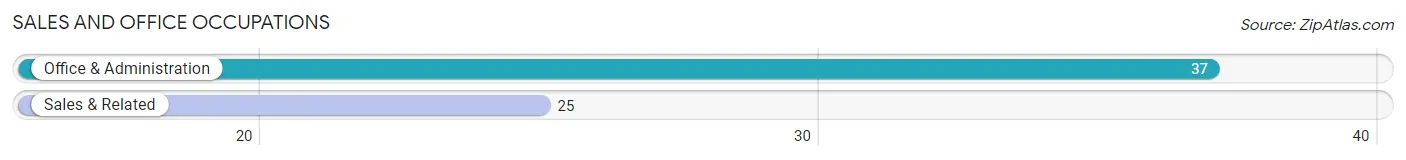
Sales and Office Occupations
The most common Sales and Office occupations in Norwood are Office & Administration (37 | 15.5%), and Sales & Related (25 | 10.5%).
Sales and Office Occupations by Sex
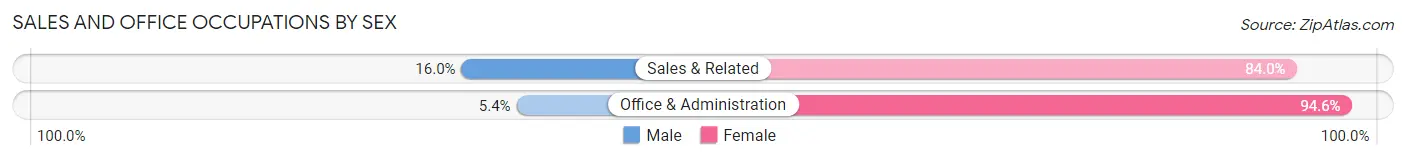
| Occupation | Male | Female |
| Sales & Related | 4 (16.0%) | 21 (84.0%) |
| Office & Administration | 2 (5.4%) | 35 (94.6%) |
| Total (Category) | 6 (9.7%) | 56 (90.3%) |
| Total (Overall) | 123 (51.7%) | 115 (48.3%) |
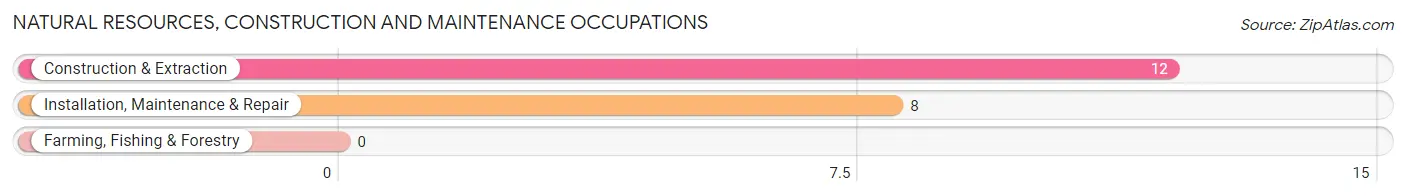
Natural Resources, Construction and Maintenance Occupations
The most common Natural Resources, Construction and Maintenance occupations in Norwood are Construction & Extraction (12 | 5.0%), and Installation, Maintenance & Repair (8 | 3.4%).
Natural Resources, Construction and Maintenance Occupations by Sex
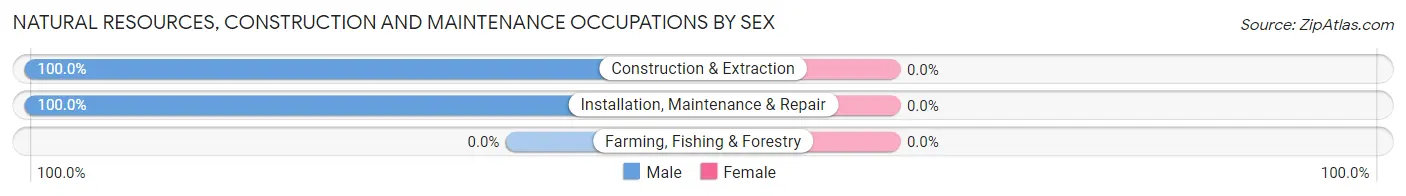
| Occupation | Male | Female |
| Farming, Fishing & Forestry | 0 (0.0%) | 0 (0.0%) |
| Construction & Extraction | 12 (100.0%) | 0 (0.0%) |
| Installation, Maintenance & Repair | 8 (100.0%) | 0 (0.0%) |
| Total (Category) | 20 (100.0%) | 0 (0.0%) |
| Total (Overall) | 123 (51.7%) | 115 (48.3%) |
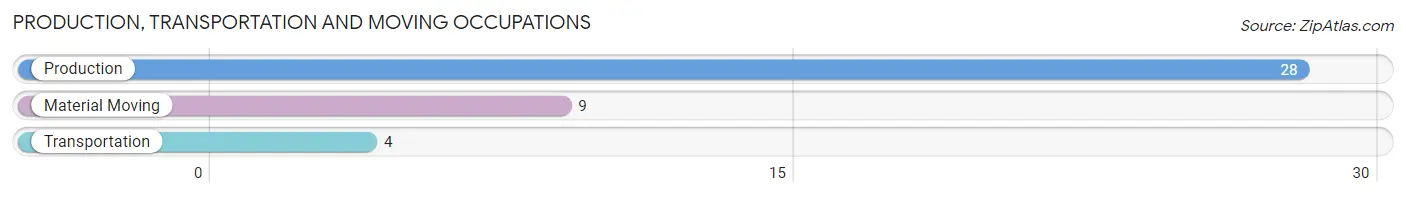
Production, Transportation and Moving Occupations
The most common Production, Transportation and Moving occupations in Norwood are Production (28 | 11.8%), Material Moving (9 | 3.8%), and Transportation (4 | 1.7%).
Production, Transportation and Moving Occupations by Sex
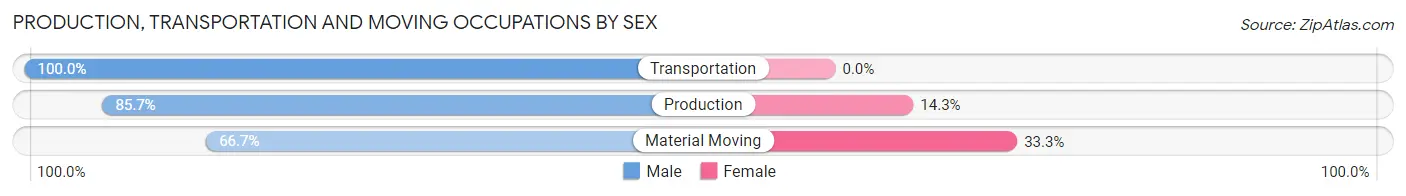
| Occupation | Male | Female |
| Production | 24 (85.7%) | 4 (14.3%) |
| Transportation | 4 (100.0%) | 0 (0.0%) |
| Material Moving | 6 (66.7%) | 3 (33.3%) |
| Total (Category) | 34 (82.9%) | 7 (17.1%) |
| Total (Overall) | 123 (51.7%) | 115 (48.3%) |
Employment Industries by Sex in Norwood
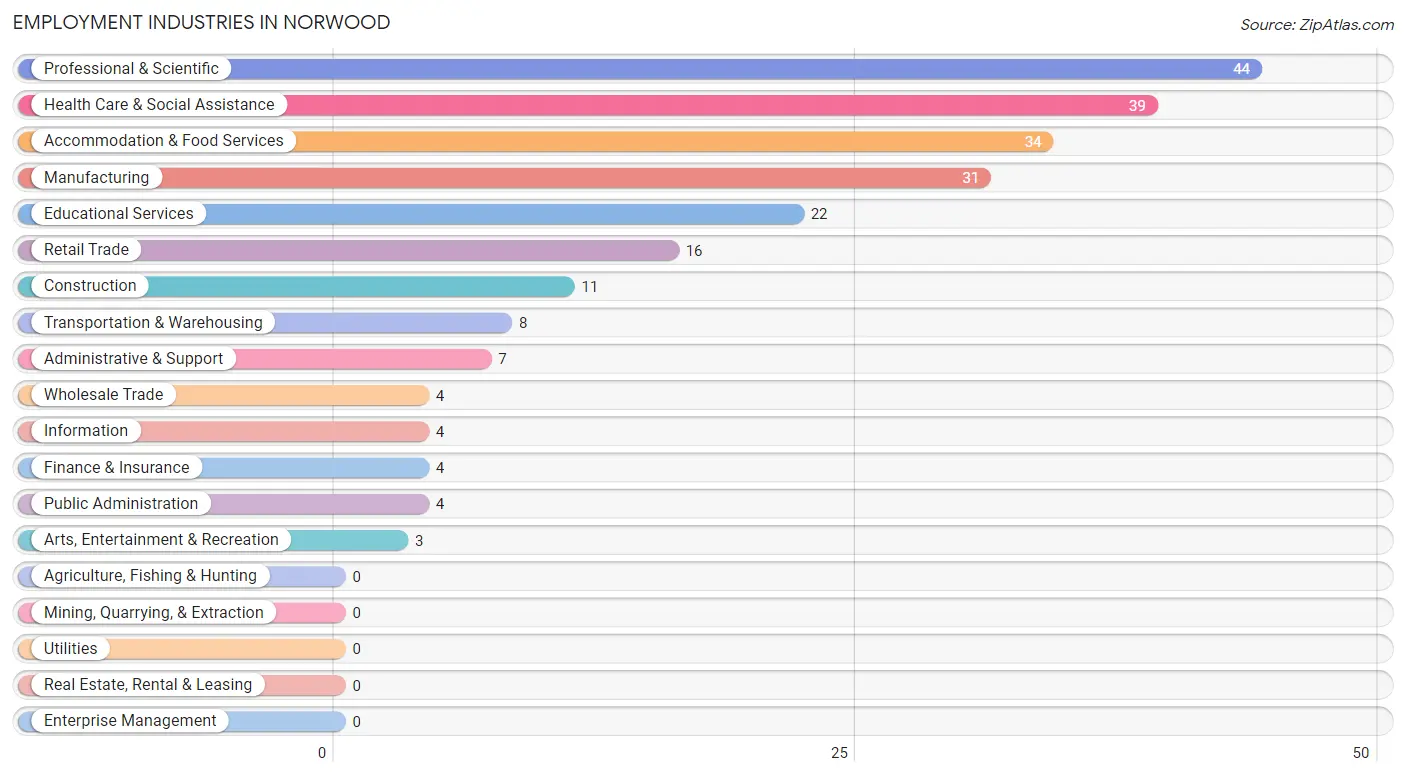
Employment Industries in Norwood
The major employment industries in Norwood include Professional & Scientific (44 | 18.5%), Health Care & Social Assistance (39 | 16.4%), Accommodation & Food Services (34 | 14.3%), Manufacturing (31 | 13.0%), and Educational Services (22 | 9.2%).
Employment Industries by Sex in Norwood
The Norwood industries that see more men than women are Construction (100.0%), Professional & Scientific (93.2%), and Transportation & Warehousing (87.5%), whereas the industries that tend to have a higher number of women are Wholesale Trade (100.0%), Accommodation & Food Services (91.2%), and Health Care & Social Assistance (82.1%).
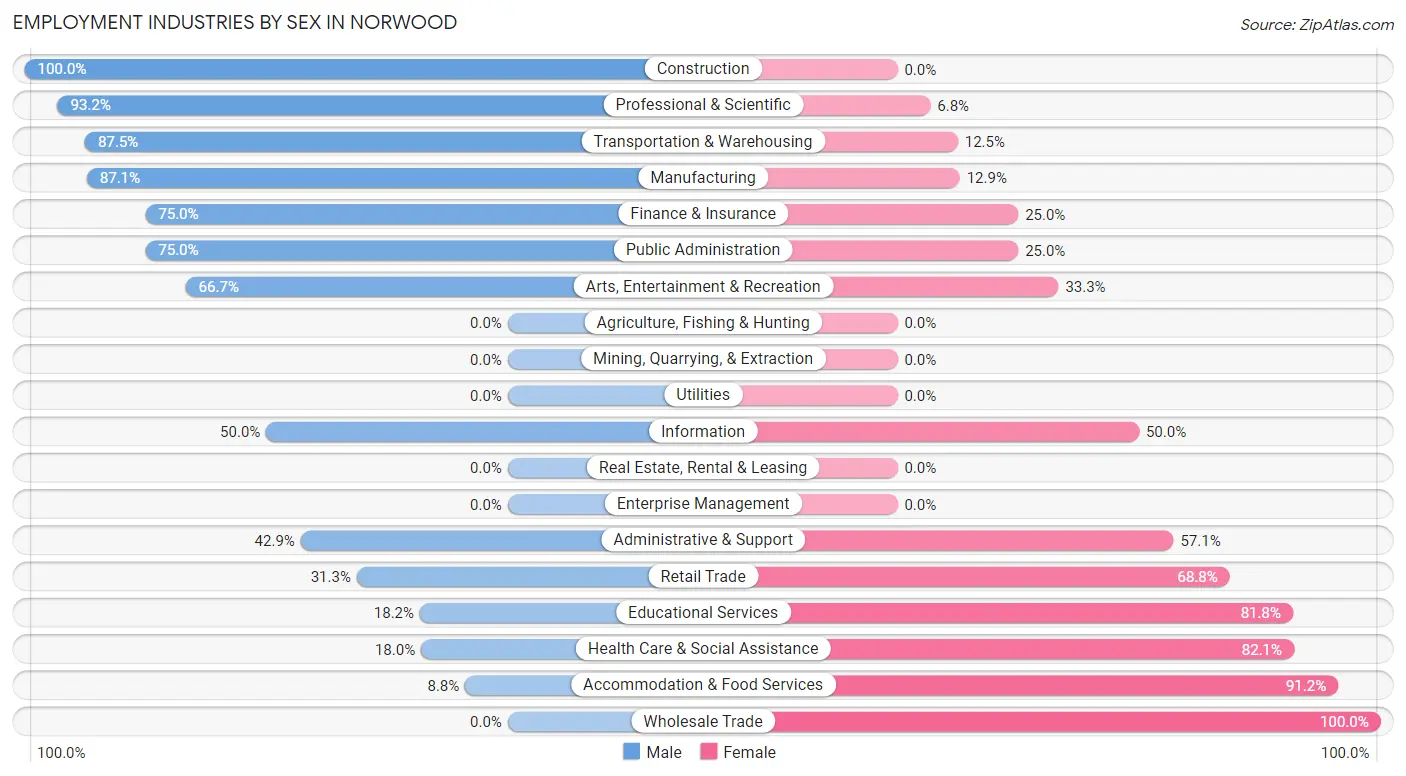
| Industry | Male | Female |
| Agriculture, Fishing & Hunting | 0 (0.0%) | 0 (0.0%) |
| Mining, Quarrying, & Extraction | 0 (0.0%) | 0 (0.0%) |
| Construction | 11 (100.0%) | 0 (0.0%) |
| Manufacturing | 27 (87.1%) | 4 (12.9%) |
| Wholesale Trade | 0 (0.0%) | 4 (100.0%) |
| Retail Trade | 5 (31.2%) | 11 (68.8%) |
| Transportation & Warehousing | 7 (87.5%) | 1 (12.5%) |
| Utilities | 0 (0.0%) | 0 (0.0%) |
| Information | 2 (50.0%) | 2 (50.0%) |
| Finance & Insurance | 3 (75.0%) | 1 (25.0%) |
| Real Estate, Rental & Leasing | 0 (0.0%) | 0 (0.0%) |
| Professional & Scientific | 41 (93.2%) | 3 (6.8%) |
| Enterprise Management | 0 (0.0%) | 0 (0.0%) |
| Administrative & Support | 3 (42.9%) | 4 (57.1%) |
| Educational Services | 4 (18.2%) | 18 (81.8%) |
| Health Care & Social Assistance | 7 (17.9%) | 32 (82.1%) |
| Arts, Entertainment & Recreation | 2 (66.7%) | 1 (33.3%) |
| Accommodation & Food Services | 3 (8.8%) | 31 (91.2%) |
| Public Administration | 3 (75.0%) | 1 (25.0%) |
| Total | 123 (51.7%) | 115 (48.3%) |
Education in Norwood
School Enrollment in Norwood
The most common levels of schooling among the 118 students in Norwood are middle school (64 | 54.2%), high school (31 | 26.3%), and elementary school (13 | 11.0%).
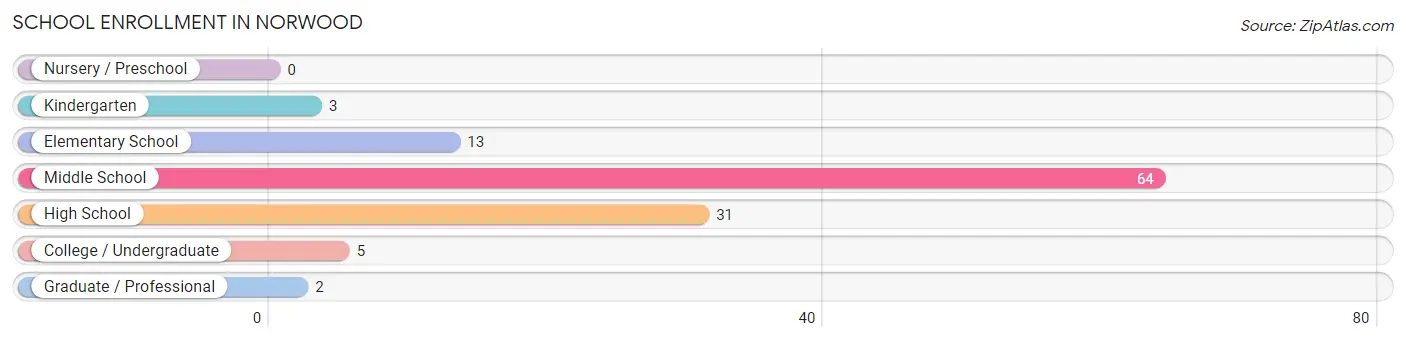
| School Level | # Students | % Students |
| Nursery / Preschool | 0 | 0.0% |
| Kindergarten | 3 | 2.5% |
| Elementary School | 13 | 11.0% |
| Middle School | 64 | 54.2% |
| High School | 31 | 26.3% |
| College / Undergraduate | 5 | 4.2% |
| Graduate / Professional | 2 | 1.7% |
| Total | 118 | 100.0% |
School Enrollment by Age by Funding Source in Norwood
Out of a total of 118 students who are enrolled in schools in Norwood, 34 (28.8%) attend a private institution, while the remaining 84 (71.2%) are enrolled in public schools. The age group of 20 to 24 year olds has the highest likelihood of being enrolled in private schools, with 2 (50.0% in the age bracket) enrolled. Conversely, the age group of 18 to 19 year olds has the lowest likelihood of being enrolled in a private school, with 4 (100.0% in the age bracket) attending a public institution.
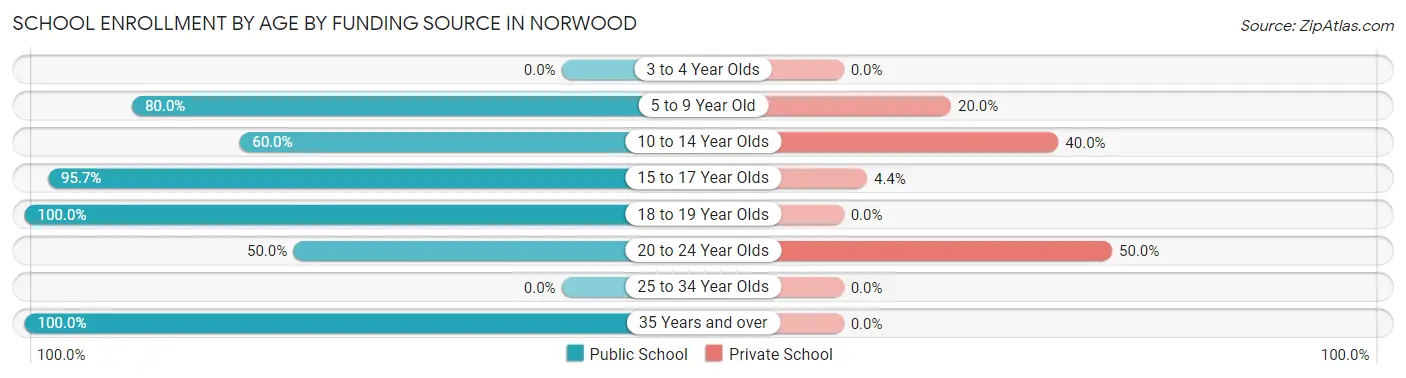
| Age Bracket | Public School | Private School |
| 3 to 4 Year Olds | 0 (0.0%) | 0 (0.0%) |
| 5 to 9 Year Old | 12 (80.0%) | 3 (20.0%) |
| 10 to 14 Year Olds | 42 (60.0%) | 28 (40.0%) |
| 15 to 17 Year Olds | 22 (95.7%) | 1 (4.3%) |
| 18 to 19 Year Olds | 4 (100.0%) | 0 (0.0%) |
| 20 to 24 Year Olds | 2 (50.0%) | 2 (50.0%) |
| 25 to 34 Year Olds | 0 (0.0%) | 0 (0.0%) |
| 35 Years and over | 2 (100.0%) | 0 (0.0%) |
| Total | 84 (71.2%) | 34 (28.8%) |
Educational Attainment by Field of Study in Norwood
Education (12 | 44.4%), visual & performing arts (5 | 18.5%), science & technology (3 | 11.1%), computers & mathematics (2 | 7.4%), and business (2 | 7.4%) are the most common fields of study among 27 individuals in Norwood who have obtained a bachelor's degree or higher.
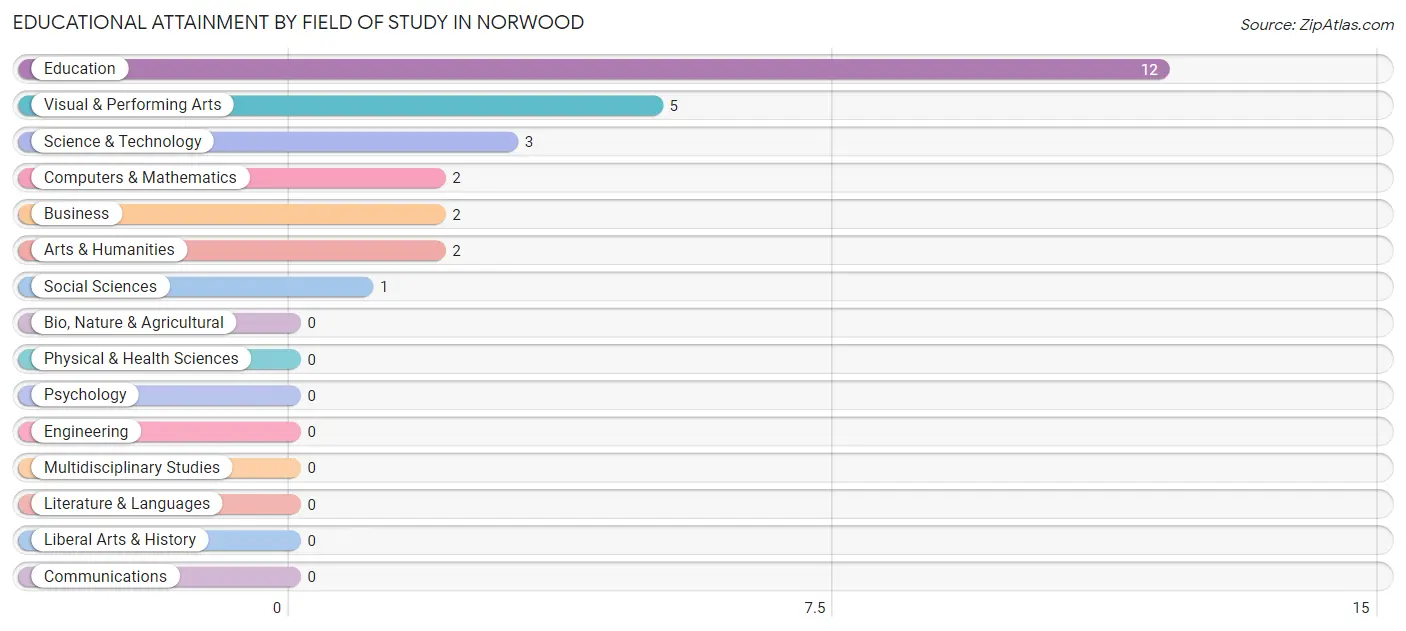
| Field of Study | # Graduates | % Graduates |
| Computers & Mathematics | 2 | 7.4% |
| Bio, Nature & Agricultural | 0 | 0.0% |
| Physical & Health Sciences | 0 | 0.0% |
| Psychology | 0 | 0.0% |
| Social Sciences | 1 | 3.7% |
| Engineering | 0 | 0.0% |
| Multidisciplinary Studies | 0 | 0.0% |
| Science & Technology | 3 | 11.1% |
| Business | 2 | 7.4% |
| Education | 12 | 44.4% |
| Literature & Languages | 0 | 0.0% |
| Liberal Arts & History | 0 | 0.0% |
| Visual & Performing Arts | 5 | 18.5% |
| Communications | 0 | 0.0% |
| Arts & Humanities | 2 | 7.4% |
| Total | 27 | 100.0% |
Transportation & Commute in Norwood
Vehicle Availability by Sex in Norwood
The most prevalent vehicle ownership categories in Norwood are males with 2 vehicles (78, accounting for 63.9%) and females with 2 vehicles (51, making up 69.0%).
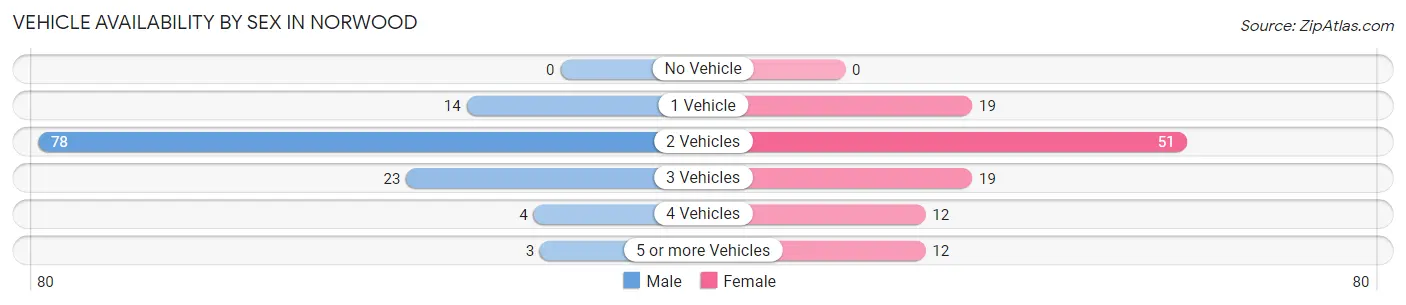
| Vehicles Available | Male | Female |
| No Vehicle | 0 (0.0%) | 0 (0.0%) |
| 1 Vehicle | 14 (11.5%) | 19 (16.8%) |
| 2 Vehicles | 78 (63.9%) | 51 (45.1%) |
| 3 Vehicles | 23 (18.9%) | 19 (16.8%) |
| 4 Vehicles | 4 (3.3%) | 12 (10.6%) |
| 5 or more Vehicles | 3 (2.5%) | 12 (10.6%) |
| Total | 122 (100.0%) | 113 (100.0%) |
Commute Time in Norwood
The most frequently occuring commute durations in Norwood are 15 to 19 minutes (48 commuters, 26.1%), 20 to 24 minutes (48 commuters, 26.1%), and 45 to 59 minutes (29 commuters, 15.8%).
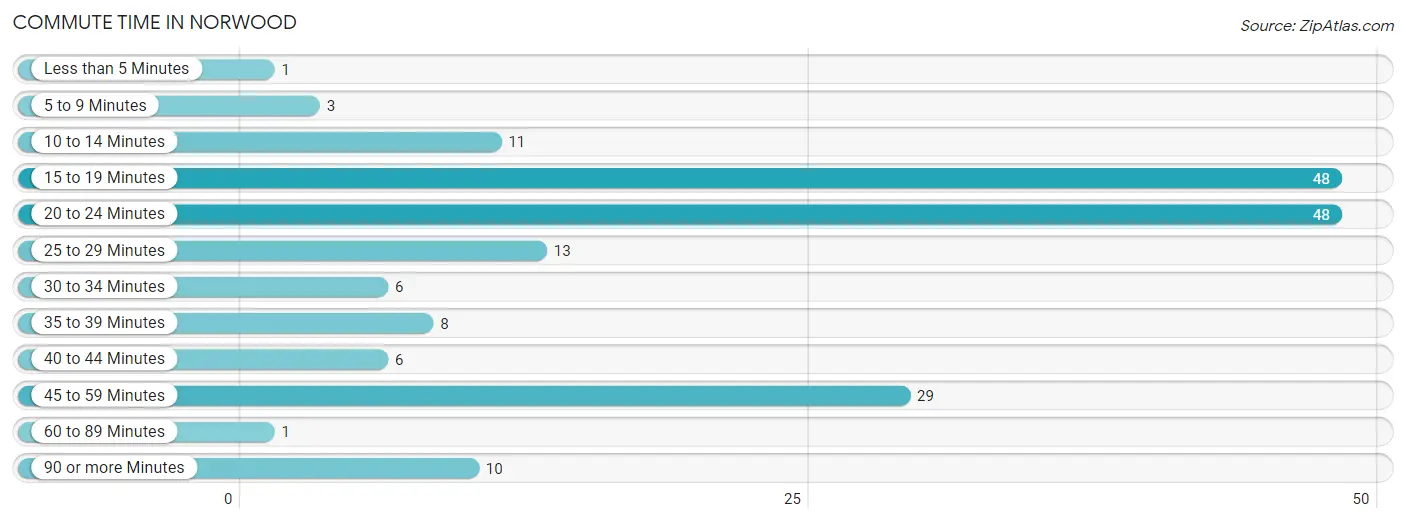
| Commute Time | # Commuters | % Commuters |
| Less than 5 Minutes | 1 | 0.5% |
| 5 to 9 Minutes | 3 | 1.6% |
| 10 to 14 Minutes | 11 | 6.0% |
| 15 to 19 Minutes | 48 | 26.1% |
| 20 to 24 Minutes | 48 | 26.1% |
| 25 to 29 Minutes | 13 | 7.1% |
| 30 to 34 Minutes | 6 | 3.3% |
| 35 to 39 Minutes | 8 | 4.3% |
| 40 to 44 Minutes | 6 | 3.3% |
| 45 to 59 Minutes | 29 | 15.8% |
| 60 to 89 Minutes | 1 | 0.5% |
| 90 or more Minutes | 10 | 5.4% |
Commute Time by Sex in Norwood
The most common commute times in Norwood are 20 to 24 minutes (28 commuters, 35.4%) for males and 15 to 19 minutes (30 commuters, 28.6%) for females.
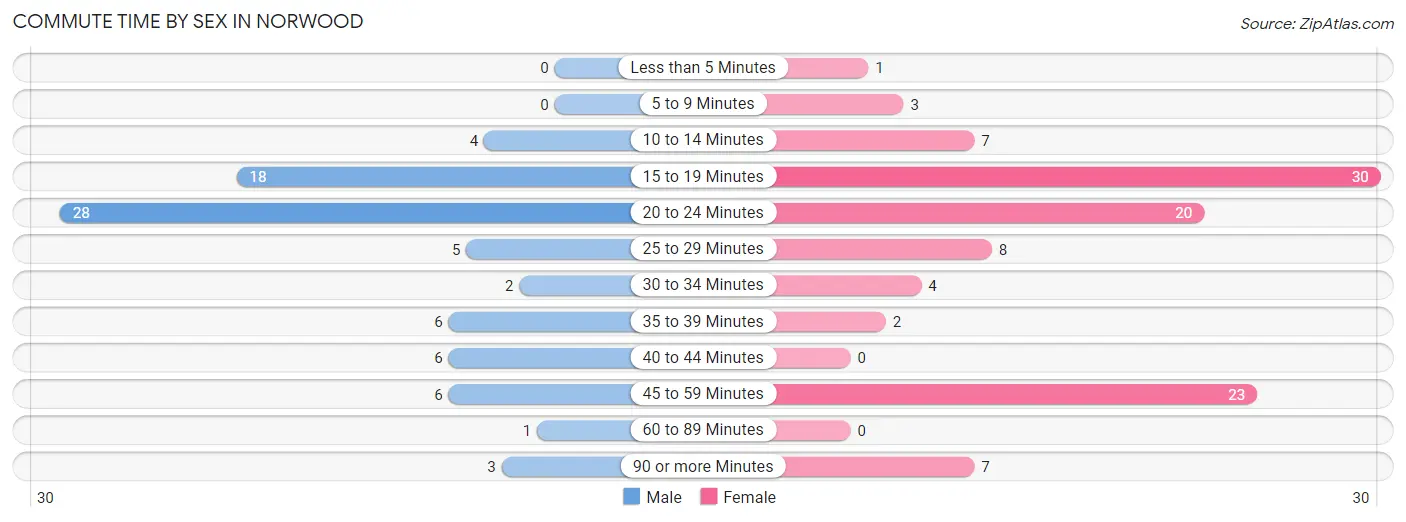
| Commute Time | Male | Female |
| Less than 5 Minutes | 0 (0.0%) | 1 (0.9%) |
| 5 to 9 Minutes | 0 (0.0%) | 3 (2.9%) |
| 10 to 14 Minutes | 4 (5.1%) | 7 (6.7%) |
| 15 to 19 Minutes | 18 (22.8%) | 30 (28.6%) |
| 20 to 24 Minutes | 28 (35.4%) | 20 (19.1%) |
| 25 to 29 Minutes | 5 (6.3%) | 8 (7.6%) |
| 30 to 34 Minutes | 2 (2.5%) | 4 (3.8%) |
| 35 to 39 Minutes | 6 (7.6%) | 2 (1.9%) |
| 40 to 44 Minutes | 6 (7.6%) | 0 (0.0%) |
| 45 to 59 Minutes | 6 (7.6%) | 23 (21.9%) |
| 60 to 89 Minutes | 1 (1.3%) | 0 (0.0%) |
| 90 or more Minutes | 3 (3.8%) | 7 (6.7%) |
Time of Departure to Work by Sex in Norwood
The most frequent times of departure to work in Norwood are 6:30 AM to 6:59 AM (15, 19.0%) for males and 4:00 PM to 11:59 PM (23, 21.9%) for females.
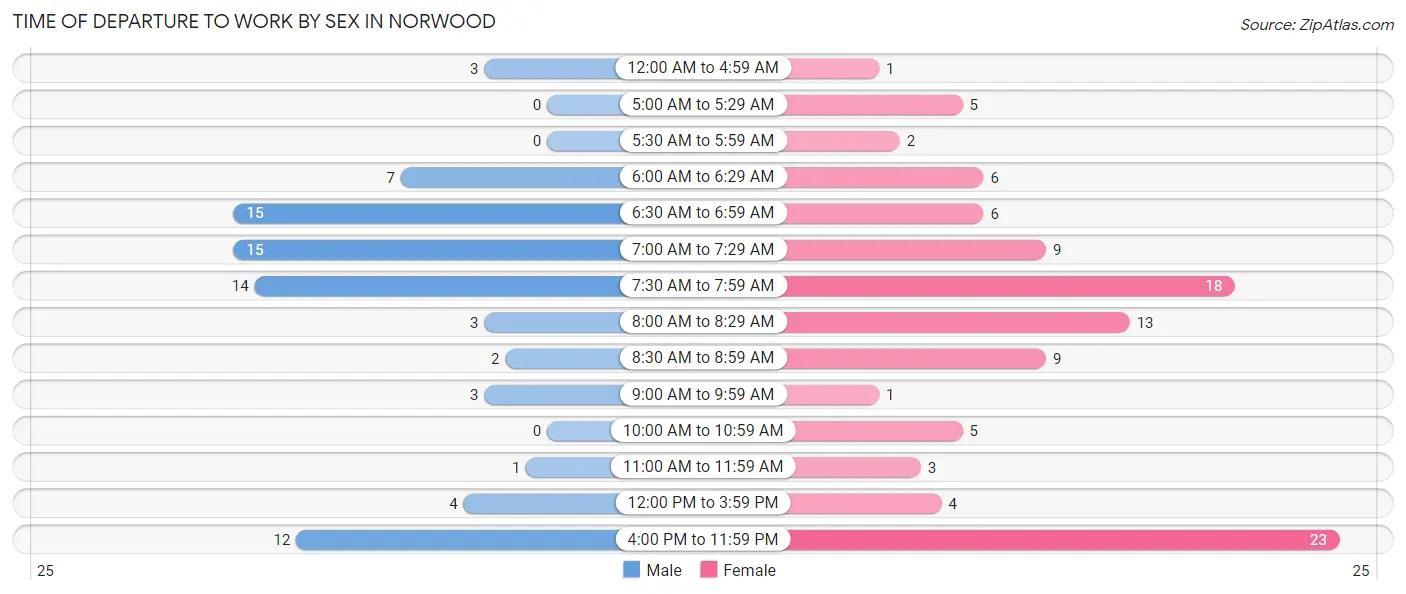
| Time of Departure | Male | Female |
| 12:00 AM to 4:59 AM | 3 (3.8%) | 1 (0.9%) |
| 5:00 AM to 5:29 AM | 0 (0.0%) | 5 (4.8%) |
| 5:30 AM to 5:59 AM | 0 (0.0%) | 2 (1.9%) |
| 6:00 AM to 6:29 AM | 7 (8.9%) | 6 (5.7%) |
| 6:30 AM to 6:59 AM | 15 (19.0%) | 6 (5.7%) |
| 7:00 AM to 7:29 AM | 15 (19.0%) | 9 (8.6%) |
| 7:30 AM to 7:59 AM | 14 (17.7%) | 18 (17.1%) |
| 8:00 AM to 8:29 AM | 3 (3.8%) | 13 (12.4%) |
| 8:30 AM to 8:59 AM | 2 (2.5%) | 9 (8.6%) |
| 9:00 AM to 9:59 AM | 3 (3.8%) | 1 (0.9%) |
| 10:00 AM to 10:59 AM | 0 (0.0%) | 5 (4.8%) |
| 11:00 AM to 11:59 AM | 1 (1.3%) | 3 (2.9%) |
| 12:00 PM to 3:59 PM | 4 (5.1%) | 4 (3.8%) |
| 4:00 PM to 11:59 PM | 12 (15.2%) | 23 (21.9%) |
| Total | 79 (100.0%) | 105 (100.0%) |
Housing Occupancy in Norwood
Occupancy by Ownership in Norwood
Of the total 188 dwellings in Norwood, owner-occupied units account for 164 (87.2%), while renter-occupied units make up 24 (12.8%).
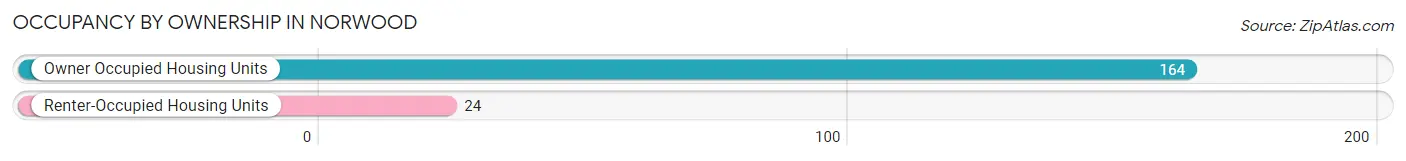
| Occupancy | # Housing Units | % Housing Units |
| Owner Occupied Housing Units | 164 | 87.2% |
| Renter-Occupied Housing Units | 24 | 12.8% |
| Total Occupied Housing Units | 188 | 100.0% |
Occupancy by Household Size in Norwood
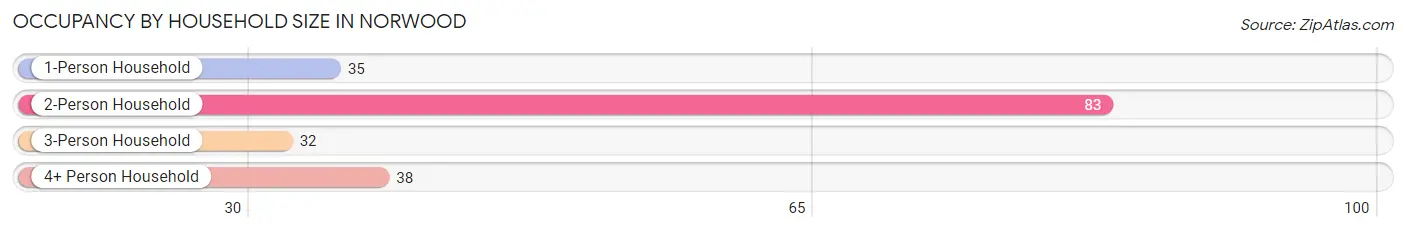
| Household Size | # Housing Units | % Housing Units |
| 1-Person Household | 35 | 18.6% |
| 2-Person Household | 83 | 44.2% |
| 3-Person Household | 32 | 17.0% |
| 4+ Person Household | 38 | 20.2% |
| Total Housing Units | 188 | 100.0% |
Occupancy by Ownership by Household Size in Norwood
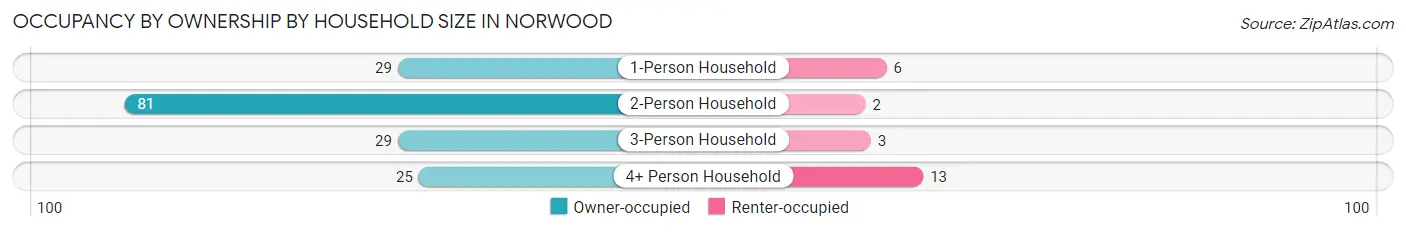
| Household Size | Owner-occupied | Renter-occupied |
| 1-Person Household | 29 (82.9%) | 6 (17.1%) |
| 2-Person Household | 81 (97.6%) | 2 (2.4%) |
| 3-Person Household | 29 (90.6%) | 3 (9.4%) |
| 4+ Person Household | 25 (65.8%) | 13 (34.2%) |
| Total Housing Units | 164 (87.2%) | 24 (12.8%) |
Occupancy by Educational Attainment in Norwood
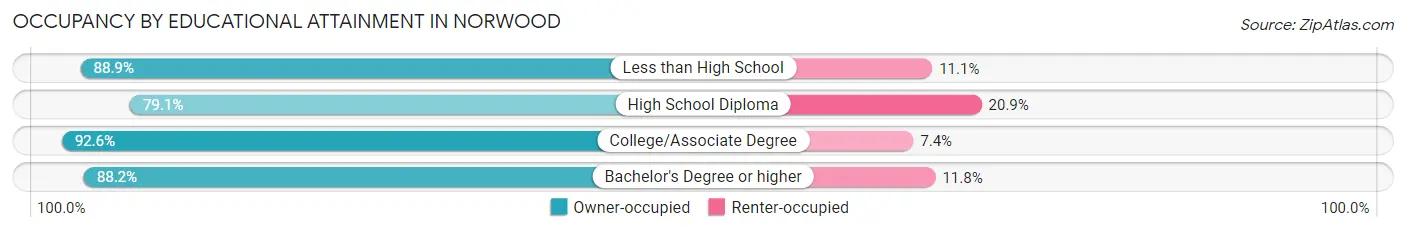
| Household Size | Owner-occupied | Renter-occupied |
| Less than High School | 8 (88.9%) | 1 (11.1%) |
| High School Diploma | 53 (79.1%) | 14 (20.9%) |
| College/Associate Degree | 88 (92.6%) | 7 (7.4%) |
| Bachelor's Degree or higher | 15 (88.2%) | 2 (11.8%) |
Occupancy by Age of Householder in Norwood
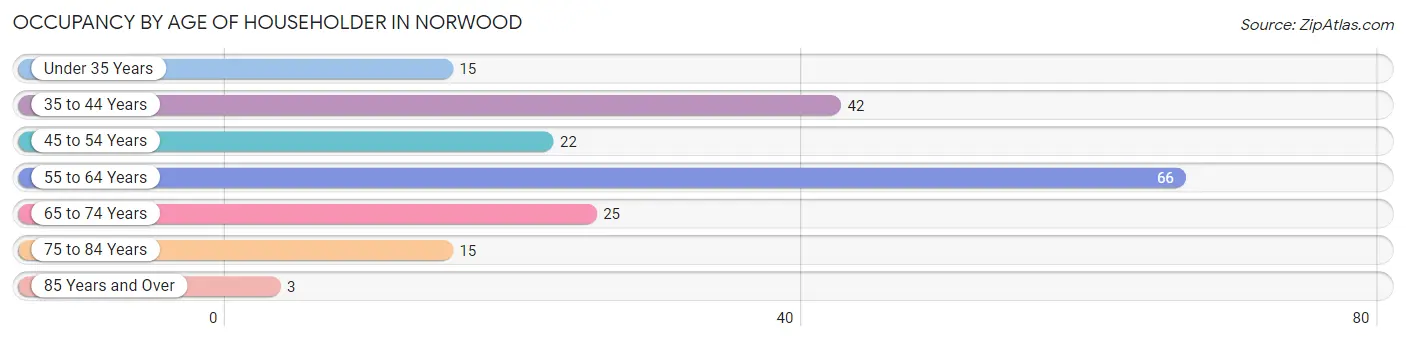
| Age Bracket | # Households | % Households |
| Under 35 Years | 15 | 8.0% |
| 35 to 44 Years | 42 | 22.3% |
| 45 to 54 Years | 22 | 11.7% |
| 55 to 64 Years | 66 | 35.1% |
| 65 to 74 Years | 25 | 13.3% |
| 75 to 84 Years | 15 | 8.0% |
| 85 Years and Over | 3 | 1.6% |
| Total | 188 | 100.0% |
Housing Finances in Norwood
Median Income by Occupancy in Norwood
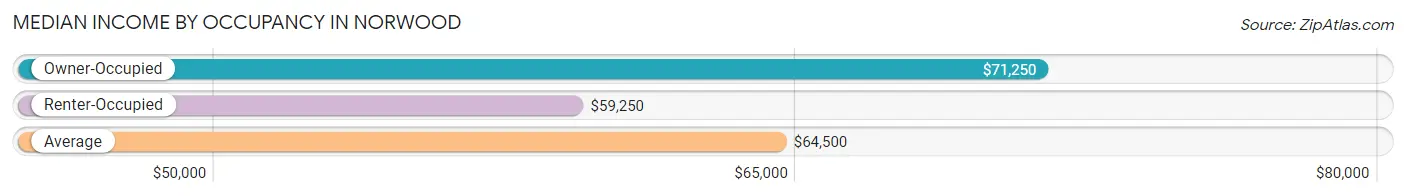
| Occupancy Type | # Households | Median Income |
| Owner-Occupied | 164 (87.2%) | $71,250 |
| Renter-Occupied | 24 (12.8%) | $59,250 |
| Average | 188 (100.0%) | $64,500 |
Occupancy by Householder Income Bracket in Norwood
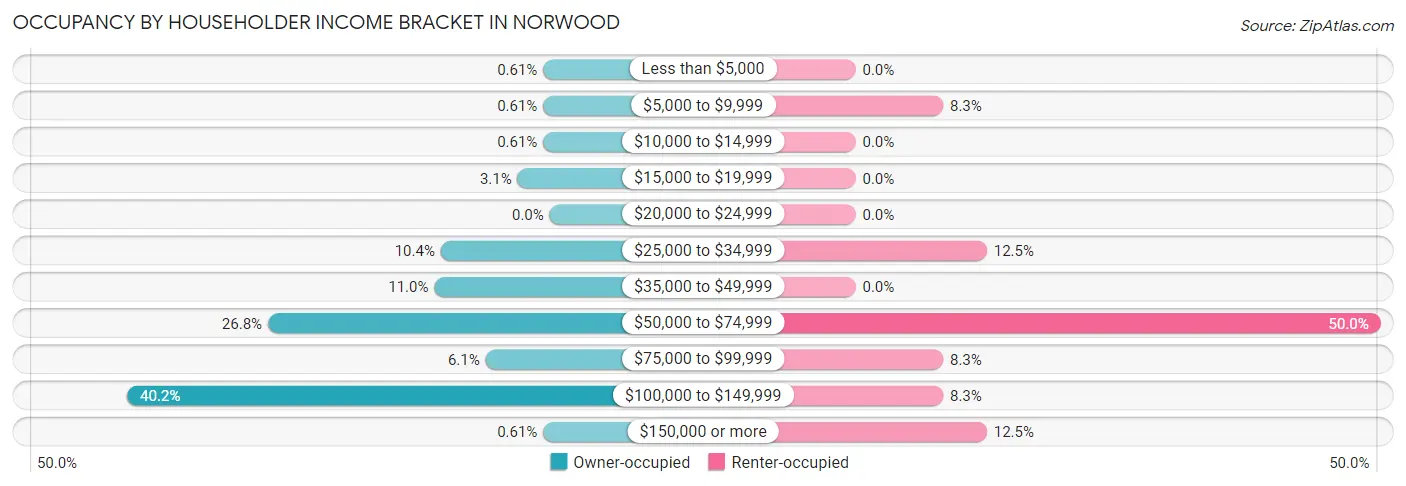
| Income Bracket | Owner-occupied | Renter-occupied |
| Less than $5,000 | 1 (0.6%) | 0 (0.0%) |
| $5,000 to $9,999 | 1 (0.6%) | 2 (8.3%) |
| $10,000 to $14,999 | 1 (0.6%) | 0 (0.0%) |
| $15,000 to $19,999 | 5 (3.0%) | 0 (0.0%) |
| $20,000 to $24,999 | 0 (0.0%) | 0 (0.0%) |
| $25,000 to $34,999 | 17 (10.4%) | 3 (12.5%) |
| $35,000 to $49,999 | 18 (11.0%) | 0 (0.0%) |
| $50,000 to $74,999 | 44 (26.8%) | 12 (50.0%) |
| $75,000 to $99,999 | 10 (6.1%) | 2 (8.3%) |
| $100,000 to $149,999 | 66 (40.2%) | 2 (8.3%) |
| $150,000 or more | 1 (0.6%) | 3 (12.5%) |
| Total | 164 (100.0%) | 24 (100.0%) |
Monthly Housing Cost Tiers in Norwood
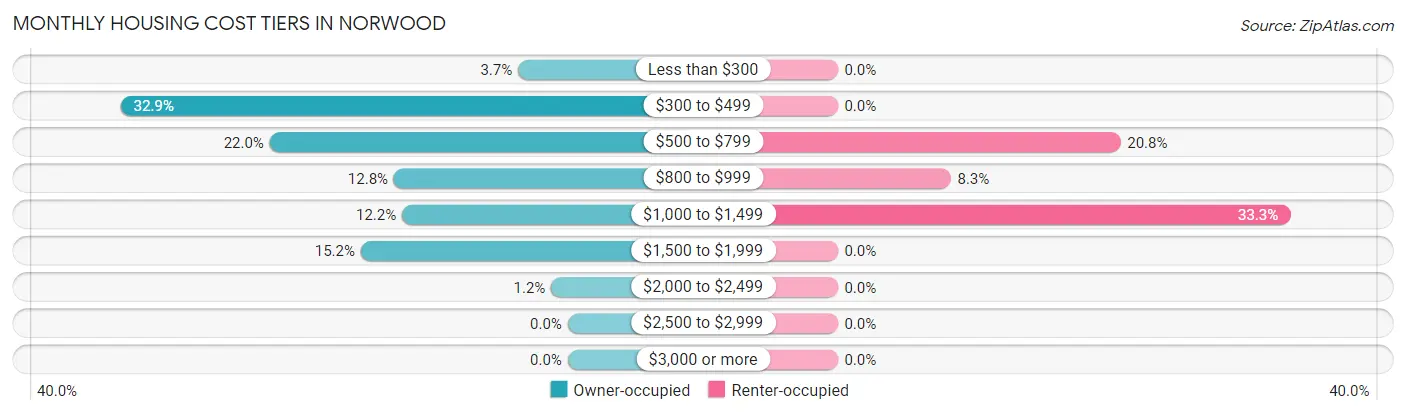
| Monthly Cost | Owner-occupied | Renter-occupied |
| Less than $300 | 6 (3.7%) | 0 (0.0%) |
| $300 to $499 | 54 (32.9%) | 0 (0.0%) |
| $500 to $799 | 36 (22.0%) | 5 (20.8%) |
| $800 to $999 | 21 (12.8%) | 2 (8.3%) |
| $1,000 to $1,499 | 20 (12.2%) | 8 (33.3%) |
| $1,500 to $1,999 | 25 (15.2%) | 0 (0.0%) |
| $2,000 to $2,499 | 2 (1.2%) | 0 (0.0%) |
| $2,500 to $2,999 | 0 (0.0%) | 0 (0.0%) |
| $3,000 or more | 0 (0.0%) | 0 (0.0%) |
| Total | 164 (100.0%) | 24 (100.0%) |
Physical Housing Characteristics in Norwood
Housing Structures in Norwood
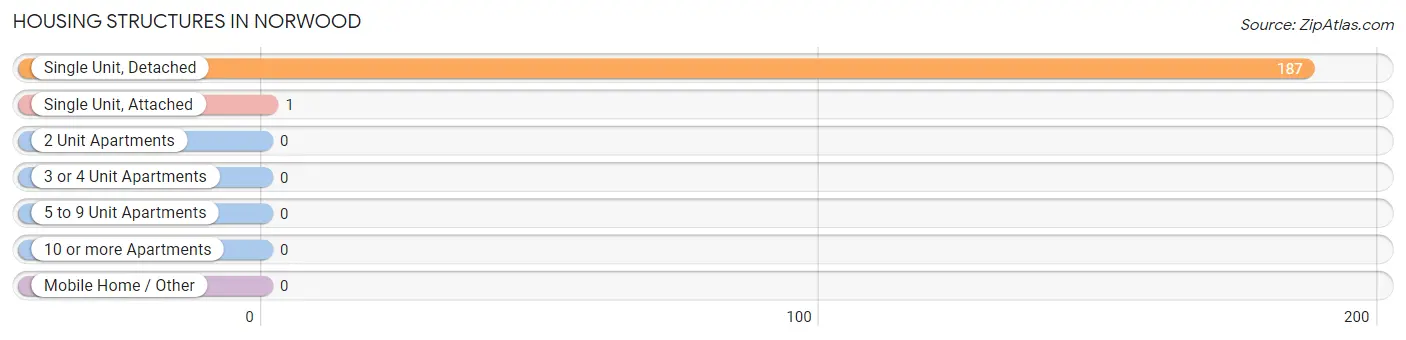
| Structure Type | # Housing Units | % Housing Units |
| Single Unit, Detached | 187 | 99.5% |
| Single Unit, Attached | 1 | 0.5% |
| 2 Unit Apartments | 0 | 0.0% |
| 3 or 4 Unit Apartments | 0 | 0.0% |
| 5 to 9 Unit Apartments | 0 | 0.0% |
| 10 or more Apartments | 0 | 0.0% |
| Mobile Home / Other | 0 | 0.0% |
| Total | 188 | 100.0% |
Housing Structures by Occupancy in Norwood
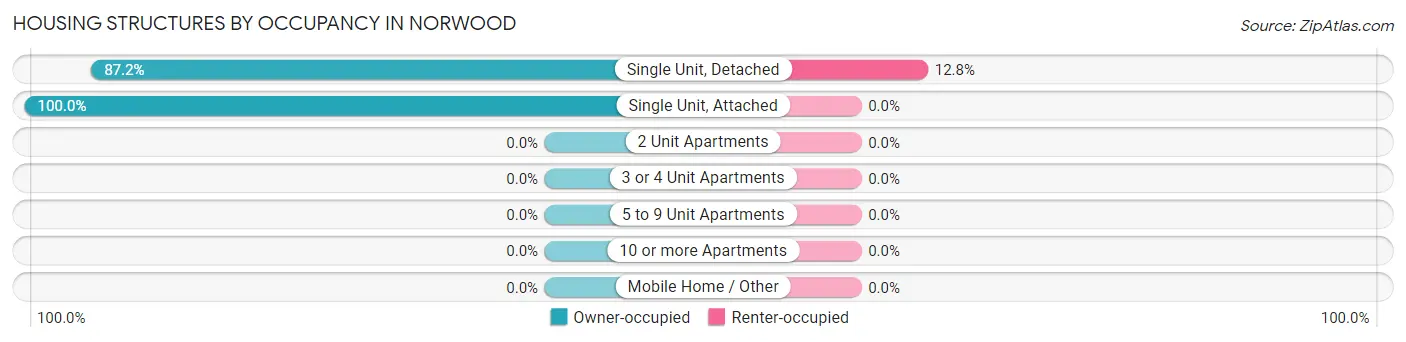
| Structure Type | Owner-occupied | Renter-occupied |
| Single Unit, Detached | 163 (87.2%) | 24 (12.8%) |
| Single Unit, Attached | 1 (100.0%) | 0 (0.0%) |
| 2 Unit Apartments | 0 (0.0%) | 0 (0.0%) |
| 3 or 4 Unit Apartments | 0 (0.0%) | 0 (0.0%) |
| 5 to 9 Unit Apartments | 0 (0.0%) | 0 (0.0%) |
| 10 or more Apartments | 0 (0.0%) | 0 (0.0%) |
| Mobile Home / Other | 0 (0.0%) | 0 (0.0%) |
| Total | 164 (87.2%) | 24 (12.8%) |
Housing Structures by Number of Rooms in Norwood
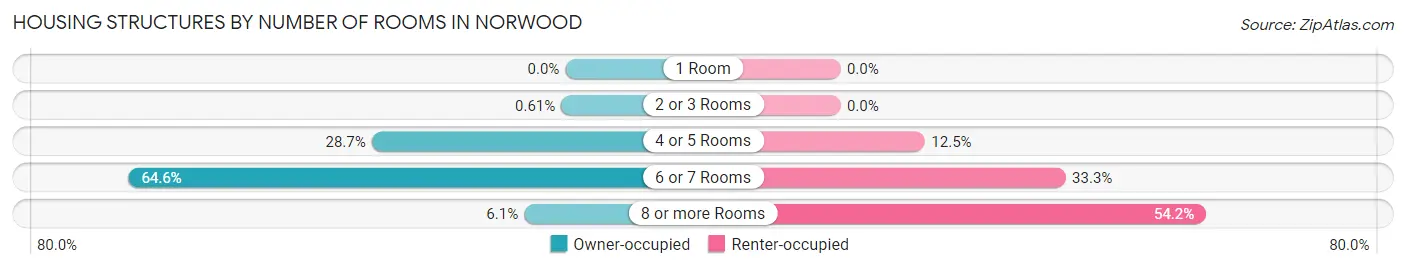
| Number of Rooms | Owner-occupied | Renter-occupied |
| 1 Room | 0 (0.0%) | 0 (0.0%) |
| 2 or 3 Rooms | 1 (0.6%) | 0 (0.0%) |
| 4 or 5 Rooms | 47 (28.7%) | 3 (12.5%) |
| 6 or 7 Rooms | 106 (64.6%) | 8 (33.3%) |
| 8 or more Rooms | 10 (6.1%) | 13 (54.2%) |
| Total | 164 (100.0%) | 24 (100.0%) |
Housing Structure by Heating Type in Norwood
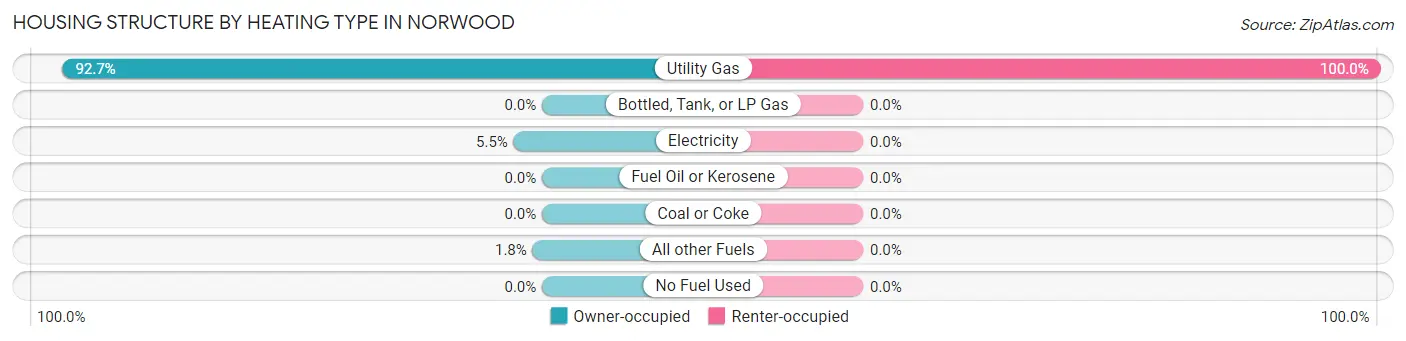
| Heating Type | Owner-occupied | Renter-occupied |
| Utility Gas | 152 (92.7%) | 24 (100.0%) |
| Bottled, Tank, or LP Gas | 0 (0.0%) | 0 (0.0%) |
| Electricity | 9 (5.5%) | 0 (0.0%) |
| Fuel Oil or Kerosene | 0 (0.0%) | 0 (0.0%) |
| Coal or Coke | 0 (0.0%) | 0 (0.0%) |
| All other Fuels | 3 (1.8%) | 0 (0.0%) |
| No Fuel Used | 0 (0.0%) | 0 (0.0%) |
| Total | 164 (100.0%) | 24 (100.0%) |
Household Vehicle Usage in Norwood
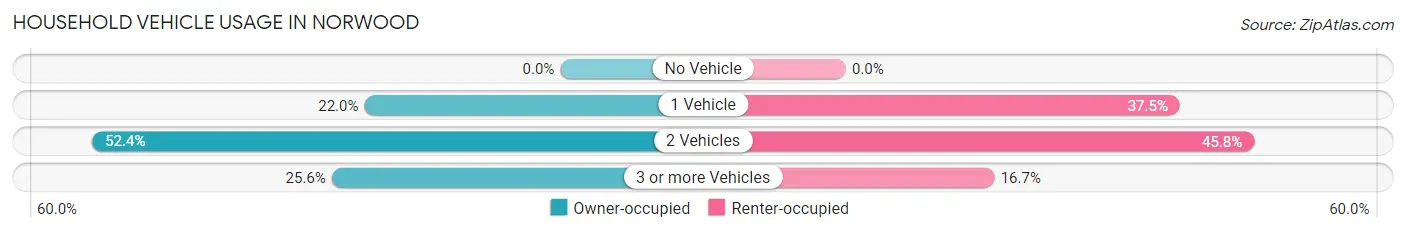
| Vehicles per Household | Owner-occupied | Renter-occupied |
| No Vehicle | 0 (0.0%) | 0 (0.0%) |
| 1 Vehicle | 36 (22.0%) | 9 (37.5%) |
| 2 Vehicles | 86 (52.4%) | 11 (45.8%) |
| 3 or more Vehicles | 42 (25.6%) | 4 (16.7%) |
| Total | 164 (100.0%) | 24 (100.0%) |
Real Estate & Mortgages in Norwood
Real Estate and Mortgage Overview in Norwood
| Characteristic | Without Mortgage | With Mortgage |
| Housing Units | 87 | 77 |
| Median Property Value | $78,700 | $105,700 |
| Median Household Income | $100,032 | $0 |
| Monthly Housing Costs | $464 | $0 |
| Real Estate Taxes | $2,592 | $0 |
Property Value by Mortgage Status in Norwood
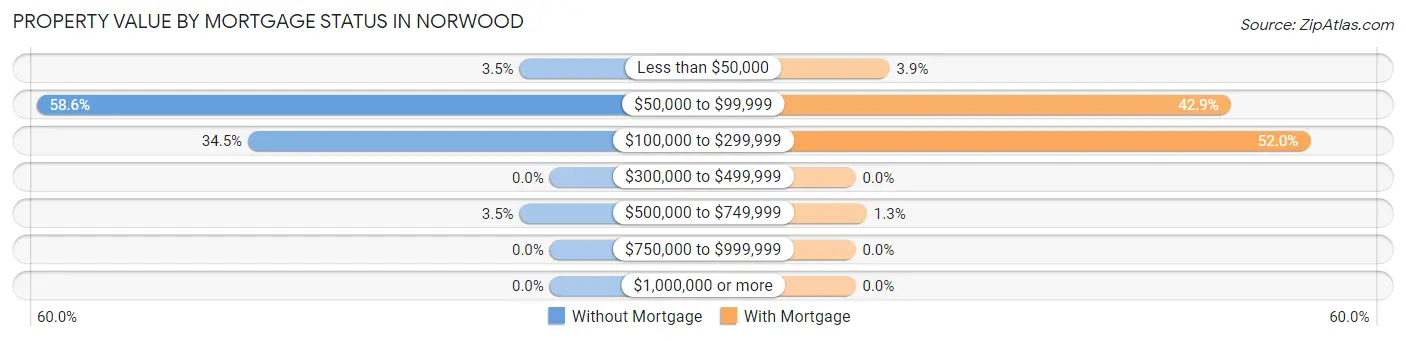
| Property Value | Without Mortgage | With Mortgage |
| Less than $50,000 | 3 (3.5%) | 3 (3.9%) |
| $50,000 to $99,999 | 51 (58.6%) | 33 (42.9%) |
| $100,000 to $299,999 | 30 (34.5%) | 40 (51.9%) |
| $300,000 to $499,999 | 0 (0.0%) | 0 (0.0%) |
| $500,000 to $749,999 | 3 (3.5%) | 1 (1.3%) |
| $750,000 to $999,999 | 0 (0.0%) | 0 (0.0%) |
| $1,000,000 or more | 0 (0.0%) | 0 (0.0%) |
| Total | 87 (100.0%) | 77 (100.0%) |
Household Income by Mortgage Status in Norwood
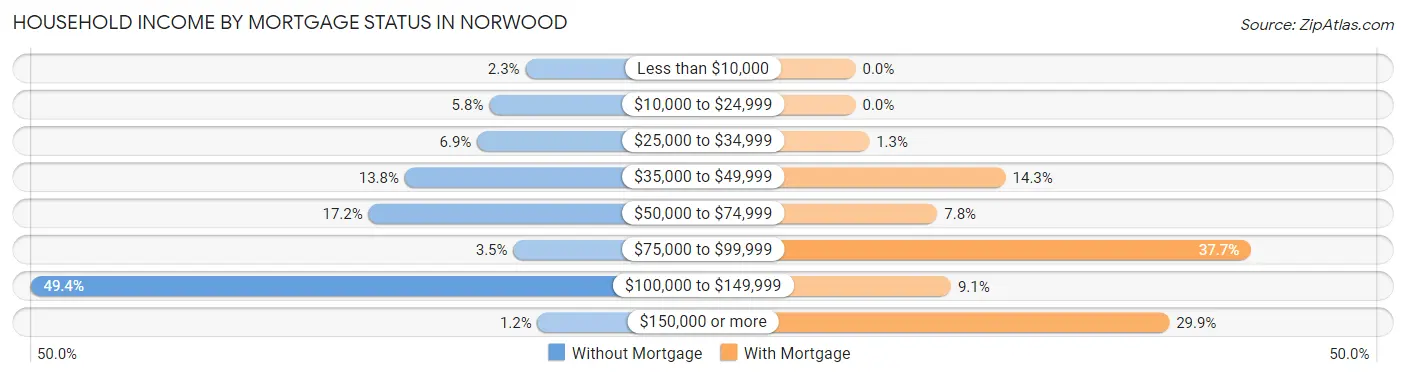
| Household Income | Without Mortgage | With Mortgage |
| Less than $10,000 | 2 (2.3%) | 0 (0.0%) |
| $10,000 to $24,999 | 5 (5.8%) | 0 (0.0%) |
| $25,000 to $34,999 | 6 (6.9%) | 1 (1.3%) |
| $35,000 to $49,999 | 12 (13.8%) | 11 (14.3%) |
| $50,000 to $74,999 | 15 (17.2%) | 6 (7.8%) |
| $75,000 to $99,999 | 3 (3.5%) | 29 (37.7%) |
| $100,000 to $149,999 | 43 (49.4%) | 7 (9.1%) |
| $150,000 or more | 1 (1.1%) | 23 (29.9%) |
| Total | 87 (100.0%) | 77 (100.0%) |
Property Value to Household Income Ratio in Norwood
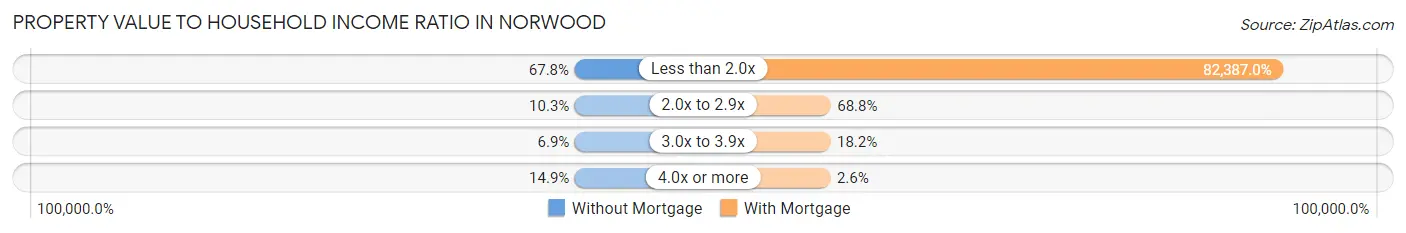
| Value-to-Income Ratio | Without Mortgage | With Mortgage |
| Less than 2.0x | 59 (67.8%) | 63,438 (82,387.0%) |
| 2.0x to 2.9x | 9 (10.3%) | 53 (68.8%) |
| 3.0x to 3.9x | 6 (6.9%) | 14 (18.2%) |
| 4.0x or more | 13 (14.9%) | 2 (2.6%) |
| Total | 87 (100.0%) | 77 (100.0%) |
Real Estate Taxes by Mortgage Status in Norwood
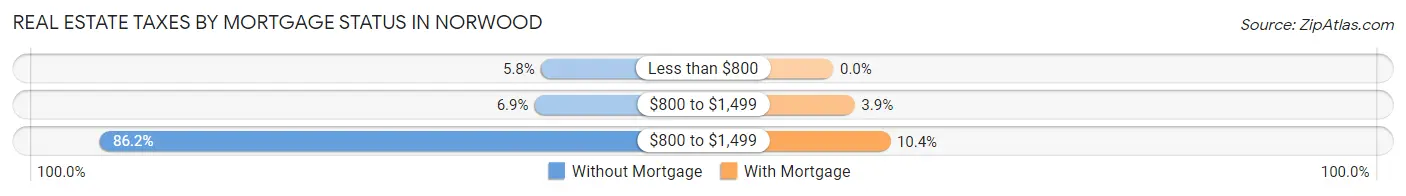
| Property Taxes | Without Mortgage | With Mortgage |
| Less than $800 | 5 (5.8%) | 0 (0.0%) |
| $800 to $1,499 | 6 (6.9%) | 3 (3.9%) |
| $800 to $1,499 | 75 (86.2%) | 8 (10.4%) |
| Total | 87 (100.0%) | 77 (100.0%) |
Health & Disability in Norwood
Health Insurance Coverage by Age in Norwood
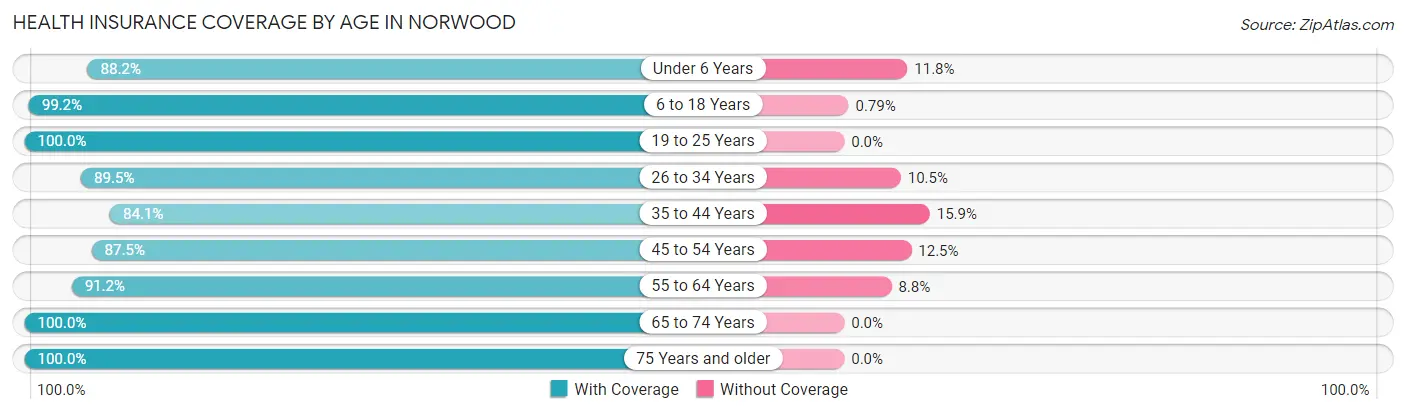
| Age Bracket | With Coverage | Without Coverage |
| Under 6 Years | 30 (88.2%) | 4 (11.8%) |
| 6 to 18 Years | 125 (99.2%) | 1 (0.8%) |
| 19 to 25 Years | 23 (100.0%) | 0 (0.0%) |
| 26 to 34 Years | 34 (89.5%) | 4 (10.5%) |
| 35 to 44 Years | 58 (84.1%) | 11 (15.9%) |
| 45 to 54 Years | 35 (87.5%) | 5 (12.5%) |
| 55 to 64 Years | 83 (91.2%) | 8 (8.8%) |
| 65 to 74 Years | 37 (100.0%) | 0 (0.0%) |
| 75 Years and older | 31 (100.0%) | 0 (0.0%) |
| Total | 456 (93.2%) | 33 (6.8%) |
Health Insurance Coverage by Citizenship Status in Norwood
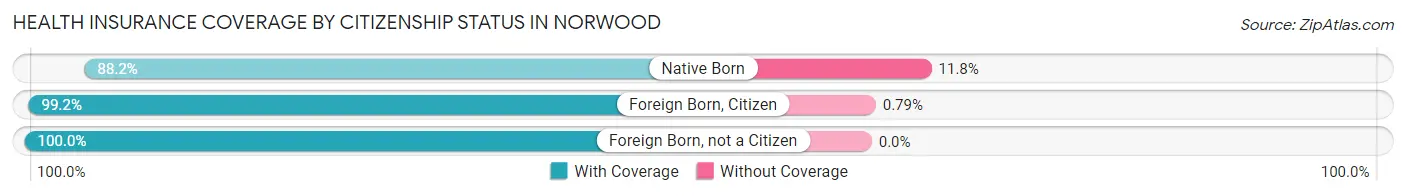
| Citizenship Status | With Coverage | Without Coverage |
| Native Born | 30 (88.2%) | 4 (11.8%) |
| Foreign Born, Citizen | 125 (99.2%) | 1 (0.8%) |
| Foreign Born, not a Citizen | 23 (100.0%) | 0 (0.0%) |
Health Insurance Coverage by Household Income in Norwood
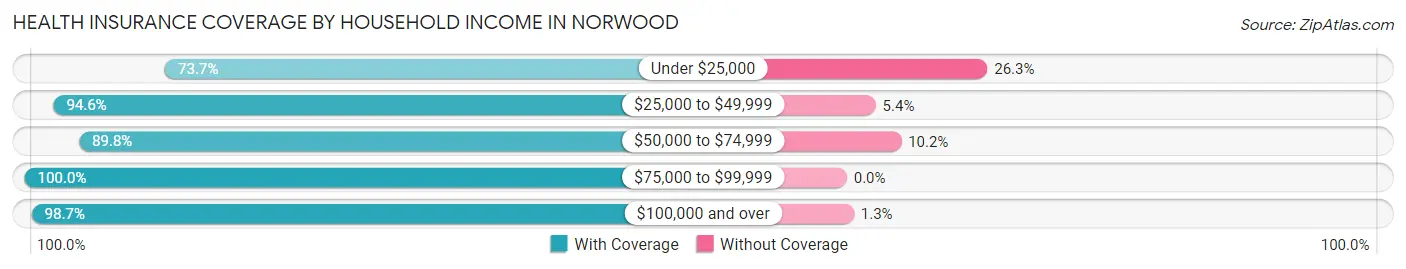
| Household Income | With Coverage | Without Coverage |
| Under $25,000 | 14 (73.7%) | 5 (26.3%) |
| $25,000 to $49,999 | 70 (94.6%) | 4 (5.4%) |
| $50,000 to $74,999 | 194 (89.8%) | 22 (10.2%) |
| $75,000 to $99,999 | 28 (100.0%) | 0 (0.0%) |
| $100,000 and over | 150 (98.7%) | 2 (1.3%) |
Public vs Private Health Insurance Coverage by Age in Norwood
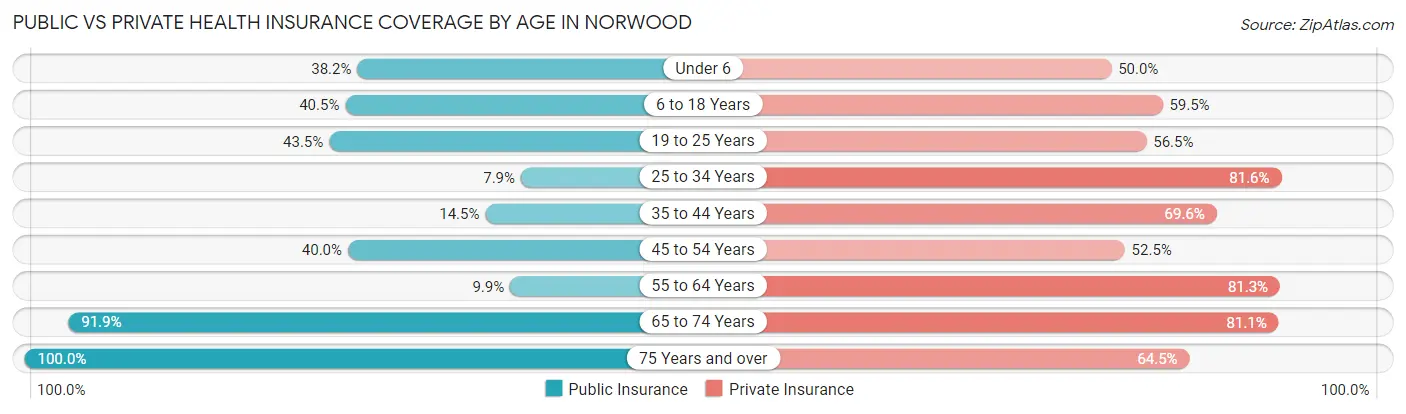
| Age Bracket | Public Insurance | Private Insurance |
| Under 6 | 13 (38.2%) | 17 (50.0%) |
| 6 to 18 Years | 51 (40.5%) | 75 (59.5%) |
| 19 to 25 Years | 10 (43.5%) | 13 (56.5%) |
| 25 to 34 Years | 3 (7.9%) | 31 (81.6%) |
| 35 to 44 Years | 10 (14.5%) | 48 (69.6%) |
| 45 to 54 Years | 16 (40.0%) | 21 (52.5%) |
| 55 to 64 Years | 9 (9.9%) | 74 (81.3%) |
| 65 to 74 Years | 34 (91.9%) | 30 (81.1%) |
| 75 Years and over | 31 (100.0%) | 20 (64.5%) |
| Total | 177 (36.2%) | 329 (67.3%) |
Disability Status by Sex by Age in Norwood
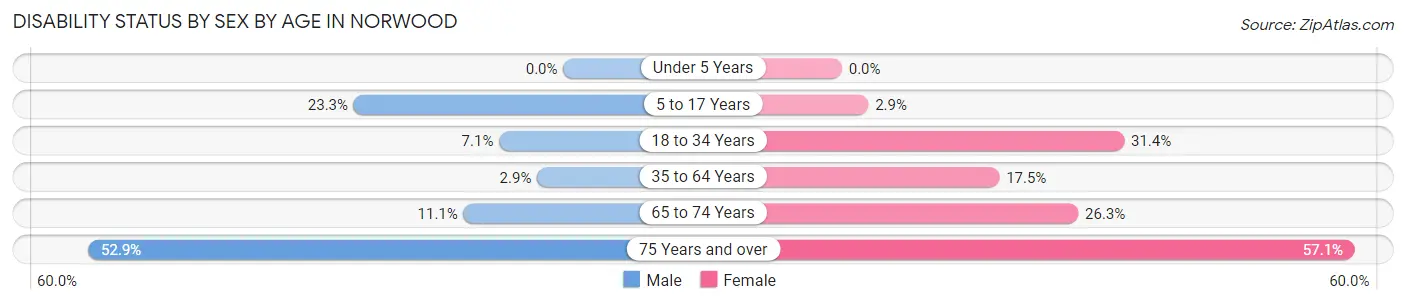
| Age Bracket | Male | Female |
| Under 5 Years | 0 (0.0%) | 0 (0.0%) |
| 5 to 17 Years | 14 (23.3%) | 2 (2.9%) |
| 18 to 34 Years | 2 (7.1%) | 11 (31.4%) |
| 35 to 64 Years | 3 (2.9%) | 17 (17.5%) |
| 65 to 74 Years | 2 (11.1%) | 5 (26.3%) |
| 75 Years and over | 9 (52.9%) | 8 (57.1%) |
Disability Class by Sex by Age in Norwood
Disability Class: Hearing Difficulty
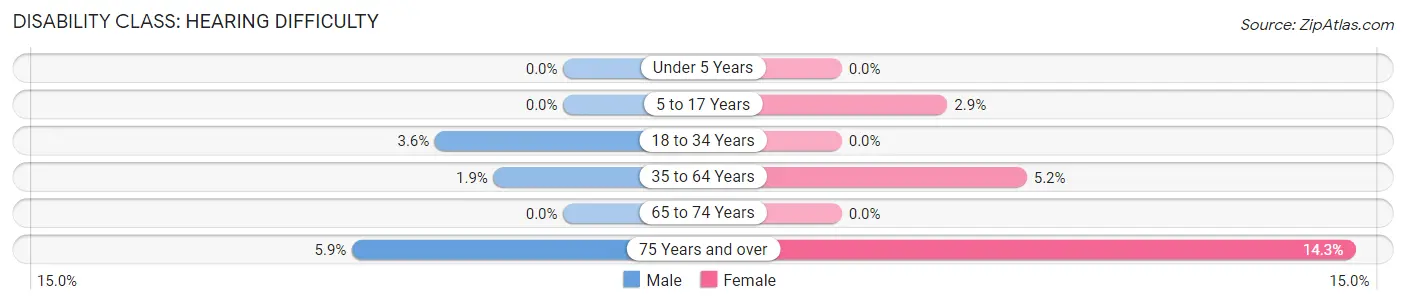
| Age Bracket | Male | Female |
| Under 5 Years | 0 (0.0%) | 0 (0.0%) |
| 5 to 17 Years | 0 (0.0%) | 2 (2.9%) |
| 18 to 34 Years | 1 (3.6%) | 0 (0.0%) |
| 35 to 64 Years | 2 (1.9%) | 5 (5.1%) |
| 65 to 74 Years | 0 (0.0%) | 0 (0.0%) |
| 75 Years and over | 1 (5.9%) | 2 (14.3%) |
Disability Class: Vision Difficulty
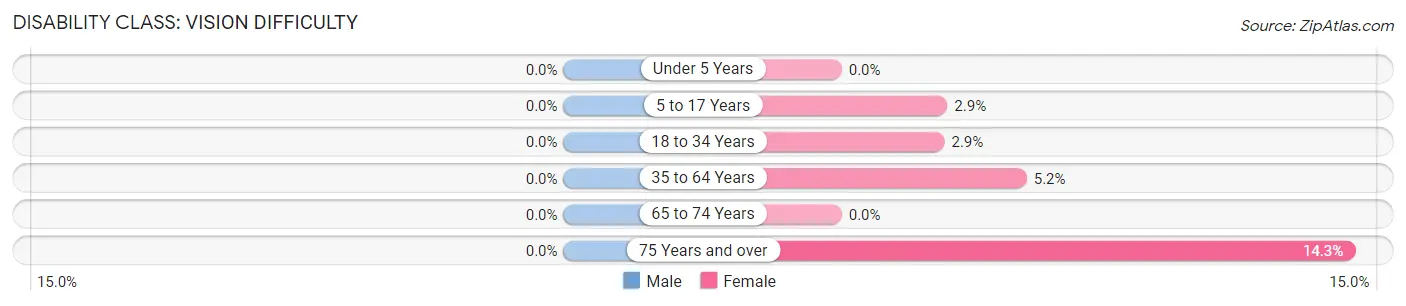
| Age Bracket | Male | Female |
| Under 5 Years | 0 (0.0%) | 0 (0.0%) |
| 5 to 17 Years | 0 (0.0%) | 2 (2.9%) |
| 18 to 34 Years | 0 (0.0%) | 1 (2.9%) |
| 35 to 64 Years | 0 (0.0%) | 5 (5.1%) |
| 65 to 74 Years | 0 (0.0%) | 0 (0.0%) |
| 75 Years and over | 0 (0.0%) | 2 (14.3%) |
Disability Class: Cognitive Difficulty
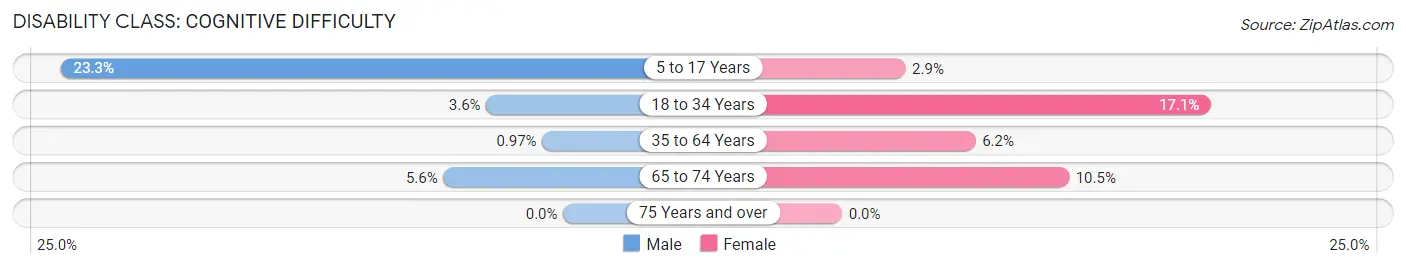
| Age Bracket | Male | Female |
| 5 to 17 Years | 14 (23.3%) | 2 (2.9%) |
| 18 to 34 Years | 1 (3.6%) | 6 (17.1%) |
| 35 to 64 Years | 1 (1.0%) | 6 (6.2%) |
| 65 to 74 Years | 1 (5.6%) | 2 (10.5%) |
| 75 Years and over | 0 (0.0%) | 0 (0.0%) |
Disability Class: Ambulatory Difficulty
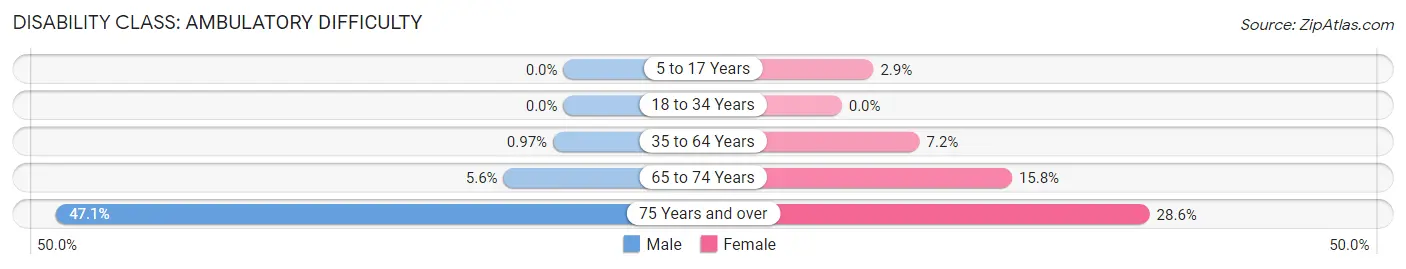
| Age Bracket | Male | Female |
| 5 to 17 Years | 0 (0.0%) | 2 (2.9%) |
| 18 to 34 Years | 0 (0.0%) | 0 (0.0%) |
| 35 to 64 Years | 1 (1.0%) | 7 (7.2%) |
| 65 to 74 Years | 1 (5.6%) | 3 (15.8%) |
| 75 Years and over | 8 (47.1%) | 4 (28.6%) |
Disability Class: Self-Care Difficulty
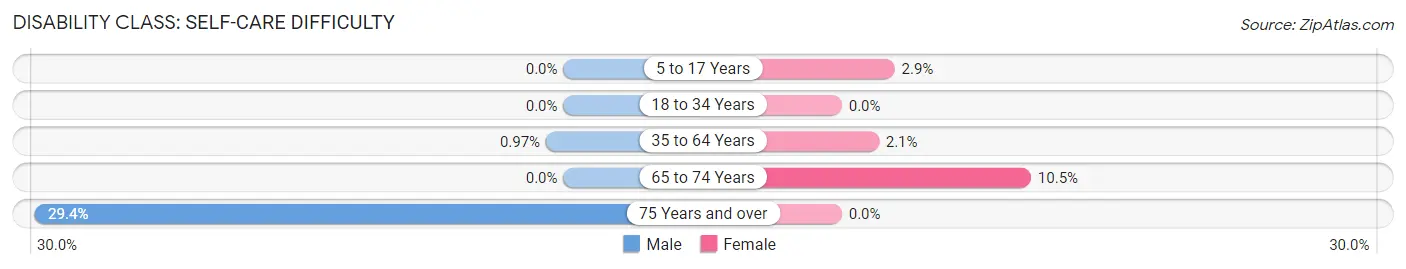
| Age Bracket | Male | Female |
| 5 to 17 Years | 0 (0.0%) | 2 (2.9%) |
| 18 to 34 Years | 0 (0.0%) | 0 (0.0%) |
| 35 to 64 Years | 1 (1.0%) | 2 (2.1%) |
| 65 to 74 Years | 0 (0.0%) | 2 (10.5%) |
| 75 Years and over | 5 (29.4%) | 0 (0.0%) |
Technology Access in Norwood
Computing Device Access in Norwood
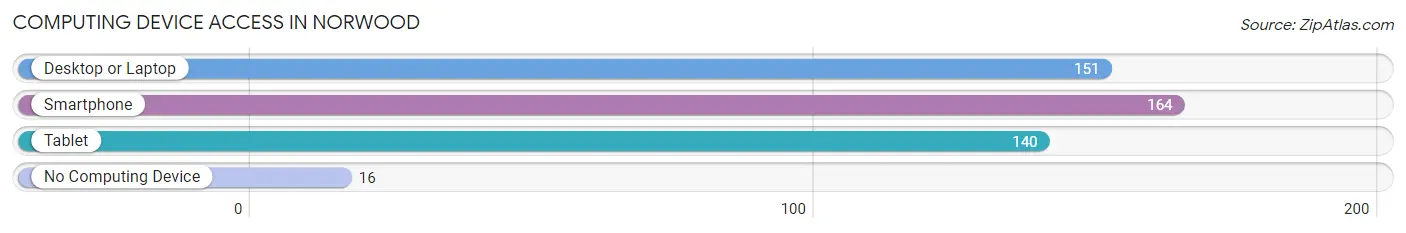
| Device Type | # Households | % Households |
| Desktop or Laptop | 151 | 80.3% |
| Smartphone | 164 | 87.2% |
| Tablet | 140 | 74.5% |
| No Computing Device | 16 | 8.5% |
| Total | 188 | 100.0% |
Internet Access in Norwood
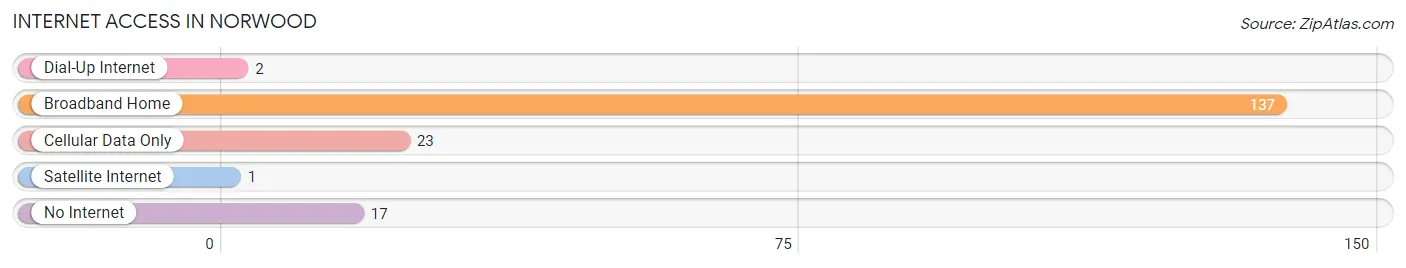
| Internet Type | # Households | % Households |
| Dial-Up Internet | 2 | 1.1% |
| Broadband Home | 137 | 72.9% |
| Cellular Data Only | 23 | 12.2% |
| Satellite Internet | 1 | 0.5% |
| No Internet | 17 | 9.0% |
| Total | 188 | 100.0% |
Norwood Summary
Norwood, Illinois is a small village located in Cook County, Illinois. It is situated on the south side of Chicago, about 20 miles from the city center. The village has a population of about 1,500 people and is part of the Chicago metropolitan area.
History
Norwood was first settled in the late 1800s by a group of German immigrants. The village was originally known as “New Berlin” and was incorporated in 1891. The village was named after a nearby farm owned by the Norwood family. The village grew slowly over the years, and by the 1950s, it had a population of about 1,000 people.
Geography
Norwood is located in Cook County, Illinois, about 20 miles south of Chicago. The village is situated on the south side of the city, near the intersection of Interstate 57 and Interstate 80. The village is bordered by the villages of Oak Lawn, Evergreen Park, and Burbank. The village is located in a flat, open area, with no major hills or mountains.
Economy
The economy of Norwood is largely based on small businesses and retail. The village is home to several small businesses, including restaurants, grocery stores, and other retail stores. The village also has a few industrial businesses, such as a printing company and a metal fabrication shop. The village is also home to a few small manufacturing companies.
Demographics
As of the 2010 census, the population of Norwood was 1,500 people. The village is predominantly white, with about 90% of the population being white. The remaining 10% of the population is made up of African Americans, Hispanics, and other ethnicities. The median household income in Norwood is $50,000, and the median home value is $150,000.
Conclusion
Norwood, Illinois is a small village located in Cook County, Illinois. It is situated on the south side of Chicago, about 20 miles from the city center. The village has a population of about 1,500 people and is part of the Chicago metropolitan area. The village was first settled in the late 1800s by a group of German immigrants and was incorporated in 1891. The economy of Norwood is largely based on small businesses and retail, and the village is predominantly white. The median household income in Norwood is $50,000, and the median home value is $150,000.
Common Questions
What is Per Capita Income in Norwood?
Per Capita income in Norwood is $25,180.
What is the Median Family Income in Norwood?
Median Family Income in Norwood is $88,750.
What is the Median Household income in Norwood?
Median Household Income in Norwood is $64,500.
What is Income or Wage Gap in Norwood?
Income or Wage Gap in Norwood is 63.1%.
Women in Norwood earn 36.9 cents for every dollar earned by a man.
What is Inequality or Gini Index in Norwood?
Inequality or Gini Index in Norwood is 0.27.
What is the Total Population of Norwood?
Total Population of Norwood is 489.
What is the Total Male Population of Norwood?
Total Male Population of Norwood is 255.
What is the Total Female Population of Norwood?
Total Female Population of Norwood is 234.
What is the Ratio of Males per 100 Females in Norwood?
There are 108.97 Males per 100 Females in Norwood.
What is the Ratio of Females per 100 Males in Norwood?
There are 91.76 Females per 100 Males in Norwood.
What is the Median Population Age in Norwood?
Median Population Age in Norwood is 36.4 Years.
What is the Average Family Size in Norwood
Average Family Size in Norwood is 2.9 People.
What is the Average Household Size in Norwood
Average Household Size in Norwood is 2.6 People.
How Large is the Labor Force in Norwood?
There are 245 People in the Labor Forcein in Norwood.
What is the Percentage of People in the Labor Force in Norwood?
69.4% of People are in the Labor Force in Norwood.
What is the Unemployment Rate in Norwood?
Unemployment Rate in Norwood is 2.9%.