South Hill, NY Map & Demographics
South Hill Map
South Hill Overview
$26,430
PER CAPITA INCOME
$168,036
AVG FAMILY INCOME
$107,536
AVG HOUSEHOLD INCOME
33.9%
WAGE / INCOME GAP [ % ]
66.1¢/ $1
WAGE / INCOME GAP [ $ ]
0.48
INEQUALITY / GINI INDEX
6,613
TOTAL POPULATION
3,246
MALE POPULATION
3,367
FEMALE POPULATION
96.41
MALES / 100 FEMALES
103.73
FEMALES / 100 MALES
20.1
MEDIAN AGE
2.7
AVG FAMILY SIZE
2.1
AVG HOUSEHOLD SIZE
2,313
LABOR FORCE [ PEOPLE ]
36.8%
PERCENT IN LABOR FORCE
3.5%
UNEMPLOYMENT RATE
Income in South Hill
Income Overview in South Hill
Per Capita Income in South Hill is $26,430, while median incomes of families and households are $168,036 and $107,536 respectively.
| Characteristic | Number | Measure |
| Per Capita Income | 6,613 | $26,430 |
| Median Family Income | 533 | $168,036 |
| Mean Family Income | 533 | $218,630 |
| Median Household Income | 1,279 | $107,536 |
| Mean Household Income | 1,279 | $135,701 |
| Income Deficit | 533 | $0 |
| Wage / Income Gap (%) | 6,613 | 33.92% |
| Wage / Income Gap ($) | 6,613 | 66.08¢ per $1 |
| Gini / Inequality Index | 6,613 | 0.48 |
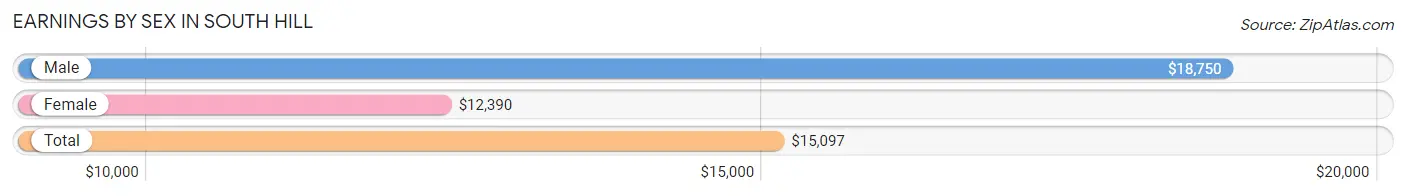
Earnings by Sex in South Hill
Average Earnings in South Hill are $15,097, $18,750 for men and $12,390 for women, a difference of 33.9%.
| Sex | Number | Average Earnings |
| Male | 1,491 (48.7%) | $18,750 |
| Female | 1,569 (51.3%) | $12,390 |
| Total | 3,060 (100.0%) | $15,097 |
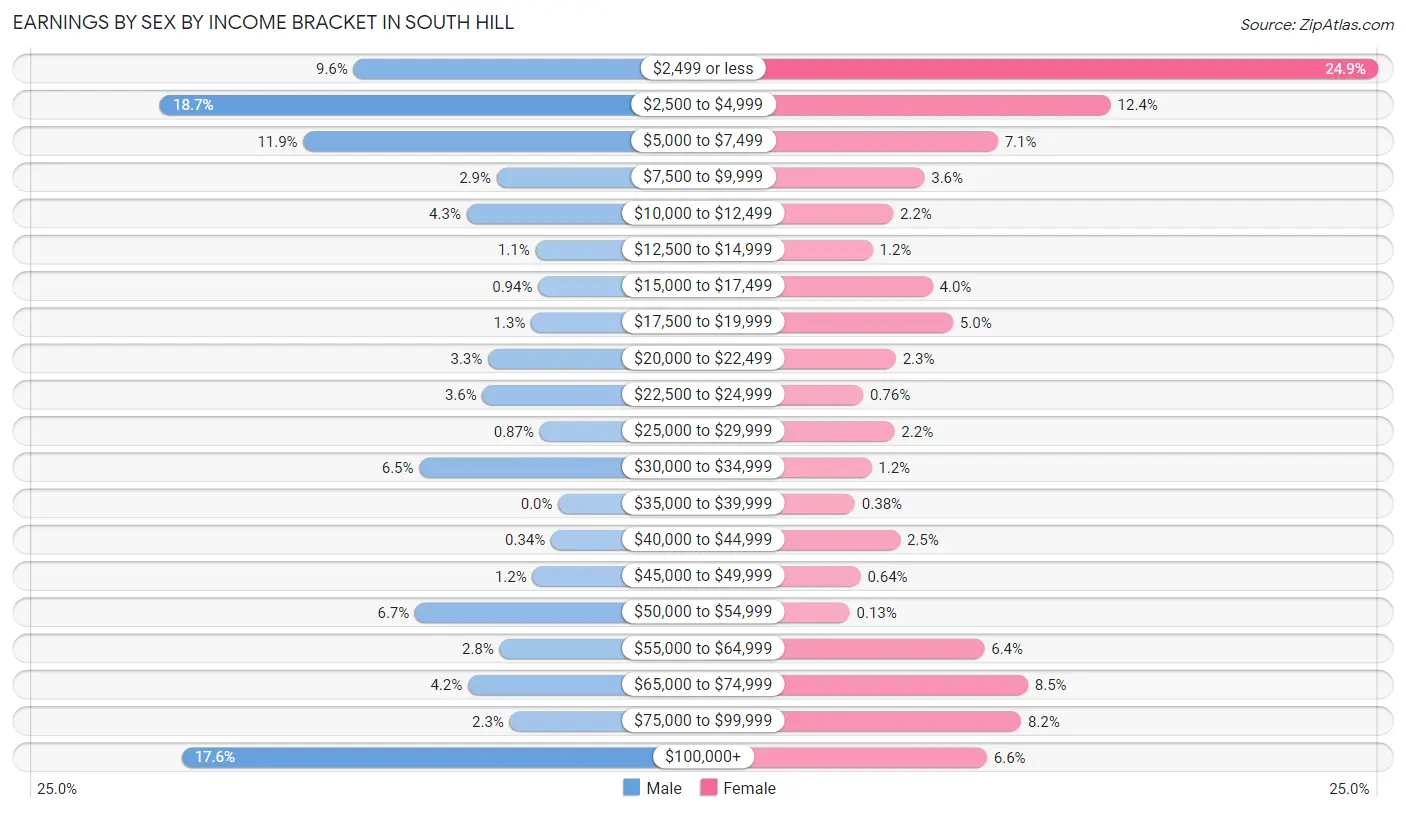
Earnings by Sex by Income Bracket in South Hill
The most common earnings brackets in South Hill are $2,500 to $4,999 for men (278 | 18.6%) and $2,499 or less for women (390 | 24.9%).
| Income | Male | Female |
| $2,499 or less | 143 (9.6%) | 390 (24.9%) |
| $2,500 to $4,999 | 278 (18.6%) | 194 (12.4%) |
| $5,000 to $7,499 | 178 (11.9%) | 111 (7.1%) |
| $7,500 to $9,999 | 43 (2.9%) | 57 (3.6%) |
| $10,000 to $12,499 | 64 (4.3%) | 34 (2.2%) |
| $12,500 to $14,999 | 16 (1.1%) | 19 (1.2%) |
| $15,000 to $17,499 | 14 (0.9%) | 63 (4.0%) |
| $17,500 to $19,999 | 19 (1.3%) | 78 (5.0%) |
| $20,000 to $22,499 | 49 (3.3%) | 36 (2.3%) |
| $22,500 to $24,999 | 53 (3.5%) | 12 (0.8%) |
| $25,000 to $29,999 | 13 (0.9%) | 35 (2.2%) |
| $30,000 to $34,999 | 97 (6.5%) | 18 (1.1%) |
| $35,000 to $39,999 | 0 (0.0%) | 6 (0.4%) |
| $40,000 to $44,999 | 5 (0.3%) | 39 (2.5%) |
| $45,000 to $49,999 | 18 (1.2%) | 10 (0.6%) |
| $50,000 to $54,999 | 100 (6.7%) | 2 (0.1%) |
| $55,000 to $64,999 | 41 (2.8%) | 101 (6.4%) |
| $65,000 to $74,999 | 63 (4.2%) | 133 (8.5%) |
| $75,000 to $99,999 | 34 (2.3%) | 128 (8.2%) |
| $100,000+ | 263 (17.6%) | 103 (6.6%) |
| Total | 1,491 (100.0%) | 1,569 (100.0%) |
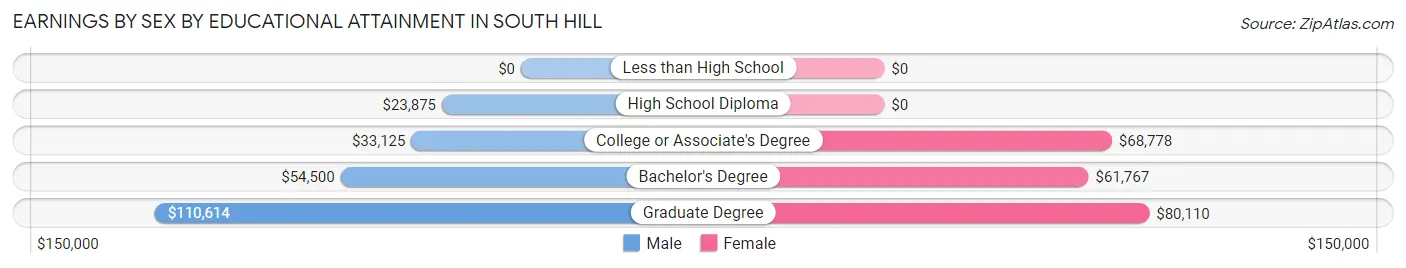
Earnings by Sex by Educational Attainment in South Hill
Average earnings in South Hill are $70,258 for men and $68,280 for women, a difference of 2.8%. Men with an educational attainment of graduate degree enjoy the highest average annual earnings of $110,614, while those with high school diploma education earn the least with $23,875. Women with an educational attainment of graduate degree earn the most with the average annual earnings of $80,110, while those with bachelor's degree education have the smallest earnings of $61,767.
| Educational Attainment | Male Income | Female Income |
| Less than High School | - | - |
| High School Diploma | $23,875 | $0 |
| College or Associate's Degree | $33,125 | $68,778 |
| Bachelor's Degree | $54,500 | $61,767 |
| Graduate Degree | $110,614 | $80,110 |
| Total | $70,258 | $68,280 |
Family Income in South Hill
Family Income Brackets in South Hill
According to the South Hill family income data, there are 169 families falling into the $150,000 to $199,999 income range, which is the most common income bracket and makes up 31.7% of all families.
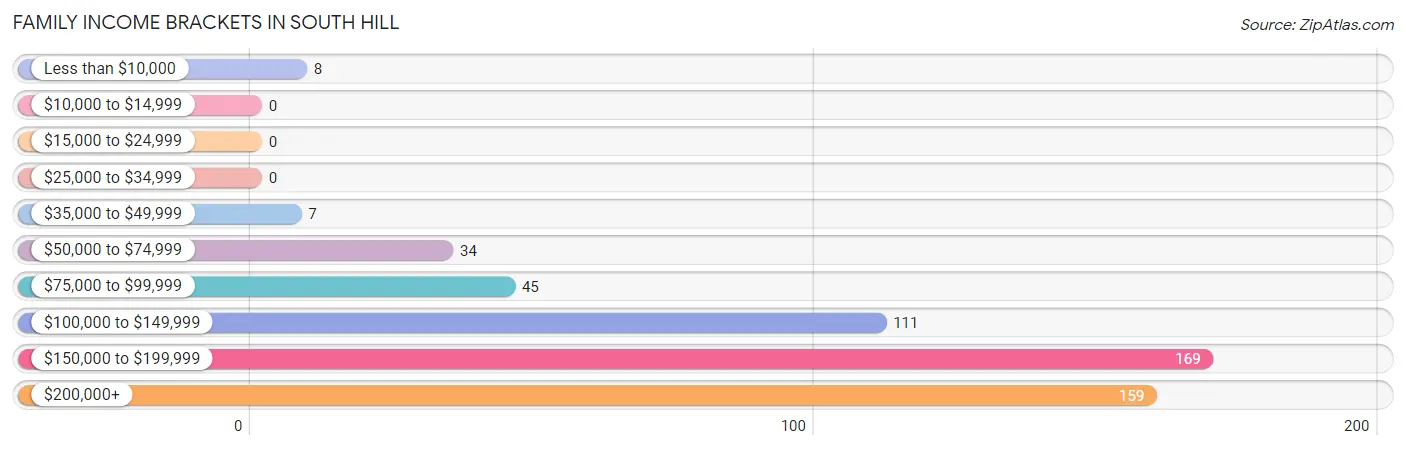
| Income Bracket | # Families | % Families |
| Less than $10,000 | 8 | 1.5% |
| $10,000 to $14,999 | 0 | 0.0% |
| $15,000 to $24,999 | 0 | 0.0% |
| $25,000 to $34,999 | 0 | 0.0% |
| $35,000 to $49,999 | 7 | 1.3% |
| $50,000 to $74,999 | 34 | 6.4% |
| $75,000 to $99,999 | 45 | 8.4% |
| $100,000 to $149,999 | 111 | 20.8% |
| $150,000 to $199,999 | 169 | 31.7% |
| $200,000+ | 159 | 29.8% |
Family Income by Famaliy Size in South Hill
3-person families (121 | 22.7%) account for the highest median family income in South Hill with $206,133 per family, while 3-person families (121 | 22.7%) have the highest median income of $68,711 per family member.
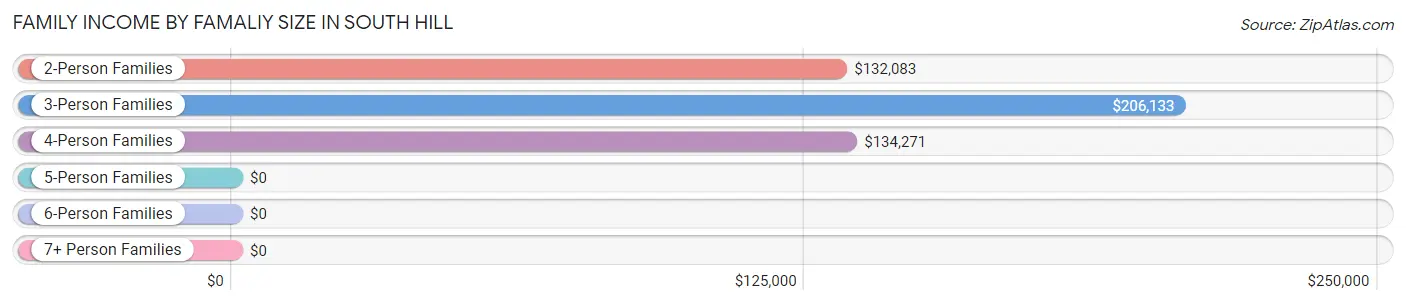
| Income Bracket | # Families | Median Income |
| 2-Person Families | 257 (48.2%) | $132,083 |
| 3-Person Families | 121 (22.7%) | $206,133 |
| 4-Person Families | 112 (21.0%) | $134,271 |
| 5-Person Families | 43 (8.1%) | $0 |
| 6-Person Families | 0 (0.0%) | $0 |
| 7+ Person Families | 0 (0.0%) | $0 |
| Total | 533 (100.0%) | $168,036 |
Family Income by Number of Earners in South Hill
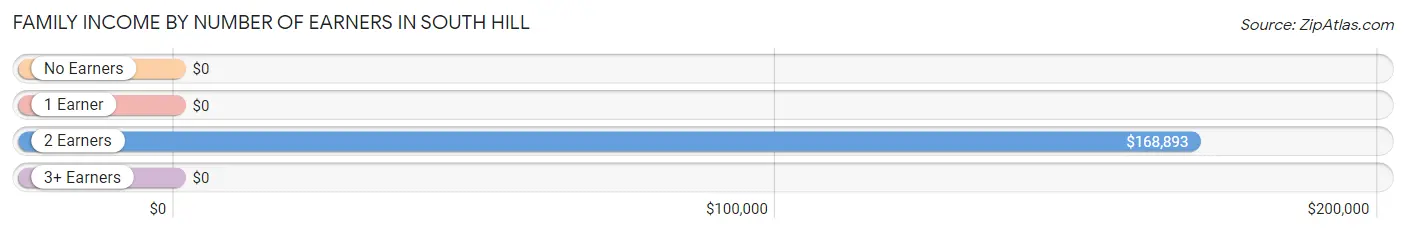
| Number of Earners | # Families | Median Income |
| No Earners | 59 (11.1%) | $0 |
| 1 Earner | 66 (12.4%) | $0 |
| 2 Earners | 361 (67.7%) | $168,893 |
| 3+ Earners | 47 (8.8%) | $0 |
| Total | 533 (100.0%) | $168,036 |
Household Income in South Hill
Household Income Brackets in South Hill
With 285 households falling in the category, the $100,000 to $149,999 income range is the most frequent in South Hill, accounting for 22.3% of all households. In contrast, only 26 households (2.0%) fall into the $25,000 to $34,999 income bracket, making it the least populous group.
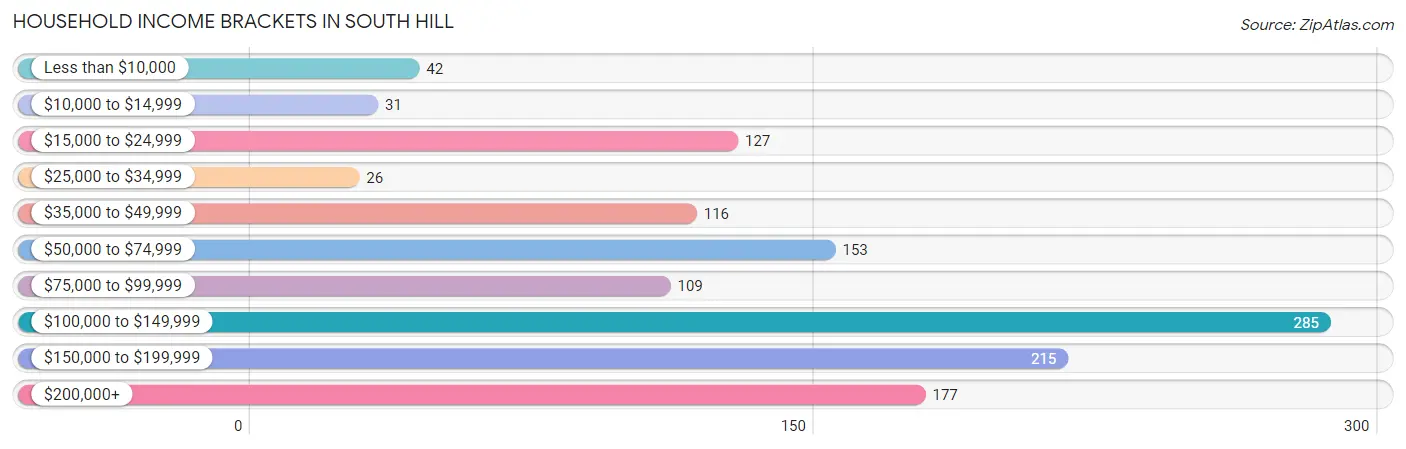
| Income Bracket | # Households | % Households |
| Less than $10,000 | 42 | 3.3% |
| $10,000 to $14,999 | 31 | 2.4% |
| $15,000 to $24,999 | 127 | 9.9% |
| $25,000 to $34,999 | 26 | 2.0% |
| $35,000 to $49,999 | 116 | 9.1% |
| $50,000 to $74,999 | 153 | 12.0% |
| $75,000 to $99,999 | 109 | 8.5% |
| $100,000 to $149,999 | 285 | 22.3% |
| $150,000 to $199,999 | 215 | 16.8% |
| $200,000+ | 177 | 13.8% |
Household Income by Householder Age in South Hill
The median household income in South Hill is $107,536, with the highest median household income of $164,118 found in the 45 to 64 years age bracket for the primary householder. A total of 432 households (33.8%) fall into this category. Meanwhile, the 15 to 24 years age bracket for the primary householder has the lowest median household income of $0, with 189 households (14.8%) in this group.
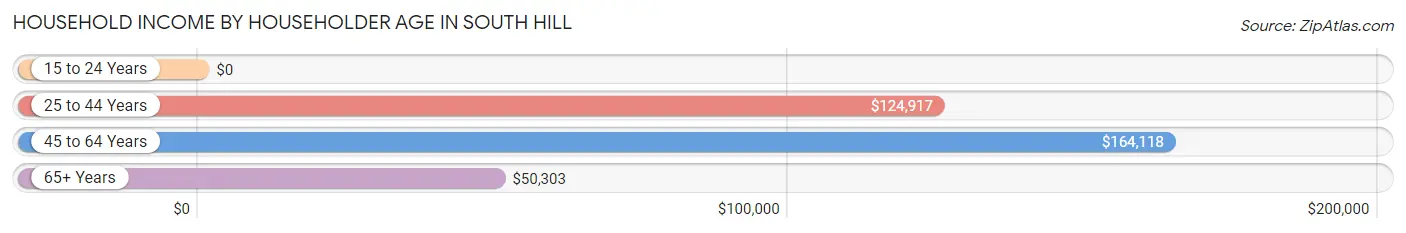
| Income Bracket | # Households | Median Income |
| 15 to 24 Years | 189 (14.8%) | $0 |
| 25 to 44 Years | 322 (25.2%) | $124,917 |
| 45 to 64 Years | 432 (33.8%) | $164,118 |
| 65+ Years | 336 (26.3%) | $50,303 |
| Total | 1,279 (100.0%) | $107,536 |
Poverty in South Hill
Income Below Poverty by Sex and Age in South Hill
With 19.9% poverty level for males and 12.9% for females among the residents of South Hill, 18 to 24 year old males and 18 to 24 year old females are the most vulnerable to poverty, with 218 males (84.2%) and 139 females (45.4%) in their respective age groups living below the poverty level.
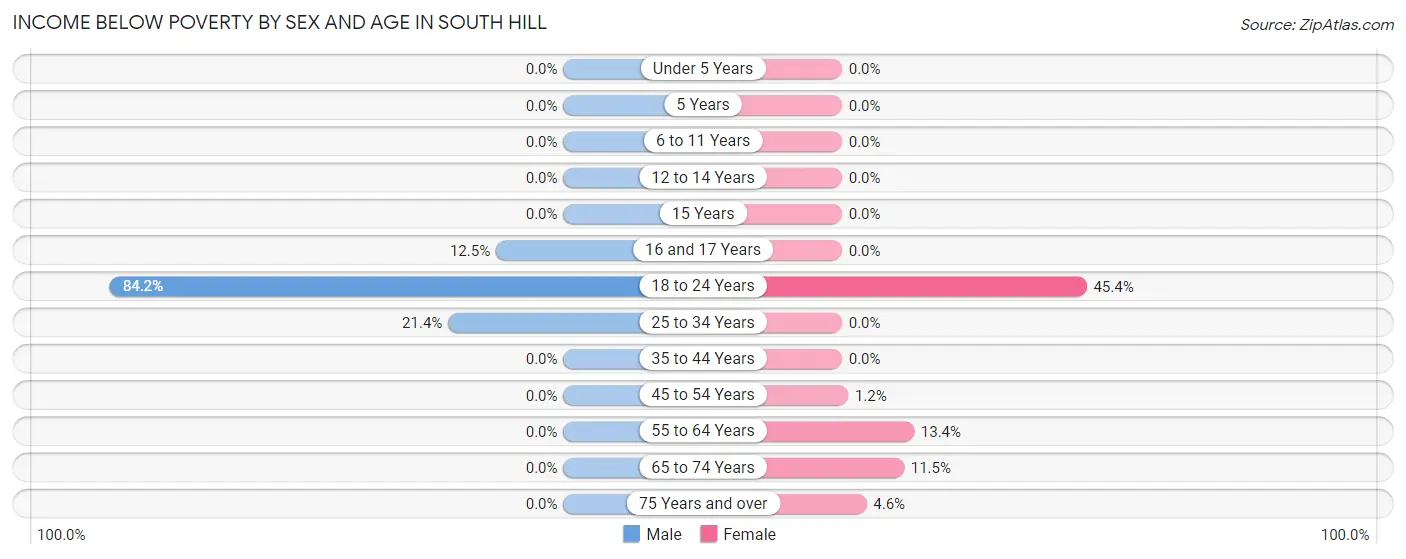
| Age Bracket | Male | Female |
| Under 5 Years | 0 (0.0%) | 0 (0.0%) |
| 5 Years | 0 (0.0%) | 0 (0.0%) |
| 6 to 11 Years | 0 (0.0%) | 0 (0.0%) |
| 12 to 14 Years | 0 (0.0%) | 0 (0.0%) |
| 15 Years | 0 (0.0%) | 0 (0.0%) |
| 16 and 17 Years | 2 (12.5%) | 0 (0.0%) |
| 18 to 24 Years | 218 (84.2%) | 139 (45.4%) |
| 25 to 34 Years | 34 (21.4%) | 0 (0.0%) |
| 35 to 44 Years | 0 (0.0%) | 0 (0.0%) |
| 45 to 54 Years | 0 (0.0%) | 2 (1.1%) |
| 55 to 64 Years | 0 (0.0%) | 21 (13.4%) |
| 65 to 74 Years | 0 (0.0%) | 16 (11.5%) |
| 75 Years and over | 0 (0.0%) | 8 (4.5%) |
| Total | 254 (19.9%) | 186 (12.9%) |
Income Above Poverty by Sex and Age in South Hill
According to the poverty statistics in South Hill, males aged under 5 years and females aged under 5 years are the age groups that are most secure financially, with 100.0% of males and 100.0% of females in these age groups living above the poverty line.
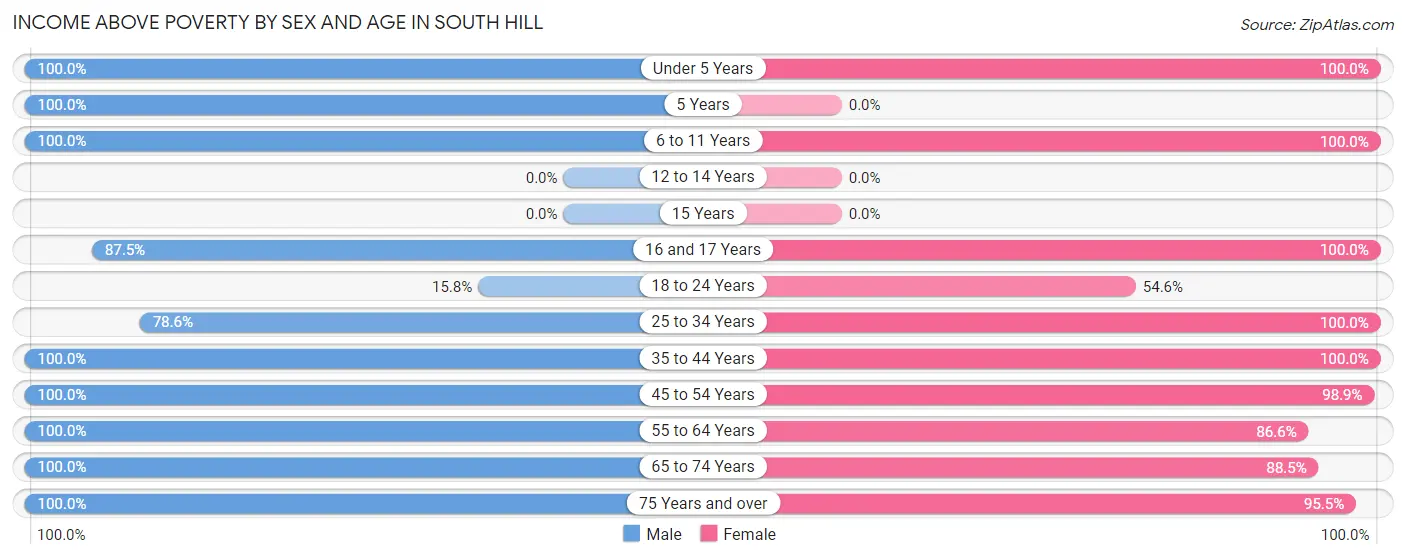
| Age Bracket | Male | Female |
| Under 5 Years | 36 (100.0%) | 35 (100.0%) |
| 5 Years | 37 (100.0%) | 0 (0.0%) |
| 6 to 11 Years | 95 (100.0%) | 126 (100.0%) |
| 12 to 14 Years | 0 (0.0%) | 0 (0.0%) |
| 15 Years | 0 (0.0%) | 0 (0.0%) |
| 16 and 17 Years | 14 (87.5%) | 18 (100.0%) |
| 18 to 24 Years | 41 (15.8%) | 167 (54.6%) |
| 25 to 34 Years | 125 (78.6%) | 135 (100.0%) |
| 35 to 44 Years | 159 (100.0%) | 173 (100.0%) |
| 45 to 54 Years | 121 (100.0%) | 172 (98.9%) |
| 55 to 64 Years | 239 (100.0%) | 136 (86.6%) |
| 65 to 74 Years | 62 (100.0%) | 123 (88.5%) |
| 75 Years and over | 95 (100.0%) | 168 (95.5%) |
| Total | 1,024 (80.1%) | 1,253 (87.1%) |
Income Below Poverty Among Married-Couple Families in South Hill
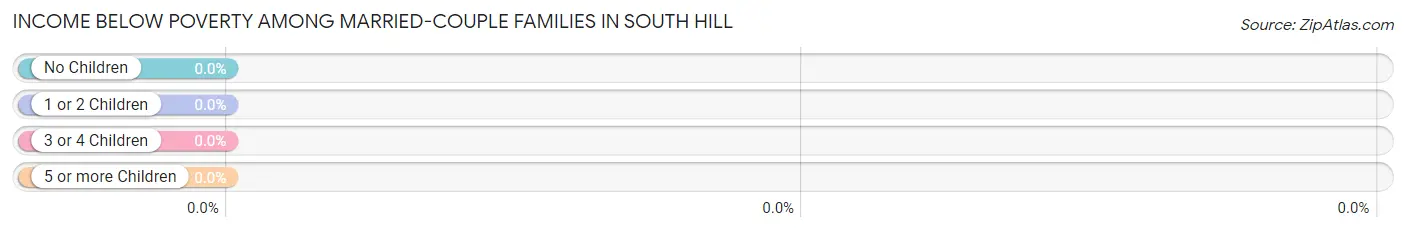
| Children | Above Poverty | Below Poverty |
| No Children | 324 (100.0%) | 0 (0.0%) |
| 1 or 2 Children | 158 (100.0%) | 0 (0.0%) |
| 3 or 4 Children | 43 (100.0%) | 0 (0.0%) |
| 5 or more Children | 0 (0.0%) | 0 (0.0%) |
| Total | 525 (100.0%) | 0 (0.0%) |
Income Below Poverty Among Single-Parent Households in South Hill
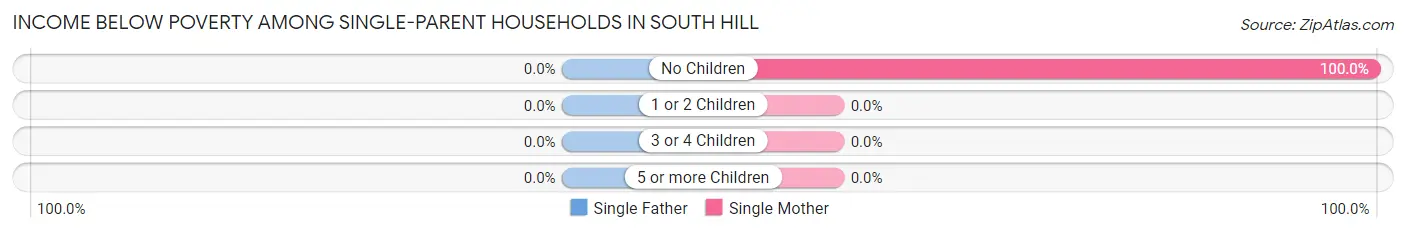
| Children | Single Father | Single Mother |
| No Children | 0 (0.0%) | 8 (100.0%) |
| 1 or 2 Children | 0 (0.0%) | 0 (0.0%) |
| 3 or 4 Children | 0 (0.0%) | 0 (0.0%) |
| 5 or more Children | 0 (0.0%) | 0 (0.0%) |
| Total | 0 (0.0%) | 8 (100.0%) |
Income Below Poverty Among Married-Couple vs Single-Parent Households in South Hill
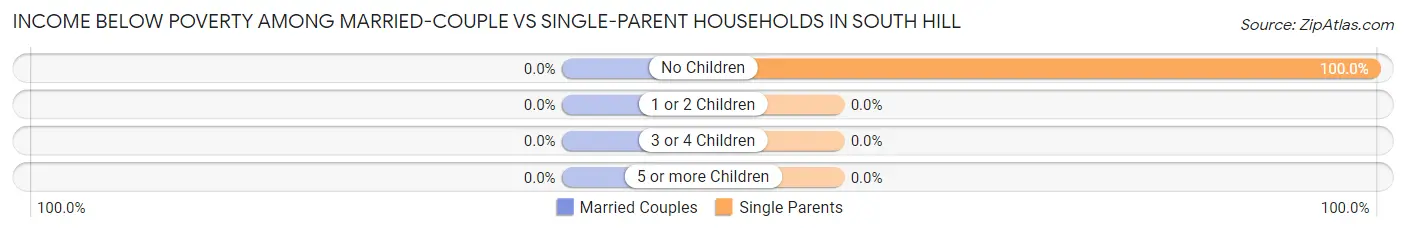
| Children | Married-Couple Families | Single-Parent Households |
| No Children | 0 (0.0%) | 8 (100.0%) |
| 1 or 2 Children | 0 (0.0%) | 0 (0.0%) |
| 3 or 4 Children | 0 (0.0%) | 0 (0.0%) |
| 5 or more Children | 0 (0.0%) | 0 (0.0%) |
| Total | 0 (0.0%) | 8 (100.0%) |
Race in South Hill
The most populous races in South Hill are White / Caucasian (4,834 | 73.1%), Asian (635 | 9.6%), and Hispanic or Latino (561 | 8.5%).
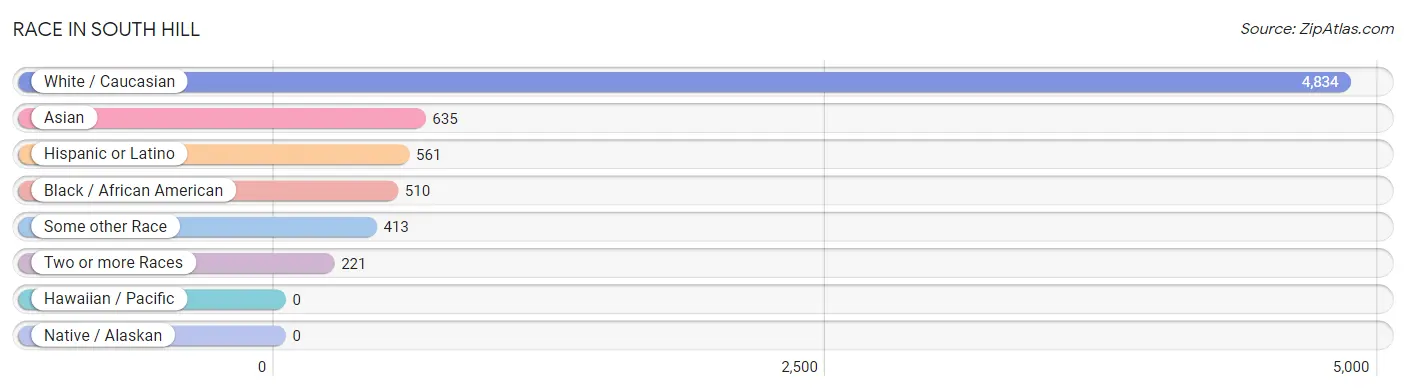
| Race | # Population | % Population |
| Asian | 635 | 9.6% |
| Black / African American | 510 | 7.7% |
| Hawaiian / Pacific | 0 | 0.0% |
| Hispanic or Latino | 561 | 8.5% |
| Native / Alaskan | 0 | 0.0% |
| White / Caucasian | 4,834 | 73.1% |
| Two or more Races | 221 | 3.3% |
| Some other Race | 413 | 6.2% |
| Total | 6,613 | 100.0% |
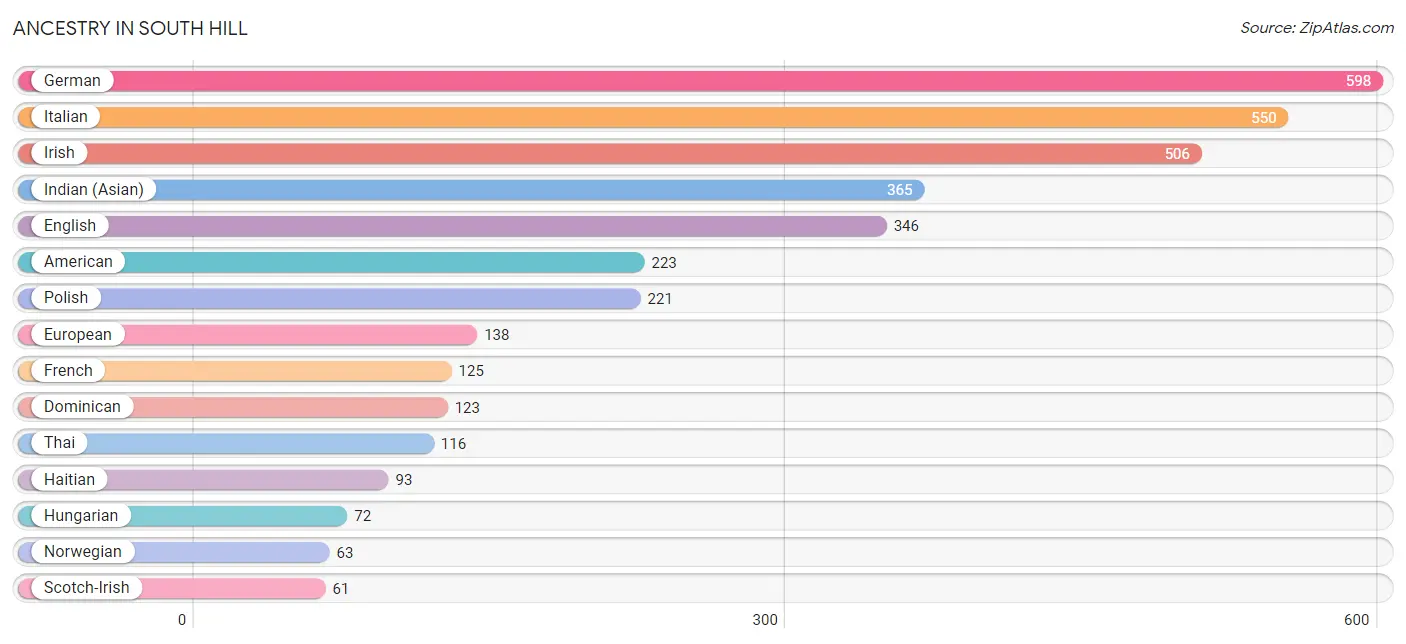
Ancestry in South Hill
The most populous ancestries reported in South Hill are German (598 | 9.0%), Italian (550 | 8.3%), Irish (506 | 7.6%), Indian (Asian) (365 | 5.5%), and English (346 | 5.2%), together accounting for 35.8% of all South Hill residents.
| Ancestry | # Population | % Population |
| American | 223 | 3.4% |
| Apache | 24 | 0.4% |
| Arab | 10 | 0.2% |
| Armenian | 5 | 0.1% |
| Austrian | 44 | 0.7% |
| Blackfeet | 1 | 0.0% |
| Bolivian | 14 | 0.2% |
| British | 54 | 0.8% |
| Burmese | 19 | 0.3% |
| Canadian | 45 | 0.7% |
| Central American | 48 | 0.7% |
| Czech | 30 | 0.4% |
| Dominican | 123 | 1.9% |
| Dutch | 42 | 0.6% |
| Eastern European | 37 | 0.6% |
| Ecuadorian | 19 | 0.3% |
| English | 346 | 5.2% |
| European | 138 | 2.1% |
| Filipino | 5 | 0.1% |
| French | 125 | 1.9% |
| French Canadian | 11 | 0.2% |
| German | 598 | 9.0% |
| Greek | 28 | 0.4% |
| Guatemalan | 27 | 0.4% |
| Haitian | 93 | 1.4% |
| Honduran | 10 | 0.2% |
| Hungarian | 72 | 1.1% |
| Indian (Asian) | 365 | 5.5% |
| Irish | 506 | 7.6% |
| Italian | 550 | 8.3% |
| Jamaican | 2 | 0.0% |
| Jordanian | 10 | 0.2% |
| Korean | 9 | 0.1% |
| Lithuanian | 31 | 0.5% |
| Mexican | 35 | 0.5% |
| Norwegian | 63 | 0.9% |
| Pakistani | 2 | 0.0% |
| Panamanian | 8 | 0.1% |
| Polish | 221 | 3.3% |
| Portuguese | 7 | 0.1% |
| Puerto Rican | 28 | 0.4% |
| Russian | 31 | 0.5% |
| Salvadoran | 3 | 0.1% |
| Scotch-Irish | 61 | 0.9% |
| Scottish | 55 | 0.8% |
| Sierra Leonean | 6 | 0.1% |
| Slovene | 8 | 0.1% |
| South American | 35 | 0.5% |
| Subsaharan African | 18 | 0.3% |
| Swedish | 22 | 0.3% |
| Thai | 116 | 1.8% |
| Ukrainian | 40 | 0.6% |
| Vietnamese | 24 | 0.4% |
| Welsh | 61 | 0.9% | View All 54 Rows |
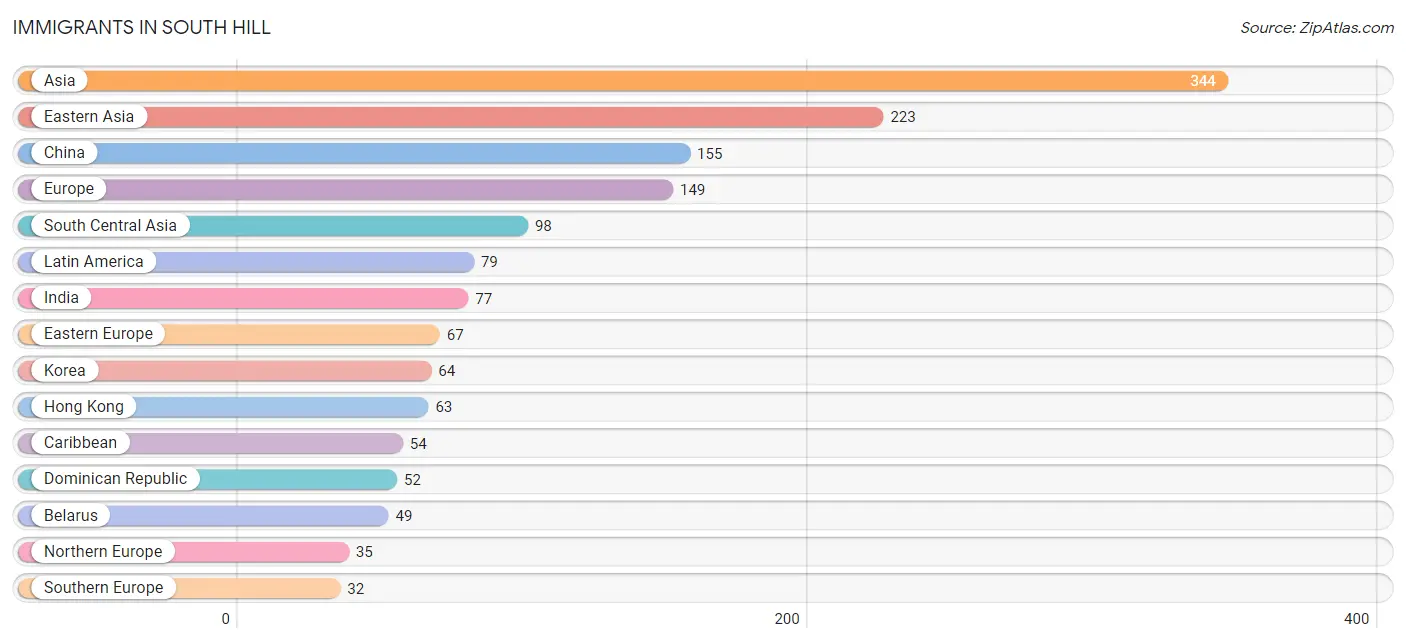
Immigrants in South Hill
The most numerous immigrant groups reported in South Hill came from Asia (344 | 5.2%), Eastern Asia (223 | 3.4%), China (155 | 2.3%), Europe (149 | 2.2%), and South Central Asia (98 | 1.5%), together accounting for 14.6% of all South Hill residents.
| Immigration Origin | # Population | % Population |
| Africa | 24 | 0.4% |
| Asia | 344 | 5.2% |
| Australia | 11 | 0.2% |
| Bangladesh | 21 | 0.3% |
| Belarus | 49 | 0.7% |
| Belgium | 15 | 0.2% |
| Bolivia | 9 | 0.1% |
| Canada | 31 | 0.5% |
| Caribbean | 54 | 0.8% |
| Central America | 4 | 0.1% |
| China | 155 | 2.3% |
| Colombia | 1 | 0.0% |
| Dominican Republic | 52 | 0.8% |
| Eastern Africa | 15 | 0.2% |
| Eastern Asia | 223 | 3.4% |
| Eastern Europe | 67 | 1.0% |
| El Salvador | 4 | 0.1% |
| England | 13 | 0.2% |
| Ethiopia | 12 | 0.2% |
| Europe | 149 | 2.2% |
| Hong Kong | 63 | 0.9% |
| India | 77 | 1.2% |
| Italy | 24 | 0.4% |
| Jamaica | 2 | 0.0% |
| Japan | 4 | 0.1% |
| Jordan | 10 | 0.2% |
| Korea | 64 | 1.0% |
| Latin America | 79 | 1.2% |
| Malaysia | 6 | 0.1% |
| Northern Europe | 35 | 0.5% |
| Oceania | 11 | 0.2% |
| Peru | 11 | 0.2% |
| Portugal | 8 | 0.1% |
| Romania | 18 | 0.3% |
| Singapore | 7 | 0.1% |
| South America | 21 | 0.3% |
| South Central Asia | 98 | 1.5% |
| South Eastern Asia | 13 | 0.2% |
| Southern Europe | 32 | 0.5% |
| Western Africa | 9 | 0.1% |
| Western Asia | 10 | 0.2% |
| Western Europe | 15 | 0.2% | View All 42 Rows |
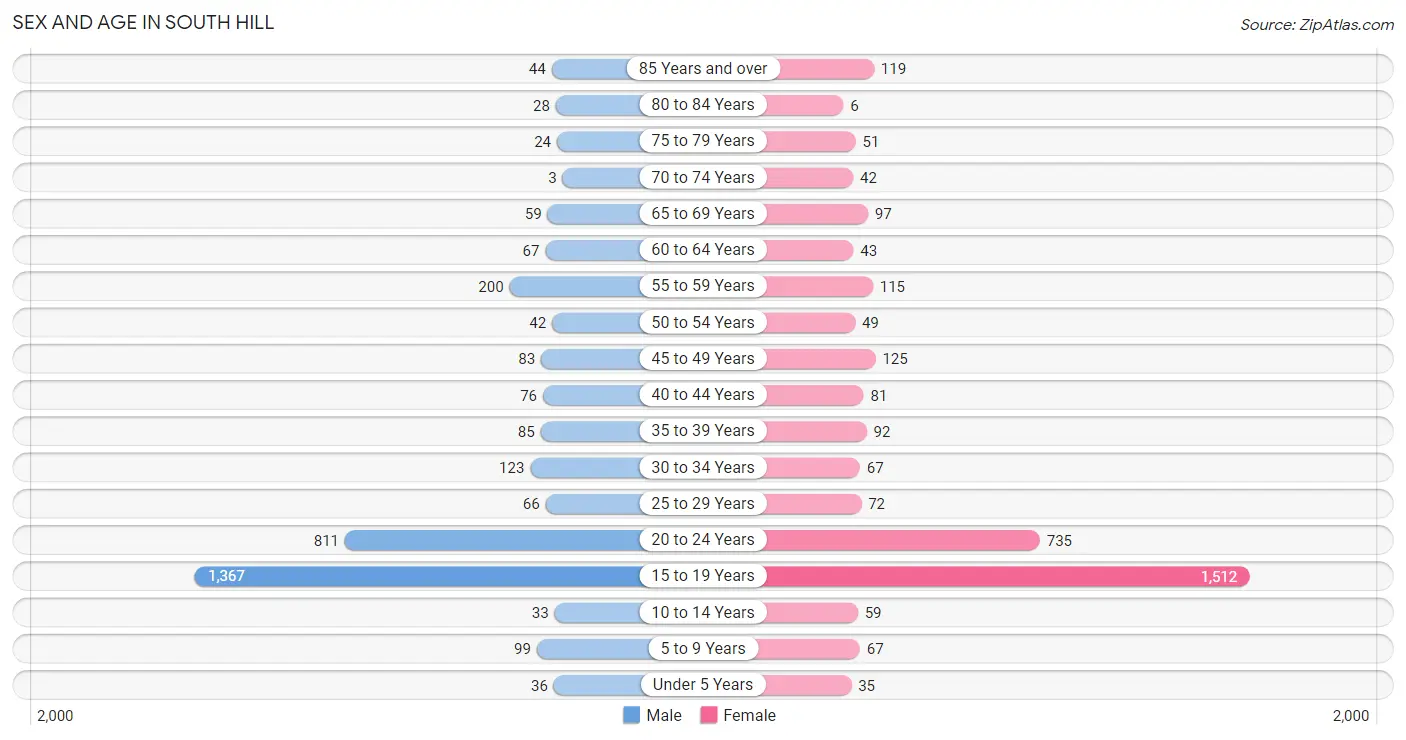
Sex and Age in South Hill
Sex and Age in South Hill
The most populous age groups in South Hill are 15 to 19 Years (1,367 | 42.1%) for men and 15 to 19 Years (1,512 | 44.9%) for women.
| Age Bracket | Male | Female |
| Under 5 Years | 36 (1.1%) | 35 (1.0%) |
| 5 to 9 Years | 99 (3.0%) | 67 (2.0%) |
| 10 to 14 Years | 33 (1.0%) | 59 (1.8%) |
| 15 to 19 Years | 1,367 (42.1%) | 1,512 (44.9%) |
| 20 to 24 Years | 811 (25.0%) | 735 (21.8%) |
| 25 to 29 Years | 66 (2.0%) | 72 (2.1%) |
| 30 to 34 Years | 123 (3.8%) | 67 (2.0%) |
| 35 to 39 Years | 85 (2.6%) | 92 (2.7%) |
| 40 to 44 Years | 76 (2.3%) | 81 (2.4%) |
| 45 to 49 Years | 83 (2.6%) | 125 (3.7%) |
| 50 to 54 Years | 42 (1.3%) | 49 (1.5%) |
| 55 to 59 Years | 200 (6.2%) | 115 (3.4%) |
| 60 to 64 Years | 67 (2.1%) | 43 (1.3%) |
| 65 to 69 Years | 59 (1.8%) | 97 (2.9%) |
| 70 to 74 Years | 3 (0.1%) | 42 (1.3%) |
| 75 to 79 Years | 24 (0.7%) | 51 (1.5%) |
| 80 to 84 Years | 28 (0.9%) | 6 (0.2%) |
| 85 Years and over | 44 (1.4%) | 119 (3.5%) |
| Total | 3,246 (100.0%) | 3,367 (100.0%) |
Families and Households in South Hill
Median Family Size in South Hill
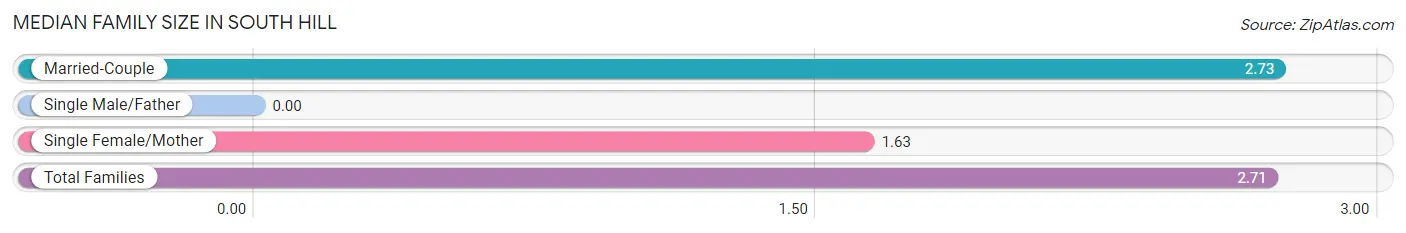
| Family Type | # Families | Family Size |
| Married-Couple | 525 (98.5%) | 2.73 |
| Single Male/Father | 0 (0.0%) | - |
| Single Female/Mother | 8 (1.5%) | 1.63 |
| Total Families | 533 (100.0%) | 2.71 |
Median Household Size in South Hill
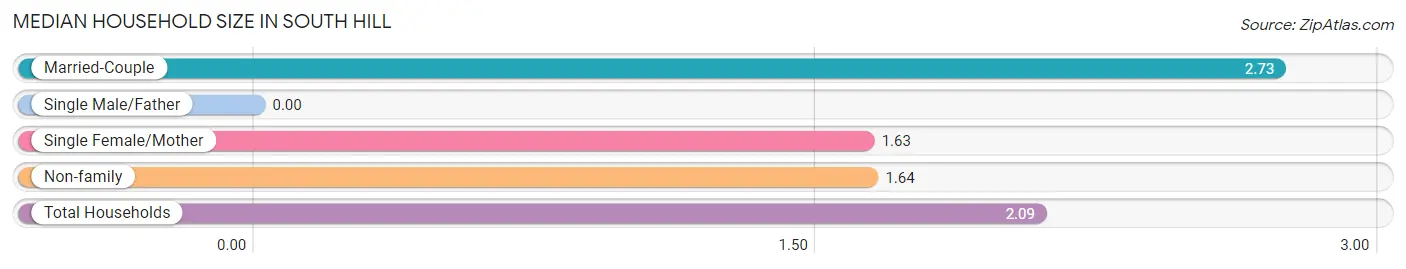
| Household Type | # Households | Household Size |
| Married-Couple | 525 (41.0%) | 2.73 |
| Single Male/Father | 0 (0.0%) | - |
| Single Female/Mother | 8 (0.6%) | 1.63 |
| Non-family | 746 (58.3%) | 1.64 |
| Total Households | 1,279 (100.0%) | 2.09 |
Household Size by Marriage Status in South Hill
Out of a total of 1,279 households in South Hill, 533 (41.7%) are family households, while 746 (58.3%) are nonfamily households. The most numerous type of family households are 2-person households, comprising 257, and the most common type of nonfamily households are 1-person households, comprising 445.
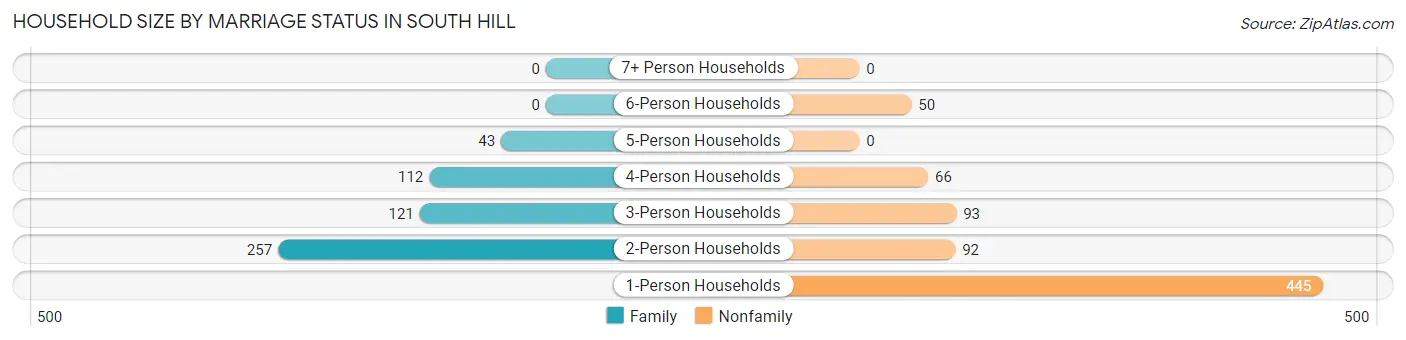
| Household Size | Family Households | Nonfamily Households |
| 1-Person Households | - | 445 (34.8%) |
| 2-Person Households | 257 (20.1%) | 92 (7.2%) |
| 3-Person Households | 121 (9.5%) | 93 (7.3%) |
| 4-Person Households | 112 (8.8%) | 66 (5.2%) |
| 5-Person Households | 43 (3.4%) | 0 (0.0%) |
| 6-Person Households | 0 (0.0%) | 50 (3.9%) |
| 7+ Person Households | 0 (0.0%) | 0 (0.0%) |
| Total | 533 (41.7%) | 746 (58.3%) |
Female Fertility in South Hill
Fertility by Age in South Hill
| Age Bracket | Women with Births | Births / 1,000 Women |
| 15 to 19 years | 0 (0.0%) | 0.0 |
| 20 to 34 years | 0 (0.0%) | 0.0 |
| 35 to 50 years | 0 (0.0%) | 0.0 |
| Total | 0 (0.0%) | 0.0 |
Fertility by Age by Marriage Status in South Hill
| Age Bracket | Married | Unmarried |
| 15 to 19 years | 0 (0.0%) | 0 (0.0%) |
| 20 to 34 years | 0 (0.0%) | 0 (0.0%) |
| 35 to 50 years | 0 (0.0%) | 0 (0.0%) |
| Total | 0 (0.0%) | 0 (0.0%) |
Fertility by Education in South Hill
| Educational Attainment | Women with Births | Births / 1,000 Women |
| Less than High School | 0 (0.0%) | 0.0 |
| High School Diploma | 0 (0.0%) | 0.0 |
| College or Associate's Degree | 0 (0.0%) | 0.0 |
| Bachelor's Degree | 0 (0.0%) | 0.0 |
| Graduate Degree | 0 (0.0%) | 0.0 |
| Total | 0 (0.0%) | 0.0 |
Fertility by Education by Marriage Status in South Hill
| Educational Attainment | Married | Unmarried |
| Less than High School | 0 (0.0%) | 0 (0.0%) |
| High School Diploma | 0 (0.0%) | 0 (0.0%) |
| College or Associate's Degree | 0 (0.0%) | 0 (0.0%) |
| Bachelor's Degree | 0 (0.0%) | 0 (0.0%) |
| Graduate Degree | 0 (0.0%) | 0 (0.0%) |
| Total | 0 (0.0%) | 0 (0.0%) |
Employment Characteristics in South Hill
Employment by Class of Employer in South Hill
Among the 2,125 employed individuals in South Hill, private company employees (702 | 33.0%), not-for-profit organizations (642 | 30.2%), and state government employees (399 | 18.8%) make up the most common classes of employment.
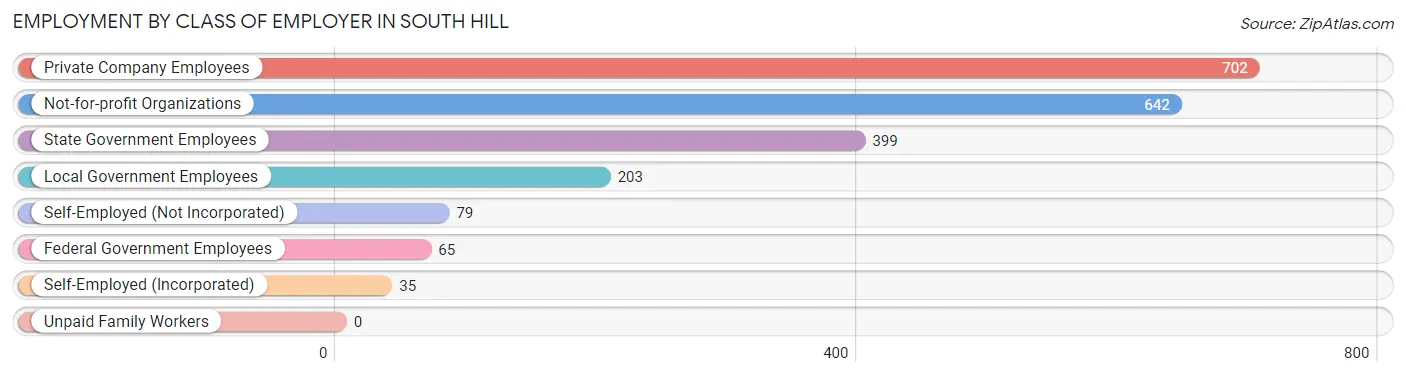
| Employer Class | # Employees | % Employees |
| Private Company Employees | 702 | 33.0% |
| Self-Employed (Incorporated) | 35 | 1.7% |
| Self-Employed (Not Incorporated) | 79 | 3.7% |
| Not-for-profit Organizations | 642 | 30.2% |
| Local Government Employees | 203 | 9.6% |
| State Government Employees | 399 | 18.8% |
| Federal Government Employees | 65 | 3.1% |
| Unpaid Family Workers | 0 | 0.0% |
| Total | 2,125 | 100.0% |
Employment Status by Age in South Hill
According to the labor force statistics for South Hill, out of the total population over 16 years of age (6,284), 36.8% or 2,313 individuals are in the labor force, with 3.5% or 81 of them unemployed. The age group with the highest labor force participation rate is 45 to 54 years, with 98.0% or 293 individuals in the labor force. Within the labor force, the 45 to 54 years age range has the highest percentage of unemployed individuals, with 17.1% or 50 of them being unemployed.
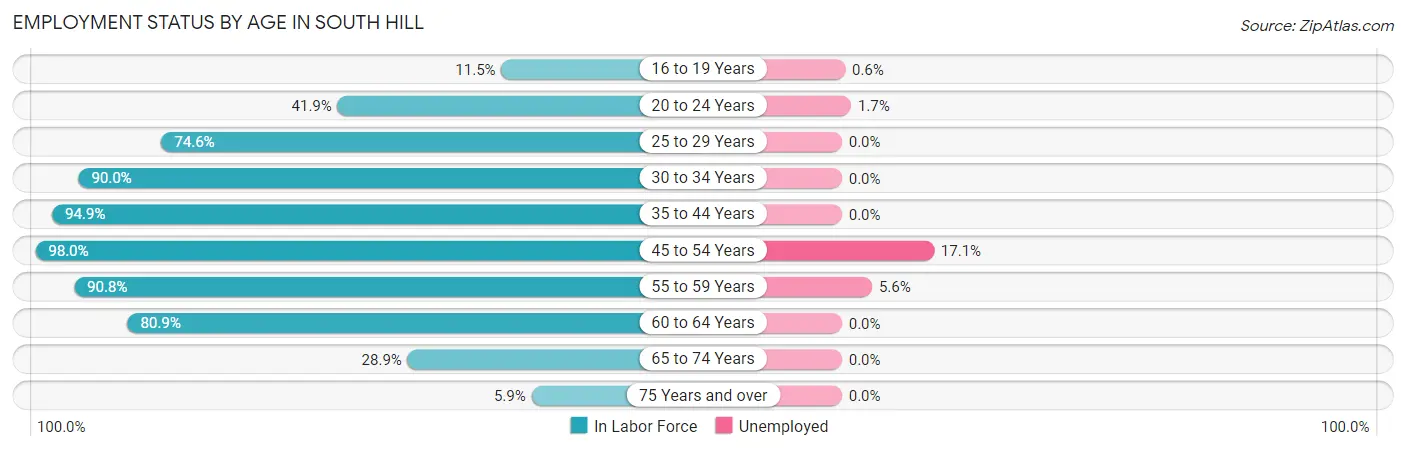
| Age Bracket | In Labor Force | Unemployed |
| 16 to 19 Years | 331 (11.5%) | 2 (0.6%) |
| 20 to 24 Years | 648 (41.9%) | 11 (1.7%) |
| 25 to 29 Years | 103 (74.6%) | 0 (0.0%) |
| 30 to 34 Years | 171 (90.0%) | 0 (0.0%) |
| 35 to 44 Years | 317 (94.9%) | 0 (0.0%) |
| 45 to 54 Years | 293 (98.0%) | 50 (17.1%) |
| 55 to 59 Years | 286 (90.8%) | 16 (5.6%) |
| 60 to 64 Years | 89 (80.9%) | 0 (0.0%) |
| 65 to 74 Years | 58 (28.9%) | 0 (0.0%) |
| 75 Years and over | 16 (5.9%) | 0 (0.0%) |
| Total | 2,313 (36.8%) | 81 (3.5%) |
Employment Status by Educational Attainment in South Hill
According to labor force statistics for South Hill, 90.8% of individuals (1,258) out of the total population between 25 and 64 years of age (1,386) are in the labor force, with 5.5% or 69 of them being unemployed. The group with the highest labor force participation rate are those with the educational attainment of bachelor's degree or higher, with 99.1% or 963 individuals in the labor force. Within the labor force, individuals with high school diploma education have the highest percentage of unemployment, with 48.5% or 50 of them being unemployed.
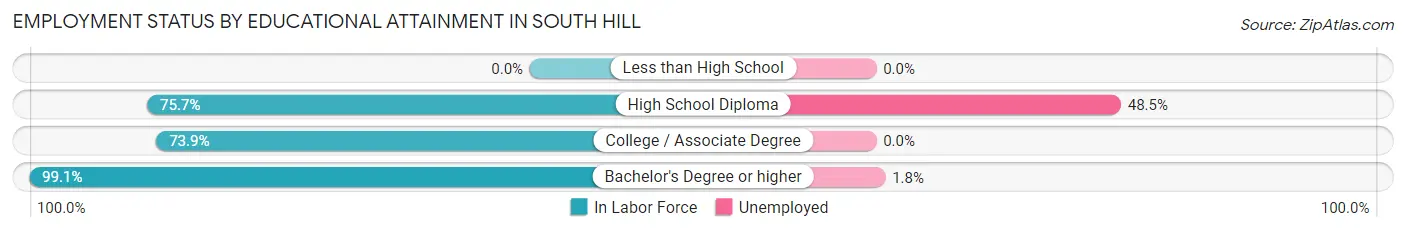
| Educational Attainment | In Labor Force | Unemployed |
| Less than High School | 0 (0.0%) | 0 (0.0%) |
| High School Diploma | 103 (75.7%) | 66 (48.5%) |
| College / Associate Degree | 193 (73.9%) | 0 (0.0%) |
| Bachelor's Degree or higher | 963 (99.1%) | 17 (1.8%) |
| Total | 1,258 (90.8%) | 76 (5.5%) |
Employment Occupations by Sex in South Hill
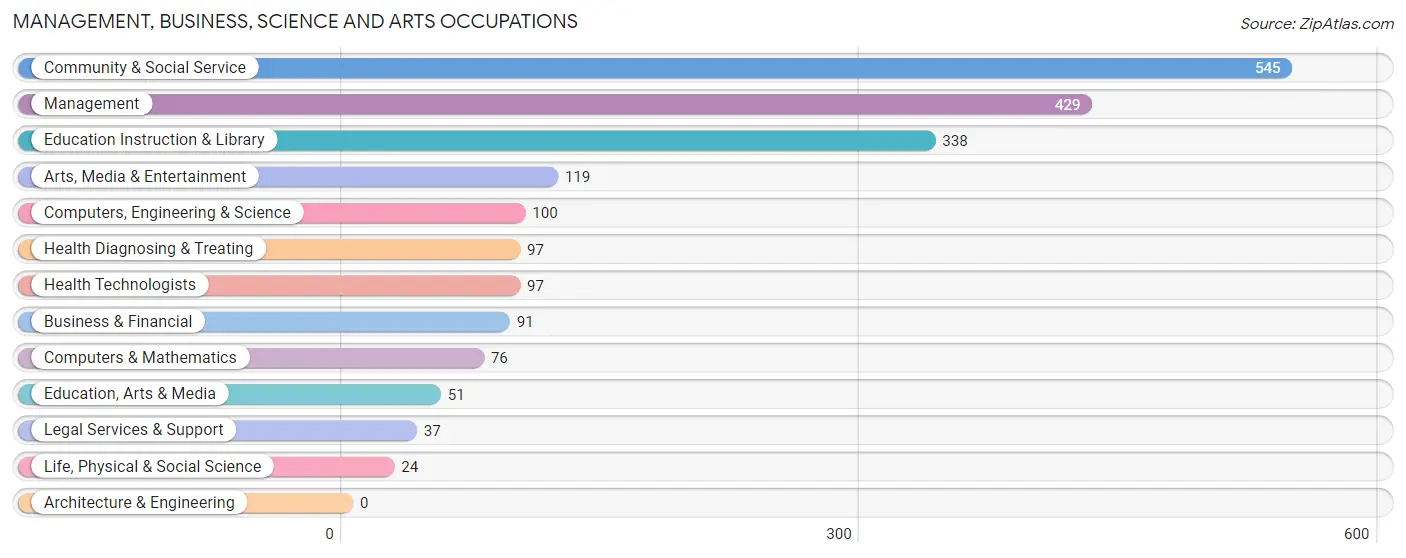
Management, Business, Science and Arts Occupations
The most common Management, Business, Science and Arts occupations in South Hill are Community & Social Service (545 | 25.0%), Management (429 | 19.7%), Education Instruction & Library (338 | 15.5%), Arts, Media & Entertainment (119 | 5.5%), and Computers, Engineering & Science (100 | 4.6%).
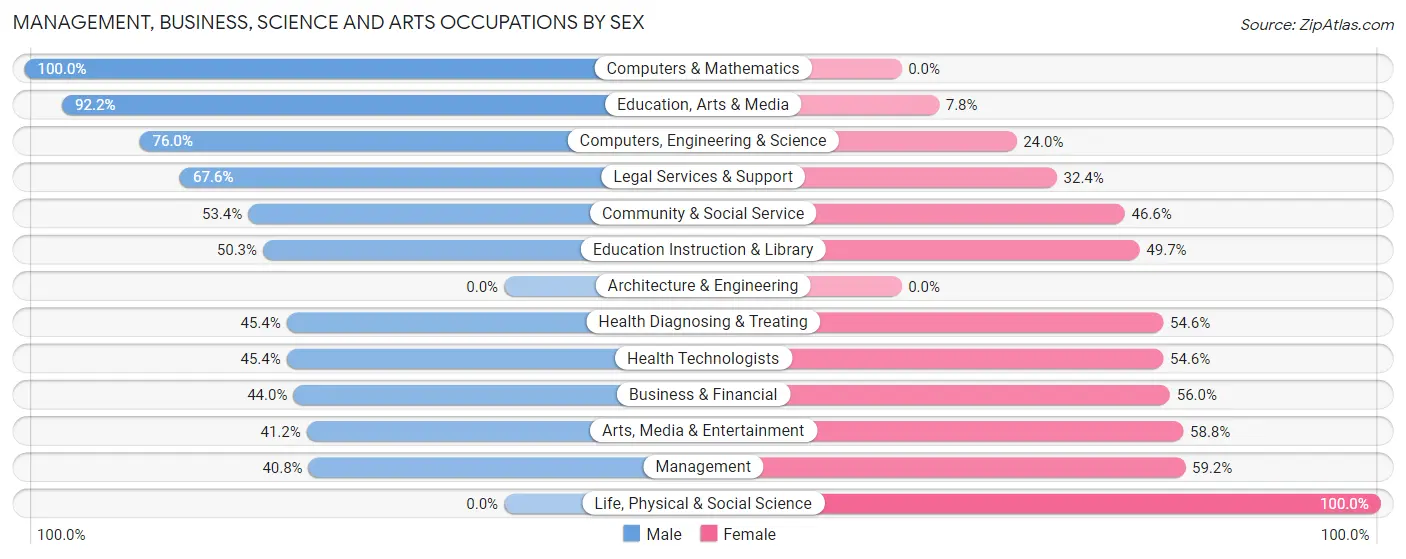
Management, Business, Science and Arts Occupations by Sex
Within the Management, Business, Science and Arts occupations in South Hill, the most male-oriented occupations are Computers & Mathematics (100.0%), Education, Arts & Media (92.2%), and Computers, Engineering & Science (76.0%), while the most female-oriented occupations are Life, Physical & Social Science (100.0%), Management (59.2%), and Arts, Media & Entertainment (58.8%).
| Occupation | Male | Female |
| Management | 175 (40.8%) | 254 (59.2%) |
| Business & Financial | 40 (44.0%) | 51 (56.0%) |
| Computers, Engineering & Science | 76 (76.0%) | 24 (24.0%) |
| Computers & Mathematics | 76 (100.0%) | 0 (0.0%) |
| Architecture & Engineering | 0 (0.0%) | 0 (0.0%) |
| Life, Physical & Social Science | 0 (0.0%) | 24 (100.0%) |
| Community & Social Service | 291 (53.4%) | 254 (46.6%) |
| Education, Arts & Media | 47 (92.2%) | 4 (7.8%) |
| Legal Services & Support | 25 (67.6%) | 12 (32.4%) |
| Education Instruction & Library | 170 (50.3%) | 168 (49.7%) |
| Arts, Media & Entertainment | 49 (41.2%) | 70 (58.8%) |
| Health Diagnosing & Treating | 44 (45.4%) | 53 (54.6%) |
| Health Technologists | 44 (45.4%) | 53 (54.6%) |
| Total (Category) | 626 (49.6%) | 636 (50.4%) |
| Total (Overall) | 1,012 (46.4%) | 1,167 (53.6%) |
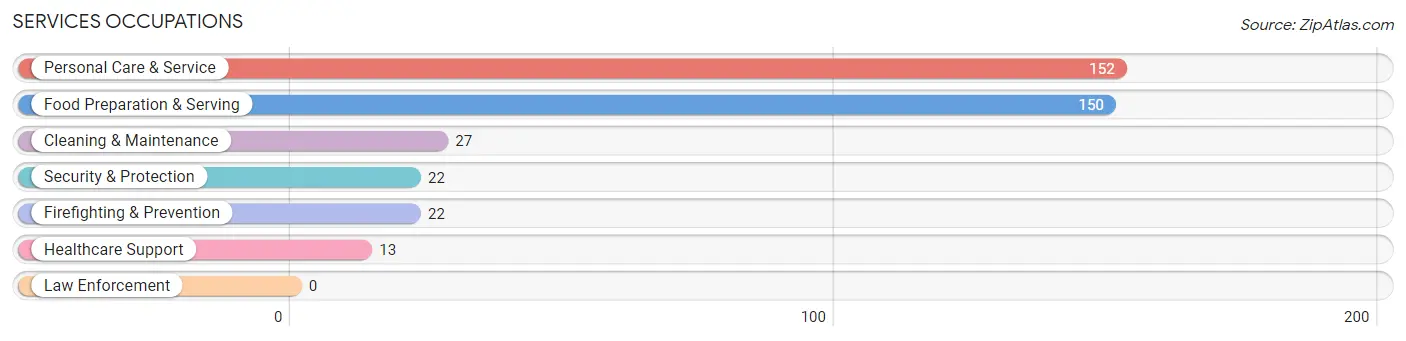
Services Occupations
The most common Services occupations in South Hill are Personal Care & Service (152 | 7.0%), Food Preparation & Serving (150 | 6.9%), Cleaning & Maintenance (27 | 1.2%), Security & Protection (22 | 1.0%), and Firefighting & Prevention (22 | 1.0%).
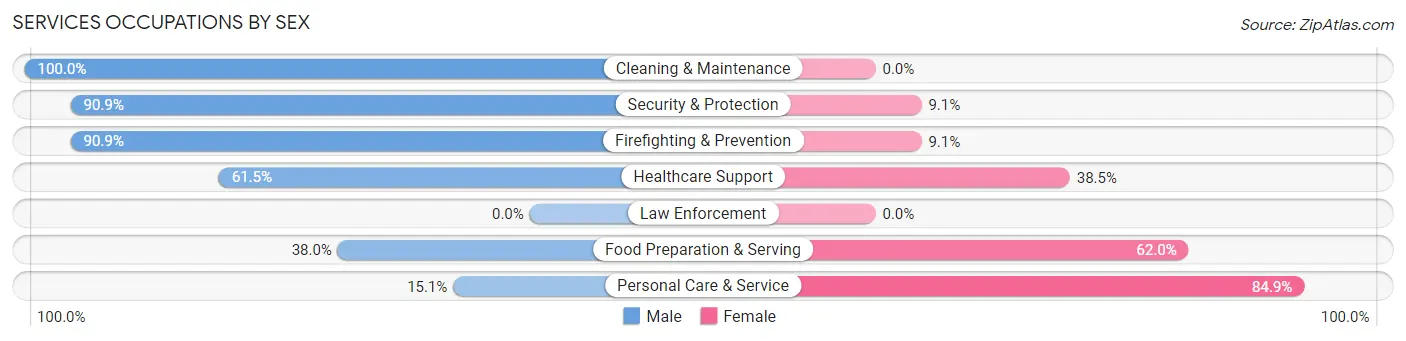
Services Occupations by Sex
Within the Services occupations in South Hill, the most male-oriented occupations are Cleaning & Maintenance (100.0%), Security & Protection (90.9%), and Firefighting & Prevention (90.9%), while the most female-oriented occupations are Personal Care & Service (84.9%), Food Preparation & Serving (62.0%), and Healthcare Support (38.5%).
| Occupation | Male | Female |
| Healthcare Support | 8 (61.5%) | 5 (38.5%) |
| Security & Protection | 20 (90.9%) | 2 (9.1%) |
| Firefighting & Prevention | 20 (90.9%) | 2 (9.1%) |
| Law Enforcement | 0 (0.0%) | 0 (0.0%) |
| Food Preparation & Serving | 57 (38.0%) | 93 (62.0%) |
| Cleaning & Maintenance | 27 (100.0%) | 0 (0.0%) |
| Personal Care & Service | 23 (15.1%) | 129 (84.9%) |
| Total (Category) | 135 (37.1%) | 229 (62.9%) |
| Total (Overall) | 1,012 (46.4%) | 1,167 (53.6%) |
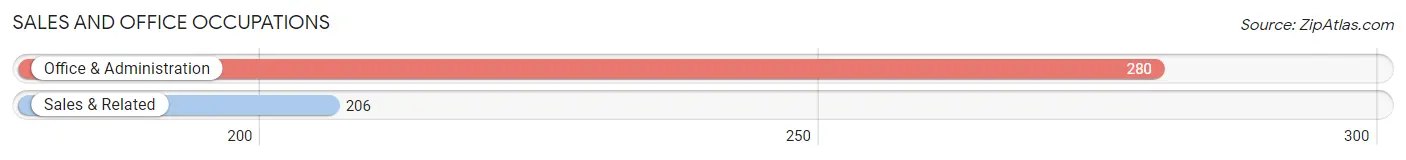
Sales and Office Occupations
The most common Sales and Office occupations in South Hill are Office & Administration (280 | 12.9%), and Sales & Related (206 | 9.5%).
Sales and Office Occupations by Sex
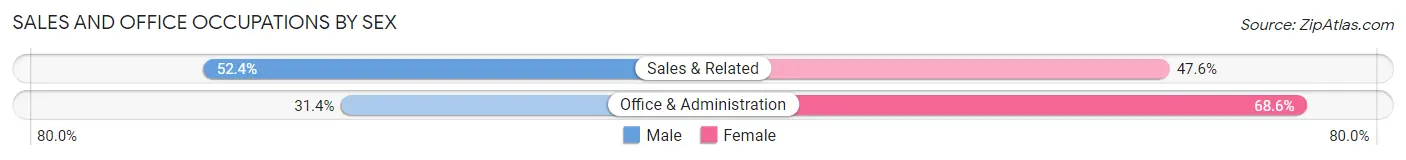
| Occupation | Male | Female |
| Sales & Related | 108 (52.4%) | 98 (47.6%) |
| Office & Administration | 88 (31.4%) | 192 (68.6%) |
| Total (Category) | 196 (40.3%) | 290 (59.7%) |
| Total (Overall) | 1,012 (46.4%) | 1,167 (53.6%) |
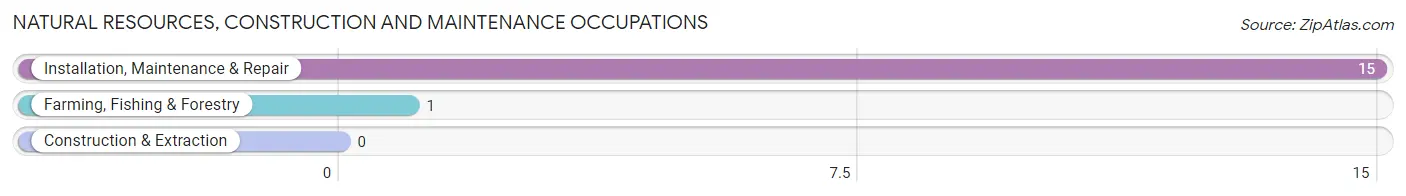
Natural Resources, Construction and Maintenance Occupations
The most common Natural Resources, Construction and Maintenance occupations in South Hill are Installation, Maintenance & Repair (15 | 0.7%), and Farming, Fishing & Forestry (1 | 0.1%).
Natural Resources, Construction and Maintenance Occupations by Sex
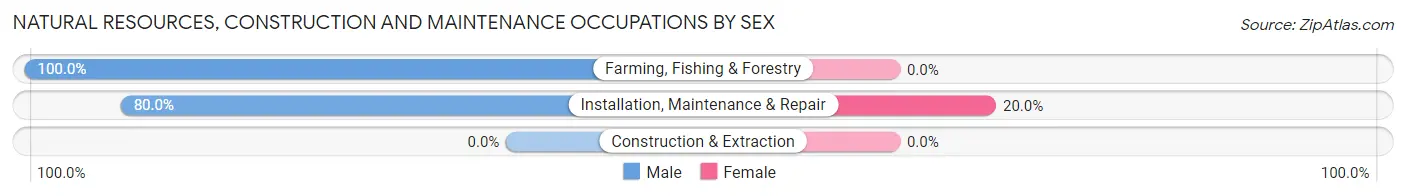
| Occupation | Male | Female |
| Farming, Fishing & Forestry | 1 (100.0%) | 0 (0.0%) |
| Construction & Extraction | 0 (0.0%) | 0 (0.0%) |
| Installation, Maintenance & Repair | 12 (80.0%) | 3 (20.0%) |
| Total (Category) | 13 (81.2%) | 3 (18.8%) |
| Total (Overall) | 1,012 (46.4%) | 1,167 (53.6%) |
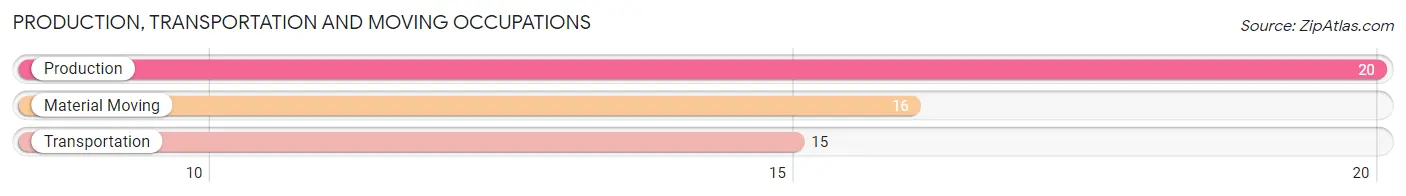
Production, Transportation and Moving Occupations
The most common Production, Transportation and Moving occupations in South Hill are Production (20 | 0.9%), Material Moving (16 | 0.7%), and Transportation (15 | 0.7%).
Production, Transportation and Moving Occupations by Sex
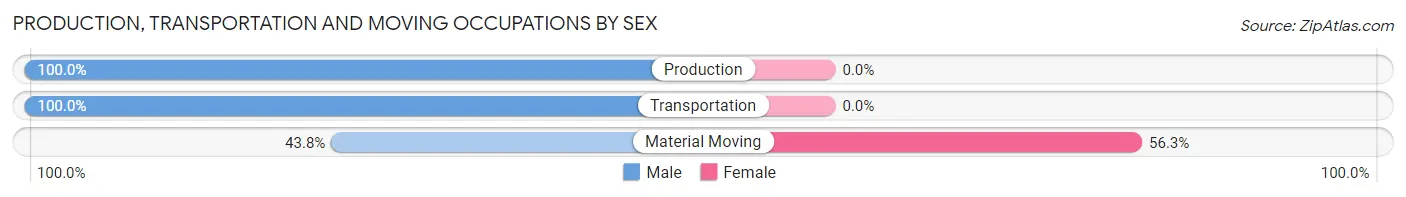
| Occupation | Male | Female |
| Production | 20 (100.0%) | 0 (0.0%) |
| Transportation | 15 (100.0%) | 0 (0.0%) |
| Material Moving | 7 (43.8%) | 9 (56.2%) |
| Total (Category) | 42 (82.4%) | 9 (17.6%) |
| Total (Overall) | 1,012 (46.4%) | 1,167 (53.6%) |
Employment Industries by Sex in South Hill
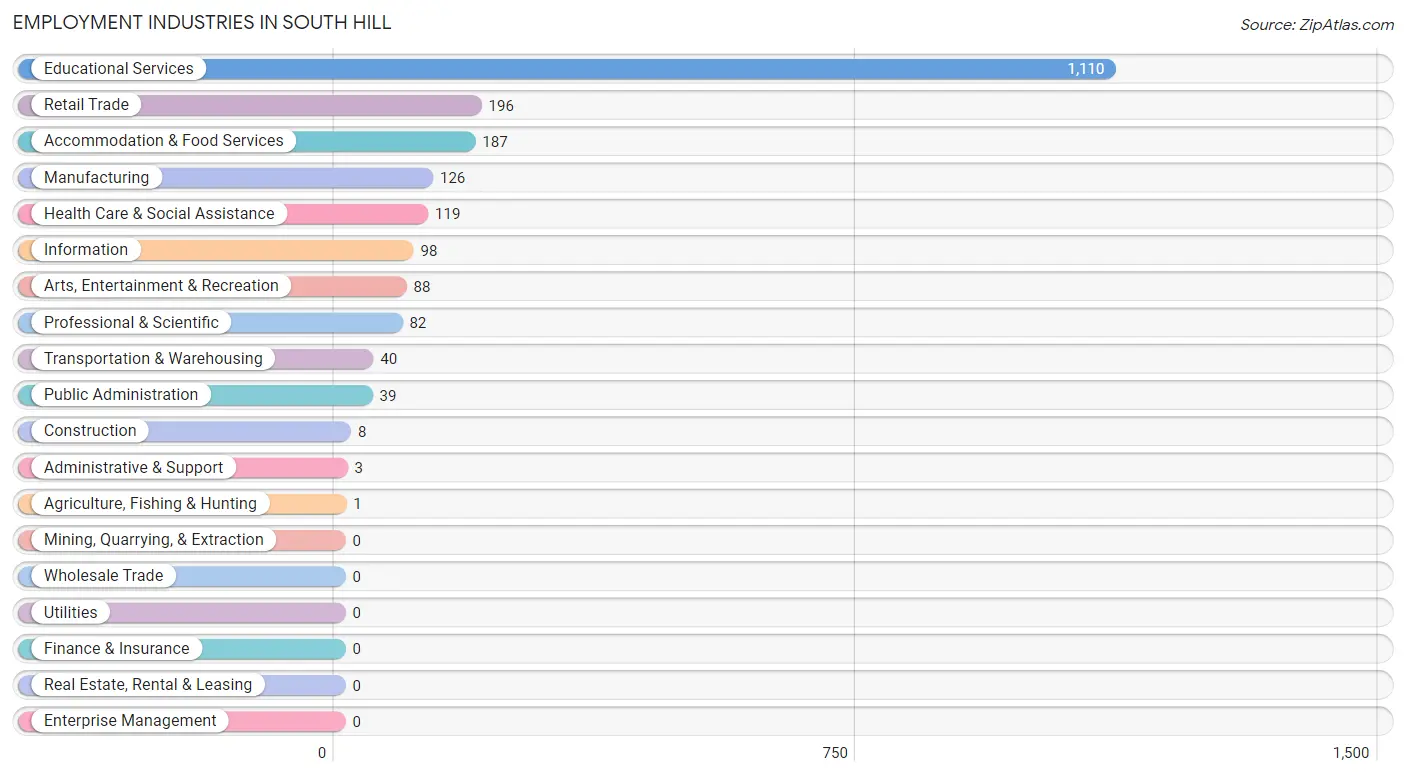
Employment Industries in South Hill
The major employment industries in South Hill include Educational Services (1,110 | 50.9%), Retail Trade (196 | 9.0%), Accommodation & Food Services (187 | 8.6%), Manufacturing (126 | 5.8%), and Health Care & Social Assistance (119 | 5.5%).
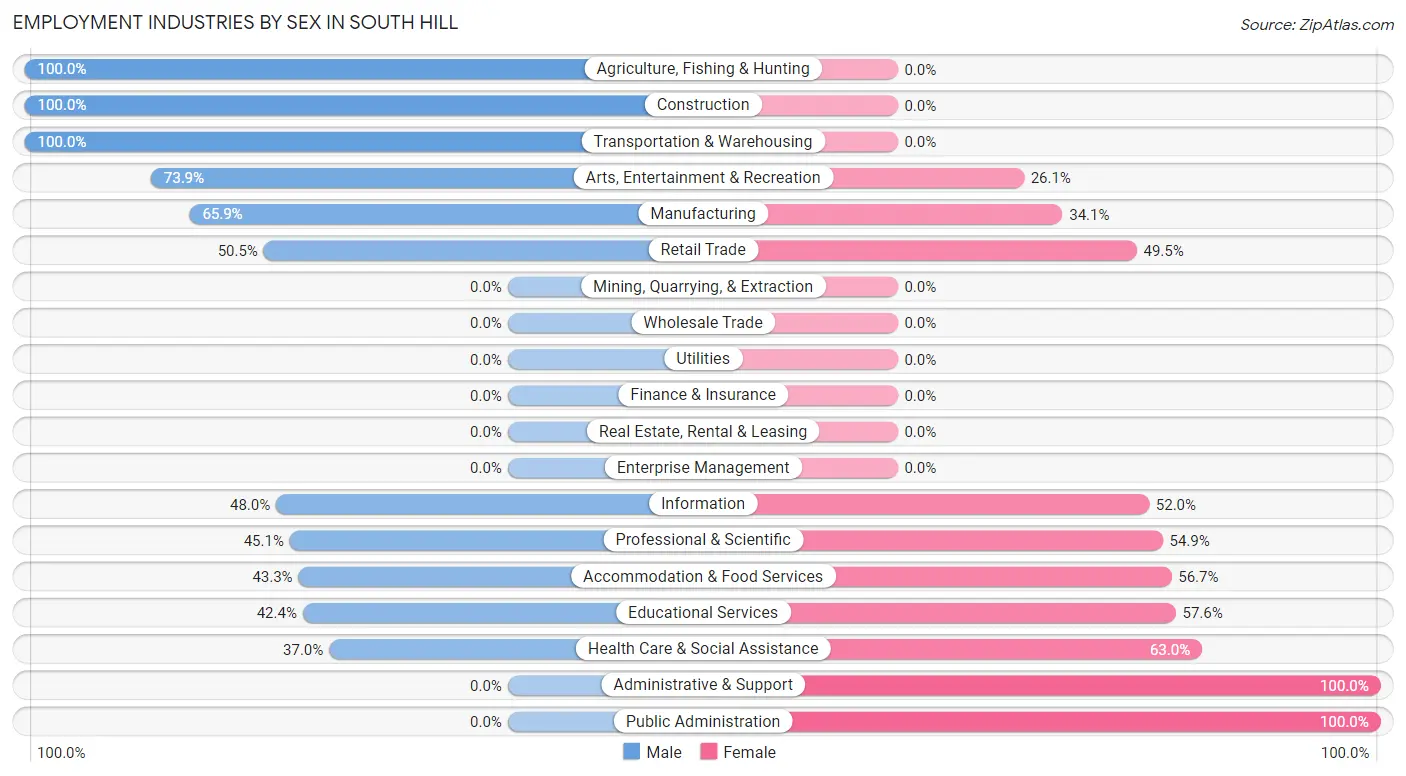
Employment Industries by Sex in South Hill
The South Hill industries that see more men than women are Agriculture, Fishing & Hunting (100.0%), Construction (100.0%), and Transportation & Warehousing (100.0%), whereas the industries that tend to have a higher number of women are Administrative & Support (100.0%), Public Administration (100.0%), and Health Care & Social Assistance (63.0%).
| Industry | Male | Female |
| Agriculture, Fishing & Hunting | 1 (100.0%) | 0 (0.0%) |
| Mining, Quarrying, & Extraction | 0 (0.0%) | 0 (0.0%) |
| Construction | 8 (100.0%) | 0 (0.0%) |
| Manufacturing | 83 (65.9%) | 43 (34.1%) |
| Wholesale Trade | 0 (0.0%) | 0 (0.0%) |
| Retail Trade | 99 (50.5%) | 97 (49.5%) |
| Transportation & Warehousing | 40 (100.0%) | 0 (0.0%) |
| Utilities | 0 (0.0%) | 0 (0.0%) |
| Information | 47 (48.0%) | 51 (52.0%) |
| Finance & Insurance | 0 (0.0%) | 0 (0.0%) |
| Real Estate, Rental & Leasing | 0 (0.0%) | 0 (0.0%) |
| Professional & Scientific | 37 (45.1%) | 45 (54.9%) |
| Enterprise Management | 0 (0.0%) | 0 (0.0%) |
| Administrative & Support | 0 (0.0%) | 3 (100.0%) |
| Educational Services | 471 (42.4%) | 639 (57.6%) |
| Health Care & Social Assistance | 44 (37.0%) | 75 (63.0%) |
| Arts, Entertainment & Recreation | 65 (73.9%) | 23 (26.1%) |
| Accommodation & Food Services | 81 (43.3%) | 106 (56.7%) |
| Public Administration | 0 (0.0%) | 39 (100.0%) |
| Total | 1,012 (46.4%) | 1,167 (53.6%) |
Education in South Hill
School Enrollment in South Hill
The most common levels of schooling among the 4,689 students in South Hill are college / undergraduate (4,298 | 91.7%), elementary school (162 | 3.5%), and middle school (59 | 1.3%).
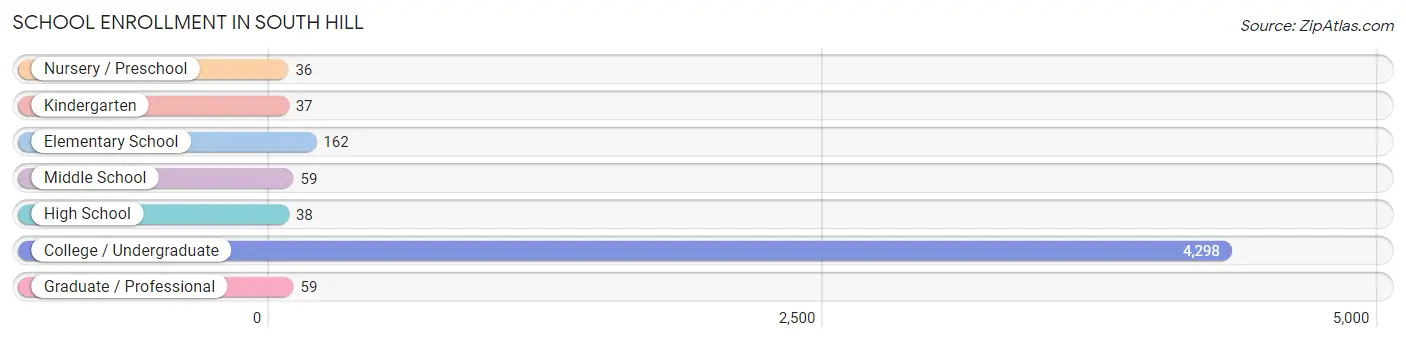
| School Level | # Students | % Students |
| Nursery / Preschool | 36 | 0.8% |
| Kindergarten | 37 | 0.8% |
| Elementary School | 162 | 3.5% |
| Middle School | 59 | 1.3% |
| High School | 38 | 0.8% |
| College / Undergraduate | 4,298 | 91.7% |
| Graduate / Professional | 59 | 1.3% |
| Total | 4,689 | 100.0% |
School Enrollment by Age by Funding Source in South Hill
Out of a total of 4,689 students who are enrolled in schools in South Hill, 4,417 (94.2%) attend a private institution, while the remaining 272 (5.8%) are enrolled in public schools. The age group of 3 to 4 year olds has the highest likelihood of being enrolled in private schools, with 36 (100.0% in the age bracket) enrolled. Conversely, the age group of 5 to 9 year old has the lowest likelihood of being enrolled in a private school, with 99 (59.6% in the age bracket) attending a public institution.
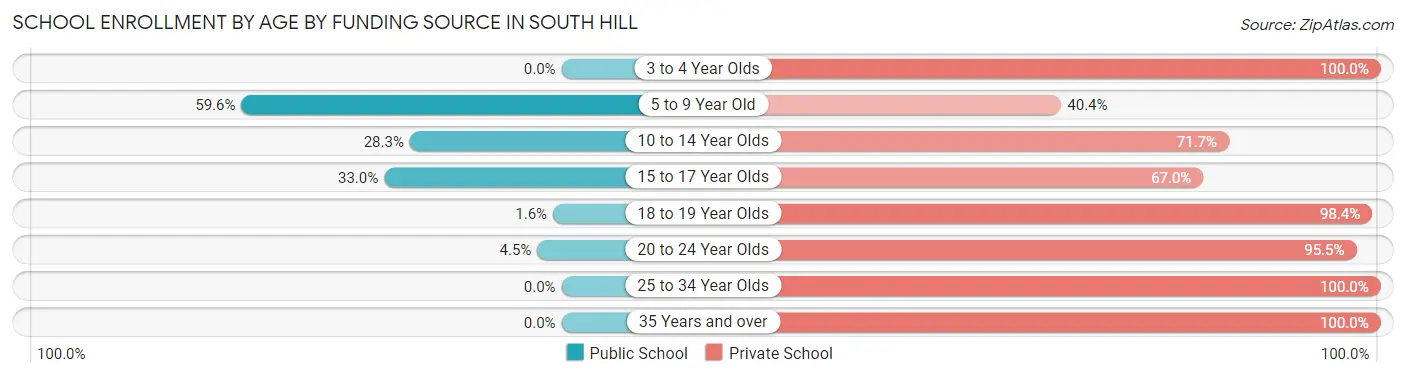
| Age Bracket | Public School | Private School |
| 3 to 4 Year Olds | 0 (0.0%) | 36 (100.0%) |
| 5 to 9 Year Old | 99 (59.6%) | 67 (40.4%) |
| 10 to 14 Year Olds | 26 (28.3%) | 66 (71.7%) |
| 15 to 17 Year Olds | 38 (33.0%) | 77 (67.0%) |
| 18 to 19 Year Olds | 44 (1.6%) | 2,718 (98.4%) |
| 20 to 24 Year Olds | 67 (4.5%) | 1,414 (95.5%) |
| 25 to 34 Year Olds | 0 (0.0%) | 34 (100.0%) |
| 35 Years and over | 0 (0.0%) | 3 (100.0%) |
| Total | 272 (5.8%) | 4,417 (94.2%) |
Educational Attainment by Field of Study in South Hill
Social sciences (213 | 14.1%), psychology (185 | 12.3%), bio, nature & agricultural (147 | 9.7%), visual & performing arts (146 | 9.7%), and science & technology (123 | 8.2%) are the most common fields of study among 1,509 individuals in South Hill who have obtained a bachelor's degree or higher.
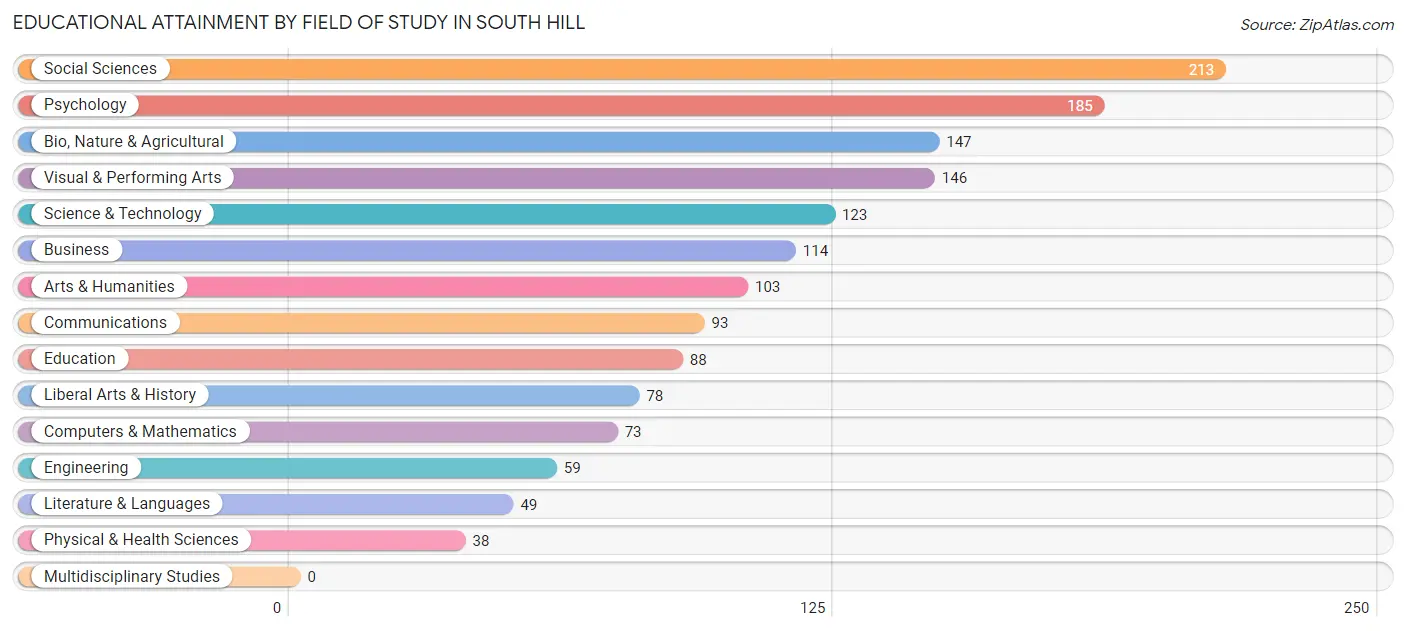
| Field of Study | # Graduates | % Graduates |
| Computers & Mathematics | 73 | 4.8% |
| Bio, Nature & Agricultural | 147 | 9.7% |
| Physical & Health Sciences | 38 | 2.5% |
| Psychology | 185 | 12.3% |
| Social Sciences | 213 | 14.1% |
| Engineering | 59 | 3.9% |
| Multidisciplinary Studies | 0 | 0.0% |
| Science & Technology | 123 | 8.2% |
| Business | 114 | 7.5% |
| Education | 88 | 5.8% |
| Literature & Languages | 49 | 3.3% |
| Liberal Arts & History | 78 | 5.2% |
| Visual & Performing Arts | 146 | 9.7% |
| Communications | 93 | 6.2% |
| Arts & Humanities | 103 | 6.8% |
| Total | 1,509 | 100.0% |
Transportation & Commute in South Hill
Vehicle Availability by Sex in South Hill
The most prevalent vehicle ownership categories in South Hill are males with 3 vehicles (258, accounting for 39.7%) and females with 3 vehicles (203, making up 40.3%).
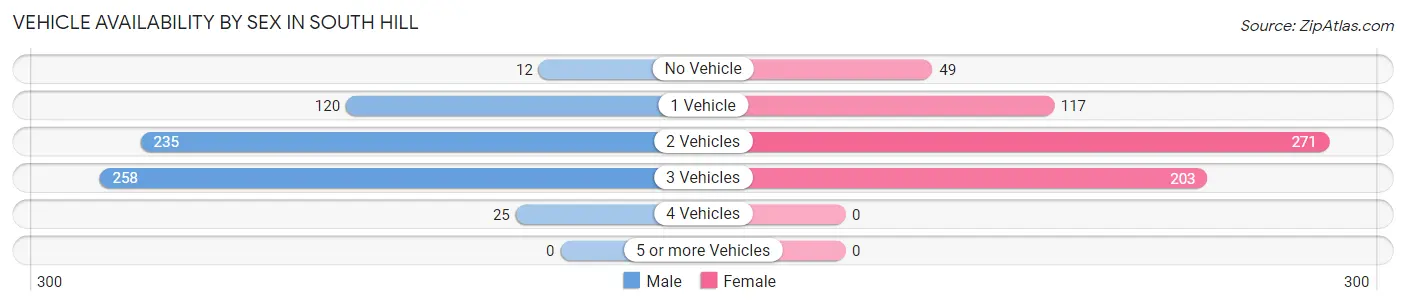
| Vehicles Available | Male | Female |
| No Vehicle | 12 (1.8%) | 49 (7.7%) |
| 1 Vehicle | 120 (18.5%) | 117 (18.3%) |
| 2 Vehicles | 235 (36.1%) | 271 (42.3%) |
| 3 Vehicles | 258 (39.7%) | 203 (31.7%) |
| 4 Vehicles | 25 (3.8%) | 0 (0.0%) |
| 5 or more Vehicles | 0 (0.0%) | 0 (0.0%) |
| Total | 650 (100.0%) | 640 (100.0%) |
Commute Time in South Hill
The most frequently occuring commute durations in South Hill are 10 to 14 minutes (465 commuters, 25.6%), 15 to 19 minutes (332 commuters, 18.2%), and 5 to 9 minutes (289 commuters, 15.9%).
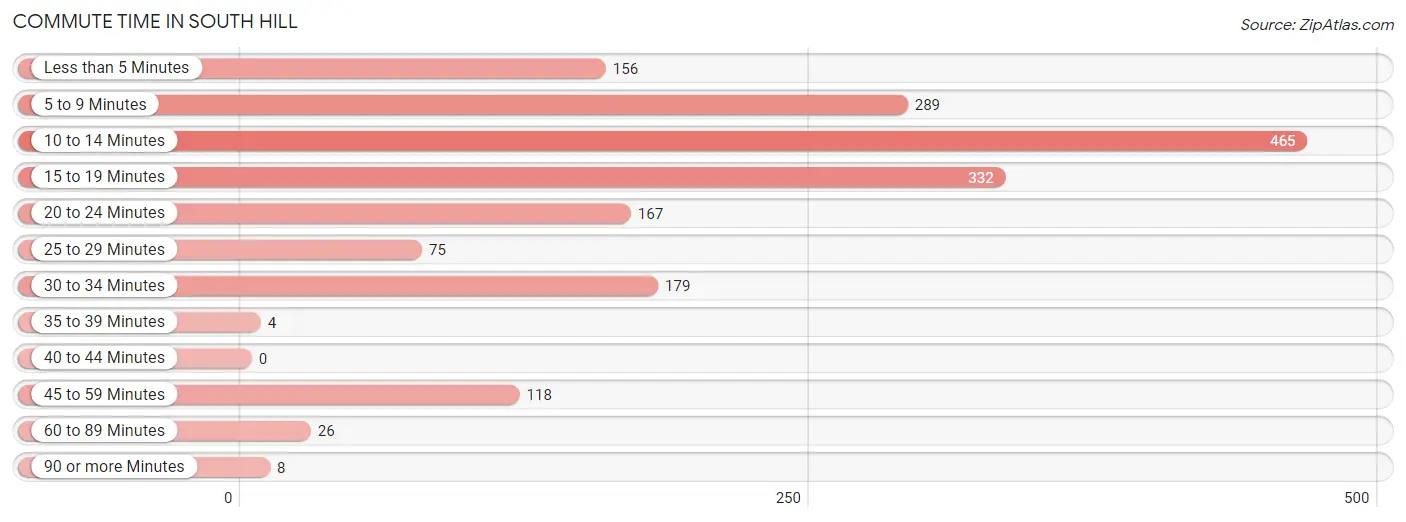
| Commute Time | # Commuters | % Commuters |
| Less than 5 Minutes | 156 | 8.6% |
| 5 to 9 Minutes | 289 | 15.9% |
| 10 to 14 Minutes | 465 | 25.6% |
| 15 to 19 Minutes | 332 | 18.2% |
| 20 to 24 Minutes | 167 | 9.2% |
| 25 to 29 Minutes | 75 | 4.1% |
| 30 to 34 Minutes | 179 | 9.8% |
| 35 to 39 Minutes | 4 | 0.2% |
| 40 to 44 Minutes | 0 | 0.0% |
| 45 to 59 Minutes | 118 | 6.5% |
| 60 to 89 Minutes | 26 | 1.4% |
| 90 or more Minutes | 8 | 0.4% |
Commute Time by Sex in South Hill
The most common commute times in South Hill are 5 to 9 minutes (196 commuters, 22.0%) for males and 10 to 14 minutes (280 commuters, 30.2%) for females.
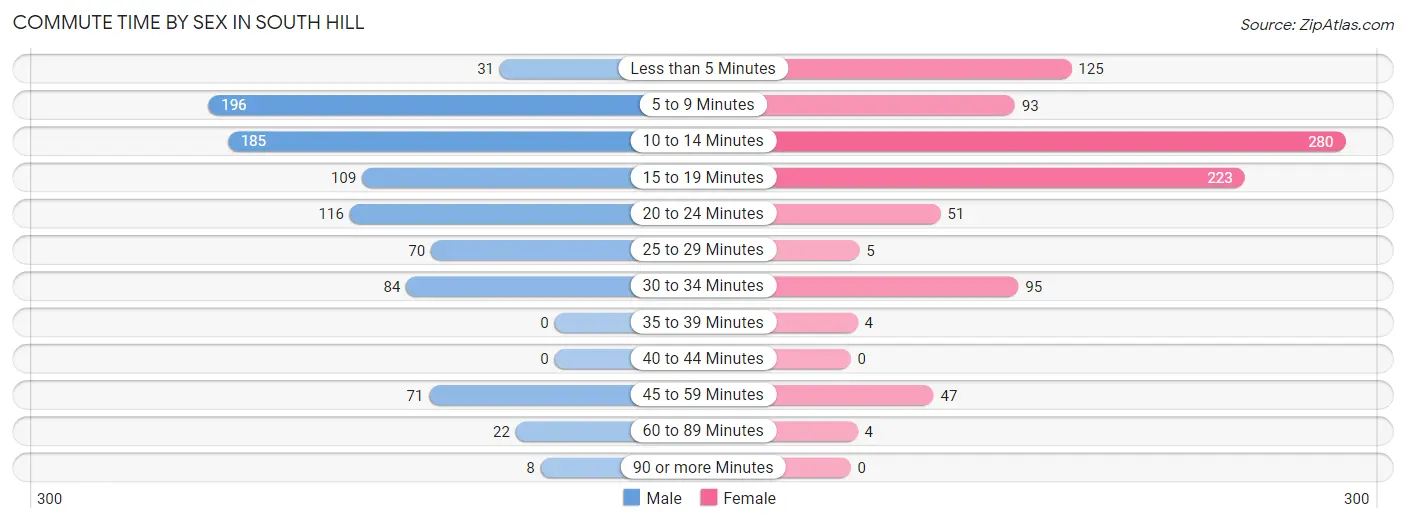
| Commute Time | Male | Female |
| Less than 5 Minutes | 31 (3.5%) | 125 (13.5%) |
| 5 to 9 Minutes | 196 (22.0%) | 93 (10.0%) |
| 10 to 14 Minutes | 185 (20.7%) | 280 (30.2%) |
| 15 to 19 Minutes | 109 (12.2%) | 223 (24.1%) |
| 20 to 24 Minutes | 116 (13.0%) | 51 (5.5%) |
| 25 to 29 Minutes | 70 (7.9%) | 5 (0.5%) |
| 30 to 34 Minutes | 84 (9.4%) | 95 (10.2%) |
| 35 to 39 Minutes | 0 (0.0%) | 4 (0.4%) |
| 40 to 44 Minutes | 0 (0.0%) | 0 (0.0%) |
| 45 to 59 Minutes | 71 (8.0%) | 47 (5.1%) |
| 60 to 89 Minutes | 22 (2.5%) | 4 (0.4%) |
| 90 or more Minutes | 8 (0.9%) | 0 (0.0%) |
Time of Departure to Work by Sex in South Hill
The most frequent times of departure to work in South Hill are 7:00 AM to 7:29 AM (163, 18.3%) for males and 8:00 AM to 8:29 AM (267, 28.8%) for females.
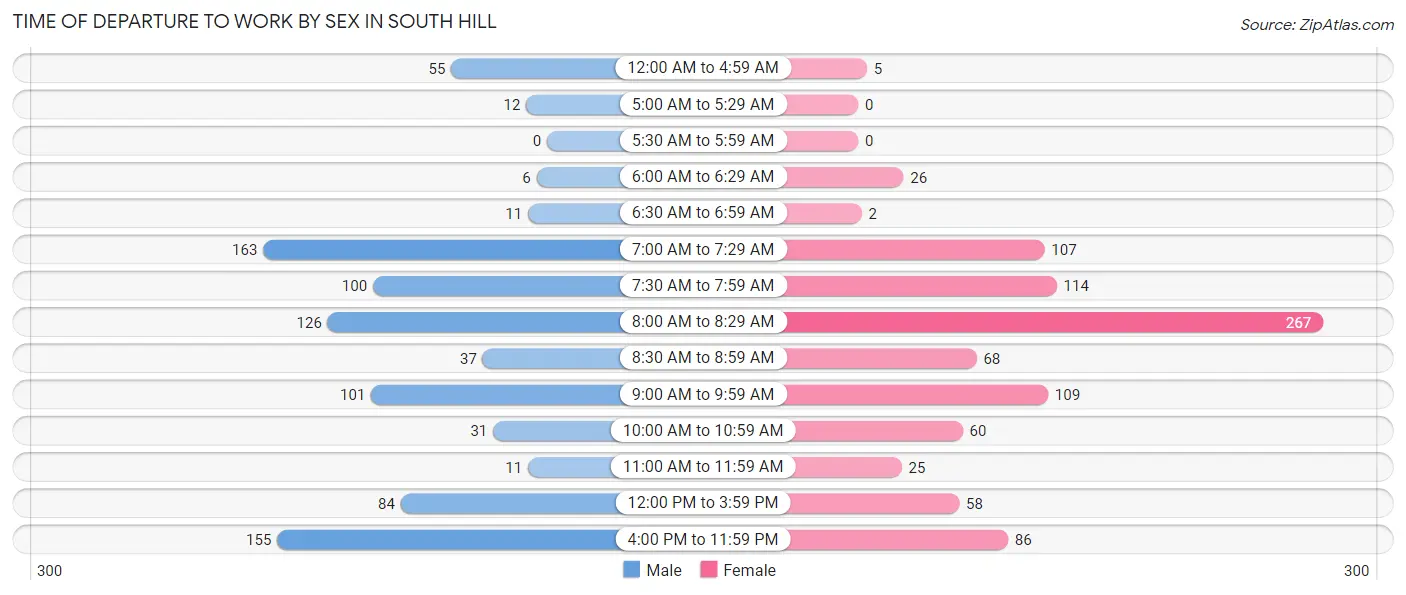
| Time of Departure | Male | Female |
| 12:00 AM to 4:59 AM | 55 (6.2%) | 5 (0.5%) |
| 5:00 AM to 5:29 AM | 12 (1.3%) | 0 (0.0%) |
| 5:30 AM to 5:59 AM | 0 (0.0%) | 0 (0.0%) |
| 6:00 AM to 6:29 AM | 6 (0.7%) | 26 (2.8%) |
| 6:30 AM to 6:59 AM | 11 (1.2%) | 2 (0.2%) |
| 7:00 AM to 7:29 AM | 163 (18.3%) | 107 (11.5%) |
| 7:30 AM to 7:59 AM | 100 (11.2%) | 114 (12.3%) |
| 8:00 AM to 8:29 AM | 126 (14.1%) | 267 (28.8%) |
| 8:30 AM to 8:59 AM | 37 (4.2%) | 68 (7.3%) |
| 9:00 AM to 9:59 AM | 101 (11.3%) | 109 (11.8%) |
| 10:00 AM to 10:59 AM | 31 (3.5%) | 60 (6.5%) |
| 11:00 AM to 11:59 AM | 11 (1.2%) | 25 (2.7%) |
| 12:00 PM to 3:59 PM | 84 (9.4%) | 58 (6.3%) |
| 4:00 PM to 11:59 PM | 155 (17.4%) | 86 (9.3%) |
| Total | 892 (100.0%) | 927 (100.0%) |
Housing Occupancy in South Hill
Occupancy by Ownership in South Hill
Of the total 1,279 dwellings in South Hill, owner-occupied units account for 813 (63.6%), while renter-occupied units make up 466 (36.4%).
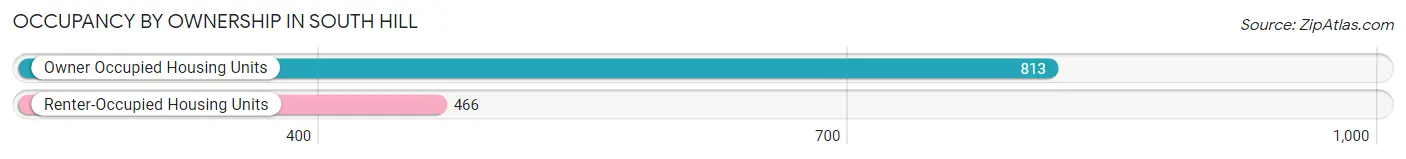
| Occupancy | # Housing Units | % Housing Units |
| Owner Occupied Housing Units | 813 | 63.6% |
| Renter-Occupied Housing Units | 466 | 36.4% |
| Total Occupied Housing Units | 1,279 | 100.0% |
Occupancy by Household Size in South Hill
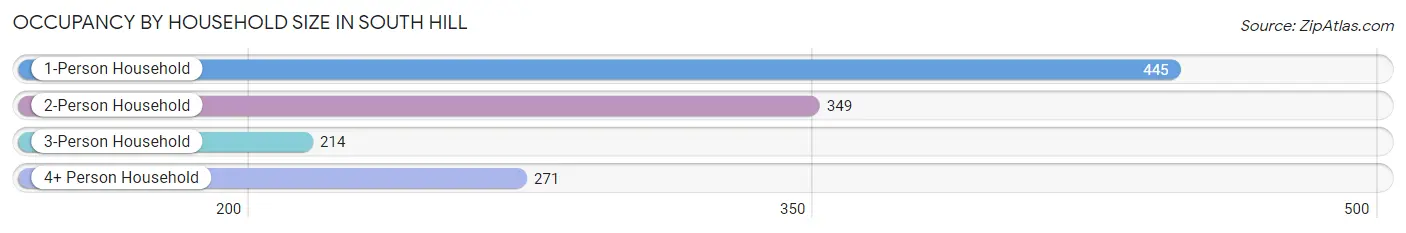
| Household Size | # Housing Units | % Housing Units |
| 1-Person Household | 445 | 34.8% |
| 2-Person Household | 349 | 27.3% |
| 3-Person Household | 214 | 16.7% |
| 4+ Person Household | 271 | 21.2% |
| Total Housing Units | 1,279 | 100.0% |
Occupancy by Ownership by Household Size in South Hill
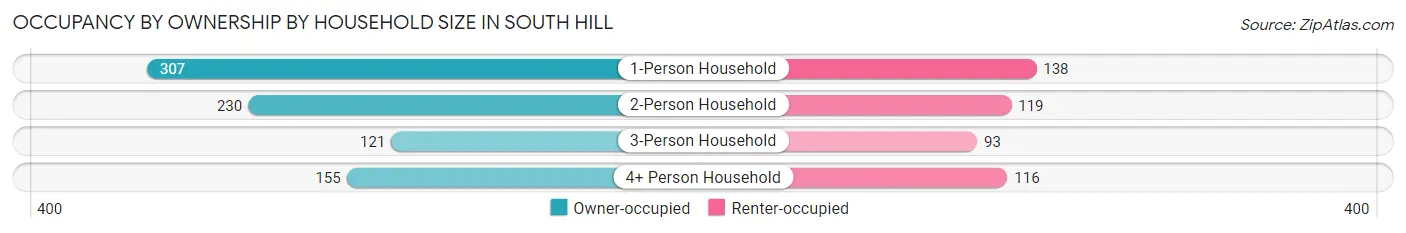
| Household Size | Owner-occupied | Renter-occupied |
| 1-Person Household | 307 (69.0%) | 138 (31.0%) |
| 2-Person Household | 230 (65.9%) | 119 (34.1%) |
| 3-Person Household | 121 (56.5%) | 93 (43.5%) |
| 4+ Person Household | 155 (57.2%) | 116 (42.8%) |
| Total Housing Units | 813 (63.6%) | 466 (36.4%) |
Occupancy by Educational Attainment in South Hill
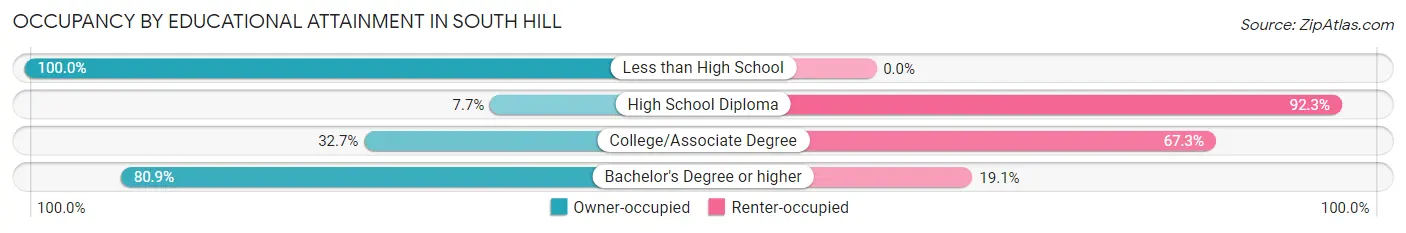
| Household Size | Owner-occupied | Renter-occupied |
| Less than High School | 2 (100.0%) | 0 (0.0%) |
| High School Diploma | 8 (7.7%) | 96 (92.3%) |
| College/Associate Degree | 99 (32.7%) | 204 (67.3%) |
| Bachelor's Degree or higher | 704 (80.9%) | 166 (19.1%) |
Occupancy by Age of Householder in South Hill
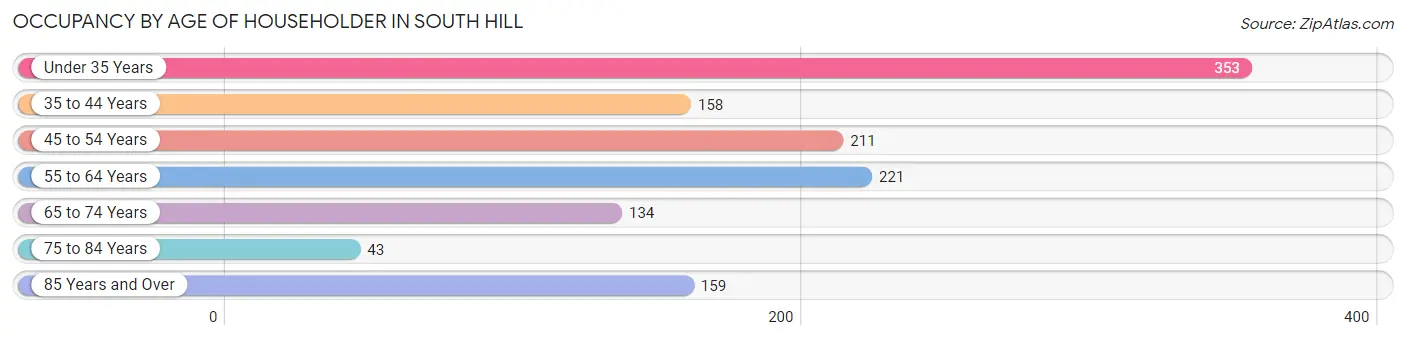
| Age Bracket | # Households | % Households |
| Under 35 Years | 353 | 27.6% |
| 35 to 44 Years | 158 | 12.3% |
| 45 to 54 Years | 211 | 16.5% |
| 55 to 64 Years | 221 | 17.3% |
| 65 to 74 Years | 134 | 10.5% |
| 75 to 84 Years | 43 | 3.4% |
| 85 Years and Over | 159 | 12.4% |
| Total | 1,279 | 100.0% |
Housing Finances in South Hill
Median Income by Occupancy in South Hill
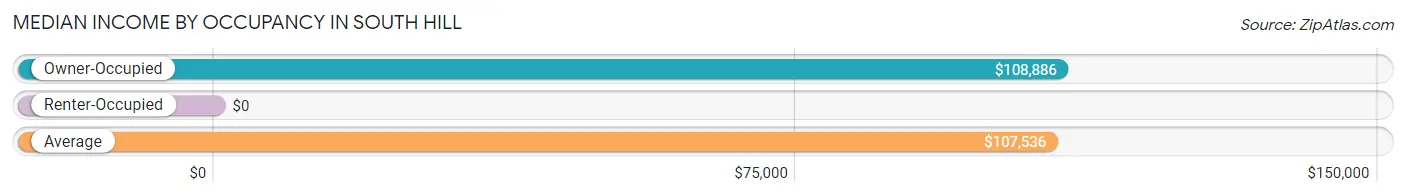
| Occupancy Type | # Households | Median Income |
| Owner-Occupied | 813 (63.6%) | $108,886 |
| Renter-Occupied | 466 (36.4%) | $0 |
| Average | 1,279 (100.0%) | $107,536 |
Occupancy by Householder Income Bracket in South Hill
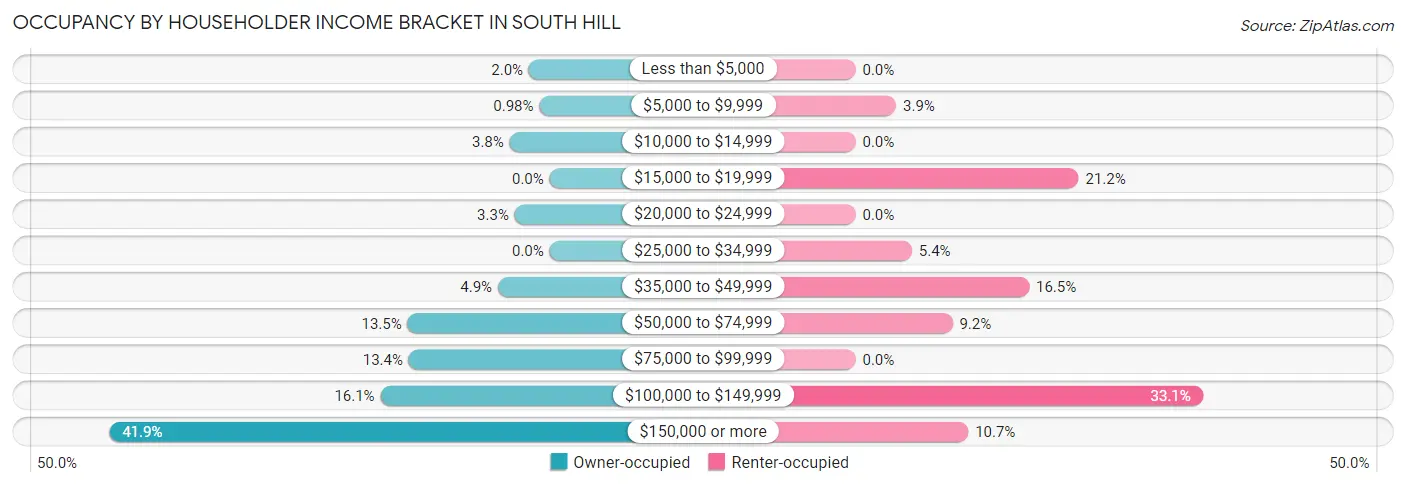
| Income Bracket | Owner-occupied | Renter-occupied |
| Less than $5,000 | 16 (2.0%) | 0 (0.0%) |
| $5,000 to $9,999 | 8 (1.0%) | 18 (3.9%) |
| $10,000 to $14,999 | 31 (3.8%) | 0 (0.0%) |
| $15,000 to $19,999 | 0 (0.0%) | 99 (21.2%) |
| $20,000 to $24,999 | 27 (3.3%) | 0 (0.0%) |
| $25,000 to $34,999 | 0 (0.0%) | 25 (5.4%) |
| $35,000 to $49,999 | 40 (4.9%) | 77 (16.5%) |
| $50,000 to $74,999 | 110 (13.5%) | 43 (9.2%) |
| $75,000 to $99,999 | 109 (13.4%) | 0 (0.0%) |
| $100,000 to $149,999 | 131 (16.1%) | 154 (33.1%) |
| $150,000 or more | 341 (41.9%) | 50 (10.7%) |
| Total | 813 (100.0%) | 466 (100.0%) |
Monthly Housing Cost Tiers in South Hill
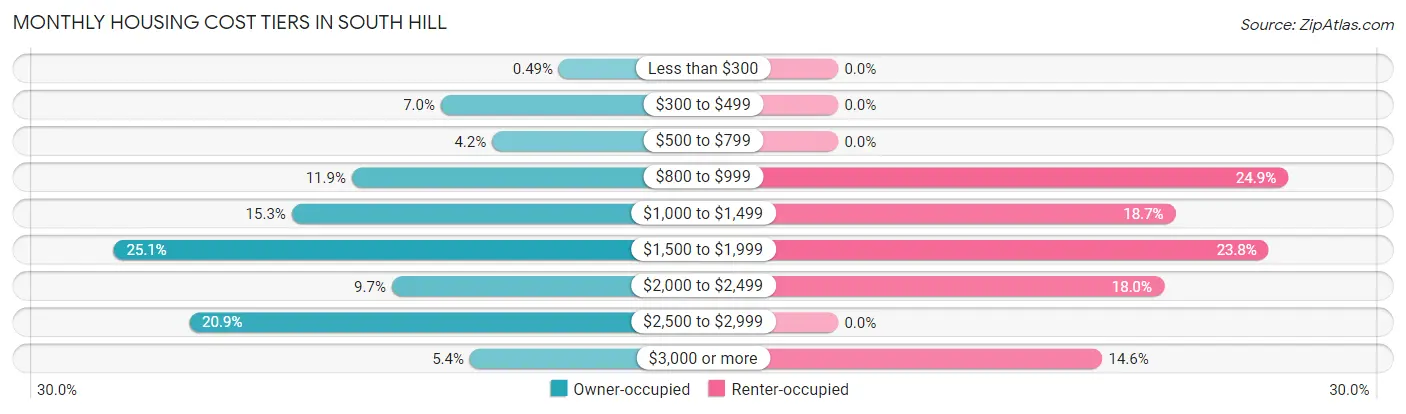
| Monthly Cost | Owner-occupied | Renter-occupied |
| Less than $300 | 4 (0.5%) | 0 (0.0%) |
| $300 to $499 | 57 (7.0%) | 0 (0.0%) |
| $500 to $799 | 34 (4.2%) | 0 (0.0%) |
| $800 to $999 | 97 (11.9%) | 116 (24.9%) |
| $1,000 to $1,499 | 124 (15.2%) | 87 (18.7%) |
| $1,500 to $1,999 | 204 (25.1%) | 111 (23.8%) |
| $2,000 to $2,499 | 79 (9.7%) | 84 (18.0%) |
| $2,500 to $2,999 | 170 (20.9%) | 0 (0.0%) |
| $3,000 or more | 44 (5.4%) | 68 (14.6%) |
| Total | 813 (100.0%) | 466 (100.0%) |
Physical Housing Characteristics in South Hill
Housing Structures in South Hill
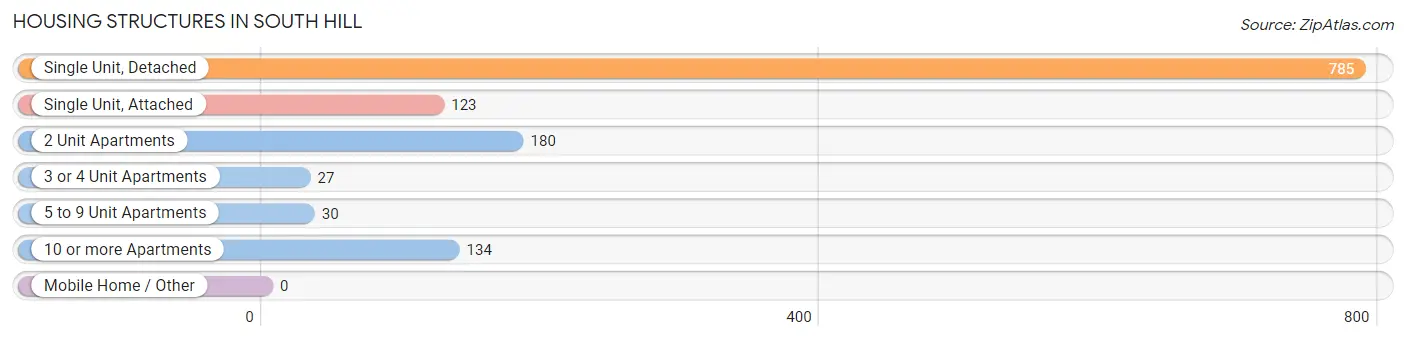
| Structure Type | # Housing Units | % Housing Units |
| Single Unit, Detached | 785 | 61.4% |
| Single Unit, Attached | 123 | 9.6% |
| 2 Unit Apartments | 180 | 14.1% |
| 3 or 4 Unit Apartments | 27 | 2.1% |
| 5 to 9 Unit Apartments | 30 | 2.4% |
| 10 or more Apartments | 134 | 10.5% |
| Mobile Home / Other | 0 | 0.0% |
| Total | 1,279 | 100.0% |
Housing Structures by Occupancy in South Hill
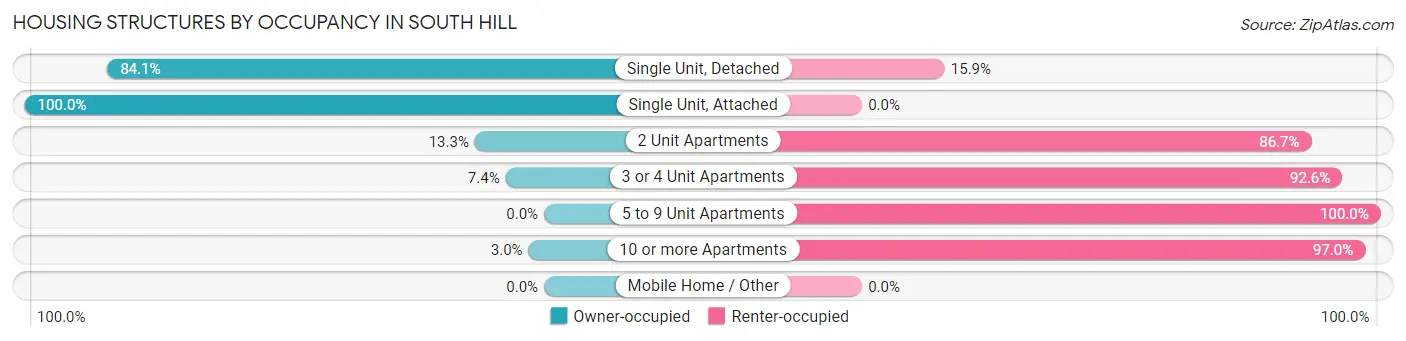
| Structure Type | Owner-occupied | Renter-occupied |
| Single Unit, Detached | 660 (84.1%) | 125 (15.9%) |
| Single Unit, Attached | 123 (100.0%) | 0 (0.0%) |
| 2 Unit Apartments | 24 (13.3%) | 156 (86.7%) |
| 3 or 4 Unit Apartments | 2 (7.4%) | 25 (92.6%) |
| 5 to 9 Unit Apartments | 0 (0.0%) | 30 (100.0%) |
| 10 or more Apartments | 4 (3.0%) | 130 (97.0%) |
| Mobile Home / Other | 0 (0.0%) | 0 (0.0%) |
| Total | 813 (63.6%) | 466 (36.4%) |
Housing Structures by Number of Rooms in South Hill
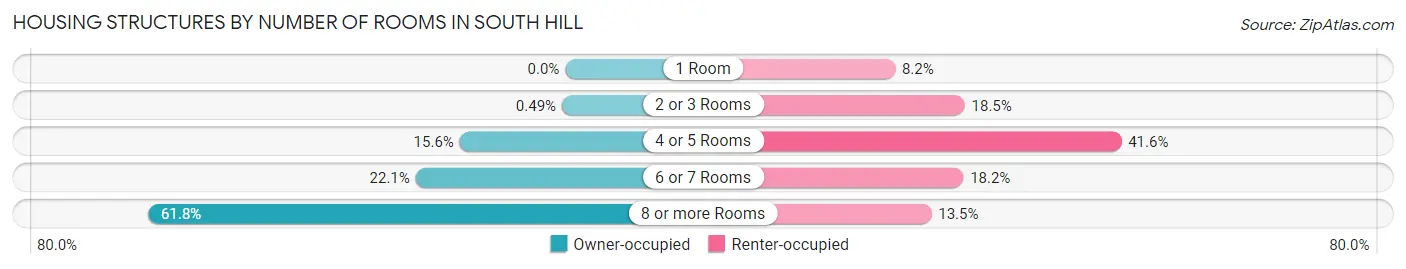
| Number of Rooms | Owner-occupied | Renter-occupied |
| 1 Room | 0 (0.0%) | 38 (8.2%) |
| 2 or 3 Rooms | 4 (0.5%) | 86 (18.4%) |
| 4 or 5 Rooms | 127 (15.6%) | 194 (41.6%) |
| 6 or 7 Rooms | 180 (22.1%) | 85 (18.2%) |
| 8 or more Rooms | 502 (61.8%) | 63 (13.5%) |
| Total | 813 (100.0%) | 466 (100.0%) |
Housing Structure by Heating Type in South Hill
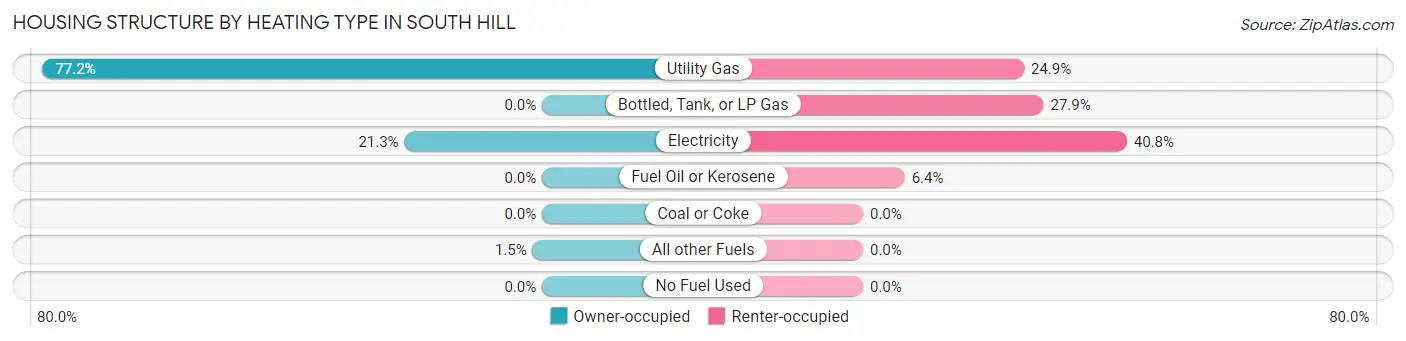
| Heating Type | Owner-occupied | Renter-occupied |
| Utility Gas | 628 (77.2%) | 116 (24.9%) |
| Bottled, Tank, or LP Gas | 0 (0.0%) | 130 (27.9%) |
| Electricity | 173 (21.3%) | 190 (40.8%) |
| Fuel Oil or Kerosene | 0 (0.0%) | 30 (6.4%) |
| Coal or Coke | 0 (0.0%) | 0 (0.0%) |
| All other Fuels | 12 (1.5%) | 0 (0.0%) |
| No Fuel Used | 0 (0.0%) | 0 (0.0%) |
| Total | 813 (100.0%) | 466 (100.0%) |
Household Vehicle Usage in South Hill
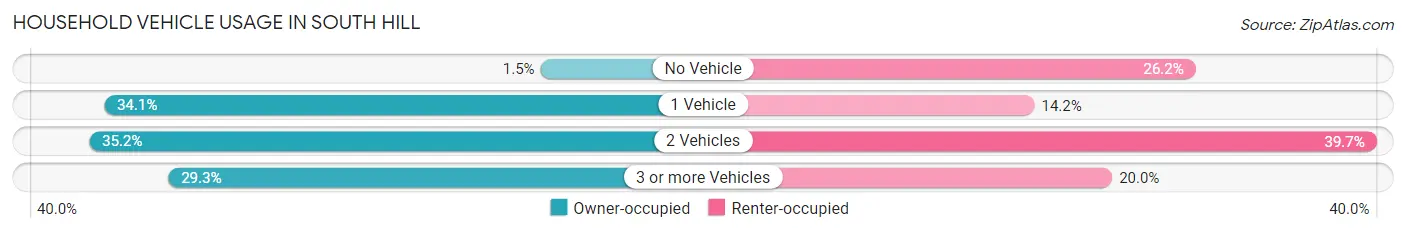
| Vehicles per Household | Owner-occupied | Renter-occupied |
| No Vehicle | 12 (1.5%) | 122 (26.2%) |
| 1 Vehicle | 277 (34.1%) | 66 (14.2%) |
| 2 Vehicles | 286 (35.2%) | 185 (39.7%) |
| 3 or more Vehicles | 238 (29.3%) | 93 (20.0%) |
| Total | 813 (100.0%) | 466 (100.0%) |
Real Estate & Mortgages in South Hill
Real Estate and Mortgage Overview in South Hill
| Characteristic | Without Mortgage | With Mortgage |
| Housing Units | 300 | 513 |
| Median Property Value | $359,000 | $328,500 |
| Median Household Income | $95,705 | $259 |
| Monthly Housing Costs | $919 | $44 |
| Real Estate Taxes | $6,216 | $0 |
Property Value by Mortgage Status in South Hill
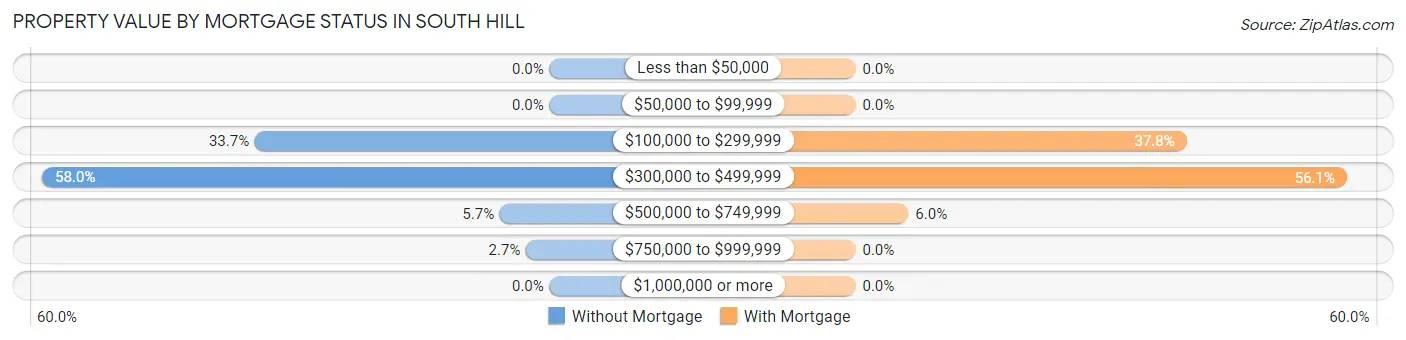
| Property Value | Without Mortgage | With Mortgage |
| Less than $50,000 | 0 (0.0%) | 0 (0.0%) |
| $50,000 to $99,999 | 0 (0.0%) | 0 (0.0%) |
| $100,000 to $299,999 | 101 (33.7%) | 194 (37.8%) |
| $300,000 to $499,999 | 174 (58.0%) | 288 (56.1%) |
| $500,000 to $749,999 | 17 (5.7%) | 31 (6.0%) |
| $750,000 to $999,999 | 8 (2.7%) | 0 (0.0%) |
| $1,000,000 or more | 0 (0.0%) | 0 (0.0%) |
| Total | 300 (100.0%) | 513 (100.0%) |
Household Income by Mortgage Status in South Hill
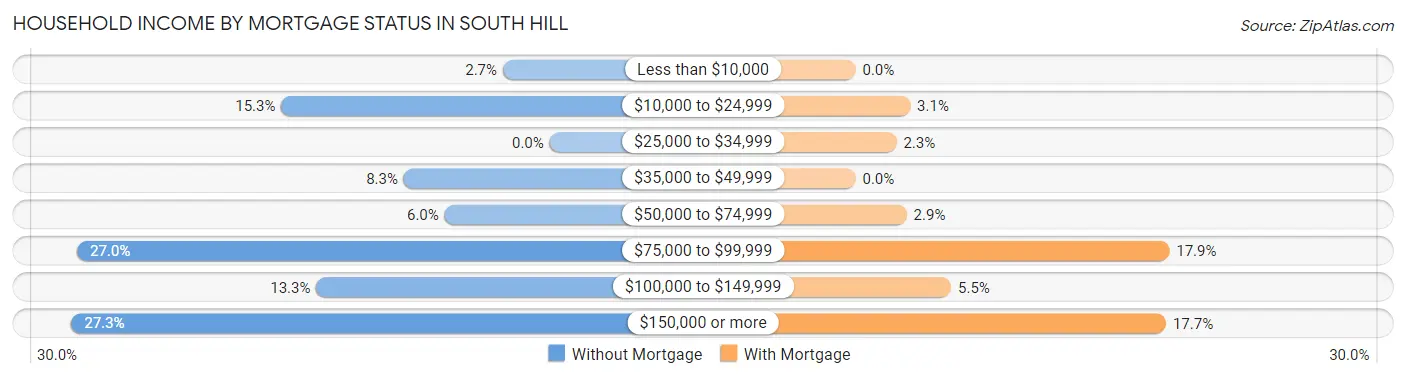
| Household Income | Without Mortgage | With Mortgage |
| Less than $10,000 | 8 (2.7%) | 0 (0.0%) |
| $10,000 to $24,999 | 46 (15.3%) | 16 (3.1%) |
| $25,000 to $34,999 | 0 (0.0%) | 12 (2.3%) |
| $35,000 to $49,999 | 25 (8.3%) | 0 (0.0%) |
| $50,000 to $74,999 | 18 (6.0%) | 15 (2.9%) |
| $75,000 to $99,999 | 81 (27.0%) | 92 (17.9%) |
| $100,000 to $149,999 | 40 (13.3%) | 28 (5.5%) |
| $150,000 or more | 82 (27.3%) | 91 (17.7%) |
| Total | 300 (100.0%) | 513 (100.0%) |
Property Value to Household Income Ratio in South Hill
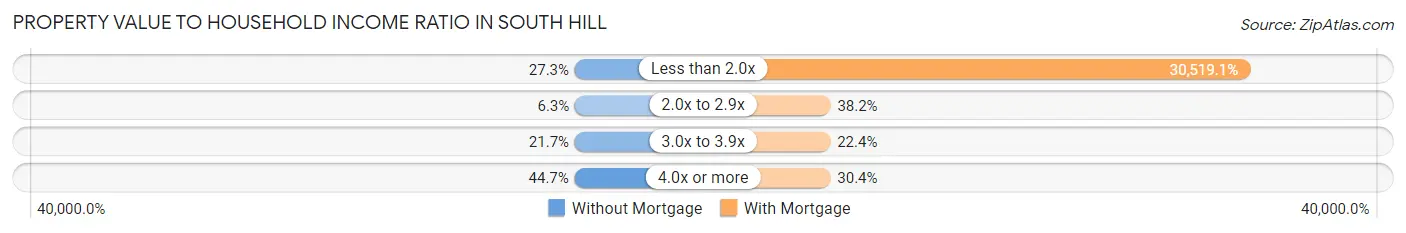
| Value-to-Income Ratio | Without Mortgage | With Mortgage |
| Less than 2.0x | 82 (27.3%) | 156,563 (30,519.1%) |
| 2.0x to 2.9x | 19 (6.3%) | 196 (38.2%) |
| 3.0x to 3.9x | 65 (21.7%) | 115 (22.4%) |
| 4.0x or more | 134 (44.7%) | 156 (30.4%) |
| Total | 300 (100.0%) | 513 (100.0%) |
Real Estate Taxes by Mortgage Status in South Hill
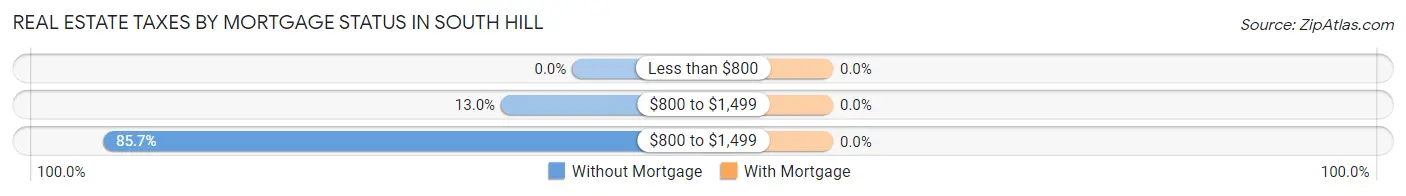
| Property Taxes | Without Mortgage | With Mortgage |
| Less than $800 | 0 (0.0%) | 0 (0.0%) |
| $800 to $1,499 | 39 (13.0%) | 0 (0.0%) |
| $800 to $1,499 | 257 (85.7%) | 0 (0.0%) |
| Total | 300 (100.0%) | 513 (100.0%) |
Health & Disability in South Hill
Health Insurance Coverage by Age in South Hill
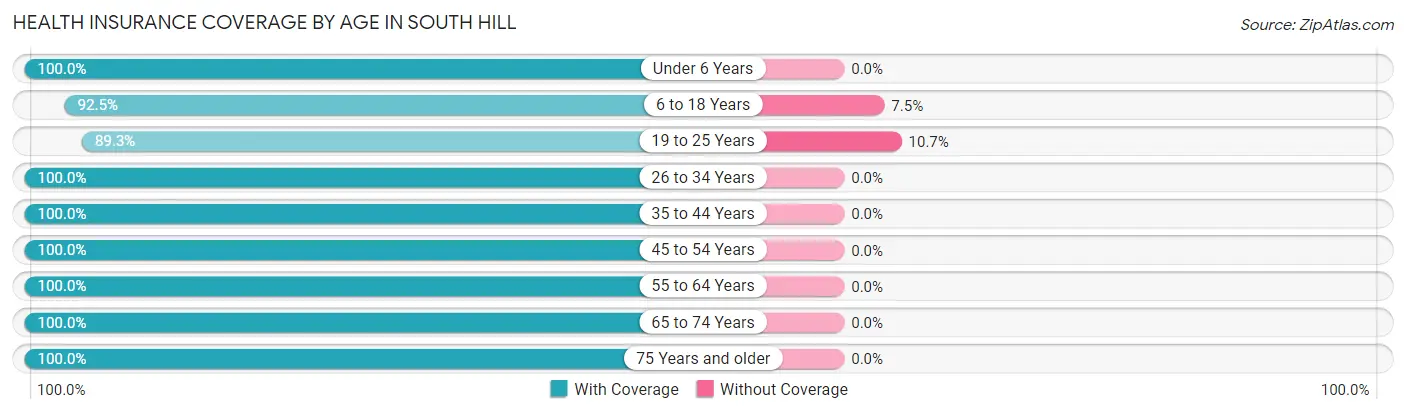
| Age Bracket | With Coverage | Without Coverage |
| Under 6 Years | 108 (100.0%) | 0 (0.0%) |
| 6 to 18 Years | 1,645 (92.5%) | 133 (7.5%) |
| 19 to 25 Years | 2,590 (89.3%) | 310 (10.7%) |
| 26 to 34 Years | 241 (100.0%) | 0 (0.0%) |
| 35 to 44 Years | 332 (100.0%) | 0 (0.0%) |
| 45 to 54 Years | 295 (100.0%) | 0 (0.0%) |
| 55 to 64 Years | 396 (100.0%) | 0 (0.0%) |
| 65 to 74 Years | 201 (100.0%) | 0 (0.0%) |
| 75 Years and older | 271 (100.0%) | 0 (0.0%) |
| Total | 6,079 (93.2%) | 443 (6.8%) |
Health Insurance Coverage by Citizenship Status in South Hill
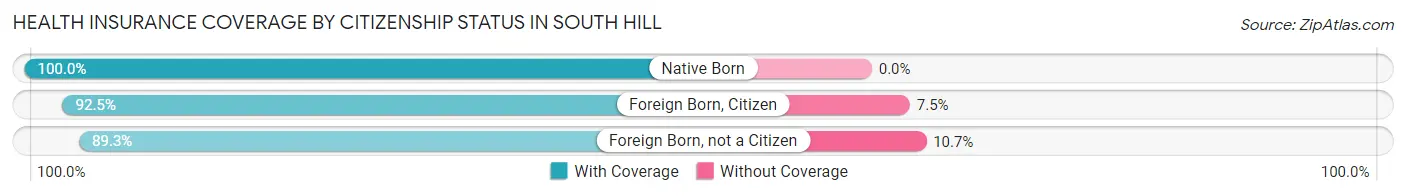
| Citizenship Status | With Coverage | Without Coverage |
| Native Born | 108 (100.0%) | 0 (0.0%) |
| Foreign Born, Citizen | 1,645 (92.5%) | 133 (7.5%) |
| Foreign Born, not a Citizen | 2,590 (89.3%) | 310 (10.7%) |
Health Insurance Coverage by Household Income in South Hill
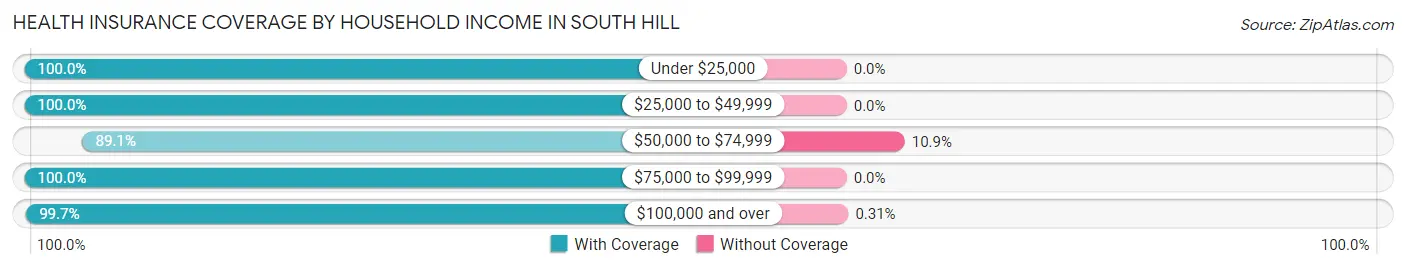
| Household Income | With Coverage | Without Coverage |
| Under $25,000 | 355 (100.0%) | 0 (0.0%) |
| $25,000 to $49,999 | 177 (100.0%) | 0 (0.0%) |
| $50,000 to $74,999 | 205 (89.1%) | 25 (10.9%) |
| $75,000 to $99,999 | 223 (100.0%) | 0 (0.0%) |
| $100,000 and over | 1,626 (99.7%) | 5 (0.3%) |
Public vs Private Health Insurance Coverage by Age in South Hill
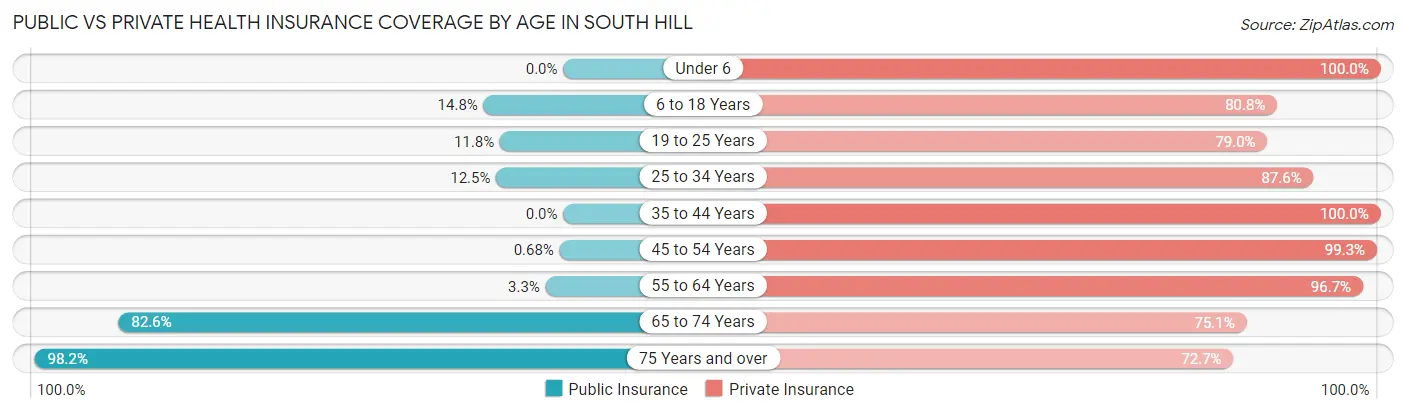
| Age Bracket | Public Insurance | Private Insurance |
| Under 6 | 0 (0.0%) | 108 (100.0%) |
| 6 to 18 Years | 263 (14.8%) | 1,437 (80.8%) |
| 19 to 25 Years | 341 (11.8%) | 2,291 (79.0%) |
| 25 to 34 Years | 30 (12.4%) | 211 (87.5%) |
| 35 to 44 Years | 0 (0.0%) | 332 (100.0%) |
| 45 to 54 Years | 2 (0.7%) | 293 (99.3%) |
| 55 to 64 Years | 13 (3.3%) | 383 (96.7%) |
| 65 to 74 Years | 166 (82.6%) | 151 (75.1%) |
| 75 Years and over | 266 (98.2%) | 197 (72.7%) |
| Total | 1,081 (16.6%) | 5,403 (82.8%) |
Disability Status by Sex by Age in South Hill
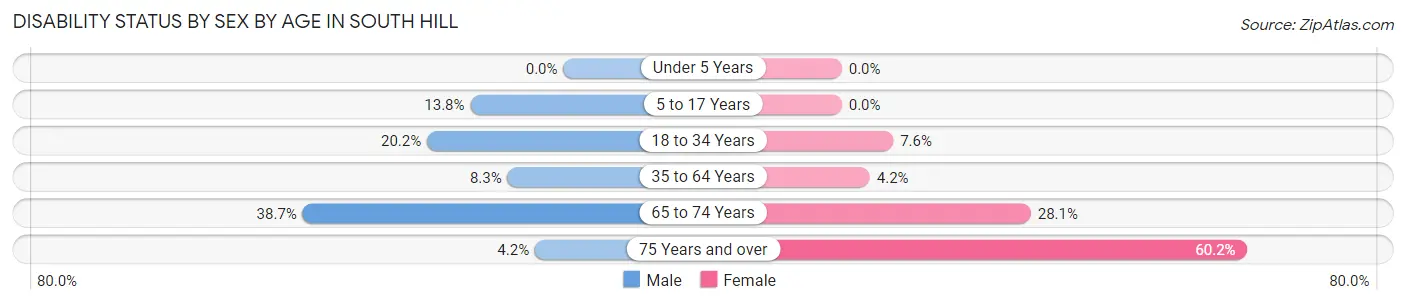
| Age Bracket | Male | Female |
| Under 5 Years | 0 (0.0%) | 0 (0.0%) |
| 5 to 17 Years | 25 (13.8%) | 0 (0.0%) |
| 18 to 34 Years | 458 (20.2%) | 177 (7.6%) |
| 35 to 64 Years | 43 (8.3%) | 21 (4.2%) |
| 65 to 74 Years | 24 (38.7%) | 39 (28.1%) |
| 75 Years and over | 4 (4.2%) | 106 (60.2%) |
Disability Class by Sex by Age in South Hill
Disability Class: Hearing Difficulty
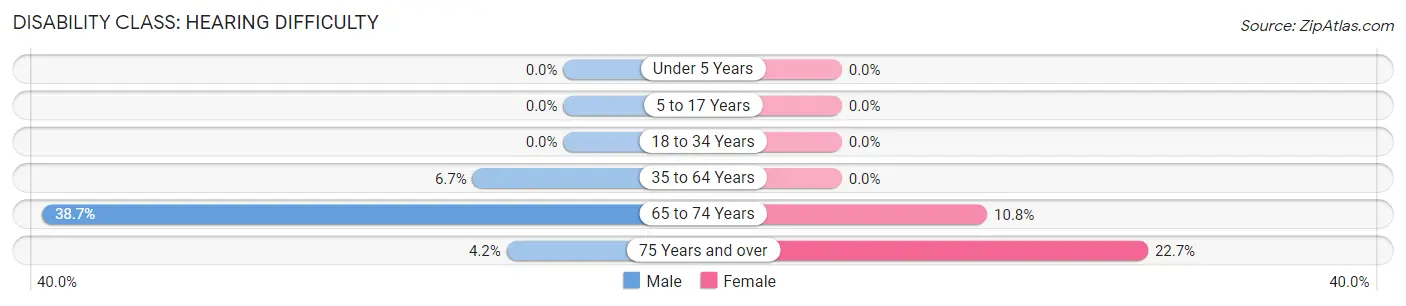
| Age Bracket | Male | Female |
| Under 5 Years | 0 (0.0%) | 0 (0.0%) |
| 5 to 17 Years | 0 (0.0%) | 0 (0.0%) |
| 18 to 34 Years | 0 (0.0%) | 0 (0.0%) |
| 35 to 64 Years | 35 (6.7%) | 0 (0.0%) |
| 65 to 74 Years | 24 (38.7%) | 15 (10.8%) |
| 75 Years and over | 4 (4.2%) | 40 (22.7%) |
Disability Class: Vision Difficulty
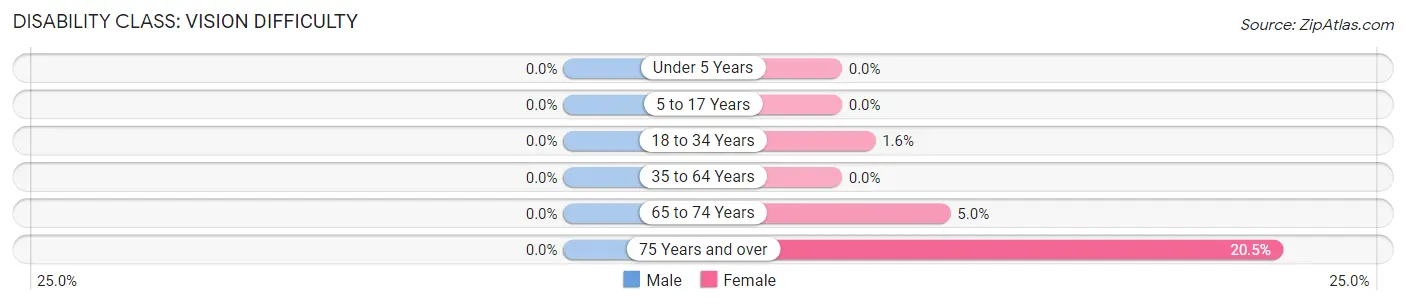
| Age Bracket | Male | Female |
| Under 5 Years | 0 (0.0%) | 0 (0.0%) |
| 5 to 17 Years | 0 (0.0%) | 0 (0.0%) |
| 18 to 34 Years | 0 (0.0%) | 36 (1.5%) |
| 35 to 64 Years | 0 (0.0%) | 0 (0.0%) |
| 65 to 74 Years | 0 (0.0%) | 7 (5.0%) |
| 75 Years and over | 0 (0.0%) | 36 (20.4%) |
Disability Class: Cognitive Difficulty
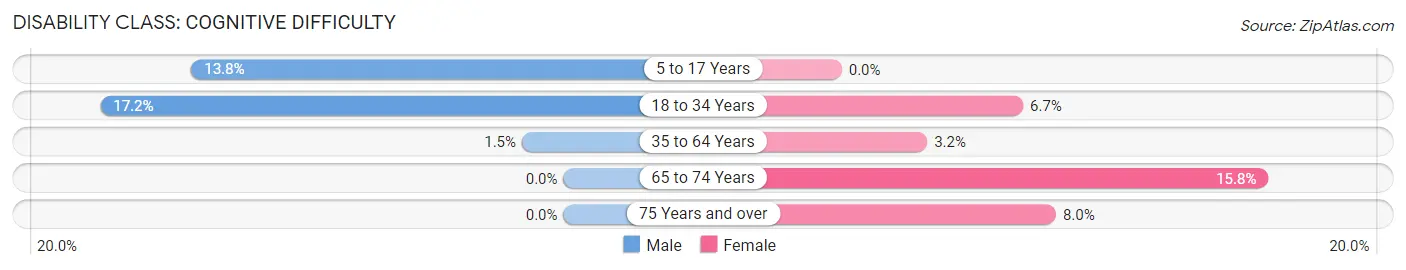
| Age Bracket | Male | Female |
| 5 to 17 Years | 25 (13.8%) | 0 (0.0%) |
| 18 to 34 Years | 389 (17.2%) | 156 (6.7%) |
| 35 to 64 Years | 8 (1.5%) | 16 (3.2%) |
| 65 to 74 Years | 0 (0.0%) | 22 (15.8%) |
| 75 Years and over | 0 (0.0%) | 14 (8.0%) |
Disability Class: Ambulatory Difficulty
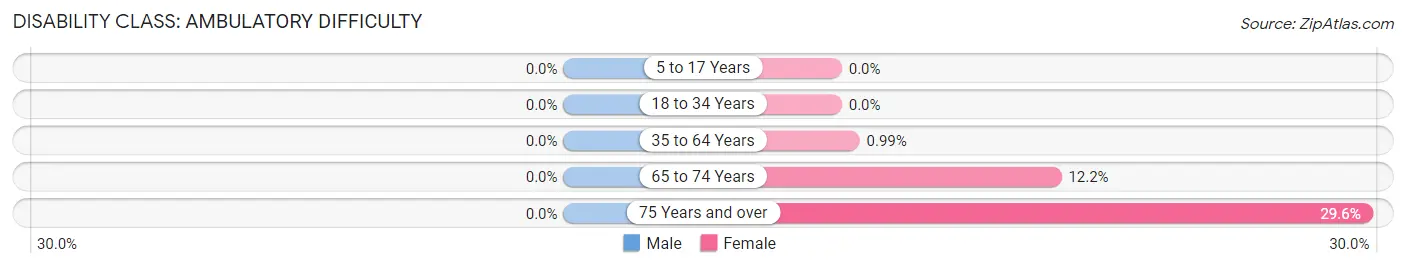
| Age Bracket | Male | Female |
| 5 to 17 Years | 0 (0.0%) | 0 (0.0%) |
| 18 to 34 Years | 0 (0.0%) | 0 (0.0%) |
| 35 to 64 Years | 0 (0.0%) | 5 (1.0%) |
| 65 to 74 Years | 0 (0.0%) | 17 (12.2%) |
| 75 Years and over | 0 (0.0%) | 52 (29.5%) |
Disability Class: Self-Care Difficulty
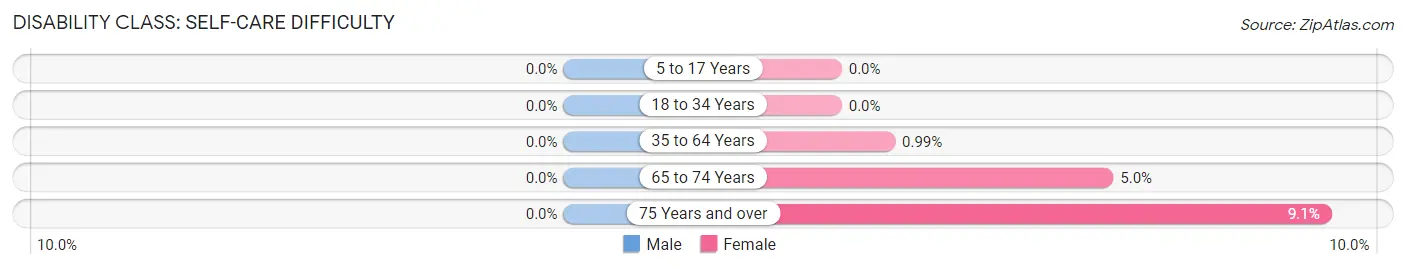
| Age Bracket | Male | Female |
| 5 to 17 Years | 0 (0.0%) | 0 (0.0%) |
| 18 to 34 Years | 0 (0.0%) | 0 (0.0%) |
| 35 to 64 Years | 0 (0.0%) | 5 (1.0%) |
| 65 to 74 Years | 0 (0.0%) | 7 (5.0%) |
| 75 Years and over | 0 (0.0%) | 16 (9.1%) |
Technology Access in South Hill
Computing Device Access in South Hill
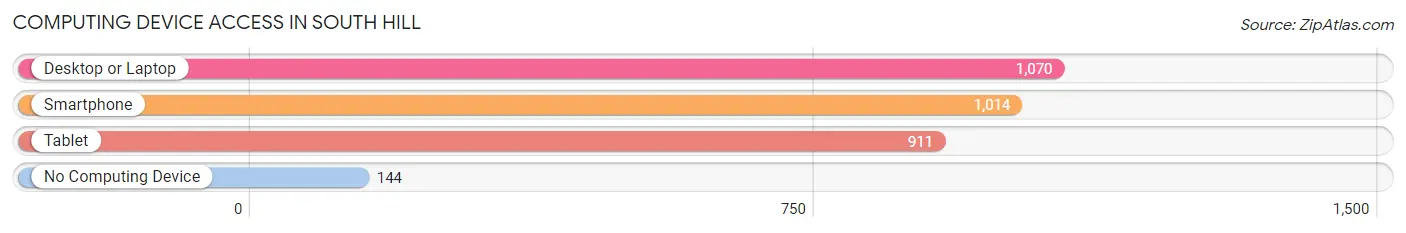
| Device Type | # Households | % Households |
| Desktop or Laptop | 1,070 | 83.7% |
| Smartphone | 1,014 | 79.3% |
| Tablet | 911 | 71.2% |
| No Computing Device | 144 | 11.3% |
| Total | 1,279 | 100.0% |
Internet Access in South Hill
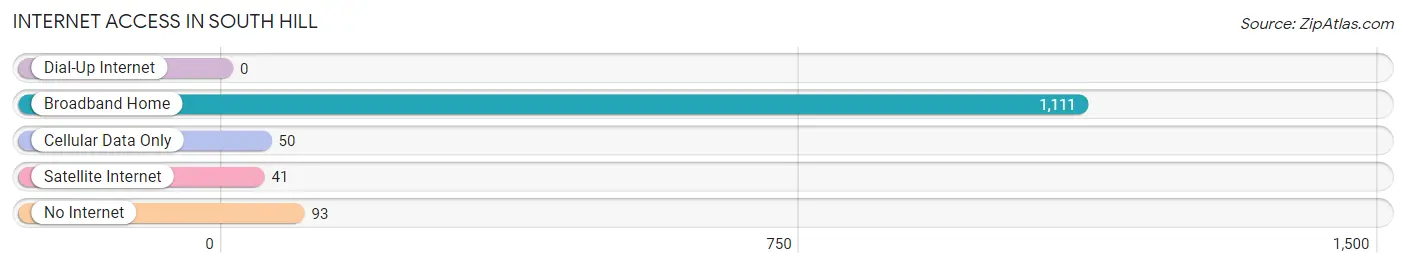
| Internet Type | # Households | % Households |
| Dial-Up Internet | 0 | 0.0% |
| Broadband Home | 1,111 | 86.9% |
| Cellular Data Only | 50 | 3.9% |
| Satellite Internet | 41 | 3.2% |
| No Internet | 93 | 7.3% |
| Total | 1,279 | 100.0% |
South Hill Summary
History
South Hill is a small hamlet located in the town of Brookhaven in Suffolk County, New York. The hamlet was first settled in the late 1700s by a group of settlers from Connecticut. The settlers were attracted to the area due to its fertile soil and abundant natural resources. The hamlet was originally known as “South Hill” due to its location on the south side of the Long Island Sound.
The hamlet was officially incorporated in 1845 and was home to a variety of industries, including farming, fishing, and lumbering. The hamlet was also home to a number of small businesses, including a general store, a blacksmith shop, and a post office.
In the late 1800s, the hamlet began to experience a period of growth and development. The population increased from just over 200 in 1880 to nearly 1,000 by 1900. This growth was largely due to the influx of immigrants from Europe, particularly from Italy and Ireland.
The hamlet continued to grow throughout the 20th century, reaching a peak population of 1,845 in 2000. This growth was largely due to the development of the nearby Long Island Expressway, which made the hamlet more accessible to commuters.
Geography
South Hill is located in the town of Brookhaven in Suffolk County, New York. The hamlet is situated on the south side of the Long Island Sound, approximately 25 miles east of New York City. The hamlet is bordered by the hamlets of East Patchogue to the west, Bellport to the north, and Mastic Beach to the east.
The hamlet is primarily composed of residential neighborhoods, with a few small businesses located along the main roads. The hamlet is home to several parks, including South Hill Park, which features a playground, basketball courts, and a baseball field.
Economy
The economy of South Hill is largely based on the service industry. The hamlet is home to a variety of small businesses, including restaurants, retail stores, and professional services. The hamlet is also home to a number of manufacturing companies, including a plastics factory and a printing company.
The hamlet is also home to a number of educational institutions, including South Hill Elementary School and South Hill High School. The hamlet is also home to a number of churches, including the South Hill United Methodist Church and the South Hill Baptist Church.
Demographics
As of the 2010 census, the population of South Hill was 1,845. The racial makeup of the hamlet was 87.3% White, 5.2% African American, 0.7% Native American, 1.2% Asian, and 4.6% from other races. Hispanic or Latino of any race were 8.2% of the population.
The median household income in South Hill was $63,750, and the median family income was $76,250. The per capita income in South Hill was $30,945. About 5.2% of families and 7.2% of the population were below the poverty line, including 8.3% of those under age 18 and 4.2% of those age 65 or over.
Common Questions
What is Per Capita Income in South Hill?
Per Capita income in South Hill is $26,430.
What is the Median Family Income in South Hill?
Median Family Income in South Hill is $168,036.
What is the Median Household income in South Hill?
Median Household Income in South Hill is $107,536.
What is Income or Wage Gap in South Hill?
Income or Wage Gap in South Hill is 33.9%.
Women in South Hill earn 66.1 cents for every dollar earned by a man.
What is Inequality or Gini Index in South Hill?
Inequality or Gini Index in South Hill is 0.48.
What is the Total Population of South Hill?
Total Population of South Hill is 6,613.
What is the Total Male Population of South Hill?
Total Male Population of South Hill is 3,246.
What is the Total Female Population of South Hill?
Total Female Population of South Hill is 3,367.
What is the Ratio of Males per 100 Females in South Hill?
There are 96.41 Males per 100 Females in South Hill.
What is the Ratio of Females per 100 Males in South Hill?
There are 103.73 Females per 100 Males in South Hill.
What is the Median Population Age in South Hill?
Median Population Age in South Hill is 20.1 Years.
What is the Average Family Size in South Hill
Average Family Size in South Hill is 2.7 People.
What is the Average Household Size in South Hill
Average Household Size in South Hill is 2.1 People.
How Large is the Labor Force in South Hill?
There are 2,313 People in the Labor Forcein in South Hill.
What is the Percentage of People in the Labor Force in South Hill?
36.8% of People are in the Labor Force in South Hill.
What is the Unemployment Rate in South Hill?
Unemployment Rate in South Hill is 3.5%.