Zip Codes with the Highest Percentage of Families with Income Above $100,000 in Plattsburgh, NY
RELATED REPORTS & OPTIONS
Family Income | $100k+
Plattsburgh
Compare Zip Codes
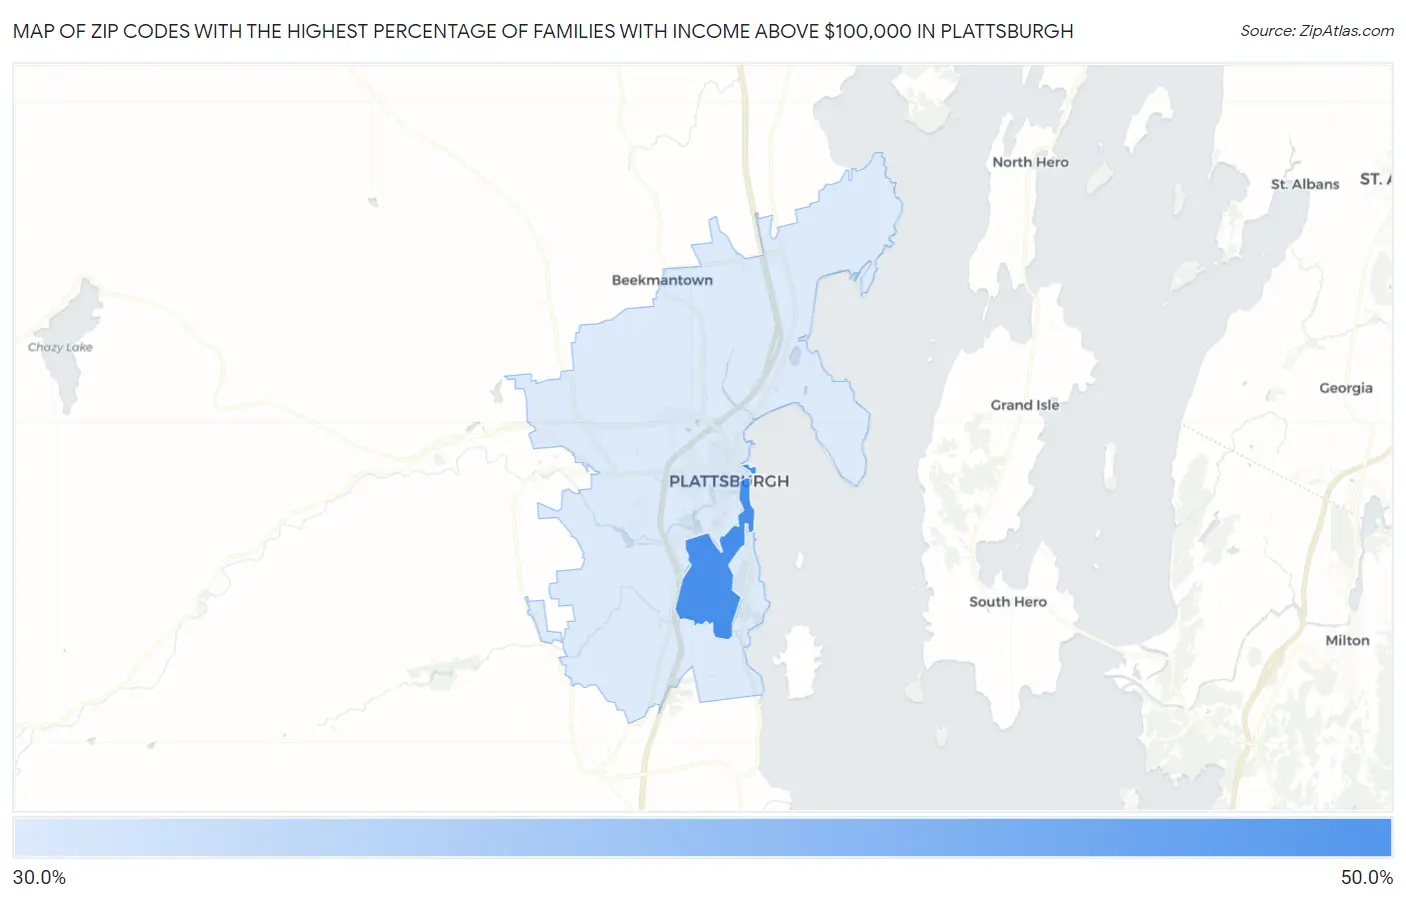
Map of Zip Codes with the Highest Percentage of Families with Income Above $100,000 in Plattsburgh
38.8%
49.3%
Zip Codes with the Highest Percentage of Families with Income Above $100,000 in Plattsburgh, NY
| Zip Code | Families with Income > $100k | vs State | vs National | |
| 1. | 12903 | 49.3% | 50.3%(-1.00)#745 | 46.1%(+3.20)#9,172 |
| 2. | 12901 | 38.8% | 50.3%(-11.5)#1,102 | 46.1%(-7.30)#15,210 |
1
Common Questions
What are the Top Zip Codes with the Highest Percentage of Families with Income Above $100,000 in Plattsburgh, NY?
Top Zip Codes with the Highest Percentage of Families with Income Above $100,000 in Plattsburgh, NY are:
What zip code has the Highest Percentage of Families with Income Above $100,000 in Plattsburgh, NY?
12903 has the Highest Percentage of Families with Income Above $100,000 in Plattsburgh, NY with 49.3%.
What is the Percentage of Families with Income Above $100,000 in Plattsburgh, NY?
Percentage of Families with Income Above $100,000 in Plattsburgh is 36.0%.
What is the Percentage of Families with Income Above $100,000 in New York?
Percentage of Families with Income Above $100,000 in New York is 50.3%.
What is the Percentage of Families with Income Above $100,000 in the United States?
Percentage of Families with Income Above $100,000 in the United States is 46.1%.