Grand View on Hudson, NY Map & Demographics
Grand View on Hudson Map
Grand View on Hudson Overview
$105,455
PER CAPITA INCOME
$186,250
AVG FAMILY INCOME
$144,519
AVG HOUSEHOLD INCOME
0.53
INEQUALITY / GINI INDEX
212
TOTAL POPULATION
87
MALE POPULATION
125
FEMALE POPULATION
69.60
MALES / 100 FEMALES
143.68
FEMALES / 100 MALES
58.3
MEDIAN AGE
2.5
AVG FAMILY SIZE
2.1
AVG HOUSEHOLD SIZE
91
LABOR FORCE [ PEOPLE ]
46.7%
PERCENT IN LABOR FORCE
4.4%
UNEMPLOYMENT RATE
Income in Grand View on Hudson
Income Overview in Grand View on Hudson
Per Capita Income in Grand View on Hudson is $105,455, while median incomes of families and households are $186,250 and $144,519 respectively.
| Characteristic | Number | Measure |
| Per Capita Income | 212 | $105,455 |
| Median Family Income | 64 | $186,250 |
| Mean Family Income | 64 | $264,863 |
| Median Household Income | 103 | $144,519 |
| Mean Household Income | 103 | $219,183 |
| Income Deficit | 64 | $0 |
| Wage / Income Gap (%) | 212 | 0.00% |
| Wage / Income Gap ($) | 212 | 100.00¢ per $1 |
| Gini / Inequality Index | 212 | 0.53 |
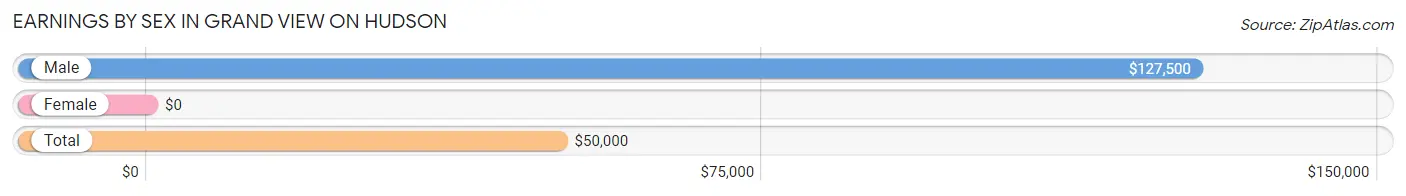
Earnings by Sex in Grand View on Hudson
| Sex | Number | Average Earnings |
| Male | 54 (46.6%) | $127,500 |
| Female | 62 (53.4%) | $0 |
| Total | 116 (100.0%) | $50,000 |
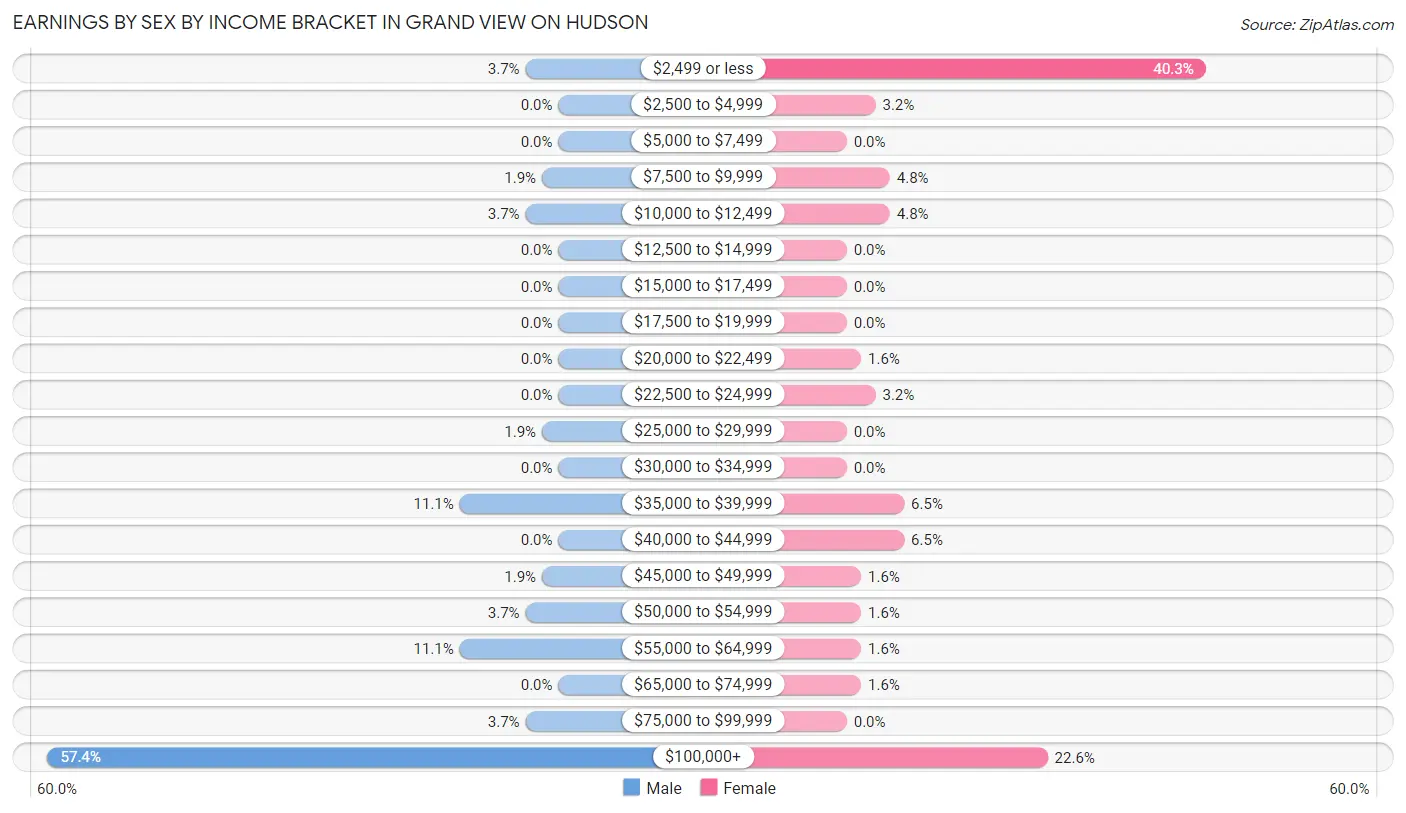
Earnings by Sex by Income Bracket in Grand View on Hudson
The most common earnings brackets in Grand View on Hudson are $100,000+ for men (31 | 57.4%) and $2,499 or less for women (25 | 40.3%).
| Income | Male | Female |
| $2,499 or less | 2 (3.7%) | 25 (40.3%) |
| $2,500 to $4,999 | 0 (0.0%) | 2 (3.2%) |
| $5,000 to $7,499 | 0 (0.0%) | 0 (0.0%) |
| $7,500 to $9,999 | 1 (1.8%) | 3 (4.8%) |
| $10,000 to $12,499 | 2 (3.7%) | 3 (4.8%) |
| $12,500 to $14,999 | 0 (0.0%) | 0 (0.0%) |
| $15,000 to $17,499 | 0 (0.0%) | 0 (0.0%) |
| $17,500 to $19,999 | 0 (0.0%) | 0 (0.0%) |
| $20,000 to $22,499 | 0 (0.0%) | 1 (1.6%) |
| $22,500 to $24,999 | 0 (0.0%) | 2 (3.2%) |
| $25,000 to $29,999 | 1 (1.8%) | 0 (0.0%) |
| $30,000 to $34,999 | 0 (0.0%) | 0 (0.0%) |
| $35,000 to $39,999 | 6 (11.1%) | 4 (6.5%) |
| $40,000 to $44,999 | 0 (0.0%) | 4 (6.5%) |
| $45,000 to $49,999 | 1 (1.8%) | 1 (1.6%) |
| $50,000 to $54,999 | 2 (3.7%) | 1 (1.6%) |
| $55,000 to $64,999 | 6 (11.1%) | 1 (1.6%) |
| $65,000 to $74,999 | 0 (0.0%) | 1 (1.6%) |
| $75,000 to $99,999 | 2 (3.7%) | 0 (0.0%) |
| $100,000+ | 31 (57.4%) | 14 (22.6%) |
| Total | 54 (100.0%) | 62 (100.0%) |
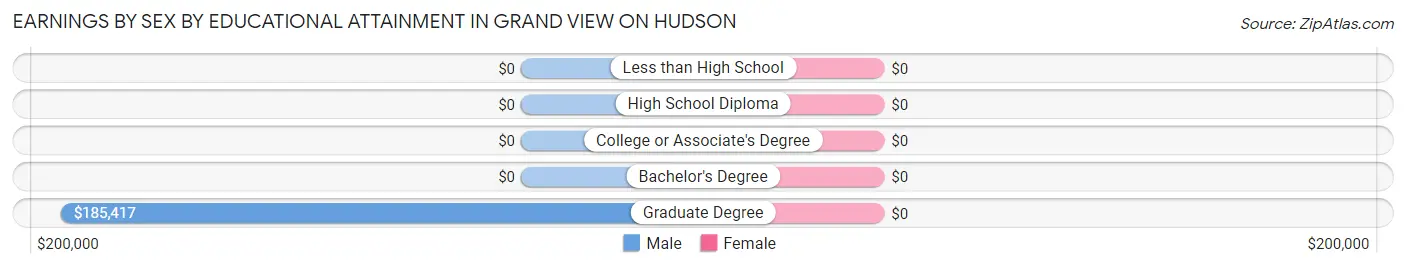
Earnings by Sex by Educational Attainment in Grand View on Hudson
| Educational Attainment | Male Income | Female Income |
| Less than High School | - | - |
| High School Diploma | - | - |
| College or Associate's Degree | - | - |
| Bachelor's Degree | - | - |
| Graduate Degree | $185,417 | $0 |
| Total | $156,250 | $0 |
Family Income in Grand View on Hudson
Family Income Brackets in Grand View on Hudson
According to the Grand View on Hudson family income data, there are 30 families falling into the $200,000+ income range, which is the most common income bracket and makes up 46.9% of all families.
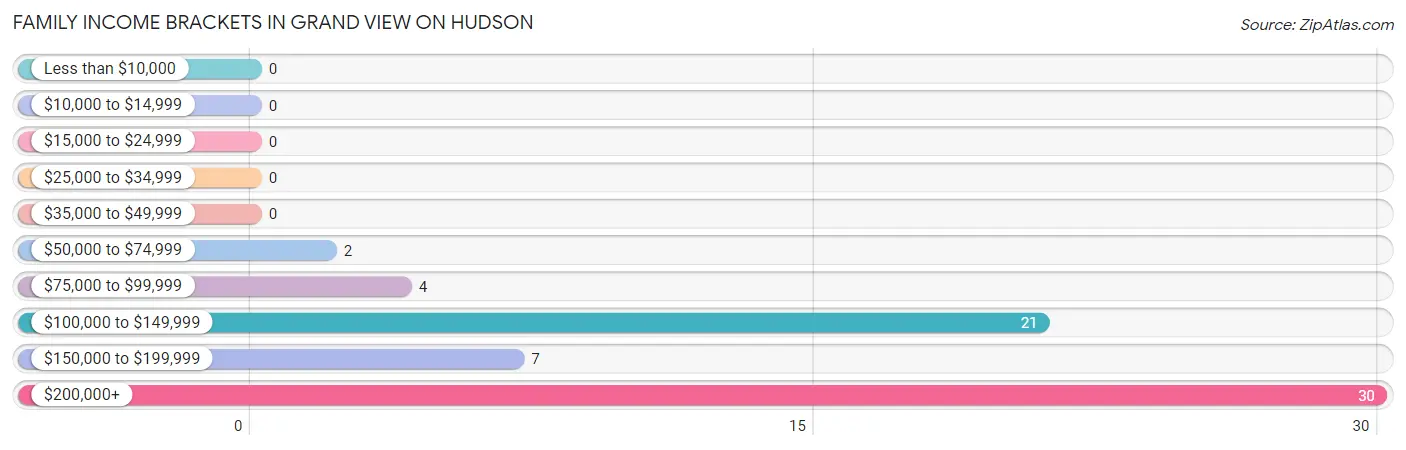
| Income Bracket | # Families | % Families |
| Less than $10,000 | 0 | 0.0% |
| $10,000 to $14,999 | 0 | 0.0% |
| $15,000 to $24,999 | 0 | 0.0% |
| $25,000 to $34,999 | 0 | 0.0% |
| $35,000 to $49,999 | 0 | 0.0% |
| $50,000 to $74,999 | 2 | 3.1% |
| $75,000 to $99,999 | 4 | 6.3% |
| $100,000 to $149,999 | 21 | 32.8% |
| $150,000 to $199,999 | 7 | 10.9% |
| $200,000+ | 30 | 46.9% |
Family Income by Famaliy Size in Grand View on Hudson
4-person families (5 | 7.8%) account for the highest median family income in Grand View on Hudson with $250,001 per family, while 2-person families (47 | 73.4%) have the highest median income of $92,656 per family member.
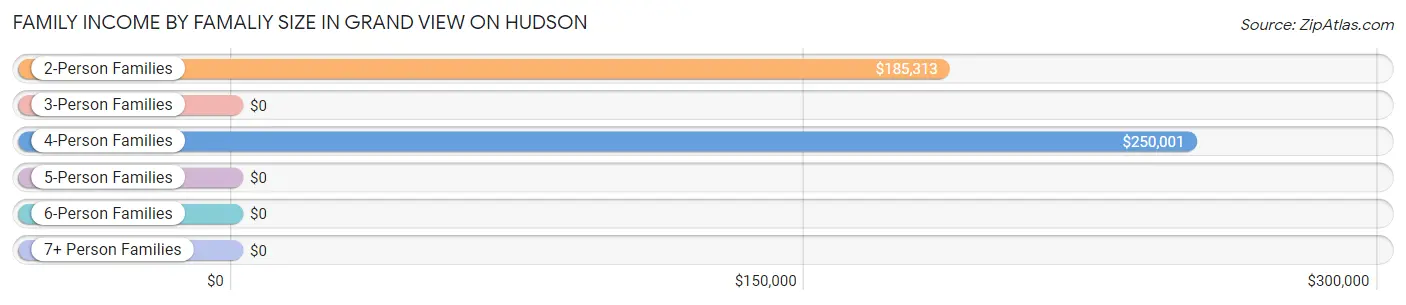
| Income Bracket | # Families | Median Income |
| 2-Person Families | 47 (73.4%) | $185,313 |
| 3-Person Families | 10 (15.6%) | $0 |
| 4-Person Families | 5 (7.8%) | $250,001 |
| 5-Person Families | 2 (3.1%) | $0 |
| 6-Person Families | 0 (0.0%) | $0 |
| 7+ Person Families | 0 (0.0%) | $0 |
| Total | 64 (100.0%) | $186,250 |
Family Income by Number of Earners in Grand View on Hudson
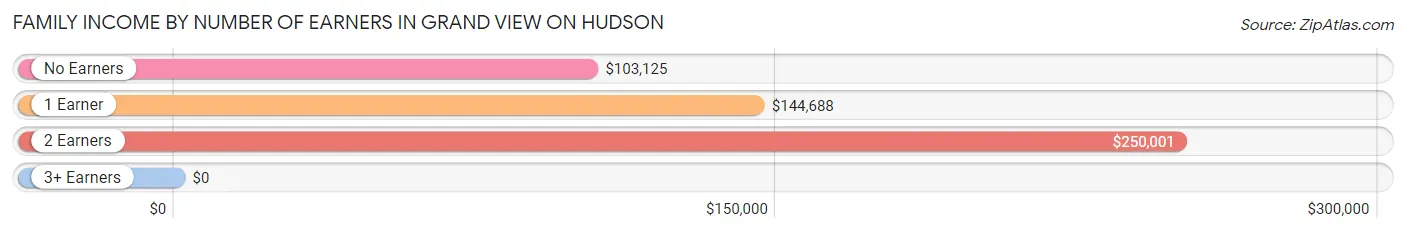
| Number of Earners | # Families | Median Income |
| No Earners | 5 (7.8%) | $103,125 |
| 1 Earner | 35 (54.7%) | $144,688 |
| 2 Earners | 23 (35.9%) | $250,001 |
| 3+ Earners | 1 (1.6%) | $0 |
| Total | 64 (100.0%) | $186,250 |
Household Income in Grand View on Hudson
Household Income Brackets in Grand View on Hudson
With 36 households falling in the category, the $200,000+ income range is the most frequent in Grand View on Hudson, accounting for 34.9% of all households. In contrast, only 1 households (1.0%) fall into the $15,000 to $24,999 income bracket, making it the least populous group.
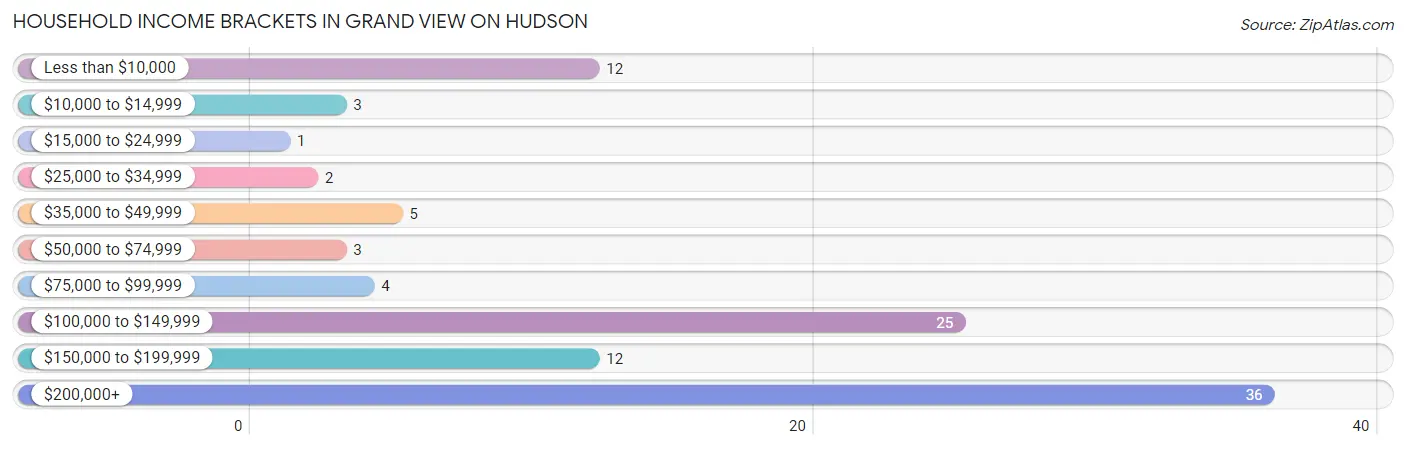
| Income Bracket | # Households | % Households |
| Less than $10,000 | 12 | 11.7% |
| $10,000 to $14,999 | 3 | 2.9% |
| $15,000 to $24,999 | 1 | 1.0% |
| $25,000 to $34,999 | 2 | 1.9% |
| $35,000 to $49,999 | 5 | 4.9% |
| $50,000 to $74,999 | 3 | 2.9% |
| $75,000 to $99,999 | 4 | 3.9% |
| $100,000 to $149,999 | 25 | 24.3% |
| $150,000 to $199,999 | 12 | 11.7% |
| $200,000+ | 36 | 35.0% |
Household Income by Householder Age in Grand View on Hudson
The median household income in Grand View on Hudson is $144,519, with the highest median household income of $250,001 found in the 25 to 44 years age bracket for the primary householder. A total of 6 households (5.8%) fall into this category.
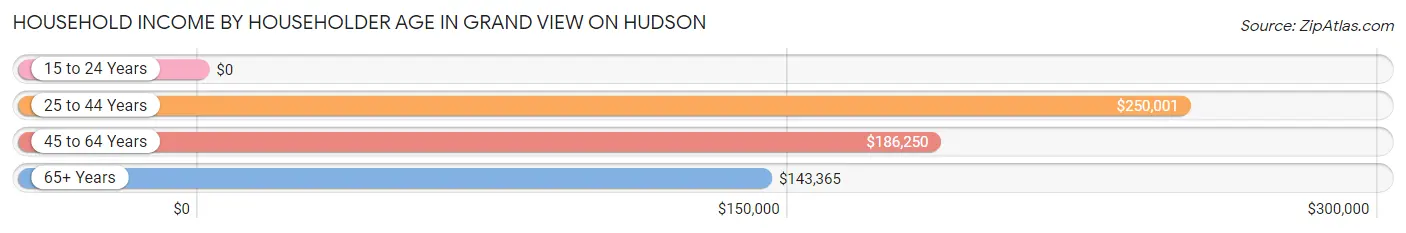
| Income Bracket | # Households | Median Income |
| 15 to 24 Years | 0 (0.0%) | $0 |
| 25 to 44 Years | 6 (5.8%) | $250,001 |
| 45 to 64 Years | 46 (44.7%) | $186,250 |
| 65+ Years | 51 (49.5%) | $143,365 |
| Total | 103 (100.0%) | $144,519 |
Poverty in Grand View on Hudson
Income Below Poverty by Sex and Age in Grand View on Hudson
With 5.8% poverty level for males and 11.2% for females among the residents of Grand View on Hudson, 55 to 64 year old males and 25 to 34 year old females are the most vulnerable to poverty, with 5 males (16.7%) and 3 females (60.0%) in their respective age groups living below the poverty level.
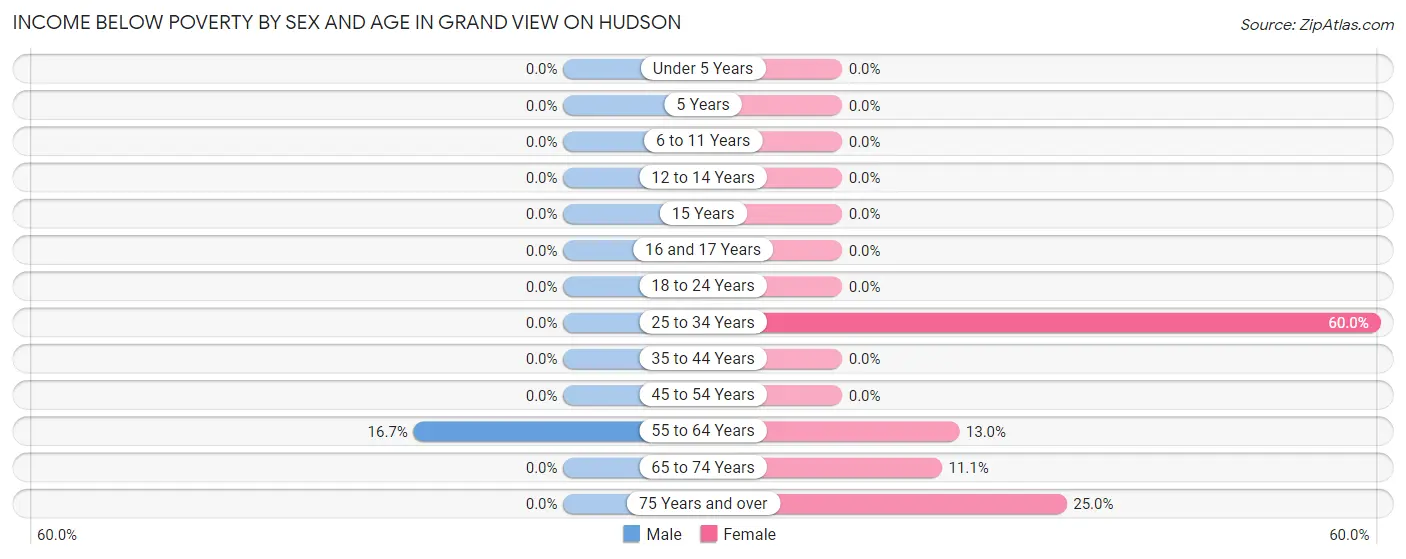
| Age Bracket | Male | Female |
| Under 5 Years | 0 (0.0%) | 0 (0.0%) |
| 5 Years | 0 (0.0%) | 0 (0.0%) |
| 6 to 11 Years | 0 (0.0%) | 0 (0.0%) |
| 12 to 14 Years | 0 (0.0%) | 0 (0.0%) |
| 15 Years | 0 (0.0%) | 0 (0.0%) |
| 16 and 17 Years | 0 (0.0%) | 0 (0.0%) |
| 18 to 24 Years | 0 (0.0%) | 0 (0.0%) |
| 25 to 34 Years | 0 (0.0%) | 3 (60.0%) |
| 35 to 44 Years | 0 (0.0%) | 0 (0.0%) |
| 45 to 54 Years | 0 (0.0%) | 0 (0.0%) |
| 55 to 64 Years | 5 (16.7%) | 3 (13.0%) |
| 65 to 74 Years | 0 (0.0%) | 3 (11.1%) |
| 75 Years and over | 0 (0.0%) | 5 (25.0%) |
| Total | 5 (5.8%) | 14 (11.2%) |
Income Above Poverty by Sex and Age in Grand View on Hudson
According to the poverty statistics in Grand View on Hudson, males aged under 5 years and females aged under 5 years are the age groups that are most secure financially, with 100.0% of males and 100.0% of females in these age groups living above the poverty line.
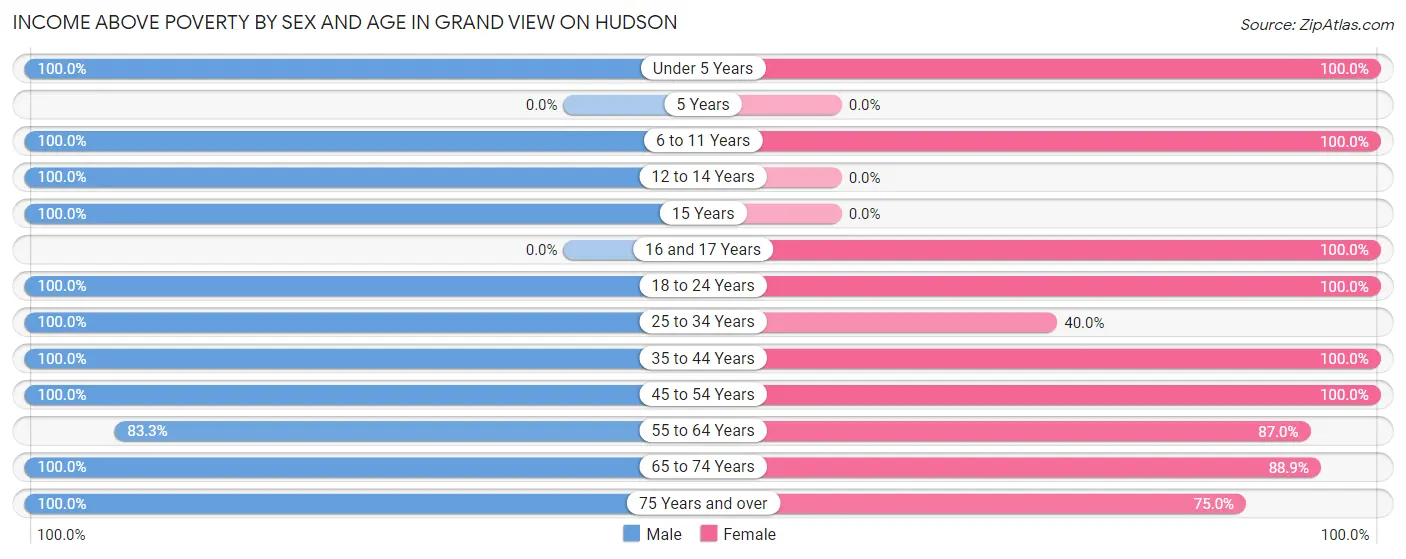
| Age Bracket | Male | Female |
| Under 5 Years | 3 (100.0%) | 2 (100.0%) |
| 5 Years | 0 (0.0%) | 0 (0.0%) |
| 6 to 11 Years | 2 (100.0%) | 6 (100.0%) |
| 12 to 14 Years | 1 (100.0%) | 0 (0.0%) |
| 15 Years | 2 (100.0%) | 0 (0.0%) |
| 16 and 17 Years | 0 (0.0%) | 23 (100.0%) |
| 18 to 24 Years | 3 (100.0%) | 4 (100.0%) |
| 25 to 34 Years | 2 (100.0%) | 2 (40.0%) |
| 35 to 44 Years | 5 (100.0%) | 5 (100.0%) |
| 45 to 54 Years | 11 (100.0%) | 10 (100.0%) |
| 55 to 64 Years | 25 (83.3%) | 20 (87.0%) |
| 65 to 74 Years | 13 (100.0%) | 24 (88.9%) |
| 75 Years and over | 14 (100.0%) | 15 (75.0%) |
| Total | 81 (94.2%) | 111 (88.8%) |
Income Below Poverty Among Married-Couple Families in Grand View on Hudson
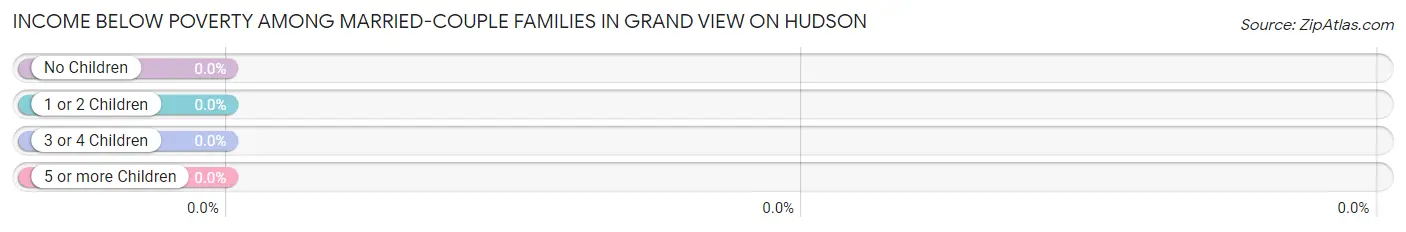
| Children | Above Poverty | Below Poverty |
| No Children | 40 (100.0%) | 0 (0.0%) |
| 1 or 2 Children | 7 (100.0%) | 0 (0.0%) |
| 3 or 4 Children | 2 (100.0%) | 0 (0.0%) |
| 5 or more Children | 0 (0.0%) | 0 (0.0%) |
| Total | 49 (100.0%) | 0 (0.0%) |
Income Below Poverty Among Single-Parent Households in Grand View on Hudson
| Children | Single Father | Single Mother |
| No Children | 0 (0.0%) | 0 (0.0%) |
| 1 or 2 Children | 0 (0.0%) | 0 (0.0%) |
| 3 or 4 Children | 0 (0.0%) | 0 (0.0%) |
| 5 or more Children | 0 (0.0%) | 0 (0.0%) |
| Total | 0 (0.0%) | 0 (0.0%) |
Income Below Poverty Among Married-Couple vs Single-Parent Households in Grand View on Hudson
| Children | Married-Couple Families | Single-Parent Households |
| No Children | 0 (0.0%) | 0 (0.0%) |
| 1 or 2 Children | 0 (0.0%) | 0 (0.0%) |
| 3 or 4 Children | 0 (0.0%) | 0 (0.0%) |
| 5 or more Children | 0 (0.0%) | 0 (0.0%) |
| Total | 0 (0.0%) | 0 (0.0%) |
Race in Grand View on Hudson
The most populous races in Grand View on Hudson are White / Caucasian (185 | 87.3%), Asian (17 | 8.0%), and Hispanic or Latino (16 | 7.5%).
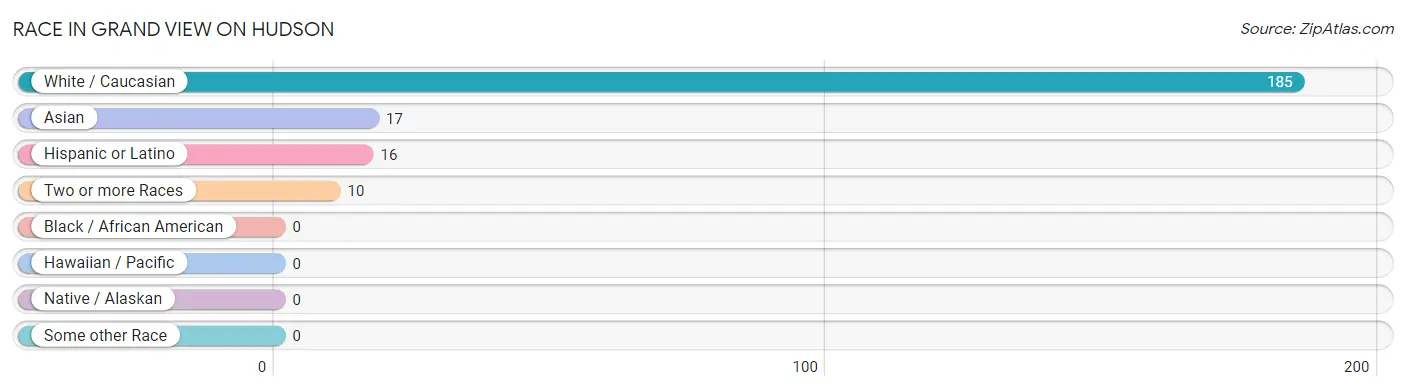
| Race | # Population | % Population |
| Asian | 17 | 8.0% |
| Black / African American | 0 | 0.0% |
| Hawaiian / Pacific | 0 | 0.0% |
| Hispanic or Latino | 16 | 7.5% |
| Native / Alaskan | 0 | 0.0% |
| White / Caucasian | 185 | 87.3% |
| Two or more Races | 10 | 4.7% |
| Some other Race | 0 | 0.0% |
| Total | 212 | 100.0% |
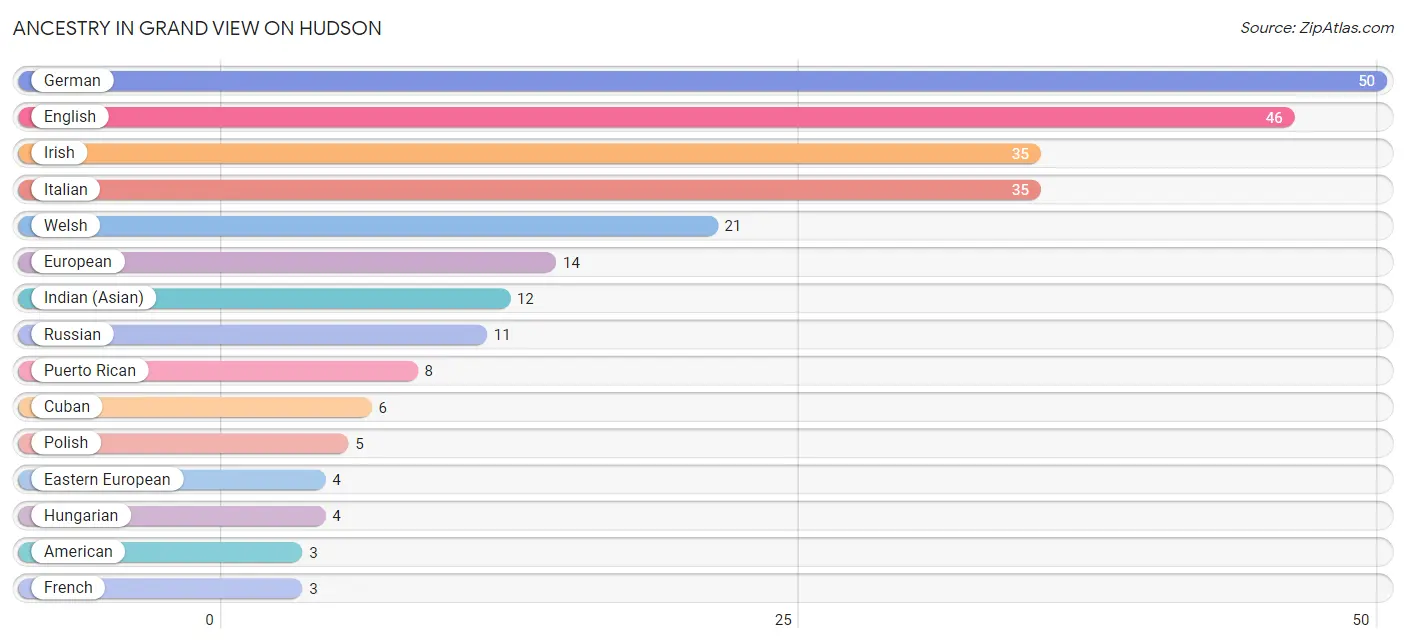
Ancestry in Grand View on Hudson
The most populous ancestries reported in Grand View on Hudson are German (50 | 23.6%), English (46 | 21.7%), Irish (35 | 16.5%), Italian (35 | 16.5%), and Welsh (21 | 9.9%), together accounting for 88.2% of all Grand View on Hudson residents.
| Ancestry | # Population | % Population |
| Albanian | 1 | 0.5% |
| American | 3 | 1.4% |
| Austrian | 2 | 0.9% |
| Belgian | 2 | 0.9% |
| British | 1 | 0.5% |
| Cuban | 6 | 2.8% |
| Dutch | 1 | 0.5% |
| Eastern European | 4 | 1.9% |
| English | 46 | 21.7% |
| European | 14 | 6.6% |
| French | 3 | 1.4% |
| German | 50 | 23.6% |
| Hungarian | 4 | 1.9% |
| Indian (Asian) | 12 | 5.7% |
| Irish | 35 | 16.5% |
| Italian | 35 | 16.5% |
| Korean | 1 | 0.5% |
| Macedonian | 1 | 0.5% |
| Norwegian | 2 | 0.9% |
| Polish | 5 | 2.4% |
| Puerto Rican | 8 | 3.8% |
| Russian | 11 | 5.2% |
| Scotch-Irish | 1 | 0.5% |
| Scottish | 3 | 1.4% |
| Spaniard | 2 | 0.9% |
| Swedish | 2 | 0.9% |
| Swiss | 1 | 0.5% |
| Thai | 2 | 0.9% |
| Welsh | 21 | 9.9% | View All 29 Rows |
Immigrants in Grand View on Hudson
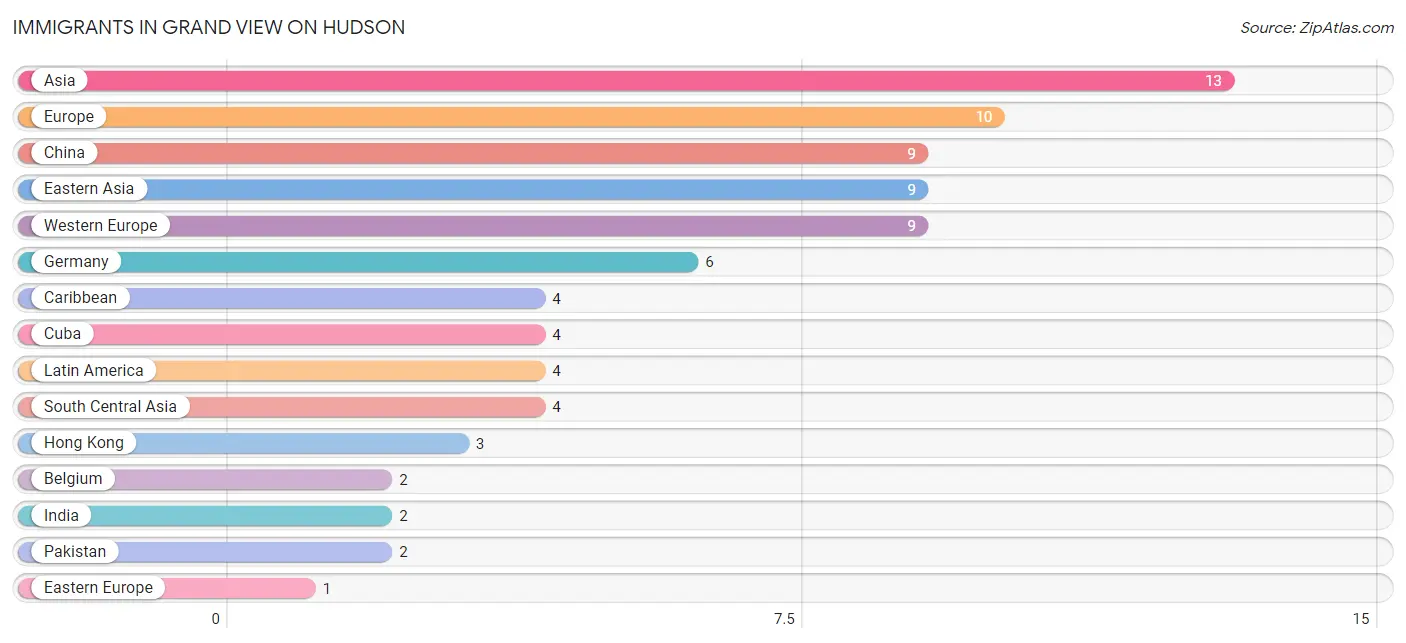
The most numerous immigrant groups reported in Grand View on Hudson came from Asia (13 | 6.1%), Europe (10 | 4.7%), China (9 | 4.3%), Eastern Asia (9 | 4.3%), and Western Europe (9 | 4.3%), together accounting for 23.6% of all Grand View on Hudson residents.
| Immigration Origin | # Population | % Population |
| Asia | 13 | 6.1% |
| Belgium | 2 | 0.9% |
| Caribbean | 4 | 1.9% |
| China | 9 | 4.3% |
| Cuba | 4 | 1.9% |
| Eastern Asia | 9 | 4.3% |
| Eastern Europe | 1 | 0.5% |
| Europe | 10 | 4.7% |
| France | 1 | 0.5% |
| Germany | 6 | 2.8% |
| Hong Kong | 3 | 1.4% |
| India | 2 | 0.9% |
| Latin America | 4 | 1.9% |
| Pakistan | 2 | 0.9% |
| South Central Asia | 4 | 1.9% |
| Western Europe | 9 | 4.3% | View All 16 Rows |
Sex and Age in Grand View on Hudson
Sex and Age in Grand View on Hudson
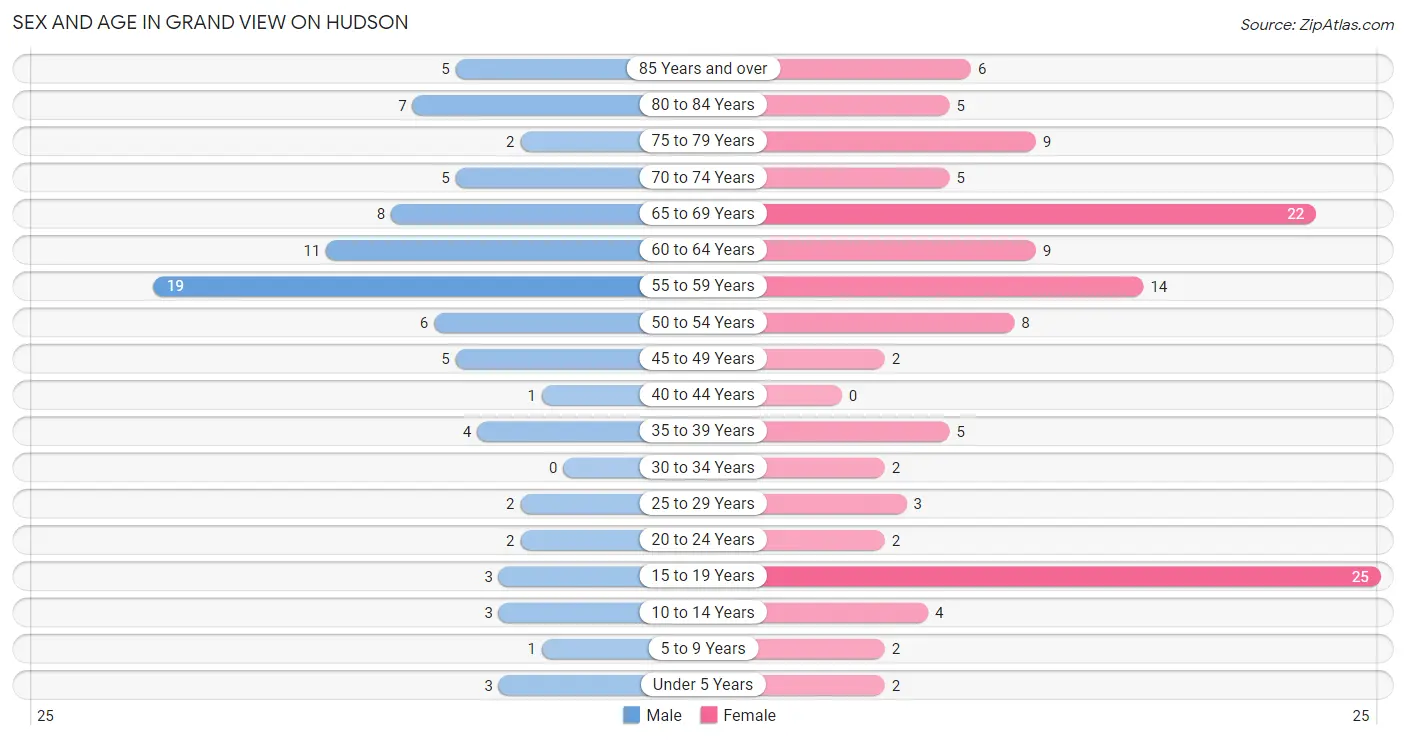
The most populous age groups in Grand View on Hudson are 55 to 59 Years (19 | 21.8%) for men and 15 to 19 Years (25 | 20.0%) for women.
| Age Bracket | Male | Female |
| Under 5 Years | 3 (3.5%) | 2 (1.6%) |
| 5 to 9 Years | 1 (1.1%) | 2 (1.6%) |
| 10 to 14 Years | 3 (3.5%) | 4 (3.2%) |
| 15 to 19 Years | 3 (3.5%) | 25 (20.0%) |
| 20 to 24 Years | 2 (2.3%) | 2 (1.6%) |
| 25 to 29 Years | 2 (2.3%) | 3 (2.4%) |
| 30 to 34 Years | 0 (0.0%) | 2 (1.6%) |
| 35 to 39 Years | 4 (4.6%) | 5 (4.0%) |
| 40 to 44 Years | 1 (1.1%) | 0 (0.0%) |
| 45 to 49 Years | 5 (5.8%) | 2 (1.6%) |
| 50 to 54 Years | 6 (6.9%) | 8 (6.4%) |
| 55 to 59 Years | 19 (21.8%) | 14 (11.2%) |
| 60 to 64 Years | 11 (12.6%) | 9 (7.2%) |
| 65 to 69 Years | 8 (9.2%) | 22 (17.6%) |
| 70 to 74 Years | 5 (5.8%) | 5 (4.0%) |
| 75 to 79 Years | 2 (2.3%) | 9 (7.2%) |
| 80 to 84 Years | 7 (8.1%) | 5 (4.0%) |
| 85 Years and over | 5 (5.8%) | 6 (4.8%) |
| Total | 87 (100.0%) | 125 (100.0%) |
Families and Households in Grand View on Hudson
Median Family Size in Grand View on Hudson
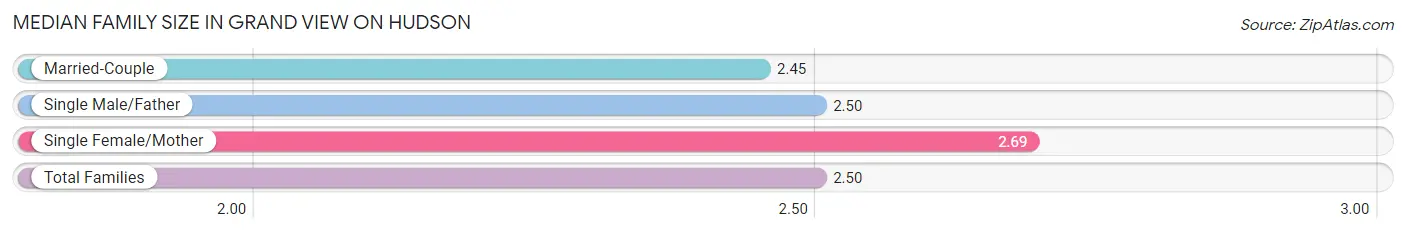
The median family size in Grand View on Hudson is 2.50 persons per family, with single female/mother families (13 | 20.3%) accounting for the largest median family size of 2.69 persons per family. On the other hand, married-couple families (49 | 76.6%) represent the smallest median family size with 2.45 persons per family.
| Family Type | # Families | Family Size |
| Married-Couple | 49 (76.6%) | 2.45 |
| Single Male/Father | 2 (3.1%) | 2.50 |
| Single Female/Mother | 13 (20.3%) | 2.69 |
| Total Families | 64 (100.0%) | 2.50 |
Median Household Size in Grand View on Hudson
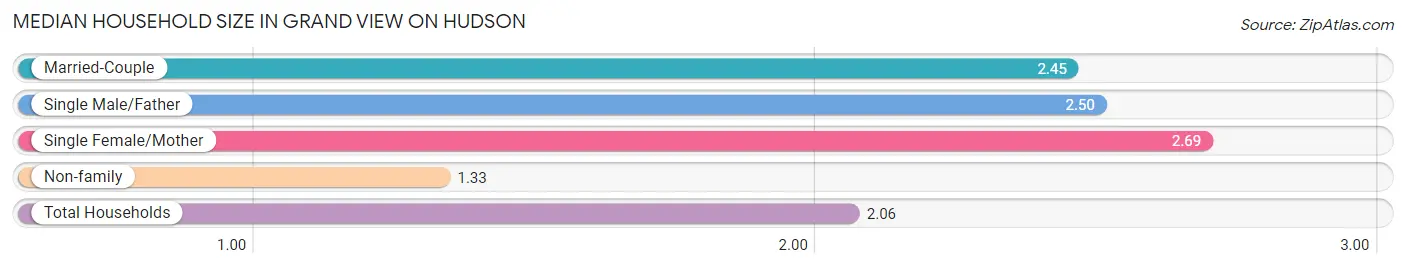
The median household size in Grand View on Hudson is 2.06 persons per household, with single female/mother households (13 | 12.6%) accounting for the largest median household size of 2.69 persons per household. non-family households (39 | 37.9%) represent the smallest median household size with 1.33 persons per household.
| Household Type | # Households | Household Size |
| Married-Couple | 49 (47.6%) | 2.45 |
| Single Male/Father | 2 (1.9%) | 2.50 |
| Single Female/Mother | 13 (12.6%) | 2.69 |
| Non-family | 39 (37.9%) | 1.33 |
| Total Households | 103 (100.0%) | 2.06 |
Household Size by Marriage Status in Grand View on Hudson
Out of a total of 103 households in Grand View on Hudson, 64 (62.1%) are family households, while 39 (37.9%) are nonfamily households. The most numerous type of family households are 2-person households, comprising 47, and the most common type of nonfamily households are 1-person households, comprising 32.
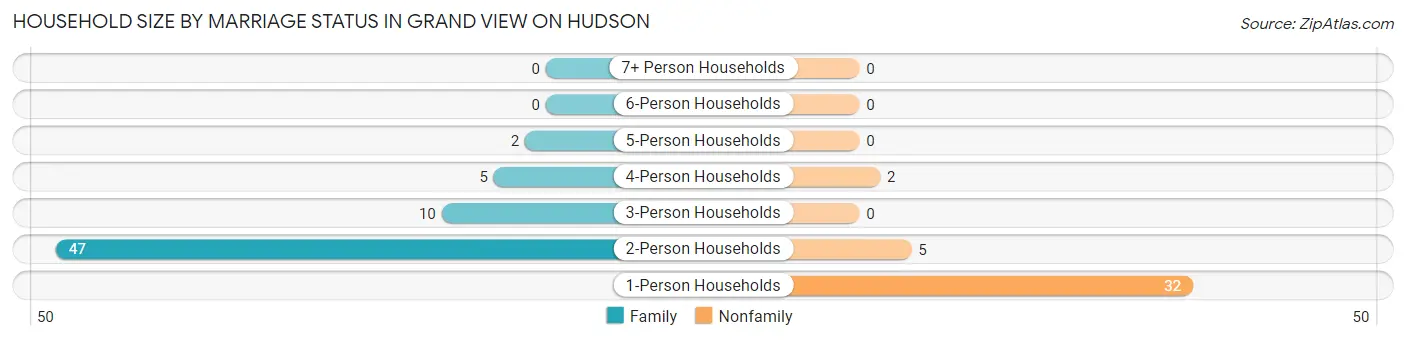
| Household Size | Family Households | Nonfamily Households |
| 1-Person Households | - | 32 (31.1%) |
| 2-Person Households | 47 (45.6%) | 5 (4.9%) |
| 3-Person Households | 10 (9.7%) | 0 (0.0%) |
| 4-Person Households | 5 (4.9%) | 2 (1.9%) |
| 5-Person Households | 2 (1.9%) | 0 (0.0%) |
| 6-Person Households | 0 (0.0%) | 0 (0.0%) |
| 7+ Person Households | 0 (0.0%) | 0 (0.0%) |
| Total | 64 (62.1%) | 39 (37.9%) |
Female Fertility in Grand View on Hudson
Fertility by Age in Grand View on Hudson
Average fertility rate in Grand View on Hudson is 73.0 births per 1,000 women. Women in the age bracket of 20 to 34 years have the highest fertility rate with 429.0 births per 1,000 women. Women in the age bracket of 20 to 34 years acount for 100.0% of all women with births.
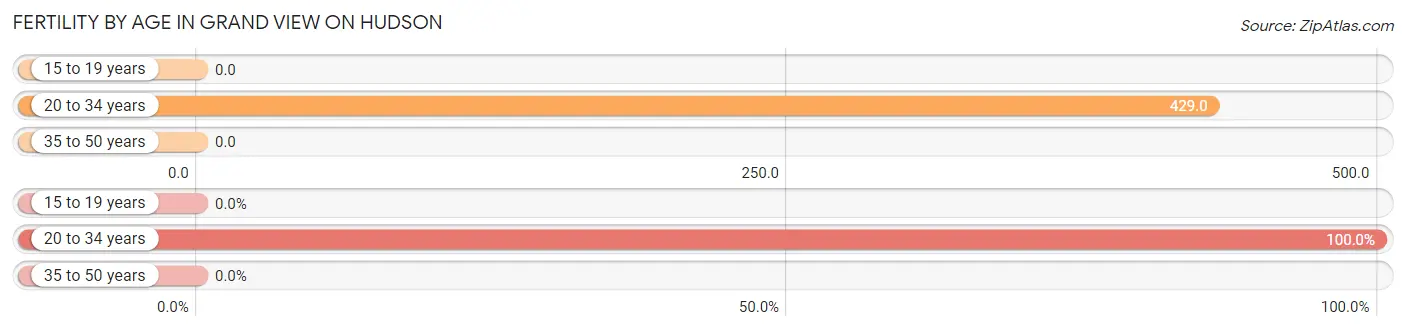
| Age Bracket | Women with Births | Births / 1,000 Women |
| 15 to 19 years | 0 (0.0%) | 0.0 |
| 20 to 34 years | 3 (100.0%) | 429.0 |
| 35 to 50 years | 0 (0.0%) | 0.0 |
| Total | 3 (100.0%) | 73.0 |
Fertility by Age by Marriage Status in Grand View on Hudson
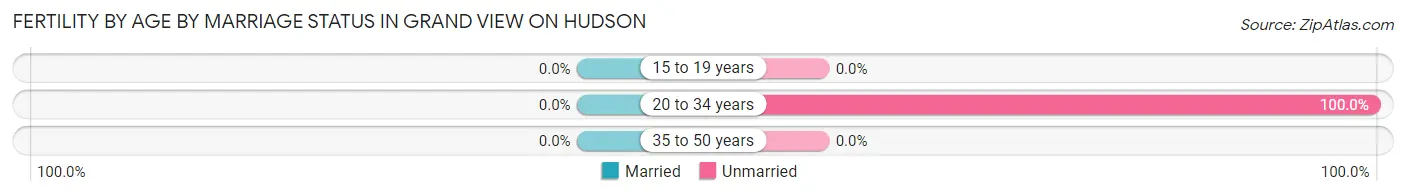
| Age Bracket | Married | Unmarried |
| 15 to 19 years | 0 (0.0%) | 0 (0.0%) |
| 20 to 34 years | 0 (0.0%) | 3 (100.0%) |
| 35 to 50 years | 0 (0.0%) | 0 (0.0%) |
| Total | 0 (0.0%) | 3 (100.0%) |
Fertility by Education in Grand View on Hudson
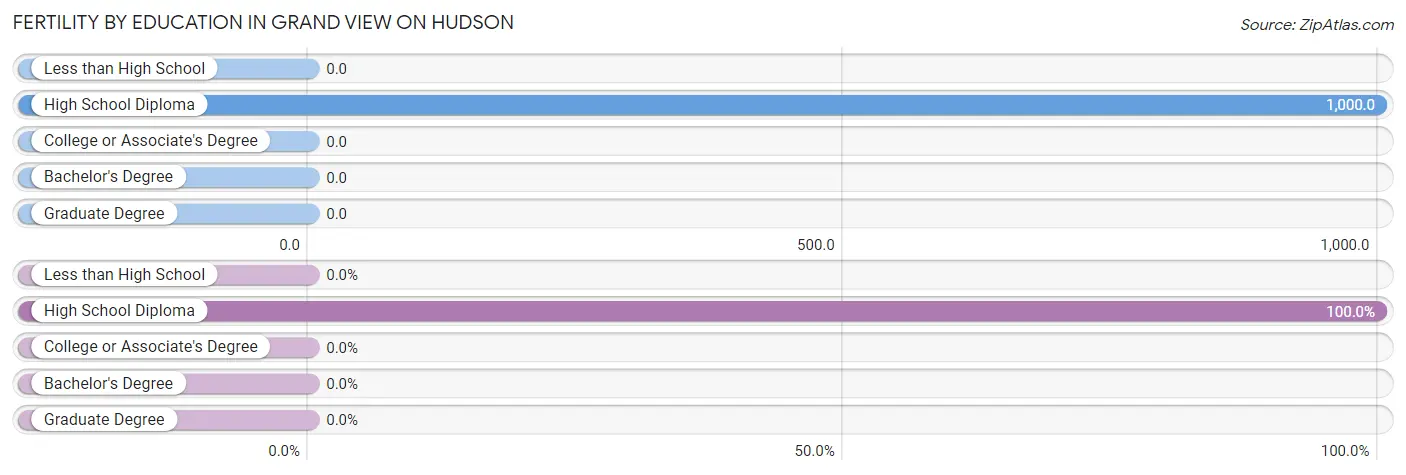
| Educational Attainment | Women with Births | Births / 1,000 Women |
| Less than High School | 0 (0.0%) | 0.0 |
| High School Diploma | 3 (100.0%) | 1,000.0 |
| College or Associate's Degree | 0 (0.0%) | 0.0 |
| Bachelor's Degree | 0 (0.0%) | 0.0 |
| Graduate Degree | 0 (0.0%) | 0.0 |
| Total | 3 (100.0%) | 73.0 |
Fertility by Education by Marriage Status in Grand View on Hudson
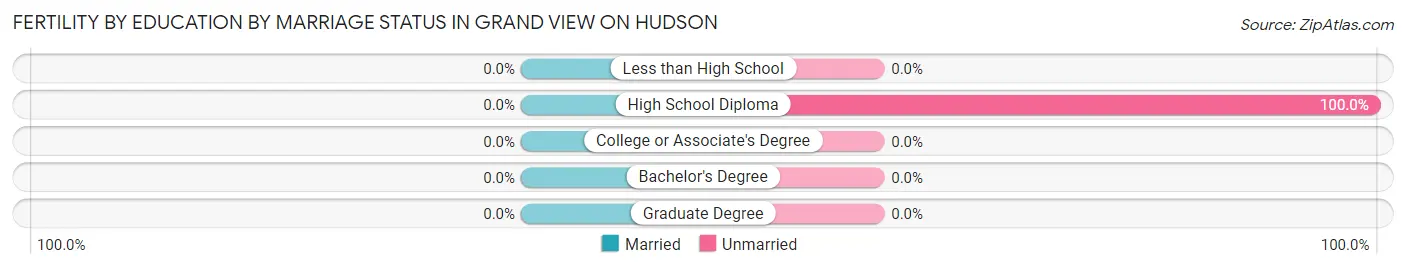
| Educational Attainment | Married | Unmarried |
| Less than High School | 0 (0.0%) | 0 (0.0%) |
| High School Diploma | 0 (0.0%) | 3 (100.0%) |
| College or Associate's Degree | 0 (0.0%) | 0 (0.0%) |
| Bachelor's Degree | 0 (0.0%) | 0 (0.0%) |
| Graduate Degree | 0 (0.0%) | 0 (0.0%) |
| Total | 0 (0.0%) | 3 (100.0%) |
Employment Characteristics in Grand View on Hudson
Employment by Class of Employer in Grand View on Hudson
Among the 80 employed individuals in Grand View on Hudson, private company employees (34 | 42.5%), self-employed (incorporated) (17 | 21.2%), and self-employed (not incorporated) (13 | 16.3%) make up the most common classes of employment.
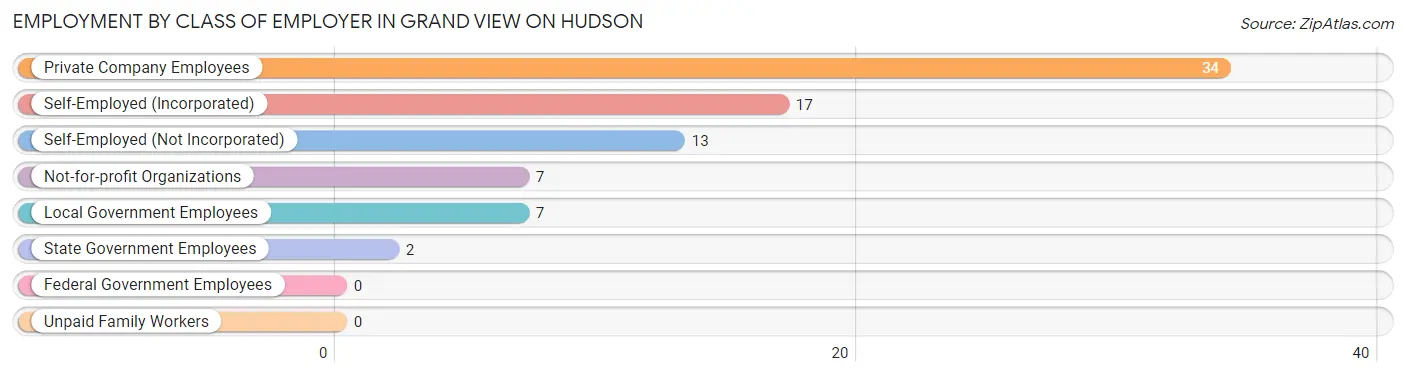
| Employer Class | # Employees | % Employees |
| Private Company Employees | 34 | 42.5% |
| Self-Employed (Incorporated) | 17 | 21.2% |
| Self-Employed (Not Incorporated) | 13 | 16.3% |
| Not-for-profit Organizations | 7 | 8.7% |
| Local Government Employees | 7 | 8.7% |
| State Government Employees | 2 | 2.5% |
| Federal Government Employees | 0 | 0.0% |
| Unpaid Family Workers | 0 | 0.0% |
| Total | 80 | 100.0% |
Employment Status by Age in Grand View on Hudson
According to the labor force statistics for Grand View on Hudson, out of the total population over 16 years of age (195), 46.7% or 91 individuals are in the labor force, with 4.4% or 4 of them unemployed. The age group with the highest labor force participation rate is 35 to 44 years, with 100.0% or 10 individuals in the labor force. Within the labor force, the 55 to 59 years age range has the highest percentage of unemployed individuals, with 14.8% or 4 of them being unemployed.
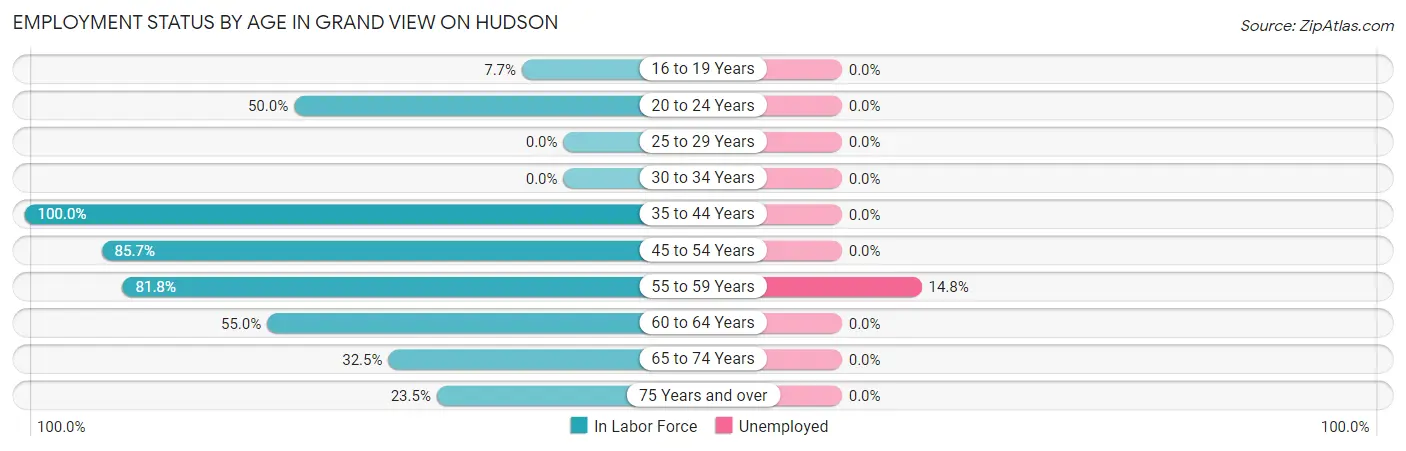
| Age Bracket | In Labor Force | Unemployed |
| 16 to 19 Years | 2 (7.7%) | 0 (0.0%) |
| 20 to 24 Years | 2 (50.0%) | 0 (0.0%) |
| 25 to 29 Years | 0 (0.0%) | 0 (0.0%) |
| 30 to 34 Years | 0 (0.0%) | 0 (0.0%) |
| 35 to 44 Years | 10 (100.0%) | 0 (0.0%) |
| 45 to 54 Years | 18 (85.7%) | 0 (0.0%) |
| 55 to 59 Years | 27 (81.8%) | 4 (14.8%) |
| 60 to 64 Years | 11 (55.0%) | 0 (0.0%) |
| 65 to 74 Years | 13 (32.5%) | 0 (0.0%) |
| 75 Years and over | 8 (23.5%) | 0 (0.0%) |
| Total | 91 (46.7%) | 4 (4.4%) |
Employment Status by Educational Attainment in Grand View on Hudson
According to labor force statistics for Grand View on Hudson, 72.5% of individuals (66) out of the total population between 25 and 64 years of age (91) are in the labor force, with 6.1% or 4 of them being unemployed. The group with the highest labor force participation rate are those with the educational attainment of less than high school, with 100.0% or 4 individuals in the labor force. Within the labor force, individuals with bachelor's degree or higher education have the highest percentage of unemployment, with 8.9% or 4 of them being unemployed.
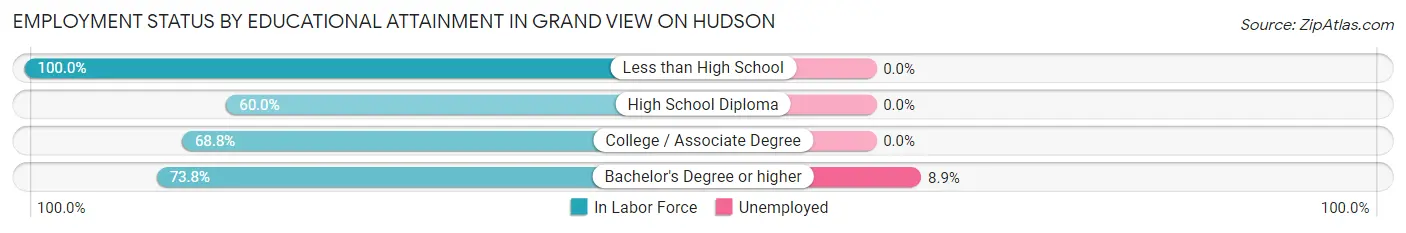
| Educational Attainment | In Labor Force | Unemployed |
| Less than High School | 4 (100.0%) | 0 (0.0%) |
| High School Diploma | 6 (60.0%) | 0 (0.0%) |
| College / Associate Degree | 11 (68.8%) | 0 (0.0%) |
| Bachelor's Degree or higher | 45 (73.8%) | 5 (8.9%) |
| Total | 66 (72.5%) | 6 (6.1%) |
Employment Occupations by Sex in Grand View on Hudson
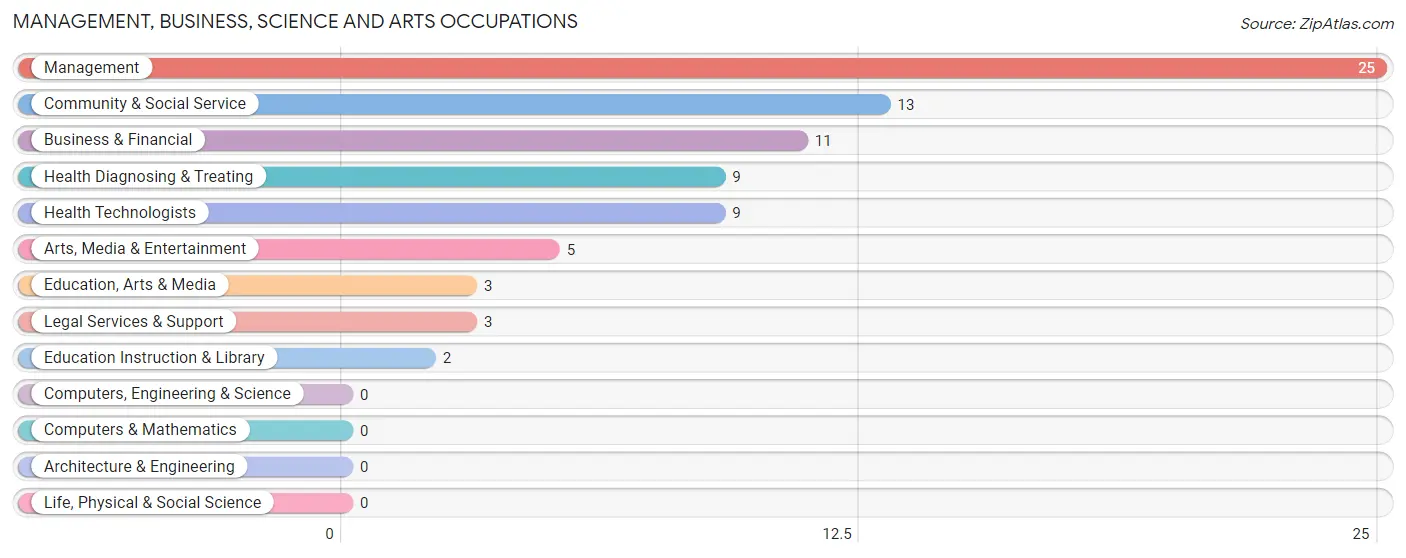
Management, Business, Science and Arts Occupations
The most common Management, Business, Science and Arts occupations in Grand View on Hudson are Management (25 | 28.7%), Community & Social Service (13 | 14.9%), Business & Financial (11 | 12.6%), Health Diagnosing & Treating (9 | 10.3%), and Health Technologists (9 | 10.3%).
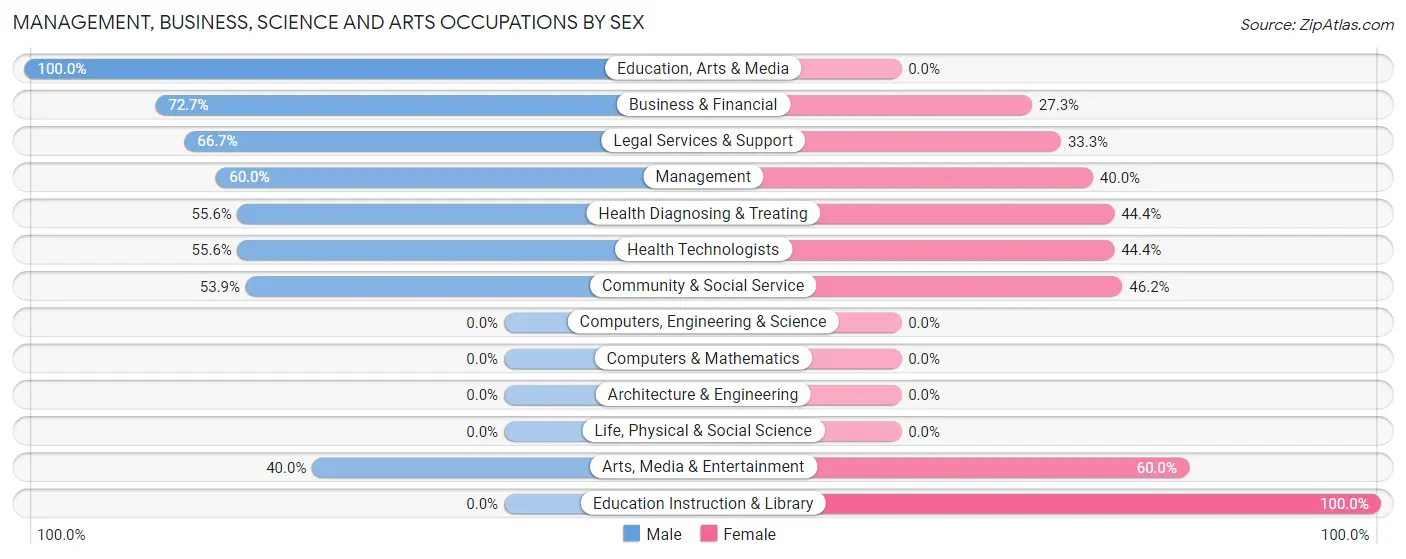
Management, Business, Science and Arts Occupations by Sex
Within the Management, Business, Science and Arts occupations in Grand View on Hudson, the most male-oriented occupations are Education, Arts & Media (100.0%), Business & Financial (72.7%), and Legal Services & Support (66.7%), while the most female-oriented occupations are Education Instruction & Library (100.0%), Arts, Media & Entertainment (60.0%), and Community & Social Service (46.2%).
| Occupation | Male | Female |
| Management | 15 (60.0%) | 10 (40.0%) |
| Business & Financial | 8 (72.7%) | 3 (27.3%) |
| Computers, Engineering & Science | 0 (0.0%) | 0 (0.0%) |
| Computers & Mathematics | 0 (0.0%) | 0 (0.0%) |
| Architecture & Engineering | 0 (0.0%) | 0 (0.0%) |
| Life, Physical & Social Science | 0 (0.0%) | 0 (0.0%) |
| Community & Social Service | 7 (53.8%) | 6 (46.2%) |
| Education, Arts & Media | 3 (100.0%) | 0 (0.0%) |
| Legal Services & Support | 2 (66.7%) | 1 (33.3%) |
| Education Instruction & Library | 0 (0.0%) | 2 (100.0%) |
| Arts, Media & Entertainment | 2 (40.0%) | 3 (60.0%) |
| Health Diagnosing & Treating | 5 (55.6%) | 4 (44.4%) |
| Health Technologists | 5 (55.6%) | 4 (44.4%) |
| Total (Category) | 35 (60.3%) | 23 (39.7%) |
| Total (Overall) | 52 (59.8%) | 35 (40.2%) |
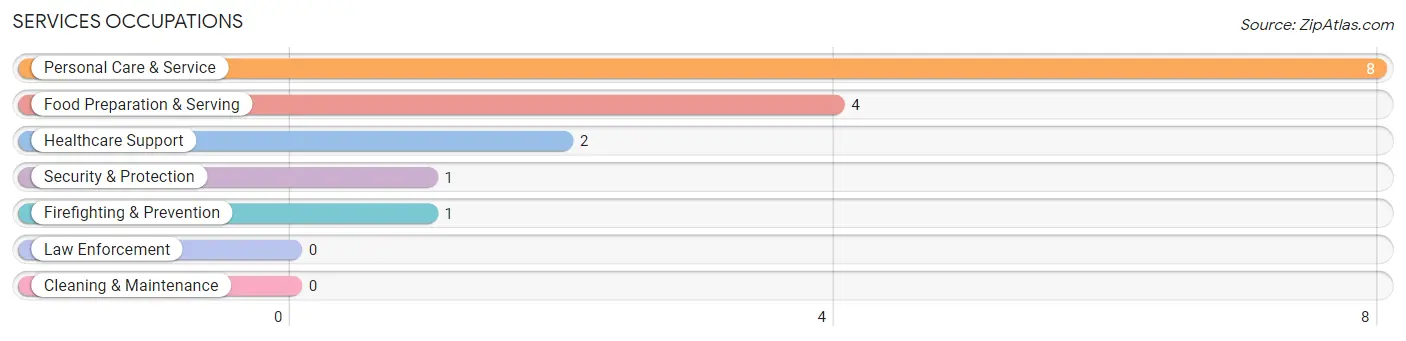
Services Occupations
The most common Services occupations in Grand View on Hudson are Personal Care & Service (8 | 9.2%), Food Preparation & Serving (4 | 4.6%), Healthcare Support (2 | 2.3%), Security & Protection (1 | 1.1%), and Firefighting & Prevention (1 | 1.1%).
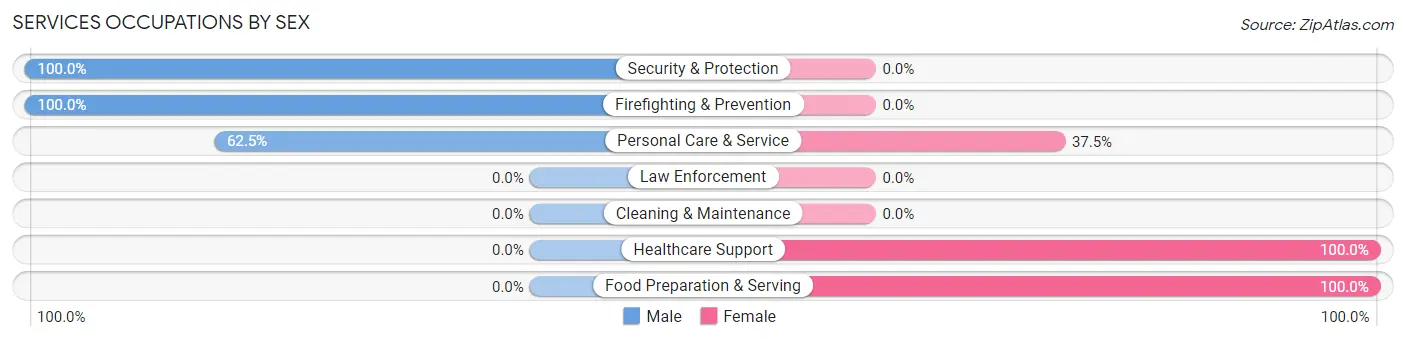
Services Occupations by Sex
Within the Services occupations in Grand View on Hudson, the most male-oriented occupations are Security & Protection (100.0%), Firefighting & Prevention (100.0%), and Personal Care & Service (62.5%), while the most female-oriented occupations are Healthcare Support (100.0%), Food Preparation & Serving (100.0%), and Personal Care & Service (37.5%).
| Occupation | Male | Female |
| Healthcare Support | 0 (0.0%) | 2 (100.0%) |
| Security & Protection | 1 (100.0%) | 0 (0.0%) |
| Firefighting & Prevention | 1 (100.0%) | 0 (0.0%) |
| Law Enforcement | 0 (0.0%) | 0 (0.0%) |
| Food Preparation & Serving | 0 (0.0%) | 4 (100.0%) |
| Cleaning & Maintenance | 0 (0.0%) | 0 (0.0%) |
| Personal Care & Service | 5 (62.5%) | 3 (37.5%) |
| Total (Category) | 6 (40.0%) | 9 (60.0%) |
| Total (Overall) | 52 (59.8%) | 35 (40.2%) |
Sales and Office Occupations
The most common Sales and Office occupations in Grand View on Hudson are Sales & Related (9 | 10.3%), and Office & Administration (1 | 1.1%).
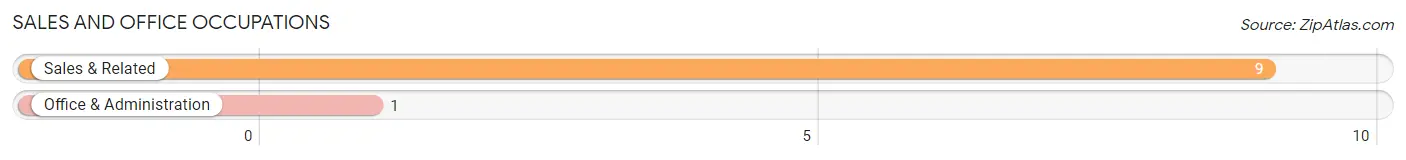
Sales and Office Occupations by Sex

| Occupation | Male | Female |
| Sales & Related | 9 (100.0%) | 0 (0.0%) |
| Office & Administration | 0 (0.0%) | 1 (100.0%) |
| Total (Category) | 9 (90.0%) | 1 (10.0%) |
| Total (Overall) | 52 (59.8%) | 35 (40.2%) |
Natural Resources, Construction and Maintenance Occupations
The most common Natural Resources, Construction and Maintenance occupations in Grand View on Hudson are , and Construction & Extraction (2 | 2.3%).
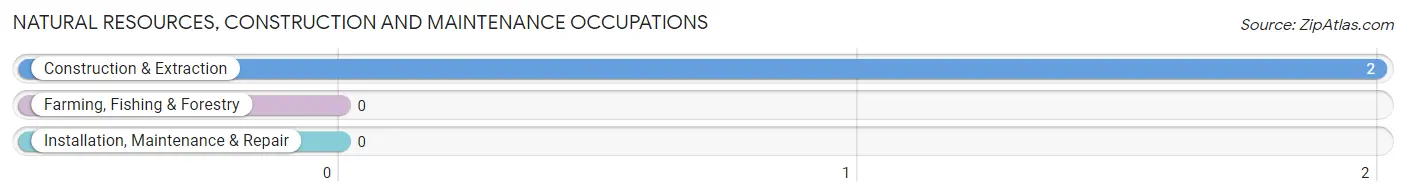
Natural Resources, Construction and Maintenance Occupations by Sex

| Occupation | Male | Female |
| Farming, Fishing & Forestry | 0 (0.0%) | 0 (0.0%) |
| Construction & Extraction | 2 (100.0%) | 0 (0.0%) |
| Installation, Maintenance & Repair | 0 (0.0%) | 0 (0.0%) |
| Total (Category) | 2 (100.0%) | 0 (0.0%) |
| Total (Overall) | 52 (59.8%) | 35 (40.2%) |
Production, Transportation and Moving Occupations
The most common Production, Transportation and Moving occupations in Grand View on Hudson are , and Production (2 | 2.3%).
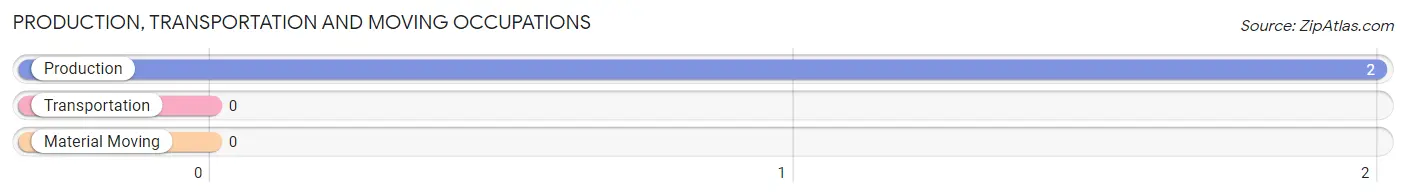
Production, Transportation and Moving Occupations by Sex
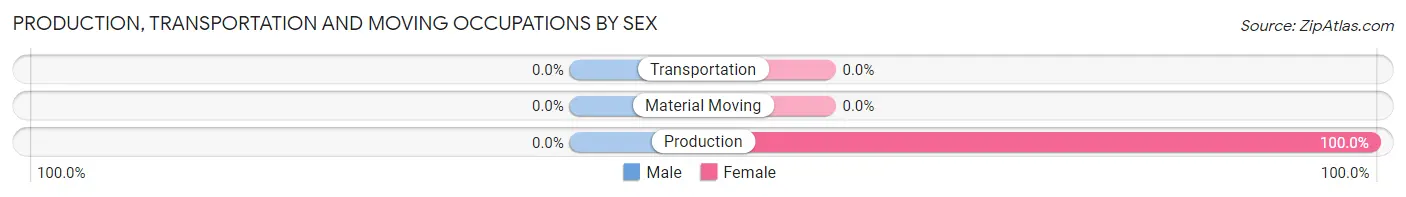
| Occupation | Male | Female |
| Production | 0 (0.0%) | 2 (100.0%) |
| Transportation | 0 (0.0%) | 0 (0.0%) |
| Material Moving | 0 (0.0%) | 0 (0.0%) |
| Total (Category) | 0 (0.0%) | 2 (100.0%) |
| Total (Overall) | 52 (59.8%) | 35 (40.2%) |
Employment Industries by Sex in Grand View on Hudson
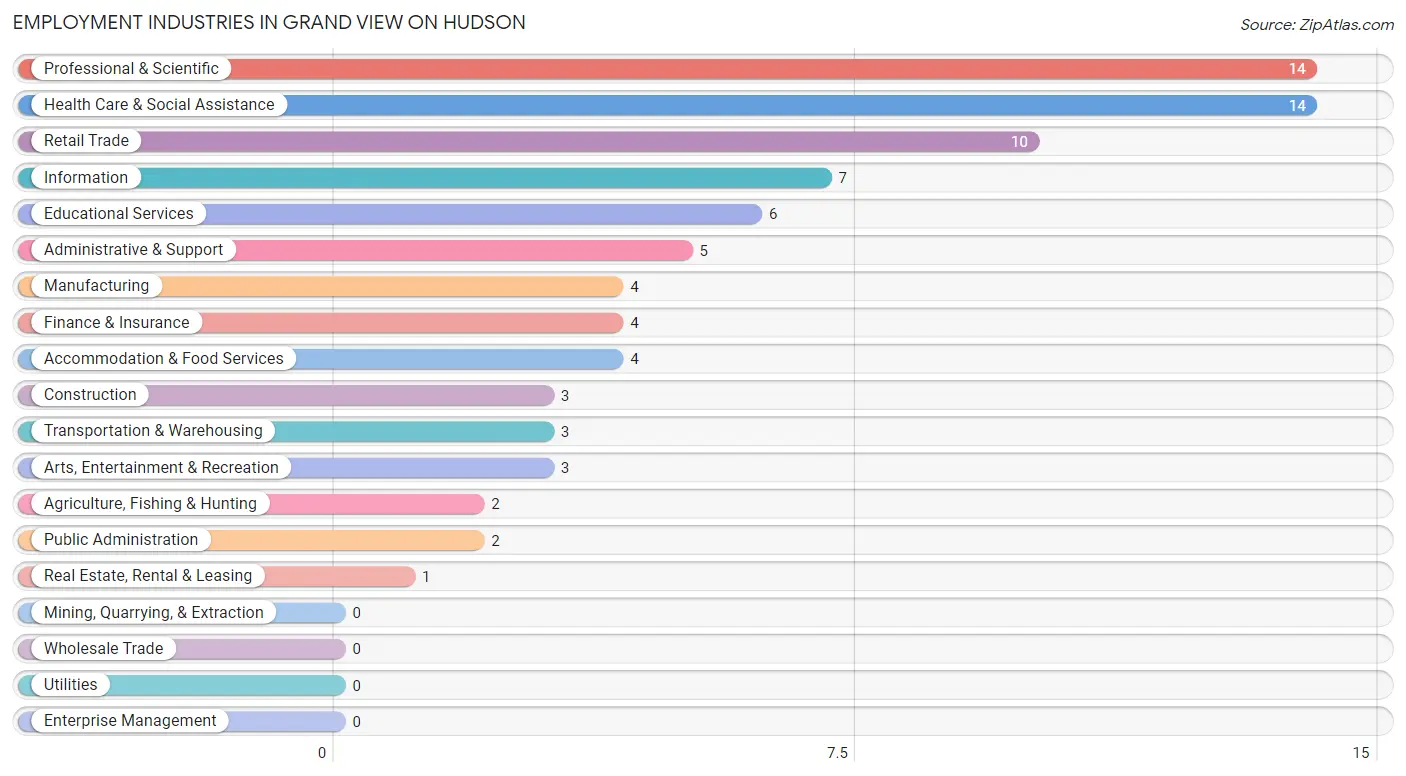
Employment Industries in Grand View on Hudson
The major employment industries in Grand View on Hudson include Professional & Scientific (14 | 16.1%), Health Care & Social Assistance (14 | 16.1%), Retail Trade (10 | 11.5%), Information (7 | 8.1%), and Educational Services (6 | 6.9%).
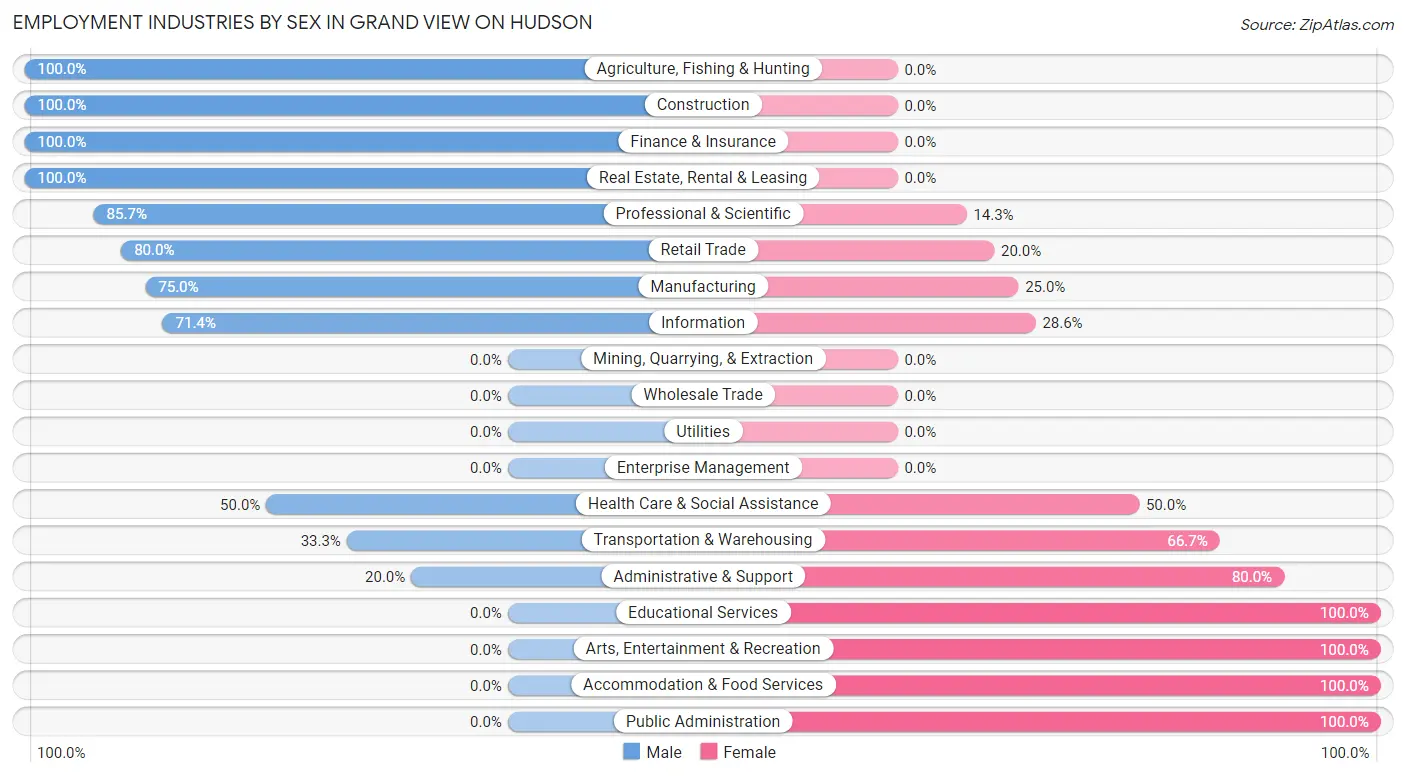
Employment Industries by Sex in Grand View on Hudson
The Grand View on Hudson industries that see more men than women are Agriculture, Fishing & Hunting (100.0%), Construction (100.0%), and Finance & Insurance (100.0%), whereas the industries that tend to have a higher number of women are Educational Services (100.0%), Arts, Entertainment & Recreation (100.0%), and Accommodation & Food Services (100.0%).
| Industry | Male | Female |
| Agriculture, Fishing & Hunting | 2 (100.0%) | 0 (0.0%) |
| Mining, Quarrying, & Extraction | 0 (0.0%) | 0 (0.0%) |
| Construction | 3 (100.0%) | 0 (0.0%) |
| Manufacturing | 3 (75.0%) | 1 (25.0%) |
| Wholesale Trade | 0 (0.0%) | 0 (0.0%) |
| Retail Trade | 8 (80.0%) | 2 (20.0%) |
| Transportation & Warehousing | 1 (33.3%) | 2 (66.7%) |
| Utilities | 0 (0.0%) | 0 (0.0%) |
| Information | 5 (71.4%) | 2 (28.6%) |
| Finance & Insurance | 4 (100.0%) | 0 (0.0%) |
| Real Estate, Rental & Leasing | 1 (100.0%) | 0 (0.0%) |
| Professional & Scientific | 12 (85.7%) | 2 (14.3%) |
| Enterprise Management | 0 (0.0%) | 0 (0.0%) |
| Administrative & Support | 1 (20.0%) | 4 (80.0%) |
| Educational Services | 0 (0.0%) | 6 (100.0%) |
| Health Care & Social Assistance | 7 (50.0%) | 7 (50.0%) |
| Arts, Entertainment & Recreation | 0 (0.0%) | 3 (100.0%) |
| Accommodation & Food Services | 0 (0.0%) | 4 (100.0%) |
| Public Administration | 0 (0.0%) | 2 (100.0%) |
| Total | 52 (59.8%) | 35 (40.2%) |
Education in Grand View on Hudson
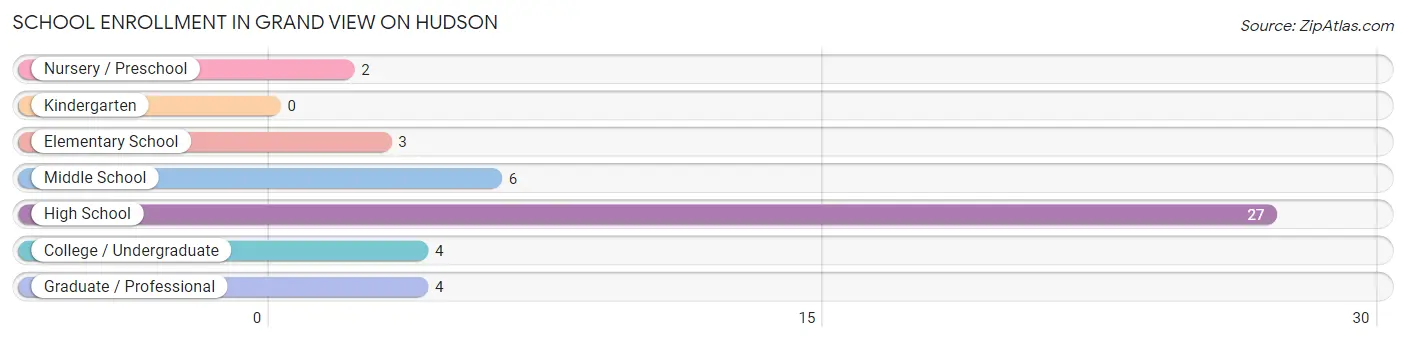
School Enrollment in Grand View on Hudson
The most common levels of schooling among the 46 students in Grand View on Hudson are high school (27 | 58.7%), middle school (6 | 13.0%), and college / undergraduate (4 | 8.7%).
| School Level | # Students | % Students |
| Nursery / Preschool | 2 | 4.3% |
| Kindergarten | 0 | 0.0% |
| Elementary School | 3 | 6.5% |
| Middle School | 6 | 13.0% |
| High School | 27 | 58.7% |
| College / Undergraduate | 4 | 8.7% |
| Graduate / Professional | 4 | 8.7% |
| Total | 46 | 100.0% |
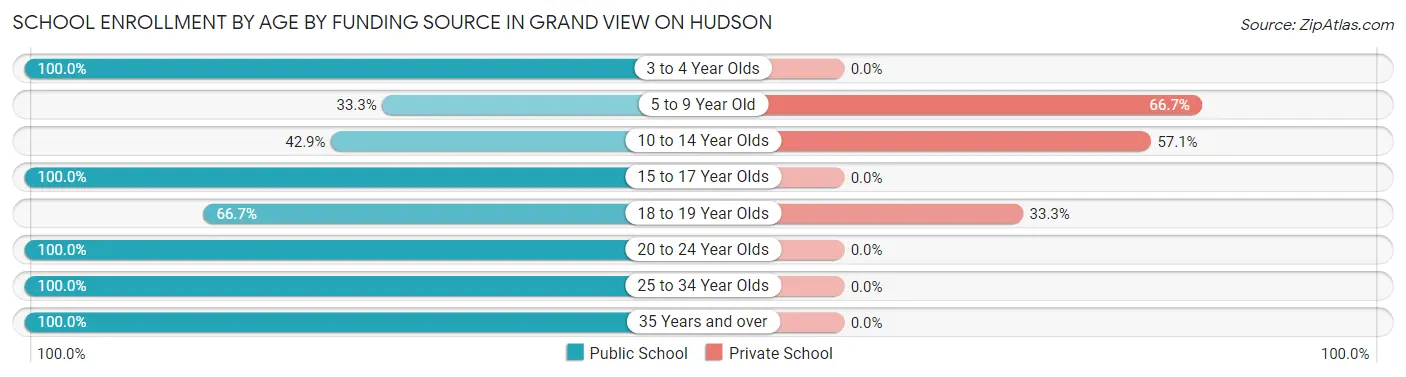
School Enrollment by Age by Funding Source in Grand View on Hudson
Out of a total of 46 students who are enrolled in schools in Grand View on Hudson, 7 (15.2%) attend a private institution, while the remaining 39 (84.8%) are enrolled in public schools. The age group of 5 to 9 year old has the highest likelihood of being enrolled in private schools, with 2 (66.7% in the age bracket) enrolled. Conversely, the age group of 3 to 4 year olds has the lowest likelihood of being enrolled in a private school, with 2 (100.0% in the age bracket) attending a public institution.
| Age Bracket | Public School | Private School |
| 3 to 4 Year Olds | 2 (100.0%) | 0 (0.0%) |
| 5 to 9 Year Old | 1 (33.3%) | 2 (66.7%) |
| 10 to 14 Year Olds | 3 (42.9%) | 4 (57.1%) |
| 15 to 17 Year Olds | 25 (100.0%) | 0 (0.0%) |
| 18 to 19 Year Olds | 2 (66.7%) | 1 (33.3%) |
| 20 to 24 Year Olds | 2 (100.0%) | 0 (0.0%) |
| 25 to 34 Year Olds | 2 (100.0%) | 0 (0.0%) |
| 35 Years and over | 2 (100.0%) | 0 (0.0%) |
| Total | 39 (84.8%) | 7 (15.2%) |
Educational Attainment by Field of Study in Grand View on Hudson
Literature & languages (33 | 23.7%), social sciences (21 | 15.1%), business (19 | 13.7%), liberal arts & history (14 | 10.1%), and engineering (11 | 7.9%) are the most common fields of study among 139 individuals in Grand View on Hudson who have obtained a bachelor's degree or higher.
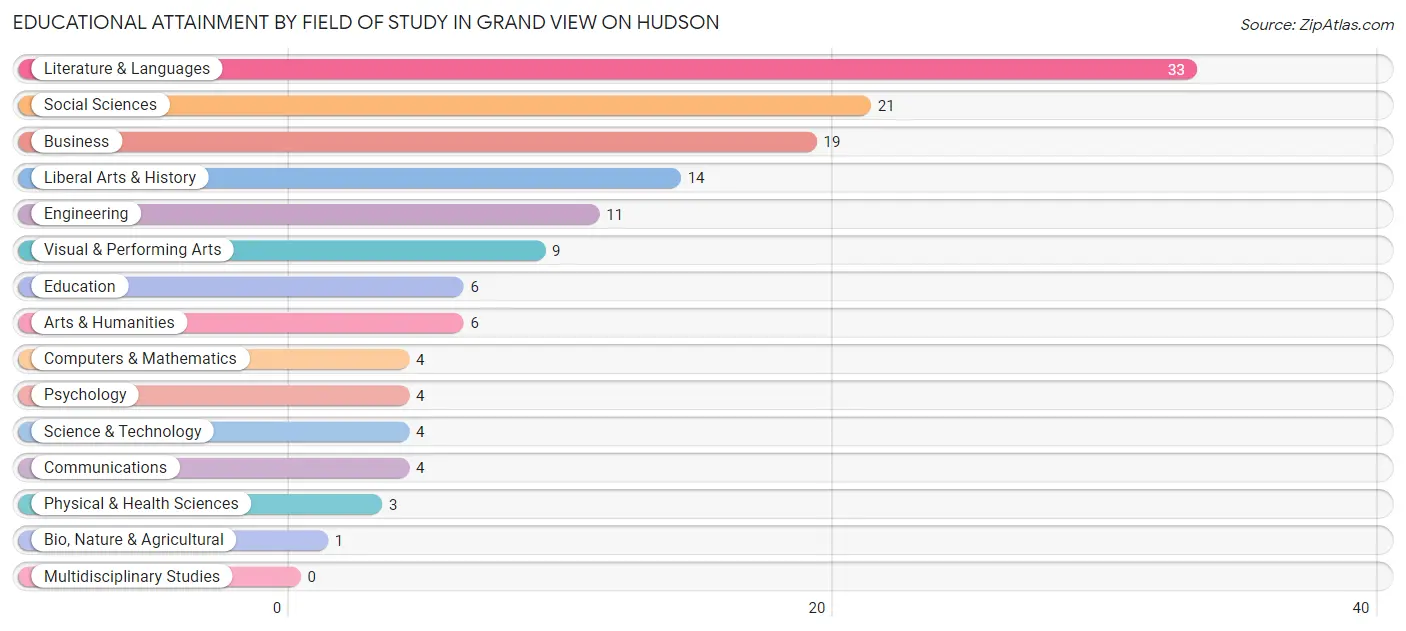
| Field of Study | # Graduates | % Graduates |
| Computers & Mathematics | 4 | 2.9% |
| Bio, Nature & Agricultural | 1 | 0.7% |
| Physical & Health Sciences | 3 | 2.2% |
| Psychology | 4 | 2.9% |
| Social Sciences | 21 | 15.1% |
| Engineering | 11 | 7.9% |
| Multidisciplinary Studies | 0 | 0.0% |
| Science & Technology | 4 | 2.9% |
| Business | 19 | 13.7% |
| Education | 6 | 4.3% |
| Literature & Languages | 33 | 23.7% |
| Liberal Arts & History | 14 | 10.1% |
| Visual & Performing Arts | 9 | 6.5% |
| Communications | 4 | 2.9% |
| Arts & Humanities | 6 | 4.3% |
| Total | 139 | 100.0% |
Transportation & Commute in Grand View on Hudson
Vehicle Availability by Sex in Grand View on Hudson
The most prevalent vehicle ownership categories in Grand View on Hudson are males with 2 vehicles (15, accounting for 31.2%) and females with 2 vehicles (15, making up 46.9%).
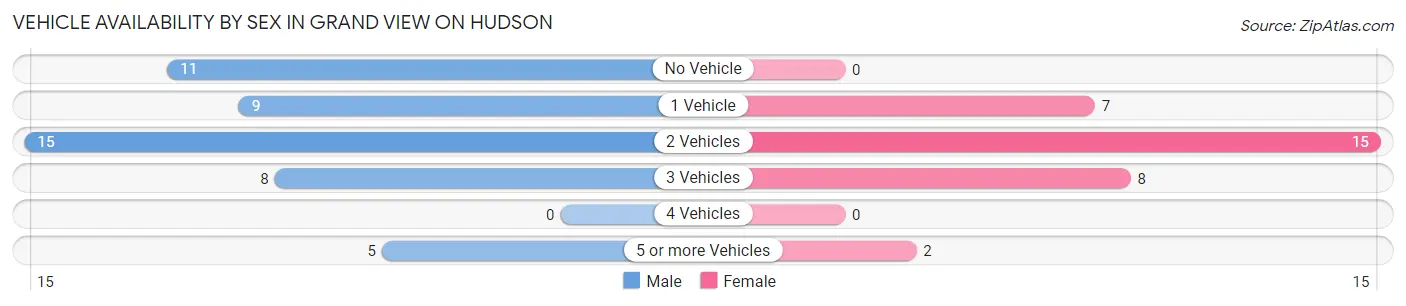
| Vehicles Available | Male | Female |
| No Vehicle | 11 (22.9%) | 0 (0.0%) |
| 1 Vehicle | 9 (18.8%) | 7 (21.9%) |
| 2 Vehicles | 15 (31.2%) | 15 (46.9%) |
| 3 Vehicles | 8 (16.7%) | 8 (25.0%) |
| 4 Vehicles | 0 (0.0%) | 0 (0.0%) |
| 5 or more Vehicles | 5 (10.4%) | 2 (6.2%) |
| Total | 48 (100.0%) | 32 (100.0%) |
Commute Time in Grand View on Hudson
The most frequently occuring commute durations in Grand View on Hudson are 30 to 34 minutes (16 commuters, 23.5%), 45 to 59 minutes (16 commuters, 23.5%), and 90 or more minutes (9 commuters, 13.2%).
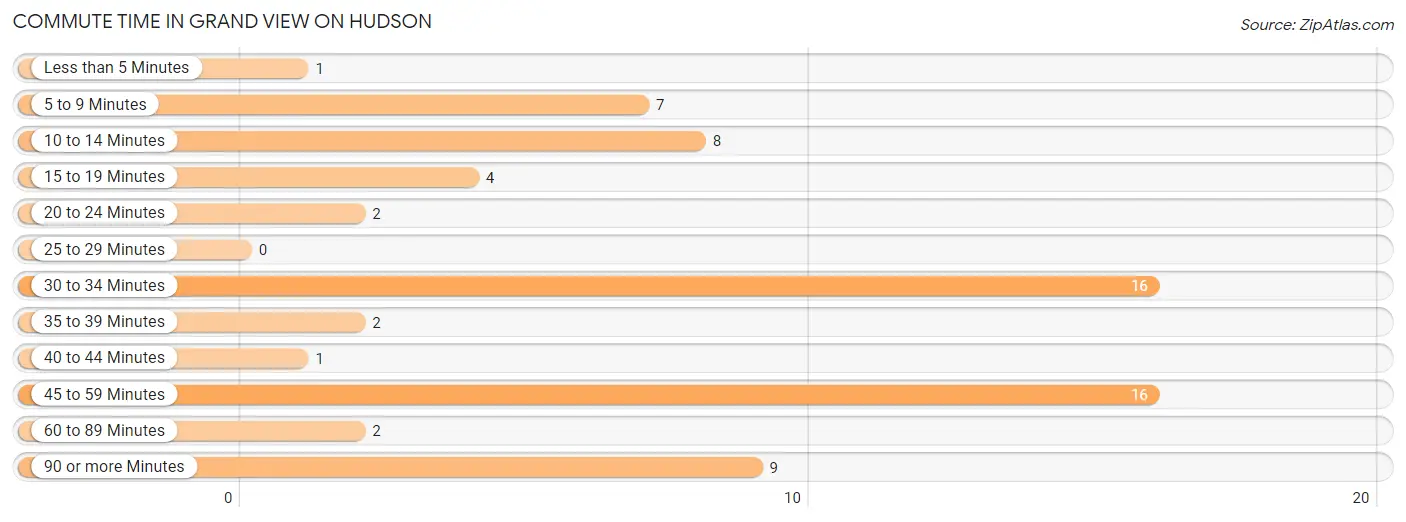
| Commute Time | # Commuters | % Commuters |
| Less than 5 Minutes | 1 | 1.5% |
| 5 to 9 Minutes | 7 | 10.3% |
| 10 to 14 Minutes | 8 | 11.8% |
| 15 to 19 Minutes | 4 | 5.9% |
| 20 to 24 Minutes | 2 | 2.9% |
| 25 to 29 Minutes | 0 | 0.0% |
| 30 to 34 Minutes | 16 | 23.5% |
| 35 to 39 Minutes | 2 | 2.9% |
| 40 to 44 Minutes | 1 | 1.5% |
| 45 to 59 Minutes | 16 | 23.5% |
| 60 to 89 Minutes | 2 | 2.9% |
| 90 or more Minutes | 9 | 13.2% |
Commute Time by Sex in Grand View on Hudson
The most common commute times in Grand View on Hudson are 45 to 59 minutes (13 commuters, 30.2%) for males and 5 to 9 minutes (6 commuters, 24.0%) for females.
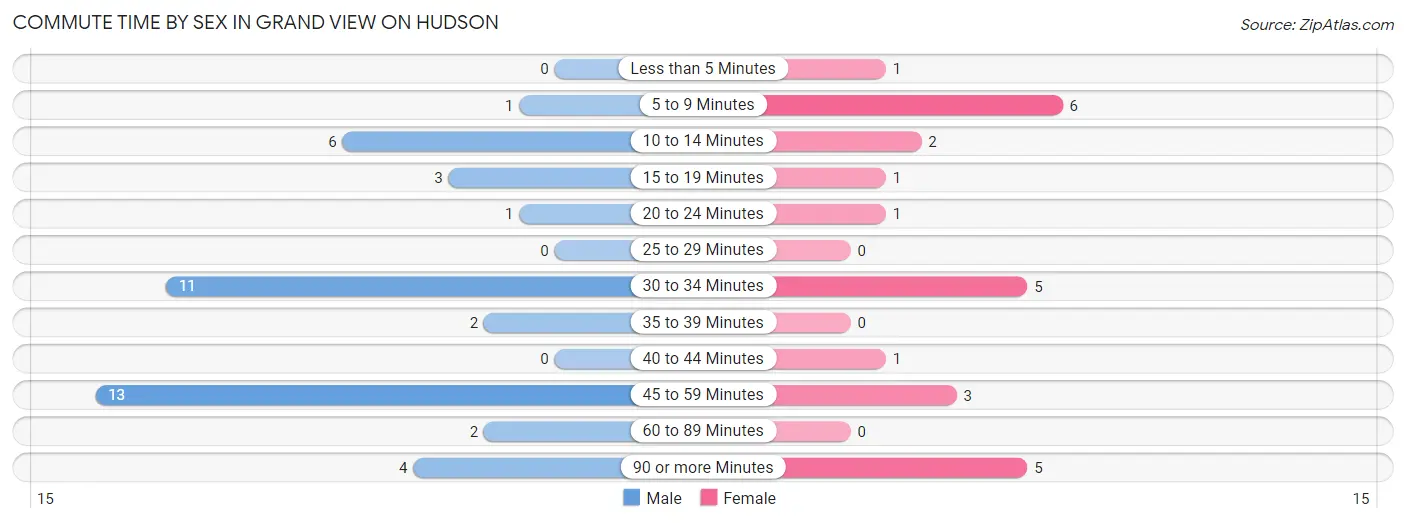
| Commute Time | Male | Female |
| Less than 5 Minutes | 0 (0.0%) | 1 (4.0%) |
| 5 to 9 Minutes | 1 (2.3%) | 6 (24.0%) |
| 10 to 14 Minutes | 6 (14.0%) | 2 (8.0%) |
| 15 to 19 Minutes | 3 (7.0%) | 1 (4.0%) |
| 20 to 24 Minutes | 1 (2.3%) | 1 (4.0%) |
| 25 to 29 Minutes | 0 (0.0%) | 0 (0.0%) |
| 30 to 34 Minutes | 11 (25.6%) | 5 (20.0%) |
| 35 to 39 Minutes | 2 (4.6%) | 0 (0.0%) |
| 40 to 44 Minutes | 0 (0.0%) | 1 (4.0%) |
| 45 to 59 Minutes | 13 (30.2%) | 3 (12.0%) |
| 60 to 89 Minutes | 2 (4.6%) | 0 (0.0%) |
| 90 or more Minutes | 4 (9.3%) | 5 (20.0%) |
Time of Departure to Work by Sex in Grand View on Hudson
The most frequent times of departure to work in Grand View on Hudson are 8:00 AM to 8:29 AM (9, 20.9%) for males and 8:00 AM to 8:29 AM (7, 28.0%) for females.
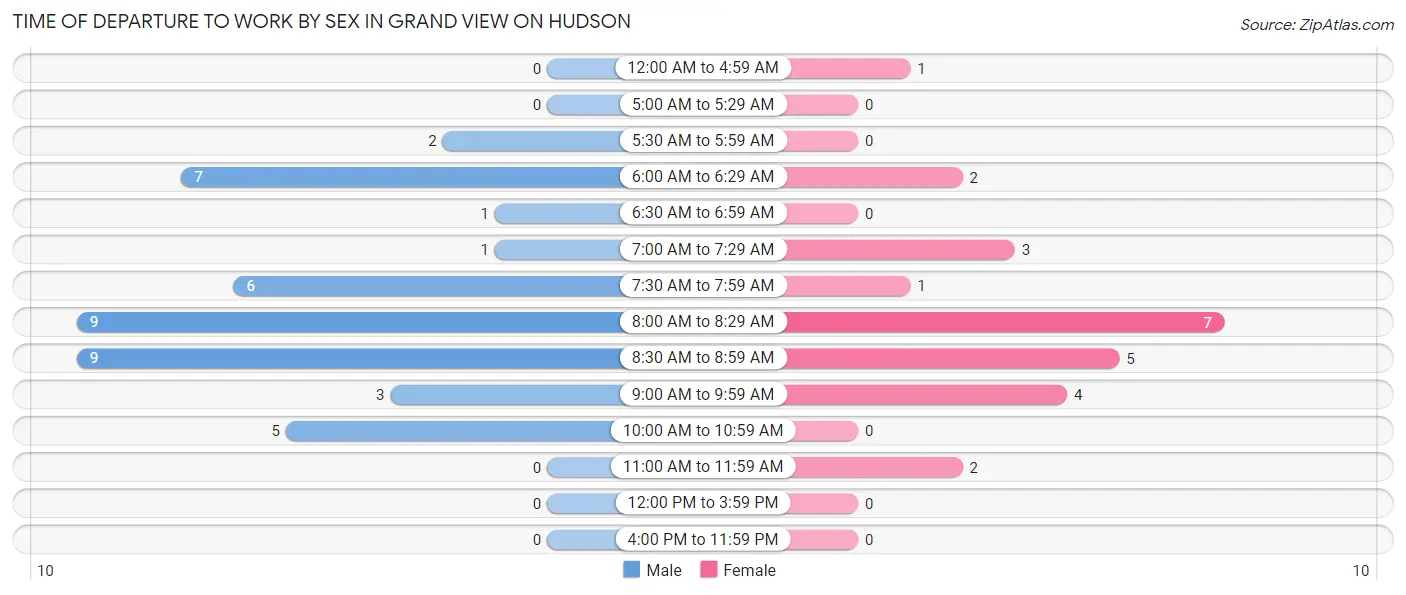
| Time of Departure | Male | Female |
| 12:00 AM to 4:59 AM | 0 (0.0%) | 1 (4.0%) |
| 5:00 AM to 5:29 AM | 0 (0.0%) | 0 (0.0%) |
| 5:30 AM to 5:59 AM | 2 (4.6%) | 0 (0.0%) |
| 6:00 AM to 6:29 AM | 7 (16.3%) | 2 (8.0%) |
| 6:30 AM to 6:59 AM | 1 (2.3%) | 0 (0.0%) |
| 7:00 AM to 7:29 AM | 1 (2.3%) | 3 (12.0%) |
| 7:30 AM to 7:59 AM | 6 (14.0%) | 1 (4.0%) |
| 8:00 AM to 8:29 AM | 9 (20.9%) | 7 (28.0%) |
| 8:30 AM to 8:59 AM | 9 (20.9%) | 5 (20.0%) |
| 9:00 AM to 9:59 AM | 3 (7.0%) | 4 (16.0%) |
| 10:00 AM to 10:59 AM | 5 (11.6%) | 0 (0.0%) |
| 11:00 AM to 11:59 AM | 0 (0.0%) | 2 (8.0%) |
| 12:00 PM to 3:59 PM | 0 (0.0%) | 0 (0.0%) |
| 4:00 PM to 11:59 PM | 0 (0.0%) | 0 (0.0%) |
| Total | 43 (100.0%) | 25 (100.0%) |
Housing Occupancy in Grand View on Hudson
Occupancy by Ownership in Grand View on Hudson
Of the total 103 dwellings in Grand View on Hudson, owner-occupied units account for 84 (81.6%), while renter-occupied units make up 19 (18.4%).
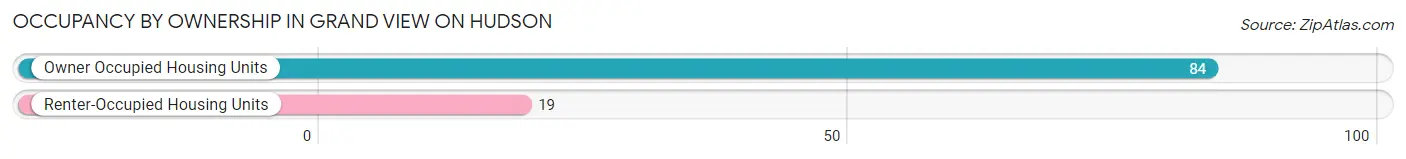
| Occupancy | # Housing Units | % Housing Units |
| Owner Occupied Housing Units | 84 | 81.6% |
| Renter-Occupied Housing Units | 19 | 18.4% |
| Total Occupied Housing Units | 103 | 100.0% |
Occupancy by Household Size in Grand View on Hudson
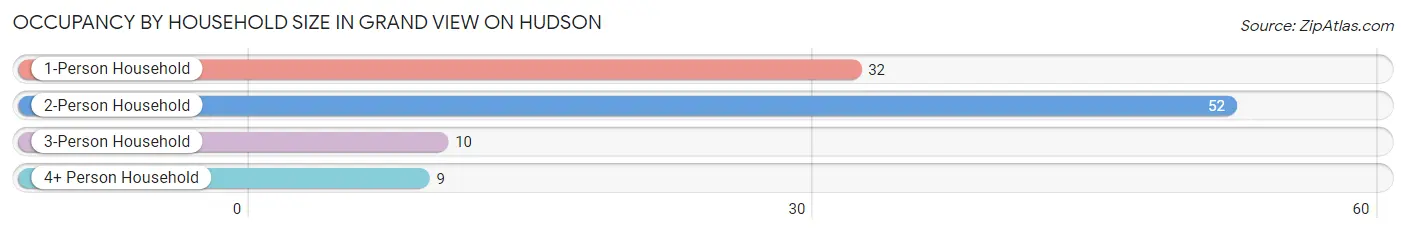
| Household Size | # Housing Units | % Housing Units |
| 1-Person Household | 32 | 31.1% |
| 2-Person Household | 52 | 50.5% |
| 3-Person Household | 10 | 9.7% |
| 4+ Person Household | 9 | 8.7% |
| Total Housing Units | 103 | 100.0% |
Occupancy by Ownership by Household Size in Grand View on Hudson
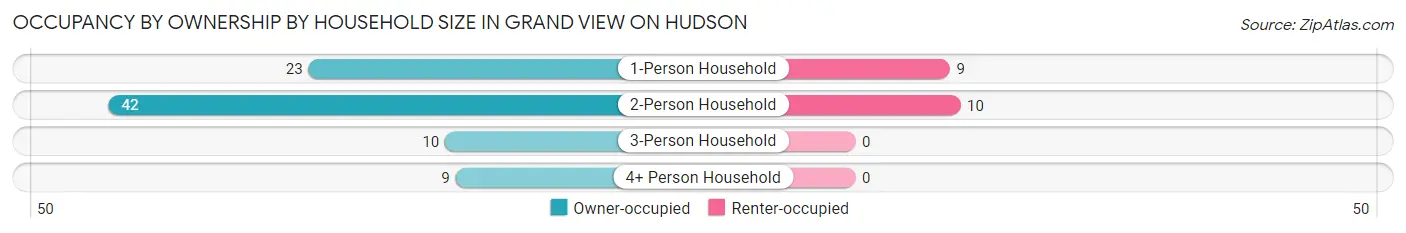
| Household Size | Owner-occupied | Renter-occupied |
| 1-Person Household | 23 (71.9%) | 9 (28.1%) |
| 2-Person Household | 42 (80.8%) | 10 (19.2%) |
| 3-Person Household | 10 (100.0%) | 0 (0.0%) |
| 4+ Person Household | 9 (100.0%) | 0 (0.0%) |
| Total Housing Units | 84 (81.6%) | 19 (18.4%) |
Occupancy by Educational Attainment in Grand View on Hudson
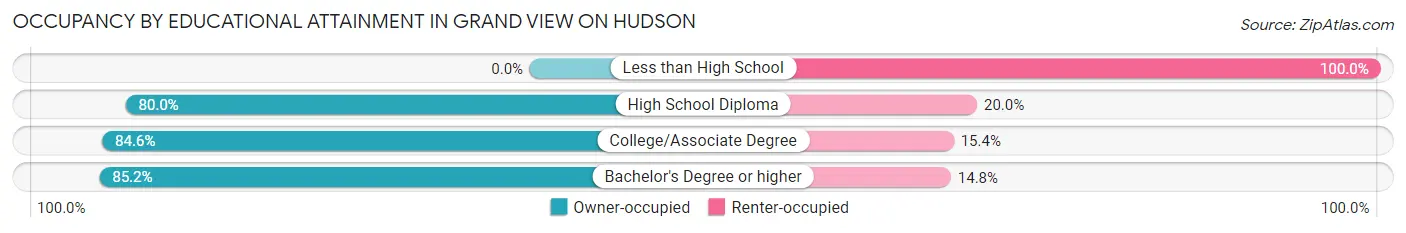
| Household Size | Owner-occupied | Renter-occupied |
| Less than High School | 0 (0.0%) | 4 (100.0%) |
| High School Diploma | 4 (80.0%) | 1 (20.0%) |
| College/Associate Degree | 11 (84.6%) | 2 (15.4%) |
| Bachelor's Degree or higher | 69 (85.2%) | 12 (14.8%) |
Occupancy by Age of Householder in Grand View on Hudson
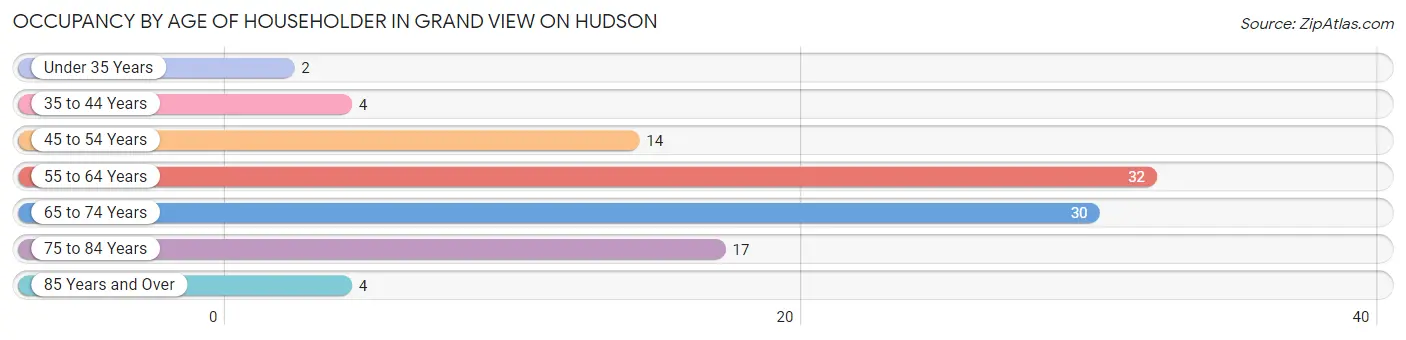
| Age Bracket | # Households | % Households |
| Under 35 Years | 2 | 1.9% |
| 35 to 44 Years | 4 | 3.9% |
| 45 to 54 Years | 14 | 13.6% |
| 55 to 64 Years | 32 | 31.1% |
| 65 to 74 Years | 30 | 29.1% |
| 75 to 84 Years | 17 | 16.5% |
| 85 Years and Over | 4 | 3.9% |
| Total | 103 | 100.0% |
Housing Finances in Grand View on Hudson
Median Income by Occupancy in Grand View on Hudson
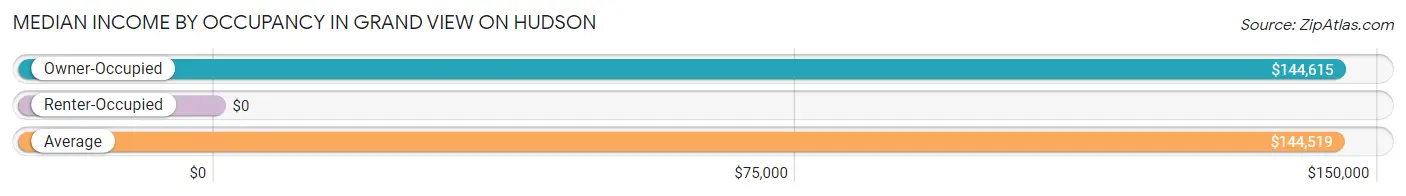
| Occupancy Type | # Households | Median Income |
| Owner-Occupied | 84 (81.6%) | $144,615 |
| Renter-Occupied | 19 (18.4%) | $0 |
| Average | 103 (100.0%) | $144,519 |
Occupancy by Householder Income Bracket in Grand View on Hudson
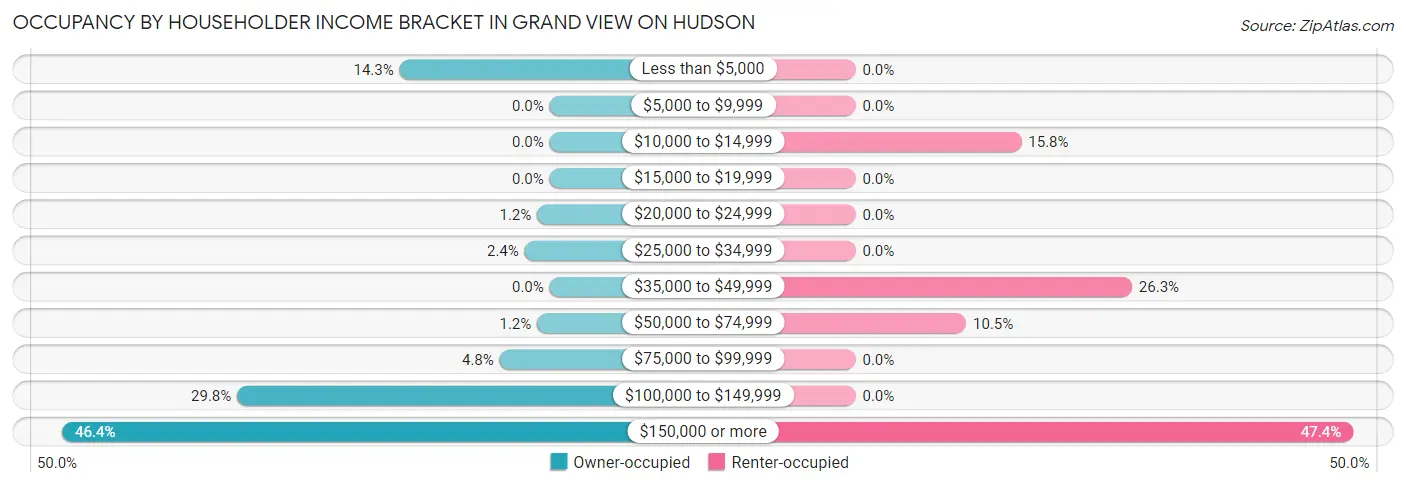
| Income Bracket | Owner-occupied | Renter-occupied |
| Less than $5,000 | 12 (14.3%) | 0 (0.0%) |
| $5,000 to $9,999 | 0 (0.0%) | 0 (0.0%) |
| $10,000 to $14,999 | 0 (0.0%) | 3 (15.8%) |
| $15,000 to $19,999 | 0 (0.0%) | 0 (0.0%) |
| $20,000 to $24,999 | 1 (1.2%) | 0 (0.0%) |
| $25,000 to $34,999 | 2 (2.4%) | 0 (0.0%) |
| $35,000 to $49,999 | 0 (0.0%) | 5 (26.3%) |
| $50,000 to $74,999 | 1 (1.2%) | 2 (10.5%) |
| $75,000 to $99,999 | 4 (4.8%) | 0 (0.0%) |
| $100,000 to $149,999 | 25 (29.8%) | 0 (0.0%) |
| $150,000 or more | 39 (46.4%) | 9 (47.4%) |
| Total | 84 (100.0%) | 19 (100.0%) |
Monthly Housing Cost Tiers in Grand View on Hudson
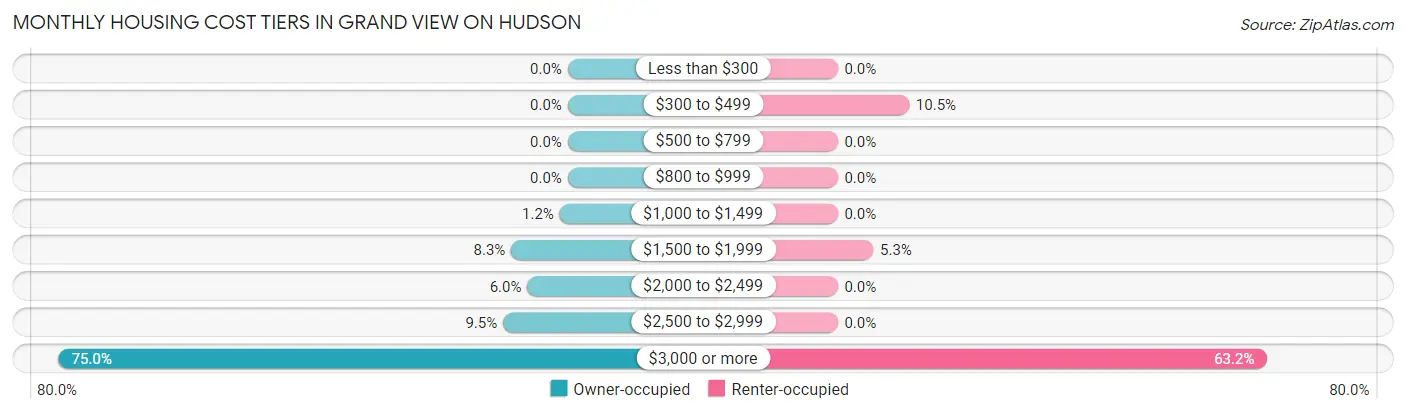
| Monthly Cost | Owner-occupied | Renter-occupied |
| Less than $300 | 0 (0.0%) | 0 (0.0%) |
| $300 to $499 | 0 (0.0%) | 2 (10.5%) |
| $500 to $799 | 0 (0.0%) | 0 (0.0%) |
| $800 to $999 | 0 (0.0%) | 0 (0.0%) |
| $1,000 to $1,499 | 1 (1.2%) | 0 (0.0%) |
| $1,500 to $1,999 | 7 (8.3%) | 1 (5.3%) |
| $2,000 to $2,499 | 5 (5.9%) | 0 (0.0%) |
| $2,500 to $2,999 | 8 (9.5%) | 0 (0.0%) |
| $3,000 or more | 63 (75.0%) | 12 (63.2%) |
| Total | 84 (100.0%) | 19 (100.0%) |
Physical Housing Characteristics in Grand View on Hudson
Housing Structures in Grand View on Hudson
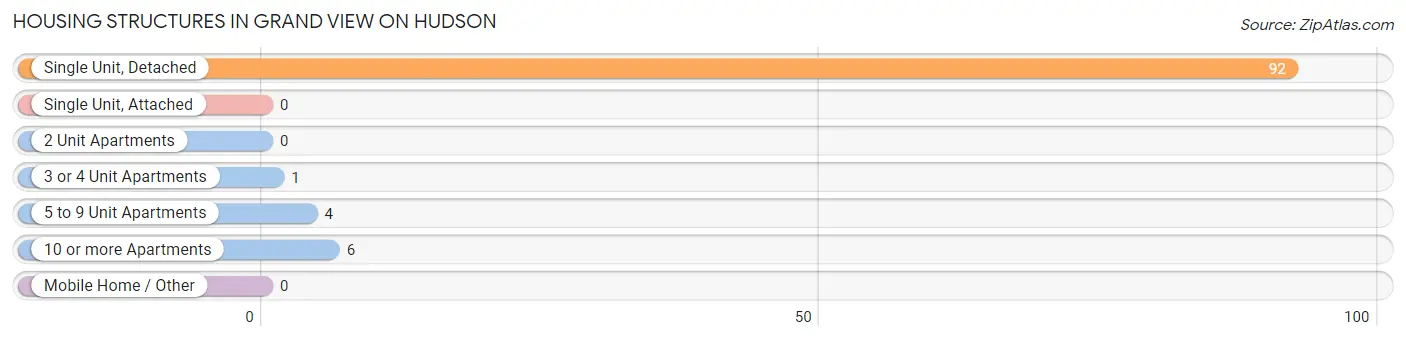
| Structure Type | # Housing Units | % Housing Units |
| Single Unit, Detached | 92 | 89.3% |
| Single Unit, Attached | 0 | 0.0% |
| 2 Unit Apartments | 0 | 0.0% |
| 3 or 4 Unit Apartments | 1 | 1.0% |
| 5 to 9 Unit Apartments | 4 | 3.9% |
| 10 or more Apartments | 6 | 5.8% |
| Mobile Home / Other | 0 | 0.0% |
| Total | 103 | 100.0% |
Housing Structures by Occupancy in Grand View on Hudson
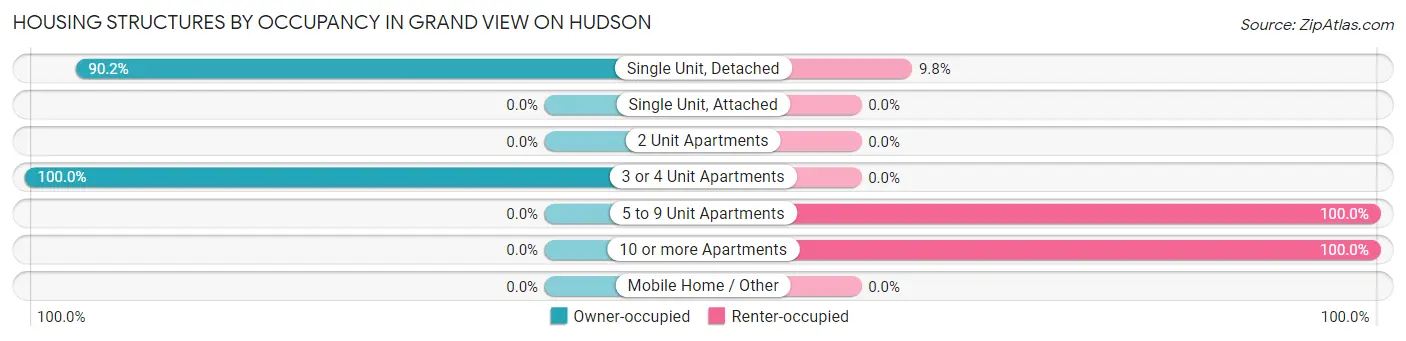
| Structure Type | Owner-occupied | Renter-occupied |
| Single Unit, Detached | 83 (90.2%) | 9 (9.8%) |
| Single Unit, Attached | 0 (0.0%) | 0 (0.0%) |
| 2 Unit Apartments | 0 (0.0%) | 0 (0.0%) |
| 3 or 4 Unit Apartments | 1 (100.0%) | 0 (0.0%) |
| 5 to 9 Unit Apartments | 0 (0.0%) | 4 (100.0%) |
| 10 or more Apartments | 0 (0.0%) | 6 (100.0%) |
| Mobile Home / Other | 0 (0.0%) | 0 (0.0%) |
| Total | 84 (81.6%) | 19 (18.4%) |
Housing Structures by Number of Rooms in Grand View on Hudson
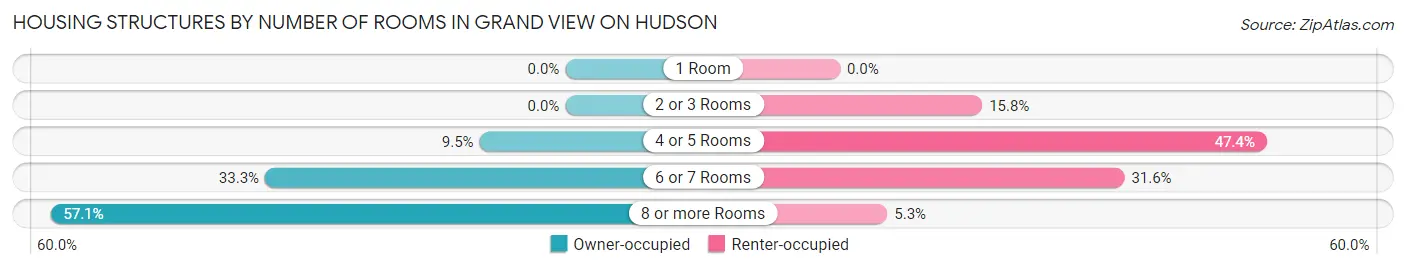
| Number of Rooms | Owner-occupied | Renter-occupied |
| 1 Room | 0 (0.0%) | 0 (0.0%) |
| 2 or 3 Rooms | 0 (0.0%) | 3 (15.8%) |
| 4 or 5 Rooms | 8 (9.5%) | 9 (47.4%) |
| 6 or 7 Rooms | 28 (33.3%) | 6 (31.6%) |
| 8 or more Rooms | 48 (57.1%) | 1 (5.3%) |
| Total | 84 (100.0%) | 19 (100.0%) |
Housing Structure by Heating Type in Grand View on Hudson
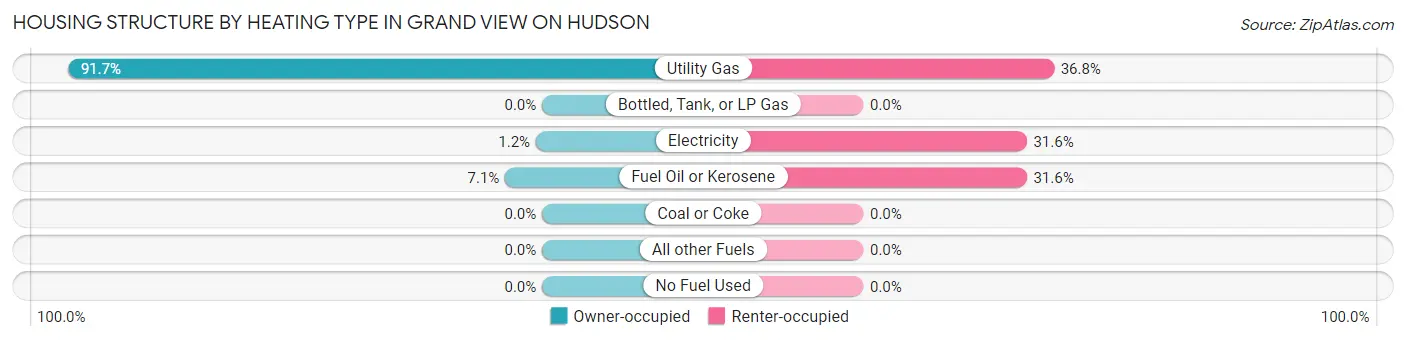
| Heating Type | Owner-occupied | Renter-occupied |
| Utility Gas | 77 (91.7%) | 7 (36.8%) |
| Bottled, Tank, or LP Gas | 0 (0.0%) | 0 (0.0%) |
| Electricity | 1 (1.2%) | 6 (31.6%) |
| Fuel Oil or Kerosene | 6 (7.1%) | 6 (31.6%) |
| Coal or Coke | 0 (0.0%) | 0 (0.0%) |
| All other Fuels | 0 (0.0%) | 0 (0.0%) |
| No Fuel Used | 0 (0.0%) | 0 (0.0%) |
| Total | 84 (100.0%) | 19 (100.0%) |
Household Vehicle Usage in Grand View on Hudson
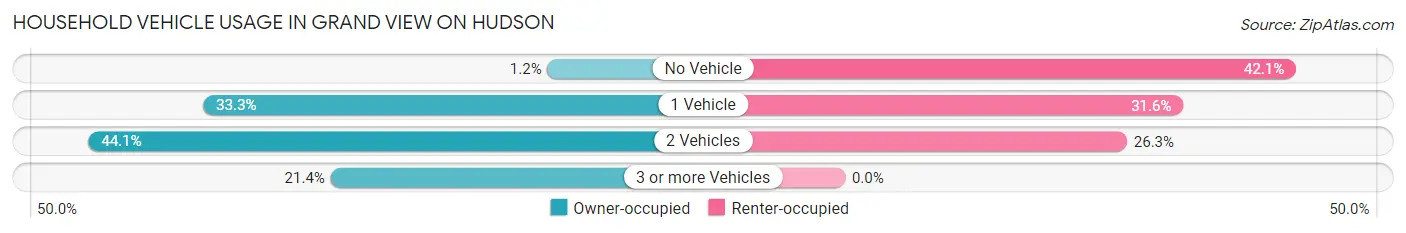
| Vehicles per Household | Owner-occupied | Renter-occupied |
| No Vehicle | 1 (1.2%) | 8 (42.1%) |
| 1 Vehicle | 28 (33.3%) | 6 (31.6%) |
| 2 Vehicles | 37 (44.1%) | 5 (26.3%) |
| 3 or more Vehicles | 18 (21.4%) | 0 (0.0%) |
| Total | 84 (100.0%) | 19 (100.0%) |
Real Estate & Mortgages in Grand View on Hudson
Real Estate and Mortgage Overview in Grand View on Hudson
| Characteristic | Without Mortgage | With Mortgage |
| Housing Units | 47 | 37 |
| Median Property Value | $1,154,400 | $1,145,800 |
| Median Household Income | $143,173 | $26 |
| Monthly Housing Costs | $1,501 | $37 |
| Real Estate Taxes | $10,001 | $0 |
Property Value by Mortgage Status in Grand View on Hudson
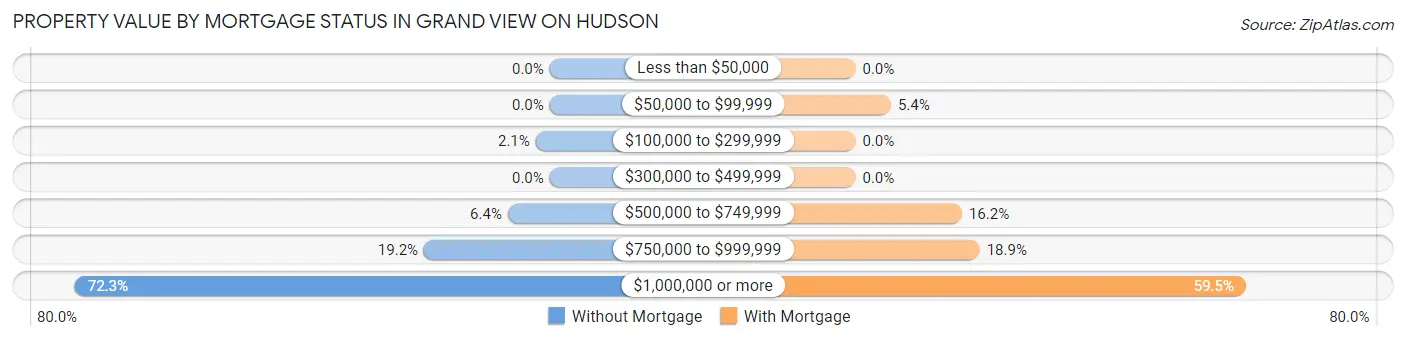
| Property Value | Without Mortgage | With Mortgage |
| Less than $50,000 | 0 (0.0%) | 0 (0.0%) |
| $50,000 to $99,999 | 0 (0.0%) | 2 (5.4%) |
| $100,000 to $299,999 | 1 (2.1%) | 0 (0.0%) |
| $300,000 to $499,999 | 0 (0.0%) | 0 (0.0%) |
| $500,000 to $749,999 | 3 (6.4%) | 6 (16.2%) |
| $750,000 to $999,999 | 9 (19.2%) | 7 (18.9%) |
| $1,000,000 or more | 34 (72.3%) | 22 (59.5%) |
| Total | 47 (100.0%) | 37 (100.0%) |
Household Income by Mortgage Status in Grand View on Hudson
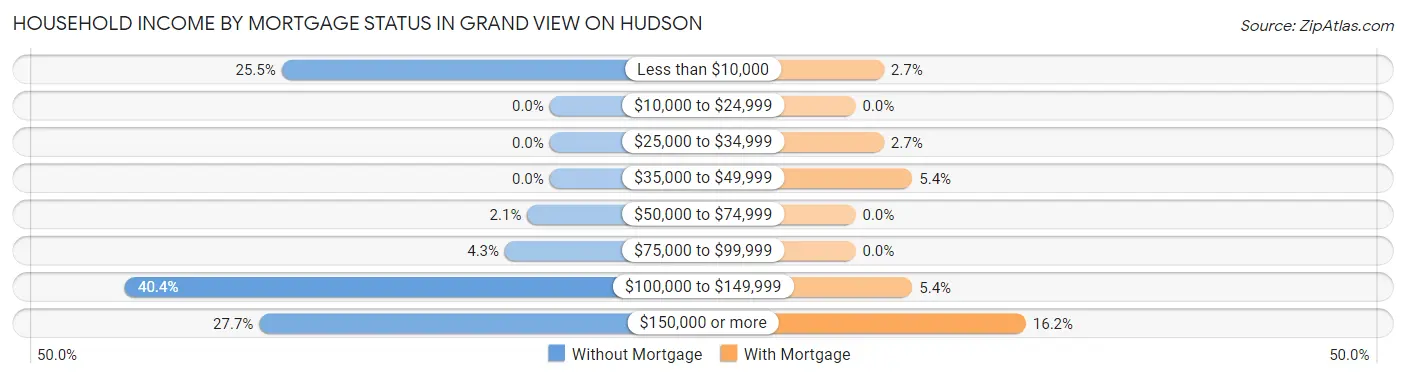
| Household Income | Without Mortgage | With Mortgage |
| Less than $10,000 | 12 (25.5%) | 1 (2.7%) |
| $10,000 to $24,999 | 0 (0.0%) | 0 (0.0%) |
| $25,000 to $34,999 | 0 (0.0%) | 1 (2.7%) |
| $35,000 to $49,999 | 0 (0.0%) | 2 (5.4%) |
| $50,000 to $74,999 | 1 (2.1%) | 0 (0.0%) |
| $75,000 to $99,999 | 2 (4.3%) | 0 (0.0%) |
| $100,000 to $149,999 | 19 (40.4%) | 2 (5.4%) |
| $150,000 or more | 13 (27.7%) | 6 (16.2%) |
| Total | 47 (100.0%) | 37 (100.0%) |
Property Value to Household Income Ratio in Grand View on Hudson
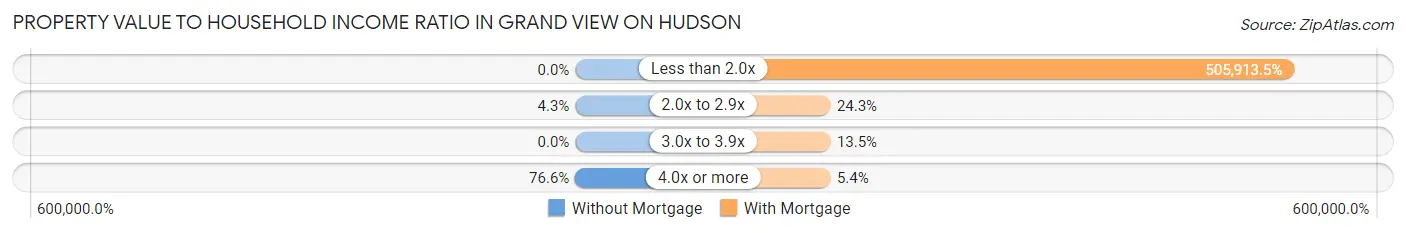
| Value-to-Income Ratio | Without Mortgage | With Mortgage |
| Less than 2.0x | 0 (0.0%) | 187,188 (505,913.5%) |
| 2.0x to 2.9x | 2 (4.3%) | 9 (24.3%) |
| 3.0x to 3.9x | 0 (0.0%) | 5 (13.5%) |
| 4.0x or more | 36 (76.6%) | 2 (5.4%) |
| Total | 47 (100.0%) | 37 (100.0%) |
Real Estate Taxes by Mortgage Status in Grand View on Hudson
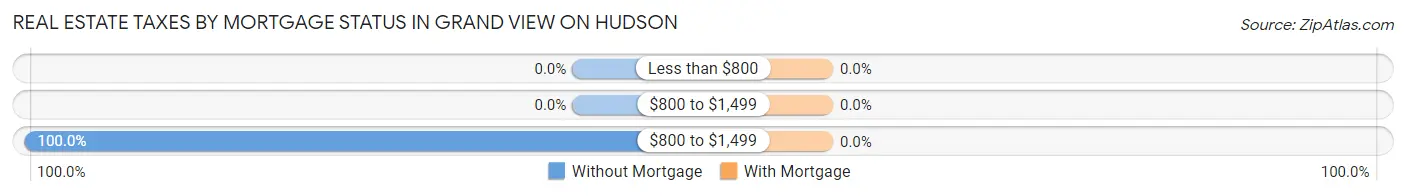
| Property Taxes | Without Mortgage | With Mortgage |
| Less than $800 | 0 (0.0%) | 0 (0.0%) |
| $800 to $1,499 | 0 (0.0%) | 0 (0.0%) |
| $800 to $1,499 | 47 (100.0%) | 0 (0.0%) |
| Total | 47 (100.0%) | 37 (100.0%) |
Health & Disability in Grand View on Hudson
Health Insurance Coverage by Age in Grand View on Hudson
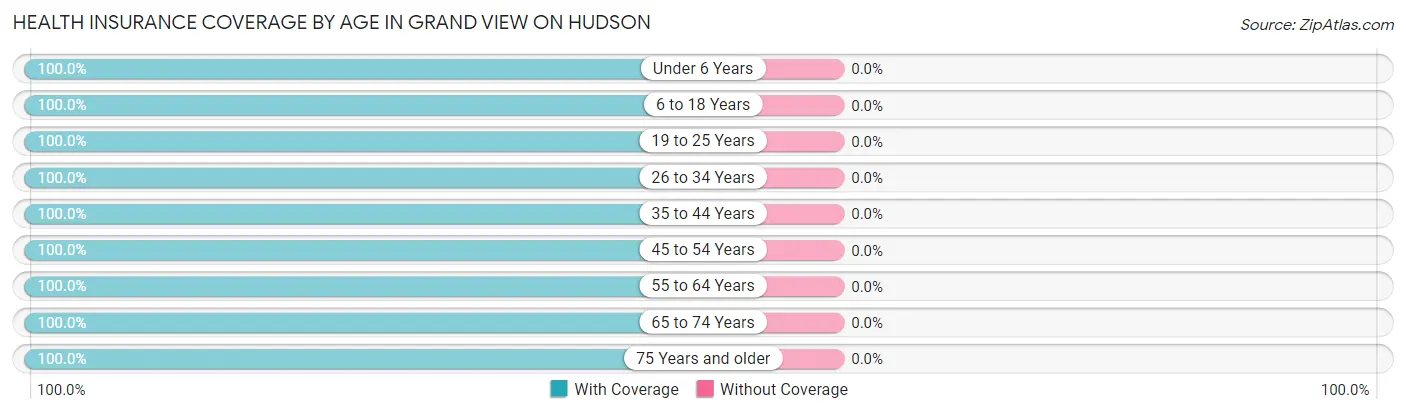
| Age Bracket | With Coverage | Without Coverage |
| Under 6 Years | 5 (100.0%) | 0 (0.0%) |
| 6 to 18 Years | 36 (100.0%) | 0 (0.0%) |
| 19 to 25 Years | 8 (100.0%) | 0 (0.0%) |
| 26 to 34 Years | 5 (100.0%) | 0 (0.0%) |
| 35 to 44 Years | 10 (100.0%) | 0 (0.0%) |
| 45 to 54 Years | 21 (100.0%) | 0 (0.0%) |
| 55 to 64 Years | 53 (100.0%) | 0 (0.0%) |
| 65 to 74 Years | 40 (100.0%) | 0 (0.0%) |
| 75 Years and older | 34 (100.0%) | 0 (0.0%) |
| Total | 212 (100.0%) | 0 (0.0%) |
Health Insurance Coverage by Citizenship Status in Grand View on Hudson
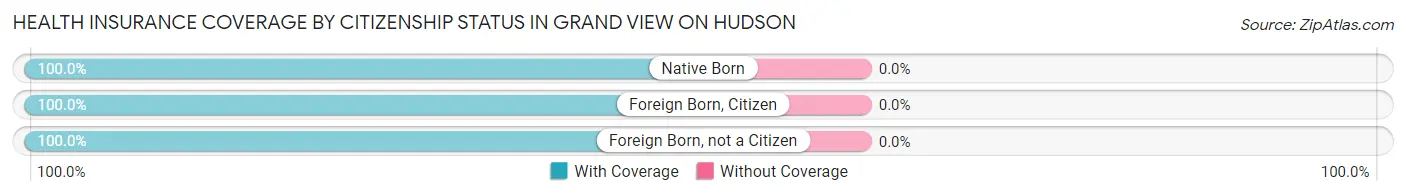
| Citizenship Status | With Coverage | Without Coverage |
| Native Born | 5 (100.0%) | 0 (0.0%) |
| Foreign Born, Citizen | 36 (100.0%) | 0 (0.0%) |
| Foreign Born, not a Citizen | 8 (100.0%) | 0 (0.0%) |
Health Insurance Coverage by Household Income in Grand View on Hudson
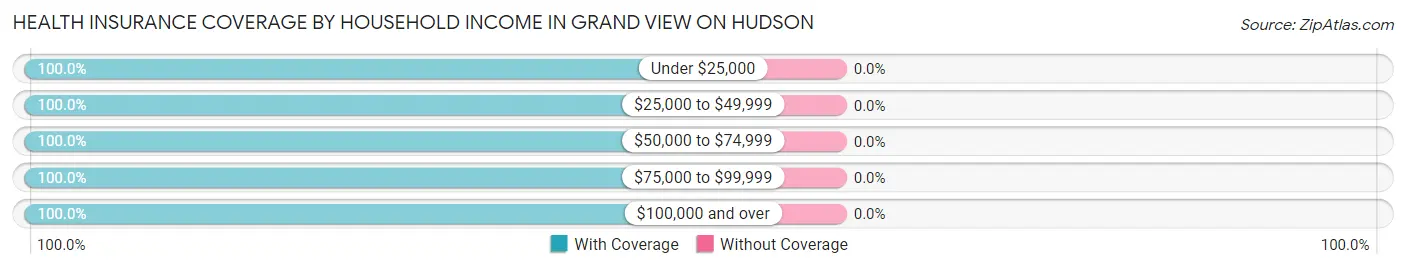
| Household Income | With Coverage | Without Coverage |
| Under $25,000 | 16 (100.0%) | 0 (0.0%) |
| $25,000 to $49,999 | 7 (100.0%) | 0 (0.0%) |
| $50,000 to $74,999 | 5 (100.0%) | 0 (0.0%) |
| $75,000 to $99,999 | 9 (100.0%) | 0 (0.0%) |
| $100,000 and over | 175 (100.0%) | 0 (0.0%) |
Public vs Private Health Insurance Coverage by Age in Grand View on Hudson
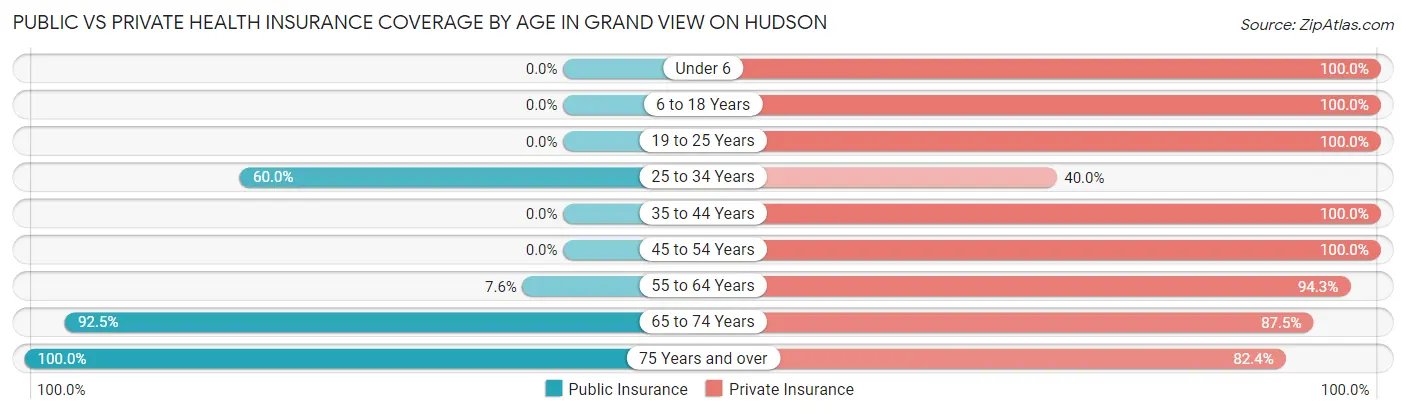
| Age Bracket | Public Insurance | Private Insurance |
| Under 6 | 0 (0.0%) | 5 (100.0%) |
| 6 to 18 Years | 0 (0.0%) | 36 (100.0%) |
| 19 to 25 Years | 0 (0.0%) | 8 (100.0%) |
| 25 to 34 Years | 3 (60.0%) | 2 (40.0%) |
| 35 to 44 Years | 0 (0.0%) | 10 (100.0%) |
| 45 to 54 Years | 0 (0.0%) | 21 (100.0%) |
| 55 to 64 Years | 4 (7.5%) | 50 (94.3%) |
| 65 to 74 Years | 37 (92.5%) | 35 (87.5%) |
| 75 Years and over | 34 (100.0%) | 28 (82.4%) |
| Total | 78 (36.8%) | 195 (92.0%) |
Disability Status by Sex by Age in Grand View on Hudson
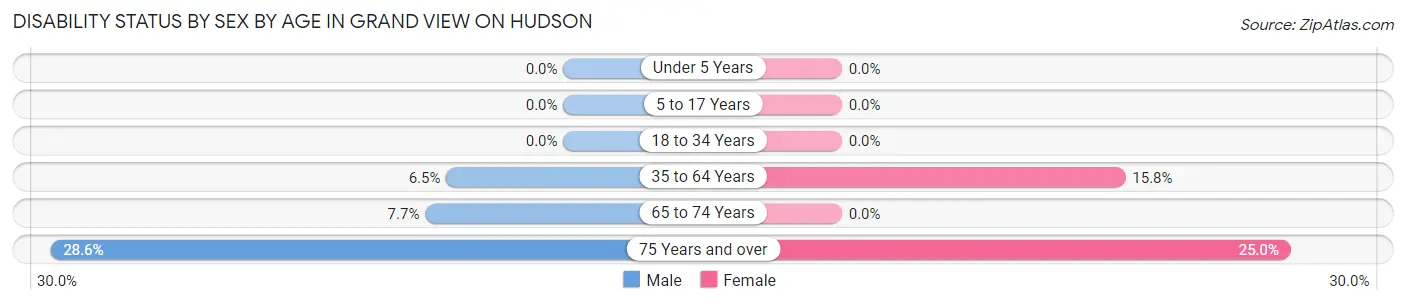
| Age Bracket | Male | Female |
| Under 5 Years | 0 (0.0%) | 0 (0.0%) |
| 5 to 17 Years | 0 (0.0%) | 0 (0.0%) |
| 18 to 34 Years | 0 (0.0%) | 0 (0.0%) |
| 35 to 64 Years | 3 (6.5%) | 6 (15.8%) |
| 65 to 74 Years | 1 (7.7%) | 0 (0.0%) |
| 75 Years and over | 4 (28.6%) | 5 (25.0%) |
Disability Class by Sex by Age in Grand View on Hudson
Disability Class: Hearing Difficulty
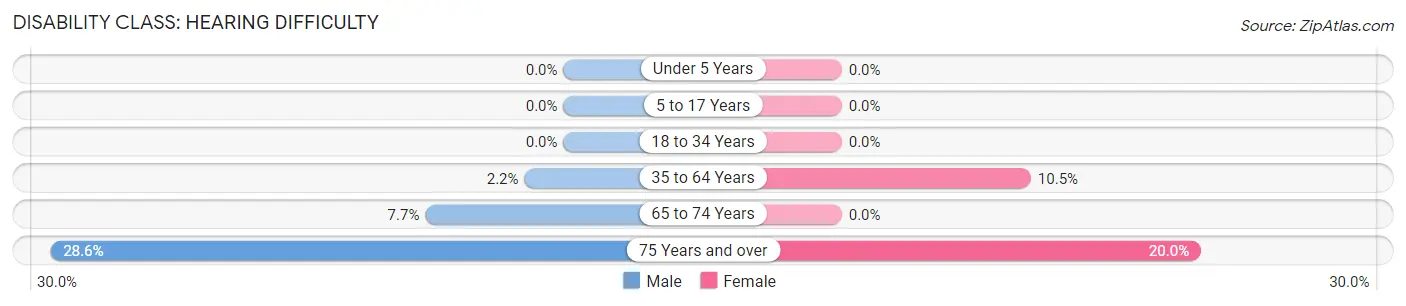
| Age Bracket | Male | Female |
| Under 5 Years | 0 (0.0%) | 0 (0.0%) |
| 5 to 17 Years | 0 (0.0%) | 0 (0.0%) |
| 18 to 34 Years | 0 (0.0%) | 0 (0.0%) |
| 35 to 64 Years | 1 (2.2%) | 4 (10.5%) |
| 65 to 74 Years | 1 (7.7%) | 0 (0.0%) |
| 75 Years and over | 4 (28.6%) | 4 (20.0%) |
Disability Class: Vision Difficulty
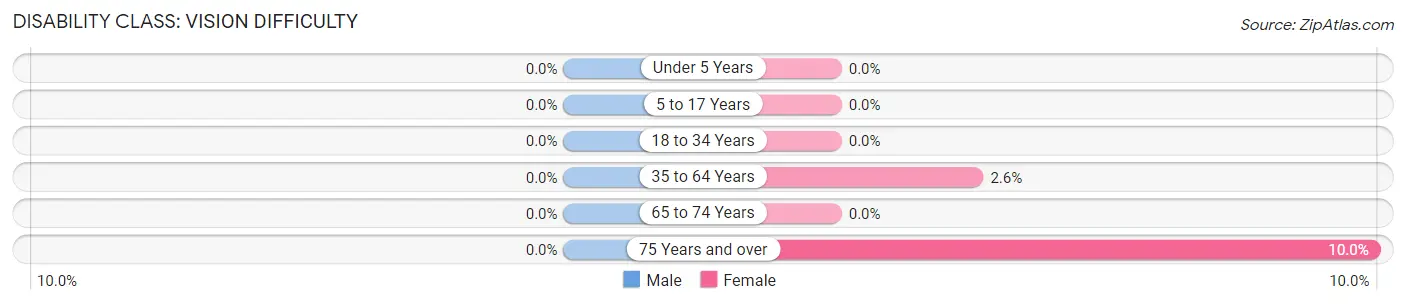
| Age Bracket | Male | Female |
| Under 5 Years | 0 (0.0%) | 0 (0.0%) |
| 5 to 17 Years | 0 (0.0%) | 0 (0.0%) |
| 18 to 34 Years | 0 (0.0%) | 0 (0.0%) |
| 35 to 64 Years | 0 (0.0%) | 1 (2.6%) |
| 65 to 74 Years | 0 (0.0%) | 0 (0.0%) |
| 75 Years and over | 0 (0.0%) | 2 (10.0%) |
Disability Class: Cognitive Difficulty
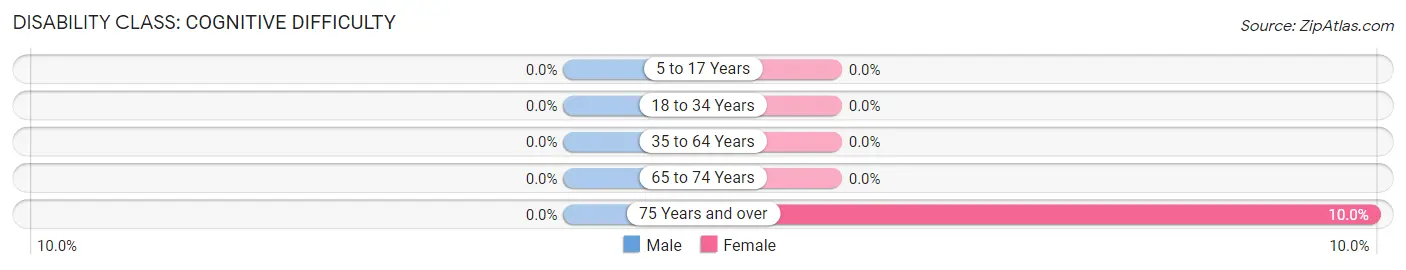
| Age Bracket | Male | Female |
| 5 to 17 Years | 0 (0.0%) | 0 (0.0%) |
| 18 to 34 Years | 0 (0.0%) | 0 (0.0%) |
| 35 to 64 Years | 0 (0.0%) | 0 (0.0%) |
| 65 to 74 Years | 0 (0.0%) | 0 (0.0%) |
| 75 Years and over | 0 (0.0%) | 2 (10.0%) |
Disability Class: Ambulatory Difficulty
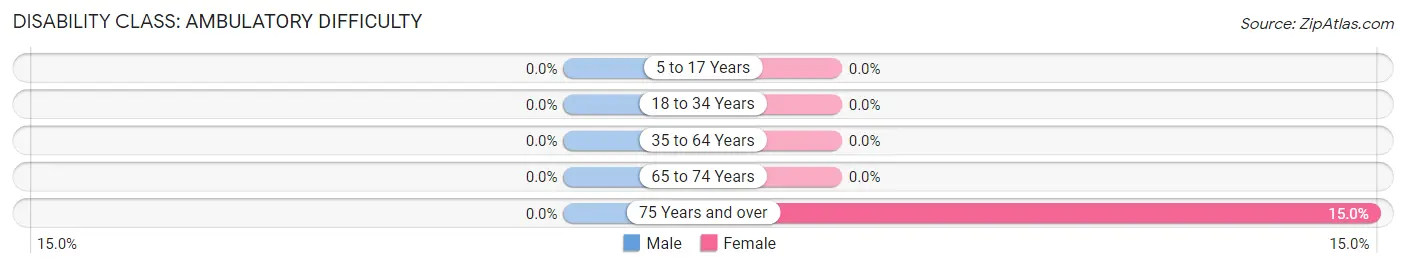
| Age Bracket | Male | Female |
| 5 to 17 Years | 0 (0.0%) | 0 (0.0%) |
| 18 to 34 Years | 0 (0.0%) | 0 (0.0%) |
| 35 to 64 Years | 0 (0.0%) | 0 (0.0%) |
| 65 to 74 Years | 0 (0.0%) | 0 (0.0%) |
| 75 Years and over | 0 (0.0%) | 3 (15.0%) |
Disability Class: Self-Care Difficulty
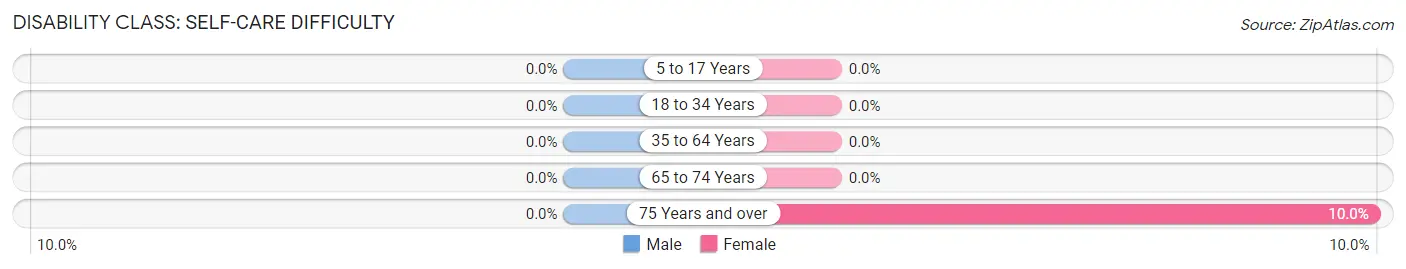
| Age Bracket | Male | Female |
| 5 to 17 Years | 0 (0.0%) | 0 (0.0%) |
| 18 to 34 Years | 0 (0.0%) | 0 (0.0%) |
| 35 to 64 Years | 0 (0.0%) | 0 (0.0%) |
| 65 to 74 Years | 0 (0.0%) | 0 (0.0%) |
| 75 Years and over | 0 (0.0%) | 2 (10.0%) |
Technology Access in Grand View on Hudson
Computing Device Access in Grand View on Hudson
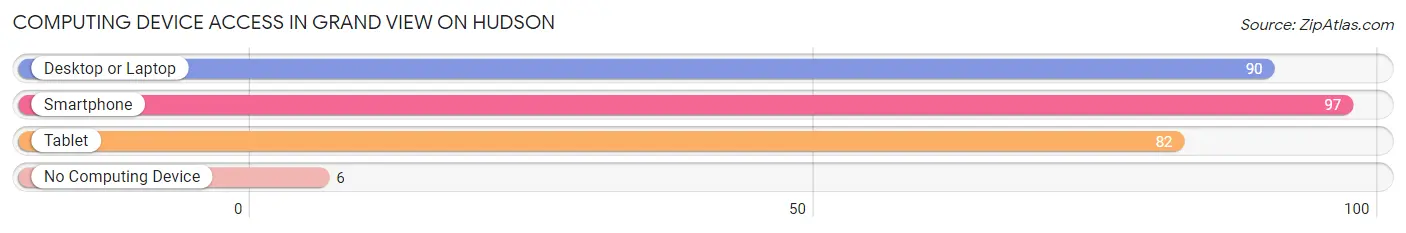
| Device Type | # Households | % Households |
| Desktop or Laptop | 90 | 87.4% |
| Smartphone | 97 | 94.2% |
| Tablet | 82 | 79.6% |
| No Computing Device | 6 | 5.8% |
| Total | 103 | 100.0% |
Internet Access in Grand View on Hudson
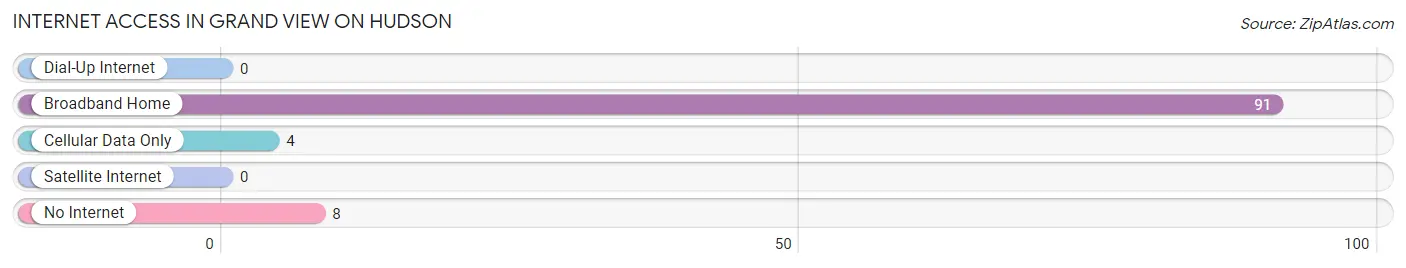
| Internet Type | # Households | % Households |
| Dial-Up Internet | 0 | 0.0% |
| Broadband Home | 91 | 88.3% |
| Cellular Data Only | 4 | 3.9% |
| Satellite Internet | 0 | 0.0% |
| No Internet | 8 | 7.8% |
| Total | 103 | 100.0% |
Grand View on Hudson Summary
Grand View on Hudson is a village located in the town of Orangetown in Rockland County, New York. It is situated on the west bank of the Hudson River, approximately 25 miles north of New York City. The village is home to a population of approximately 1,500 people and is known for its picturesque views of the Hudson River and the Palisades.
History
Grand View on Hudson was first settled in the late 1700s by Dutch and English settlers. The village was originally known as “Grand View” and was part of the town of Orangetown. In 1872, the village was incorporated as “Grand View on Hudson”.
The village was a popular summer destination for wealthy New Yorkers in the late 19th and early 20th centuries. Many of the grand homes that were built during this time still stand today.
In the early 20th century, the village was home to a number of factories, including a paper mill, a brickyard, and a cement plant. These factories provided employment for many of the village’s residents.
Geography
Grand View on Hudson is located on the west bank of the Hudson River, approximately 25 miles north of New York City. The village is bordered by the towns of Orangetown and Clarkstown.
The village is situated on a hill overlooking the Hudson River and the Palisades. The village is home to a number of parks, including Grand View Park, which offers stunning views of the Hudson River and the Palisades.
Economy
Grand View on Hudson is a primarily residential community. The village is home to a number of small businesses, including restaurants, shops, and professional services.
The village is also home to a number of corporate offices, including those of the pharmaceutical company Pfizer and the financial services company UBS.
Demographics
As of the 2010 census, the population of Grand View on Hudson was 1,521. The racial makeup of the village was 94.3% White, 1.2% African American, 0.2% Native American, 1.7% Asian, 0.1% Pacific Islander, 1.2% from other races, and 1.3% from two or more races. Hispanic or Latino of any race were 4.2% of the population.
The median household income in Grand View on Hudson was $90,917, and the median family income was $106,250. The per capita income for the village was $45,945.
Conclusion
Grand View on Hudson is a picturesque village located on the west bank of the Hudson River, approximately 25 miles north of New York City. The village is home to a population of approximately 1,500 people and is known for its stunning views of the Hudson River and the Palisades. The village is a primarily residential community and is home to a number of small businesses, corporate offices, and parks. The population of Grand View on Hudson is primarily White, with a small percentage of African American, Native American, Asian, and Hispanic or Latino residents. The median household income in Grand View on Hudson is $90,917.
Common Questions
What is Per Capita Income in Grand View on Hudson?
Per Capita income in Grand View on Hudson is $105,455.
What is the Median Family Income in Grand View on Hudson?
Median Family Income in Grand View on Hudson is $186,250.
What is the Median Household income in Grand View on Hudson?
Median Household Income in Grand View on Hudson is $144,519.
What is Inequality or Gini Index in Grand View on Hudson?
Inequality or Gini Index in Grand View on Hudson is 0.53.
What is the Total Population of Grand View on Hudson?
Total Population of Grand View on Hudson is 212.
What is the Total Male Population of Grand View on Hudson?
Total Male Population of Grand View on Hudson is 87.
What is the Total Female Population of Grand View on Hudson?
Total Female Population of Grand View on Hudson is 125.
What is the Ratio of Males per 100 Females in Grand View on Hudson?
There are 69.60 Males per 100 Females in Grand View on Hudson.
What is the Ratio of Females per 100 Males in Grand View on Hudson?
There are 143.68 Females per 100 Males in Grand View on Hudson.
What is the Median Population Age in Grand View on Hudson?
Median Population Age in Grand View on Hudson is 58.3 Years.
What is the Average Family Size in Grand View on Hudson
Average Family Size in Grand View on Hudson is 2.5 People.
What is the Average Household Size in Grand View on Hudson
Average Household Size in Grand View on Hudson is 2.1 People.
How Large is the Labor Force in Grand View on Hudson?
There are 91 People in the Labor Forcein in Grand View on Hudson.
What is the Percentage of People in the Labor Force in Grand View on Hudson?
46.7% of People are in the Labor Force in Grand View on Hudson.
What is the Unemployment Rate in Grand View on Hudson?
Unemployment Rate in Grand View on Hudson is 4.4%.