Zip Codes with the Highest Percentage of Families with Income Above $100,000 in New York
RELATED REPORTS & OPTIONS
Family Income | $100k+
New York
Compare Zip Codes
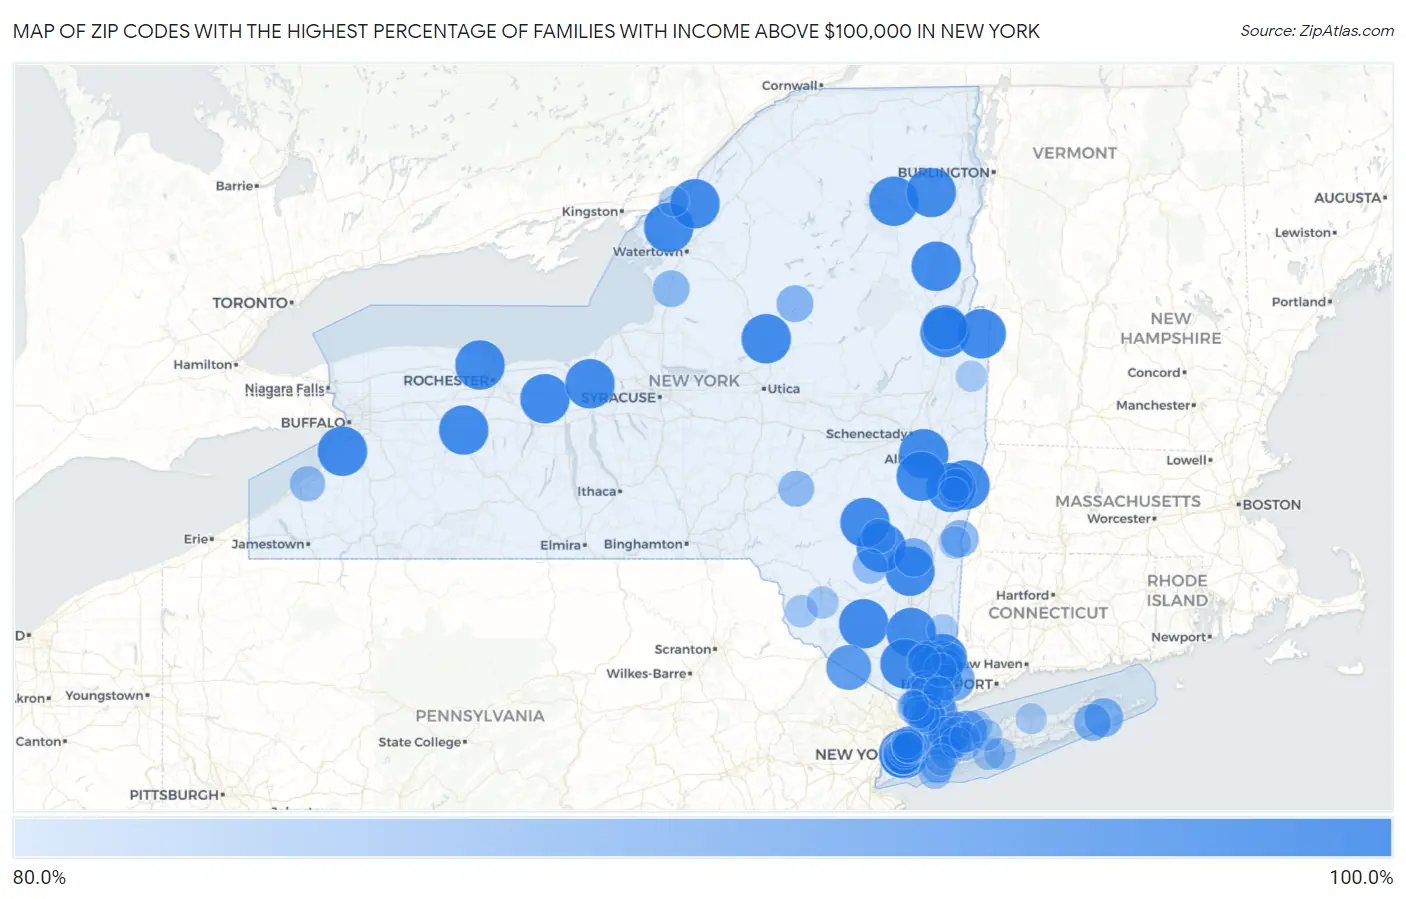
Map of Zip Codes with the Highest Percentage of Families with Income Above $100,000 in New York
80.0%
100.0%
Zip Codes with the Highest Percentage of Families with Income Above $100,000 in New York
| Zip Code | Families with Income > $100k | vs State | vs National | |
| 1. | 12222 | 100.0% | 50.3%(+49.7)#1 | 46.1%(+53.9)#5 |
| 2. | 12977 | 100.0% | 50.3%(+49.7)#2 | 46.1%(+53.9)#16 |
| 3. | 12574 | 100.0% | 50.3%(+49.7)#3 | 46.1%(+53.9)#37 |
| 4. | 14539 | 100.0% | 50.3%(+49.7)#4 | 46.1%(+53.9)#64 |
| 5. | 12195 | 100.0% | 50.3%(+49.7)#5 | 46.1%(+53.9)#68 |
| 6. | 10279 | 100.0% | 50.3%(+49.7)#6 | 46.1%(+53.9)#82 |
| 7. | 13301 | 100.0% | 50.3%(+49.7)#7 | 46.1%(+53.9)#86 |
| 8. | 12987 | 100.0% | 50.3%(+49.7)#8 | 46.1%(+53.9)#87 |
| 9. | 12448 | 100.0% | 50.3%(+49.7)#9 | 46.1%(+53.9)#92 |
| 10. | 14515 | 100.0% | 50.3%(+49.7)#10 | 46.1%(+53.9)#93 |
| 11. | 10519 | 100.0% | 50.3%(+49.7)#11 | 46.1%(+53.9)#110 |
| 12. | 14537 | 100.0% | 50.3%(+49.7)#12 | 46.1%(+53.9)#118 |
| 13. | 13632 | 100.0% | 50.3%(+49.7)#13 | 46.1%(+53.9)#125 |
| 14. | 12872 | 100.0% | 50.3%(+49.7)#14 | 46.1%(+53.9)#131 |
| 15. | 12820 | 100.0% | 50.3%(+49.7)#15 | 46.1%(+53.9)#132 |
| 16. | 12854 | 100.0% | 50.3%(+49.7)#16 | 46.1%(+53.9)#139 |
| 17. | 12115 | 100.0% | 50.3%(+49.7)#17 | 46.1%(+53.9)#144 |
| 18. | 13675 | 100.0% | 50.3%(+49.7)#18 | 46.1%(+53.9)#172 |
| 19. | 14112 | 100.0% | 50.3%(+49.7)#19 | 46.1%(+53.9)#187 |
| 20. | 10985 | 100.0% | 50.3%(+49.7)#20 | 46.1%(+53.9)#204 |
| 21. | 12161 | 100.0% | 50.3%(+49.7)#21 | 46.1%(+53.9)#220 |
| 22. | 13154 | 100.0% | 50.3%(+49.7)#22 | 46.1%(+53.9)#225 |
| 23. | 12452 | 100.0% | 50.3%(+49.7)#23 | 46.1%(+53.9)#232 |
| 24. | 12527 | 100.0% | 50.3%(+49.7)#24 | 46.1%(+53.9)#252 |
| 25. | 10911 | 100.0% | 50.3%(+49.7)#25 | 46.1%(+53.9)#258 |
| 26. | 10969 | 95.5% | 50.3%(+45.2)#26 | 46.1%(+49.4)#285 |
| 27. | 10578 | 95.4% | 50.3%(+45.1)#27 | 46.1%(+49.3)#287 |
| 28. | 12844 | 95.3% | 50.3%(+45.0)#28 | 46.1%(+49.2)#288 |
| 29. | 10004 | 93.5% | 50.3%(+43.2)#29 | 46.1%(+47.4)#304 |
| 30. | 10007 | 93.3% | 50.3%(+43.0)#30 | 46.1%(+47.2)#308 |
| 31. | 10576 | 92.7% | 50.3%(+42.4)#31 | 46.1%(+46.6)#316 |
| 32. | 11724 | 92.1% | 50.3%(+41.8)#32 | 46.1%(+46.0)#322 |
| 33. | 10282 | 91.5% | 50.3%(+41.2)#33 | 46.1%(+45.4)#331 |
| 34. | 10514 | 90.0% | 50.3%(+39.7)#34 | 46.1%(+43.9)#357 |
| 35. | 10006 | 89.8% | 50.3%(+39.5)#35 | 46.1%(+43.7)#365 |
| 36. | 10280 | 89.7% | 50.3%(+39.4)#36 | 46.1%(+43.6)#368 |
| 37. | 10005 | 89.7% | 50.3%(+39.4)#37 | 46.1%(+43.6)#369 |
| 38. | 10533 | 89.6% | 50.3%(+39.3)#38 | 46.1%(+43.5)#372 |
| 39. | 10502 | 89.6% | 50.3%(+39.3)#39 | 46.1%(+43.5)#373 |
| 40. | 10526 | 89.6% | 50.3%(+39.3)#40 | 46.1%(+43.5)#374 |
| 41. | 12507 | 89.6% | 50.3%(+39.3)#41 | 46.1%(+43.5)#375 |
| 42. | 11975 | 89.5% | 50.3%(+39.2)#42 | 46.1%(+43.4)#376 |
| 43. | 10580 | 89.4% | 50.3%(+39.1)#43 | 46.1%(+43.3)#379 |
| 44. | 10577 | 89.3% | 50.3%(+39.0)#44 | 46.1%(+43.2)#382 |
| 45. | 10501 | 89.3% | 50.3%(+39.0)#45 | 46.1%(+43.2)#384 |
| 46. | 10535 | 88.6% | 50.3%(+38.3)#46 | 46.1%(+42.5)#404 |
| 47. | 12517 | 88.2% | 50.3%(+37.9)#47 | 46.1%(+42.1)#419 |
| 48. | 10028 | 88.1% | 50.3%(+37.8)#48 | 46.1%(+42.0)#420 |
| 49. | 11976 | 87.7% | 50.3%(+37.4)#49 | 46.1%(+41.6)#444 |
| 50. | 13420 | 87.7% | 50.3%(+37.4)#50 | 46.1%(+41.6)#445 |
| 51. | 13674 | 87.5% | 50.3%(+37.2)#51 | 46.1%(+41.4)#455 |
| 52. | 10506 | 86.8% | 50.3%(+36.5)#52 | 46.1%(+40.7)#480 |
| 53. | 13860 | 86.7% | 50.3%(+36.4)#53 | 46.1%(+40.6)#492 |
| 54. | 10803 | 86.6% | 50.3%(+36.3)#54 | 46.1%(+40.5)#494 |
| 55. | 11577 | 86.5% | 50.3%(+36.2)#55 | 46.1%(+40.4)#501 |
| 56. | 10003 | 86.2% | 50.3%(+35.9)#56 | 46.1%(+40.1)#515 |
| 57. | 10510 | 86.1% | 50.3%(+35.8)#57 | 46.1%(+40.0)#524 |
| 58. | 14135 | 86.1% | 50.3%(+35.8)#58 | 46.1%(+40.0)#527 |
| 59. | 10583 | 86.0% | 50.3%(+35.7)#59 | 46.1%(+39.9)#528 |
| 60. | 10560 | 85.8% | 50.3%(+35.5)#60 | 46.1%(+39.7)#548 |
| 61. | 12450 | 85.7% | 50.3%(+35.4)#61 | 46.1%(+39.6)#556 |
| 62. | 10016 | 85.6% | 50.3%(+35.3)#62 | 46.1%(+39.5)#558 |
| 63. | 11030 | 85.6% | 50.3%(+35.3)#63 | 46.1%(+39.5)#559 |
| 64. | 12494 | 85.6% | 50.3%(+35.3)#64 | 46.1%(+39.5)#561 |
| 65. | 11765 | 85.6% | 50.3%(+35.3)#65 | 46.1%(+39.5)#562 |
| 66. | 11803 | 85.3% | 50.3%(+35.0)#66 | 46.1%(+39.2)#571 |
| 67. | 10804 | 85.3% | 50.3%(+35.0)#67 | 46.1%(+39.2)#574 |
| 68. | 11568 | 85.1% | 50.3%(+34.8)#68 | 46.1%(+39.0)#583 |
| 69. | 10065 | 85.0% | 50.3%(+34.7)#69 | 46.1%(+38.9)#585 |
| 70. | 10570 | 84.9% | 50.3%(+34.6)#70 | 46.1%(+38.8)#596 |
| 71. | 11579 | 84.9% | 50.3%(+34.6)#71 | 46.1%(+38.8)#601 |
| 72. | 11598 | 84.7% | 50.3%(+34.4)#72 | 46.1%(+38.6)#610 |
| 73. | 10536 | 84.5% | 50.3%(+34.2)#73 | 46.1%(+38.4)#627 |
| 74. | 10964 | 84.5% | 50.3%(+34.2)#74 | 46.1%(+38.4)#628 |
| 75. | 11732 | 84.4% | 50.3%(+34.1)#75 | 46.1%(+38.3)#638 |
| 76. | 10588 | 84.4% | 50.3%(+34.1)#76 | 46.1%(+38.3)#639 |
| 77. | 11509 | 84.0% | 50.3%(+33.7)#77 | 46.1%(+37.9)#672 |
| 78. | 12024 | 84.0% | 50.3%(+33.7)#78 | 46.1%(+37.9)#673 |
| 79. | 11530 | 83.8% | 50.3%(+33.5)#79 | 46.1%(+37.7)#683 |
| 80. | 11718 | 83.4% | 50.3%(+33.1)#80 | 46.1%(+37.3)#710 |
| 81. | 12516 | 83.4% | 50.3%(+33.1)#81 | 46.1%(+37.3)#711 |
| 82. | 12720 | 83.4% | 50.3%(+33.1)#82 | 46.1%(+37.3)#713 |
| 83. | 12742 | 83.3% | 50.3%(+33.0)#83 | 46.1%(+37.2)#722 |
| 84. | 10707 | 83.2% | 50.3%(+32.9)#84 | 46.1%(+37.1)#726 |
| 85. | 10706 | 83.2% | 50.3%(+32.9)#85 | 46.1%(+37.1)#727 |
| 86. | 10024 | 83.0% | 50.3%(+32.7)#86 | 46.1%(+36.9)#737 |
| 87. | 11739 | 82.9% | 50.3%(+32.6)#87 | 46.1%(+36.8)#744 |
| 88. | 11721 | 82.7% | 50.3%(+32.4)#88 | 46.1%(+36.6)#755 |
| 89. | 11725 | 82.6% | 50.3%(+32.3)#89 | 46.1%(+36.5)#762 |
| 90. | 11753 | 82.6% | 50.3%(+32.3)#90 | 46.1%(+36.5)#764 |
| 91. | 11565 | 82.6% | 50.3%(+32.3)#91 | 46.1%(+36.5)#768 |
| 92. | 12531 | 82.6% | 50.3%(+32.3)#92 | 46.1%(+36.5)#770 |
| 93. | 10504 | 82.4% | 50.3%(+32.1)#93 | 46.1%(+36.3)#782 |
| 94. | 12823 | 82.3% | 50.3%(+32.0)#94 | 46.1%(+36.2)#792 |
| 95. | 11786 | 82.0% | 50.3%(+31.7)#95 | 46.1%(+35.9)#806 |
| 96. | 10022 | 81.8% | 50.3%(+31.5)#96 | 46.1%(+35.7)#819 |
| 97. | 11797 | 81.7% | 50.3%(+31.4)#97 | 46.1%(+35.6)#843 |
| 98. | 12136 | 81.7% | 50.3%(+31.4)#98 | 46.1%(+35.6)#849 |
| 99. | 10968 | 81.5% | 50.3%(+31.2)#99 | 46.1%(+35.4)#865 |
| 100. | 13692 | 81.4% | 50.3%(+31.1)#100 | 46.1%(+35.3)#876 |
Common Questions
What are the Top 10 Zip Codes with the Highest Percentage of Families with Income Above $100,000 in New York?
Top 10 Zip Codes with the Highest Percentage of Families with Income Above $100,000 in New York are:
What zip code has the Highest Percentage of Families with Income Above $100,000 in New York?
12222 has the Highest Percentage of Families with Income Above $100,000 in New York with 100.0%.
What is the Percentage of Families with Income Above $100,000 in the State of New York?
Percentage of Families with Income Above $100,000 in New York is 50.3%.
What is the Percentage of Families with Income Above $100,000 in the United States?
Percentage of Families with Income Above $100,000 in the United States is 46.1%.