Great River, NY Map & Demographics
Great River Map
Great River Overview
$77,558
PER CAPITA INCOME
$187,321
AVG FAMILY INCOME
$140,469
AVG HOUSEHOLD INCOME
38.1%
WAGE / INCOME GAP [ % ]
61.9¢/ $1
WAGE / INCOME GAP [ $ ]
0.47
INEQUALITY / GINI INDEX
1,992
TOTAL POPULATION
1,011
MALE POPULATION
981
FEMALE POPULATION
103.06
MALES / 100 FEMALES
97.03
FEMALES / 100 MALES
49.9
MEDIAN AGE
3.2
AVG FAMILY SIZE
2.4
AVG HOUSEHOLD SIZE
1,234
LABOR FORCE [ PEOPLE ]
69.0%
PERCENT IN LABOR FORCE
3.2%
UNEMPLOYMENT RATE
Great River Zip Codes
Great River Area Codes
Income in Great River
Income Overview in Great River
Per Capita Income in Great River is $77,558, while median incomes of families and households are $187,321 and $140,469 respectively.
| Characteristic | Number | Measure |
| Per Capita Income | 1,992 | $77,558 |
| Median Family Income | 525 | $187,321 |
| Mean Family Income | 525 | $242,302 |
| Median Household Income | 823 | $140,469 |
| Mean Household Income | 823 | $182,858 |
| Income Deficit | 525 | $0 |
| Wage / Income Gap (%) | 1,992 | 38.05% |
| Wage / Income Gap ($) | 1,992 | 61.95¢ per $1 |
| Gini / Inequality Index | 1,992 | 0.47 |
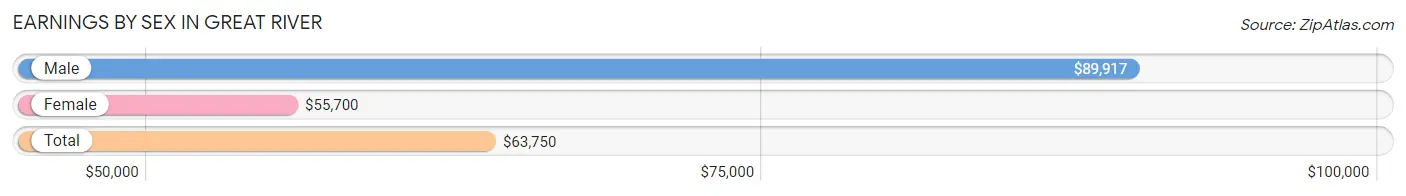
Earnings by Sex in Great River
Average Earnings in Great River are $63,750, $89,917 for men and $55,700 for women, a difference of 38.1%.
| Sex | Number | Average Earnings |
| Male | 717 (54.8%) | $89,917 |
| Female | 592 (45.2%) | $55,700 |
| Total | 1,309 (100.0%) | $63,750 |
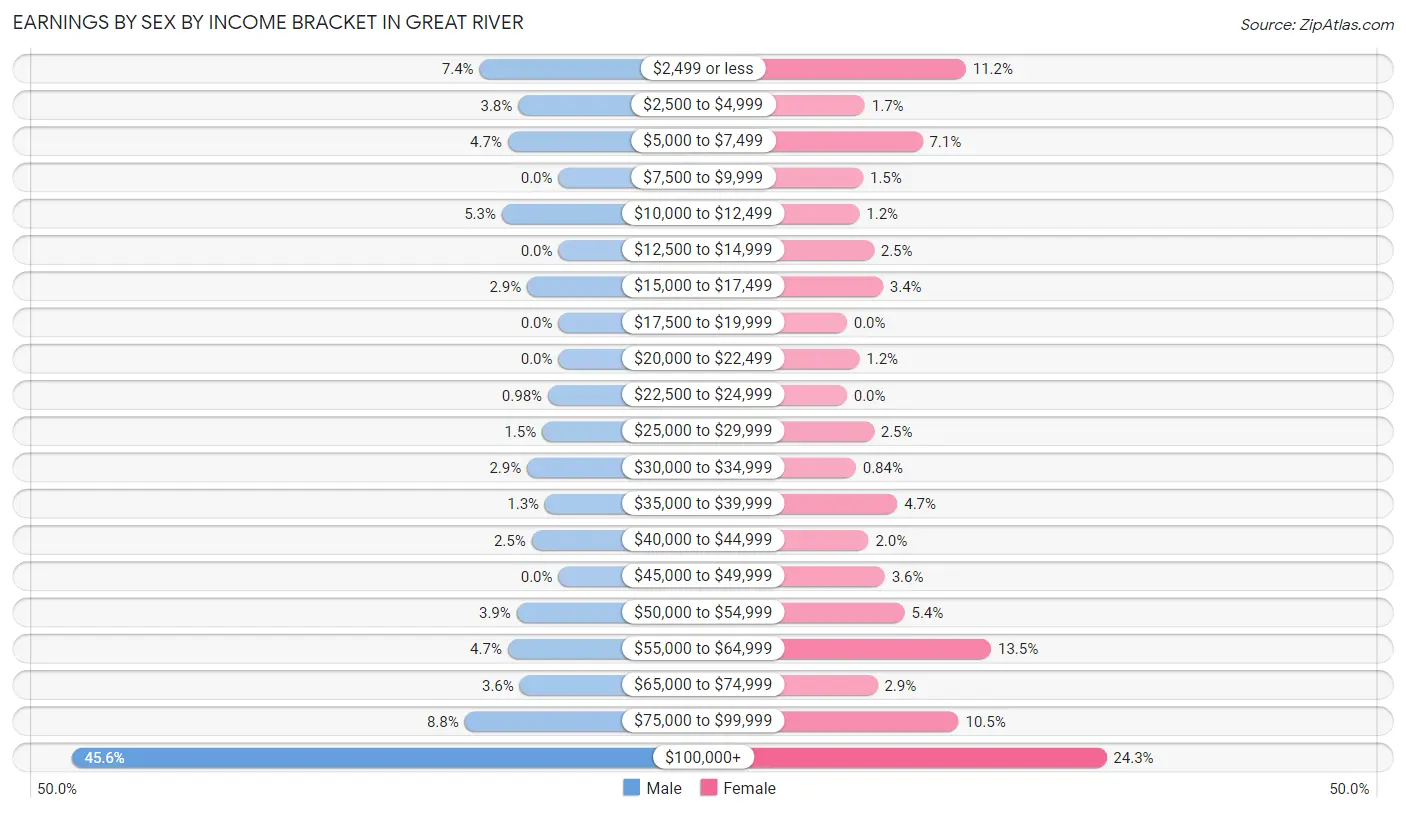
Earnings by Sex by Income Bracket in Great River
The most common earnings brackets in Great River are $100,000+ for men (327 | 45.6%) and $100,000+ for women (144 | 24.3%).
| Income | Male | Female |
| $2,499 or less | 53 (7.4%) | 66 (11.2%) |
| $2,500 to $4,999 | 27 (3.8%) | 10 (1.7%) |
| $5,000 to $7,499 | 34 (4.7%) | 42 (7.1%) |
| $7,500 to $9,999 | 0 (0.0%) | 9 (1.5%) |
| $10,000 to $12,499 | 38 (5.3%) | 7 (1.2%) |
| $12,500 to $14,999 | 0 (0.0%) | 15 (2.5%) |
| $15,000 to $17,499 | 21 (2.9%) | 20 (3.4%) |
| $17,500 to $19,999 | 0 (0.0%) | 0 (0.0%) |
| $20,000 to $22,499 | 0 (0.0%) | 7 (1.2%) |
| $22,500 to $24,999 | 7 (1.0%) | 0 (0.0%) |
| $25,000 to $29,999 | 11 (1.5%) | 15 (2.5%) |
| $30,000 to $34,999 | 21 (2.9%) | 5 (0.8%) |
| $35,000 to $39,999 | 9 (1.3%) | 28 (4.7%) |
| $40,000 to $44,999 | 18 (2.5%) | 12 (2.0%) |
| $45,000 to $49,999 | 0 (0.0%) | 21 (3.5%) |
| $50,000 to $54,999 | 28 (3.9%) | 32 (5.4%) |
| $55,000 to $64,999 | 34 (4.7%) | 80 (13.5%) |
| $65,000 to $74,999 | 26 (3.6%) | 17 (2.9%) |
| $75,000 to $99,999 | 63 (8.8%) | 62 (10.5%) |
| $100,000+ | 327 (45.6%) | 144 (24.3%) |
| Total | 717 (100.0%) | 592 (100.0%) |
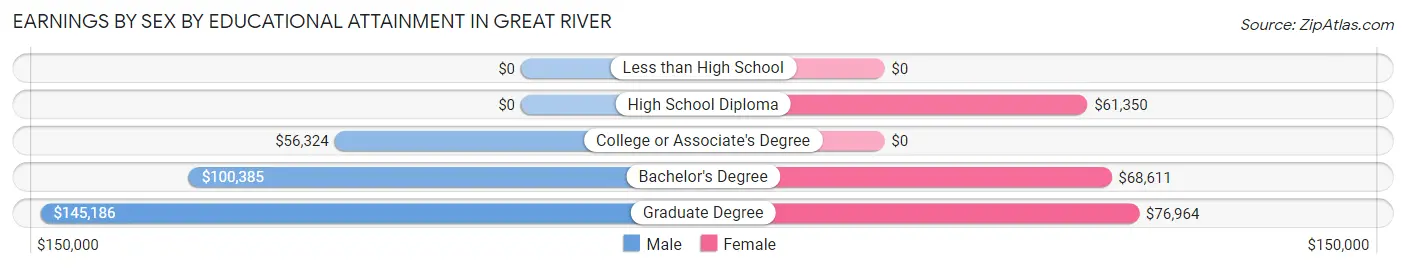
Earnings by Sex by Educational Attainment in Great River
Average earnings in Great River are $102,625 for men and $63,068 for women, a difference of 38.6%. Men with an educational attainment of graduate degree enjoy the highest average annual earnings of $145,186, while those with college or associate's degree education earn the least with $56,324. Women with an educational attainment of graduate degree earn the most with the average annual earnings of $76,964, while those with high school diploma education have the smallest earnings of $61,350.
| Educational Attainment | Male Income | Female Income |
| Less than High School | - | - |
| High School Diploma | - | - |
| College or Associate's Degree | $56,324 | $0 |
| Bachelor's Degree | $100,385 | $68,611 |
| Graduate Degree | $145,186 | $76,964 |
| Total | $102,625 | $63,068 |
Family Income in Great River
Family Income Brackets in Great River
According to the Great River family income data, there are 248 families falling into the $200,000+ income range, which is the most common income bracket and makes up 47.2% of all families.
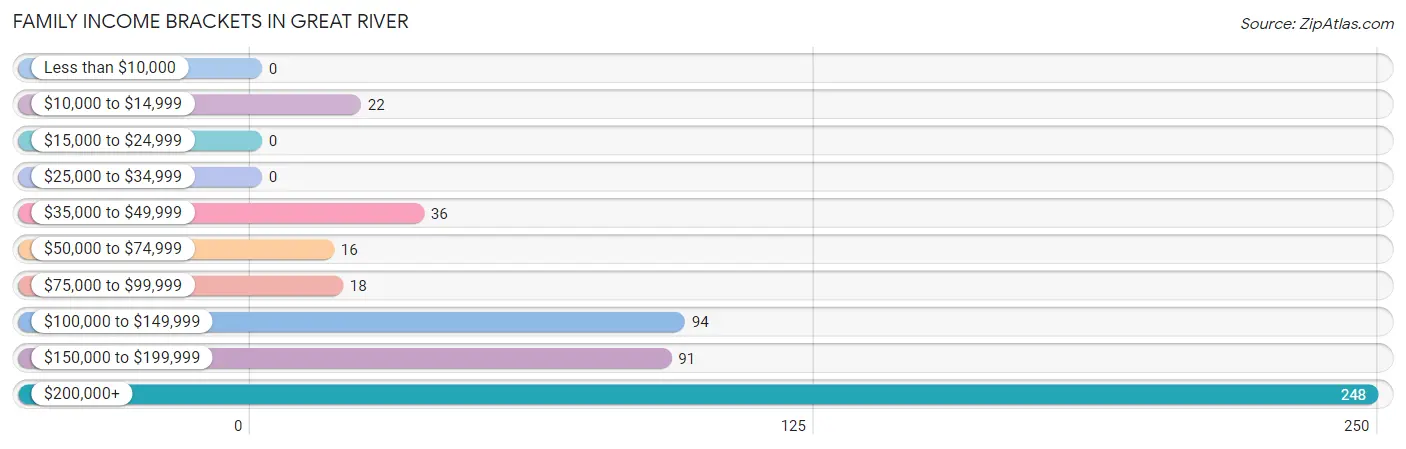
| Income Bracket | # Families | % Families |
| Less than $10,000 | 0 | 0.0% |
| $10,000 to $14,999 | 22 | 4.2% |
| $15,000 to $24,999 | 0 | 0.0% |
| $25,000 to $34,999 | 0 | 0.0% |
| $35,000 to $49,999 | 36 | 6.9% |
| $50,000 to $74,999 | 16 | 3.0% |
| $75,000 to $99,999 | 18 | 3.4% |
| $100,000 to $149,999 | 94 | 17.9% |
| $150,000 to $199,999 | 91 | 17.3% |
| $200,000+ | 248 | 47.2% |
Family Income by Famaliy Size in Great River
4-person families (110 | 20.9%) account for the highest median family income in Great River with $250,001 per family, while 3-person families (120 | 22.9%) have the highest median income of $72,083 per family member.
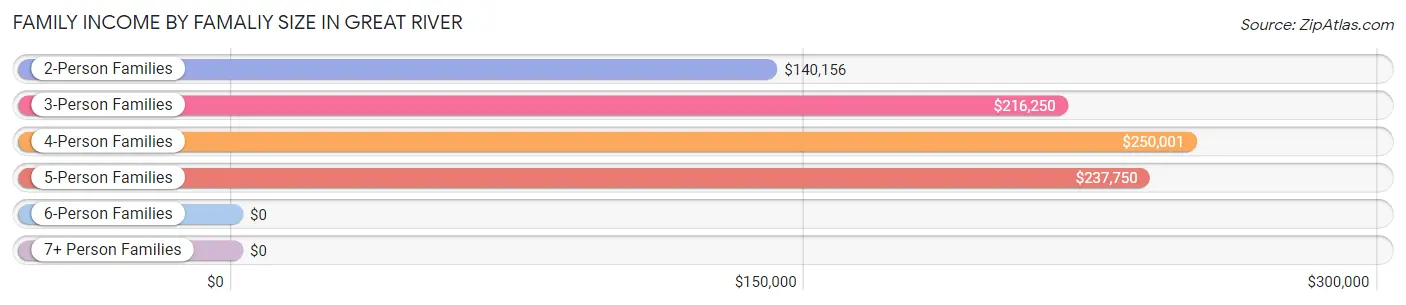
| Income Bracket | # Families | Median Income |
| 2-Person Families | 235 (44.8%) | $140,156 |
| 3-Person Families | 120 (22.9%) | $216,250 |
| 4-Person Families | 110 (20.9%) | $250,001 |
| 5-Person Families | 55 (10.5%) | $237,750 |
| 6-Person Families | 0 (0.0%) | $0 |
| 7+ Person Families | 5 (0.9%) | $0 |
| Total | 525 (100.0%) | $187,321 |
Family Income by Number of Earners in Great River
The median family income in Great River is $187,321, with families comprising 3+ earners (144) having the highest median family income of $240,938, while families with no earners (88) have the lowest median family income of $39,219, accounting for 27.4% and 16.8% of families, respectively.
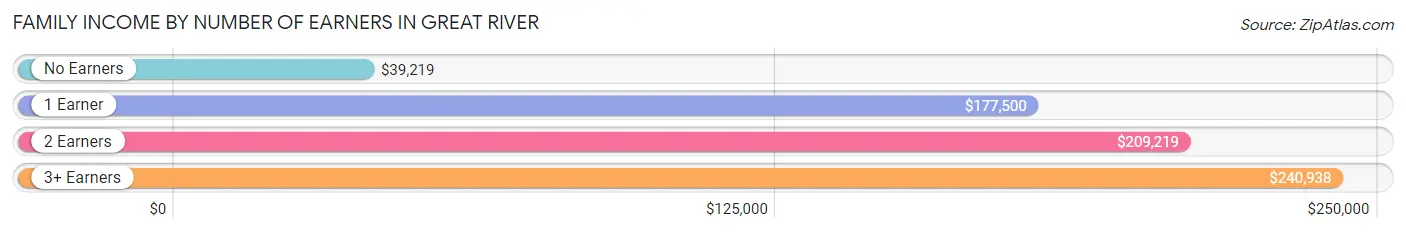
| Number of Earners | # Families | Median Income |
| No Earners | 88 (16.8%) | $39,219 |
| 1 Earner | 56 (10.7%) | $177,500 |
| 2 Earners | 237 (45.1%) | $209,219 |
| 3+ Earners | 144 (27.4%) | $240,938 |
| Total | 525 (100.0%) | $187,321 |
Household Income in Great River
Household Income Brackets in Great River
With 248 households falling in the category, the $200,000+ income range is the most frequent in Great River, accounting for 30.1% of all households.
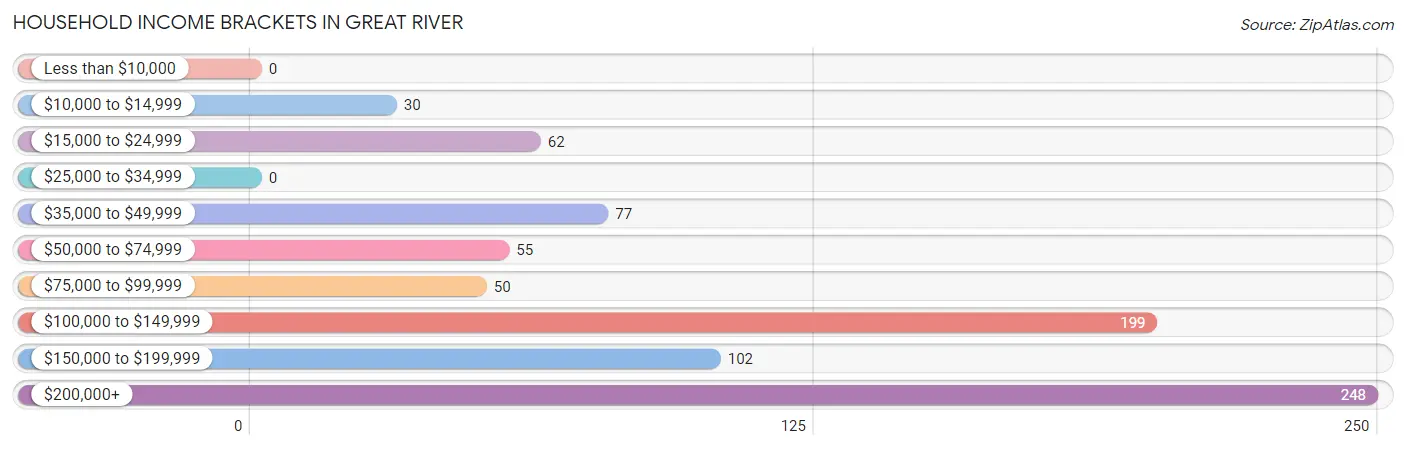
| Income Bracket | # Households | % Households |
| Less than $10,000 | 0 | 0.0% |
| $10,000 to $14,999 | 30 | 3.6% |
| $15,000 to $24,999 | 62 | 7.5% |
| $25,000 to $34,999 | 0 | 0.0% |
| $35,000 to $49,999 | 77 | 9.4% |
| $50,000 to $74,999 | 55 | 6.7% |
| $75,000 to $99,999 | 50 | 6.1% |
| $100,000 to $149,999 | 199 | 24.2% |
| $150,000 to $199,999 | 102 | 12.4% |
| $200,000+ | 248 | 30.1% |
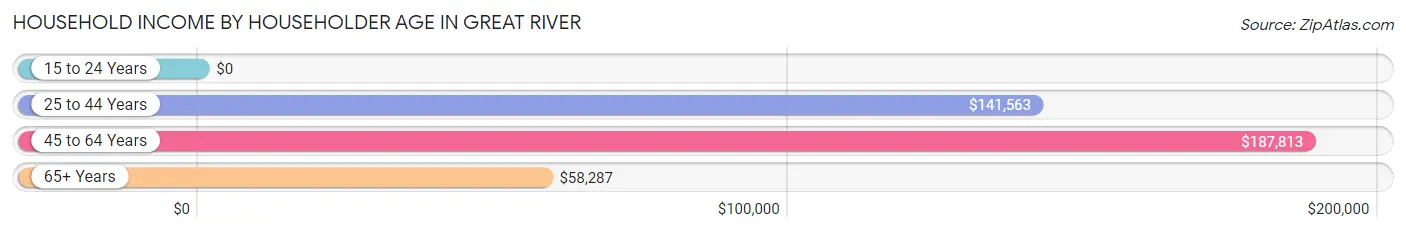
Household Income by Householder Age in Great River
The median household income in Great River is $140,469, with the highest median household income of $187,813 found in the 45 to 64 years age bracket for the primary householder. A total of 364 households (44.2%) fall into this category.
| Income Bracket | # Households | Median Income |
| 15 to 24 Years | 0 (0.0%) | $0 |
| 25 to 44 Years | 138 (16.8%) | $141,563 |
| 45 to 64 Years | 364 (44.2%) | $187,813 |
| 65+ Years | 321 (39.0%) | $58,287 |
| Total | 823 (100.0%) | $140,469 |
Poverty in Great River
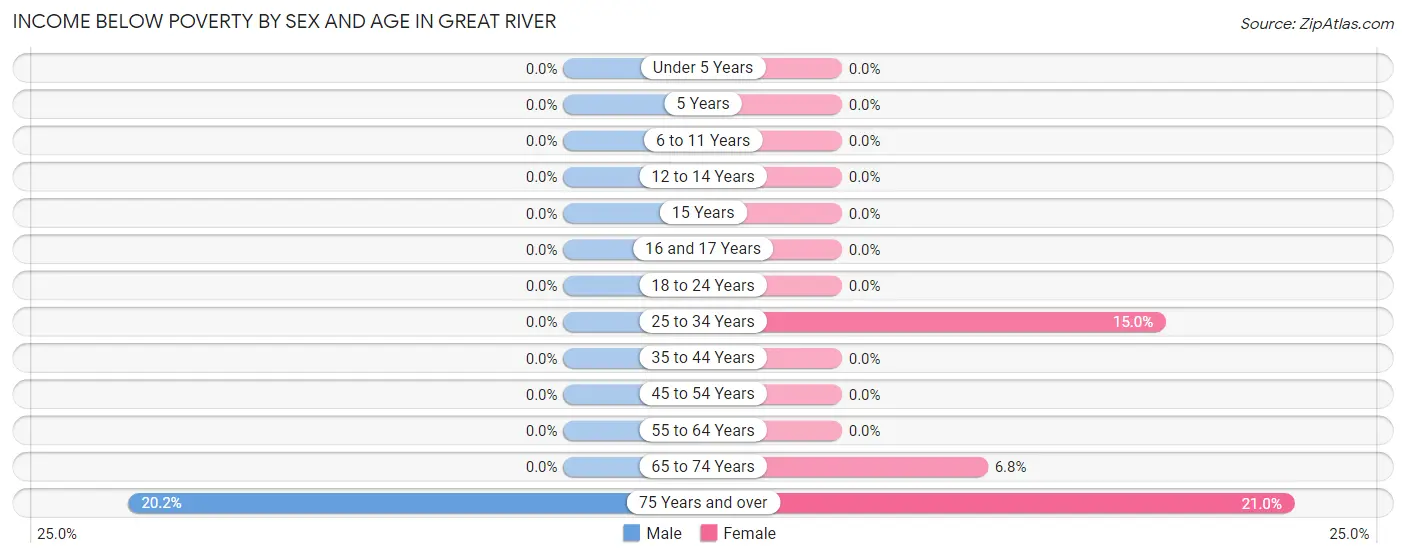
Income Below Poverty by Sex and Age in Great River
With 2.2% poverty level for males and 4.8% for females among the residents of Great River, 75 year old and over males and 75 year old and over females are the most vulnerable to poverty, with 22 males (20.2%) and 26 females (21.0%) in their respective age groups living below the poverty level.
| Age Bracket | Male | Female |
| Under 5 Years | 0 (0.0%) | 0 (0.0%) |
| 5 Years | 0 (0.0%) | 0 (0.0%) |
| 6 to 11 Years | 0 (0.0%) | 0 (0.0%) |
| 12 to 14 Years | 0 (0.0%) | 0 (0.0%) |
| 15 Years | 0 (0.0%) | 0 (0.0%) |
| 16 and 17 Years | 0 (0.0%) | 0 (0.0%) |
| 18 to 24 Years | 0 (0.0%) | 0 (0.0%) |
| 25 to 34 Years | 0 (0.0%) | 12 (15.0%) |
| 35 to 44 Years | 0 (0.0%) | 0 (0.0%) |
| 45 to 54 Years | 0 (0.0%) | 0 (0.0%) |
| 55 to 64 Years | 0 (0.0%) | 0 (0.0%) |
| 65 to 74 Years | 0 (0.0%) | 9 (6.8%) |
| 75 Years and over | 22 (20.2%) | 26 (21.0%) |
| Total | 22 (2.2%) | 47 (4.8%) |
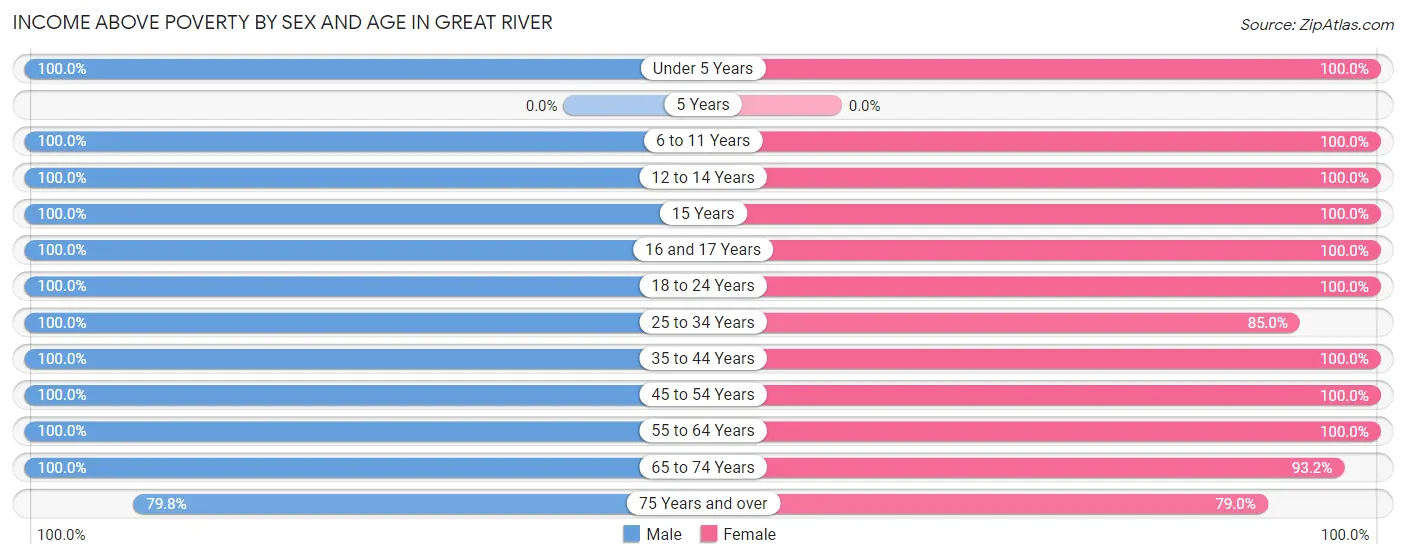
Income Above Poverty by Sex and Age in Great River
According to the poverty statistics in Great River, males aged under 5 years and females aged under 5 years are the age groups that are most secure financially, with 100.0% of males and 100.0% of females in these age groups living above the poverty line.
| Age Bracket | Male | Female |
| Under 5 Years | 13 (100.0%) | 24 (100.0%) |
| 5 Years | 0 (0.0%) | 0 (0.0%) |
| 6 to 11 Years | 25 (100.0%) | 48 (100.0%) |
| 12 to 14 Years | 54 (100.0%) | 25 (100.0%) |
| 15 Years | 10 (100.0%) | 5 (100.0%) |
| 16 and 17 Years | 37 (100.0%) | 31 (100.0%) |
| 18 to 24 Years | 120 (100.0%) | 96 (100.0%) |
| 25 to 34 Years | 182 (100.0%) | 68 (85.0%) |
| 35 to 44 Years | 86 (100.0%) | 61 (100.0%) |
| 45 to 54 Years | 111 (100.0%) | 144 (100.0%) |
| 55 to 64 Years | 162 (100.0%) | 210 (100.0%) |
| 65 to 74 Years | 102 (100.0%) | 124 (93.2%) |
| 75 Years and over | 87 (79.8%) | 98 (79.0%) |
| Total | 989 (97.8%) | 934 (95.2%) |
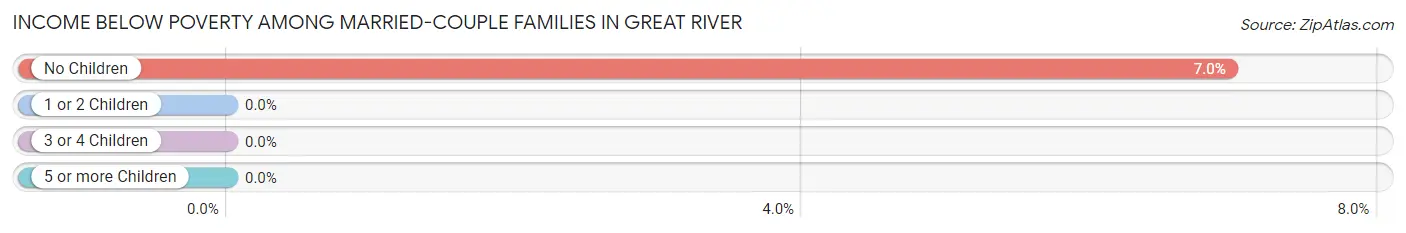
Income Below Poverty Among Married-Couple Families in Great River
The poverty statistics for married-couple families in Great River show that 5.3% or 22 of the total 412 families live below the poverty line. Families with no children have the highest poverty rate of 7.0%, comprising of 22 families. On the other hand, families with 1 or 2 children have the lowest poverty rate of 0.0%, which includes 0 families.
| Children | Above Poverty | Below Poverty |
| No Children | 294 (93.0%) | 22 (7.0%) |
| 1 or 2 Children | 71 (100.0%) | 0 (0.0%) |
| 3 or 4 Children | 25 (100.0%) | 0 (0.0%) |
| 5 or more Children | 0 (0.0%) | 0 (0.0%) |
| Total | 390 (94.7%) | 22 (5.3%) |
Income Below Poverty Among Single-Parent Households in Great River
| Children | Single Father | Single Mother |
| No Children | 0 (0.0%) | 0 (0.0%) |
| 1 or 2 Children | 0 (0.0%) | 0 (0.0%) |
| 3 or 4 Children | 0 (0.0%) | 0 (0.0%) |
| 5 or more Children | 0 (0.0%) | 0 (0.0%) |
| Total | 0 (0.0%) | 0 (0.0%) |
Income Below Poverty Among Married-Couple vs Single-Parent Households in Great River
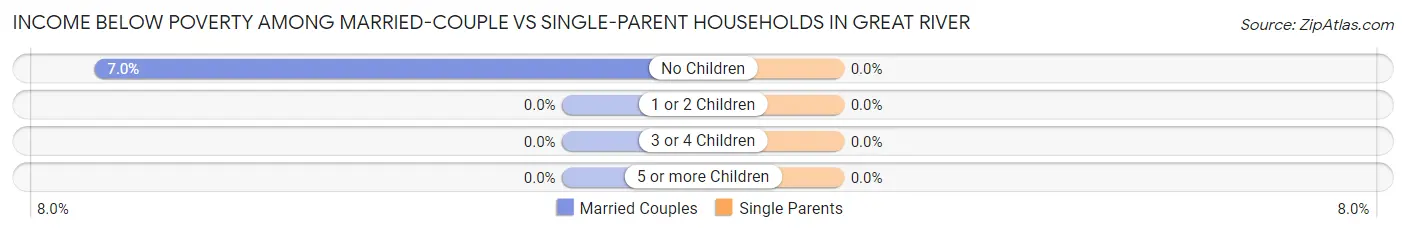
| Children | Married-Couple Families | Single-Parent Households |
| No Children | 22 (7.0%) | 0 (0.0%) |
| 1 or 2 Children | 0 (0.0%) | 0 (0.0%) |
| 3 or 4 Children | 0 (0.0%) | 0 (0.0%) |
| 5 or more Children | 0 (0.0%) | 0 (0.0%) |
| Total | 22 (5.3%) | 0 (0.0%) |
Race in Great River
The most populous races in Great River are White / Caucasian (1,821 | 91.4%), Hispanic or Latino (181 | 9.1%), and Two or more Races (133 | 6.7%).
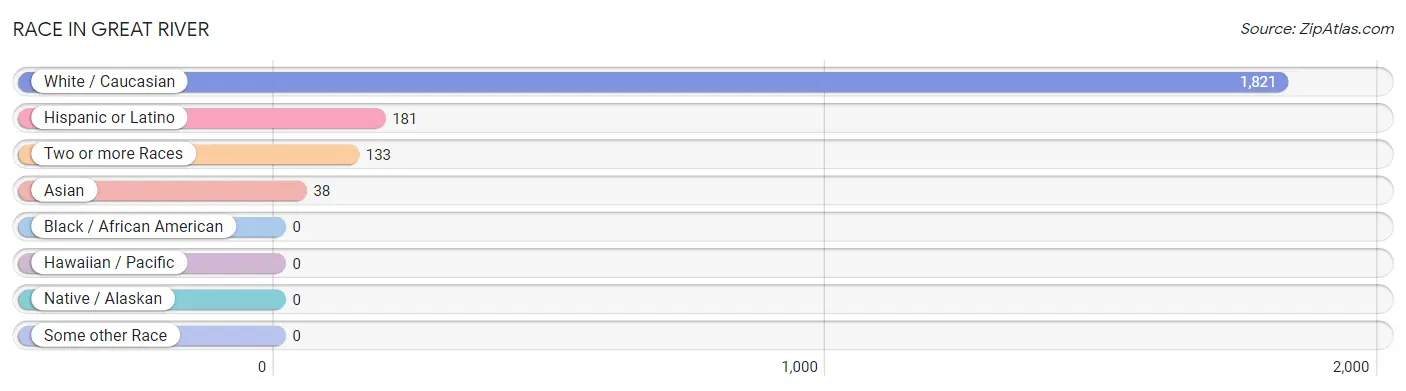
| Race | # Population | % Population |
| Asian | 38 | 1.9% |
| Black / African American | 0 | 0.0% |
| Hawaiian / Pacific | 0 | 0.0% |
| Hispanic or Latino | 181 | 9.1% |
| Native / Alaskan | 0 | 0.0% |
| White / Caucasian | 1,821 | 91.4% |
| Two or more Races | 133 | 6.7% |
| Some other Race | 0 | 0.0% |
| Total | 1,992 | 100.0% |
Ancestry in Great River
The most populous ancestries reported in Great River are Italian (630 | 31.6%), Irish (525 | 26.4%), German (204 | 10.2%), English (145 | 7.3%), and American (107 | 5.4%), together accounting for 80.9% of all Great River residents.
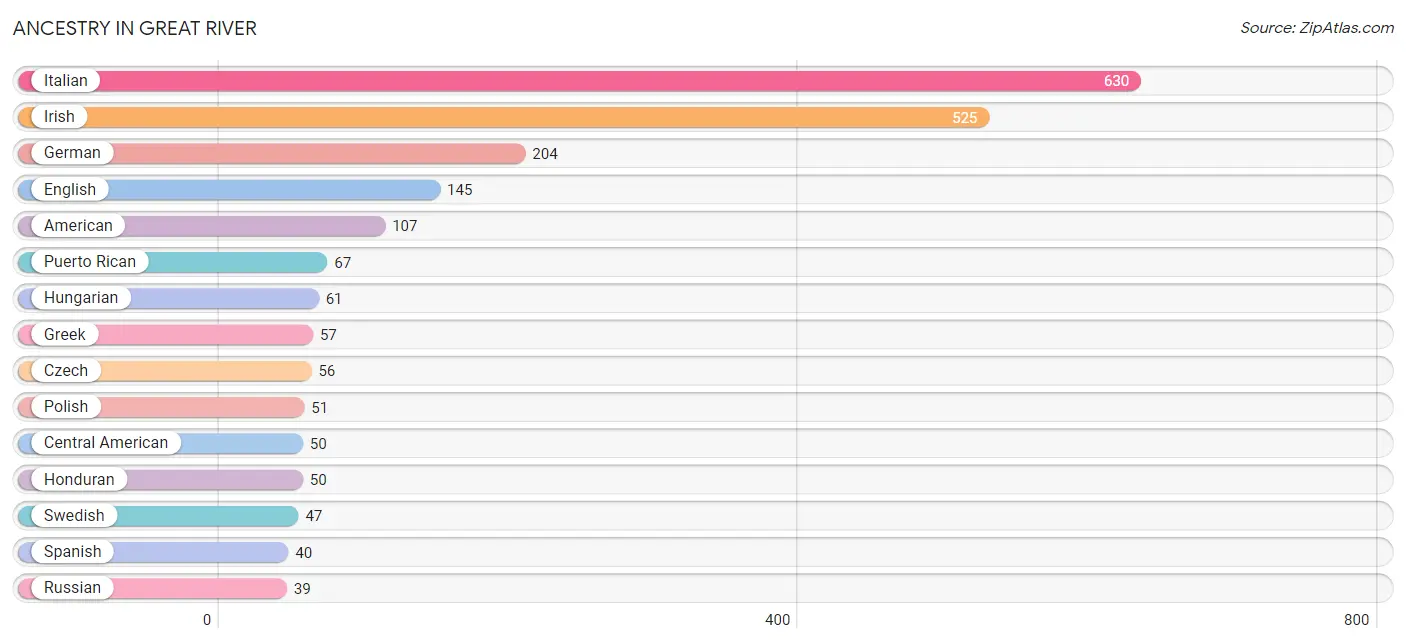
| Ancestry | # Population | % Population |
| American | 107 | 5.4% |
| Arab | 17 | 0.9% |
| Austrian | 6 | 0.3% |
| Burmese | 20 | 1.0% |
| Central American | 50 | 2.5% |
| Colombian | 4 | 0.2% |
| Cuban | 13 | 0.6% |
| Czech | 56 | 2.8% |
| Danish | 5 | 0.3% |
| Dominican | 7 | 0.4% |
| Eastern European | 16 | 0.8% |
| English | 145 | 7.3% |
| European | 19 | 0.9% |
| Finnish | 10 | 0.5% |
| French | 36 | 1.8% |
| French Canadian | 7 | 0.4% |
| German | 204 | 10.2% |
| Greek | 57 | 2.9% |
| Honduran | 50 | 2.5% |
| Hungarian | 61 | 3.1% |
| Irish | 525 | 26.4% |
| Italian | 630 | 31.6% |
| Korean | 37 | 1.9% |
| Norwegian | 14 | 0.7% |
| Polish | 51 | 2.6% |
| Puerto Rican | 67 | 3.4% |
| Russian | 39 | 2.0% |
| Scandinavian | 9 | 0.4% |
| Scottish | 20 | 1.0% |
| South American | 4 | 0.2% |
| Spanish | 40 | 2.0% |
| Swedish | 47 | 2.4% |
| Syrian | 17 | 0.9% |
| Ukrainian | 7 | 0.4% |
| Yugoslavian | 6 | 0.3% | View All 35 Rows |
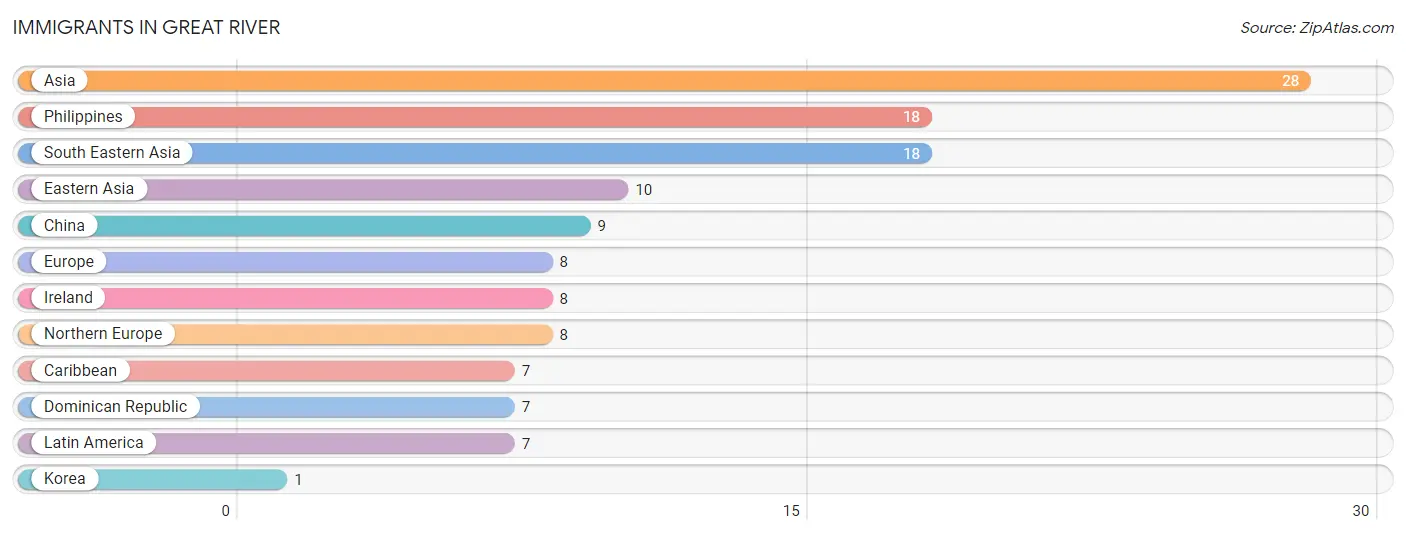
Immigrants in Great River
The most numerous immigrant groups reported in Great River came from Asia (28 | 1.4%), Philippines (18 | 0.9%), South Eastern Asia (18 | 0.9%), Eastern Asia (10 | 0.5%), and China (9 | 0.4%), together accounting for 4.2% of all Great River residents.
| Immigration Origin | # Population | % Population |
| Asia | 28 | 1.4% |
| Caribbean | 7 | 0.4% |
| China | 9 | 0.4% |
| Dominican Republic | 7 | 0.4% |
| Eastern Asia | 10 | 0.5% |
| Europe | 8 | 0.4% |
| Ireland | 8 | 0.4% |
| Korea | 1 | 0.1% |
| Latin America | 7 | 0.4% |
| Northern Europe | 8 | 0.4% |
| Philippines | 18 | 0.9% |
| South Eastern Asia | 18 | 0.9% | View All 12 Rows |
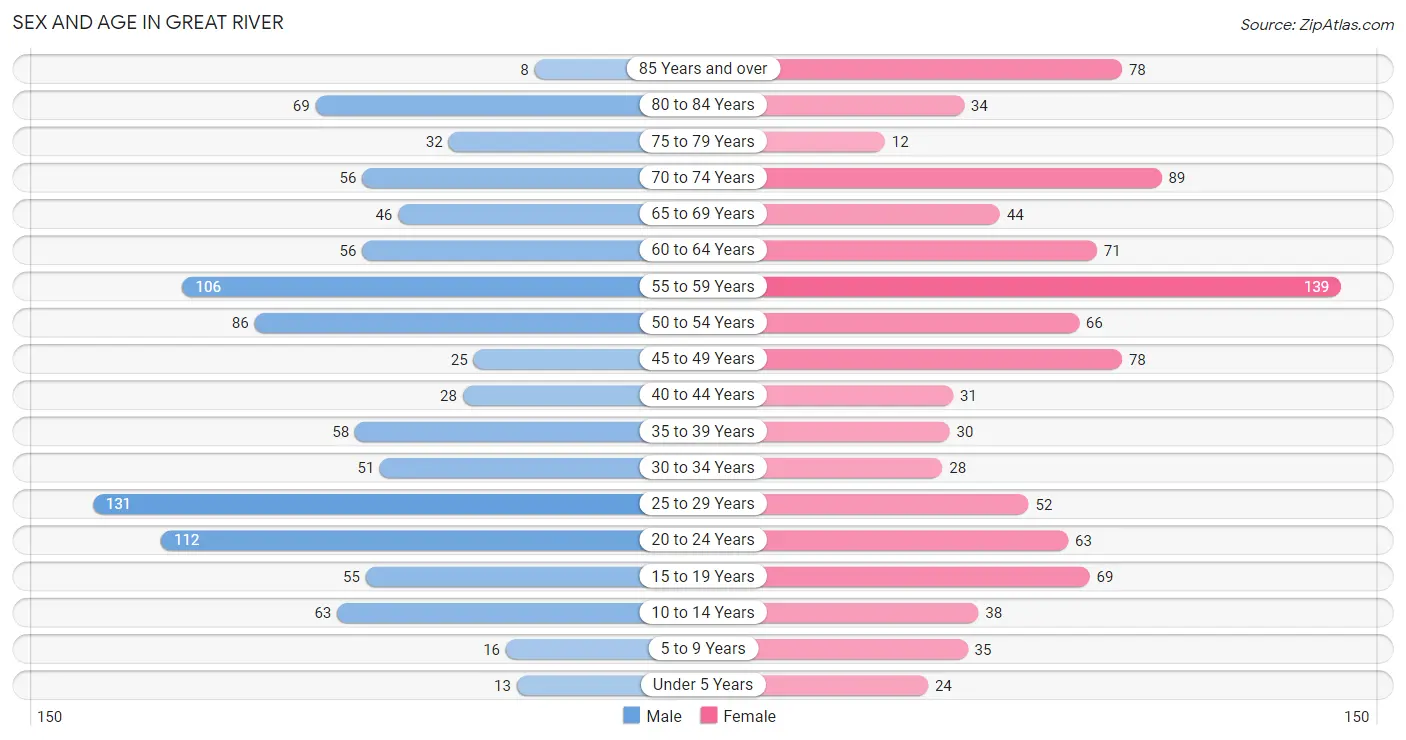
Sex and Age in Great River
Sex and Age in Great River
The most populous age groups in Great River are 25 to 29 Years (131 | 13.0%) for men and 55 to 59 Years (139 | 14.2%) for women.
| Age Bracket | Male | Female |
| Under 5 Years | 13 (1.3%) | 24 (2.5%) |
| 5 to 9 Years | 16 (1.6%) | 35 (3.6%) |
| 10 to 14 Years | 63 (6.2%) | 38 (3.9%) |
| 15 to 19 Years | 55 (5.4%) | 69 (7.0%) |
| 20 to 24 Years | 112 (11.1%) | 63 (6.4%) |
| 25 to 29 Years | 131 (13.0%) | 52 (5.3%) |
| 30 to 34 Years | 51 (5.0%) | 28 (2.9%) |
| 35 to 39 Years | 58 (5.7%) | 30 (3.1%) |
| 40 to 44 Years | 28 (2.8%) | 31 (3.2%) |
| 45 to 49 Years | 25 (2.5%) | 78 (8.0%) |
| 50 to 54 Years | 86 (8.5%) | 66 (6.7%) |
| 55 to 59 Years | 106 (10.5%) | 139 (14.2%) |
| 60 to 64 Years | 56 (5.5%) | 71 (7.2%) |
| 65 to 69 Years | 46 (4.5%) | 44 (4.5%) |
| 70 to 74 Years | 56 (5.5%) | 89 (9.1%) |
| 75 to 79 Years | 32 (3.2%) | 12 (1.2%) |
| 80 to 84 Years | 69 (6.8%) | 34 (3.5%) |
| 85 Years and over | 8 (0.8%) | 78 (8.0%) |
| Total | 1,011 (100.0%) | 981 (100.0%) |
Families and Households in Great River
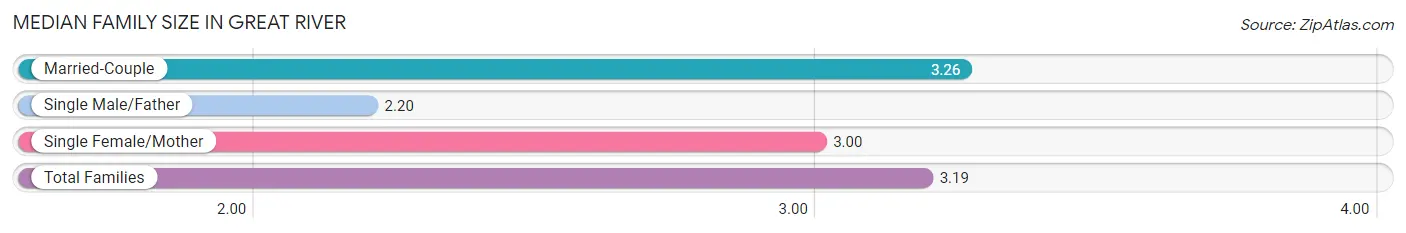
Median Family Size in Great River
The median family size in Great River is 3.19 persons per family, with married-couple families (412 | 78.5%) accounting for the largest median family size of 3.26 persons per family. On the other hand, single male/father families (10 | 1.9%) represent the smallest median family size with 2.20 persons per family.
| Family Type | # Families | Family Size |
| Married-Couple | 412 (78.5%) | 3.26 |
| Single Male/Father | 10 (1.9%) | 2.20 |
| Single Female/Mother | 103 (19.6%) | 3.00 |
| Total Families | 525 (100.0%) | 3.19 |
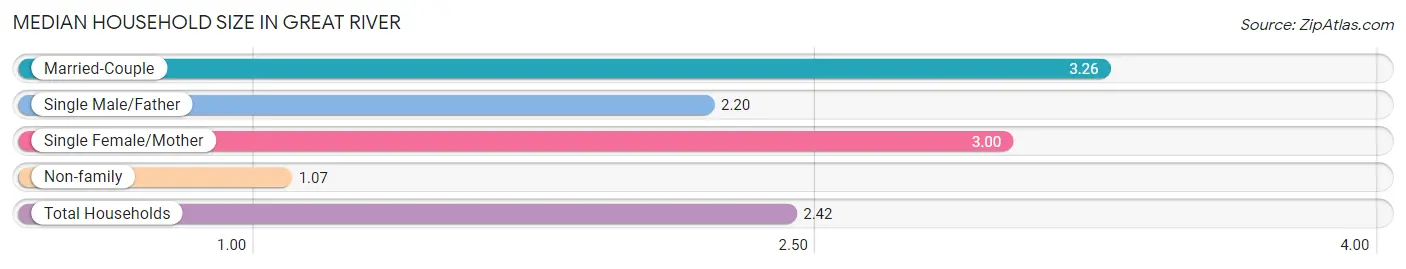
Median Household Size in Great River
The median household size in Great River is 2.42 persons per household, with married-couple households (412 | 50.1%) accounting for the largest median household size of 3.26 persons per household. non-family households (298 | 36.2%) represent the smallest median household size with 1.07 persons per household.
| Household Type | # Households | Household Size |
| Married-Couple | 412 (50.1%) | 3.26 |
| Single Male/Father | 10 (1.2%) | 2.20 |
| Single Female/Mother | 103 (12.5%) | 3.00 |
| Non-family | 298 (36.2%) | 1.07 |
| Total Households | 823 (100.0%) | 2.42 |
Household Size by Marriage Status in Great River
Out of a total of 823 households in Great River, 525 (63.8%) are family households, while 298 (36.2%) are nonfamily households. The most numerous type of family households are 2-person households, comprising 235, and the most common type of nonfamily households are 1-person households, comprising 277.

| Household Size | Family Households | Nonfamily Households |
| 1-Person Households | - | 277 (33.7%) |
| 2-Person Households | 235 (28.5%) | 21 (2.5%) |
| 3-Person Households | 120 (14.6%) | 0 (0.0%) |
| 4-Person Households | 110 (13.4%) | 0 (0.0%) |
| 5-Person Households | 55 (6.7%) | 0 (0.0%) |
| 6-Person Households | 0 (0.0%) | 0 (0.0%) |
| 7+ Person Households | 5 (0.6%) | 0 (0.0%) |
| Total | 525 (63.8%) | 298 (36.2%) |
Female Fertility in Great River
Fertility by Age in Great River
Average fertility rate in Great River is 23.0 births per 1,000 women. Women in the age bracket of 35 to 50 years have the highest fertility rate with 58.0 births per 1,000 women. Women in the age bracket of 35 to 50 years acount for 100.0% of all women with births.
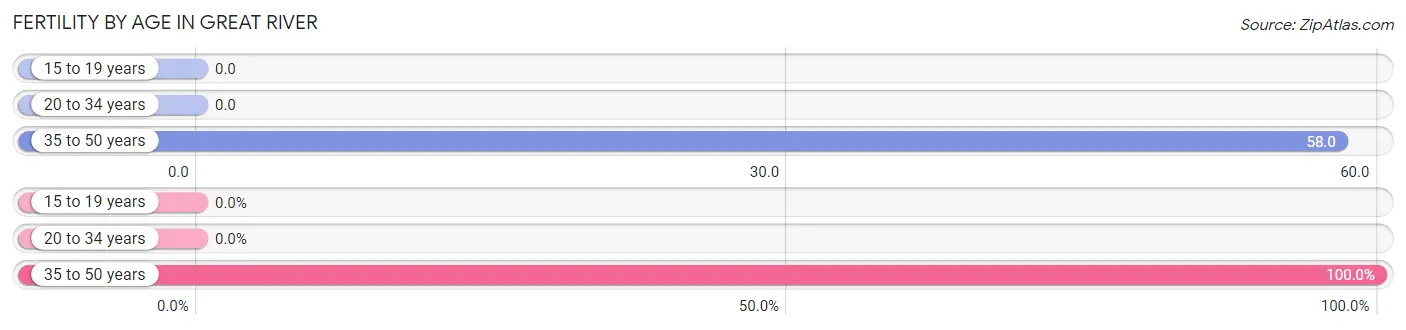
| Age Bracket | Women with Births | Births / 1,000 Women |
| 15 to 19 years | 0 (0.0%) | 0.0 |
| 20 to 34 years | 0 (0.0%) | 0.0 |
| 35 to 50 years | 8 (100.0%) | 58.0 |
| Total | 8 (100.0%) | 23.0 |
Fertility by Age by Marriage Status in Great River
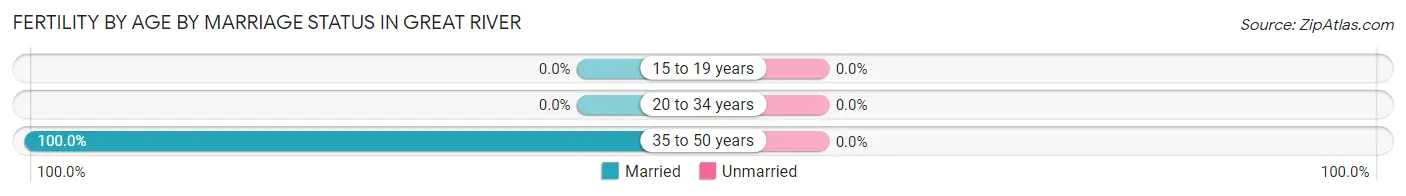
| Age Bracket | Married | Unmarried |
| 15 to 19 years | 0 (0.0%) | 0 (0.0%) |
| 20 to 34 years | 0 (0.0%) | 0 (0.0%) |
| 35 to 50 years | 8 (100.0%) | 0 (0.0%) |
| Total | 8 (100.0%) | 0 (0.0%) |
Fertility by Education in Great River
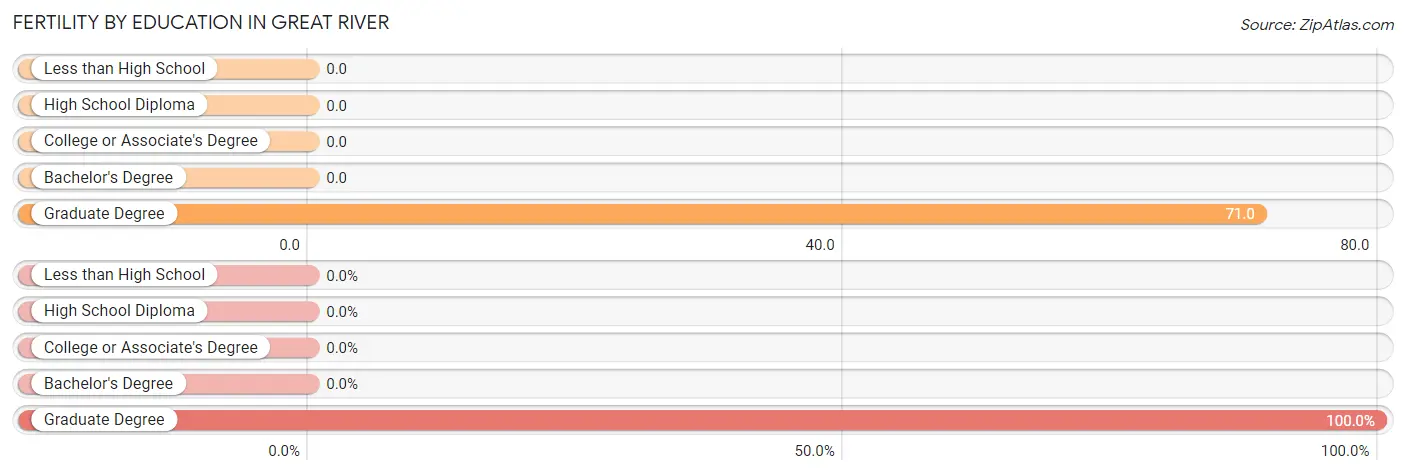
| Educational Attainment | Women with Births | Births / 1,000 Women |
| Less than High School | 0 (0.0%) | 0.0 |
| High School Diploma | 0 (0.0%) | 0.0 |
| College or Associate's Degree | 0 (0.0%) | 0.0 |
| Bachelor's Degree | 0 (0.0%) | 0.0 |
| Graduate Degree | 8 (100.0%) | 71.0 |
| Total | 8 (100.0%) | 23.0 |
Fertility by Education by Marriage Status in Great River
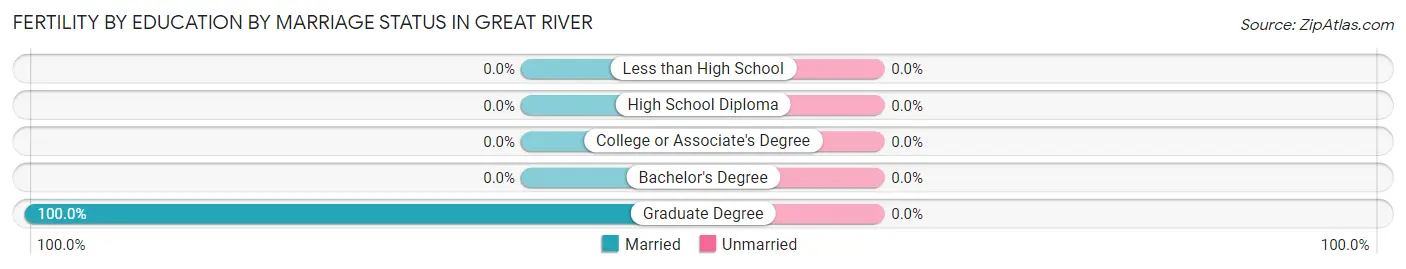
| Educational Attainment | Married | Unmarried |
| Less than High School | 0 (0.0%) | 0 (0.0%) |
| High School Diploma | 0 (0.0%) | 0 (0.0%) |
| College or Associate's Degree | 0 (0.0%) | 0 (0.0%) |
| Bachelor's Degree | 0 (0.0%) | 0 (0.0%) |
| Graduate Degree | 8 (100.0%) | 0 (0.0%) |
| Total | 8 (100.0%) | 0 (0.0%) |
Employment Characteristics in Great River
Employment by Class of Employer in Great River
Among the 1,116 employed individuals in Great River, private company employees (594 | 53.2%), local government employees (193 | 17.3%), and not-for-profit organizations (107 | 9.6%) make up the most common classes of employment.
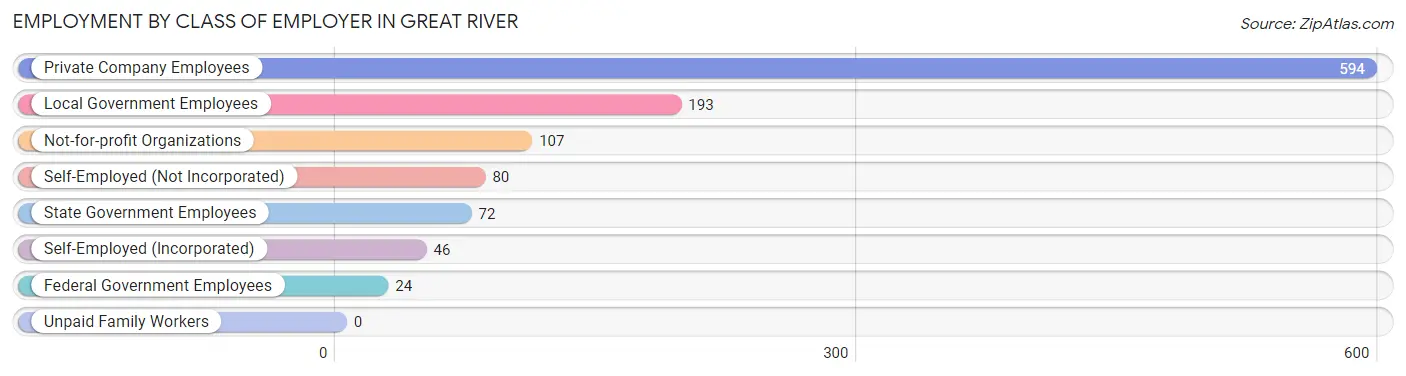
| Employer Class | # Employees | % Employees |
| Private Company Employees | 594 | 53.2% |
| Self-Employed (Incorporated) | 46 | 4.1% |
| Self-Employed (Not Incorporated) | 80 | 7.2% |
| Not-for-profit Organizations | 107 | 9.6% |
| Local Government Employees | 193 | 17.3% |
| State Government Employees | 72 | 6.5% |
| Federal Government Employees | 24 | 2.1% |
| Unpaid Family Workers | 0 | 0.0% |
| Total | 1,116 | 100.0% |
Employment Status by Age in Great River
According to the labor force statistics for Great River, out of the total population over 16 years of age (1,788), 69.0% or 1,234 individuals are in the labor force, with 3.2% or 39 of them unemployed. The age group with the highest labor force participation rate is 25 to 29 years, with 100.0% or 183 individuals in the labor force. Within the labor force, the 55 to 59 years age range has the highest percentage of unemployed individuals, with 10.9% or 26 of them being unemployed.
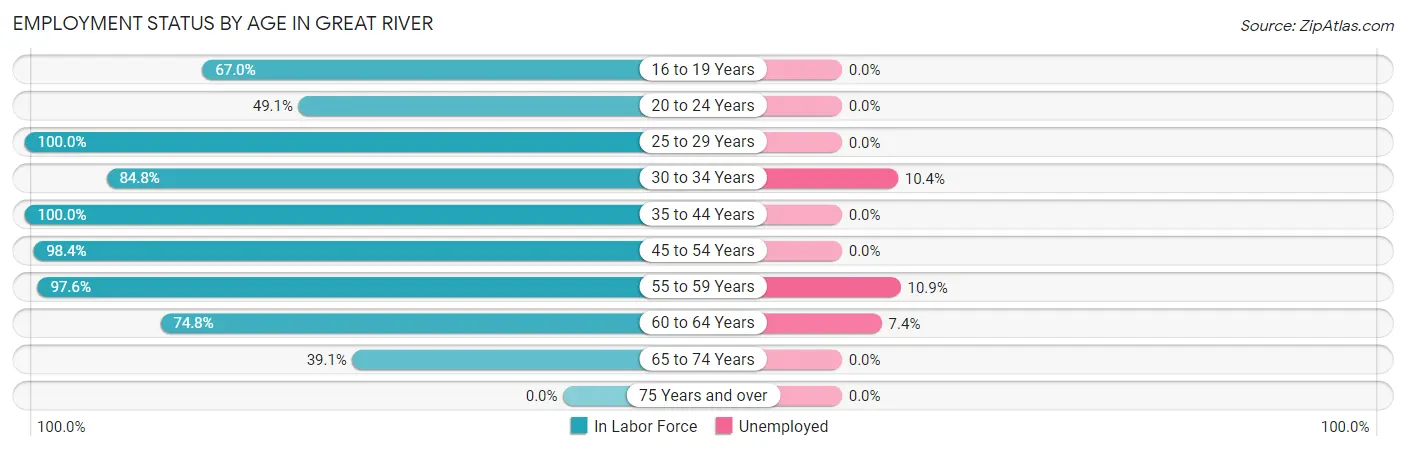
| Age Bracket | In Labor Force | Unemployed |
| 16 to 19 Years | 73 (67.0%) | 0 (0.0%) |
| 20 to 24 Years | 86 (49.1%) | 0 (0.0%) |
| 25 to 29 Years | 183 (100.0%) | 0 (0.0%) |
| 30 to 34 Years | 67 (84.8%) | 7 (10.4%) |
| 35 to 44 Years | 147 (100.0%) | 0 (0.0%) |
| 45 to 54 Years | 251 (98.4%) | 0 (0.0%) |
| 55 to 59 Years | 239 (97.6%) | 26 (10.9%) |
| 60 to 64 Years | 95 (74.8%) | 7 (7.4%) |
| 65 to 74 Years | 92 (39.1%) | 0 (0.0%) |
| 75 Years and over | 0 (0.0%) | 0 (0.0%) |
| Total | 1,234 (69.0%) | 39 (3.2%) |
Employment Status by Educational Attainment in Great River
According to labor force statistics for Great River, 94.8% of individuals (982) out of the total population between 25 and 64 years of age (1,036) are in the labor force, with 4.1% or 40 of them being unemployed. The group with the highest labor force participation rate are those with the educational attainment of high school diploma, with 100.0% or 134 individuals in the labor force. Within the labor force, individuals with college / associate degree education have the highest percentage of unemployment, with 16.7% or 29 of them being unemployed.
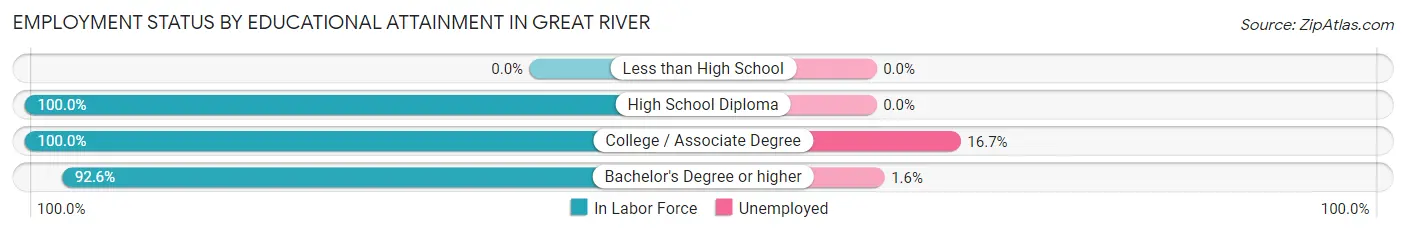
| Educational Attainment | In Labor Force | Unemployed |
| Less than High School | 0 (0.0%) | 0 (0.0%) |
| High School Diploma | 134 (100.0%) | 0 (0.0%) |
| College / Associate Degree | 174 (100.0%) | 29 (16.7%) |
| Bachelor's Degree or higher | 674 (92.6%) | 12 (1.6%) |
| Total | 982 (94.8%) | 42 (4.1%) |
Employment Occupations by Sex in Great River
Management, Business, Science and Arts Occupations
The most common Management, Business, Science and Arts occupations in Great River are Community & Social Service (322 | 27.0%), Education Instruction & Library (235 | 19.7%), Management (179 | 15.0%), Business & Financial (131 | 11.0%), and Health Diagnosing & Treating (60 | 5.0%).
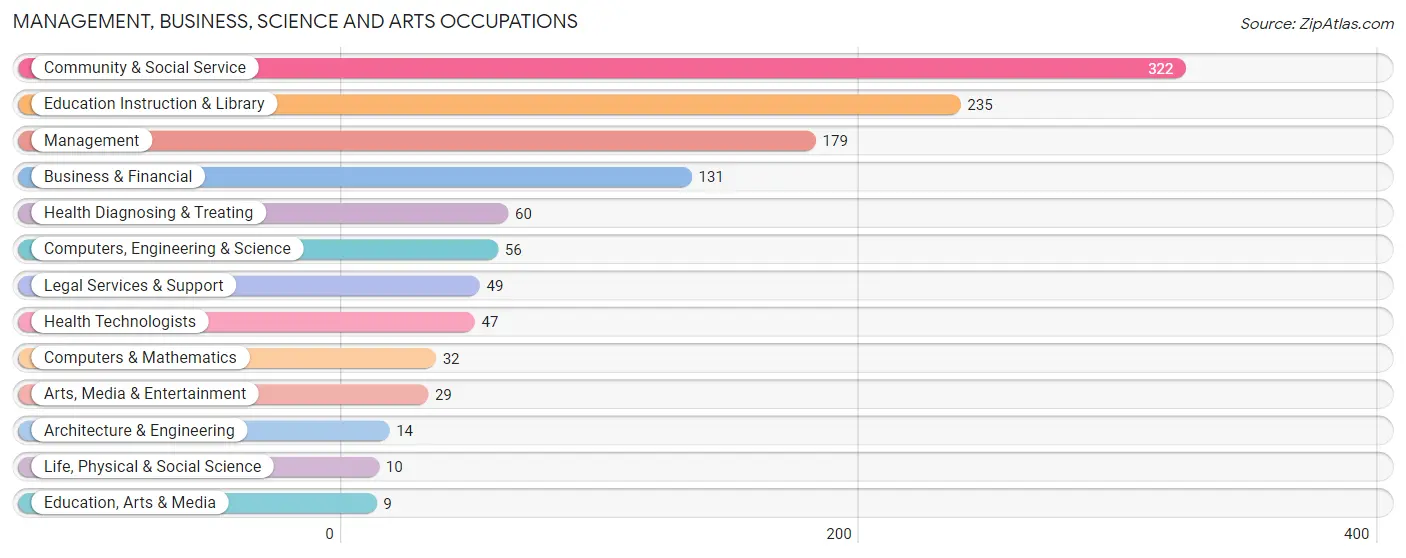
Management, Business, Science and Arts Occupations by Sex
Within the Management, Business, Science and Arts occupations in Great River, the most male-oriented occupations are Computers, Engineering & Science (100.0%), Computers & Mathematics (100.0%), and Architecture & Engineering (100.0%), while the most female-oriented occupations are Education, Arts & Media (100.0%), Education Instruction & Library (88.1%), and Arts, Media & Entertainment (82.8%).
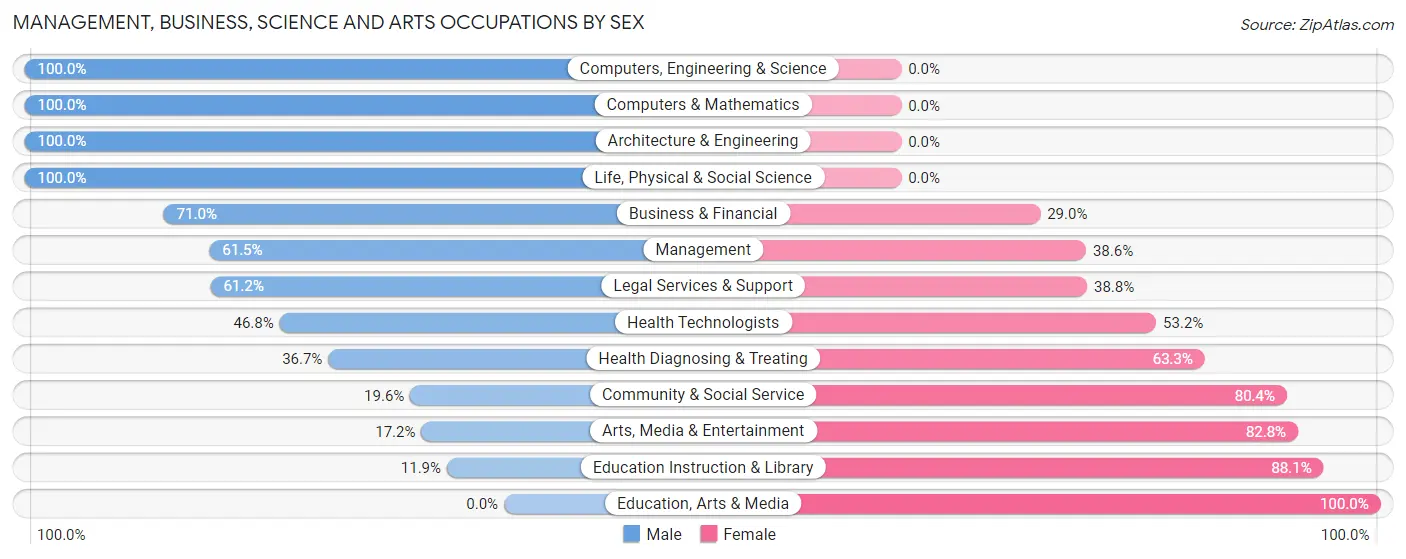
| Occupation | Male | Female |
| Management | 110 (61.5%) | 69 (38.6%) |
| Business & Financial | 93 (71.0%) | 38 (29.0%) |
| Computers, Engineering & Science | 56 (100.0%) | 0 (0.0%) |
| Computers & Mathematics | 32 (100.0%) | 0 (0.0%) |
| Architecture & Engineering | 14 (100.0%) | 0 (0.0%) |
| Life, Physical & Social Science | 10 (100.0%) | 0 (0.0%) |
| Community & Social Service | 63 (19.6%) | 259 (80.4%) |
| Education, Arts & Media | 0 (0.0%) | 9 (100.0%) |
| Legal Services & Support | 30 (61.2%) | 19 (38.8%) |
| Education Instruction & Library | 28 (11.9%) | 207 (88.1%) |
| Arts, Media & Entertainment | 5 (17.2%) | 24 (82.8%) |
| Health Diagnosing & Treating | 22 (36.7%) | 38 (63.3%) |
| Health Technologists | 22 (46.8%) | 25 (53.2%) |
| Total (Category) | 344 (46.0%) | 404 (54.0%) |
| Total (Overall) | 623 (52.2%) | 570 (47.8%) |
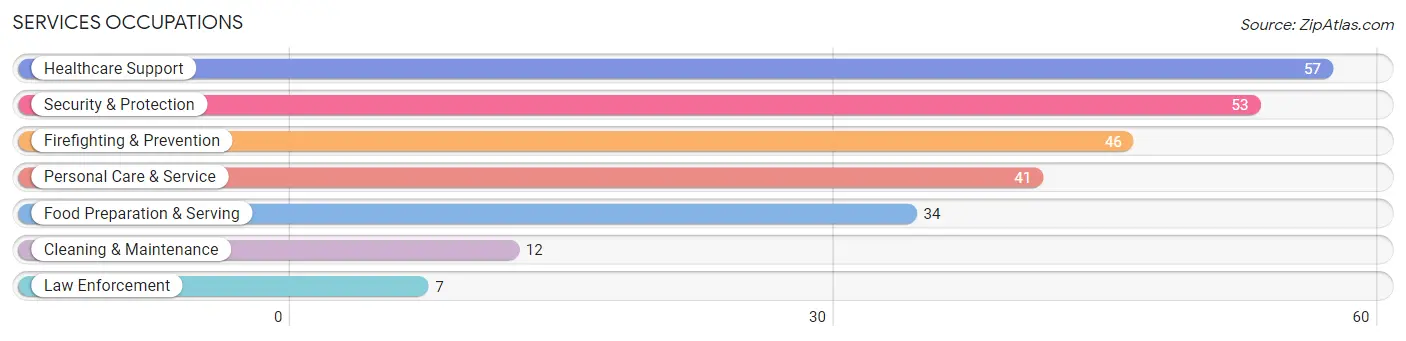
Services Occupations
The most common Services occupations in Great River are Healthcare Support (57 | 4.8%), Security & Protection (53 | 4.4%), Firefighting & Prevention (46 | 3.9%), Personal Care & Service (41 | 3.4%), and Food Preparation & Serving (34 | 2.9%).
Services Occupations by Sex
Within the Services occupations in Great River, the most male-oriented occupations are Security & Protection (100.0%), Firefighting & Prevention (100.0%), and Law Enforcement (100.0%), while the most female-oriented occupations are Cleaning & Maintenance (100.0%), Personal Care & Service (100.0%), and Healthcare Support (54.4%).
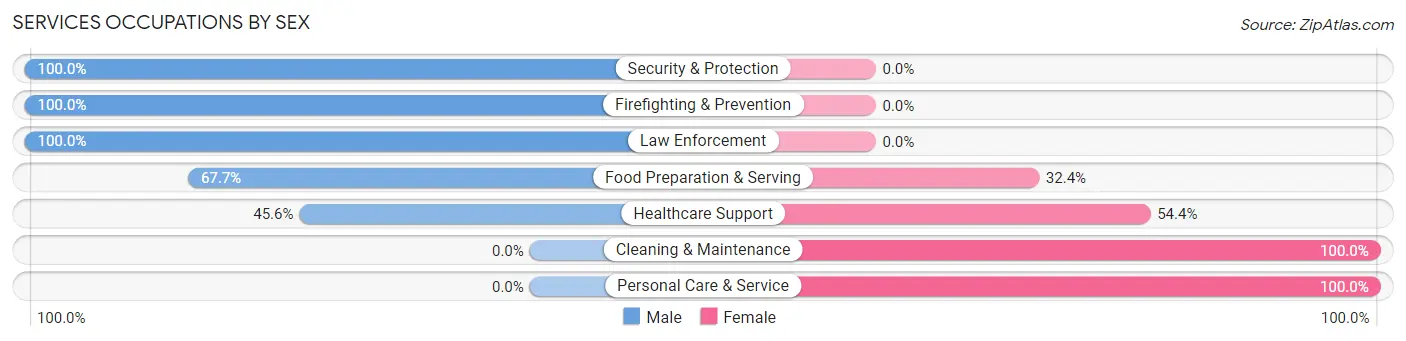
| Occupation | Male | Female |
| Healthcare Support | 26 (45.6%) | 31 (54.4%) |
| Security & Protection | 53 (100.0%) | 0 (0.0%) |
| Firefighting & Prevention | 46 (100.0%) | 0 (0.0%) |
| Law Enforcement | 7 (100.0%) | 0 (0.0%) |
| Food Preparation & Serving | 23 (67.6%) | 11 (32.4%) |
| Cleaning & Maintenance | 0 (0.0%) | 12 (100.0%) |
| Personal Care & Service | 0 (0.0%) | 41 (100.0%) |
| Total (Category) | 102 (51.8%) | 95 (48.2%) |
| Total (Overall) | 623 (52.2%) | 570 (47.8%) |
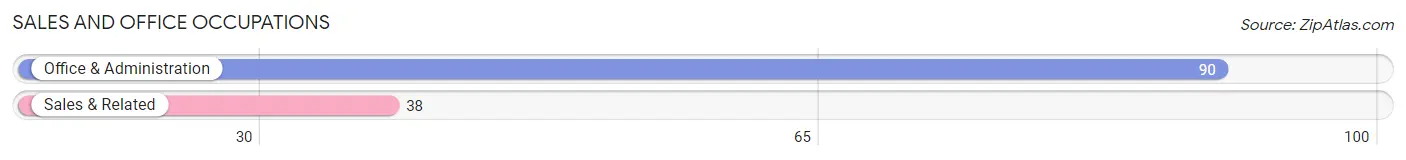
Sales and Office Occupations
The most common Sales and Office occupations in Great River are Office & Administration (90 | 7.5%), and Sales & Related (38 | 3.2%).
Sales and Office Occupations by Sex
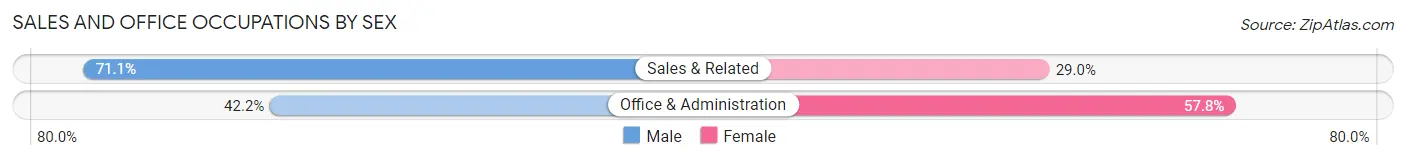
| Occupation | Male | Female |
| Sales & Related | 27 (71.1%) | 11 (28.9%) |
| Office & Administration | 38 (42.2%) | 52 (57.8%) |
| Total (Category) | 65 (50.8%) | 63 (49.2%) |
| Total (Overall) | 623 (52.2%) | 570 (47.8%) |
Natural Resources, Construction and Maintenance Occupations
The most common Natural Resources, Construction and Maintenance occupations in Great River are Installation, Maintenance & Repair (33 | 2.8%), and Construction & Extraction (26 | 2.2%).
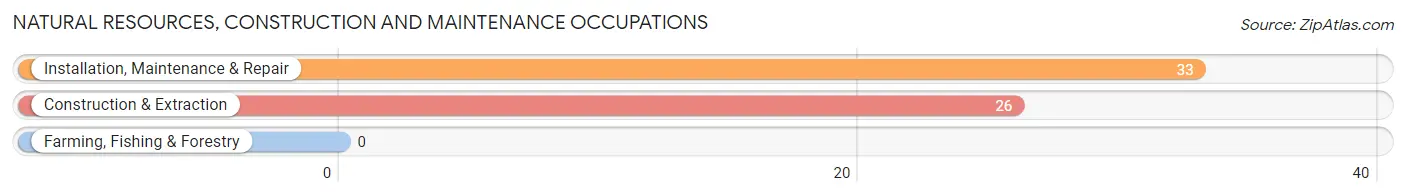
Natural Resources, Construction and Maintenance Occupations by Sex
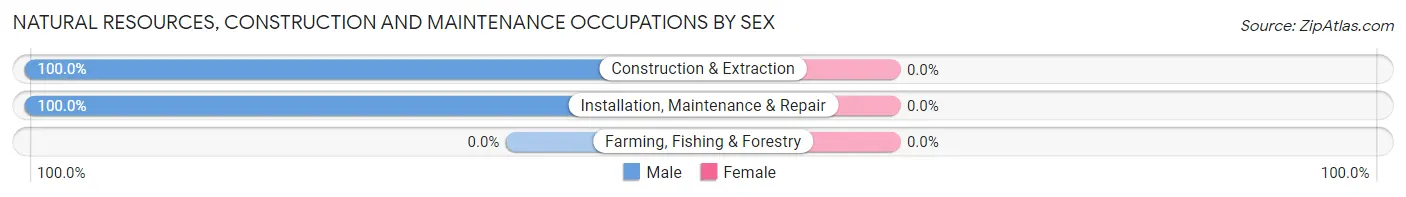
| Occupation | Male | Female |
| Farming, Fishing & Forestry | 0 (0.0%) | 0 (0.0%) |
| Construction & Extraction | 26 (100.0%) | 0 (0.0%) |
| Installation, Maintenance & Repair | 33 (100.0%) | 0 (0.0%) |
| Total (Category) | 59 (100.0%) | 0 (0.0%) |
| Total (Overall) | 623 (52.2%) | 570 (47.8%) |
Production, Transportation and Moving Occupations
The most common Production, Transportation and Moving occupations in Great River are Production (31 | 2.6%), Material Moving (22 | 1.8%), and Transportation (8 | 0.7%).
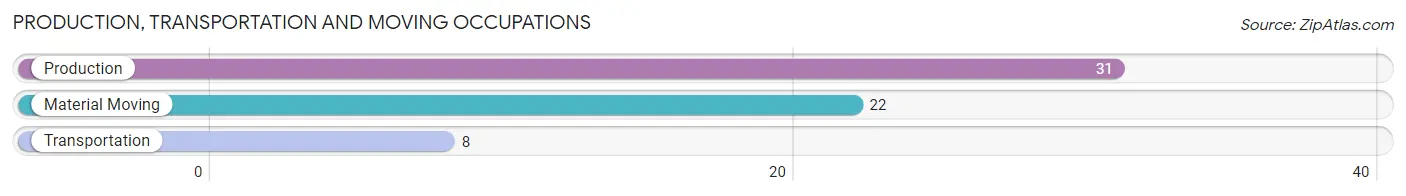
Production, Transportation and Moving Occupations by Sex
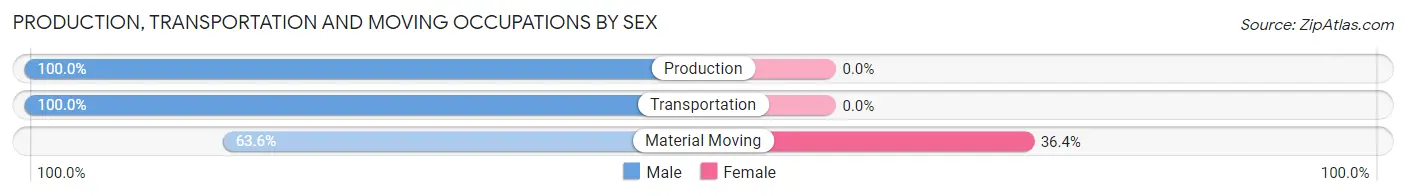
| Occupation | Male | Female |
| Production | 31 (100.0%) | 0 (0.0%) |
| Transportation | 8 (100.0%) | 0 (0.0%) |
| Material Moving | 14 (63.6%) | 8 (36.4%) |
| Total (Category) | 53 (86.9%) | 8 (13.1%) |
| Total (Overall) | 623 (52.2%) | 570 (47.8%) |
Employment Industries by Sex in Great River
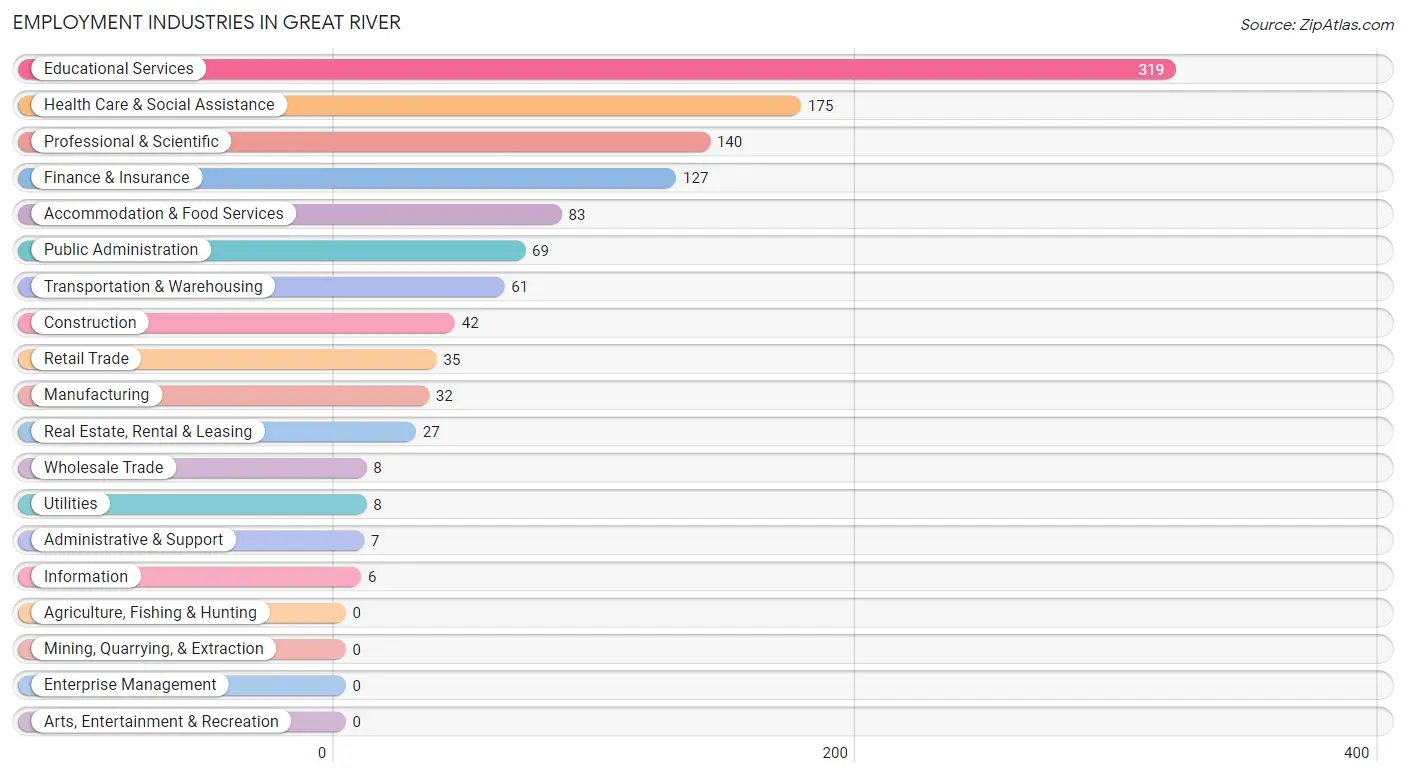
Employment Industries in Great River
The major employment industries in Great River include Educational Services (319 | 26.7%), Health Care & Social Assistance (175 | 14.7%), Professional & Scientific (140 | 11.7%), Finance & Insurance (127 | 10.6%), and Accommodation & Food Services (83 | 7.0%).
Employment Industries by Sex in Great River
The Great River industries that see more men than women are Construction (100.0%), Wholesale Trade (100.0%), and Utilities (100.0%), whereas the industries that tend to have a higher number of women are Administrative & Support (100.0%), Accommodation & Food Services (72.3%), and Educational Services (69.9%).
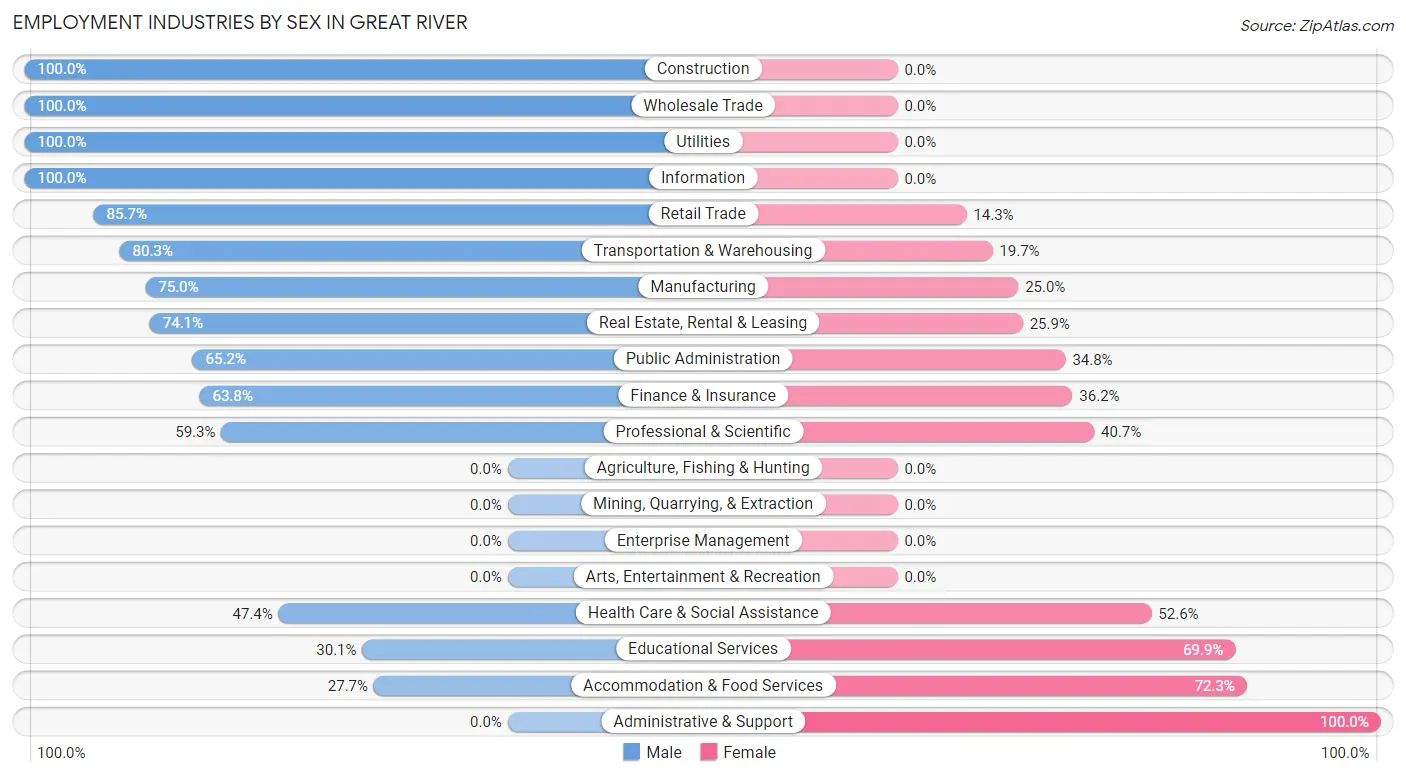
| Industry | Male | Female |
| Agriculture, Fishing & Hunting | 0 (0.0%) | 0 (0.0%) |
| Mining, Quarrying, & Extraction | 0 (0.0%) | 0 (0.0%) |
| Construction | 42 (100.0%) | 0 (0.0%) |
| Manufacturing | 24 (75.0%) | 8 (25.0%) |
| Wholesale Trade | 8 (100.0%) | 0 (0.0%) |
| Retail Trade | 30 (85.7%) | 5 (14.3%) |
| Transportation & Warehousing | 49 (80.3%) | 12 (19.7%) |
| Utilities | 8 (100.0%) | 0 (0.0%) |
| Information | 6 (100.0%) | 0 (0.0%) |
| Finance & Insurance | 81 (63.8%) | 46 (36.2%) |
| Real Estate, Rental & Leasing | 20 (74.1%) | 7 (25.9%) |
| Professional & Scientific | 83 (59.3%) | 57 (40.7%) |
| Enterprise Management | 0 (0.0%) | 0 (0.0%) |
| Administrative & Support | 0 (0.0%) | 7 (100.0%) |
| Educational Services | 96 (30.1%) | 223 (69.9%) |
| Health Care & Social Assistance | 83 (47.4%) | 92 (52.6%) |
| Arts, Entertainment & Recreation | 0 (0.0%) | 0 (0.0%) |
| Accommodation & Food Services | 23 (27.7%) | 60 (72.3%) |
| Public Administration | 45 (65.2%) | 24 (34.8%) |
| Total | 623 (52.2%) | 570 (47.8%) |
Education in Great River
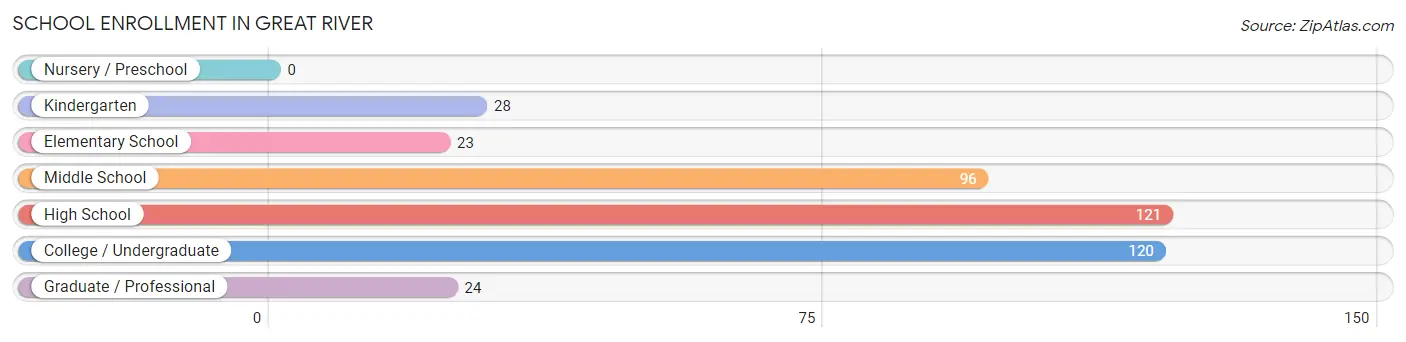
School Enrollment in Great River
The most common levels of schooling among the 412 students in Great River are high school (121 | 29.4%), college / undergraduate (120 | 29.1%), and middle school (96 | 23.3%).
| School Level | # Students | % Students |
| Nursery / Preschool | 0 | 0.0% |
| Kindergarten | 28 | 6.8% |
| Elementary School | 23 | 5.6% |
| Middle School | 96 | 23.3% |
| High School | 121 | 29.4% |
| College / Undergraduate | 120 | 29.1% |
| Graduate / Professional | 24 | 5.8% |
| Total | 412 | 100.0% |
School Enrollment by Age by Funding Source in Great River
Out of a total of 412 students who are enrolled in schools in Great River, 118 (28.6%) attend a private institution, while the remaining 294 (71.4%) are enrolled in public schools. The age group of 35 years and over has the highest likelihood of being enrolled in private schools, with 4 (100.0% in the age bracket) enrolled. Conversely, the age group of 15 to 17 year olds has the lowest likelihood of being enrolled in a private school, with 83 (100.0% in the age bracket) attending a public institution.
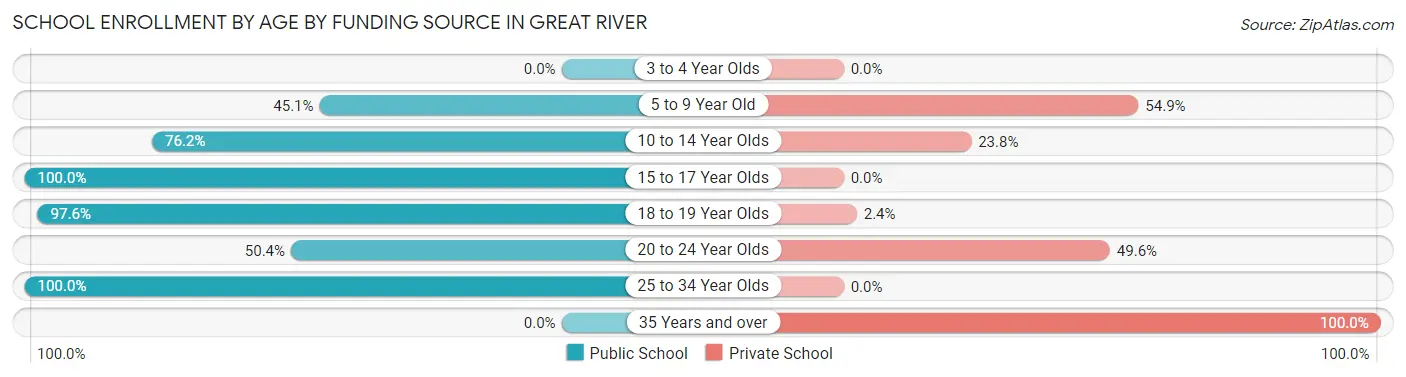
| Age Bracket | Public School | Private School |
| 3 to 4 Year Olds | 0 (0.0%) | 0 (0.0%) |
| 5 to 9 Year Old | 23 (45.1%) | 28 (54.9%) |
| 10 to 14 Year Olds | 77 (76.2%) | 24 (23.8%) |
| 15 to 17 Year Olds | 83 (100.0%) | 0 (0.0%) |
| 18 to 19 Year Olds | 40 (97.6%) | 1 (2.4%) |
| 20 to 24 Year Olds | 62 (50.4%) | 61 (49.6%) |
| 25 to 34 Year Olds | 9 (100.0%) | 0 (0.0%) |
| 35 Years and over | 0 (0.0%) | 4 (100.0%) |
| Total | 294 (71.4%) | 118 (28.6%) |
Educational Attainment by Field of Study in Great River
Business (220 | 22.6%), education (178 | 18.3%), engineering (84 | 8.6%), social sciences (77 | 7.9%), and science & technology (67 | 6.9%) are the most common fields of study among 974 individuals in Great River who have obtained a bachelor's degree or higher.
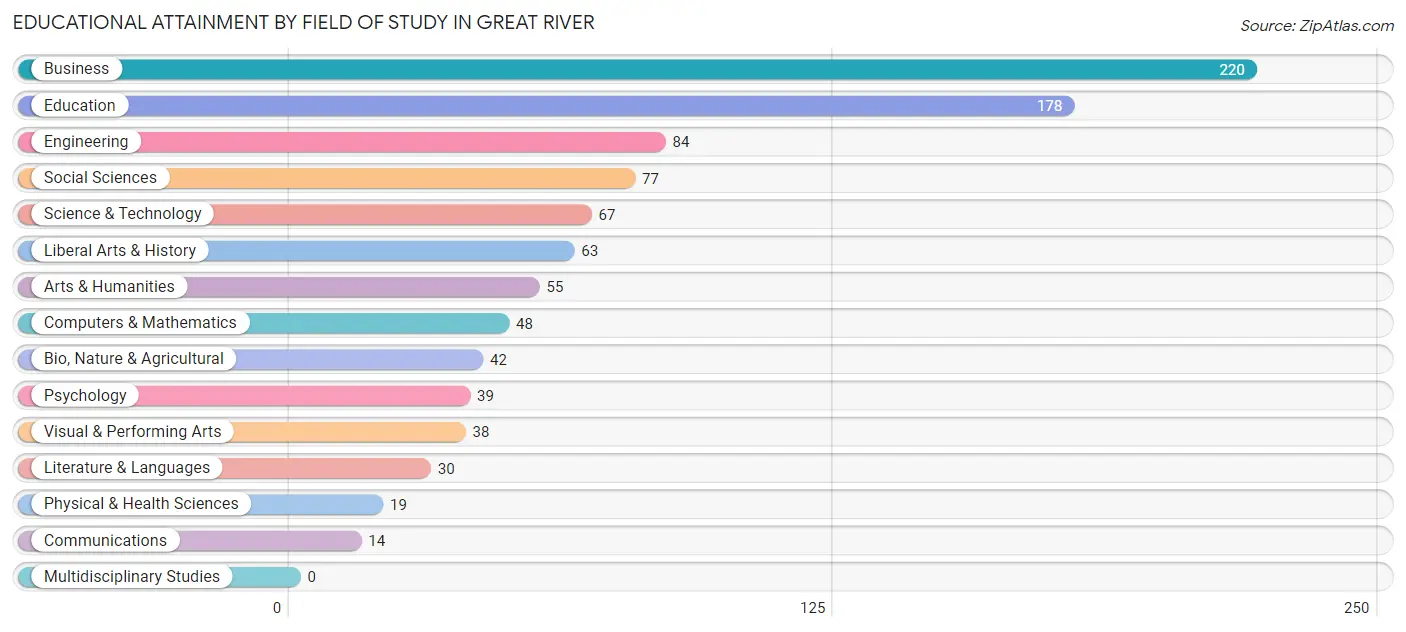
| Field of Study | # Graduates | % Graduates |
| Computers & Mathematics | 48 | 4.9% |
| Bio, Nature & Agricultural | 42 | 4.3% |
| Physical & Health Sciences | 19 | 1.9% |
| Psychology | 39 | 4.0% |
| Social Sciences | 77 | 7.9% |
| Engineering | 84 | 8.6% |
| Multidisciplinary Studies | 0 | 0.0% |
| Science & Technology | 67 | 6.9% |
| Business | 220 | 22.6% |
| Education | 178 | 18.3% |
| Literature & Languages | 30 | 3.1% |
| Liberal Arts & History | 63 | 6.5% |
| Visual & Performing Arts | 38 | 3.9% |
| Communications | 14 | 1.4% |
| Arts & Humanities | 55 | 5.7% |
| Total | 974 | 100.0% |
Transportation & Commute in Great River
Vehicle Availability by Sex in Great River
The most prevalent vehicle ownership categories in Great River are males with 3 vehicles (216, accounting for 35.6%) and females with 3 vehicles (134, making up 42.3%).
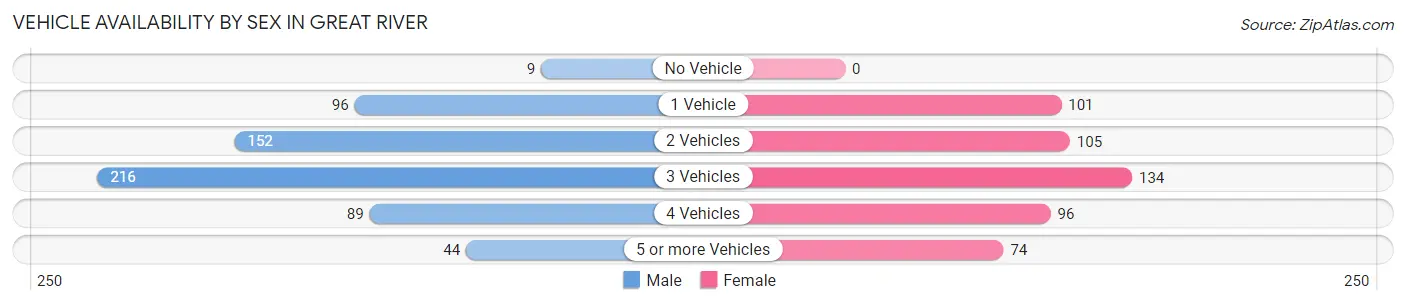
| Vehicles Available | Male | Female |
| No Vehicle | 9 (1.5%) | 0 (0.0%) |
| 1 Vehicle | 96 (15.8%) | 101 (19.8%) |
| 2 Vehicles | 152 (25.1%) | 105 (20.6%) |
| 3 Vehicles | 216 (35.6%) | 134 (26.3%) |
| 4 Vehicles | 89 (14.7%) | 96 (18.8%) |
| 5 or more Vehicles | 44 (7.3%) | 74 (14.5%) |
| Total | 606 (100.0%) | 510 (100.0%) |
Commute Time in Great River
The most frequently occuring commute durations in Great River are 30 to 34 minutes (184 commuters, 18.1%), 20 to 24 minutes (165 commuters, 16.2%), and 10 to 14 minutes (160 commuters, 15.7%).
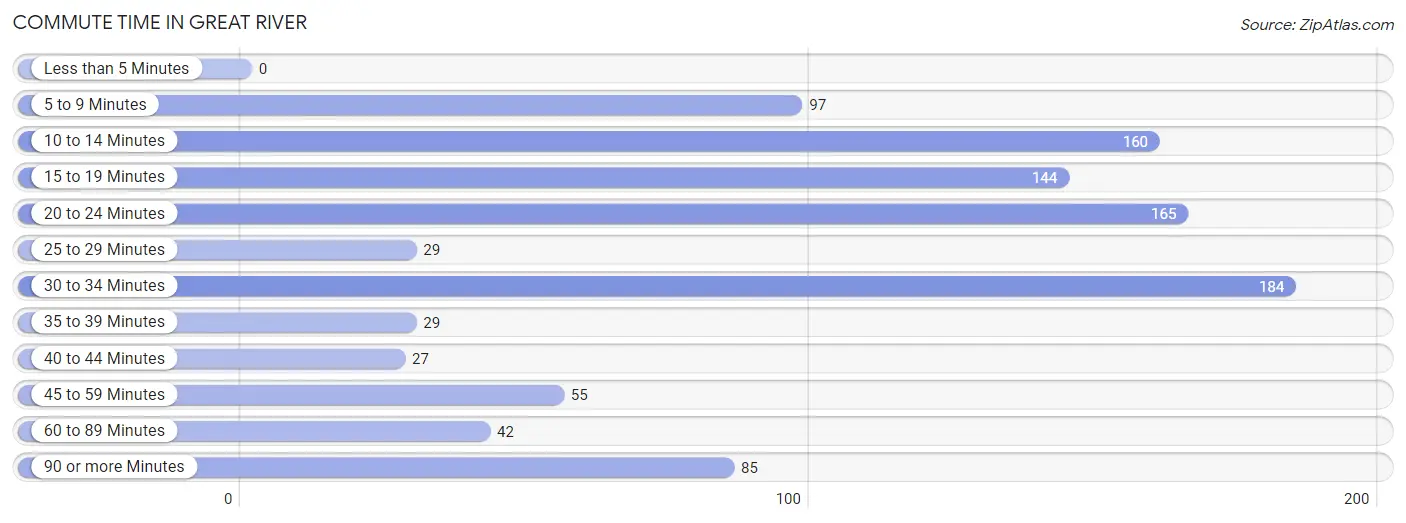
| Commute Time | # Commuters | % Commuters |
| Less than 5 Minutes | 0 | 0.0% |
| 5 to 9 Minutes | 97 | 9.5% |
| 10 to 14 Minutes | 160 | 15.7% |
| 15 to 19 Minutes | 144 | 14.2% |
| 20 to 24 Minutes | 165 | 16.2% |
| 25 to 29 Minutes | 29 | 2.9% |
| 30 to 34 Minutes | 184 | 18.1% |
| 35 to 39 Minutes | 29 | 2.9% |
| 40 to 44 Minutes | 27 | 2.6% |
| 45 to 59 Minutes | 55 | 5.4% |
| 60 to 89 Minutes | 42 | 4.1% |
| 90 or more Minutes | 85 | 8.4% |
Commute Time by Sex in Great River
The most common commute times in Great River are 30 to 34 minutes (147 commuters, 27.2%) for males and 10 to 14 minutes (102 commuters, 21.4%) for females.
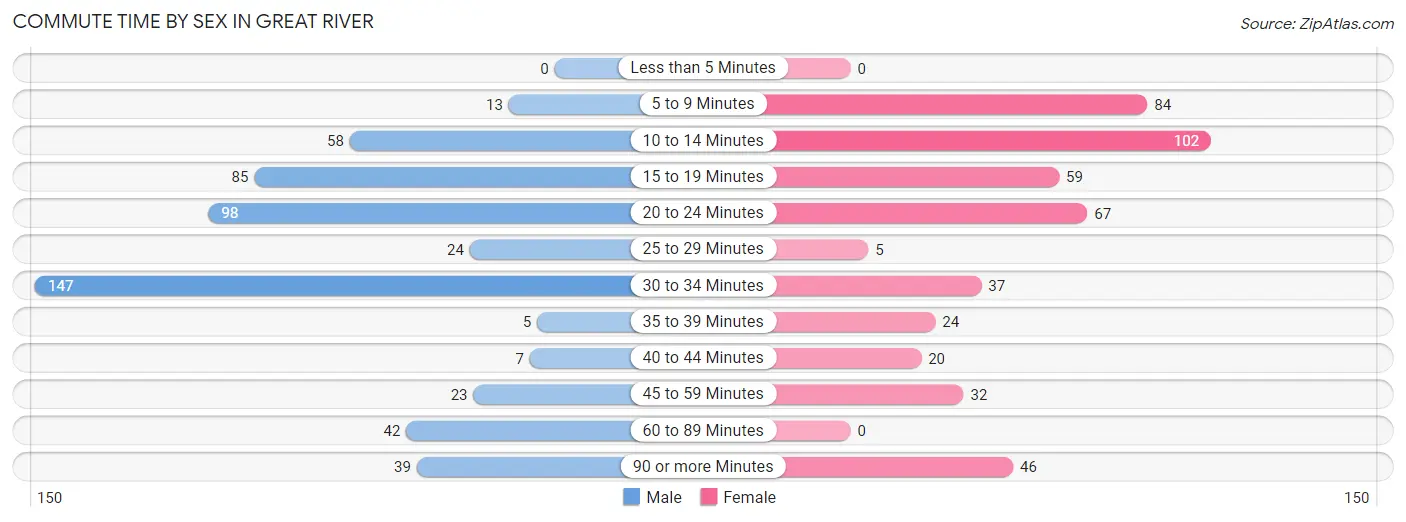
| Commute Time | Male | Female |
| Less than 5 Minutes | 0 (0.0%) | 0 (0.0%) |
| 5 to 9 Minutes | 13 (2.4%) | 84 (17.6%) |
| 10 to 14 Minutes | 58 (10.7%) | 102 (21.4%) |
| 15 to 19 Minutes | 85 (15.7%) | 59 (12.4%) |
| 20 to 24 Minutes | 98 (18.1%) | 67 (14.1%) |
| 25 to 29 Minutes | 24 (4.4%) | 5 (1.1%) |
| 30 to 34 Minutes | 147 (27.2%) | 37 (7.8%) |
| 35 to 39 Minutes | 5 (0.9%) | 24 (5.0%) |
| 40 to 44 Minutes | 7 (1.3%) | 20 (4.2%) |
| 45 to 59 Minutes | 23 (4.3%) | 32 (6.7%) |
| 60 to 89 Minutes | 42 (7.8%) | 0 (0.0%) |
| 90 or more Minutes | 39 (7.2%) | 46 (9.7%) |
Time of Departure to Work by Sex in Great River
The most frequent times of departure to work in Great River are 7:00 AM to 7:29 AM (126, 23.3%) for males and 9:00 AM to 9:59 AM (100, 21.0%) for females.
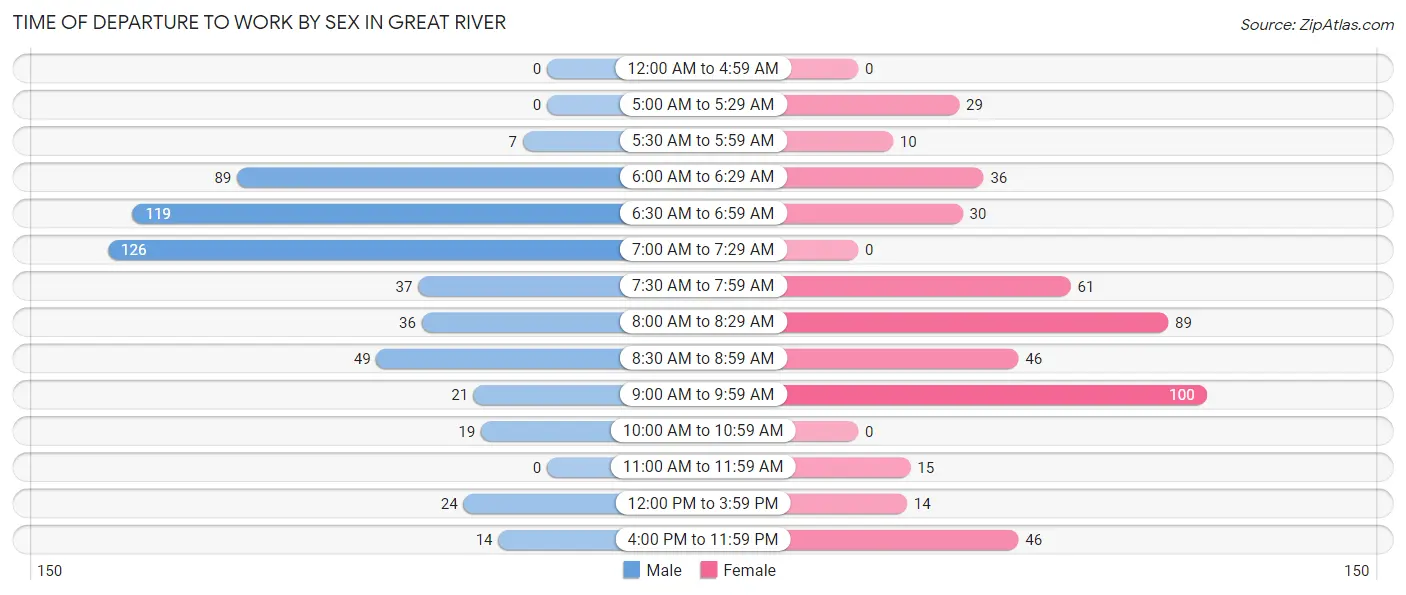
| Time of Departure | Male | Female |
| 12:00 AM to 4:59 AM | 0 (0.0%) | 0 (0.0%) |
| 5:00 AM to 5:29 AM | 0 (0.0%) | 29 (6.1%) |
| 5:30 AM to 5:59 AM | 7 (1.3%) | 10 (2.1%) |
| 6:00 AM to 6:29 AM | 89 (16.5%) | 36 (7.6%) |
| 6:30 AM to 6:59 AM | 119 (22.0%) | 30 (6.3%) |
| 7:00 AM to 7:29 AM | 126 (23.3%) | 0 (0.0%) |
| 7:30 AM to 7:59 AM | 37 (6.8%) | 61 (12.8%) |
| 8:00 AM to 8:29 AM | 36 (6.7%) | 89 (18.7%) |
| 8:30 AM to 8:59 AM | 49 (9.1%) | 46 (9.7%) |
| 9:00 AM to 9:59 AM | 21 (3.9%) | 100 (21.0%) |
| 10:00 AM to 10:59 AM | 19 (3.5%) | 0 (0.0%) |
| 11:00 AM to 11:59 AM | 0 (0.0%) | 15 (3.2%) |
| 12:00 PM to 3:59 PM | 24 (4.4%) | 14 (2.9%) |
| 4:00 PM to 11:59 PM | 14 (2.6%) | 46 (9.7%) |
| Total | 541 (100.0%) | 476 (100.0%) |
Housing Occupancy in Great River
Occupancy by Ownership in Great River
Of the total 823 dwellings in Great River, owner-occupied units account for 535 (65.0%), while renter-occupied units make up 288 (35.0%).
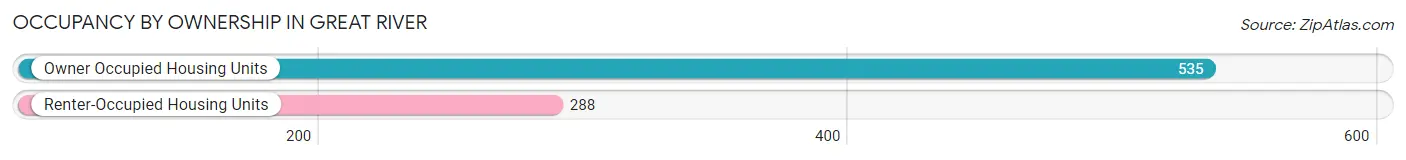
| Occupancy | # Housing Units | % Housing Units |
| Owner Occupied Housing Units | 535 | 65.0% |
| Renter-Occupied Housing Units | 288 | 35.0% |
| Total Occupied Housing Units | 823 | 100.0% |
Occupancy by Household Size in Great River
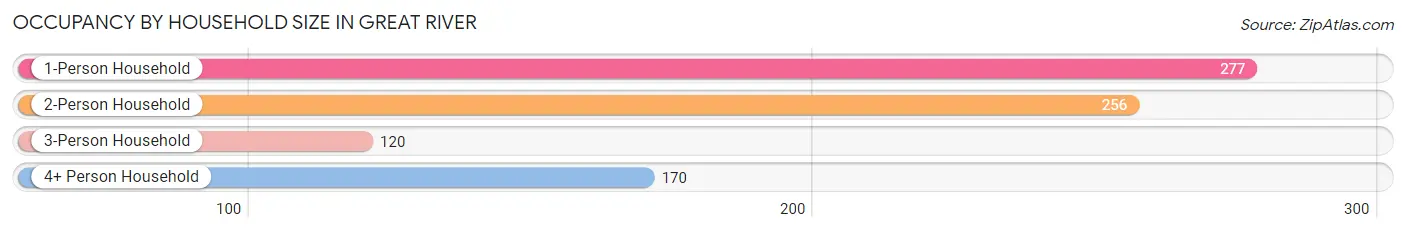
| Household Size | # Housing Units | % Housing Units |
| 1-Person Household | 277 | 33.7% |
| 2-Person Household | 256 | 31.1% |
| 3-Person Household | 120 | 14.6% |
| 4+ Person Household | 170 | 20.7% |
| Total Housing Units | 823 | 100.0% |
Occupancy by Ownership by Household Size in Great River
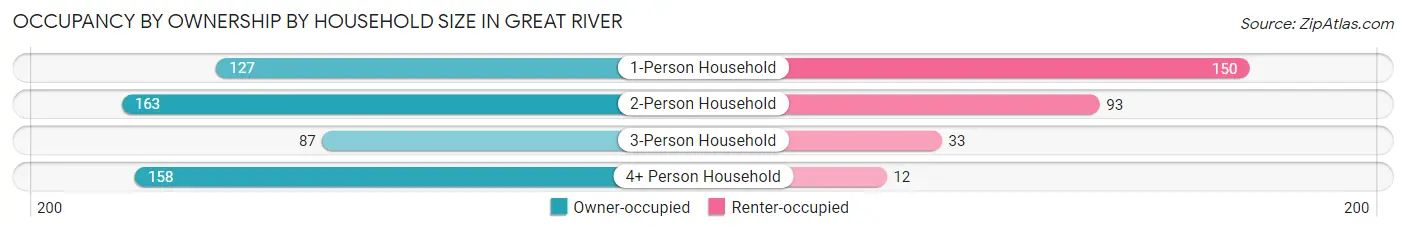
| Household Size | Owner-occupied | Renter-occupied |
| 1-Person Household | 127 (45.9%) | 150 (54.1%) |
| 2-Person Household | 163 (63.7%) | 93 (36.3%) |
| 3-Person Household | 87 (72.5%) | 33 (27.5%) |
| 4+ Person Household | 158 (92.9%) | 12 (7.1%) |
| Total Housing Units | 535 (65.0%) | 288 (35.0%) |
Occupancy by Educational Attainment in Great River
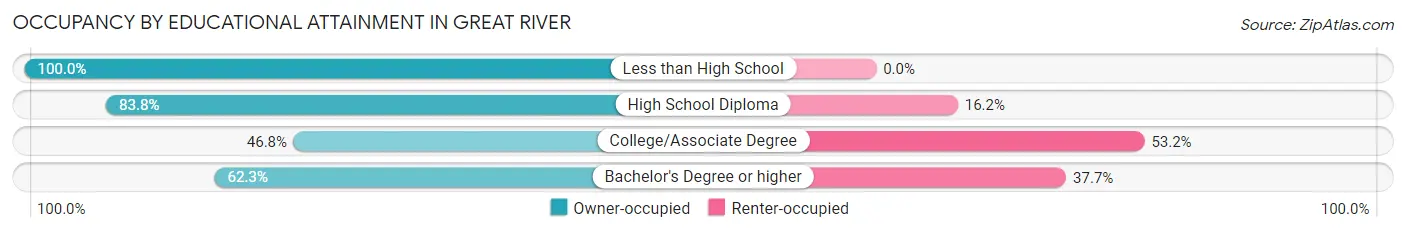
| Household Size | Owner-occupied | Renter-occupied |
| Less than High School | 39 (100.0%) | 0 (0.0%) |
| High School Diploma | 114 (83.8%) | 22 (16.2%) |
| College/Associate Degree | 66 (46.8%) | 75 (53.2%) |
| Bachelor's Degree or higher | 316 (62.3%) | 191 (37.7%) |
Occupancy by Age of Householder in Great River
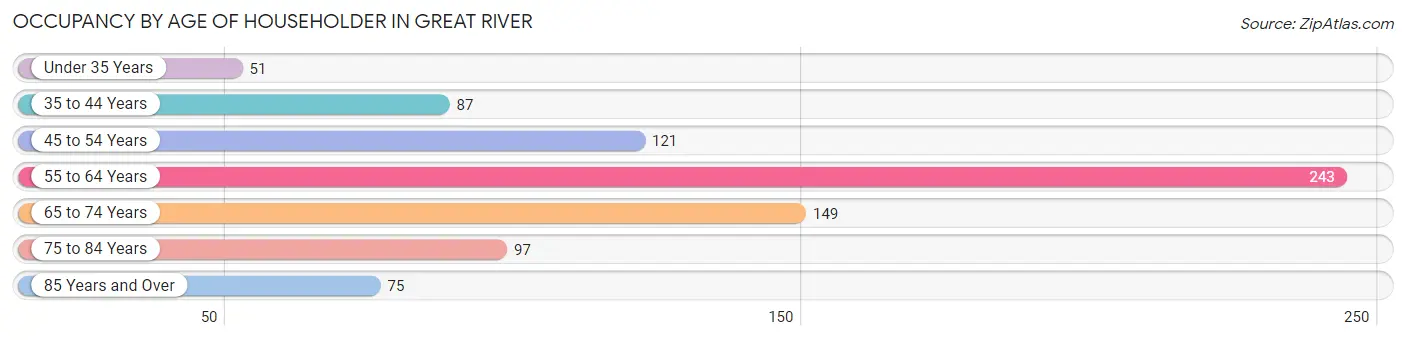
| Age Bracket | # Households | % Households |
| Under 35 Years | 51 | 6.2% |
| 35 to 44 Years | 87 | 10.6% |
| 45 to 54 Years | 121 | 14.7% |
| 55 to 64 Years | 243 | 29.5% |
| 65 to 74 Years | 149 | 18.1% |
| 75 to 84 Years | 97 | 11.8% |
| 85 Years and Over | 75 | 9.1% |
| Total | 823 | 100.0% |
Housing Finances in Great River
Median Income by Occupancy in Great River
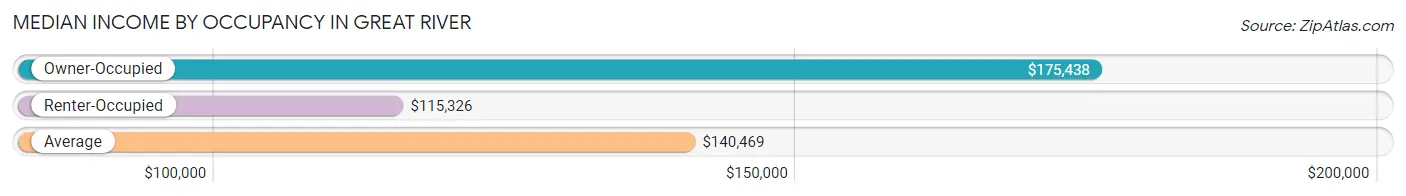
| Occupancy Type | # Households | Median Income |
| Owner-Occupied | 535 (65.0%) | $175,438 |
| Renter-Occupied | 288 (35.0%) | $115,326 |
| Average | 823 (100.0%) | $140,469 |
Occupancy by Householder Income Bracket in Great River
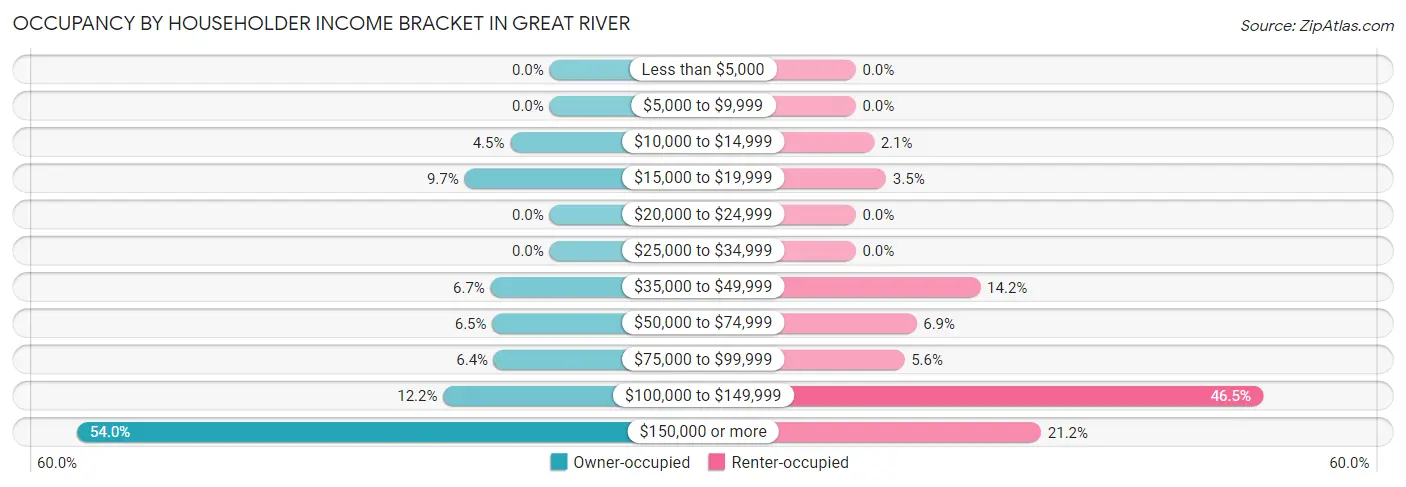
| Income Bracket | Owner-occupied | Renter-occupied |
| Less than $5,000 | 0 (0.0%) | 0 (0.0%) |
| $5,000 to $9,999 | 0 (0.0%) | 0 (0.0%) |
| $10,000 to $14,999 | 24 (4.5%) | 6 (2.1%) |
| $15,000 to $19,999 | 52 (9.7%) | 10 (3.5%) |
| $20,000 to $24,999 | 0 (0.0%) | 0 (0.0%) |
| $25,000 to $34,999 | 0 (0.0%) | 0 (0.0%) |
| $35,000 to $49,999 | 36 (6.7%) | 41 (14.2%) |
| $50,000 to $74,999 | 35 (6.5%) | 20 (6.9%) |
| $75,000 to $99,999 | 34 (6.4%) | 16 (5.6%) |
| $100,000 to $149,999 | 65 (12.1%) | 134 (46.5%) |
| $150,000 or more | 289 (54.0%) | 61 (21.2%) |
| Total | 535 (100.0%) | 288 (100.0%) |
Monthly Housing Cost Tiers in Great River
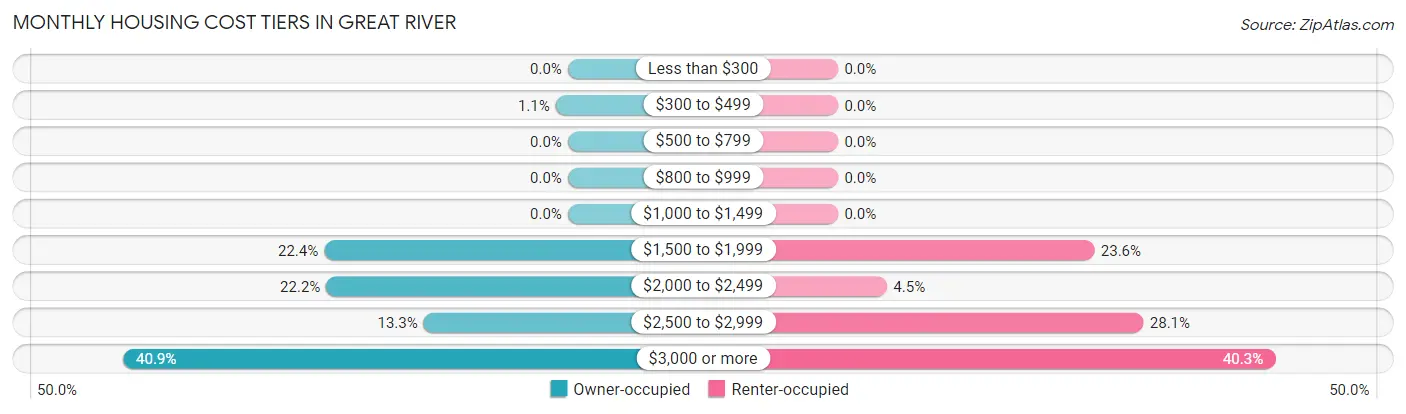
| Monthly Cost | Owner-occupied | Renter-occupied |
| Less than $300 | 0 (0.0%) | 0 (0.0%) |
| $300 to $499 | 6 (1.1%) | 0 (0.0%) |
| $500 to $799 | 0 (0.0%) | 0 (0.0%) |
| $800 to $999 | 0 (0.0%) | 0 (0.0%) |
| $1,000 to $1,499 | 0 (0.0%) | 0 (0.0%) |
| $1,500 to $1,999 | 120 (22.4%) | 68 (23.6%) |
| $2,000 to $2,499 | 119 (22.2%) | 13 (4.5%) |
| $2,500 to $2,999 | 71 (13.3%) | 81 (28.1%) |
| $3,000 or more | 219 (40.9%) | 116 (40.3%) |
| Total | 535 (100.0%) | 288 (100.0%) |
Physical Housing Characteristics in Great River
Housing Structures in Great River
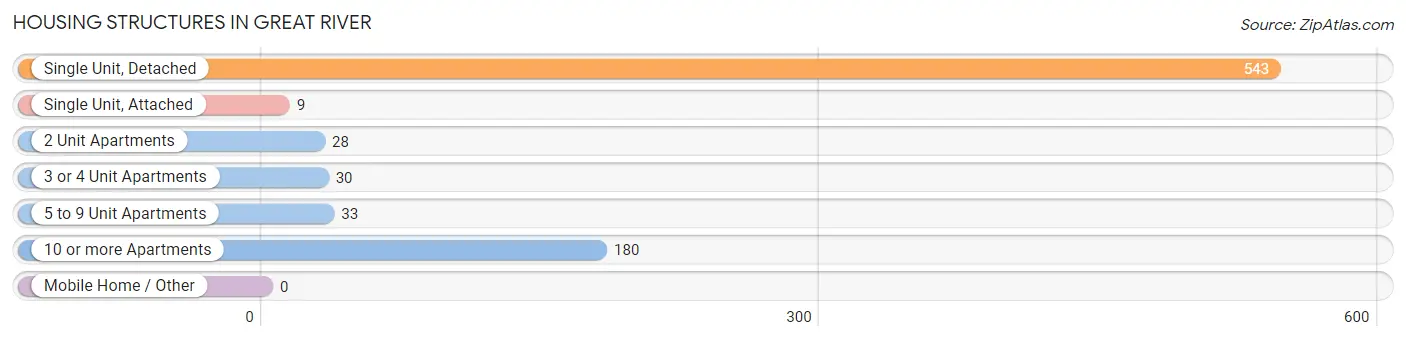
| Structure Type | # Housing Units | % Housing Units |
| Single Unit, Detached | 543 | 66.0% |
| Single Unit, Attached | 9 | 1.1% |
| 2 Unit Apartments | 28 | 3.4% |
| 3 or 4 Unit Apartments | 30 | 3.6% |
| 5 to 9 Unit Apartments | 33 | 4.0% |
| 10 or more Apartments | 180 | 21.9% |
| Mobile Home / Other | 0 | 0.0% |
| Total | 823 | 100.0% |
Housing Structures by Occupancy in Great River
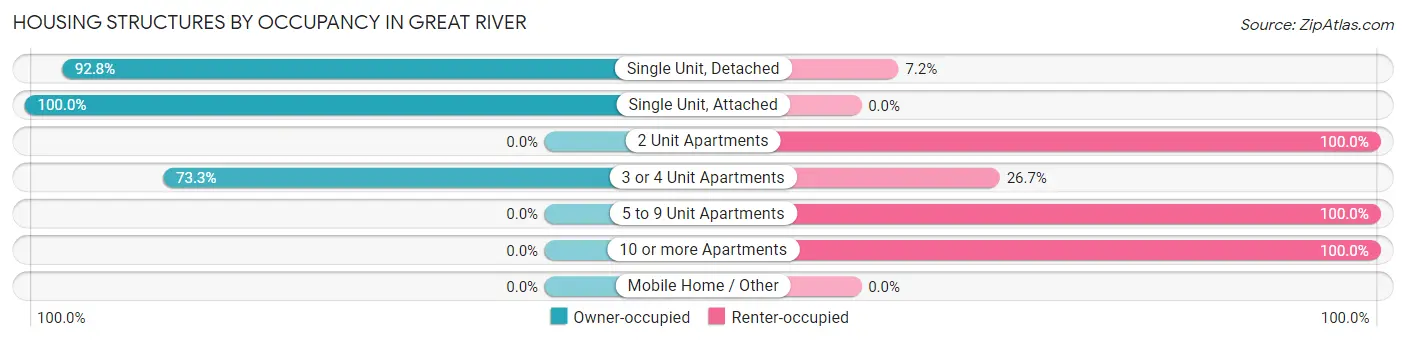
| Structure Type | Owner-occupied | Renter-occupied |
| Single Unit, Detached | 504 (92.8%) | 39 (7.2%) |
| Single Unit, Attached | 9 (100.0%) | 0 (0.0%) |
| 2 Unit Apartments | 0 (0.0%) | 28 (100.0%) |
| 3 or 4 Unit Apartments | 22 (73.3%) | 8 (26.7%) |
| 5 to 9 Unit Apartments | 0 (0.0%) | 33 (100.0%) |
| 10 or more Apartments | 0 (0.0%) | 180 (100.0%) |
| Mobile Home / Other | 0 (0.0%) | 0 (0.0%) |
| Total | 535 (65.0%) | 288 (35.0%) |
Housing Structures by Number of Rooms in Great River
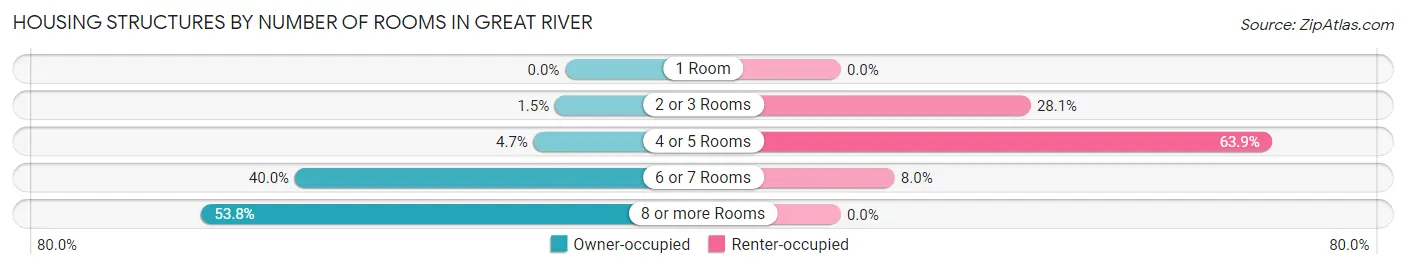
| Number of Rooms | Owner-occupied | Renter-occupied |
| 1 Room | 0 (0.0%) | 0 (0.0%) |
| 2 or 3 Rooms | 8 (1.5%) | 81 (28.1%) |
| 4 or 5 Rooms | 25 (4.7%) | 184 (63.9%) |
| 6 or 7 Rooms | 214 (40.0%) | 23 (8.0%) |
| 8 or more Rooms | 288 (53.8%) | 0 (0.0%) |
| Total | 535 (100.0%) | 288 (100.0%) |
Housing Structure by Heating Type in Great River
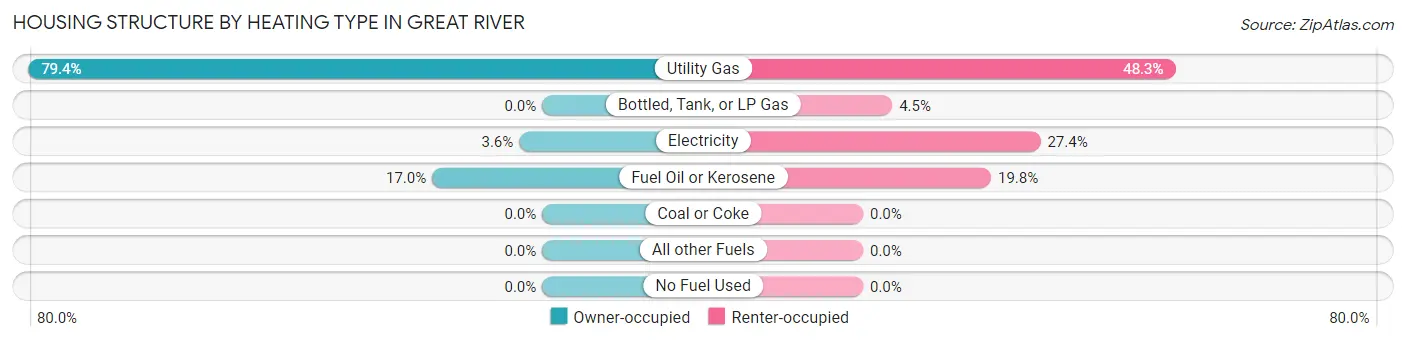
| Heating Type | Owner-occupied | Renter-occupied |
| Utility Gas | 425 (79.4%) | 139 (48.3%) |
| Bottled, Tank, or LP Gas | 0 (0.0%) | 13 (4.5%) |
| Electricity | 19 (3.5%) | 79 (27.4%) |
| Fuel Oil or Kerosene | 91 (17.0%) | 57 (19.8%) |
| Coal or Coke | 0 (0.0%) | 0 (0.0%) |
| All other Fuels | 0 (0.0%) | 0 (0.0%) |
| No Fuel Used | 0 (0.0%) | 0 (0.0%) |
| Total | 535 (100.0%) | 288 (100.0%) |
Household Vehicle Usage in Great River
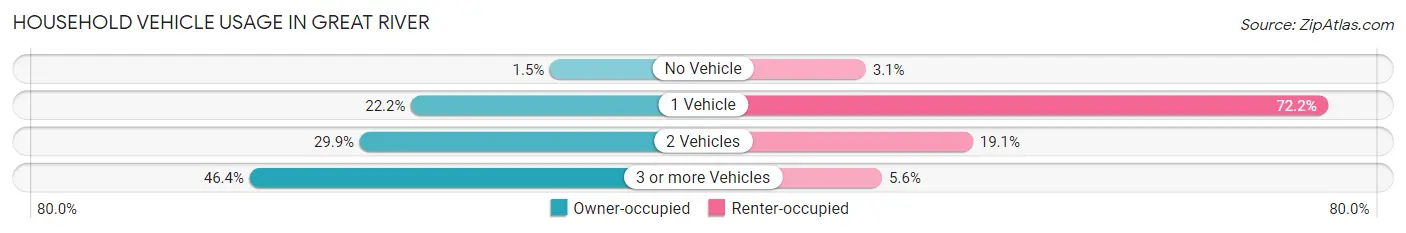
| Vehicles per Household | Owner-occupied | Renter-occupied |
| No Vehicle | 8 (1.5%) | 9 (3.1%) |
| 1 Vehicle | 119 (22.2%) | 208 (72.2%) |
| 2 Vehicles | 160 (29.9%) | 55 (19.1%) |
| 3 or more Vehicles | 248 (46.4%) | 16 (5.6%) |
| Total | 535 (100.0%) | 288 (100.0%) |
Real Estate & Mortgages in Great River
Real Estate and Mortgage Overview in Great River
| Characteristic | Without Mortgage | With Mortgage |
| Housing Units | 250 | 285 |
| Median Property Value | $792,900 | $811,000 |
| Median Household Income | $83,438 | $198 |
| Monthly Housing Costs | $1,501 | $219 |
| Real Estate Taxes | $10,001 | $0 |
Property Value by Mortgage Status in Great River
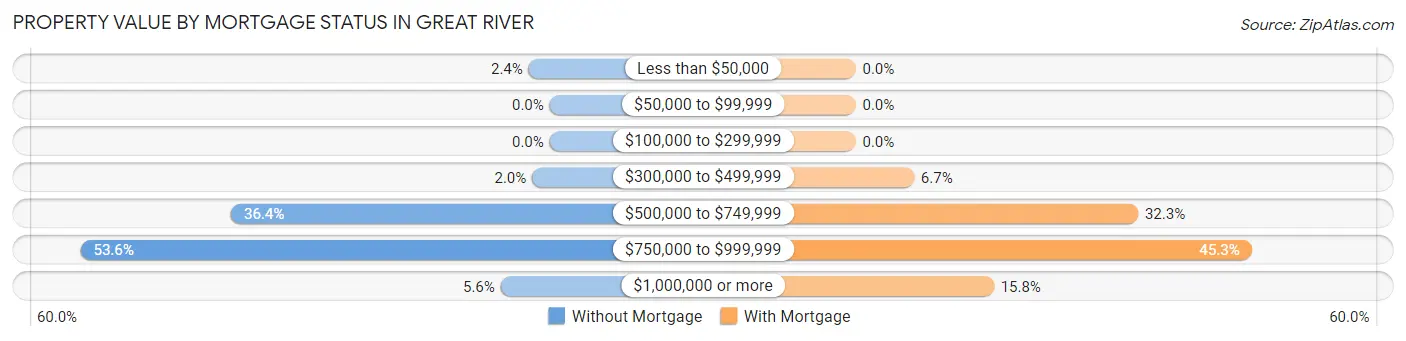
| Property Value | Without Mortgage | With Mortgage |
| Less than $50,000 | 6 (2.4%) | 0 (0.0%) |
| $50,000 to $99,999 | 0 (0.0%) | 0 (0.0%) |
| $100,000 to $299,999 | 0 (0.0%) | 0 (0.0%) |
| $300,000 to $499,999 | 5 (2.0%) | 19 (6.7%) |
| $500,000 to $749,999 | 91 (36.4%) | 92 (32.3%) |
| $750,000 to $999,999 | 134 (53.6%) | 129 (45.3%) |
| $1,000,000 or more | 14 (5.6%) | 45 (15.8%) |
| Total | 250 (100.0%) | 285 (100.0%) |
Household Income by Mortgage Status in Great River
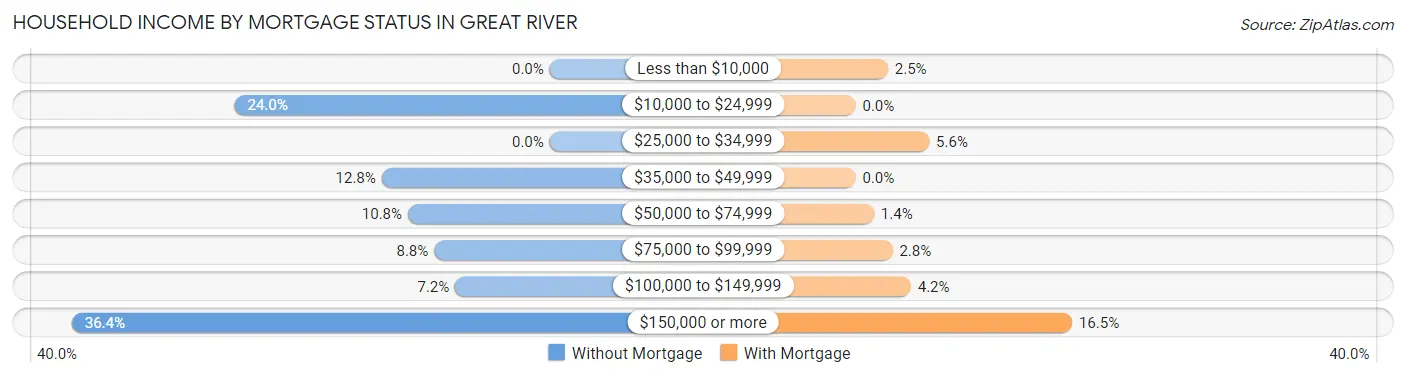
| Household Income | Without Mortgage | With Mortgage |
| Less than $10,000 | 0 (0.0%) | 7 (2.5%) |
| $10,000 to $24,999 | 60 (24.0%) | 0 (0.0%) |
| $25,000 to $34,999 | 0 (0.0%) | 16 (5.6%) |
| $35,000 to $49,999 | 32 (12.8%) | 0 (0.0%) |
| $50,000 to $74,999 | 27 (10.8%) | 4 (1.4%) |
| $75,000 to $99,999 | 22 (8.8%) | 8 (2.8%) |
| $100,000 to $149,999 | 18 (7.2%) | 12 (4.2%) |
| $150,000 or more | 91 (36.4%) | 47 (16.5%) |
| Total | 250 (100.0%) | 285 (100.0%) |
Property Value to Household Income Ratio in Great River
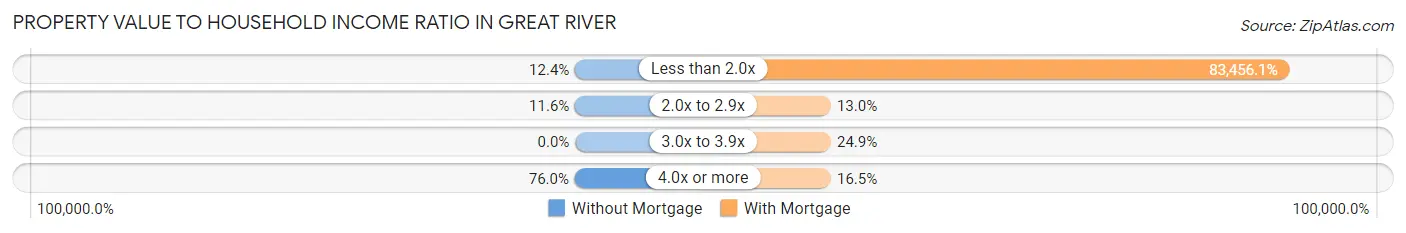
| Value-to-Income Ratio | Without Mortgage | With Mortgage |
| Less than 2.0x | 31 (12.4%) | 237,850 (83,456.1%) |
| 2.0x to 2.9x | 29 (11.6%) | 37 (13.0%) |
| 3.0x to 3.9x | 0 (0.0%) | 71 (24.9%) |
| 4.0x or more | 190 (76.0%) | 47 (16.5%) |
| Total | 250 (100.0%) | 285 (100.0%) |
Real Estate Taxes by Mortgage Status in Great River
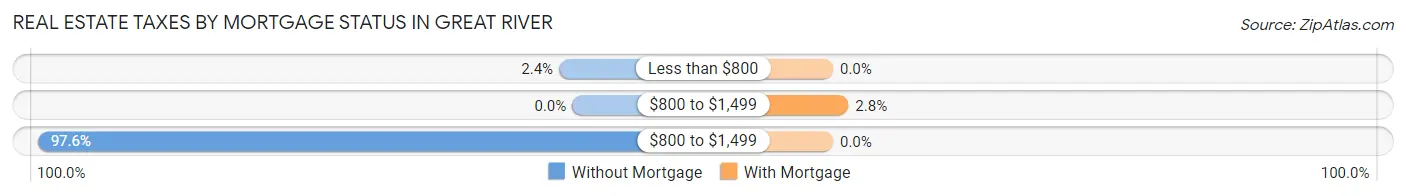
| Property Taxes | Without Mortgage | With Mortgage |
| Less than $800 | 6 (2.4%) | 0 (0.0%) |
| $800 to $1,499 | 0 (0.0%) | 8 (2.8%) |
| $800 to $1,499 | 244 (97.6%) | 0 (0.0%) |
| Total | 250 (100.0%) | 285 (100.0%) |
Health & Disability in Great River
Health Insurance Coverage by Age in Great River
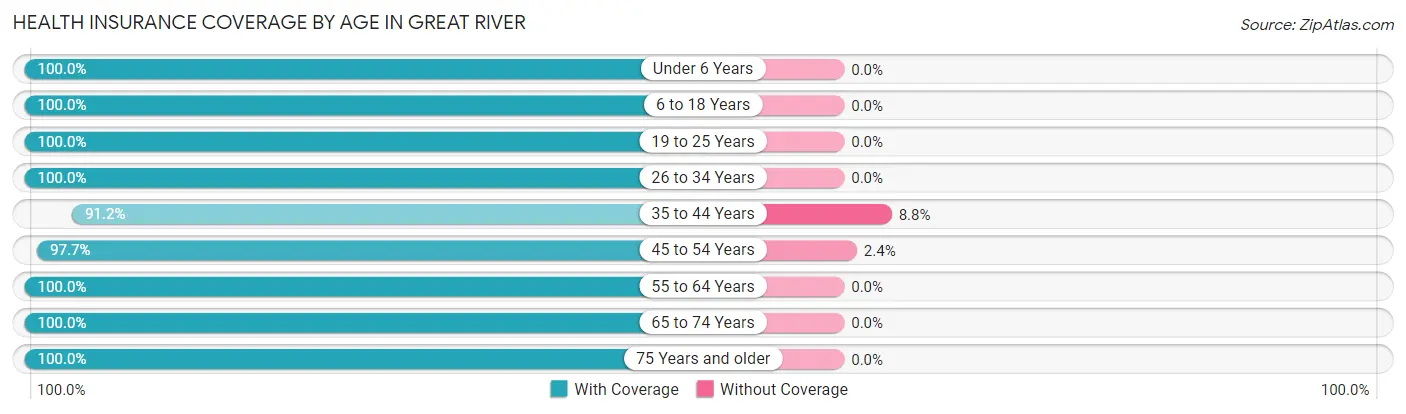
| Age Bracket | With Coverage | Without Coverage |
| Under 6 Years | 37 (100.0%) | 0 (0.0%) |
| 6 to 18 Years | 268 (100.0%) | 0 (0.0%) |
| 19 to 25 Years | 219 (100.0%) | 0 (0.0%) |
| 26 to 34 Years | 226 (100.0%) | 0 (0.0%) |
| 35 to 44 Years | 134 (91.2%) | 13 (8.8%) |
| 45 to 54 Years | 249 (97.7%) | 6 (2.4%) |
| 55 to 64 Years | 372 (100.0%) | 0 (0.0%) |
| 65 to 74 Years | 235 (100.0%) | 0 (0.0%) |
| 75 Years and older | 233 (100.0%) | 0 (0.0%) |
| Total | 1,973 (99.1%) | 19 (0.9%) |
Health Insurance Coverage by Citizenship Status in Great River
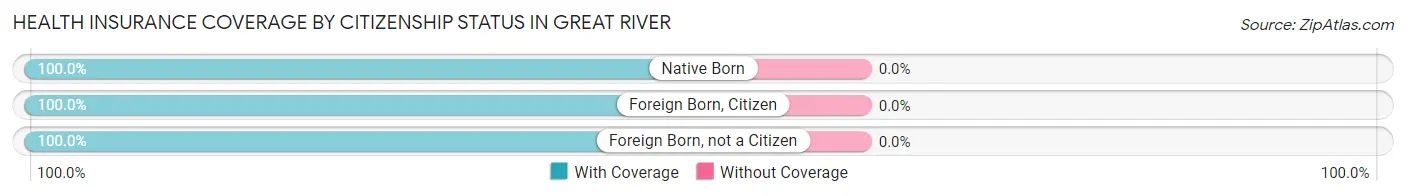
| Citizenship Status | With Coverage | Without Coverage |
| Native Born | 37 (100.0%) | 0 (0.0%) |
| Foreign Born, Citizen | 268 (100.0%) | 0 (0.0%) |
| Foreign Born, not a Citizen | 219 (100.0%) | 0 (0.0%) |
Health Insurance Coverage by Household Income in Great River
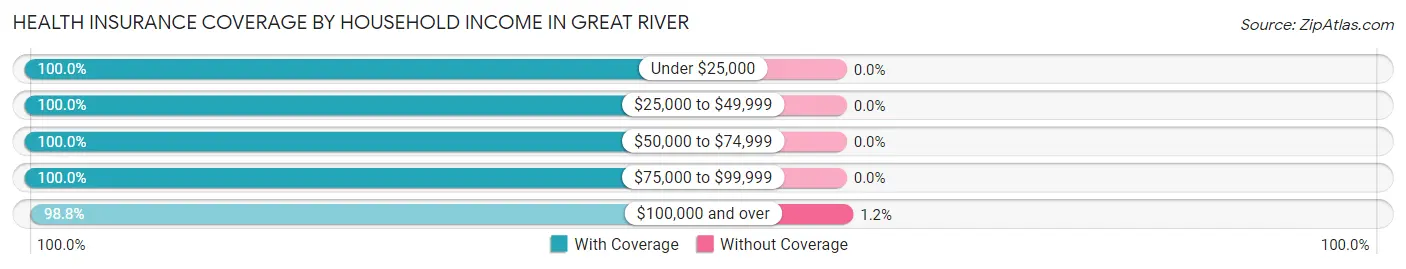
| Household Income | With Coverage | Without Coverage |
| Under $25,000 | 119 (100.0%) | 0 (0.0%) |
| $25,000 to $49,999 | 100 (100.0%) | 0 (0.0%) |
| $50,000 to $74,999 | 94 (100.0%) | 0 (0.0%) |
| $75,000 to $99,999 | 120 (100.0%) | 0 (0.0%) |
| $100,000 and over | 1,540 (98.8%) | 19 (1.2%) |
Public vs Private Health Insurance Coverage by Age in Great River
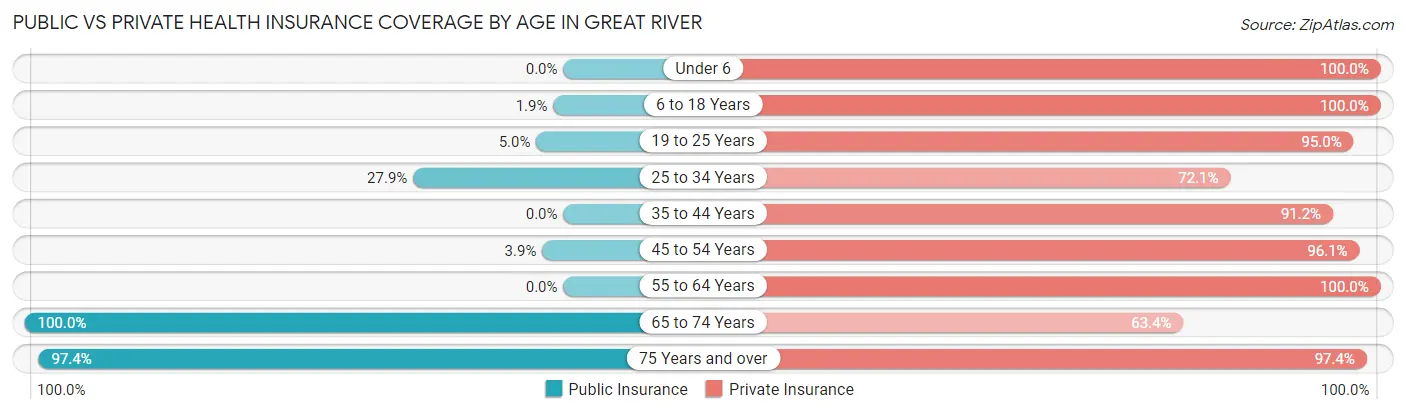
| Age Bracket | Public Insurance | Private Insurance |
| Under 6 | 0 (0.0%) | 37 (100.0%) |
| 6 to 18 Years | 5 (1.9%) | 268 (100.0%) |
| 19 to 25 Years | 11 (5.0%) | 208 (95.0%) |
| 25 to 34 Years | 63 (27.9%) | 163 (72.1%) |
| 35 to 44 Years | 0 (0.0%) | 134 (91.2%) |
| 45 to 54 Years | 10 (3.9%) | 245 (96.1%) |
| 55 to 64 Years | 0 (0.0%) | 372 (100.0%) |
| 65 to 74 Years | 235 (100.0%) | 149 (63.4%) |
| 75 Years and over | 227 (97.4%) | 227 (97.4%) |
| Total | 551 (27.7%) | 1,803 (90.5%) |
Disability Status by Sex by Age in Great River
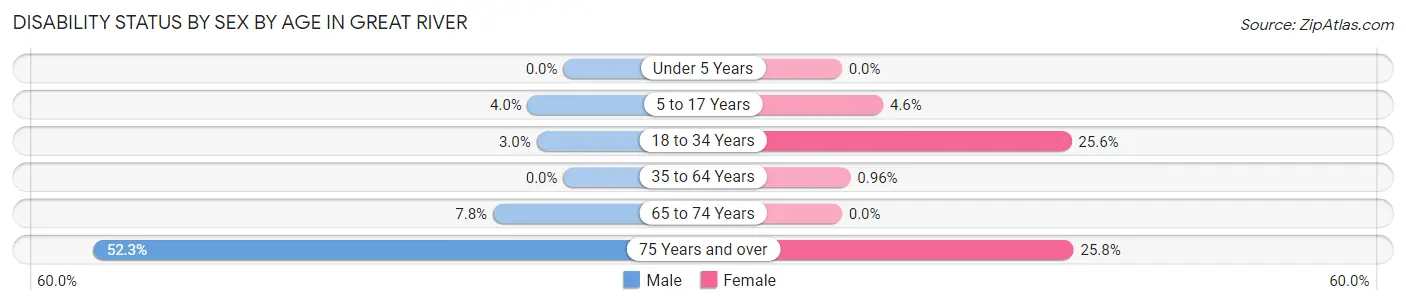
| Age Bracket | Male | Female |
| Under 5 Years | 0 (0.0%) | 0 (0.0%) |
| 5 to 17 Years | 5 (4.0%) | 5 (4.6%) |
| 18 to 34 Years | 9 (3.0%) | 45 (25.6%) |
| 35 to 64 Years | 0 (0.0%) | 4 (1.0%) |
| 65 to 74 Years | 8 (7.8%) | 0 (0.0%) |
| 75 Years and over | 57 (52.3%) | 32 (25.8%) |
Disability Class by Sex by Age in Great River
Disability Class: Hearing Difficulty
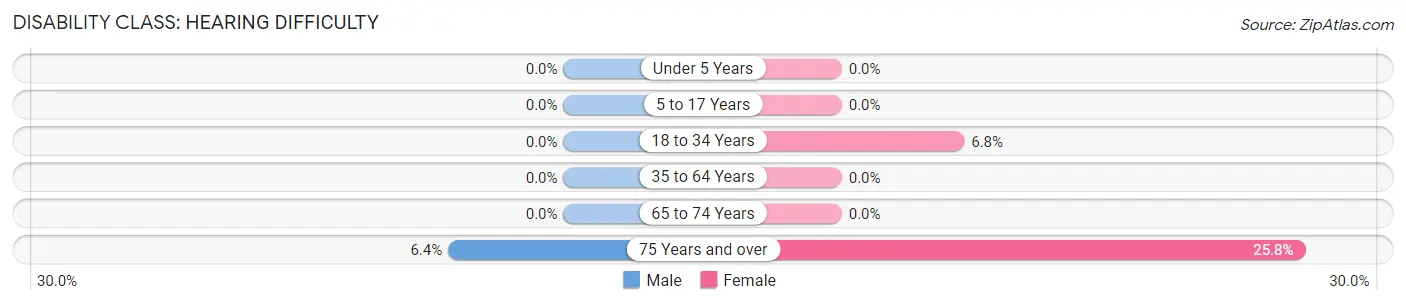
| Age Bracket | Male | Female |
| Under 5 Years | 0 (0.0%) | 0 (0.0%) |
| 5 to 17 Years | 0 (0.0%) | 0 (0.0%) |
| 18 to 34 Years | 0 (0.0%) | 12 (6.8%) |
| 35 to 64 Years | 0 (0.0%) | 0 (0.0%) |
| 65 to 74 Years | 0 (0.0%) | 0 (0.0%) |
| 75 Years and over | 7 (6.4%) | 32 (25.8%) |
Disability Class: Vision Difficulty
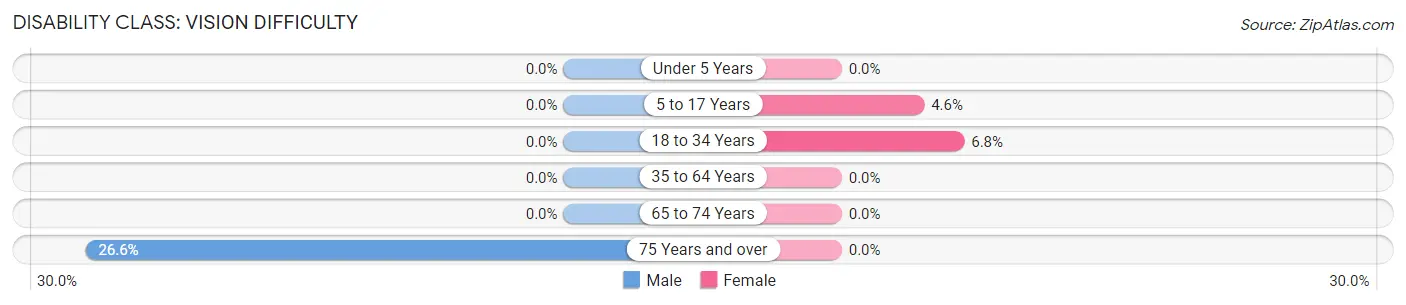
| Age Bracket | Male | Female |
| Under 5 Years | 0 (0.0%) | 0 (0.0%) |
| 5 to 17 Years | 0 (0.0%) | 5 (4.6%) |
| 18 to 34 Years | 0 (0.0%) | 12 (6.8%) |
| 35 to 64 Years | 0 (0.0%) | 0 (0.0%) |
| 65 to 74 Years | 0 (0.0%) | 0 (0.0%) |
| 75 Years and over | 29 (26.6%) | 0 (0.0%) |
Disability Class: Cognitive Difficulty
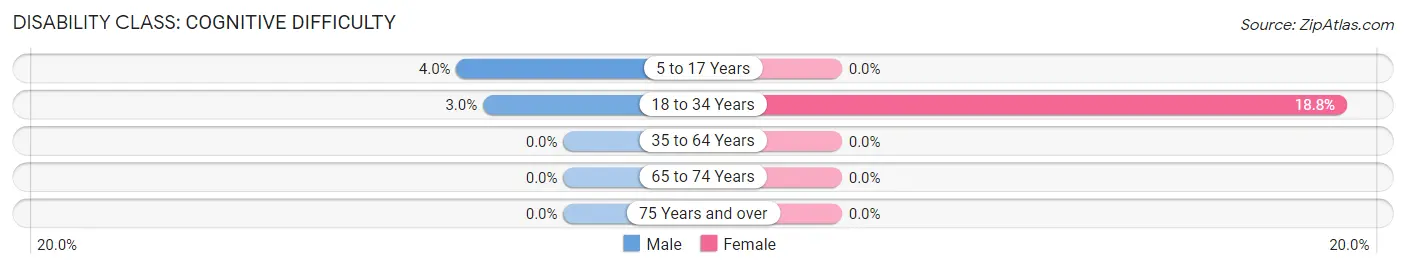
| Age Bracket | Male | Female |
| 5 to 17 Years | 5 (4.0%) | 0 (0.0%) |
| 18 to 34 Years | 9 (3.0%) | 33 (18.8%) |
| 35 to 64 Years | 0 (0.0%) | 0 (0.0%) |
| 65 to 74 Years | 0 (0.0%) | 0 (0.0%) |
| 75 Years and over | 0 (0.0%) | 0 (0.0%) |
Disability Class: Ambulatory Difficulty
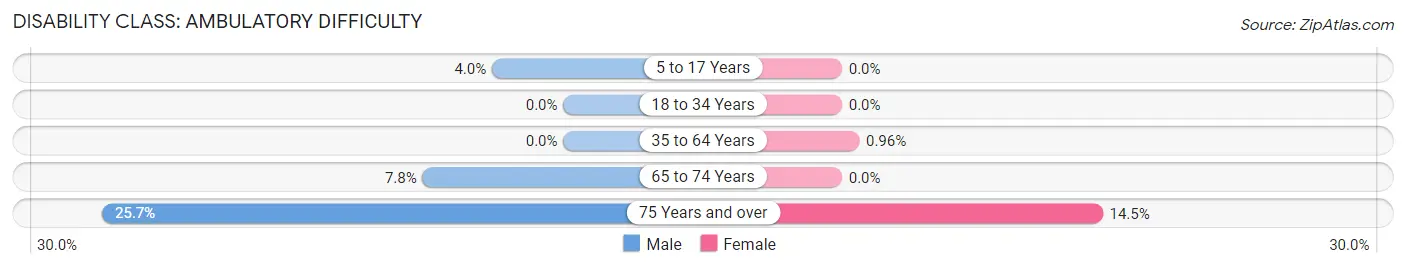
| Age Bracket | Male | Female |
| 5 to 17 Years | 5 (4.0%) | 0 (0.0%) |
| 18 to 34 Years | 0 (0.0%) | 0 (0.0%) |
| 35 to 64 Years | 0 (0.0%) | 4 (1.0%) |
| 65 to 74 Years | 8 (7.8%) | 0 (0.0%) |
| 75 Years and over | 28 (25.7%) | 18 (14.5%) |
Disability Class: Self-Care Difficulty
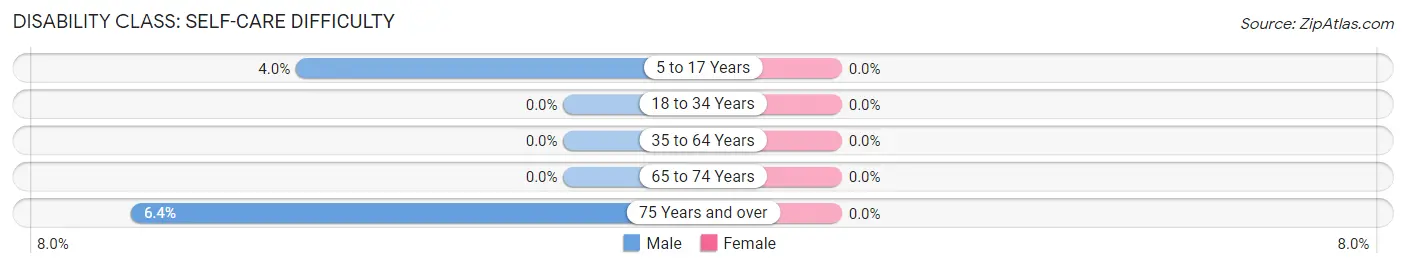
| Age Bracket | Male | Female |
| 5 to 17 Years | 5 (4.0%) | 0 (0.0%) |
| 18 to 34 Years | 0 (0.0%) | 0 (0.0%) |
| 35 to 64 Years | 0 (0.0%) | 0 (0.0%) |
| 65 to 74 Years | 0 (0.0%) | 0 (0.0%) |
| 75 Years and over | 7 (6.4%) | 0 (0.0%) |
Technology Access in Great River
Computing Device Access in Great River
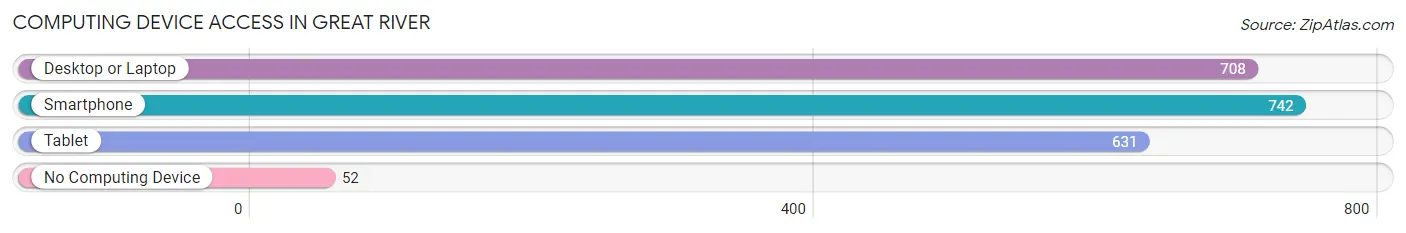
| Device Type | # Households | % Households |
| Desktop or Laptop | 708 | 86.0% |
| Smartphone | 742 | 90.2% |
| Tablet | 631 | 76.7% |
| No Computing Device | 52 | 6.3% |
| Total | 823 | 100.0% |
Internet Access in Great River
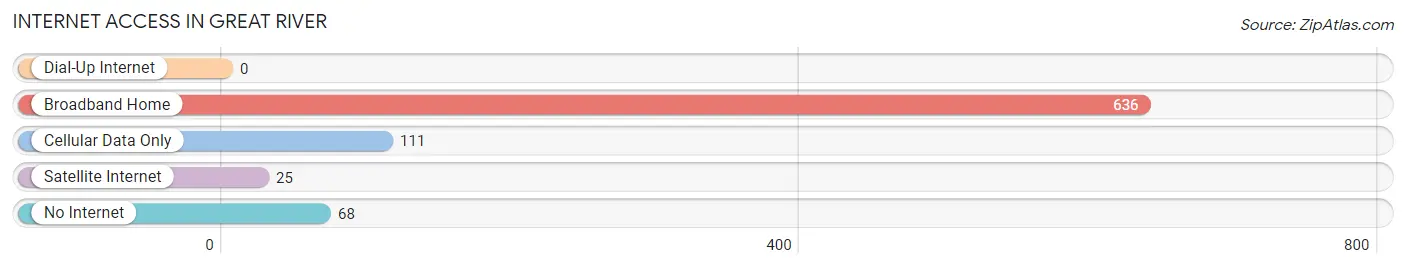
| Internet Type | # Households | % Households |
| Dial-Up Internet | 0 | 0.0% |
| Broadband Home | 636 | 77.3% |
| Cellular Data Only | 111 | 13.5% |
| Satellite Internet | 25 | 3.0% |
| No Internet | 68 | 8.3% |
| Total | 823 | 100.0% |
Great River Summary
Great River is a hamlet located in the Town of Islip in Suffolk County, New York. It is situated on the south shore of Long Island, approximately 50 miles east of New York City. The hamlet is bordered by the Great South Bay to the north, the Connetquot River to the east, and the South Shore Estuary to the south.
History
The area now known as Great River was originally inhabited by the Secatogue Indians, a branch of the Algonquin tribe. The Secatogue Indians were a peaceful tribe who lived off the land and the waters of the Great South Bay. The first European settlers arrived in the area in the late 1600s, and the hamlet was officially established in 1720.
The hamlet was originally known as "Great South Bay," but the name was changed to "Great River" in 1845. The name was chosen to reflect the fact that the hamlet is located at the mouth of the Connetquot River.
In the late 1800s, Great River became a popular summer destination for wealthy New Yorkers. The area was known for its beautiful beaches, fishing, and boating. The hamlet also became a popular spot for duck hunting, and the area was home to several duck hunting clubs.
In the early 1900s, the hamlet began to experience a population boom. The population grew from just over 500 in 1900 to over 1,000 by the mid-1920s. The population continued to grow throughout the 20th century, and today the hamlet has a population of approximately 2,500.
Geography
Great River is located on the south shore of Long Island, approximately 50 miles east of New York City. The hamlet is bordered by the Great South Bay to the north, the Connetquot River to the east, and the South Shore Estuary to the south.
The hamlet is located in the Town of Islip, which is part of Suffolk County. The town is home to several other hamlets, including Bay Shore, Brightwaters, and Islip.
The hamlet is located in a temperate climate zone, with hot summers and cold winters. The average temperature in the summer is around 75 degrees Fahrenheit, and the average temperature in the winter is around 40 degrees Fahrenheit.
Economy
The economy of Great River is largely based on tourism and recreation. The hamlet is home to several marinas, which attract visitors from all over the region. The hamlet is also home to several restaurants, bars, and shops, which cater to both locals and visitors.
The hamlet is also home to several businesses, including a boat repair shop, a landscaping company, and a seafood market. The hamlet is also home to several small manufacturing companies, which produce a variety of products, including furniture, clothing, and electronics.
Demographics
As of the 2010 census, the population of Great River was 2,521. The population is largely white (90.2%), with small percentages of African American (3.2%), Asian (2.2%), and Hispanic (2.2%) residents.
The median household income in Great River is $90,945, which is significantly higher than the national median of $53,482. The median home value in the hamlet is $521,400, which is also significantly higher than the national median of $184,700.
The hamlet is home to several schools, including Great River Elementary School, Great River Middle School, and Great River High School. The hamlet is also home to several churches, including St. John's Episcopal Church and St. Mary's Roman Catholic Church.
Common Questions
What is Per Capita Income in Great River?
Per Capita income in Great River is $77,558.
What is the Median Family Income in Great River?
Median Family Income in Great River is $187,321.
What is the Median Household income in Great River?
Median Household Income in Great River is $140,469.
What is Income or Wage Gap in Great River?
Income or Wage Gap in Great River is 38.1%.
Women in Great River earn 61.9 cents for every dollar earned by a man.
What is Inequality or Gini Index in Great River?
Inequality or Gini Index in Great River is 0.47.
What is the Total Population of Great River?
Total Population of Great River is 1,992.
What is the Total Male Population of Great River?
Total Male Population of Great River is 1,011.
What is the Total Female Population of Great River?
Total Female Population of Great River is 981.
What is the Ratio of Males per 100 Females in Great River?
There are 103.06 Males per 100 Females in Great River.
What is the Ratio of Females per 100 Males in Great River?
There are 97.03 Females per 100 Males in Great River.
What is the Median Population Age in Great River?
Median Population Age in Great River is 49.9 Years.
What is the Average Family Size in Great River
Average Family Size in Great River is 3.2 People.
What is the Average Household Size in Great River
Average Household Size in Great River is 2.4 People.
How Large is the Labor Force in Great River?
There are 1,234 People in the Labor Forcein in Great River.
What is the Percentage of People in the Labor Force in Great River?
69.0% of People are in the Labor Force in Great River.
What is the Unemployment Rate in Great River?
Unemployment Rate in Great River is 3.2%.