Zip Codes with the Highest Percentage of Families with Income Above $100,000 in Lyon Mountain, NY
RELATED REPORTS & OPTIONS
Family Income | $100k+
Lyon Mountain
Compare Zip Codes
Map of Zip Codes with the Highest Percentage of Families with Income Above $100,000 in Lyon Mountain
29.3%
29.4%
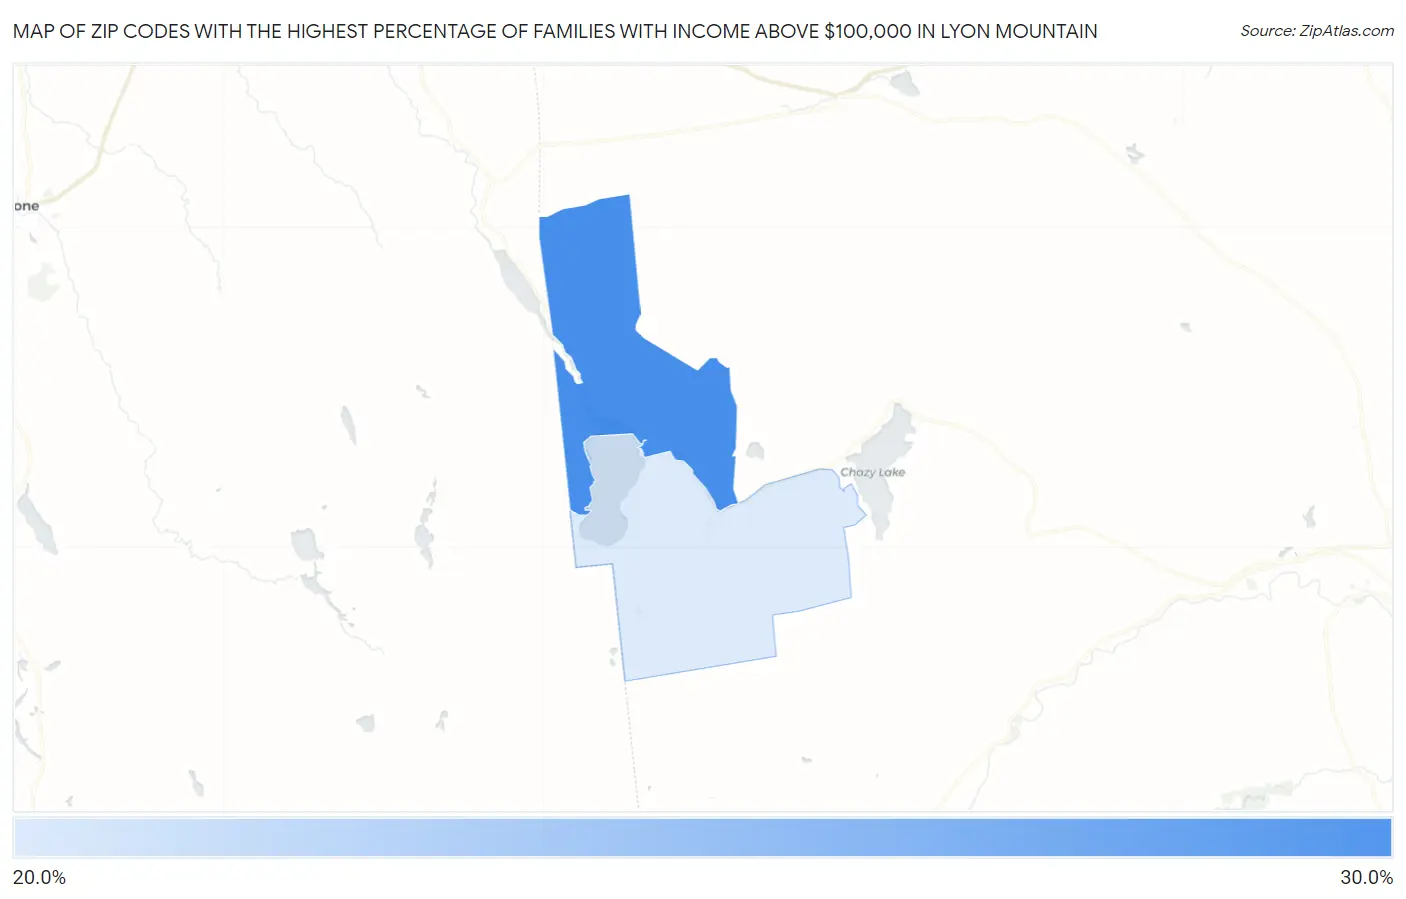
Zip Codes with the Highest Percentage of Families with Income Above $100,000 in Lyon Mountain, NY
| Zip Code | Families with Income > $100k | vs State | vs National | |
| 1. | 12955 | 29.4% | 50.3%(-20.9)#1,396 | 46.1%(-16.7)#21,890 |
| 2. | 12952 | 29.3% | 50.3%(-21.0)#1,400 | 46.1%(-16.8)#21,956 |
1
Common Questions
What are the Top Zip Codes with the Highest Percentage of Families with Income Above $100,000 in Lyon Mountain, NY?
Top Zip Codes with the Highest Percentage of Families with Income Above $100,000 in Lyon Mountain, NY are:
What zip code has the Highest Percentage of Families with Income Above $100,000 in Lyon Mountain, NY?
12955 has the Highest Percentage of Families with Income Above $100,000 in Lyon Mountain, NY with 29.4%.
What is the Percentage of Families with Income Above $100,000 in Lyon Mountain, NY?
Percentage of Families with Income Above $100,000 in Lyon Mountain is 9.8%.
What is the Percentage of Families with Income Above $100,000 in New York?
Percentage of Families with Income Above $100,000 in New York is 50.3%.
What is the Percentage of Families with Income Above $100,000 in the United States?
Percentage of Families with Income Above $100,000 in the United States is 46.1%.