East Shoreham, NY Map & Demographics
East Shoreham Map
East Shoreham Overview
$52,729
PER CAPITA INCOME
$171,042
AVG FAMILY INCOME
$164,214
AVG HOUSEHOLD INCOME
14.6%
WAGE / INCOME GAP [ % ]
85.4¢/ $1
WAGE / INCOME GAP [ $ ]
0.32
INEQUALITY / GINI INDEX
7,367
TOTAL POPULATION
3,832
MALE POPULATION
3,535
FEMALE POPULATION
108.40
MALES / 100 FEMALES
92.25
FEMALES / 100 MALES
37.1
MEDIAN AGE
3.7
AVG FAMILY SIZE
3.5
AVG HOUSEHOLD SIZE
3,724
LABOR FORCE [ PEOPLE ]
65.5%
PERCENT IN LABOR FORCE
3.7%
UNEMPLOYMENT RATE
Income in East Shoreham
Income Overview in East Shoreham
Per Capita Income in East Shoreham is $52,729, while median incomes of families and households are $171,042 and $164,214 respectively.
| Characteristic | Number | Measure |
| Per Capita Income | 7,367 | $52,729 |
| Median Family Income | 1,783 | $171,042 |
| Mean Family Income | 1,783 | $192,918 |
| Median Household Income | 2,050 | $164,214 |
| Mean Household Income | 2,050 | $185,684 |
| Income Deficit | 1,783 | $0 |
| Wage / Income Gap (%) | 7,367 | 14.59% |
| Wage / Income Gap ($) | 7,367 | 85.41¢ per $1 |
| Gini / Inequality Index | 7,367 | 0.32 |
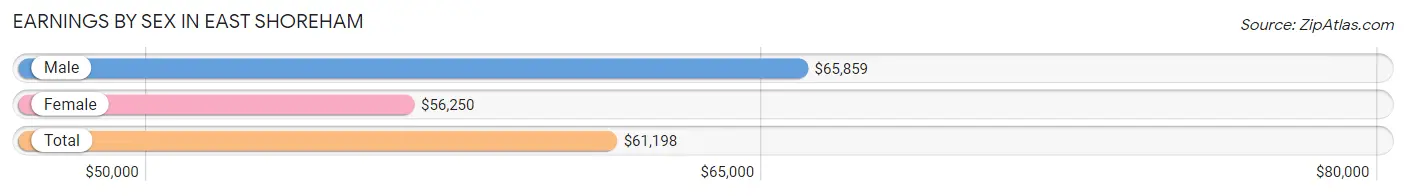
Earnings by Sex in East Shoreham
Average Earnings in East Shoreham are $61,198, $65,859 for men and $56,250 for women, a difference of 14.6%.
| Sex | Number | Average Earnings |
| Male | 2,348 (57.5%) | $65,859 |
| Female | 1,738 (42.5%) | $56,250 |
| Total | 4,086 (100.0%) | $61,198 |
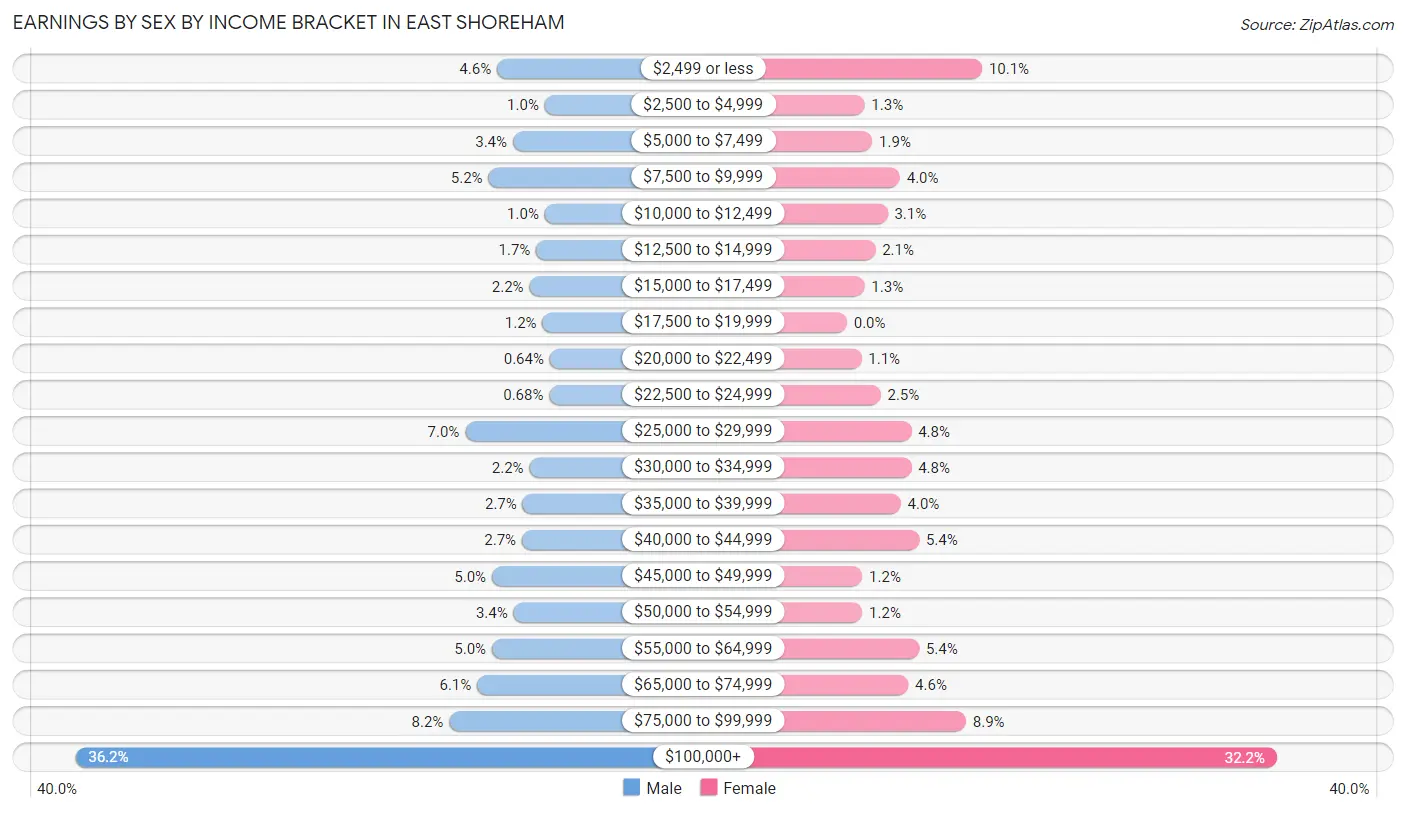
Earnings by Sex by Income Bracket in East Shoreham
The most common earnings brackets in East Shoreham are $100,000+ for men (850 | 36.2%) and $100,000+ for women (560 | 32.2%).
| Income | Male | Female |
| $2,499 or less | 108 (4.6%) | 176 (10.1%) |
| $2,500 to $4,999 | 24 (1.0%) | 23 (1.3%) |
| $5,000 to $7,499 | 80 (3.4%) | 33 (1.9%) |
| $7,500 to $9,999 | 123 (5.2%) | 69 (4.0%) |
| $10,000 to $12,499 | 24 (1.0%) | 53 (3.0%) |
| $12,500 to $14,999 | 39 (1.7%) | 37 (2.1%) |
| $15,000 to $17,499 | 51 (2.2%) | 23 (1.3%) |
| $17,500 to $19,999 | 28 (1.2%) | 0 (0.0%) |
| $20,000 to $22,499 | 15 (0.6%) | 19 (1.1%) |
| $22,500 to $24,999 | 16 (0.7%) | 44 (2.5%) |
| $25,000 to $29,999 | 164 (7.0%) | 84 (4.8%) |
| $30,000 to $34,999 | 51 (2.2%) | 84 (4.8%) |
| $35,000 to $39,999 | 63 (2.7%) | 70 (4.0%) |
| $40,000 to $44,999 | 64 (2.7%) | 94 (5.4%) |
| $45,000 to $49,999 | 117 (5.0%) | 20 (1.1%) |
| $50,000 to $54,999 | 79 (3.4%) | 20 (1.1%) |
| $55,000 to $64,999 | 117 (5.0%) | 94 (5.4%) |
| $65,000 to $74,999 | 143 (6.1%) | 80 (4.6%) |
| $75,000 to $99,999 | 192 (8.2%) | 155 (8.9%) |
| $100,000+ | 850 (36.2%) | 560 (32.2%) |
| Total | 2,348 (100.0%) | 1,738 (100.0%) |
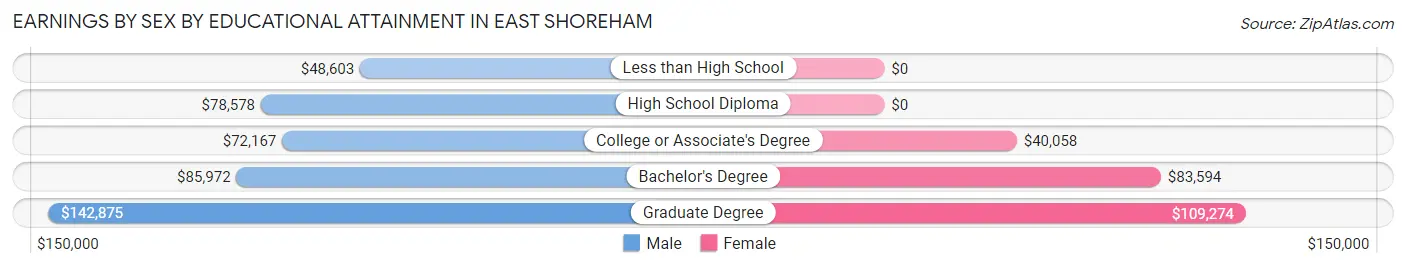
Earnings by Sex by Educational Attainment in East Shoreham
Average earnings in East Shoreham are $93,333 for men and $64,167 for women, a difference of 31.2%. Men with an educational attainment of graduate degree enjoy the highest average annual earnings of $142,875, while those with less than high school education earn the least with $48,603. Women with an educational attainment of graduate degree earn the most with the average annual earnings of $109,274, while those with college or associate's degree education have the smallest earnings of $40,058.
| Educational Attainment | Male Income | Female Income |
| Less than High School | $48,603 | $0 |
| High School Diploma | $78,578 | $0 |
| College or Associate's Degree | $72,167 | $40,058 |
| Bachelor's Degree | $85,972 | $83,594 |
| Graduate Degree | $142,875 | $109,274 |
| Total | $93,333 | $64,167 |
Family Income in East Shoreham
Family Income Brackets in East Shoreham
According to the East Shoreham family income data, there are 724 families falling into the $200,000+ income range, which is the most common income bracket and makes up 40.6% of all families.
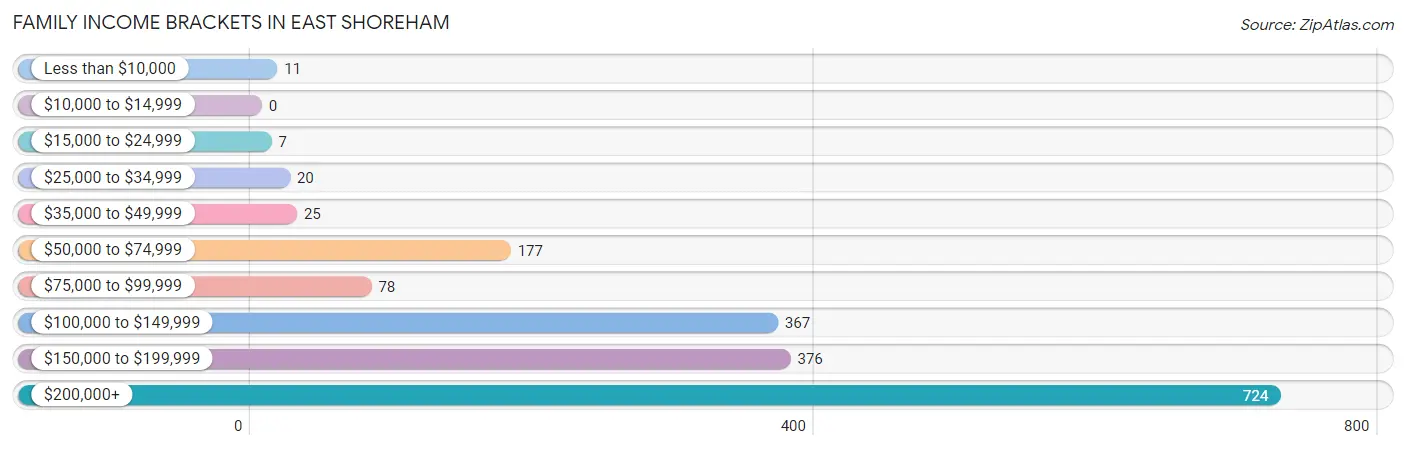
| Income Bracket | # Families | % Families |
| Less than $10,000 | 11 | 0.6% |
| $10,000 to $14,999 | 0 | 0.0% |
| $15,000 to $24,999 | 7 | 0.4% |
| $25,000 to $34,999 | 20 | 1.1% |
| $35,000 to $49,999 | 25 | 1.4% |
| $50,000 to $74,999 | 177 | 9.9% |
| $75,000 to $99,999 | 78 | 4.4% |
| $100,000 to $149,999 | 367 | 20.6% |
| $150,000 to $199,999 | 376 | 21.1% |
| $200,000+ | 724 | 40.6% |
Family Income by Famaliy Size in East Shoreham
6-person families (224 | 12.6%) account for the highest median family income in East Shoreham with $238,727 per family, while 2-person families (566 | 31.7%) have the highest median income of $73,542 per family member.
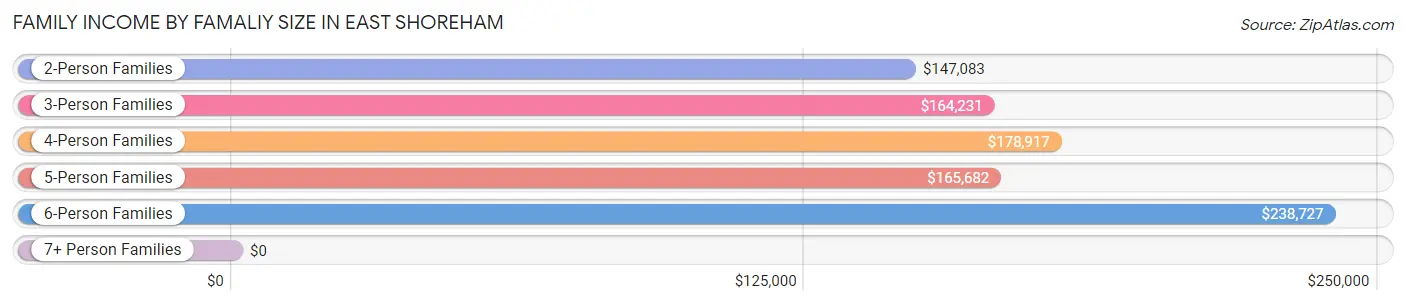
| Income Bracket | # Families | Median Income |
| 2-Person Families | 566 (31.7%) | $147,083 |
| 3-Person Families | 354 (19.9%) | $164,231 |
| 4-Person Families | 437 (24.5%) | $178,917 |
| 5-Person Families | 182 (10.2%) | $165,682 |
| 6-Person Families | 224 (12.6%) | $238,727 |
| 7+ Person Families | 20 (1.1%) | $0 |
| Total | 1,783 (100.0%) | $171,042 |
Family Income by Number of Earners in East Shoreham
The median family income in East Shoreham is $171,042, with families comprising 3+ earners (472) having the highest median family income of $237,977, while families with no earners (147) have the lowest median family income of $105,375, accounting for 26.5% and 8.2% of families, respectively.
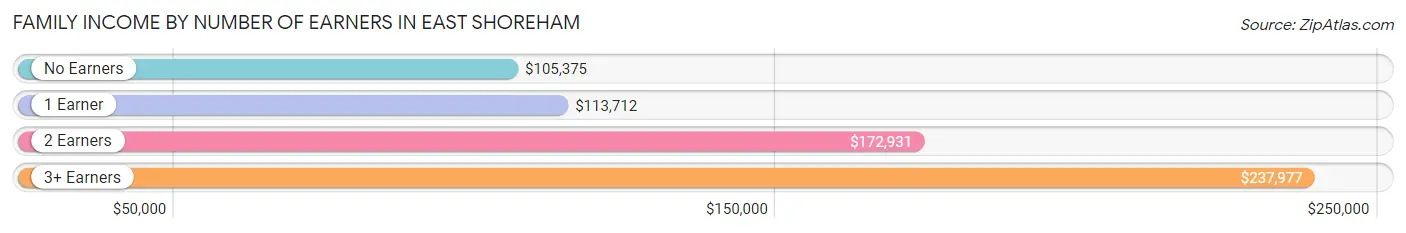
| Number of Earners | # Families | Median Income |
| No Earners | 147 (8.2%) | $105,375 |
| 1 Earner | 384 (21.5%) | $113,712 |
| 2 Earners | 780 (43.8%) | $172,931 |
| 3+ Earners | 472 (26.5%) | $237,977 |
| Total | 1,783 (100.0%) | $171,042 |
Household Income in East Shoreham
Household Income Brackets in East Shoreham
With 756 households falling in the category, the $200,000+ income range is the most frequent in East Shoreham, accounting for 36.9% of all households.
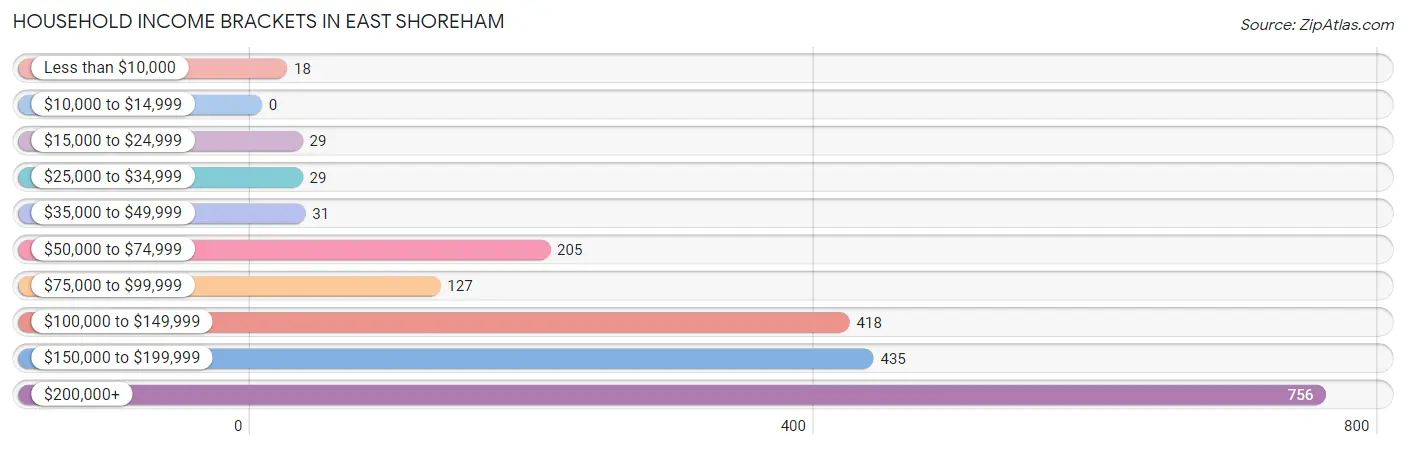
| Income Bracket | # Households | % Households |
| Less than $10,000 | 18 | 0.9% |
| $10,000 to $14,999 | 0 | 0.0% |
| $15,000 to $24,999 | 29 | 1.4% |
| $25,000 to $34,999 | 29 | 1.4% |
| $35,000 to $49,999 | 31 | 1.5% |
| $50,000 to $74,999 | 205 | 10.0% |
| $75,000 to $99,999 | 127 | 6.2% |
| $100,000 to $149,999 | 418 | 20.4% |
| $150,000 to $199,999 | 435 | 21.2% |
| $200,000+ | 756 | 36.9% |
Household Income by Householder Age in East Shoreham
The median household income in East Shoreham is $164,214, with the highest median household income of $181,136 found in the 25 to 44 years age bracket for the primary householder. A total of 612 households (29.8%) fall into this category.
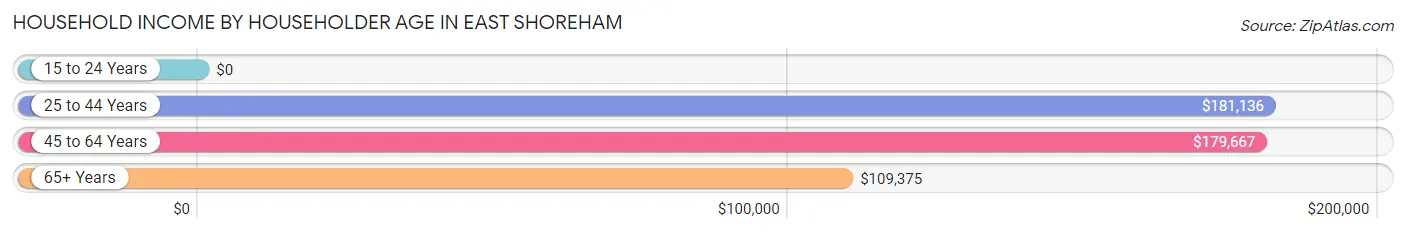
| Income Bracket | # Households | Median Income |
| 15 to 24 Years | 0 (0.0%) | $0 |
| 25 to 44 Years | 612 (29.8%) | $181,136 |
| 45 to 64 Years | 982 (47.9%) | $179,667 |
| 65+ Years | 456 (22.2%) | $109,375 |
| Total | 2,050 (100.0%) | $164,214 |
Poverty in East Shoreham
Income Below Poverty by Sex and Age in East Shoreham
With 2.5% poverty level for males and 2.9% for females among the residents of East Shoreham, 55 to 64 year old males and 75 year old and over females are the most vulnerable to poverty, with 46 males (8.1%) and 18 females (13.4%) in their respective age groups living below the poverty level.
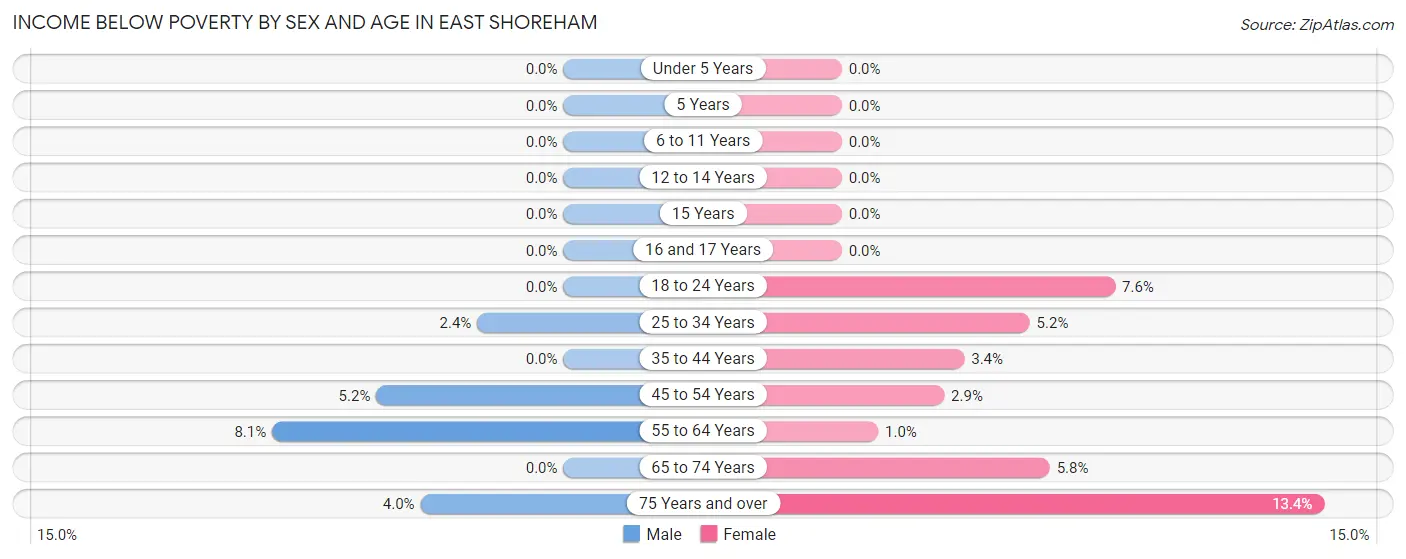
| Age Bracket | Male | Female |
| Under 5 Years | 0 (0.0%) | 0 (0.0%) |
| 5 Years | 0 (0.0%) | 0 (0.0%) |
| 6 to 11 Years | 0 (0.0%) | 0 (0.0%) |
| 12 to 14 Years | 0 (0.0%) | 0 (0.0%) |
| 15 Years | 0 (0.0%) | 0 (0.0%) |
| 16 and 17 Years | 0 (0.0%) | 0 (0.0%) |
| 18 to 24 Years | 0 (0.0%) | 15 (7.6%) |
| 25 to 34 Years | 10 (2.4%) | 17 (5.2%) |
| 35 to 44 Years | 0 (0.0%) | 20 (3.4%) |
| 45 to 54 Years | 32 (5.2%) | 10 (2.9%) |
| 55 to 64 Years | 46 (8.1%) | 6 (1.0%) |
| 65 to 74 Years | 0 (0.0%) | 15 (5.8%) |
| 75 Years and over | 7 (4.0%) | 18 (13.4%) |
| Total | 95 (2.5%) | 101 (2.9%) |
Income Above Poverty by Sex and Age in East Shoreham
According to the poverty statistics in East Shoreham, males aged under 5 years and females aged under 5 years are the age groups that are most secure financially, with 100.0% of males and 100.0% of females in these age groups living above the poverty line.
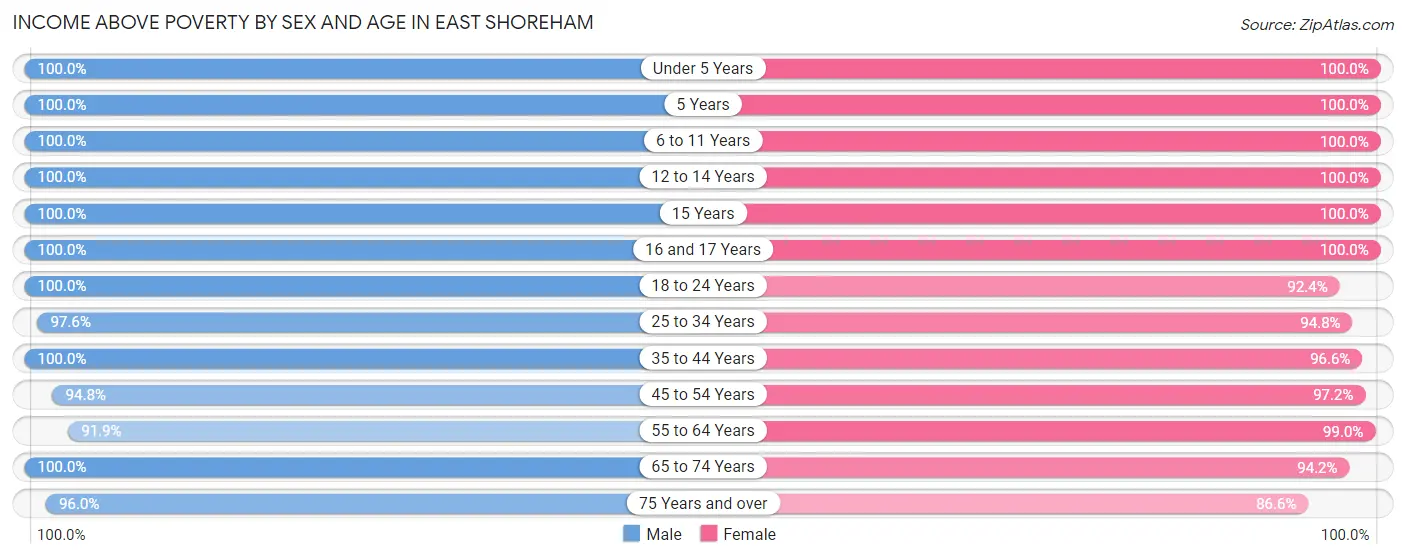
| Age Bracket | Male | Female |
| Under 5 Years | 183 (100.0%) | 79 (100.0%) |
| 5 Years | 31 (100.0%) | 25 (100.0%) |
| 6 to 11 Years | 270 (100.0%) | 450 (100.0%) |
| 12 to 14 Years | 169 (100.0%) | 348 (100.0%) |
| 15 Years | 14 (100.0%) | 89 (100.0%) |
| 16 and 17 Years | 143 (100.0%) | 73 (100.0%) |
| 18 to 24 Years | 683 (100.0%) | 182 (92.4%) |
| 25 to 34 Years | 406 (97.6%) | 308 (94.8%) |
| 35 to 44 Years | 327 (100.0%) | 566 (96.6%) |
| 45 to 54 Years | 582 (94.8%) | 341 (97.2%) |
| 55 to 64 Years | 521 (91.9%) | 590 (99.0%) |
| 65 to 74 Years | 239 (100.0%) | 244 (94.2%) |
| 75 Years and over | 169 (96.0%) | 116 (86.6%) |
| Total | 3,737 (97.5%) | 3,411 (97.1%) |
Income Below Poverty Among Married-Couple Families in East Shoreham
The poverty statistics for married-couple families in East Shoreham show that 1.1% or 17 of the total 1,569 families live below the poverty line. Families with no children have the highest poverty rate of 2.1%, comprising of 17 families. On the other hand, families with 1 or 2 children have the lowest poverty rate of 0.0%, which includes 0 families.
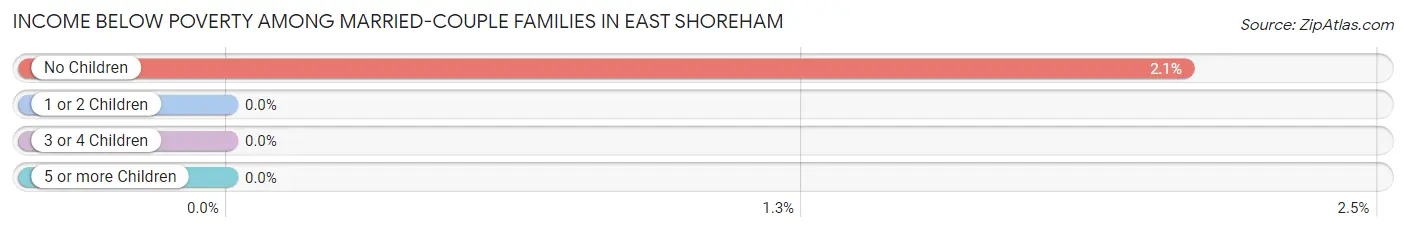
| Children | Above Poverty | Below Poverty |
| No Children | 800 (97.9%) | 17 (2.1%) |
| 1 or 2 Children | 464 (100.0%) | 0 (0.0%) |
| 3 or 4 Children | 288 (100.0%) | 0 (0.0%) |
| 5 or more Children | 0 (0.0%) | 0 (0.0%) |
| Total | 1,552 (98.9%) | 17 (1.1%) |
Income Below Poverty Among Single-Parent Households in East Shoreham
| Children | Single Father | Single Mother |
| No Children | 0 (0.0%) | 0 (0.0%) |
| 1 or 2 Children | 0 (0.0%) | 0 (0.0%) |
| 3 or 4 Children | 0 (0.0%) | 0 (0.0%) |
| 5 or more Children | 0 (0.0%) | 0 (0.0%) |
| Total | 0 (0.0%) | 0 (0.0%) |
Income Below Poverty Among Married-Couple vs Single-Parent Households in East Shoreham
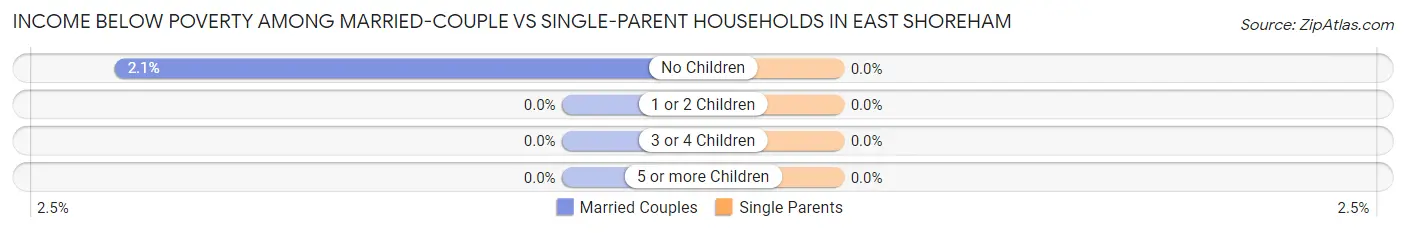
| Children | Married-Couple Families | Single-Parent Households |
| No Children | 17 (2.1%) | 0 (0.0%) |
| 1 or 2 Children | 0 (0.0%) | 0 (0.0%) |
| 3 or 4 Children | 0 (0.0%) | 0 (0.0%) |
| 5 or more Children | 0 (0.0%) | 0 (0.0%) |
| Total | 17 (1.1%) | 0 (0.0%) |
Race in East Shoreham
The most populous races in East Shoreham are White / Caucasian (6,349 | 86.2%), Hispanic or Latino (829 | 11.3%), and Two or more Races (411 | 5.6%).
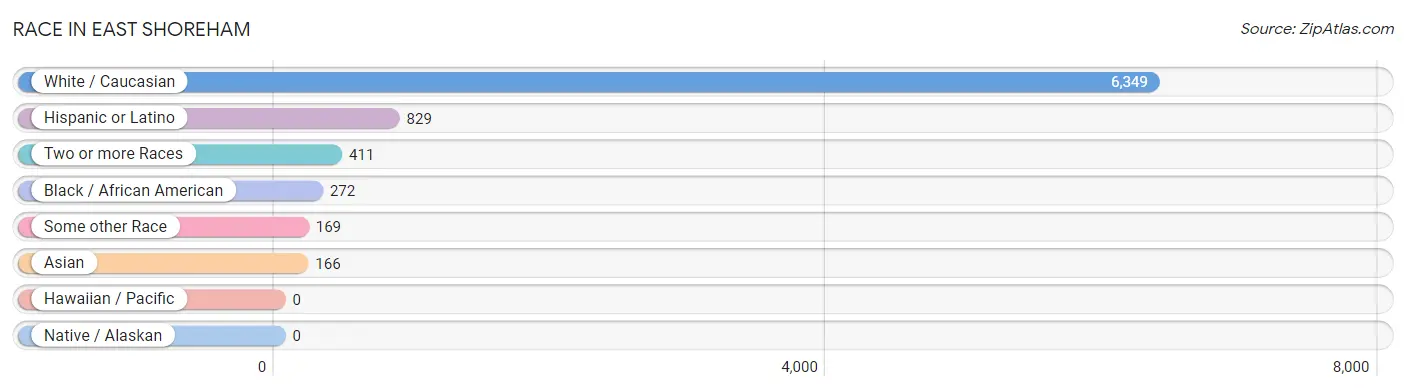
| Race | # Population | % Population |
| Asian | 166 | 2.2% |
| Black / African American | 272 | 3.7% |
| Hawaiian / Pacific | 0 | 0.0% |
| Hispanic or Latino | 829 | 11.3% |
| Native / Alaskan | 0 | 0.0% |
| White / Caucasian | 6,349 | 86.2% |
| Two or more Races | 411 | 5.6% |
| Some other Race | 169 | 2.3% |
| Total | 7,367 | 100.0% |
Ancestry in East Shoreham
The most populous ancestries reported in East Shoreham are Irish (1,960 | 26.6%), Italian (1,482 | 20.1%), German (1,129 | 15.3%), English (704 | 9.6%), and American (434 | 5.9%), together accounting for 77.5% of all East Shoreham residents.
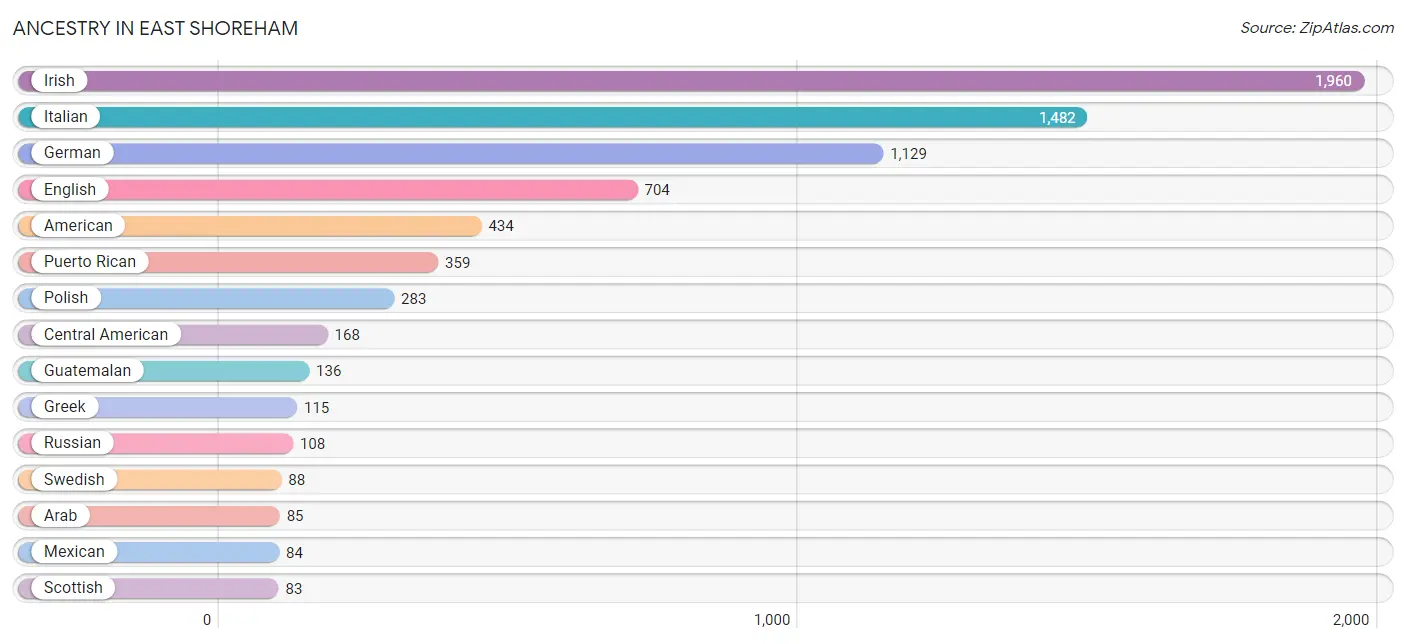
| Ancestry | # Population | % Population |
| American | 434 | 5.9% |
| Arab | 85 | 1.1% |
| British | 17 | 0.2% |
| Burmese | 12 | 0.2% |
| Canadian | 6 | 0.1% |
| Central American | 168 | 2.3% |
| Cuban | 47 | 0.6% |
| Dominican | 40 | 0.5% |
| Dutch | 10 | 0.1% |
| Ecuadorian | 53 | 0.7% |
| Egyptian | 62 | 0.8% |
| English | 704 | 9.6% |
| European | 47 | 0.6% |
| Filipino | 3 | 0.0% |
| Finnish | 48 | 0.6% |
| French | 49 | 0.7% |
| French Canadian | 20 | 0.3% |
| German | 1,129 | 15.3% |
| Greek | 115 | 1.6% |
| Guatemalan | 136 | 1.8% |
| Haitian | 1 | 0.0% |
| Honduran | 32 | 0.4% |
| Hungarian | 75 | 1.0% |
| Iranian | 23 | 0.3% |
| Irish | 1,960 | 26.6% |
| Italian | 1,482 | 20.1% |
| Korean | 34 | 0.5% |
| Lebanese | 23 | 0.3% |
| Lithuanian | 14 | 0.2% |
| Mexican | 84 | 1.1% |
| Norwegian | 67 | 0.9% |
| Polish | 283 | 3.8% |
| Portuguese | 13 | 0.2% |
| Puerto Rican | 359 | 4.9% |
| Romanian | 8 | 0.1% |
| Russian | 108 | 1.5% |
| Scandinavian | 43 | 0.6% |
| Scotch-Irish | 18 | 0.2% |
| Scottish | 83 | 1.1% |
| Slovak | 14 | 0.2% |
| South American | 53 | 0.7% |
| Spanish | 50 | 0.7% |
| Swedish | 88 | 1.2% |
| Thai | 33 | 0.4% |
| Turkish | 19 | 0.3% |
| Ukrainian | 63 | 0.9% |
| Welsh | 70 | 0.9% | View All 47 Rows |
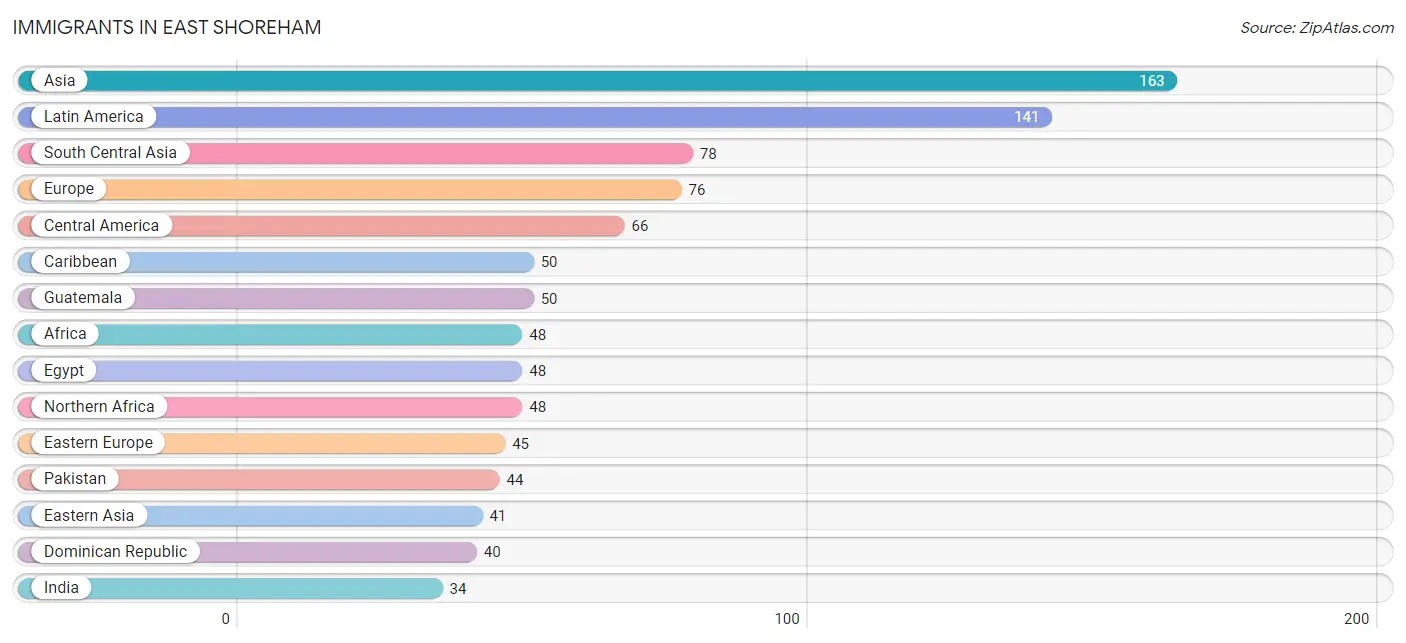
Immigrants in East Shoreham
The most numerous immigrant groups reported in East Shoreham came from Asia (163 | 2.2%), Latin America (141 | 1.9%), South Central Asia (78 | 1.1%), Europe (76 | 1.0%), and Central America (66 | 0.9%), together accounting for 7.1% of all East Shoreham residents.
| Immigration Origin | # Population | % Population |
| Africa | 48 | 0.6% |
| Asia | 163 | 2.2% |
| Brazil | 15 | 0.2% |
| Caribbean | 50 | 0.7% |
| Central America | 66 | 0.9% |
| China | 29 | 0.4% |
| Croatia | 10 | 0.1% |
| Dominican Republic | 40 | 0.5% |
| Eastern Asia | 41 | 0.6% |
| Eastern Europe | 45 | 0.6% |
| Egypt | 48 | 0.6% |
| England | 6 | 0.1% |
| Europe | 76 | 1.0% |
| Guatemala | 50 | 0.7% |
| Guyana | 10 | 0.1% |
| Haiti | 1 | 0.0% |
| Honduras | 7 | 0.1% |
| Hong Kong | 12 | 0.2% |
| India | 34 | 0.5% |
| Ireland | 15 | 0.2% |
| Korea | 12 | 0.2% |
| Latin America | 141 | 1.9% |
| Lebanon | 14 | 0.2% |
| Mexico | 9 | 0.1% |
| Northern Africa | 48 | 0.6% |
| Northern Europe | 31 | 0.4% |
| Pakistan | 44 | 0.6% |
| Philippines | 13 | 0.2% |
| Poland | 24 | 0.3% |
| Romania | 11 | 0.2% |
| South America | 25 | 0.3% |
| South Central Asia | 78 | 1.1% |
| South Eastern Asia | 13 | 0.2% |
| Taiwan | 3 | 0.0% |
| Trinidad and Tobago | 9 | 0.1% |
| Turkey | 17 | 0.2% |
| Western Asia | 31 | 0.4% | View All 37 Rows |
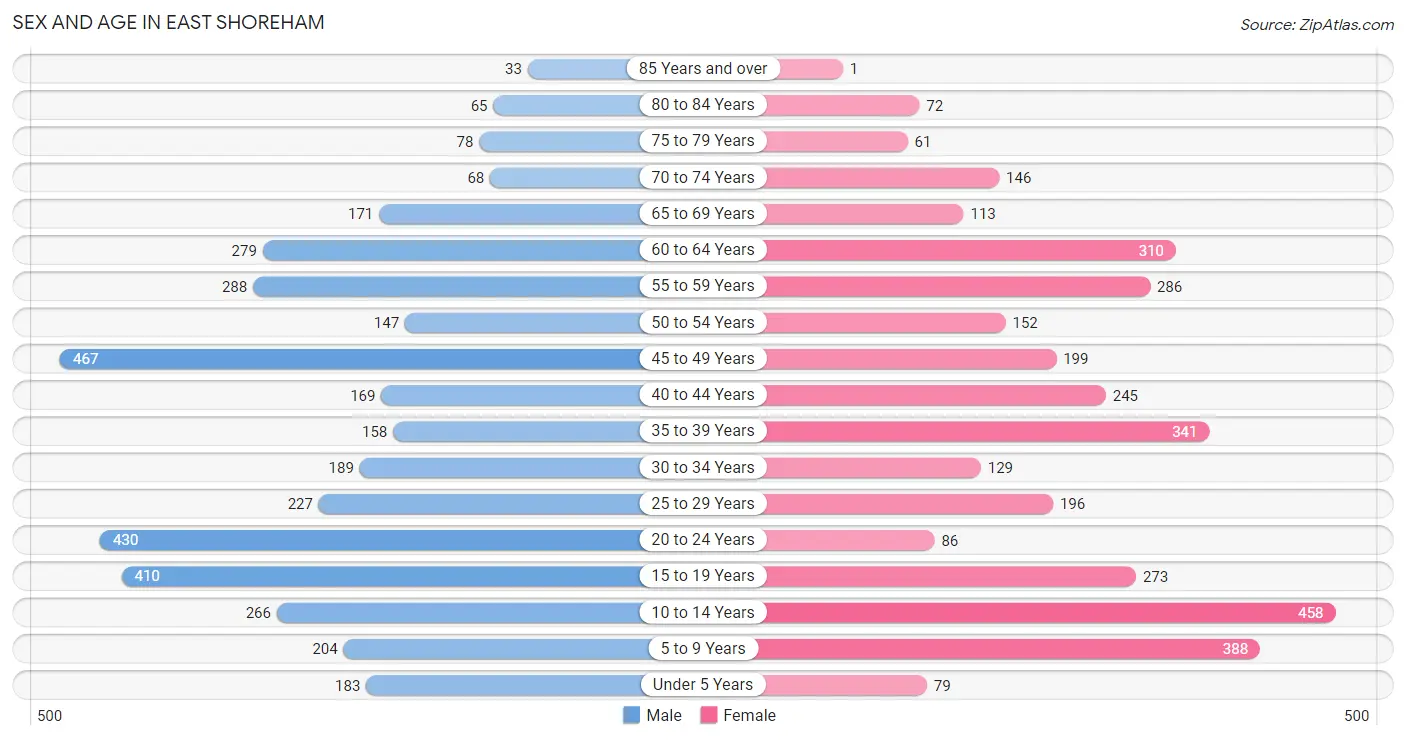
Sex and Age in East Shoreham
Sex and Age in East Shoreham
The most populous age groups in East Shoreham are 45 to 49 Years (467 | 12.2%) for men and 10 to 14 Years (458 | 13.0%) for women.
| Age Bracket | Male | Female |
| Under 5 Years | 183 (4.8%) | 79 (2.2%) |
| 5 to 9 Years | 204 (5.3%) | 388 (11.0%) |
| 10 to 14 Years | 266 (6.9%) | 458 (13.0%) |
| 15 to 19 Years | 410 (10.7%) | 273 (7.7%) |
| 20 to 24 Years | 430 (11.2%) | 86 (2.4%) |
| 25 to 29 Years | 227 (5.9%) | 196 (5.5%) |
| 30 to 34 Years | 189 (4.9%) | 129 (3.6%) |
| 35 to 39 Years | 158 (4.1%) | 341 (9.7%) |
| 40 to 44 Years | 169 (4.4%) | 245 (6.9%) |
| 45 to 49 Years | 467 (12.2%) | 199 (5.6%) |
| 50 to 54 Years | 147 (3.8%) | 152 (4.3%) |
| 55 to 59 Years | 288 (7.5%) | 286 (8.1%) |
| 60 to 64 Years | 279 (7.3%) | 310 (8.8%) |
| 65 to 69 Years | 171 (4.5%) | 113 (3.2%) |
| 70 to 74 Years | 68 (1.8%) | 146 (4.1%) |
| 75 to 79 Years | 78 (2.0%) | 61 (1.7%) |
| 80 to 84 Years | 65 (1.7%) | 72 (2.0%) |
| 85 Years and over | 33 (0.9%) | 1 (0.0%) |
| Total | 3,832 (100.0%) | 3,535 (100.0%) |
Families and Households in East Shoreham
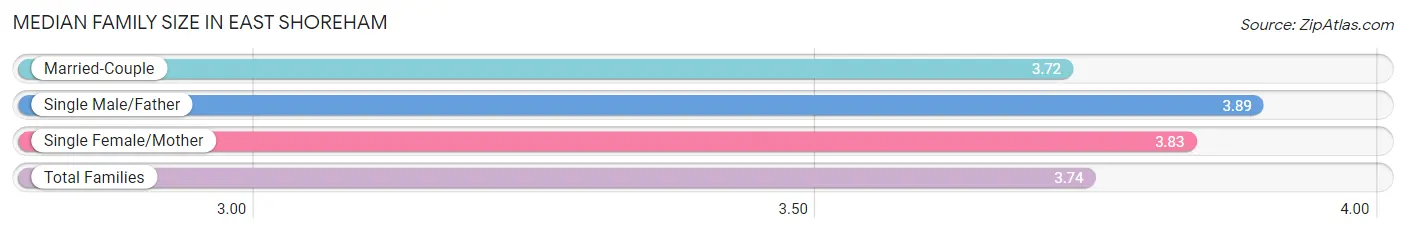
Median Family Size in East Shoreham
The median family size in East Shoreham is 3.74 persons per family, with single male/father families (45 | 2.5%) accounting for the largest median family size of 3.89 persons per family. On the other hand, married-couple families (1,569 | 88.0%) represent the smallest median family size with 3.72 persons per family.
| Family Type | # Families | Family Size |
| Married-Couple | 1,569 (88.0%) | 3.72 |
| Single Male/Father | 45 (2.5%) | 3.89 |
| Single Female/Mother | 169 (9.5%) | 3.83 |
| Total Families | 1,783 (100.0%) | 3.74 |
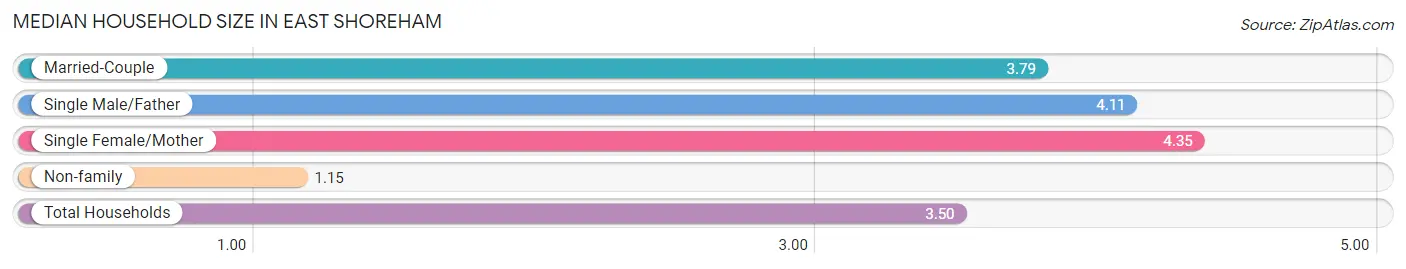
Median Household Size in East Shoreham
The median household size in East Shoreham is 3.50 persons per household, with single female/mother households (169 | 8.2%) accounting for the largest median household size of 4.35 persons per household. non-family households (267 | 13.0%) represent the smallest median household size with 1.15 persons per household.
| Household Type | # Households | Household Size |
| Married-Couple | 1,569 (76.5%) | 3.79 |
| Single Male/Father | 45 (2.2%) | 4.11 |
| Single Female/Mother | 169 (8.2%) | 4.35 |
| Non-family | 267 (13.0%) | 1.15 |
| Total Households | 2,050 (100.0%) | 3.50 |
Household Size by Marriage Status in East Shoreham
Out of a total of 2,050 households in East Shoreham, 1,783 (87.0%) are family households, while 267 (13.0%) are nonfamily households. The most numerous type of family households are 2-person households, comprising 556, and the most common type of nonfamily households are 1-person households, comprising 232.
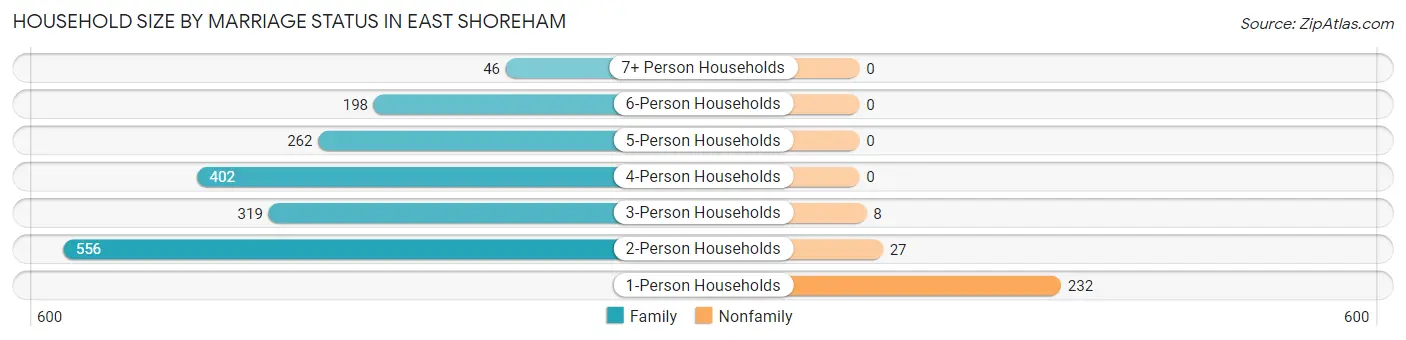
| Household Size | Family Households | Nonfamily Households |
| 1-Person Households | - | 232 (11.3%) |
| 2-Person Households | 556 (27.1%) | 27 (1.3%) |
| 3-Person Households | 319 (15.6%) | 8 (0.4%) |
| 4-Person Households | 402 (19.6%) | 0 (0.0%) |
| 5-Person Households | 262 (12.8%) | 0 (0.0%) |
| 6-Person Households | 198 (9.7%) | 0 (0.0%) |
| 7+ Person Households | 46 (2.2%) | 0 (0.0%) |
| Total | 1,783 (87.0%) | 267 (13.0%) |
Female Fertility in East Shoreham
Fertility by Age in East Shoreham
Average fertility rate in East Shoreham is 38.0 births per 1,000 women. Women in the age bracket of 35 to 50 years have the highest fertility rate with 70.0 births per 1,000 women. Women in the age bracket of 35 to 50 years acount for 100.0% of all women with births.
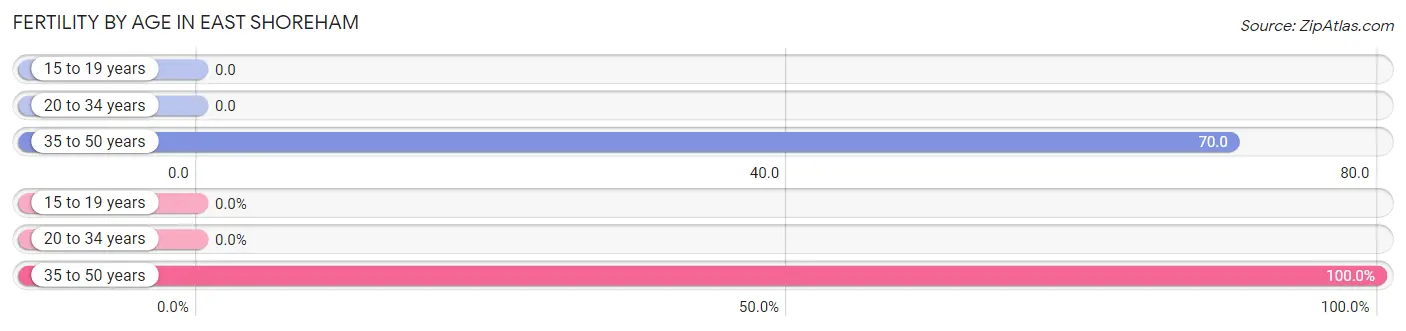
| Age Bracket | Women with Births | Births / 1,000 Women |
| 15 to 19 years | 0 (0.0%) | 0.0 |
| 20 to 34 years | 0 (0.0%) | 0.0 |
| 35 to 50 years | 57 (100.0%) | 70.0 |
| Total | 57 (100.0%) | 38.0 |
Fertility by Age by Marriage Status in East Shoreham
21.1% of women with births (57) in East Shoreham are married. The highest percentage of unmarried women with births falls into 35 to 50 years age bracket with 78.9% of them unmarried at the time of birth, while the lowest percentage of unmarried women with births belong to 35 to 50 years age bracket with 78.9% of them unmarried.
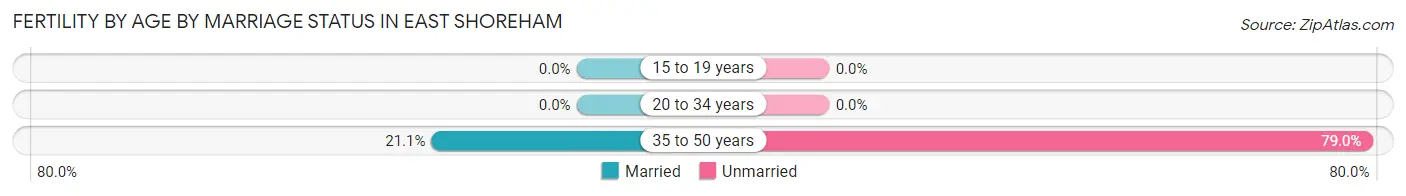
| Age Bracket | Married | Unmarried |
| 15 to 19 years | 0 (0.0%) | 0 (0.0%) |
| 20 to 34 years | 0 (0.0%) | 0 (0.0%) |
| 35 to 50 years | 12 (21.0%) | 45 (78.9%) |
| Total | 12 (21.0%) | 45 (78.9%) |
Fertility by Education in East Shoreham
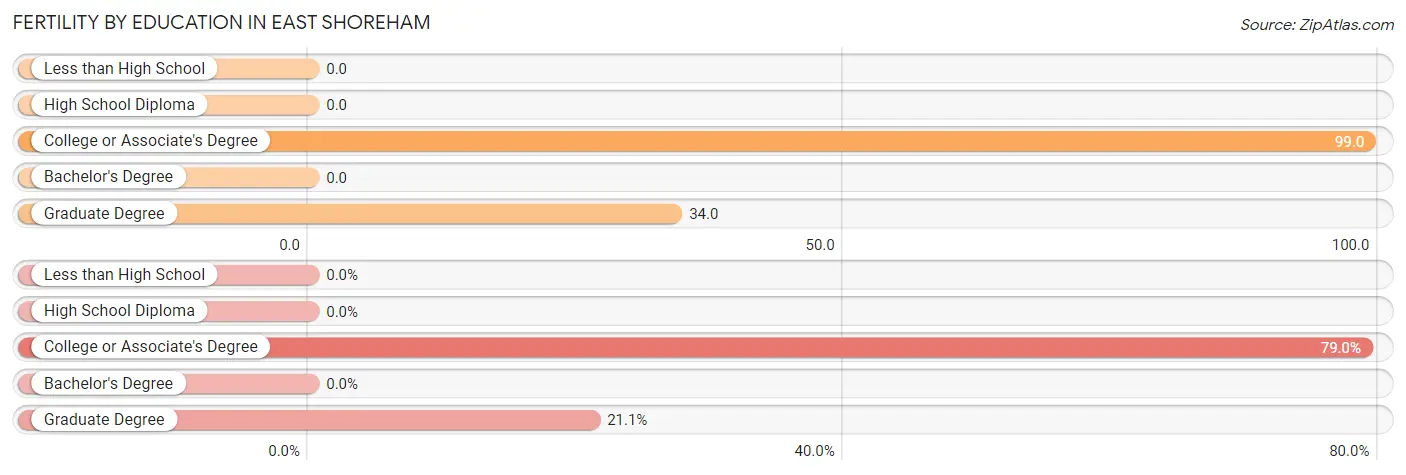
| Educational Attainment | Women with Births | Births / 1,000 Women |
| Less than High School | 0 (0.0%) | 0.0 |
| High School Diploma | 0 (0.0%) | 0.0 |
| College or Associate's Degree | 45 (78.9%) | 99.0 |
| Bachelor's Degree | 0 (0.0%) | 0.0 |
| Graduate Degree | 12 (21.0%) | 34.0 |
| Total | 57 (100.0%) | 38.0 |
Fertility by Education by Marriage Status in East Shoreham
78.9% of women with births in East Shoreham are unmarried. Women with the educational attainment of college or associate's degree are most likely to be married with 26.7% of them married at childbirth, while women with the educational attainment of graduate degree are least likely to be married with 100.0% of them unmarried at childbirth.
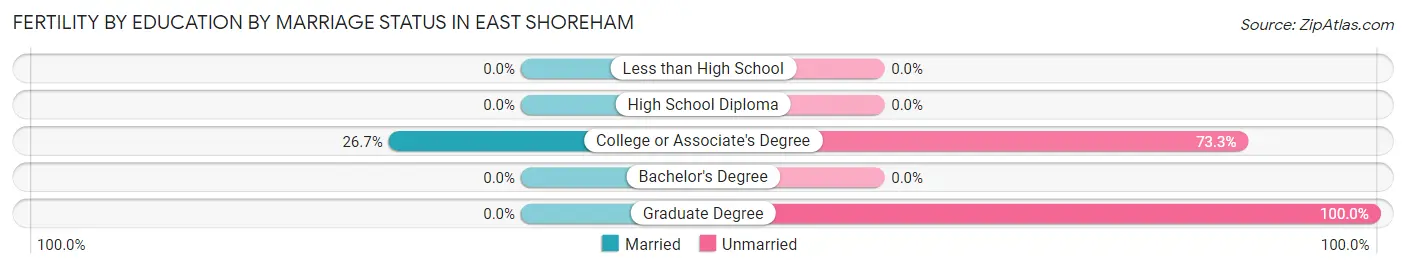
| Educational Attainment | Married | Unmarried |
| Less than High School | 0 (0.0%) | 0 (0.0%) |
| High School Diploma | 0 (0.0%) | 0 (0.0%) |
| College or Associate's Degree | 12 (26.7%) | 33 (73.3%) |
| Bachelor's Degree | 0 (0.0%) | 0 (0.0%) |
| Graduate Degree | 0 (0.0%) | 12 (100.0%) |
| Total | 12 (21.0%) | 45 (78.9%) |
Employment Characteristics in East Shoreham
Employment by Class of Employer in East Shoreham
Among the 3,494 employed individuals in East Shoreham, private company employees (1,860 | 53.2%), local government employees (701 | 20.1%), and not-for-profit organizations (352 | 10.1%) make up the most common classes of employment.
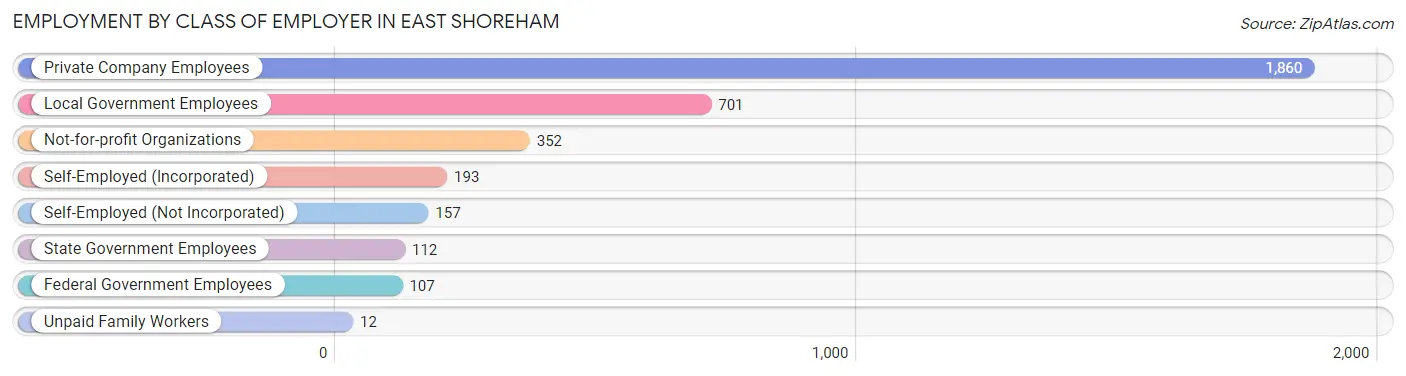
| Employer Class | # Employees | % Employees |
| Private Company Employees | 1,860 | 53.2% |
| Self-Employed (Incorporated) | 193 | 5.5% |
| Self-Employed (Not Incorporated) | 157 | 4.5% |
| Not-for-profit Organizations | 352 | 10.1% |
| Local Government Employees | 701 | 20.1% |
| State Government Employees | 112 | 3.2% |
| Federal Government Employees | 107 | 3.1% |
| Unpaid Family Workers | 12 | 0.3% |
| Total | 3,494 | 100.0% |
Employment Status by Age in East Shoreham
According to the labor force statistics for East Shoreham, out of the total population over 16 years of age (5,686), 65.5% or 3,724 individuals are in the labor force, with 3.7% or 138 of them unemployed. The age group with the highest labor force participation rate is 45 to 54 years, with 92.3% or 891 individuals in the labor force. Within the labor force, the 20 to 24 years age range has the highest percentage of unemployed individuals, with 18.8% or 77 of them being unemployed.
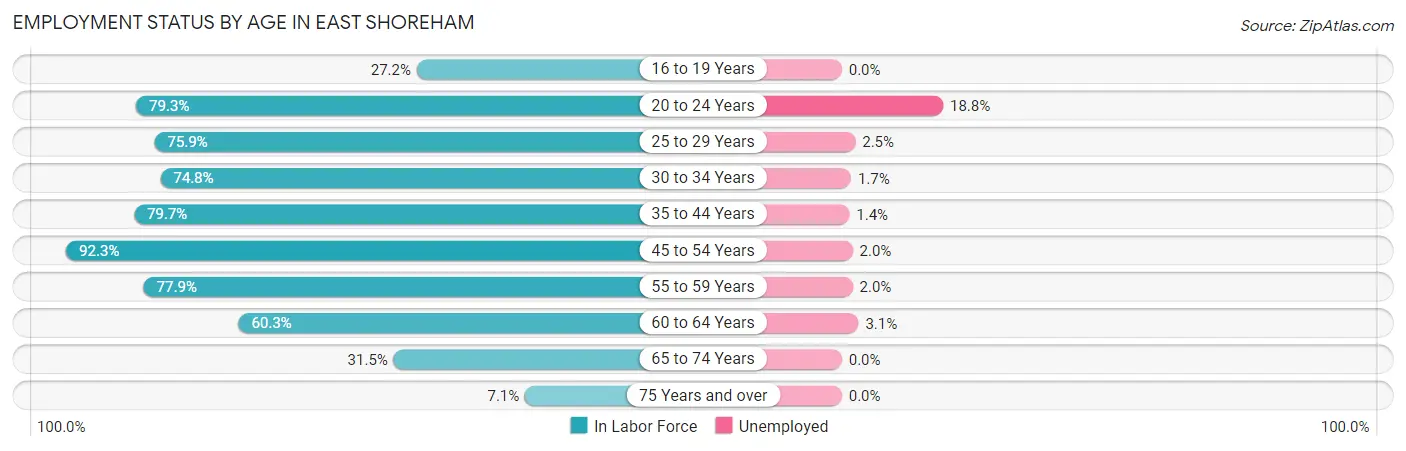
| Age Bracket | In Labor Force | Unemployed |
| 16 to 19 Years | 158 (27.2%) | 0 (0.0%) |
| 20 to 24 Years | 409 (79.3%) | 77 (18.8%) |
| 25 to 29 Years | 321 (75.9%) | 8 (2.5%) |
| 30 to 34 Years | 238 (74.8%) | 4 (1.7%) |
| 35 to 44 Years | 728 (79.7%) | 10 (1.4%) |
| 45 to 54 Years | 891 (92.3%) | 18 (2.0%) |
| 55 to 59 Years | 447 (77.9%) | 9 (2.0%) |
| 60 to 64 Years | 355 (60.3%) | 11 (3.1%) |
| 65 to 74 Years | 157 (31.5%) | 0 (0.0%) |
| 75 Years and over | 22 (7.1%) | 0 (0.0%) |
| Total | 3,724 (65.5%) | 138 (3.7%) |
Employment Status by Educational Attainment in East Shoreham
According to labor force statistics for East Shoreham, 78.8% of individuals (2,980) out of the total population between 25 and 64 years of age (3,782) are in the labor force, with 2.0% or 60 of them being unemployed. The group with the highest labor force participation rate are those with the educational attainment of bachelor's degree or higher, with 90.6% or 1,603 individuals in the labor force. Within the labor force, individuals with high school diploma education have the highest percentage of unemployment, with 4.7% or 30 of them being unemployed.
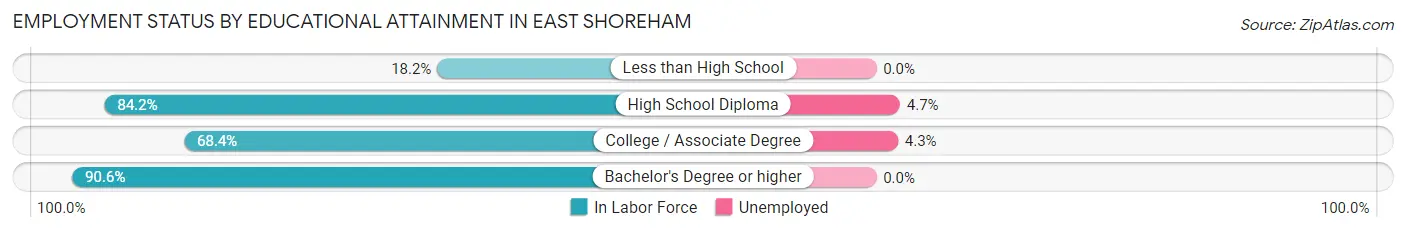
| Educational Attainment | In Labor Force | Unemployed |
| Less than High School | 43 (18.2%) | 0 (0.0%) |
| High School Diploma | 638 (84.2%) | 36 (4.7%) |
| College / Associate Degree | 697 (68.4%) | 44 (4.3%) |
| Bachelor's Degree or higher | 1,603 (90.6%) | 0 (0.0%) |
| Total | 2,980 (78.8%) | 76 (2.0%) |
Employment Occupations by Sex in East Shoreham
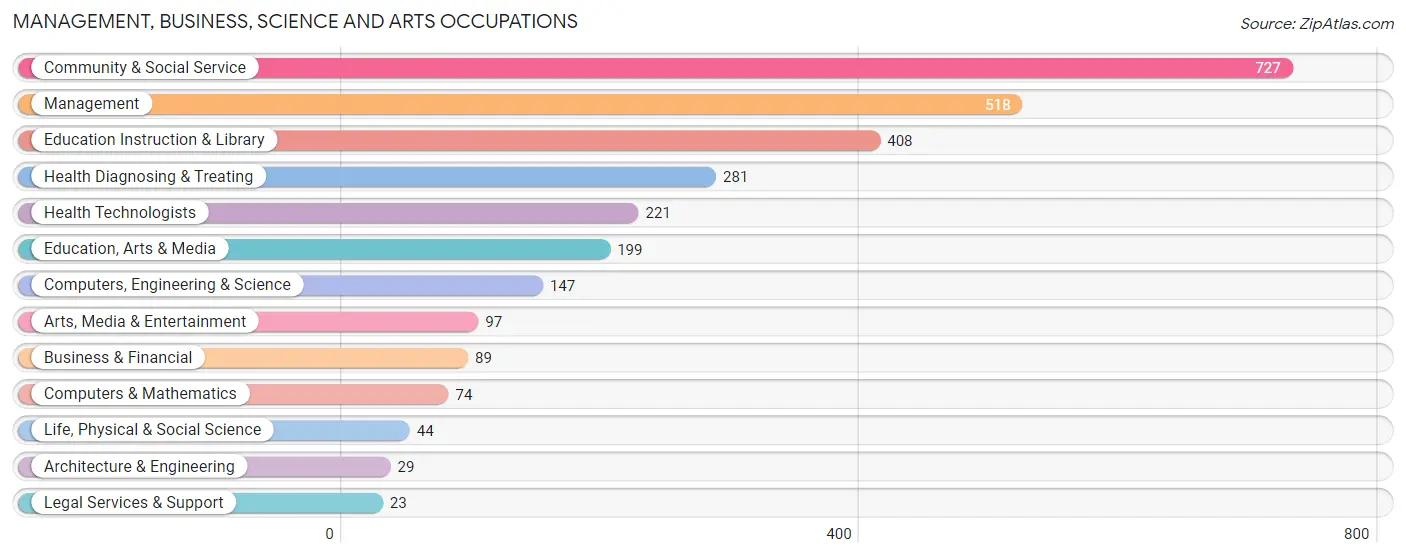
Management, Business, Science and Arts Occupations
The most common Management, Business, Science and Arts occupations in East Shoreham are Community & Social Service (727 | 20.3%), Management (518 | 14.4%), Education Instruction & Library (408 | 11.4%), Health Diagnosing & Treating (281 | 7.8%), and Health Technologists (221 | 6.2%).
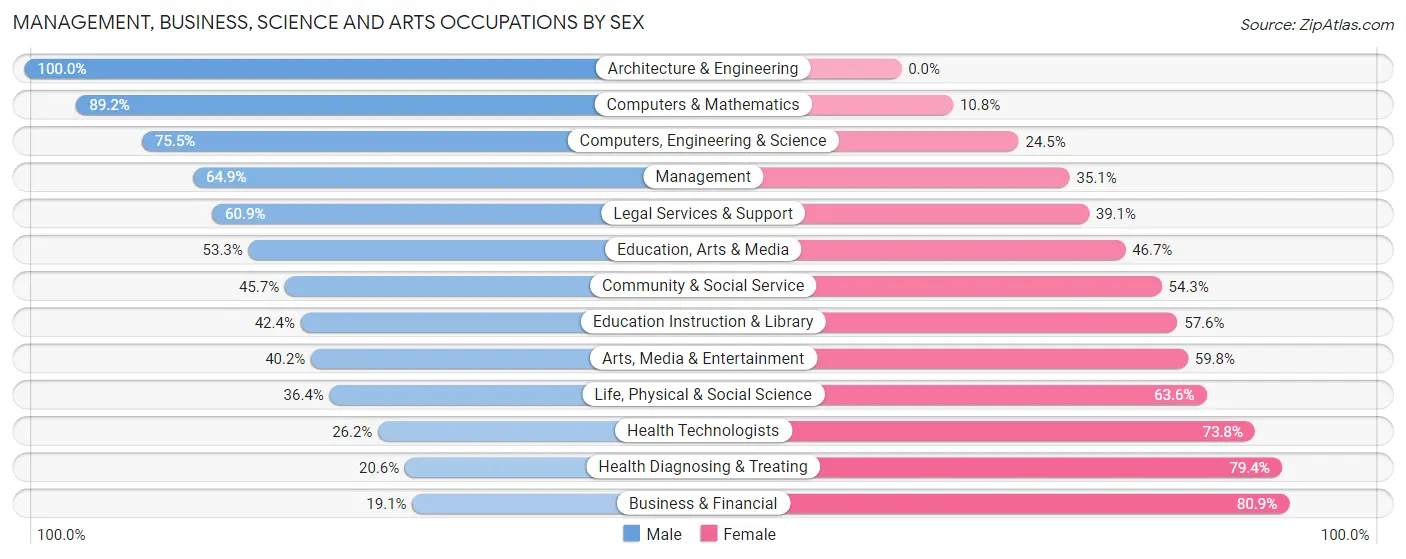
Management, Business, Science and Arts Occupations by Sex
Within the Management, Business, Science and Arts occupations in East Shoreham, the most male-oriented occupations are Architecture & Engineering (100.0%), Computers & Mathematics (89.2%), and Computers, Engineering & Science (75.5%), while the most female-oriented occupations are Business & Financial (80.9%), Health Diagnosing & Treating (79.4%), and Health Technologists (73.8%).
| Occupation | Male | Female |
| Management | 336 (64.9%) | 182 (35.1%) |
| Business & Financial | 17 (19.1%) | 72 (80.9%) |
| Computers, Engineering & Science | 111 (75.5%) | 36 (24.5%) |
| Computers & Mathematics | 66 (89.2%) | 8 (10.8%) |
| Architecture & Engineering | 29 (100.0%) | 0 (0.0%) |
| Life, Physical & Social Science | 16 (36.4%) | 28 (63.6%) |
| Community & Social Service | 332 (45.7%) | 395 (54.3%) |
| Education, Arts & Media | 106 (53.3%) | 93 (46.7%) |
| Legal Services & Support | 14 (60.9%) | 9 (39.1%) |
| Education Instruction & Library | 173 (42.4%) | 235 (57.6%) |
| Arts, Media & Entertainment | 39 (40.2%) | 58 (59.8%) |
| Health Diagnosing & Treating | 58 (20.6%) | 223 (79.4%) |
| Health Technologists | 58 (26.2%) | 163 (73.8%) |
| Total (Category) | 854 (48.5%) | 908 (51.5%) |
| Total (Overall) | 2,092 (58.3%) | 1,497 (41.7%) |
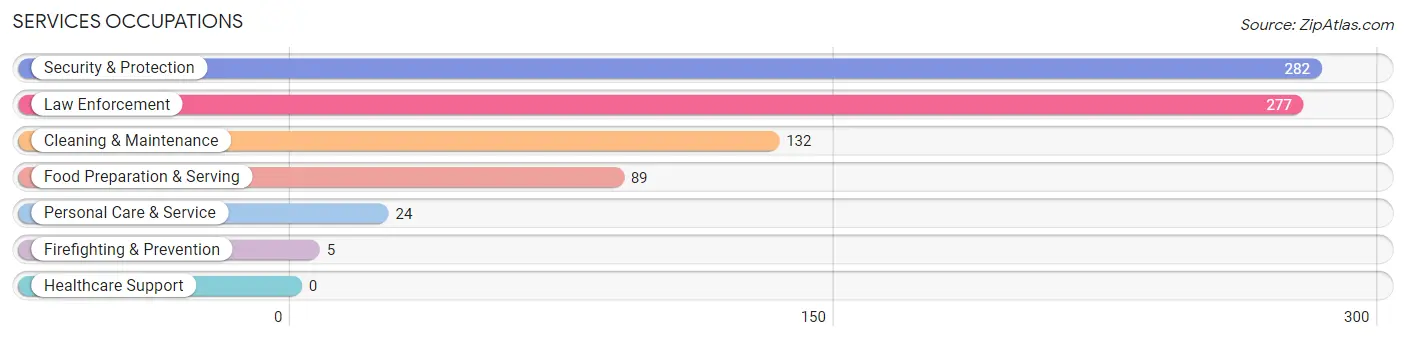
Services Occupations
The most common Services occupations in East Shoreham are Security & Protection (282 | 7.9%), Law Enforcement (277 | 7.7%), Cleaning & Maintenance (132 | 3.7%), Food Preparation & Serving (89 | 2.5%), and Personal Care & Service (24 | 0.7%).
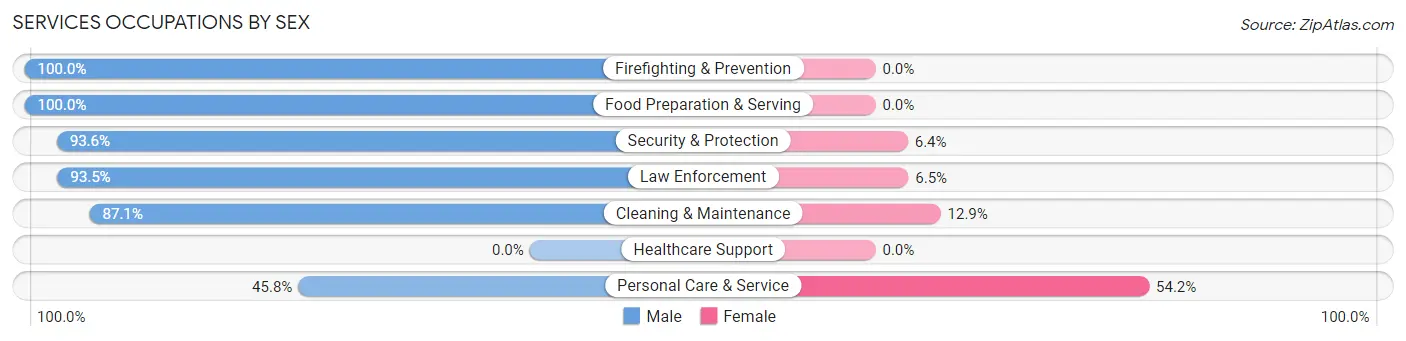
Services Occupations by Sex
Within the Services occupations in East Shoreham, the most male-oriented occupations are Firefighting & Prevention (100.0%), Food Preparation & Serving (100.0%), and Security & Protection (93.6%), while the most female-oriented occupations are Personal Care & Service (54.2%), Cleaning & Maintenance (12.9%), and Law Enforcement (6.5%).
| Occupation | Male | Female |
| Healthcare Support | 0 (0.0%) | 0 (0.0%) |
| Security & Protection | 264 (93.6%) | 18 (6.4%) |
| Firefighting & Prevention | 5 (100.0%) | 0 (0.0%) |
| Law Enforcement | 259 (93.5%) | 18 (6.5%) |
| Food Preparation & Serving | 89 (100.0%) | 0 (0.0%) |
| Cleaning & Maintenance | 115 (87.1%) | 17 (12.9%) |
| Personal Care & Service | 11 (45.8%) | 13 (54.2%) |
| Total (Category) | 479 (90.9%) | 48 (9.1%) |
| Total (Overall) | 2,092 (58.3%) | 1,497 (41.7%) |
Sales and Office Occupations
The most common Sales and Office occupations in East Shoreham are Sales & Related (403 | 11.2%), and Office & Administration (378 | 10.5%).
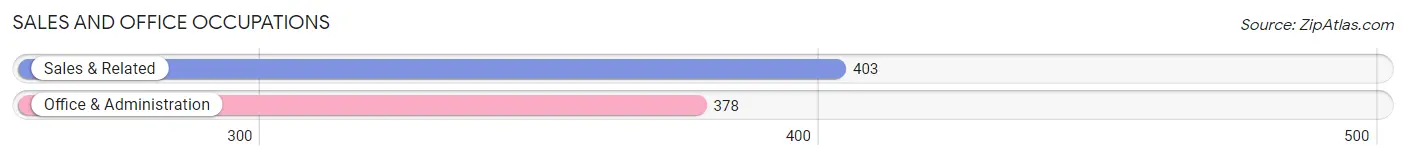
Sales and Office Occupations by Sex
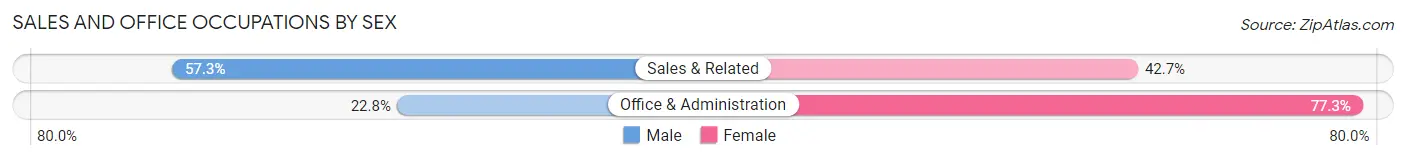
| Occupation | Male | Female |
| Sales & Related | 231 (57.3%) | 172 (42.7%) |
| Office & Administration | 86 (22.8%) | 292 (77.2%) |
| Total (Category) | 317 (40.6%) | 464 (59.4%) |
| Total (Overall) | 2,092 (58.3%) | 1,497 (41.7%) |
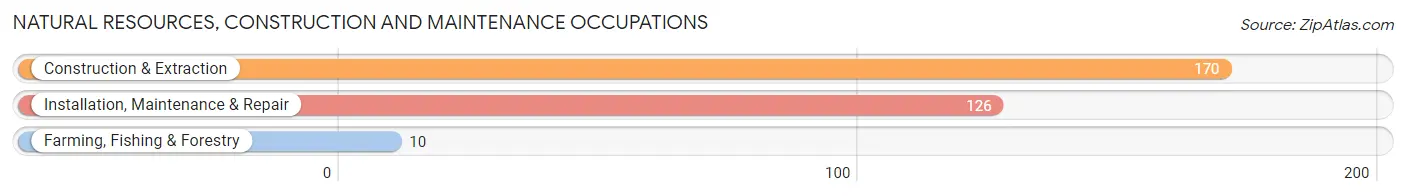
Natural Resources, Construction and Maintenance Occupations
The most common Natural Resources, Construction and Maintenance occupations in East Shoreham are Construction & Extraction (170 | 4.7%), Installation, Maintenance & Repair (126 | 3.5%), and Farming, Fishing & Forestry (10 | 0.3%).
Natural Resources, Construction and Maintenance Occupations by Sex
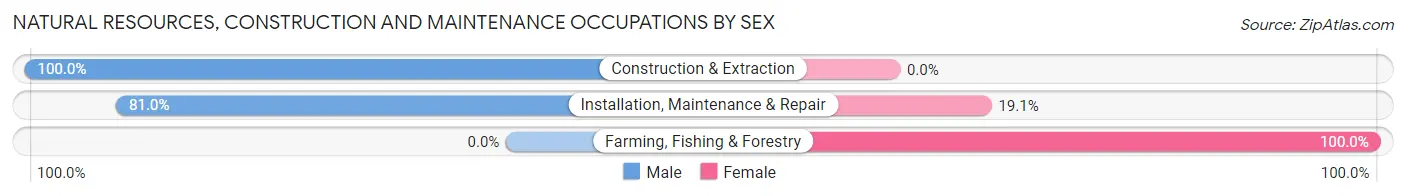
| Occupation | Male | Female |
| Farming, Fishing & Forestry | 0 (0.0%) | 10 (100.0%) |
| Construction & Extraction | 170 (100.0%) | 0 (0.0%) |
| Installation, Maintenance & Repair | 102 (80.9%) | 24 (19.1%) |
| Total (Category) | 272 (88.9%) | 34 (11.1%) |
| Total (Overall) | 2,092 (58.3%) | 1,497 (41.7%) |
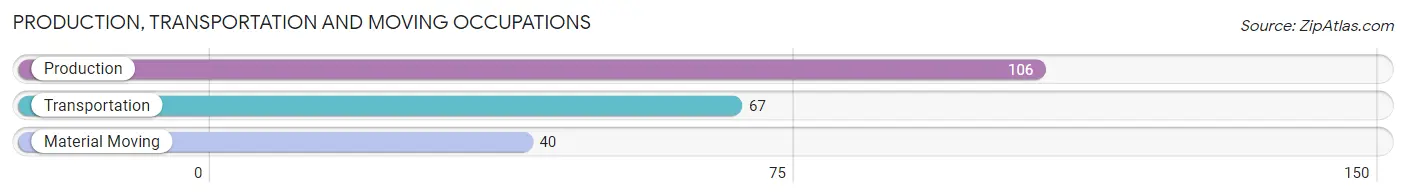
Production, Transportation and Moving Occupations
The most common Production, Transportation and Moving occupations in East Shoreham are Production (106 | 2.9%), Transportation (67 | 1.9%), and Material Moving (40 | 1.1%).
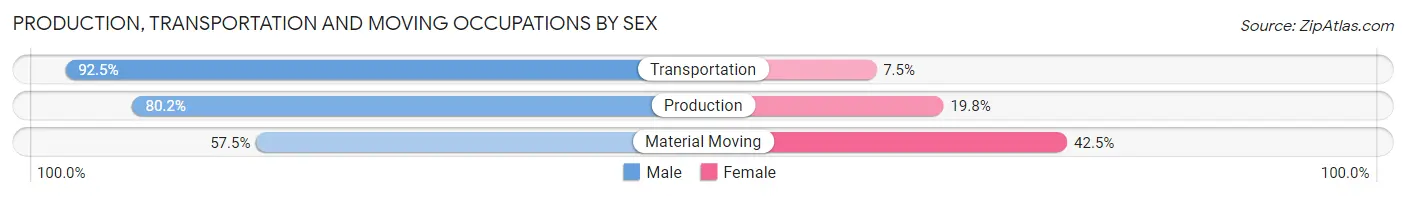
Production, Transportation and Moving Occupations by Sex
| Occupation | Male | Female |
| Production | 85 (80.2%) | 21 (19.8%) |
| Transportation | 62 (92.5%) | 5 (7.5%) |
| Material Moving | 23 (57.5%) | 17 (42.5%) |
| Total (Category) | 170 (79.8%) | 43 (20.2%) |
| Total (Overall) | 2,092 (58.3%) | 1,497 (41.7%) |
Employment Industries by Sex in East Shoreham
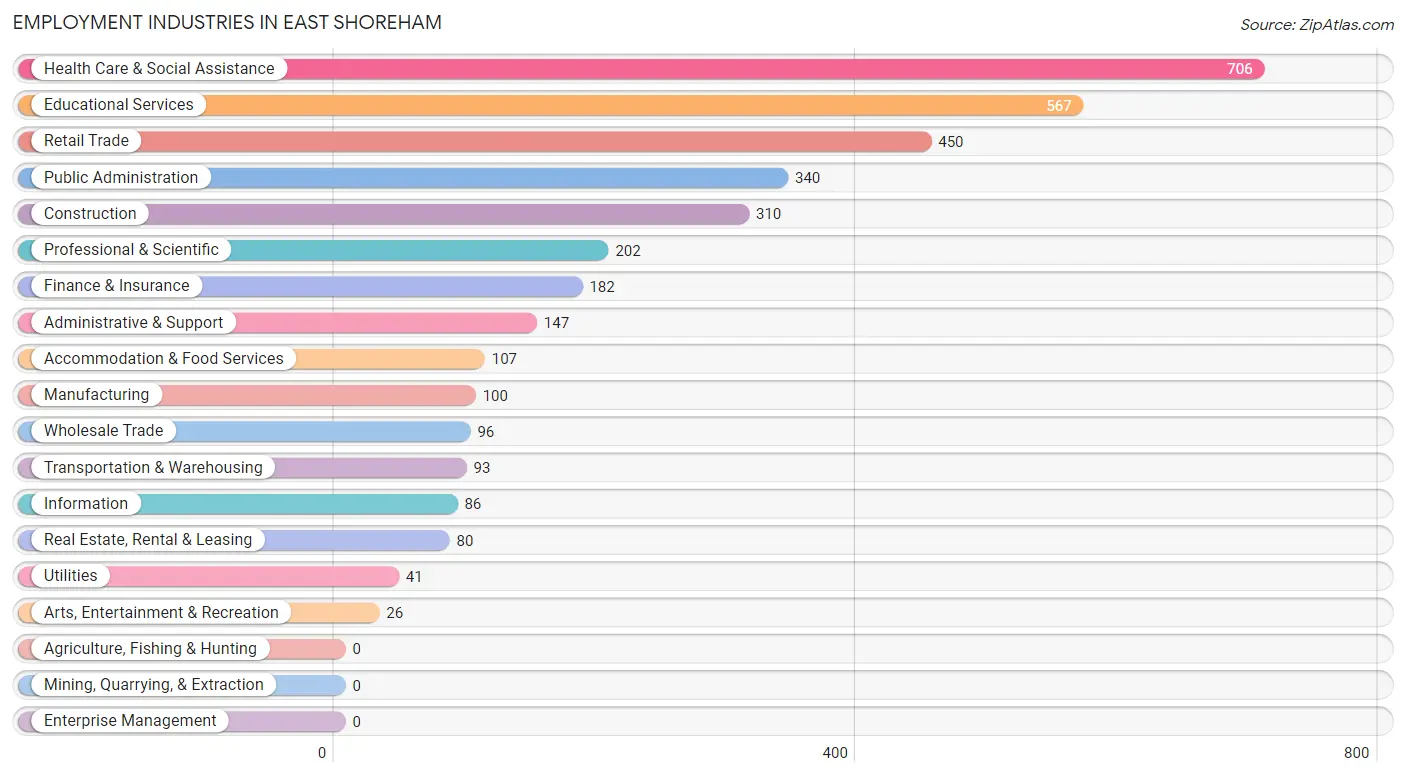
Employment Industries in East Shoreham
The major employment industries in East Shoreham include Health Care & Social Assistance (706 | 19.7%), Educational Services (567 | 15.8%), Retail Trade (450 | 12.5%), Public Administration (340 | 9.5%), and Construction (310 | 8.6%).
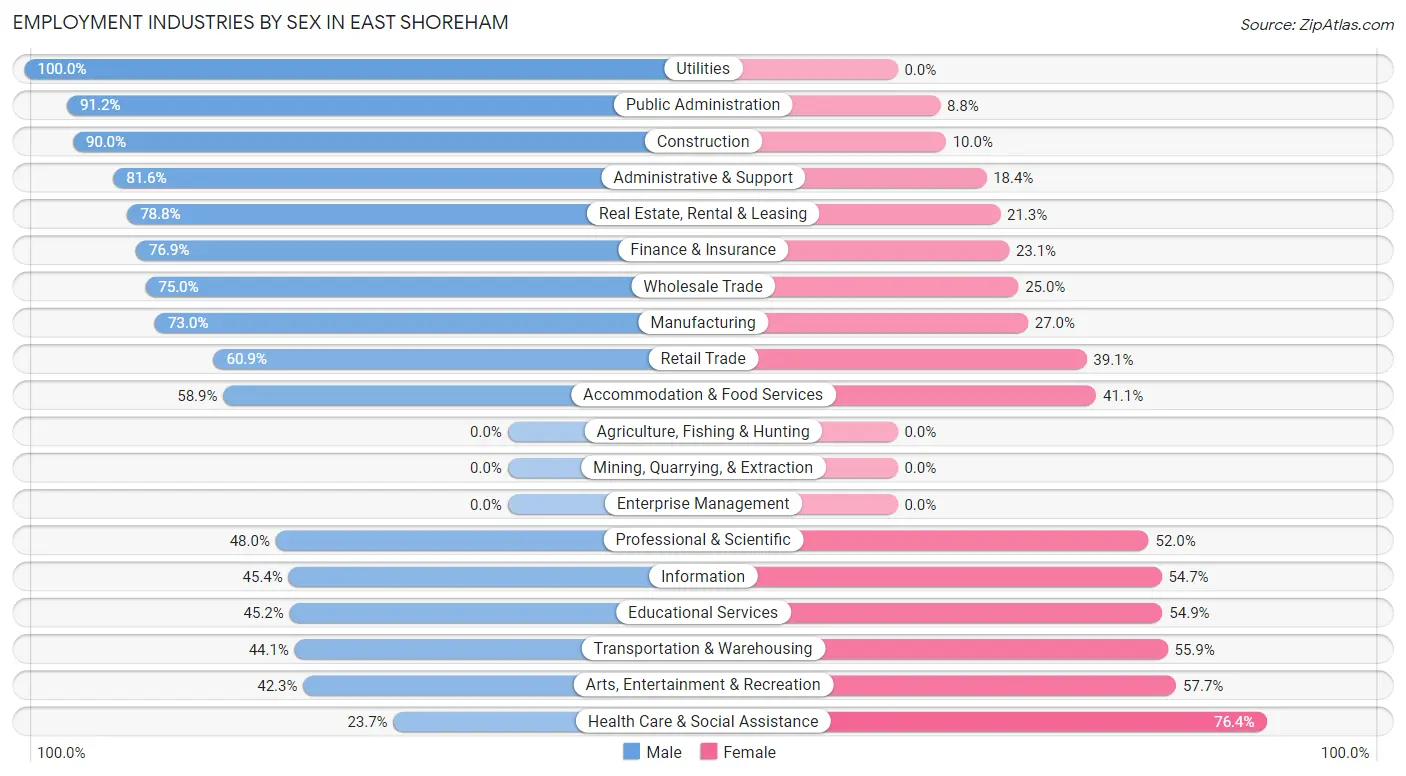
Employment Industries by Sex in East Shoreham
The East Shoreham industries that see more men than women are Utilities (100.0%), Public Administration (91.2%), and Construction (90.0%), whereas the industries that tend to have a higher number of women are Health Care & Social Assistance (76.3%), Arts, Entertainment & Recreation (57.7%), and Transportation & Warehousing (55.9%).
| Industry | Male | Female |
| Agriculture, Fishing & Hunting | 0 (0.0%) | 0 (0.0%) |
| Mining, Quarrying, & Extraction | 0 (0.0%) | 0 (0.0%) |
| Construction | 279 (90.0%) | 31 (10.0%) |
| Manufacturing | 73 (73.0%) | 27 (27.0%) |
| Wholesale Trade | 72 (75.0%) | 24 (25.0%) |
| Retail Trade | 274 (60.9%) | 176 (39.1%) |
| Transportation & Warehousing | 41 (44.1%) | 52 (55.9%) |
| Utilities | 41 (100.0%) | 0 (0.0%) |
| Information | 39 (45.4%) | 47 (54.6%) |
| Finance & Insurance | 140 (76.9%) | 42 (23.1%) |
| Real Estate, Rental & Leasing | 63 (78.7%) | 17 (21.2%) |
| Professional & Scientific | 97 (48.0%) | 105 (52.0%) |
| Enterprise Management | 0 (0.0%) | 0 (0.0%) |
| Administrative & Support | 120 (81.6%) | 27 (18.4%) |
| Educational Services | 256 (45.2%) | 311 (54.8%) |
| Health Care & Social Assistance | 167 (23.6%) | 539 (76.3%) |
| Arts, Entertainment & Recreation | 11 (42.3%) | 15 (57.7%) |
| Accommodation & Food Services | 63 (58.9%) | 44 (41.1%) |
| Public Administration | 310 (91.2%) | 30 (8.8%) |
| Total | 2,092 (58.3%) | 1,497 (41.7%) |
Education in East Shoreham
School Enrollment in East Shoreham
The most common levels of schooling among the 2,316 students in East Shoreham are middle school (576 | 24.9%), elementary school (499 | 21.5%), and high school (490 | 21.2%).
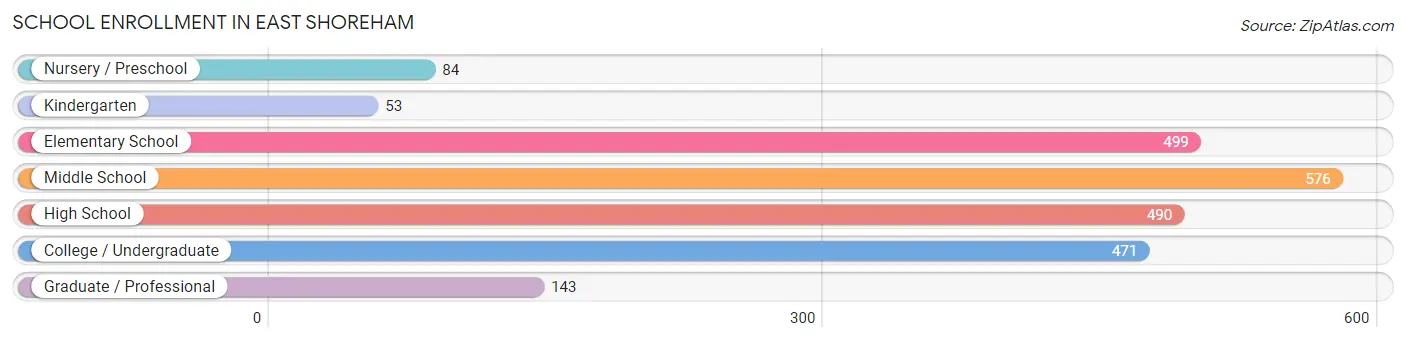
| School Level | # Students | % Students |
| Nursery / Preschool | 84 | 3.6% |
| Kindergarten | 53 | 2.3% |
| Elementary School | 499 | 21.5% |
| Middle School | 576 | 24.9% |
| High School | 490 | 21.2% |
| College / Undergraduate | 471 | 20.3% |
| Graduate / Professional | 143 | 6.2% |
| Total | 2,316 | 100.0% |
School Enrollment by Age by Funding Source in East Shoreham
Out of a total of 2,316 students who are enrolled in schools in East Shoreham, 227 (9.8%) attend a private institution, while the remaining 2,089 (90.2%) are enrolled in public schools. The age group of 35 years and over has the highest likelihood of being enrolled in private schools, with 81 (64.3% in the age bracket) enrolled. Conversely, the age group of 10 to 14 year olds has the lowest likelihood of being enrolled in a private school, with 712 (100.0% in the age bracket) attending a public institution.
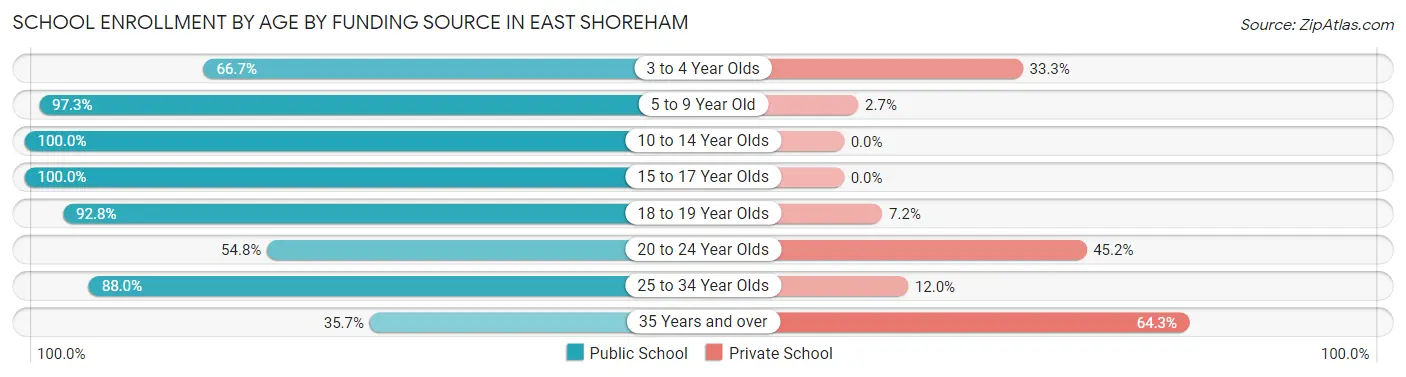
| Age Bracket | Public School | Private School |
| 3 to 4 Year Olds | 20 (66.7%) | 10 (33.3%) |
| 5 to 9 Year Old | 576 (97.3%) | 16 (2.7%) |
| 10 to 14 Year Olds | 712 (100.0%) | 0 (0.0%) |
| 15 to 17 Year Olds | 319 (100.0%) | 0 (0.0%) |
| 18 to 19 Year Olds | 207 (92.8%) | 16 (7.2%) |
| 20 to 24 Year Olds | 108 (54.8%) | 89 (45.2%) |
| 25 to 34 Year Olds | 103 (88.0%) | 14 (12.0%) |
| 35 Years and over | 45 (35.7%) | 81 (64.3%) |
| Total | 2,089 (90.2%) | 227 (9.8%) |
Educational Attainment by Field of Study in East Shoreham
Business (466 | 21.1%), education (420 | 19.0%), bio, nature & agricultural (196 | 8.9%), science & technology (182 | 8.2%), and arts & humanities (146 | 6.6%) are the most common fields of study among 2,210 individuals in East Shoreham who have obtained a bachelor's degree or higher.
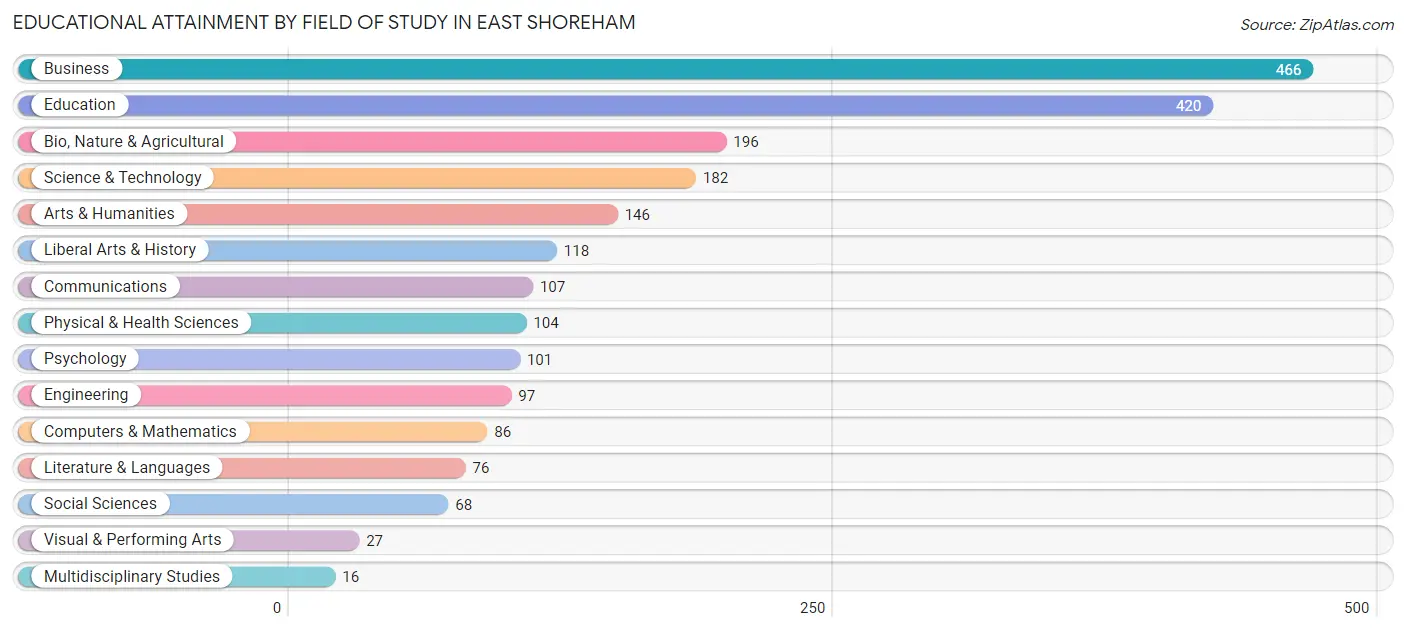
| Field of Study | # Graduates | % Graduates |
| Computers & Mathematics | 86 | 3.9% |
| Bio, Nature & Agricultural | 196 | 8.9% |
| Physical & Health Sciences | 104 | 4.7% |
| Psychology | 101 | 4.6% |
| Social Sciences | 68 | 3.1% |
| Engineering | 97 | 4.4% |
| Multidisciplinary Studies | 16 | 0.7% |
| Science & Technology | 182 | 8.2% |
| Business | 466 | 21.1% |
| Education | 420 | 19.0% |
| Literature & Languages | 76 | 3.4% |
| Liberal Arts & History | 118 | 5.3% |
| Visual & Performing Arts | 27 | 1.2% |
| Communications | 107 | 4.8% |
| Arts & Humanities | 146 | 6.6% |
| Total | 2,210 | 100.0% |
Transportation & Commute in East Shoreham
Vehicle Availability by Sex in East Shoreham
The most prevalent vehicle ownership categories in East Shoreham are males with 3 vehicles (723, accounting for 35.1%) and females with 3 vehicles (427, making up 50.9%).
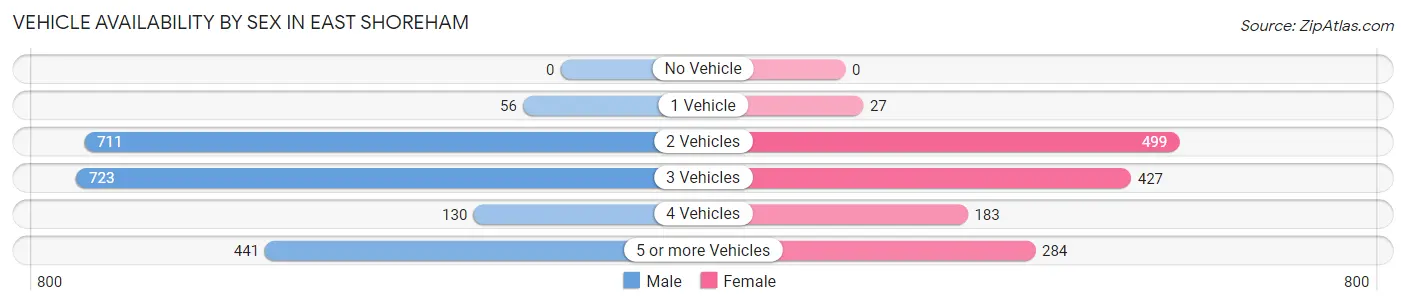
| Vehicles Available | Male | Female |
| No Vehicle | 0 (0.0%) | 0 (0.0%) |
| 1 Vehicle | 56 (2.7%) | 27 (1.9%) |
| 2 Vehicles | 711 (34.5%) | 499 (35.1%) |
| 3 Vehicles | 723 (35.1%) | 427 (30.1%) |
| 4 Vehicles | 130 (6.3%) | 183 (12.9%) |
| 5 or more Vehicles | 441 (21.4%) | 284 (20.0%) |
| Total | 2,061 (100.0%) | 1,420 (100.0%) |
Commute Time in East Shoreham
The most frequently occuring commute durations in East Shoreham are 20 to 24 minutes (563 commuters, 17.8%), 25 to 29 minutes (432 commuters, 13.7%), and 10 to 14 minutes (296 commuters, 9.4%).
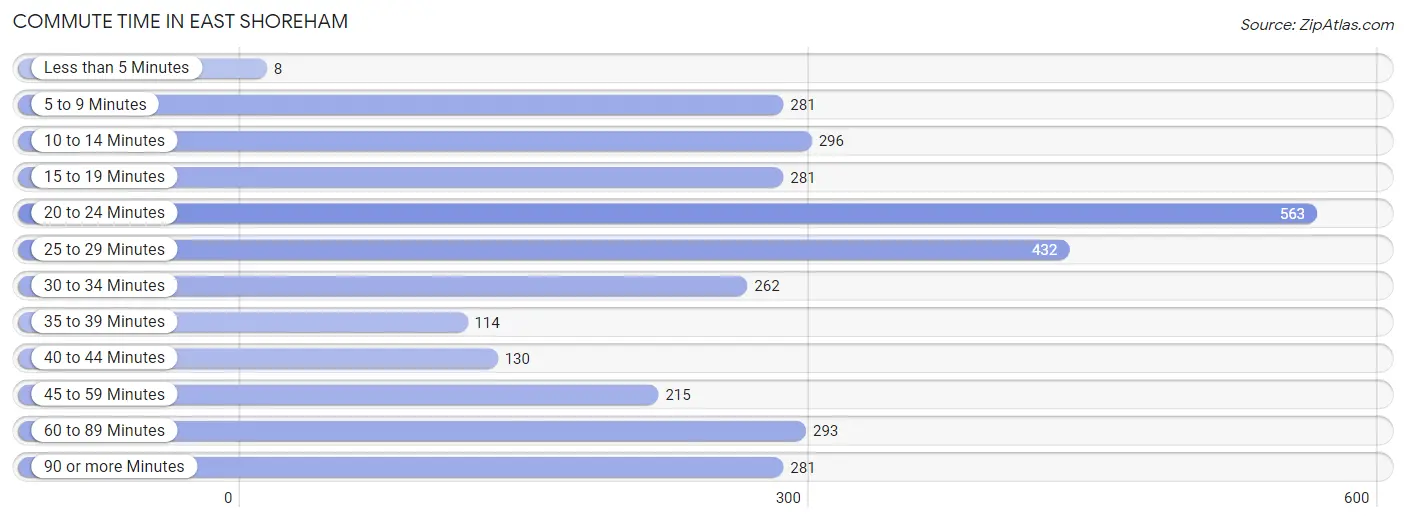
| Commute Time | # Commuters | % Commuters |
| Less than 5 Minutes | 8 | 0.3% |
| 5 to 9 Minutes | 281 | 8.9% |
| 10 to 14 Minutes | 296 | 9.4% |
| 15 to 19 Minutes | 281 | 8.9% |
| 20 to 24 Minutes | 563 | 17.8% |
| 25 to 29 Minutes | 432 | 13.7% |
| 30 to 34 Minutes | 262 | 8.3% |
| 35 to 39 Minutes | 114 | 3.6% |
| 40 to 44 Minutes | 130 | 4.1% |
| 45 to 59 Minutes | 215 | 6.8% |
| 60 to 89 Minutes | 293 | 9.3% |
| 90 or more Minutes | 281 | 8.9% |
Commute Time by Sex in East Shoreham
The most common commute times in East Shoreham are 20 to 24 minutes (375 commuters, 20.0%) for males and 25 to 29 minutes (213 commuters, 16.6%) for females.
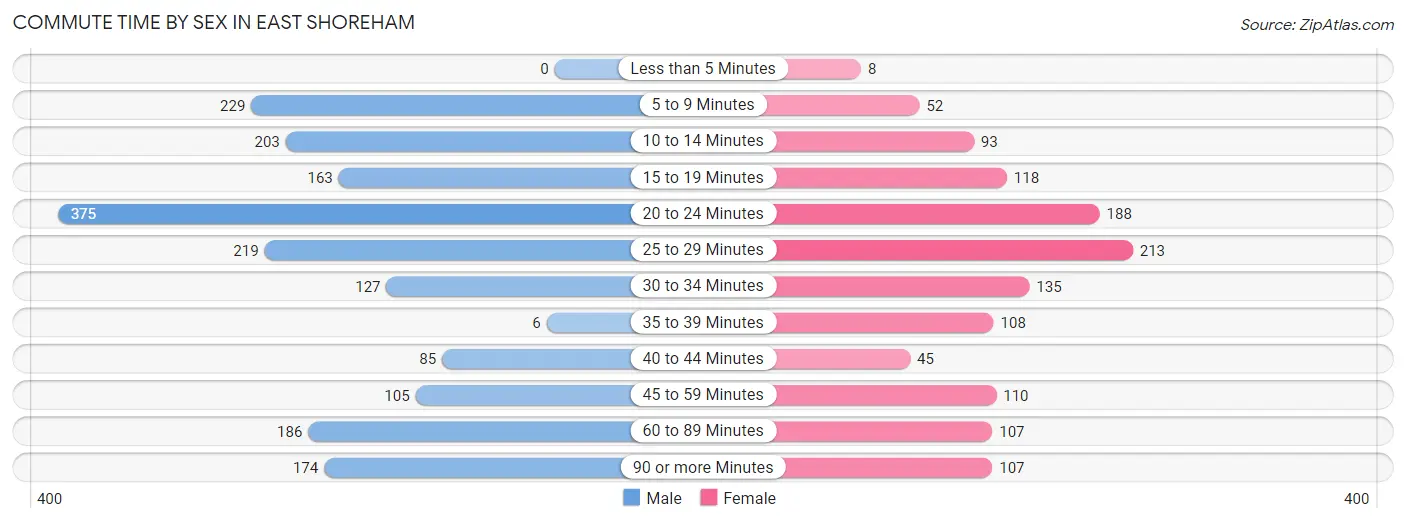
| Commute Time | Male | Female |
| Less than 5 Minutes | 0 (0.0%) | 8 (0.6%) |
| 5 to 9 Minutes | 229 (12.2%) | 52 (4.1%) |
| 10 to 14 Minutes | 203 (10.8%) | 93 (7.2%) |
| 15 to 19 Minutes | 163 (8.7%) | 118 (9.2%) |
| 20 to 24 Minutes | 375 (20.0%) | 188 (14.6%) |
| 25 to 29 Minutes | 219 (11.7%) | 213 (16.6%) |
| 30 to 34 Minutes | 127 (6.8%) | 135 (10.5%) |
| 35 to 39 Minutes | 6 (0.3%) | 108 (8.4%) |
| 40 to 44 Minutes | 85 (4.5%) | 45 (3.5%) |
| 45 to 59 Minutes | 105 (5.6%) | 110 (8.6%) |
| 60 to 89 Minutes | 186 (9.9%) | 107 (8.3%) |
| 90 or more Minutes | 174 (9.3%) | 107 (8.3%) |
Time of Departure to Work by Sex in East Shoreham
The most frequent times of departure to work in East Shoreham are 9:00 AM to 9:59 AM (261, 13.9%) for males and 8:00 AM to 8:29 AM (215, 16.7%) for females.
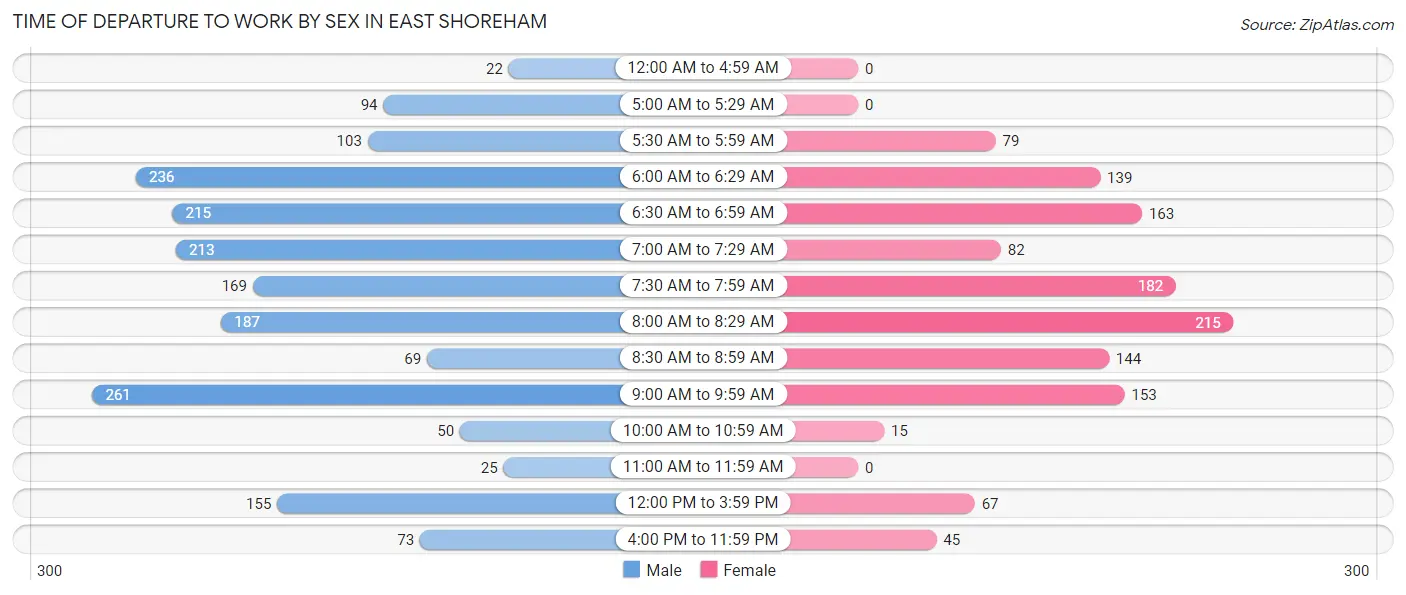
| Time of Departure | Male | Female |
| 12:00 AM to 4:59 AM | 22 (1.2%) | 0 (0.0%) |
| 5:00 AM to 5:29 AM | 94 (5.0%) | 0 (0.0%) |
| 5:30 AM to 5:59 AM | 103 (5.5%) | 79 (6.1%) |
| 6:00 AM to 6:29 AM | 236 (12.6%) | 139 (10.8%) |
| 6:30 AM to 6:59 AM | 215 (11.5%) | 163 (12.7%) |
| 7:00 AM to 7:29 AM | 213 (11.4%) | 82 (6.4%) |
| 7:30 AM to 7:59 AM | 169 (9.0%) | 182 (14.2%) |
| 8:00 AM to 8:29 AM | 187 (10.0%) | 215 (16.7%) |
| 8:30 AM to 8:59 AM | 69 (3.7%) | 144 (11.2%) |
| 9:00 AM to 9:59 AM | 261 (13.9%) | 153 (11.9%) |
| 10:00 AM to 10:59 AM | 50 (2.7%) | 15 (1.2%) |
| 11:00 AM to 11:59 AM | 25 (1.3%) | 0 (0.0%) |
| 12:00 PM to 3:59 PM | 155 (8.3%) | 67 (5.2%) |
| 4:00 PM to 11:59 PM | 73 (3.9%) | 45 (3.5%) |
| Total | 1,872 (100.0%) | 1,284 (100.0%) |
Housing Occupancy in East Shoreham
Occupancy by Ownership in East Shoreham
Of the total 2,050 dwellings in East Shoreham, owner-occupied units account for 2,000 (97.6%), while renter-occupied units make up 50 (2.4%).
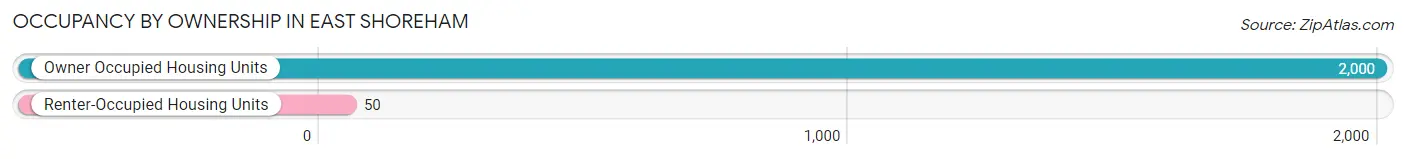
| Occupancy | # Housing Units | % Housing Units |
| Owner Occupied Housing Units | 2,000 | 97.6% |
| Renter-Occupied Housing Units | 50 | 2.4% |
| Total Occupied Housing Units | 2,050 | 100.0% |
Occupancy by Household Size in East Shoreham
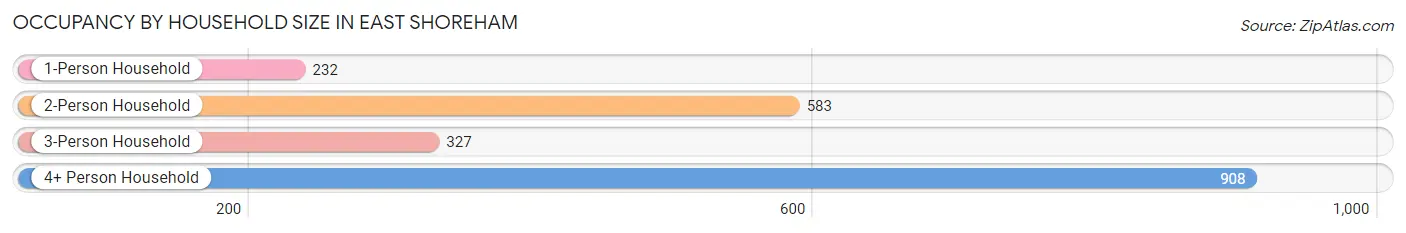
| Household Size | # Housing Units | % Housing Units |
| 1-Person Household | 232 | 11.3% |
| 2-Person Household | 583 | 28.4% |
| 3-Person Household | 327 | 16.0% |
| 4+ Person Household | 908 | 44.3% |
| Total Housing Units | 2,050 | 100.0% |
Occupancy by Ownership by Household Size in East Shoreham
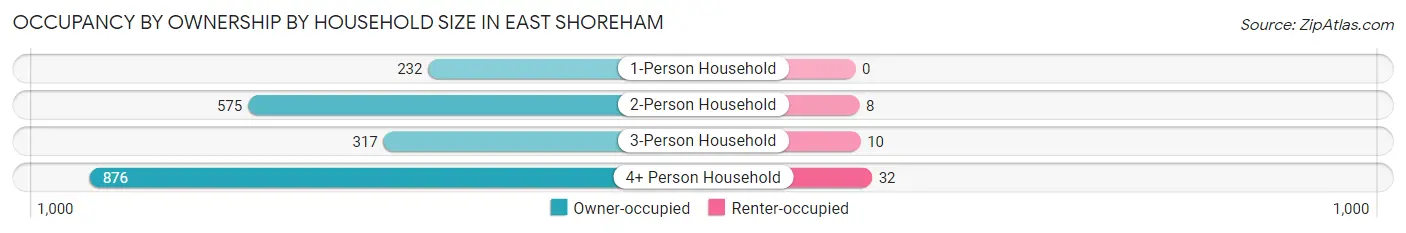
| Household Size | Owner-occupied | Renter-occupied |
| 1-Person Household | 232 (100.0%) | 0 (0.0%) |
| 2-Person Household | 575 (98.6%) | 8 (1.4%) |
| 3-Person Household | 317 (96.9%) | 10 (3.1%) |
| 4+ Person Household | 876 (96.5%) | 32 (3.5%) |
| Total Housing Units | 2,000 (97.6%) | 50 (2.4%) |
Occupancy by Educational Attainment in East Shoreham
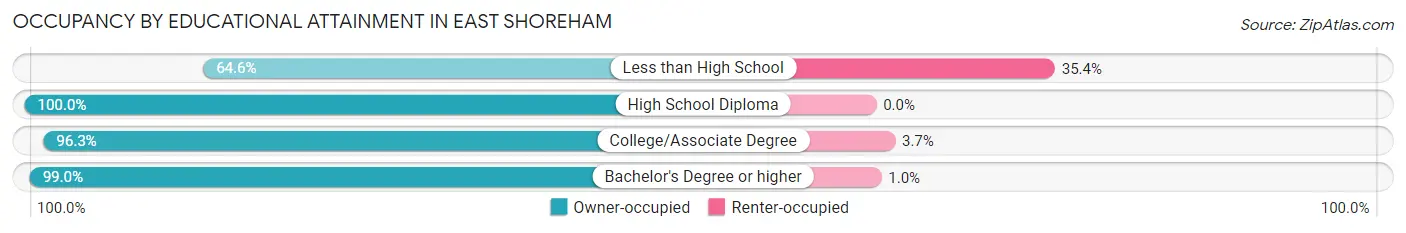
| Household Size | Owner-occupied | Renter-occupied |
| Less than High School | 31 (64.6%) | 17 (35.4%) |
| High School Diploma | 340 (100.0%) | 0 (0.0%) |
| College/Associate Degree | 567 (96.3%) | 22 (3.7%) |
| Bachelor's Degree or higher | 1,062 (99.0%) | 11 (1.0%) |
Occupancy by Age of Householder in East Shoreham
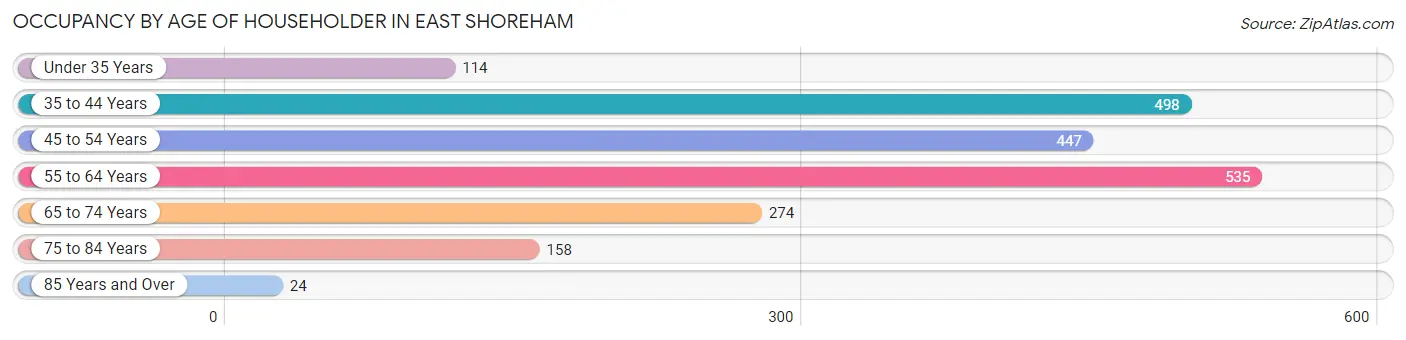
| Age Bracket | # Households | % Households |
| Under 35 Years | 114 | 5.6% |
| 35 to 44 Years | 498 | 24.3% |
| 45 to 54 Years | 447 | 21.8% |
| 55 to 64 Years | 535 | 26.1% |
| 65 to 74 Years | 274 | 13.4% |
| 75 to 84 Years | 158 | 7.7% |
| 85 Years and Over | 24 | 1.2% |
| Total | 2,050 | 100.0% |
Housing Finances in East Shoreham
Median Income by Occupancy in East Shoreham
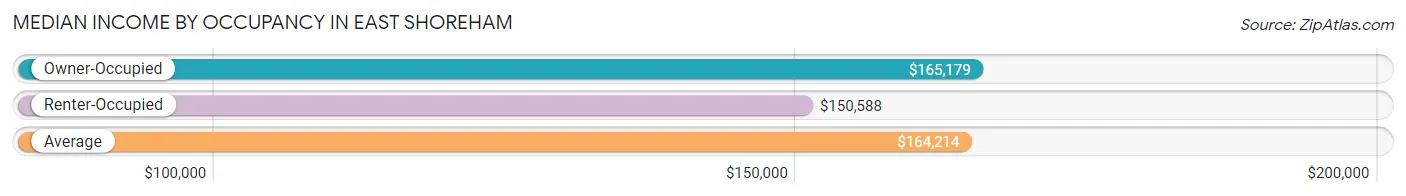
| Occupancy Type | # Households | Median Income |
| Owner-Occupied | 2,000 (97.6%) | $165,179 |
| Renter-Occupied | 50 (2.4%) | $150,588 |
| Average | 2,050 (100.0%) | $164,214 |
Occupancy by Householder Income Bracket in East Shoreham
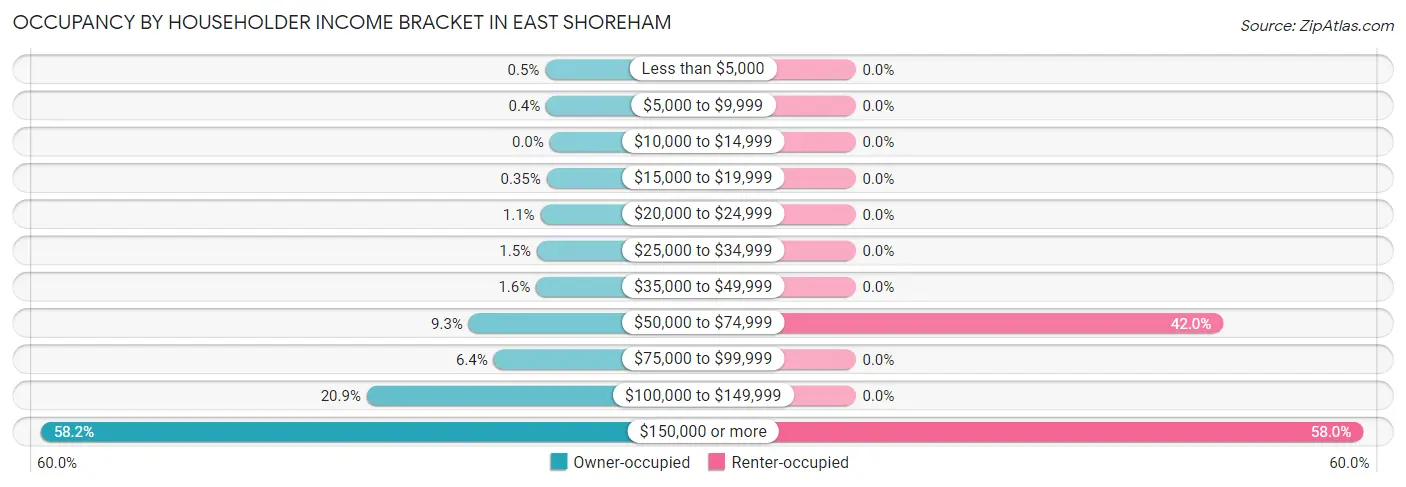
| Income Bracket | Owner-occupied | Renter-occupied |
| Less than $5,000 | 10 (0.5%) | 0 (0.0%) |
| $5,000 to $9,999 | 8 (0.4%) | 0 (0.0%) |
| $10,000 to $14,999 | 0 (0.0%) | 0 (0.0%) |
| $15,000 to $19,999 | 7 (0.4%) | 0 (0.0%) |
| $20,000 to $24,999 | 21 (1.1%) | 0 (0.0%) |
| $25,000 to $34,999 | 29 (1.5%) | 0 (0.0%) |
| $35,000 to $49,999 | 31 (1.5%) | 0 (0.0%) |
| $50,000 to $74,999 | 185 (9.2%) | 21 (42.0%) |
| $75,000 to $99,999 | 128 (6.4%) | 0 (0.0%) |
| $100,000 to $149,999 | 418 (20.9%) | 0 (0.0%) |
| $150,000 or more | 1,163 (58.2%) | 29 (58.0%) |
| Total | 2,000 (100.0%) | 50 (100.0%) |
Monthly Housing Cost Tiers in East Shoreham
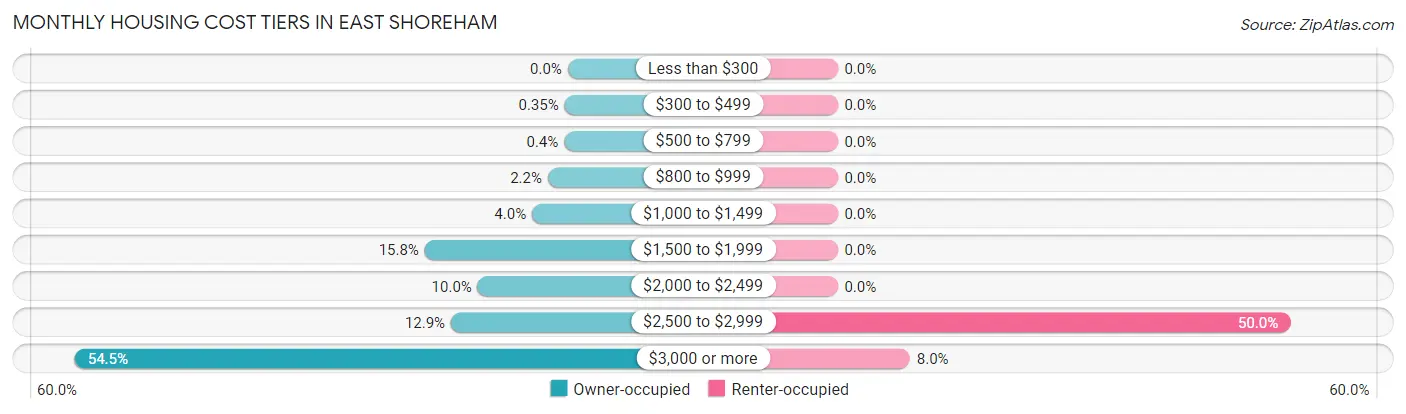
| Monthly Cost | Owner-occupied | Renter-occupied |
| Less than $300 | 0 (0.0%) | 0 (0.0%) |
| $300 to $499 | 7 (0.4%) | 0 (0.0%) |
| $500 to $799 | 8 (0.4%) | 0 (0.0%) |
| $800 to $999 | 44 (2.2%) | 0 (0.0%) |
| $1,000 to $1,499 | 79 (4.0%) | 0 (0.0%) |
| $1,500 to $1,999 | 316 (15.8%) | 0 (0.0%) |
| $2,000 to $2,499 | 199 (10.0%) | 0 (0.0%) |
| $2,500 to $2,999 | 258 (12.9%) | 25 (50.0%) |
| $3,000 or more | 1,089 (54.4%) | 4 (8.0%) |
| Total | 2,000 (100.0%) | 50 (100.0%) |
Physical Housing Characteristics in East Shoreham
Housing Structures in East Shoreham
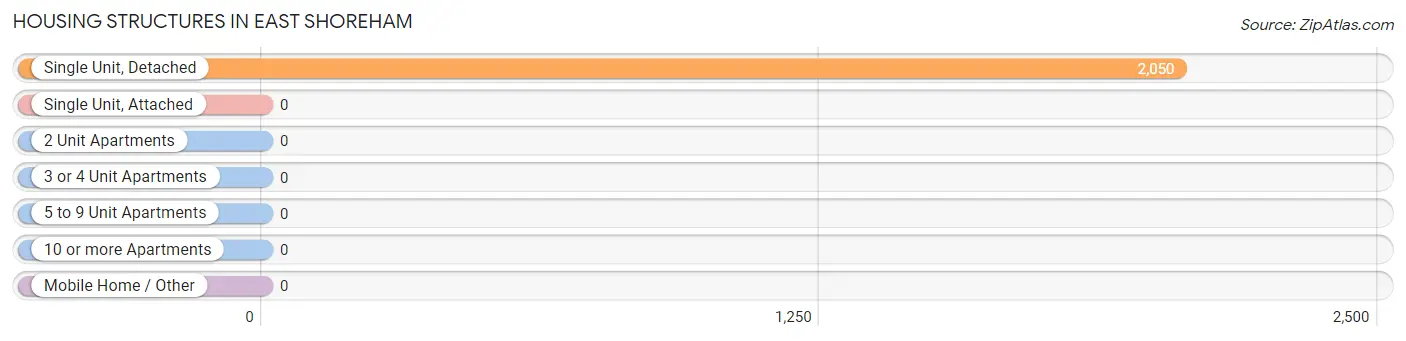
| Structure Type | # Housing Units | % Housing Units |
| Single Unit, Detached | 2,050 | 100.0% |
| Single Unit, Attached | 0 | 0.0% |
| 2 Unit Apartments | 0 | 0.0% |
| 3 or 4 Unit Apartments | 0 | 0.0% |
| 5 to 9 Unit Apartments | 0 | 0.0% |
| 10 or more Apartments | 0 | 0.0% |
| Mobile Home / Other | 0 | 0.0% |
| Total | 2,050 | 100.0% |
Housing Structures by Occupancy in East Shoreham
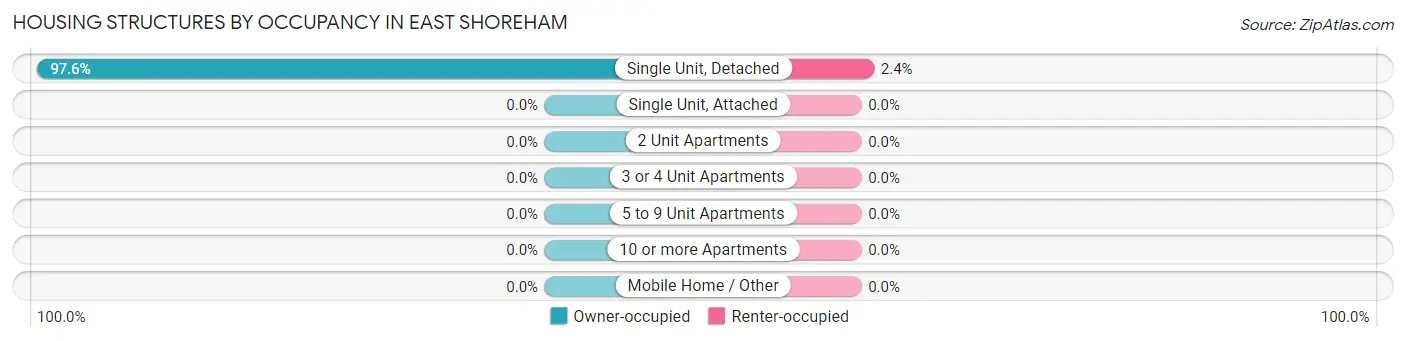
| Structure Type | Owner-occupied | Renter-occupied |
| Single Unit, Detached | 2,000 (97.6%) | 50 (2.4%) |
| Single Unit, Attached | 0 (0.0%) | 0 (0.0%) |
| 2 Unit Apartments | 0 (0.0%) | 0 (0.0%) |
| 3 or 4 Unit Apartments | 0 (0.0%) | 0 (0.0%) |
| 5 to 9 Unit Apartments | 0 (0.0%) | 0 (0.0%) |
| 10 or more Apartments | 0 (0.0%) | 0 (0.0%) |
| Mobile Home / Other | 0 (0.0%) | 0 (0.0%) |
| Total | 2,000 (97.6%) | 50 (2.4%) |
Housing Structures by Number of Rooms in East Shoreham
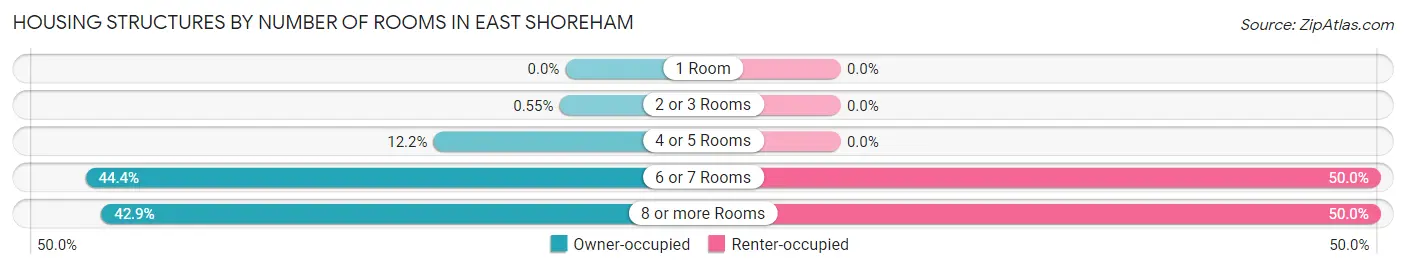
| Number of Rooms | Owner-occupied | Renter-occupied |
| 1 Room | 0 (0.0%) | 0 (0.0%) |
| 2 or 3 Rooms | 11 (0.5%) | 0 (0.0%) |
| 4 or 5 Rooms | 244 (12.2%) | 0 (0.0%) |
| 6 or 7 Rooms | 887 (44.4%) | 25 (50.0%) |
| 8 or more Rooms | 858 (42.9%) | 25 (50.0%) |
| Total | 2,000 (100.0%) | 50 (100.0%) |
Housing Structure by Heating Type in East Shoreham
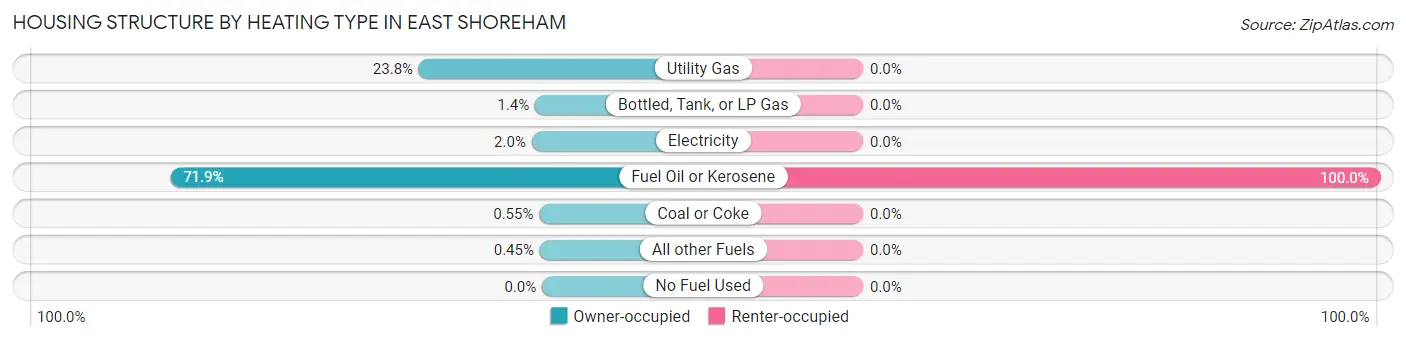
| Heating Type | Owner-occupied | Renter-occupied |
| Utility Gas | 476 (23.8%) | 0 (0.0%) |
| Bottled, Tank, or LP Gas | 27 (1.3%) | 0 (0.0%) |
| Electricity | 40 (2.0%) | 0 (0.0%) |
| Fuel Oil or Kerosene | 1,437 (71.9%) | 50 (100.0%) |
| Coal or Coke | 11 (0.5%) | 0 (0.0%) |
| All other Fuels | 9 (0.4%) | 0 (0.0%) |
| No Fuel Used | 0 (0.0%) | 0 (0.0%) |
| Total | 2,000 (100.0%) | 50 (100.0%) |
Household Vehicle Usage in East Shoreham
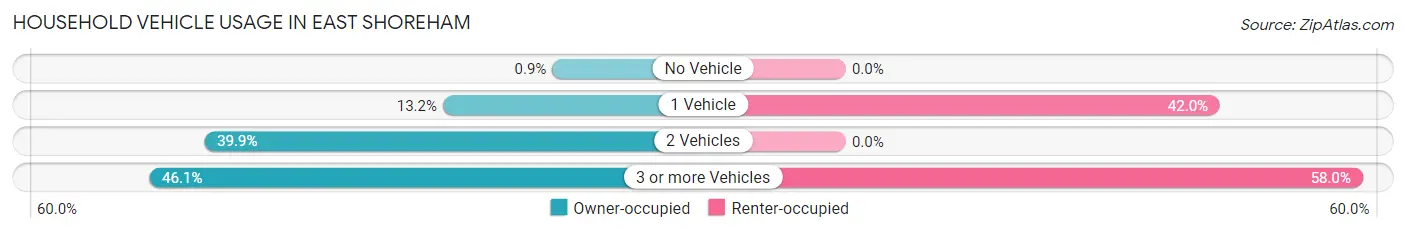
| Vehicles per Household | Owner-occupied | Renter-occupied |
| No Vehicle | 18 (0.9%) | 0 (0.0%) |
| 1 Vehicle | 263 (13.2%) | 21 (42.0%) |
| 2 Vehicles | 798 (39.9%) | 0 (0.0%) |
| 3 or more Vehicles | 921 (46.1%) | 29 (58.0%) |
| Total | 2,000 (100.0%) | 50 (100.0%) |
Real Estate & Mortgages in East Shoreham
Real Estate and Mortgage Overview in East Shoreham
| Characteristic | Without Mortgage | With Mortgage |
| Housing Units | 460 | 1,540 |
| Median Property Value | $454,700 | $484,500 |
| Median Household Income | $121,250 | $978 |
| Monthly Housing Costs | $1,501 | $1,089 |
| Real Estate Taxes | $10,001 | $0 |
Property Value by Mortgage Status in East Shoreham
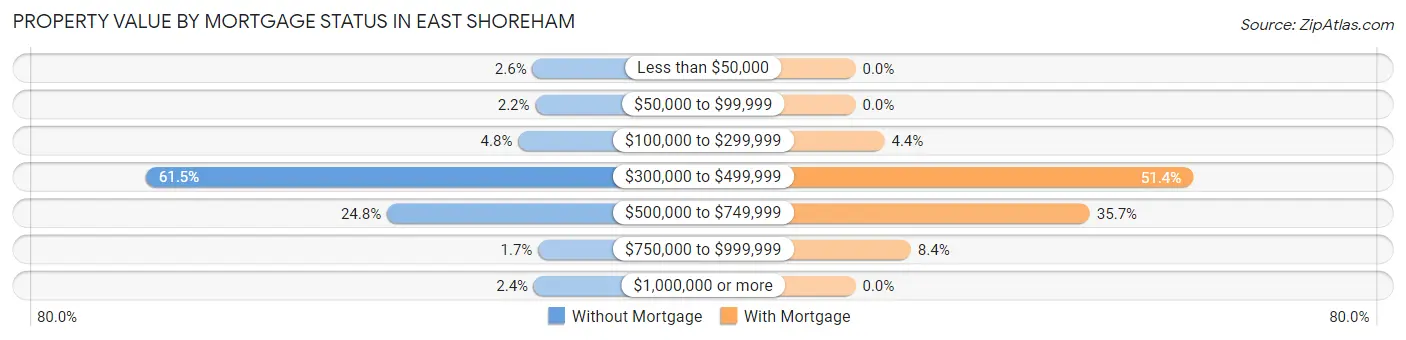
| Property Value | Without Mortgage | With Mortgage |
| Less than $50,000 | 12 (2.6%) | 0 (0.0%) |
| $50,000 to $99,999 | 10 (2.2%) | 0 (0.0%) |
| $100,000 to $299,999 | 22 (4.8%) | 68 (4.4%) |
| $300,000 to $499,999 | 283 (61.5%) | 792 (51.4%) |
| $500,000 to $749,999 | 114 (24.8%) | 550 (35.7%) |
| $750,000 to $999,999 | 8 (1.7%) | 130 (8.4%) |
| $1,000,000 or more | 11 (2.4%) | 0 (0.0%) |
| Total | 460 (100.0%) | 1,540 (100.0%) |
Household Income by Mortgage Status in East Shoreham
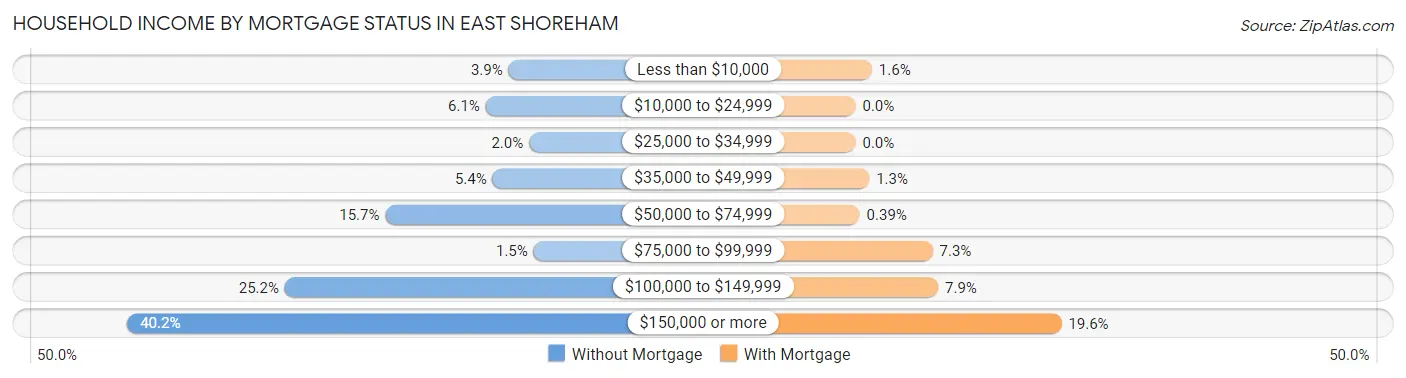
| Household Income | Without Mortgage | With Mortgage |
| Less than $10,000 | 18 (3.9%) | 24 (1.6%) |
| $10,000 to $24,999 | 28 (6.1%) | 0 (0.0%) |
| $25,000 to $34,999 | 9 (2.0%) | 0 (0.0%) |
| $35,000 to $49,999 | 25 (5.4%) | 20 (1.3%) |
| $50,000 to $74,999 | 72 (15.7%) | 6 (0.4%) |
| $75,000 to $99,999 | 7 (1.5%) | 113 (7.3%) |
| $100,000 to $149,999 | 116 (25.2%) | 121 (7.9%) |
| $150,000 or more | 185 (40.2%) | 302 (19.6%) |
| Total | 460 (100.0%) | 1,540 (100.0%) |
Property Value to Household Income Ratio in East Shoreham
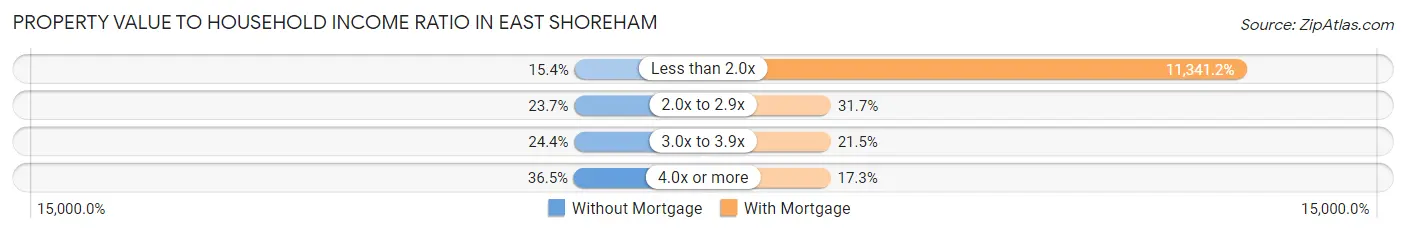
| Value-to-Income Ratio | Without Mortgage | With Mortgage |
| Less than 2.0x | 71 (15.4%) | 174,655 (11,341.2%) |
| 2.0x to 2.9x | 109 (23.7%) | 488 (31.7%) |
| 3.0x to 3.9x | 112 (24.3%) | 331 (21.5%) |
| 4.0x or more | 168 (36.5%) | 266 (17.3%) |
| Total | 460 (100.0%) | 1,540 (100.0%) |
Real Estate Taxes by Mortgage Status in East Shoreham
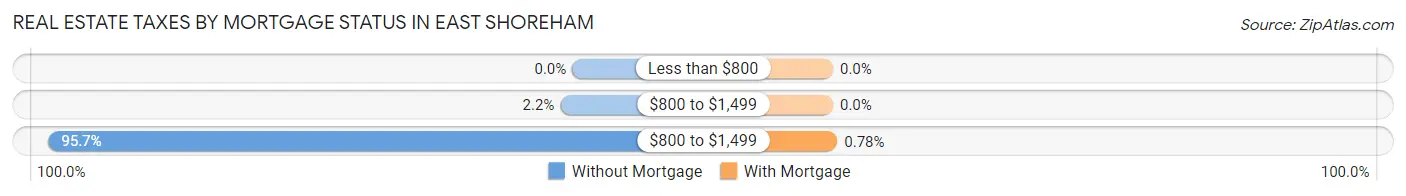
| Property Taxes | Without Mortgage | With Mortgage |
| Less than $800 | 0 (0.0%) | 0 (0.0%) |
| $800 to $1,499 | 10 (2.2%) | 0 (0.0%) |
| $800 to $1,499 | 440 (95.7%) | 12 (0.8%) |
| Total | 460 (100.0%) | 1,540 (100.0%) |
Health & Disability in East Shoreham
Health Insurance Coverage by Age in East Shoreham
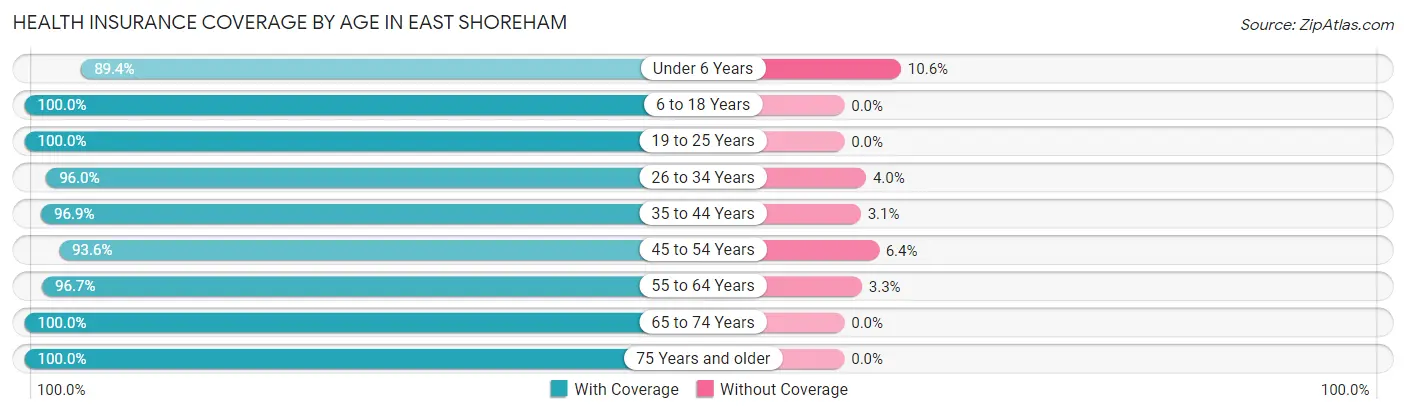
| Age Bracket | With Coverage | Without Coverage |
| Under 6 Years | 305 (89.4%) | 36 (10.6%) |
| 6 to 18 Years | 1,729 (100.0%) | 0 (0.0%) |
| 19 to 25 Years | 730 (100.0%) | 0 (0.0%) |
| 26 to 34 Years | 689 (96.0%) | 29 (4.0%) |
| 35 to 44 Years | 885 (96.9%) | 28 (3.1%) |
| 45 to 54 Years | 903 (93.6%) | 62 (6.4%) |
| 55 to 64 Years | 1,125 (96.7%) | 38 (3.3%) |
| 65 to 74 Years | 498 (100.0%) | 0 (0.0%) |
| 75 Years and older | 310 (100.0%) | 0 (0.0%) |
| Total | 7,174 (97.4%) | 193 (2.6%) |
Health Insurance Coverage by Citizenship Status in East Shoreham
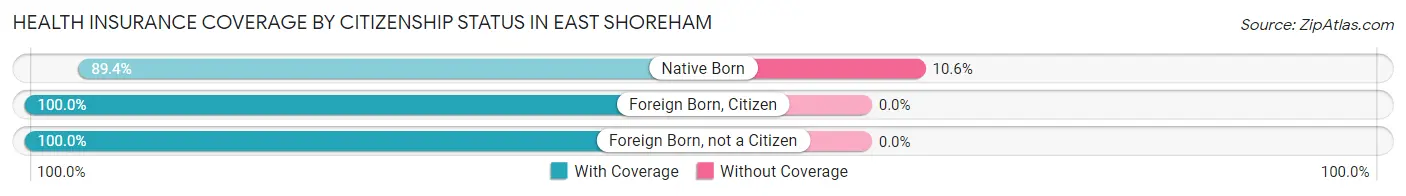
| Citizenship Status | With Coverage | Without Coverage |
| Native Born | 305 (89.4%) | 36 (10.6%) |
| Foreign Born, Citizen | 1,729 (100.0%) | 0 (0.0%) |
| Foreign Born, not a Citizen | 730 (100.0%) | 0 (0.0%) |
Health Insurance Coverage by Household Income in East Shoreham
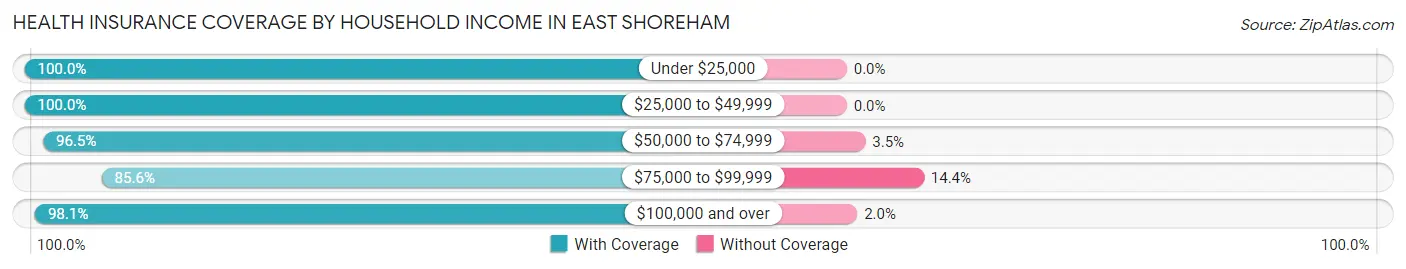
| Household Income | With Coverage | Without Coverage |
| Under $25,000 | 53 (100.0%) | 0 (0.0%) |
| $25,000 to $49,999 | 124 (100.0%) | 0 (0.0%) |
| $50,000 to $74,999 | 556 (96.5%) | 20 (3.5%) |
| $75,000 to $99,999 | 320 (85.6%) | 54 (14.4%) |
| $100,000 and over | 5,926 (98.1%) | 118 (1.9%) |
Public vs Private Health Insurance Coverage by Age in East Shoreham
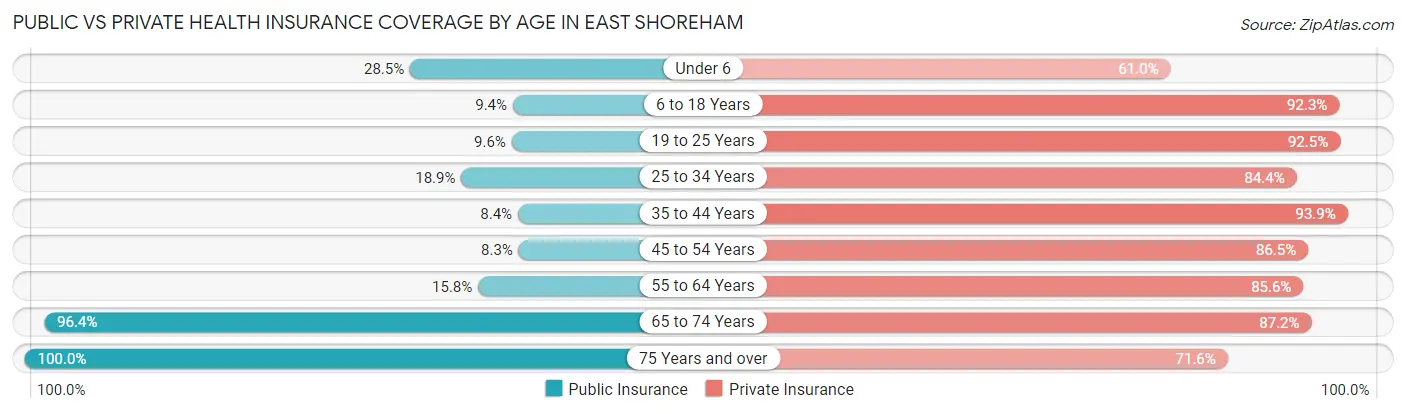
| Age Bracket | Public Insurance | Private Insurance |
| Under 6 | 97 (28.4%) | 208 (61.0%) |
| 6 to 18 Years | 162 (9.4%) | 1,596 (92.3%) |
| 19 to 25 Years | 70 (9.6%) | 675 (92.5%) |
| 25 to 34 Years | 136 (18.9%) | 606 (84.4%) |
| 35 to 44 Years | 77 (8.4%) | 857 (93.9%) |
| 45 to 54 Years | 80 (8.3%) | 835 (86.5%) |
| 55 to 64 Years | 184 (15.8%) | 996 (85.6%) |
| 65 to 74 Years | 480 (96.4%) | 434 (87.2%) |
| 75 Years and over | 310 (100.0%) | 222 (71.6%) |
| Total | 1,596 (21.7%) | 6,429 (87.3%) |
Disability Status by Sex by Age in East Shoreham
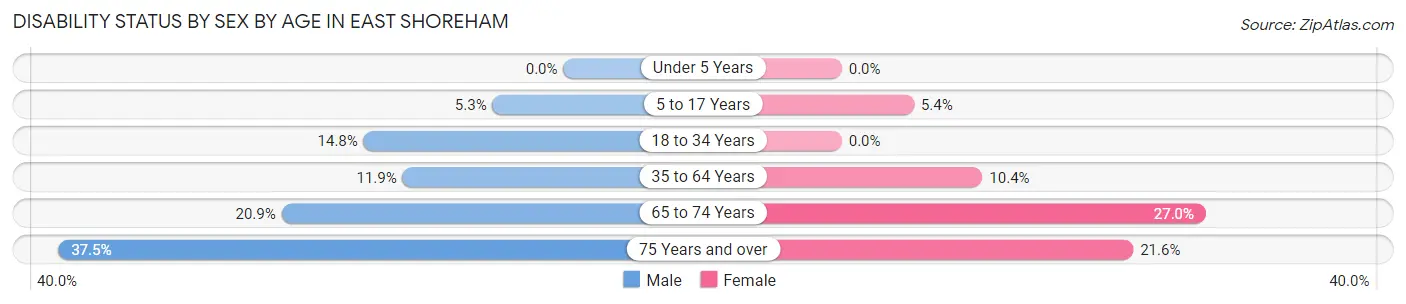
| Age Bracket | Male | Female |
| Under 5 Years | 0 (0.0%) | 0 (0.0%) |
| 5 to 17 Years | 33 (5.3%) | 54 (5.4%) |
| 18 to 34 Years | 163 (14.8%) | 0 (0.0%) |
| 35 to 64 Years | 180 (11.9%) | 160 (10.4%) |
| 65 to 74 Years | 50 (20.9%) | 70 (27.0%) |
| 75 Years and over | 66 (37.5%) | 29 (21.6%) |
Disability Class by Sex by Age in East Shoreham
Disability Class: Hearing Difficulty
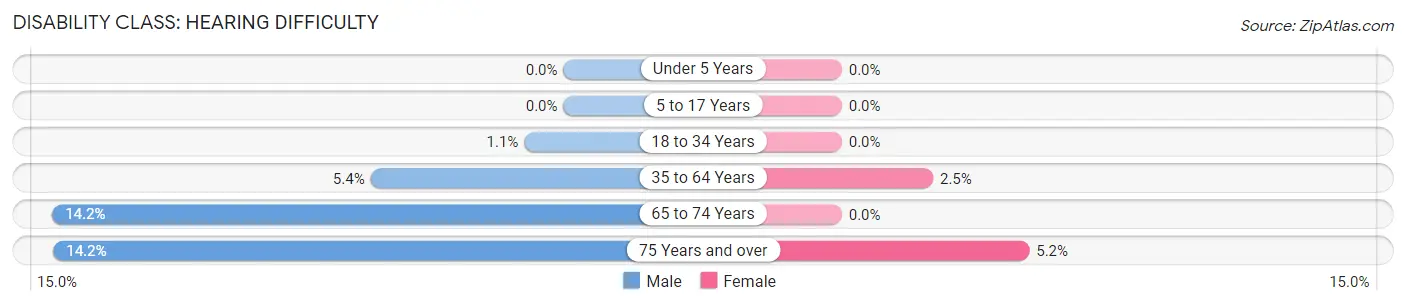
| Age Bracket | Male | Female |
| Under 5 Years | 0 (0.0%) | 0 (0.0%) |
| 5 to 17 Years | 0 (0.0%) | 0 (0.0%) |
| 18 to 34 Years | 12 (1.1%) | 0 (0.0%) |
| 35 to 64 Years | 81 (5.4%) | 39 (2.5%) |
| 65 to 74 Years | 34 (14.2%) | 0 (0.0%) |
| 75 Years and over | 25 (14.2%) | 7 (5.2%) |
Disability Class: Vision Difficulty
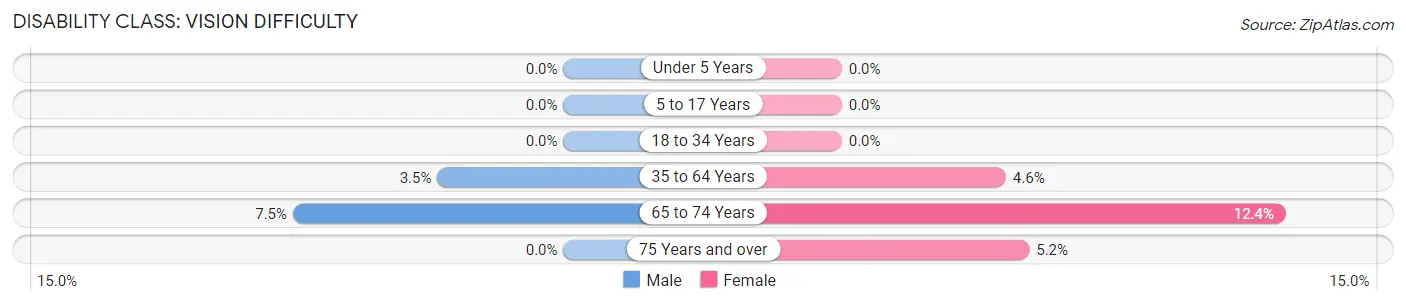
| Age Bracket | Male | Female |
| Under 5 Years | 0 (0.0%) | 0 (0.0%) |
| 5 to 17 Years | 0 (0.0%) | 0 (0.0%) |
| 18 to 34 Years | 0 (0.0%) | 0 (0.0%) |
| 35 to 64 Years | 53 (3.5%) | 70 (4.6%) |
| 65 to 74 Years | 18 (7.5%) | 32 (12.4%) |
| 75 Years and over | 0 (0.0%) | 7 (5.2%) |
Disability Class: Cognitive Difficulty
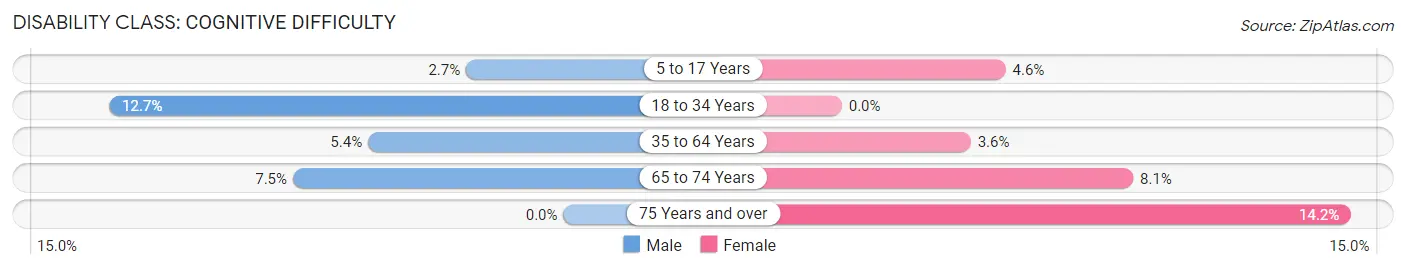
| Age Bracket | Male | Female |
| 5 to 17 Years | 17 (2.7%) | 46 (4.6%) |
| 18 to 34 Years | 139 (12.7%) | 0 (0.0%) |
| 35 to 64 Years | 82 (5.4%) | 55 (3.6%) |
| 65 to 74 Years | 18 (7.5%) | 21 (8.1%) |
| 75 Years and over | 0 (0.0%) | 19 (14.2%) |
Disability Class: Ambulatory Difficulty
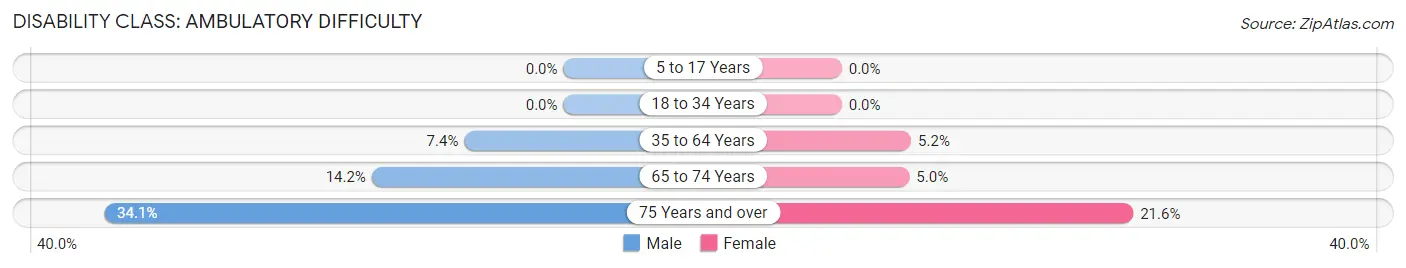
| Age Bracket | Male | Female |
| 5 to 17 Years | 0 (0.0%) | 0 (0.0%) |
| 18 to 34 Years | 0 (0.0%) | 0 (0.0%) |
| 35 to 64 Years | 111 (7.4%) | 79 (5.1%) |
| 65 to 74 Years | 34 (14.2%) | 13 (5.0%) |
| 75 Years and over | 60 (34.1%) | 29 (21.6%) |
Disability Class: Self-Care Difficulty
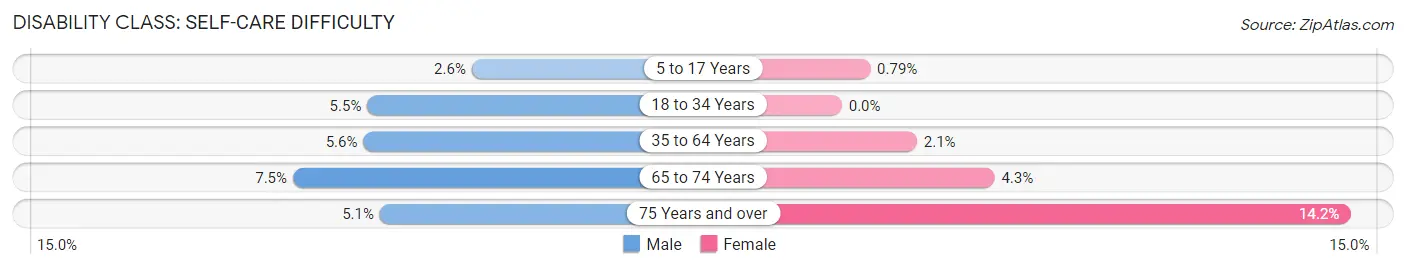
| Age Bracket | Male | Female |
| 5 to 17 Years | 16 (2.5%) | 8 (0.8%) |
| 18 to 34 Years | 60 (5.5%) | 0 (0.0%) |
| 35 to 64 Years | 84 (5.6%) | 32 (2.1%) |
| 65 to 74 Years | 18 (7.5%) | 11 (4.3%) |
| 75 Years and over | 9 (5.1%) | 19 (14.2%) |
Technology Access in East Shoreham
Computing Device Access in East Shoreham
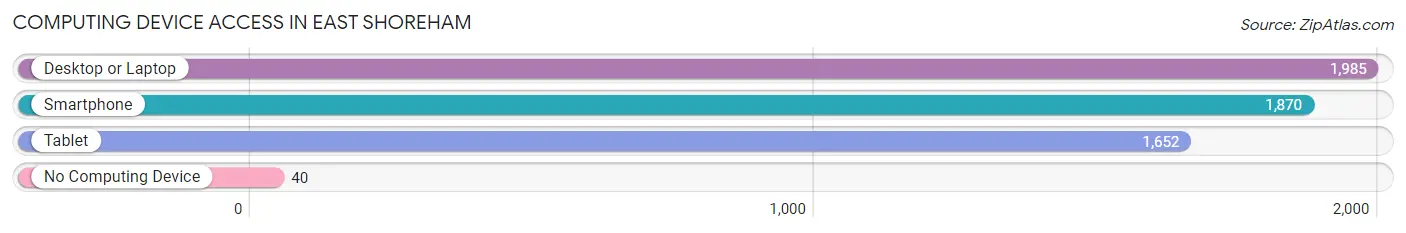
| Device Type | # Households | % Households |
| Desktop or Laptop | 1,985 | 96.8% |
| Smartphone | 1,870 | 91.2% |
| Tablet | 1,652 | 80.6% |
| No Computing Device | 40 | 1.9% |
| Total | 2,050 | 100.0% |
Internet Access in East Shoreham
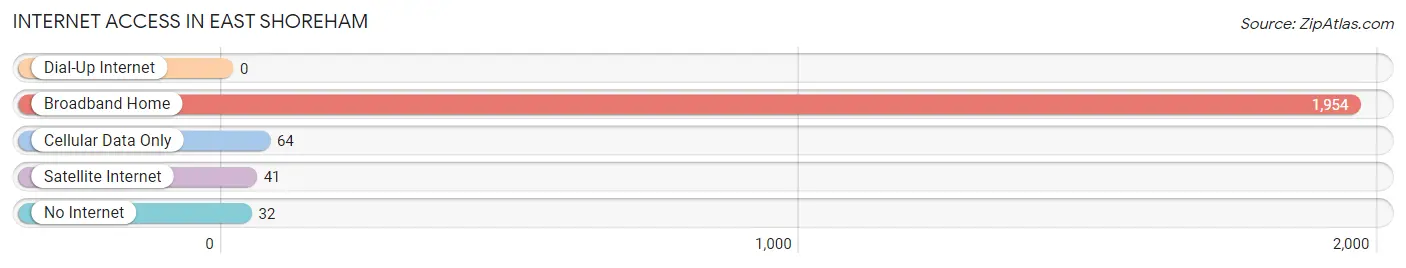
| Internet Type | # Households | % Households |
| Dial-Up Internet | 0 | 0.0% |
| Broadband Home | 1,954 | 95.3% |
| Cellular Data Only | 64 | 3.1% |
| Satellite Internet | 41 | 2.0% |
| No Internet | 32 | 1.6% |
| Total | 2,050 | 100.0% |
East Shoreham Summary
East Shoreham is a hamlet located in the Town of Brookhaven in Suffolk County, New York. It is situated on the north shore of Long Island, approximately 60 miles east of New York City. The hamlet is bordered by the hamlets of Shoreham and Wading River to the east, Rocky Point to the south, and Sound Beach to the west.
History
The area that is now East Shoreham was originally inhabited by the Setalcott Indians, a sub-tribe of the Algonquin Nation. The first European settlers arrived in the area in the late 1600s, and the hamlet was officially established in 1790. The hamlet was originally known as “East Shoreham” due to its location on the eastern shore of Long Island.
In the late 1800s, East Shoreham was a popular summer destination for wealthy New Yorkers. The area was home to several large estates, including the estate of William K. Vanderbilt, which was later converted into a golf course.
In the early 1900s, East Shoreham began to develop into a residential community. The hamlet was home to several small businesses, including a post office, a general store, and a blacksmith shop.
Geography
East Shoreham is located on the north shore of Long Island, approximately 60 miles east of New York City. The hamlet is bordered by the hamlets of Shoreham and Wading River to the east, Rocky Point to the south, and Sound Beach to the west.
The hamlet is situated on a peninsula that juts out into the Long Island Sound. The peninsula is surrounded by several small bays and inlets, including the Great South Bay, the Nissequogue River, and the Forge River.
The terrain of East Shoreham is mostly flat, with some rolling hills. The area is heavily wooded, with several small ponds and streams.
Economy
East Shoreham is primarily a residential community, with few businesses or industries. The hamlet is home to several small businesses, including a post office, a general store, and a blacksmith shop.
The hamlet is also home to several recreational facilities, including a golf course, a marina, and several parks. The hamlet is also home to several small farms, which produce a variety of fruits and vegetables.
Demographics
As of the 2010 census, the population of East Shoreham was 4,845. The population is predominantly white (94.3%), with small percentages of African American (2.2%), Asian (1.7%), and Hispanic (1.6%) residents.
The median household income in East Shoreham is $87,917, and the median home value is $521,400. The hamlet has a low unemployment rate (3.2%) and a high rate of homeownership (83.2%).
Conclusion
East Shoreham is a small hamlet located on the north shore of Long Island, approximately 60 miles east of New York City. The hamlet was originally inhabited by the Setalcott Indians, and was later settled by European settlers in the late 1600s. East Shoreham is primarily a residential community, with few businesses or industries. The hamlet is home to several recreational facilities, including a golf course, a marina, and several parks. The population of East Shoreham is predominantly white, with small percentages of African American, Asian, and Hispanic residents. The median household income in East Shoreham is $87,917, and the median home value is $521,400.
Common Questions
What is Per Capita Income in East Shoreham?
Per Capita income in East Shoreham is $52,729.
What is the Median Family Income in East Shoreham?
Median Family Income in East Shoreham is $171,042.
What is the Median Household income in East Shoreham?
Median Household Income in East Shoreham is $164,214.
What is Income or Wage Gap in East Shoreham?
Income or Wage Gap in East Shoreham is 14.6%.
Women in East Shoreham earn 85.4 cents for every dollar earned by a man.
What is Inequality or Gini Index in East Shoreham?
Inequality or Gini Index in East Shoreham is 0.32.
What is the Total Population of East Shoreham?
Total Population of East Shoreham is 7,367.
What is the Total Male Population of East Shoreham?
Total Male Population of East Shoreham is 3,832.
What is the Total Female Population of East Shoreham?
Total Female Population of East Shoreham is 3,535.
What is the Ratio of Males per 100 Females in East Shoreham?
There are 108.40 Males per 100 Females in East Shoreham.
What is the Ratio of Females per 100 Males in East Shoreham?
There are 92.25 Females per 100 Males in East Shoreham.
What is the Median Population Age in East Shoreham?
Median Population Age in East Shoreham is 37.1 Years.
What is the Average Family Size in East Shoreham
Average Family Size in East Shoreham is 3.7 People.
What is the Average Household Size in East Shoreham
Average Household Size in East Shoreham is 3.5 People.
How Large is the Labor Force in East Shoreham?
There are 3,724 People in the Labor Forcein in East Shoreham.
What is the Percentage of People in the Labor Force in East Shoreham?
65.5% of People are in the Labor Force in East Shoreham.
What is the Unemployment Rate in East Shoreham?
Unemployment Rate in East Shoreham is 3.7%.