Retsof, NY Map & Demographics
Retsof Map
Retsof Overview
$45,223
PER CAPITA INCOME
$187,652
AVG FAMILY INCOME
$125,500
AVG HOUSEHOLD INCOME
86.1%
WAGE / INCOME GAP [ % ]
13.9¢/ $1
WAGE / INCOME GAP [ $ ]
0.21
INEQUALITY / GINI INDEX
236
TOTAL POPULATION
80
MALE POPULATION
156
FEMALE POPULATION
51.28
MALES / 100 FEMALES
195.00
FEMALES / 100 MALES
41.4
MEDIAN AGE
3.5
AVG FAMILY SIZE
2.9
AVG HOUSEHOLD SIZE
191
LABOR FORCE [ PEOPLE ]
86.4%
PERCENT IN LABOR FORCE
Retsof Zip Codes
Retsof Area Codes
Income in Retsof
Income Overview in Retsof
Per Capita Income in Retsof is $45,223, while median incomes of families and households are $187,652 and $125,500 respectively.
| Characteristic | Number | Measure |
| Per Capita Income | 236 | $45,223 |
| Median Family Income | 62 | $187,652 |
| Mean Family Income | 62 | $156,931 |
| Median Household Income | 82 | $125,500 |
| Mean Household Income | 82 | $133,923 |
| Income Deficit | 62 | $0 |
| Wage / Income Gap (%) | 236 | 86.06% |
| Wage / Income Gap ($) | 236 | 13.94¢ per $1 |
| Gini / Inequality Index | 236 | 0.21 |
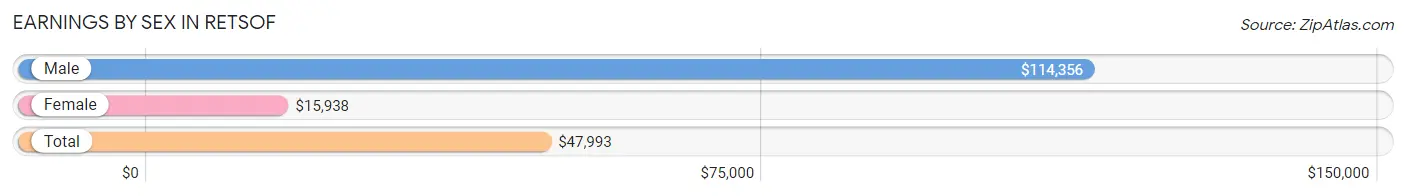
Earnings by Sex in Retsof
Average Earnings in Retsof are $47,993, $114,356 for men and $15,938 for women, a difference of 86.1%.
| Sex | Number | Average Earnings |
| Male | 65 (34.0%) | $114,356 |
| Female | 126 (66.0%) | $15,938 |
| Total | 191 (100.0%) | $47,993 |
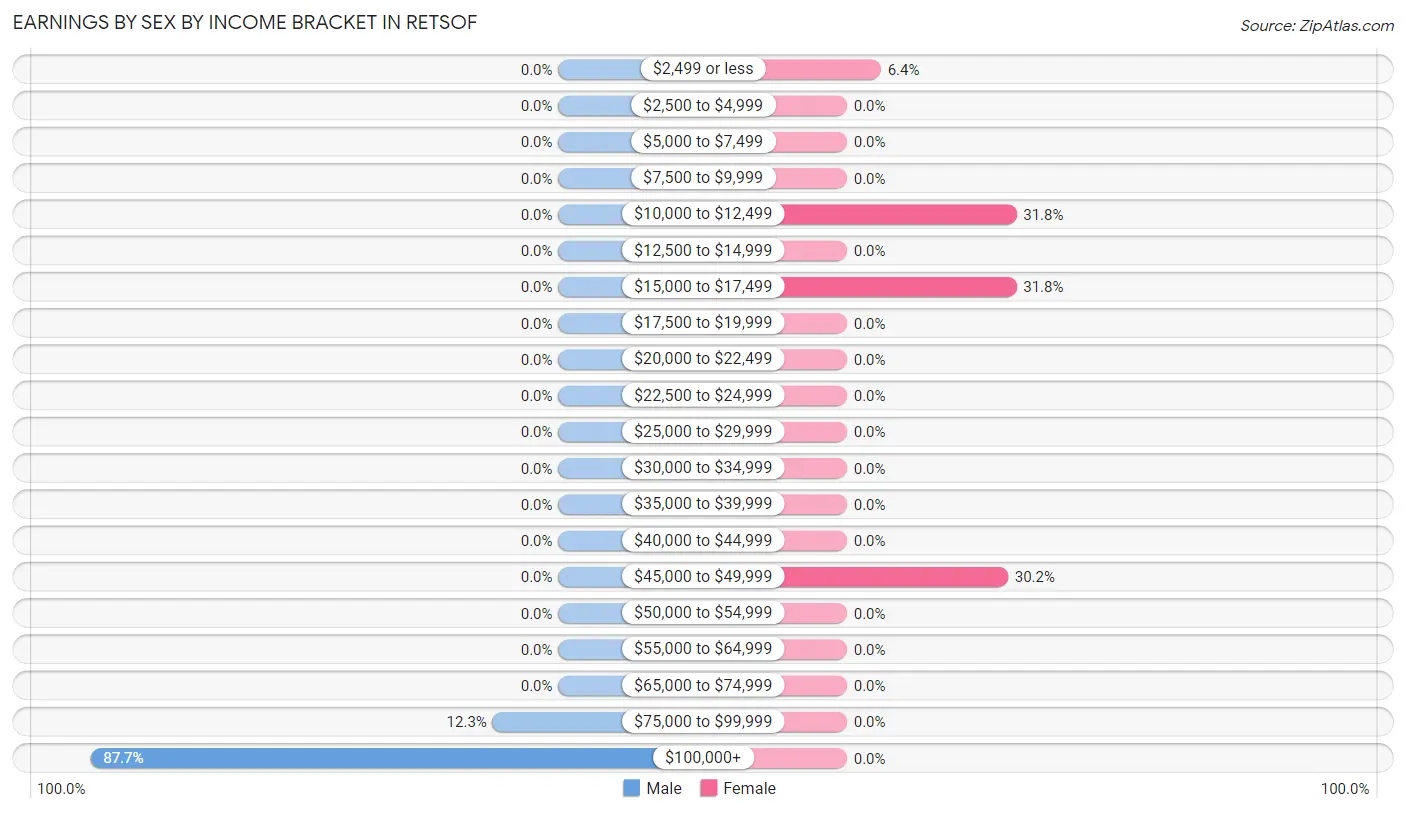
Earnings by Sex by Income Bracket in Retsof
The most common earnings brackets in Retsof are $100,000+ for men (57 | 87.7%) and $10,000 to $12,499 for women (40 | 31.8%).
| Income | Male | Female |
| $2,499 or less | 0 (0.0%) | 8 (6.4%) |
| $2,500 to $4,999 | 0 (0.0%) | 0 (0.0%) |
| $5,000 to $7,499 | 0 (0.0%) | 0 (0.0%) |
| $7,500 to $9,999 | 0 (0.0%) | 0 (0.0%) |
| $10,000 to $12,499 | 0 (0.0%) | 40 (31.8%) |
| $12,500 to $14,999 | 0 (0.0%) | 0 (0.0%) |
| $15,000 to $17,499 | 0 (0.0%) | 40 (31.8%) |
| $17,500 to $19,999 | 0 (0.0%) | 0 (0.0%) |
| $20,000 to $22,499 | 0 (0.0%) | 0 (0.0%) |
| $22,500 to $24,999 | 0 (0.0%) | 0 (0.0%) |
| $25,000 to $29,999 | 0 (0.0%) | 0 (0.0%) |
| $30,000 to $34,999 | 0 (0.0%) | 0 (0.0%) |
| $35,000 to $39,999 | 0 (0.0%) | 0 (0.0%) |
| $40,000 to $44,999 | 0 (0.0%) | 0 (0.0%) |
| $45,000 to $49,999 | 0 (0.0%) | 38 (30.2%) |
| $50,000 to $54,999 | 0 (0.0%) | 0 (0.0%) |
| $55,000 to $64,999 | 0 (0.0%) | 0 (0.0%) |
| $65,000 to $74,999 | 0 (0.0%) | 0 (0.0%) |
| $75,000 to $99,999 | 8 (12.3%) | 0 (0.0%) |
| $100,000+ | 57 (87.7%) | 0 (0.0%) |
| Total | 65 (100.0%) | 126 (100.0%) |
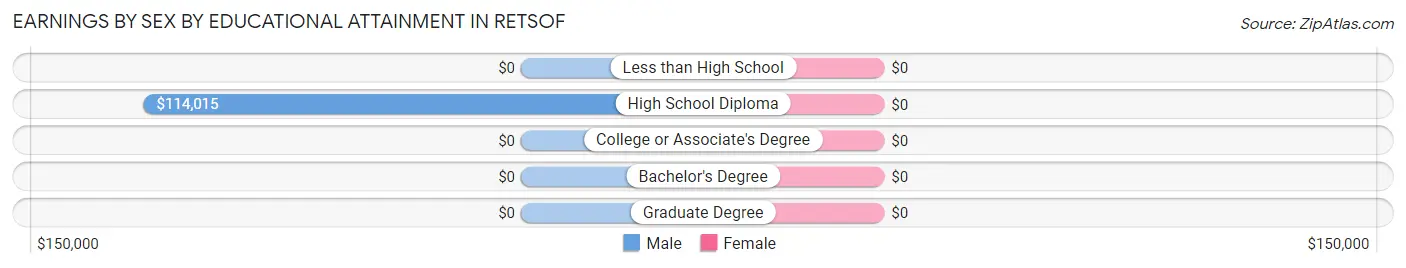
Earnings by Sex by Educational Attainment in Retsof
| Educational Attainment | Male Income | Female Income |
| Less than High School | - | - |
| High School Diploma | $114,015 | $0 |
| College or Associate's Degree | - | - |
| Bachelor's Degree | - | - |
| Graduate Degree | - | - |
| Total | $114,356 | $0 |
Family Income in Retsof
Family Income Brackets in Retsof
According to the Retsof family income data, there are 33 families falling into the $150,000 to $199,999 income range, which is the most common income bracket and makes up 53.2% of all families.
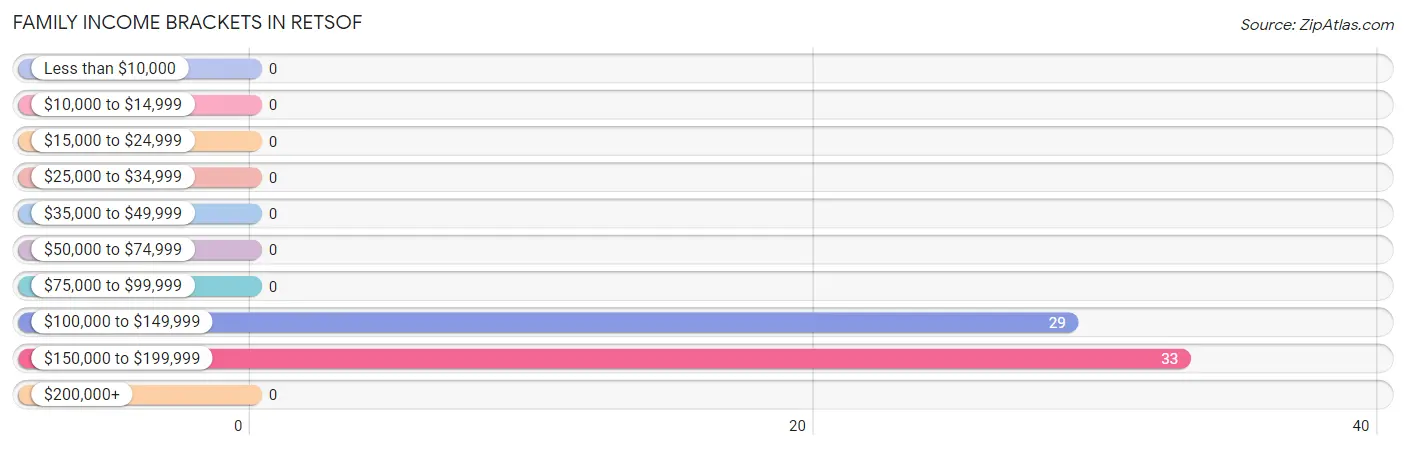
| Income Bracket | # Families | % Families |
| Less than $10,000 | 0 | 0.0% |
| $10,000 to $14,999 | 0 | 0.0% |
| $15,000 to $24,999 | 0 | 0.0% |
| $25,000 to $34,999 | 0 | 0.0% |
| $35,000 to $49,999 | 0 | 0.0% |
| $50,000 to $74,999 | 0 | 0.0% |
| $75,000 to $99,999 | 0 | 0.0% |
| $100,000 to $149,999 | 29 | 46.8% |
| $150,000 to $199,999 | 33 | 53.2% |
| $200,000+ | 0 | 0.0% |
Family Income by Famaliy Size in Retsof
| Income Bracket | # Families | Median Income |
| 2-Person Families | 0 (0.0%) | $0 |
| 3-Person Families | 29 (46.8%) | $0 |
| 4-Person Families | 33 (53.2%) | $0 |
| 5-Person Families | 0 (0.0%) | $0 |
| 6-Person Families | 0 (0.0%) | $0 |
| 7+ Person Families | 0 (0.0%) | $0 |
| Total | 62 (100.0%) | $187,652 |
Family Income by Number of Earners in Retsof
| Number of Earners | # Families | Median Income |
| No Earners | 0 (0.0%) | $0 |
| 1 Earner | 19 (30.6%) | $0 |
| 2 Earners | 0 (0.0%) | $0 |
| 3+ Earners | 43 (69.4%) | $0 |
| Total | 62 (100.0%) | $187,652 |
Household Income in Retsof
Household Income Brackets in Retsof
With 38 households falling in the category, the $100,000 to $149,999 income range is the most frequent in Retsof, accounting for 46.3% of all households.
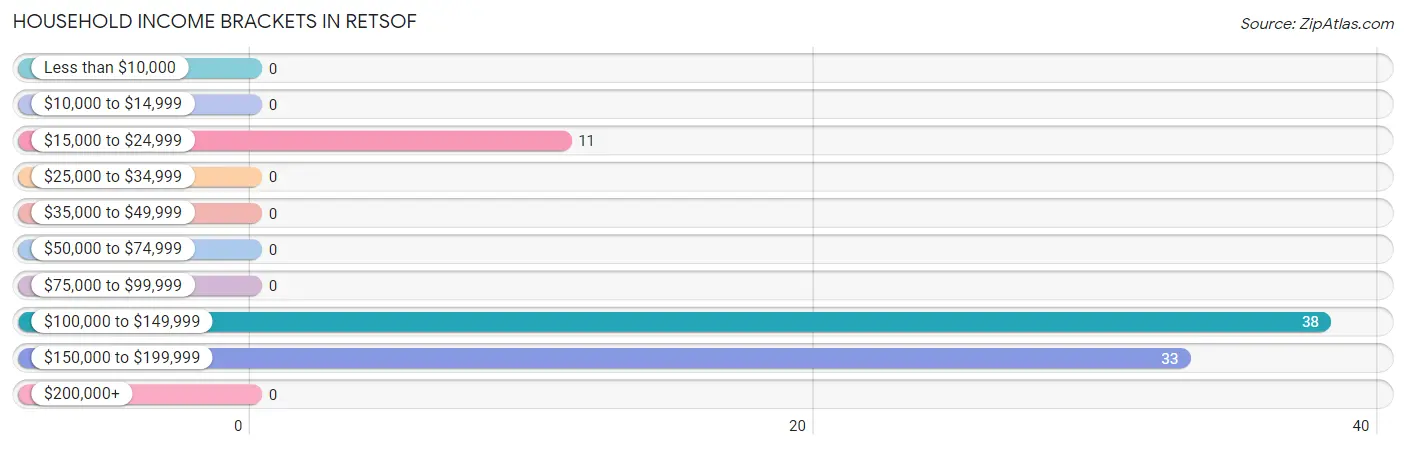
| Income Bracket | # Households | % Households |
| Less than $10,000 | 0 | 0.0% |
| $10,000 to $14,999 | 0 | 0.0% |
| $15,000 to $24,999 | 11 | 13.4% |
| $25,000 to $34,999 | 0 | 0.0% |
| $35,000 to $49,999 | 0 | 0.0% |
| $50,000 to $74,999 | 0 | 0.0% |
| $75,000 to $99,999 | 0 | 0.0% |
| $100,000 to $149,999 | 38 | 46.3% |
| $150,000 to $199,999 | 33 | 40.2% |
| $200,000+ | 0 | 0.0% |
Household Income by Householder Age in Retsof
The median household income in Retsof is $125,500, with the highest median household income of $188,030 found in the 45 to 64 years age bracket for the primary householder. A total of 52 households (63.4%) fall into this category.
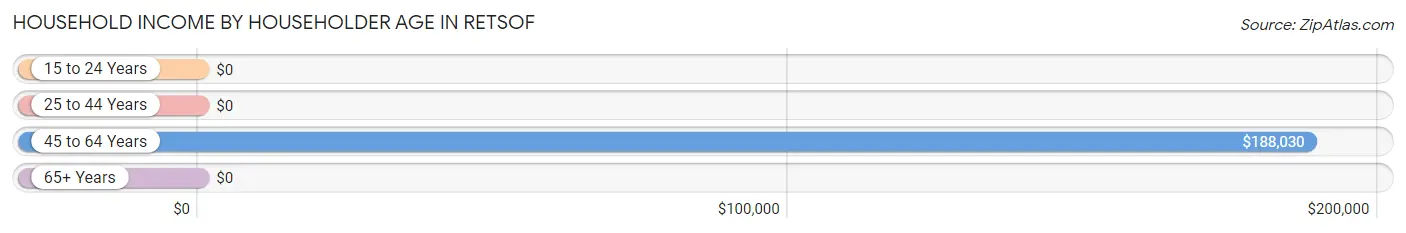
| Income Bracket | # Households | Median Income |
| 15 to 24 Years | 0 (0.0%) | $0 |
| 25 to 44 Years | 19 (23.2%) | $0 |
| 45 to 64 Years | 52 (63.4%) | $188,030 |
| 65+ Years | 11 (13.4%) | $0 |
| Total | 82 (100.0%) | $125,500 |
Poverty in Retsof
Income Below Poverty by Sex and Age in Retsof
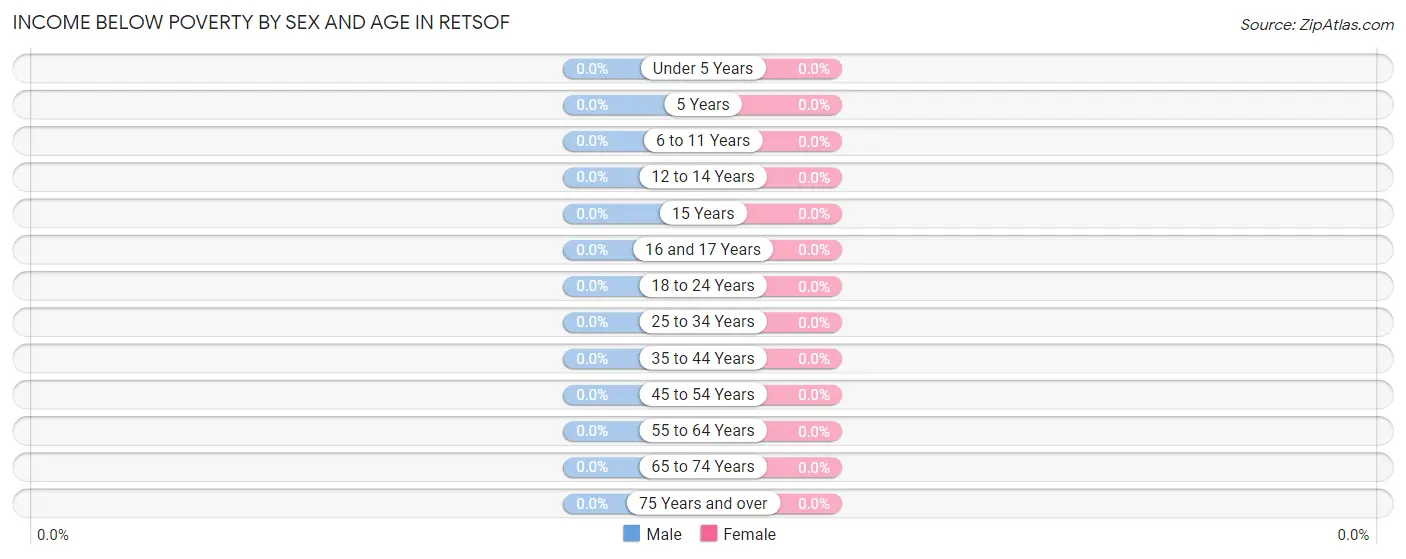
| Age Bracket | Male | Female |
| Under 5 Years | 0 (0.0%) | 0 (0.0%) |
| 5 Years | 0 (0.0%) | 0 (0.0%) |
| 6 to 11 Years | 0 (0.0%) | 0 (0.0%) |
| 12 to 14 Years | 0 (0.0%) | 0 (0.0%) |
| 15 Years | 0 (0.0%) | 0 (0.0%) |
| 16 and 17 Years | 0 (0.0%) | 0 (0.0%) |
| 18 to 24 Years | 0 (0.0%) | 0 (0.0%) |
| 25 to 34 Years | 0 (0.0%) | 0 (0.0%) |
| 35 to 44 Years | 0 (0.0%) | 0 (0.0%) |
| 45 to 54 Years | 0 (0.0%) | 0 (0.0%) |
| 55 to 64 Years | 0 (0.0%) | 0 (0.0%) |
| 65 to 74 Years | 0 (0.0%) | 0 (0.0%) |
| 75 Years and over | 0 (0.0%) | 0 (0.0%) |
| Total | 0 (0.0%) | 0 (0.0%) |
Income Above Poverty by Sex and Age in Retsof
According to the poverty statistics in Retsof, males aged under 5 years and females aged 16 and 17 years are the age groups that are most secure financially, with 100.0% of males and 100.0% of females in these age groups living above the poverty line.
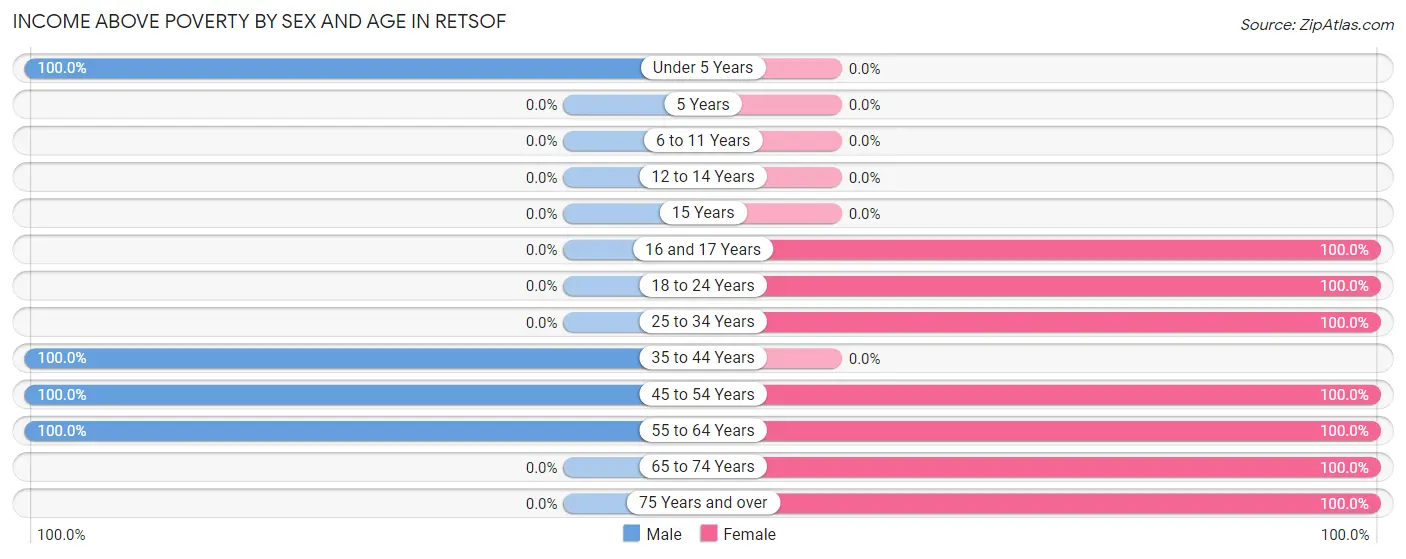
| Age Bracket | Male | Female |
| Under 5 Years | 15 (100.0%) | 0 (0.0%) |
| 5 Years | 0 (0.0%) | 0 (0.0%) |
| 6 to 11 Years | 0 (0.0%) | 0 (0.0%) |
| 12 to 14 Years | 0 (0.0%) | 0 (0.0%) |
| 15 Years | 0 (0.0%) | 0 (0.0%) |
| 16 and 17 Years | 0 (0.0%) | 38 (100.0%) |
| 18 to 24 Years | 0 (0.0%) | 40 (100.0%) |
| 25 to 34 Years | 0 (0.0%) | 19 (100.0%) |
| 35 to 44 Years | 15 (100.0%) | 0 (0.0%) |
| 45 to 54 Years | 41 (100.0%) | 38 (100.0%) |
| 55 to 64 Years | 9 (100.0%) | 10 (100.0%) |
| 65 to 74 Years | 0 (0.0%) | 7 (100.0%) |
| 75 Years and over | 0 (0.0%) | 4 (100.0%) |
| Total | 80 (100.0%) | 156 (100.0%) |
Income Below Poverty Among Married-Couple Families in Retsof
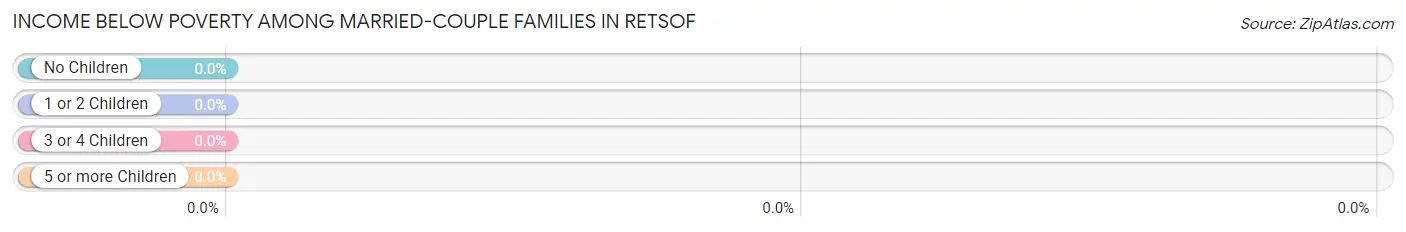
| Children | Above Poverty | Below Poverty |
| No Children | 0 (0.0%) | 0 (0.0%) |
| 1 or 2 Children | 62 (100.0%) | 0 (0.0%) |
| 3 or 4 Children | 0 (0.0%) | 0 (0.0%) |
| 5 or more Children | 0 (0.0%) | 0 (0.0%) |
| Total | 62 (100.0%) | 0 (0.0%) |
Income Below Poverty Among Single-Parent Households in Retsof
| Children | Single Father | Single Mother |
| No Children | 0 (0.0%) | 0 (0.0%) |
| 1 or 2 Children | 0 (0.0%) | 0 (0.0%) |
| 3 or 4 Children | 0 (0.0%) | 0 (0.0%) |
| 5 or more Children | 0 (0.0%) | 0 (0.0%) |
| Total | 0 (0.0%) | 0 (0.0%) |
Income Below Poverty Among Married-Couple vs Single-Parent Households in Retsof
| Children | Married-Couple Families | Single-Parent Households |
| No Children | 0 (0.0%) | 0 (0.0%) |
| 1 or 2 Children | 0 (0.0%) | 0 (0.0%) |
| 3 or 4 Children | 0 (0.0%) | 0 (0.0%) |
| 5 or more Children | 0 (0.0%) | 0 (0.0%) |
| Total | 0 (0.0%) | 0 (0.0%) |
Race in Retsof
The most populous races in Retsof are , and White / Caucasian (236 | 100.0%).
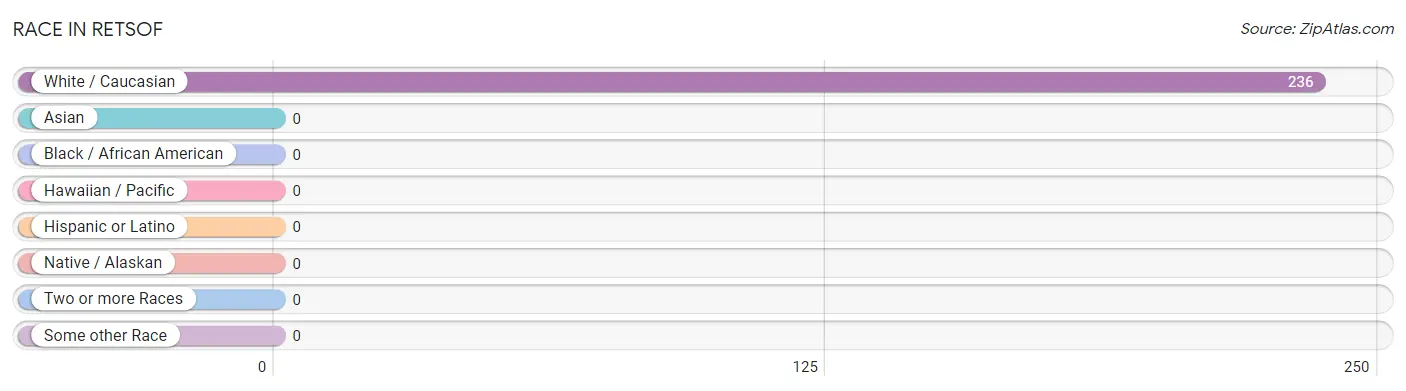
| Race | # Population | % Population |
| Asian | 0 | 0.0% |
| Black / African American | 0 | 0.0% |
| Hawaiian / Pacific | 0 | 0.0% |
| Hispanic or Latino | 0 | 0.0% |
| Native / Alaskan | 0 | 0.0% |
| White / Caucasian | 236 | 100.0% |
| Two or more Races | 0 | 0.0% |
| Some other Race | 0 | 0.0% |
| Total | 236 | 100.0% |
Ancestry in Retsof
The most populous ancestries reported in Retsof are Italian (167 | 70.8%), Irish (141 | 59.8%), American (7 | 3.0%), and German (4 | 1.7%), together accounting for 135.2% of all Retsof residents.
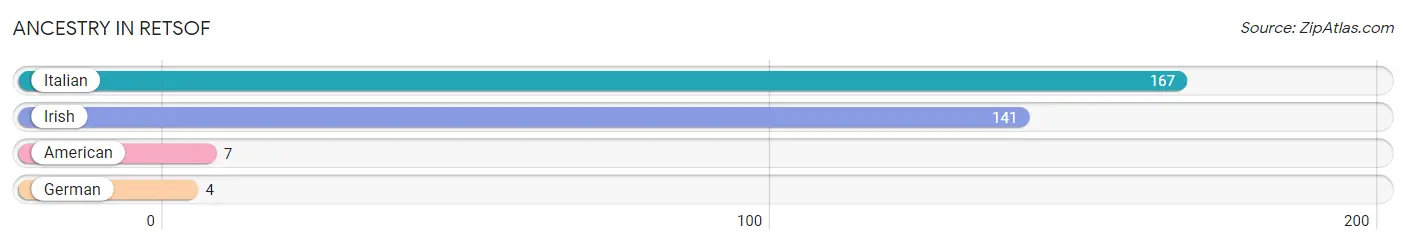
| Ancestry | # Population | % Population |
| American | 7 | 3.0% |
| German | 4 | 1.7% |
| Irish | 141 | 59.8% |
| Italian | 167 | 70.8% | View All 4 Rows |
Immigrants in Retsof

| Immigration Origin | # Population | % Population | View All 0 Rows |
Sex and Age in Retsof
Sex and Age in Retsof
The most populous age groups in Retsof are 50 to 54 Years (41 | 51.2%) for men and 20 to 24 Years (40 | 25.6%) for women.
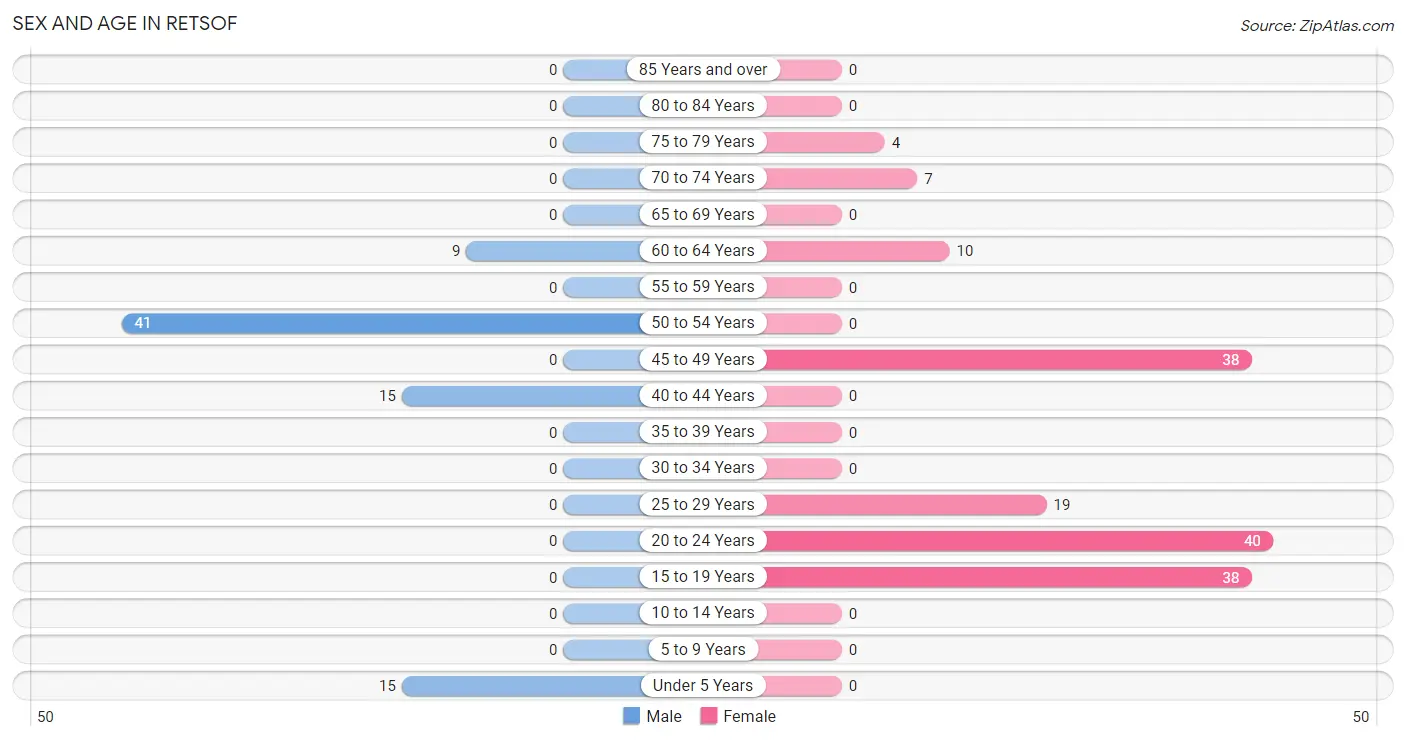
| Age Bracket | Male | Female |
| Under 5 Years | 15 (18.8%) | 0 (0.0%) |
| 5 to 9 Years | 0 (0.0%) | 0 (0.0%) |
| 10 to 14 Years | 0 (0.0%) | 0 (0.0%) |
| 15 to 19 Years | 0 (0.0%) | 38 (24.4%) |
| 20 to 24 Years | 0 (0.0%) | 40 (25.6%) |
| 25 to 29 Years | 0 (0.0%) | 19 (12.2%) |
| 30 to 34 Years | 0 (0.0%) | 0 (0.0%) |
| 35 to 39 Years | 0 (0.0%) | 0 (0.0%) |
| 40 to 44 Years | 15 (18.8%) | 0 (0.0%) |
| 45 to 49 Years | 0 (0.0%) | 38 (24.4%) |
| 50 to 54 Years | 41 (51.2%) | 0 (0.0%) |
| 55 to 59 Years | 0 (0.0%) | 0 (0.0%) |
| 60 to 64 Years | 9 (11.3%) | 10 (6.4%) |
| 65 to 69 Years | 0 (0.0%) | 0 (0.0%) |
| 70 to 74 Years | 0 (0.0%) | 7 (4.5%) |
| 75 to 79 Years | 0 (0.0%) | 4 (2.6%) |
| 80 to 84 Years | 0 (0.0%) | 0 (0.0%) |
| 85 Years and over | 0 (0.0%) | 0 (0.0%) |
| Total | 80 (100.0%) | 156 (100.0%) |
Families and Households in Retsof
Median Family Size in Retsof
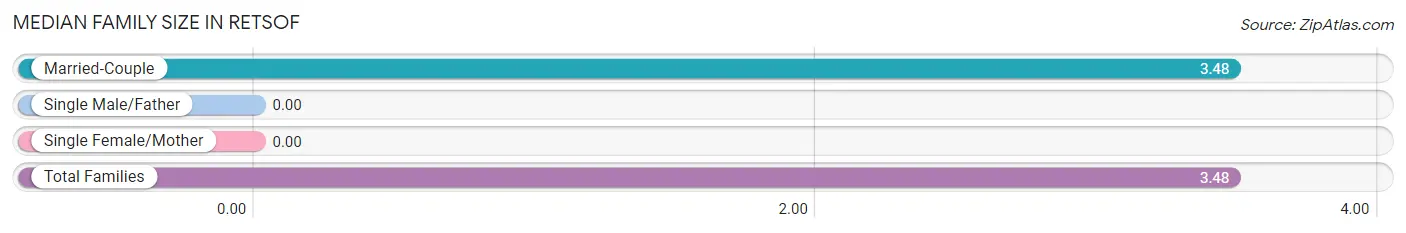
| Family Type | # Families | Family Size |
| Married-Couple | 62 (100.0%) | 3.48 |
| Single Male/Father | 0 (0.0%) | - |
| Single Female/Mother | 0 (0.0%) | - |
| Total Families | 62 (100.0%) | 3.48 |
Median Household Size in Retsof
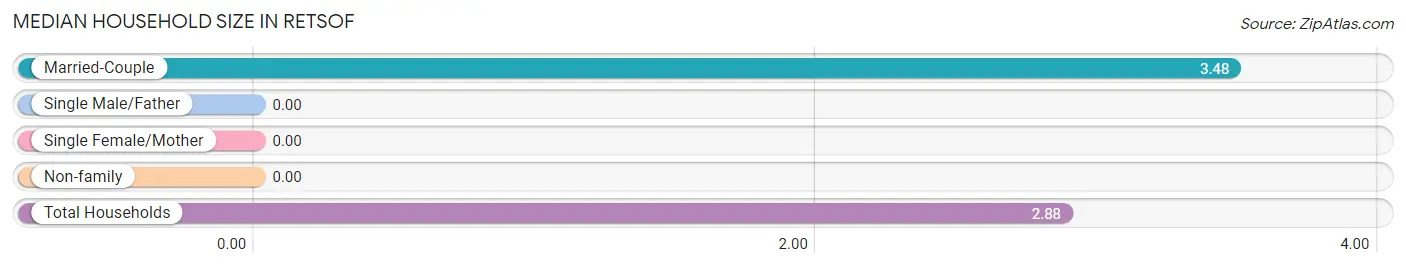
| Household Type | # Households | Household Size |
| Married-Couple | 62 (75.6%) | 3.48 |
| Single Male/Father | 0 (0.0%) | - |
| Single Female/Mother | 0 (0.0%) | - |
| Non-family | 20 (24.4%) | - |
| Total Households | 82 (100.0%) | 2.88 |
Household Size by Marriage Status in Retsof
Out of a total of 82 households in Retsof, 62 (75.6%) are family households, while 20 (24.4%) are nonfamily households. The most numerous type of family households are 4-person households, comprising 33, and the most common type of nonfamily households are 1-person households, comprising 20.
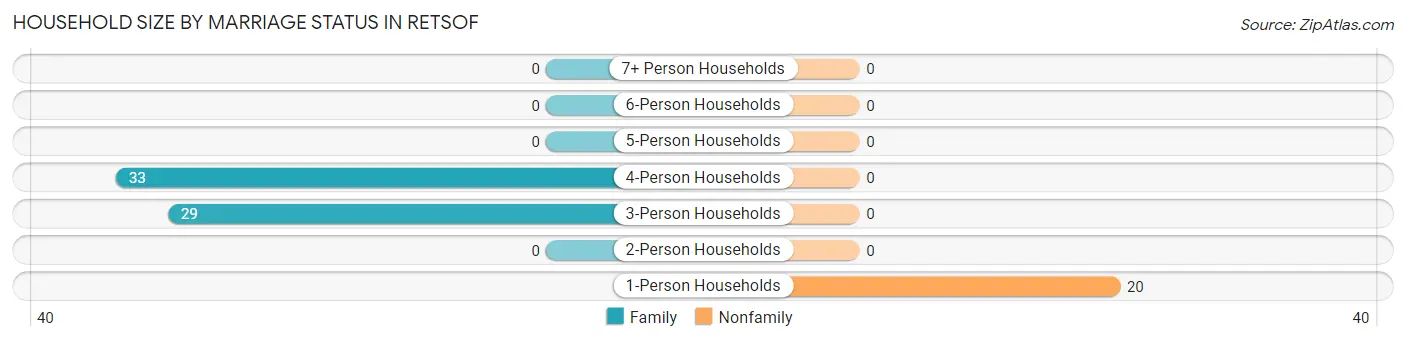
| Household Size | Family Households | Nonfamily Households |
| 1-Person Households | - | 20 (24.4%) |
| 2-Person Households | 0 (0.0%) | 0 (0.0%) |
| 3-Person Households | 29 (35.4%) | 0 (0.0%) |
| 4-Person Households | 33 (40.2%) | 0 (0.0%) |
| 5-Person Households | 0 (0.0%) | 0 (0.0%) |
| 6-Person Households | 0 (0.0%) | 0 (0.0%) |
| 7+ Person Households | 0 (0.0%) | 0 (0.0%) |
| Total | 62 (75.6%) | 20 (24.4%) |
Female Fertility in Retsof
Fertility by Age in Retsof
| Age Bracket | Women with Births | Births / 1,000 Women |
| 15 to 19 years | 0 (0.0%) | 0.0 |
| 20 to 34 years | 0 (0.0%) | 0.0 |
| 35 to 50 years | 0 (0.0%) | 0.0 |
| Total | 0 (0.0%) | 0.0 |
Fertility by Age by Marriage Status in Retsof
| Age Bracket | Married | Unmarried |
| 15 to 19 years | 0 (0.0%) | 0 (0.0%) |
| 20 to 34 years | 0 (0.0%) | 0 (0.0%) |
| 35 to 50 years | 0 (0.0%) | 0 (0.0%) |
| Total | 0 (0.0%) | 0 (0.0%) |
Fertility by Education in Retsof
| Educational Attainment | Women with Births | Births / 1,000 Women |
| Less than High School | 0 (0.0%) | 0.0 |
| High School Diploma | 0 (0.0%) | 0.0 |
| College or Associate's Degree | 0 (0.0%) | 0.0 |
| Bachelor's Degree | 0 (0.0%) | 0.0 |
| Graduate Degree | 0 (0.0%) | 0.0 |
| Total | 0 (0.0%) | 0.0 |
Fertility by Education by Marriage Status in Retsof
| Educational Attainment | Married | Unmarried |
| Less than High School | 0 (0.0%) | 0 (0.0%) |
| High School Diploma | 0 (0.0%) | 0 (0.0%) |
| College or Associate's Degree | 0 (0.0%) | 0 (0.0%) |
| Bachelor's Degree | 0 (0.0%) | 0 (0.0%) |
| Graduate Degree | 0 (0.0%) | 0 (0.0%) |
| Total | 0 (0.0%) | 0 (0.0%) |
Employment Characteristics in Retsof
Employment by Class of Employer in Retsof
Among the 191 employed individuals in Retsof, private company employees (143 | 74.9%), state government employees (40 | 20.9%), and local government employees (8 | 4.2%) make up the most common classes of employment.
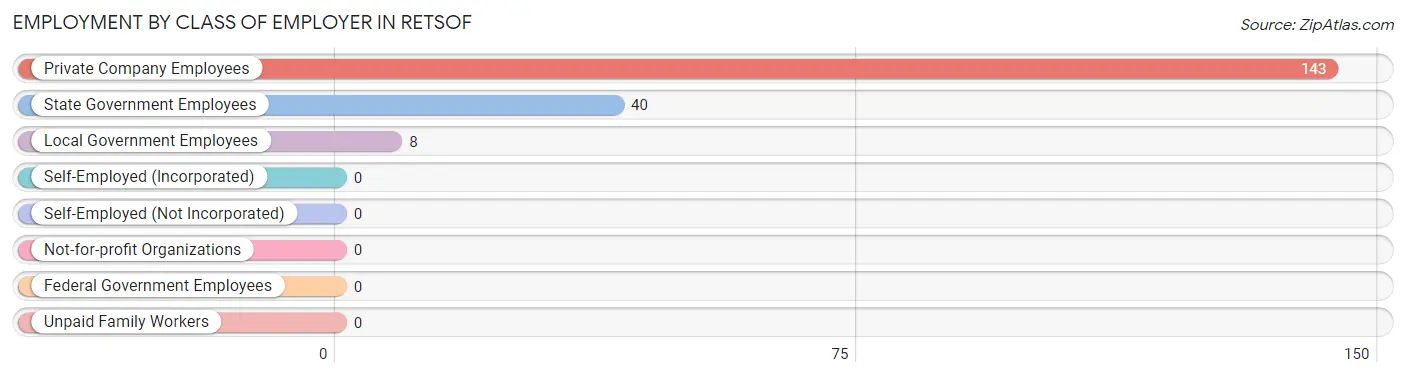
| Employer Class | # Employees | % Employees |
| Private Company Employees | 143 | 74.9% |
| Self-Employed (Incorporated) | 0 | 0.0% |
| Self-Employed (Not Incorporated) | 0 | 0.0% |
| Not-for-profit Organizations | 0 | 0.0% |
| Local Government Employees | 8 | 4.2% |
| State Government Employees | 40 | 20.9% |
| Federal Government Employees | 0 | 0.0% |
| Unpaid Family Workers | 0 | 0.0% |
| Total | 191 | 100.0% |
Employment Status by Age in Retsof
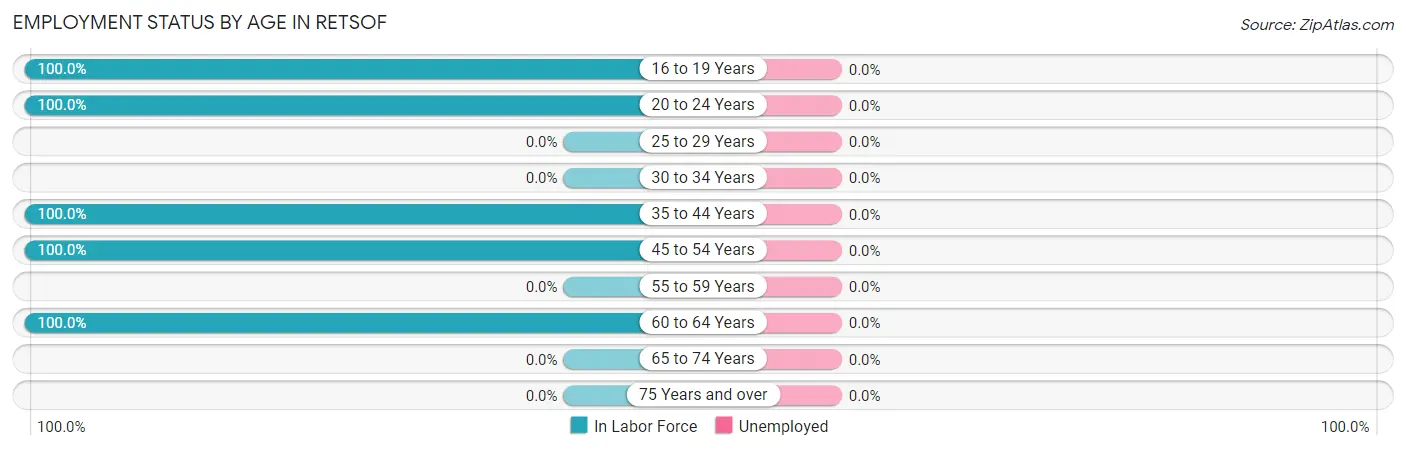
| Age Bracket | In Labor Force | Unemployed |
| 16 to 19 Years | 38 (100.0%) | 0 (0.0%) |
| 20 to 24 Years | 40 (100.0%) | 0 (0.0%) |
| 25 to 29 Years | 0 (0.0%) | 0 (0.0%) |
| 30 to 34 Years | 0 (0.0%) | 0 (0.0%) |
| 35 to 44 Years | 15 (100.0%) | 0 (0.0%) |
| 45 to 54 Years | 79 (100.0%) | 0 (0.0%) |
| 55 to 59 Years | 0 (0.0%) | 0 (0.0%) |
| 60 to 64 Years | 19 (100.0%) | 0 (0.0%) |
| 65 to 74 Years | 0 (0.0%) | 0 (0.0%) |
| 75 Years and over | 0 (0.0%) | 0 (0.0%) |
| Total | 191 (86.4%) | 0 (0.0%) |
Employment Status by Educational Attainment in Retsof
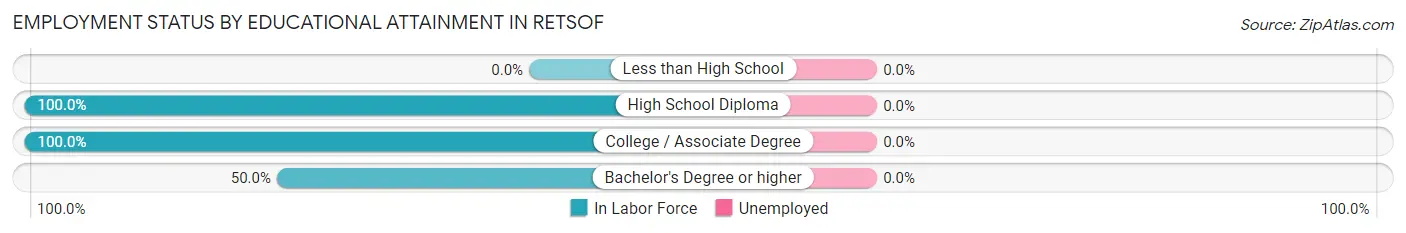
| Educational Attainment | In Labor Force | Unemployed |
| Less than High School | 0 (0.0%) | 0 (0.0%) |
| High School Diploma | 56 (100.0%) | 0 (0.0%) |
| College / Associate Degree | 38 (100.0%) | 0 (0.0%) |
| Bachelor's Degree or higher | 19 (50.0%) | 0 (0.0%) |
| Total | 113 (85.6%) | 0 (0.0%) |
Employment Occupations by Sex in Retsof
Management, Business, Science and Arts Occupations
The most common Management, Business, Science and Arts occupations in Retsof are Community & Social Service (40 | 20.9%), Education Instruction & Library (40 | 20.9%), and Business & Financial (9 | 4.7%).
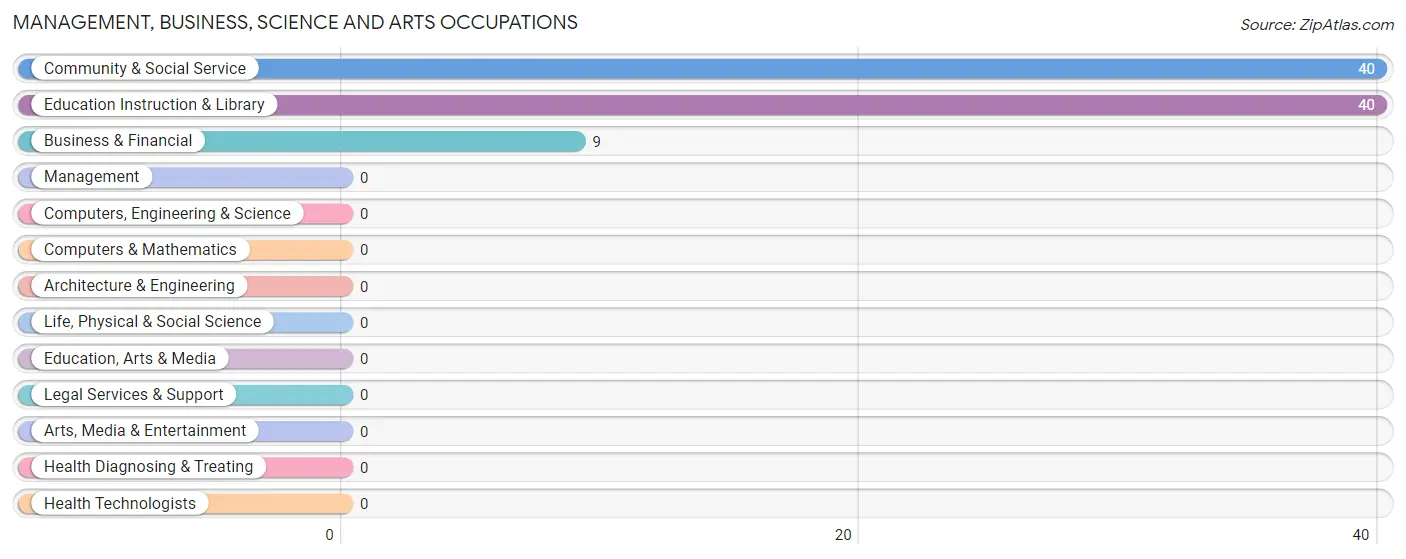
Management, Business, Science and Arts Occupations by Sex
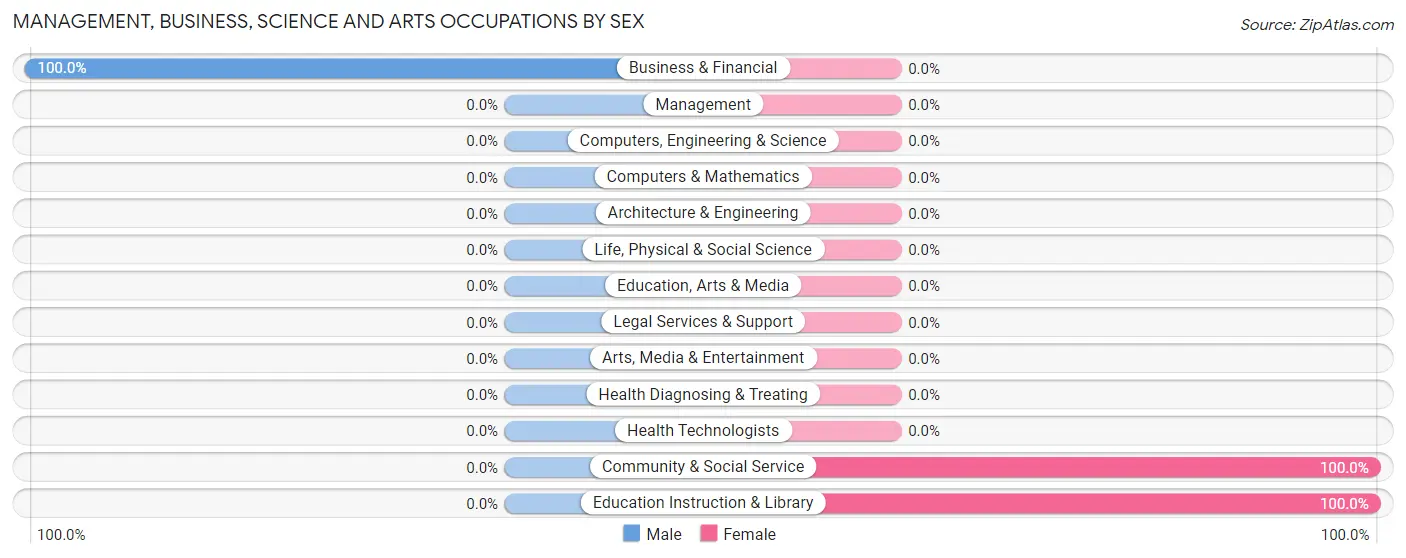
| Occupation | Male | Female |
| Management | 0 (0.0%) | 0 (0.0%) |
| Business & Financial | 9 (100.0%) | 0 (0.0%) |
| Computers, Engineering & Science | 0 (0.0%) | 0 (0.0%) |
| Computers & Mathematics | 0 (0.0%) | 0 (0.0%) |
| Architecture & Engineering | 0 (0.0%) | 0 (0.0%) |
| Life, Physical & Social Science | 0 (0.0%) | 0 (0.0%) |
| Community & Social Service | 0 (0.0%) | 40 (100.0%) |
| Education, Arts & Media | 0 (0.0%) | 0 (0.0%) |
| Legal Services & Support | 0 (0.0%) | 0 (0.0%) |
| Education Instruction & Library | 0 (0.0%) | 40 (100.0%) |
| Arts, Media & Entertainment | 0 (0.0%) | 0 (0.0%) |
| Health Diagnosing & Treating | 0 (0.0%) | 0 (0.0%) |
| Health Technologists | 0 (0.0%) | 0 (0.0%) |
| Total (Category) | 9 (18.4%) | 40 (81.6%) |
| Total (Overall) | 65 (34.0%) | 126 (66.0%) |
Services Occupations
The most common Services occupations in Retsof are Security & Protection (8 | 4.2%), and Law Enforcement (8 | 4.2%).
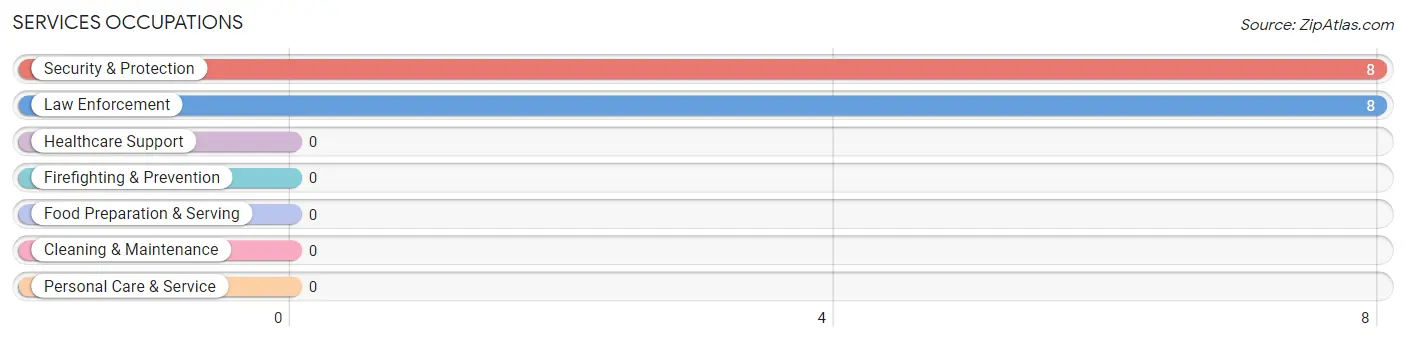
Services Occupations by Sex
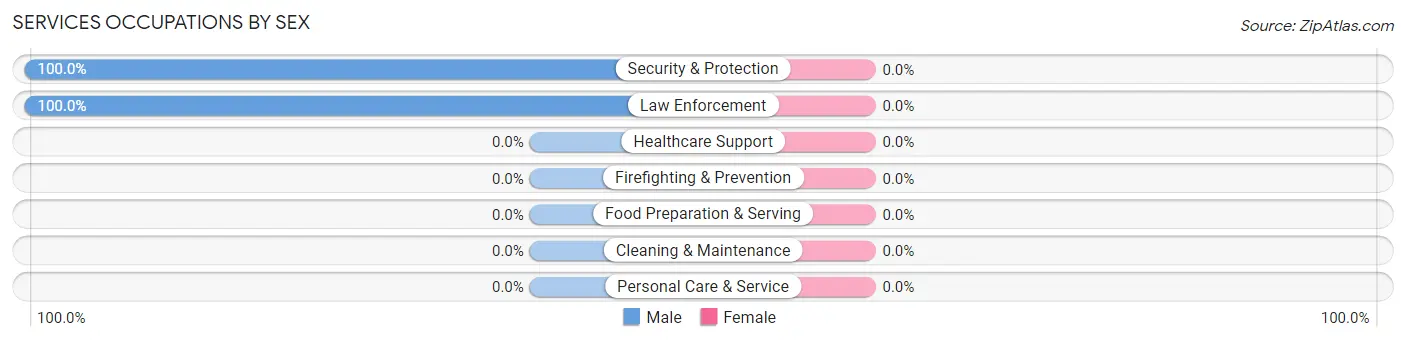
| Occupation | Male | Female |
| Healthcare Support | 0 (0.0%) | 0 (0.0%) |
| Security & Protection | 8 (100.0%) | 0 (0.0%) |
| Firefighting & Prevention | 0 (0.0%) | 0 (0.0%) |
| Law Enforcement | 8 (100.0%) | 0 (0.0%) |
| Food Preparation & Serving | 0 (0.0%) | 0 (0.0%) |
| Cleaning & Maintenance | 0 (0.0%) | 0 (0.0%) |
| Personal Care & Service | 0 (0.0%) | 0 (0.0%) |
| Total (Category) | 8 (100.0%) | 0 (0.0%) |
| Total (Overall) | 65 (34.0%) | 126 (66.0%) |
Sales and Office Occupations
The most common Sales and Office occupations in Retsof are Sales & Related (38 | 19.9%), and Office & Administration (38 | 19.9%).
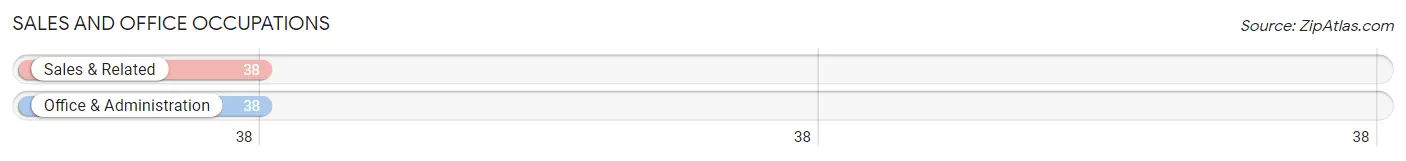
Sales and Office Occupations by Sex
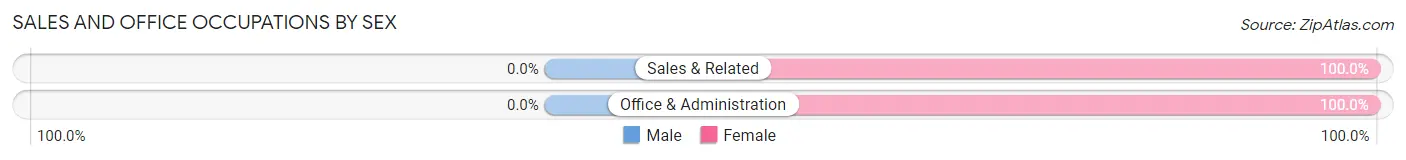
| Occupation | Male | Female |
| Sales & Related | 0 (0.0%) | 38 (100.0%) |
| Office & Administration | 0 (0.0%) | 38 (100.0%) |
| Total (Category) | 0 (0.0%) | 76 (100.0%) |
| Total (Overall) | 65 (34.0%) | 126 (66.0%) |
Natural Resources, Construction and Maintenance Occupations
The most common Natural Resources, Construction and Maintenance occupations in Retsof are Installation, Maintenance & Repair (33 | 17.3%), and Construction & Extraction (15 | 7.9%).
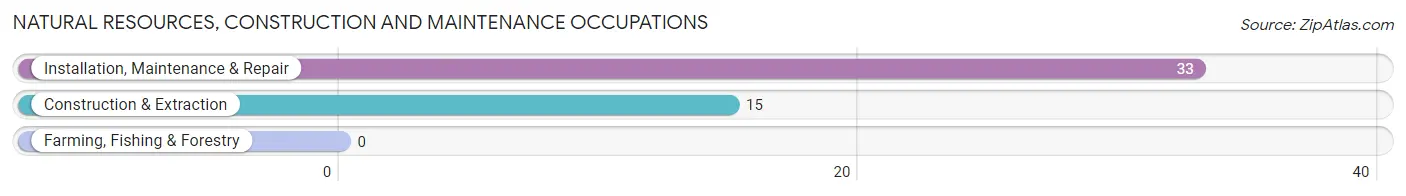
Natural Resources, Construction and Maintenance Occupations by Sex
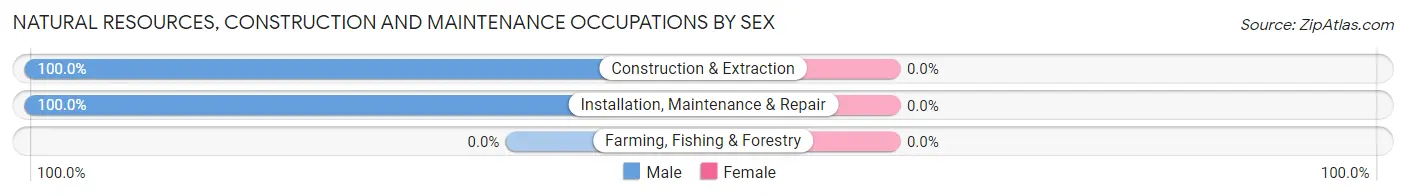
| Occupation | Male | Female |
| Farming, Fishing & Forestry | 0 (0.0%) | 0 (0.0%) |
| Construction & Extraction | 15 (100.0%) | 0 (0.0%) |
| Installation, Maintenance & Repair | 33 (100.0%) | 0 (0.0%) |
| Total (Category) | 48 (100.0%) | 0 (0.0%) |
| Total (Overall) | 65 (34.0%) | 126 (66.0%) |
Production, Transportation and Moving Occupations
The most common Production, Transportation and Moving occupations in Retsof are , and Transportation (10 | 5.2%).
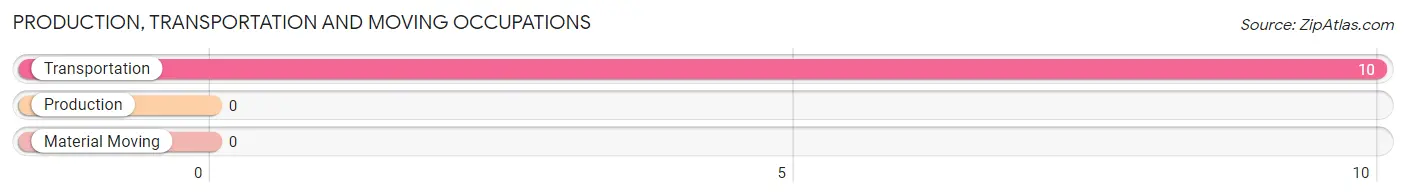
Production, Transportation and Moving Occupations by Sex
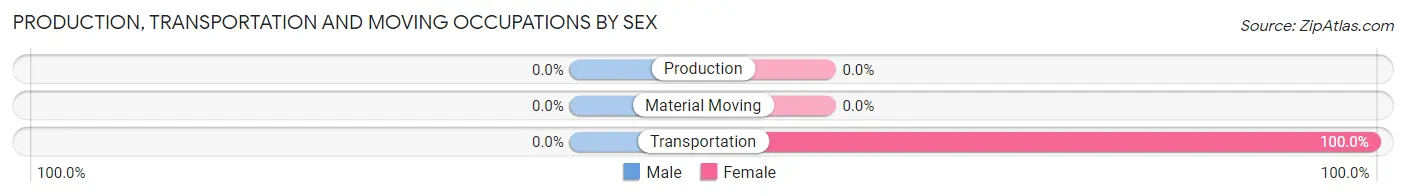
| Occupation | Male | Female |
| Production | 0 (0.0%) | 0 (0.0%) |
| Transportation | 0 (0.0%) | 10 (100.0%) |
| Material Moving | 0 (0.0%) | 0 (0.0%) |
| Total (Category) | 0 (0.0%) | 10 (100.0%) |
| Total (Overall) | 65 (34.0%) | 126 (66.0%) |
Employment Industries by Sex in Retsof
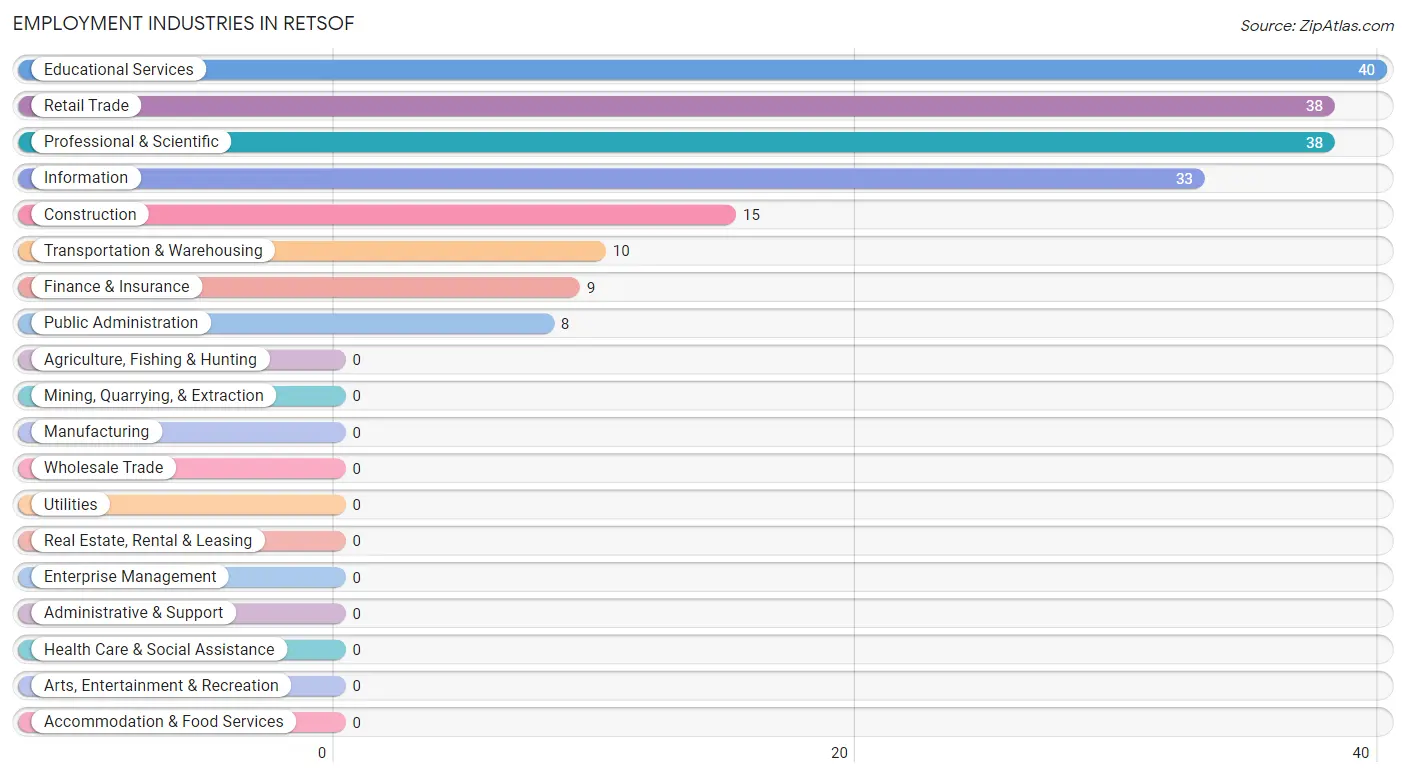
Employment Industries in Retsof
The major employment industries in Retsof include Educational Services (40 | 20.9%), Retail Trade (38 | 19.9%), Professional & Scientific (38 | 19.9%), Information (33 | 17.3%), and Construction (15 | 7.9%).
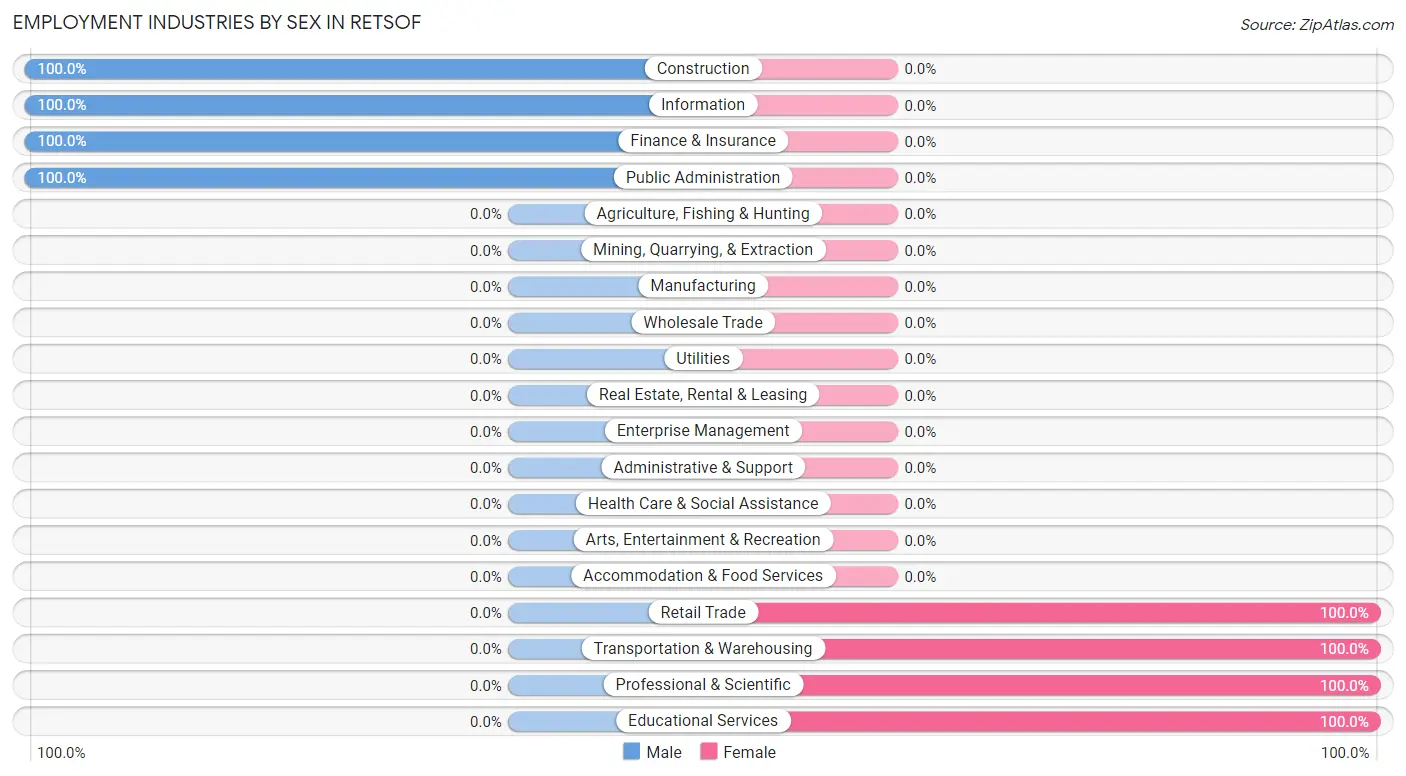
Employment Industries by Sex in Retsof
The Retsof industries that see more men than women are Construction (100.0%), Information (100.0%), and Finance & Insurance (100.0%), whereas the industries that tend to have a higher number of women are Retail Trade (100.0%), Transportation & Warehousing (100.0%), and Professional & Scientific (100.0%).
| Industry | Male | Female |
| Agriculture, Fishing & Hunting | 0 (0.0%) | 0 (0.0%) |
| Mining, Quarrying, & Extraction | 0 (0.0%) | 0 (0.0%) |
| Construction | 15 (100.0%) | 0 (0.0%) |
| Manufacturing | 0 (0.0%) | 0 (0.0%) |
| Wholesale Trade | 0 (0.0%) | 0 (0.0%) |
| Retail Trade | 0 (0.0%) | 38 (100.0%) |
| Transportation & Warehousing | 0 (0.0%) | 10 (100.0%) |
| Utilities | 0 (0.0%) | 0 (0.0%) |
| Information | 33 (100.0%) | 0 (0.0%) |
| Finance & Insurance | 9 (100.0%) | 0 (0.0%) |
| Real Estate, Rental & Leasing | 0 (0.0%) | 0 (0.0%) |
| Professional & Scientific | 0 (0.0%) | 38 (100.0%) |
| Enterprise Management | 0 (0.0%) | 0 (0.0%) |
| Administrative & Support | 0 (0.0%) | 0 (0.0%) |
| Educational Services | 0 (0.0%) | 40 (100.0%) |
| Health Care & Social Assistance | 0 (0.0%) | 0 (0.0%) |
| Arts, Entertainment & Recreation | 0 (0.0%) | 0 (0.0%) |
| Accommodation & Food Services | 0 (0.0%) | 0 (0.0%) |
| Public Administration | 8 (100.0%) | 0 (0.0%) |
| Total | 65 (34.0%) | 126 (66.0%) |
Education in Retsof
School Enrollment in Retsof
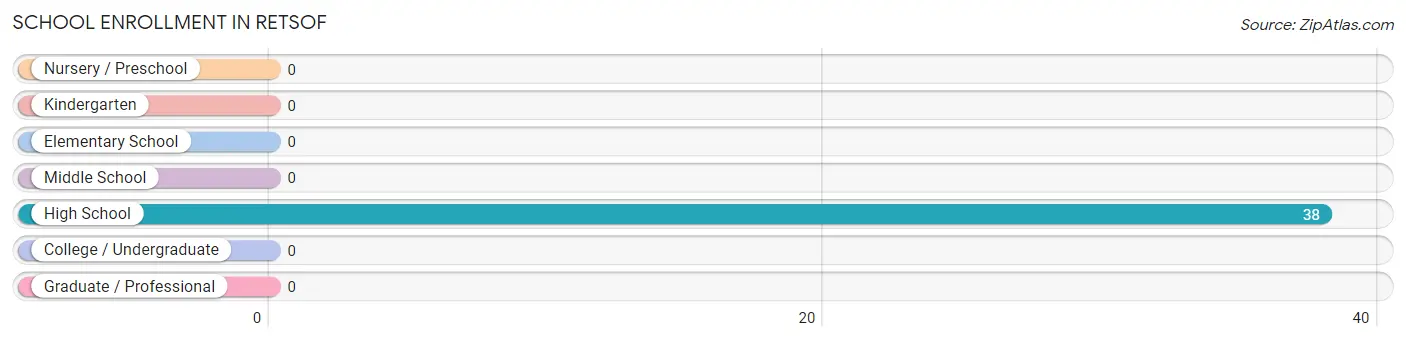
| School Level | # Students | % Students |
| Nursery / Preschool | 0 | 0.0% |
| Kindergarten | 0 | 0.0% |
| Elementary School | 0 | 0.0% |
| Middle School | 0 | 0.0% |
| High School | 38 | 100.0% |
| College / Undergraduate | 0 | 0.0% |
| Graduate / Professional | 0 | 0.0% |
| Total | 38 | 100.0% |
School Enrollment by Age by Funding Source in Retsof
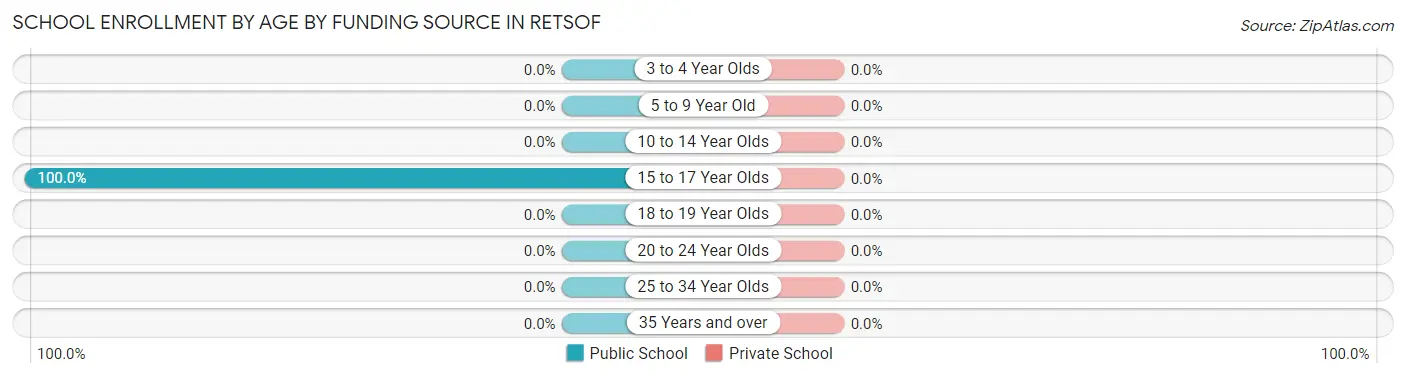
| Age Bracket | Public School | Private School |
| 3 to 4 Year Olds | 0 (0.0%) | 0 (0.0%) |
| 5 to 9 Year Old | 0 (0.0%) | 0 (0.0%) |
| 10 to 14 Year Olds | 0 (0.0%) | 0 (0.0%) |
| 15 to 17 Year Olds | 38 (100.0%) | 0 (0.0%) |
| 18 to 19 Year Olds | 0 (0.0%) | 0 (0.0%) |
| 20 to 24 Year Olds | 0 (0.0%) | 0 (0.0%) |
| 25 to 34 Year Olds | 0 (0.0%) | 0 (0.0%) |
| 35 Years and over | 0 (0.0%) | 0 (0.0%) |
| Total | 38 (100.0%) | 0 (0.0%) |
Educational Attainment by Field of Study in Retsof
Psychology (19 | 50.0%), arts & humanities (10 | 26.3%), and business (9 | 23.7%) are the most common fields of study among 38 individuals in Retsof who have obtained a bachelor's degree or higher.
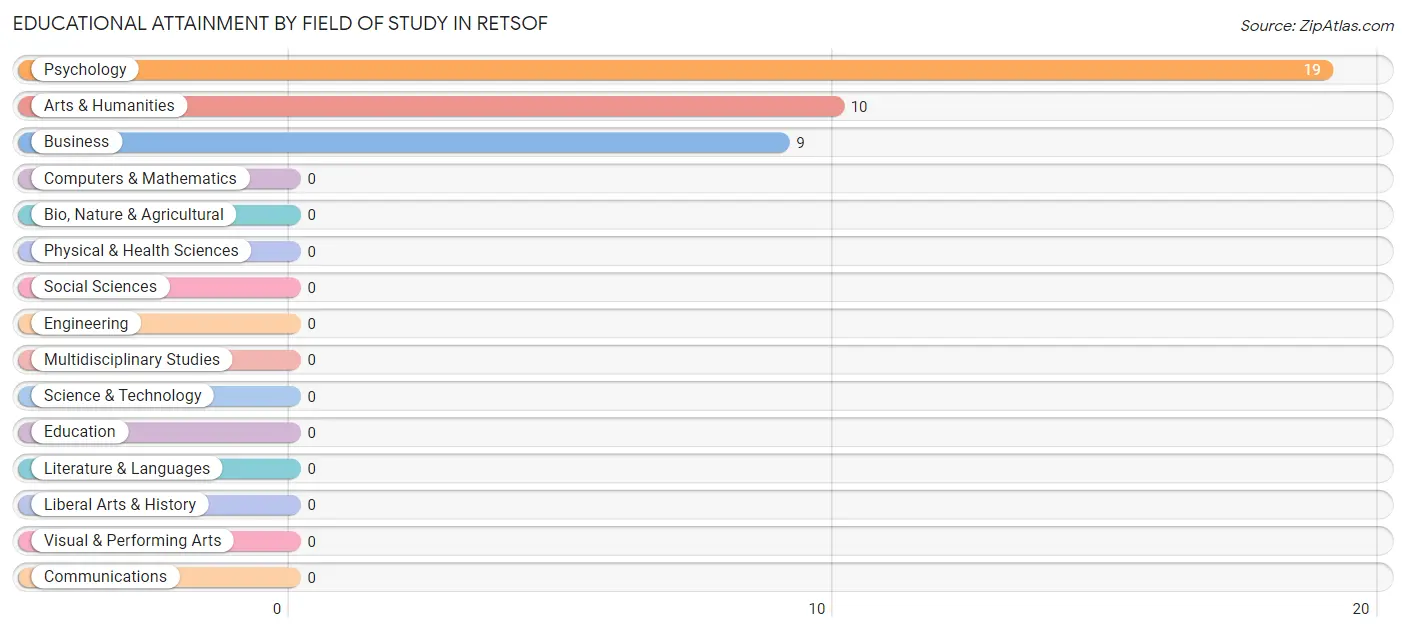
| Field of Study | # Graduates | % Graduates |
| Computers & Mathematics | 0 | 0.0% |
| Bio, Nature & Agricultural | 0 | 0.0% |
| Physical & Health Sciences | 0 | 0.0% |
| Psychology | 19 | 50.0% |
| Social Sciences | 0 | 0.0% |
| Engineering | 0 | 0.0% |
| Multidisciplinary Studies | 0 | 0.0% |
| Science & Technology | 0 | 0.0% |
| Business | 9 | 23.7% |
| Education | 0 | 0.0% |
| Literature & Languages | 0 | 0.0% |
| Liberal Arts & History | 0 | 0.0% |
| Visual & Performing Arts | 0 | 0.0% |
| Communications | 0 | 0.0% |
| Arts & Humanities | 10 | 26.3% |
| Total | 38 | 100.0% |
Transportation & Commute in Retsof
Vehicle Availability by Sex in Retsof
The most prevalent vehicle ownership categories in Retsof are males with 4 vehicles (33, accounting for 50.8%) and females with 4 vehicles (108, making up 26.2%).
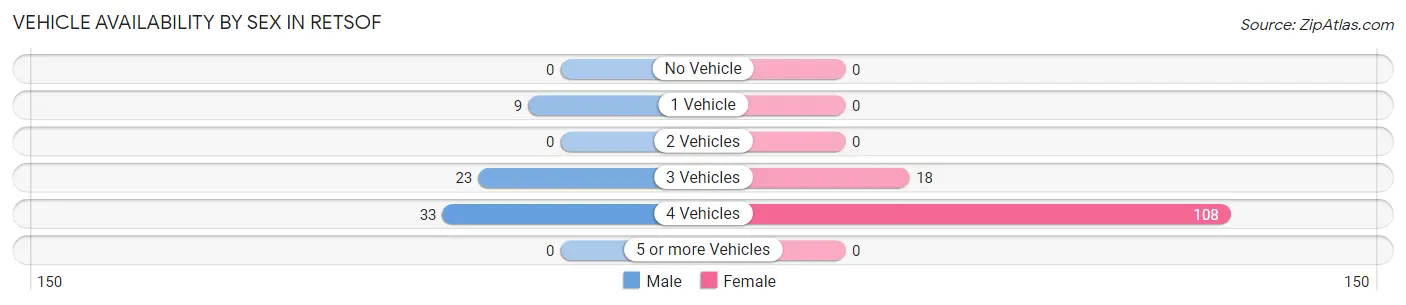
| Vehicles Available | Male | Female |
| No Vehicle | 0 (0.0%) | 0 (0.0%) |
| 1 Vehicle | 9 (13.9%) | 0 (0.0%) |
| 2 Vehicles | 0 (0.0%) | 0 (0.0%) |
| 3 Vehicles | 23 (35.4%) | 18 (14.3%) |
| 4 Vehicles | 33 (50.8%) | 108 (85.7%) |
| 5 or more Vehicles | 0 (0.0%) | 0 (0.0%) |
| Total | 65 (100.0%) | 126 (100.0%) |
Commute Time in Retsof
The most frequently occuring commute durations in Retsof are 5 to 9 minutes (58 commuters, 31.9%), 20 to 24 minutes (38 commuters, 20.9%), and 15 to 19 minutes (33 commuters, 18.1%).
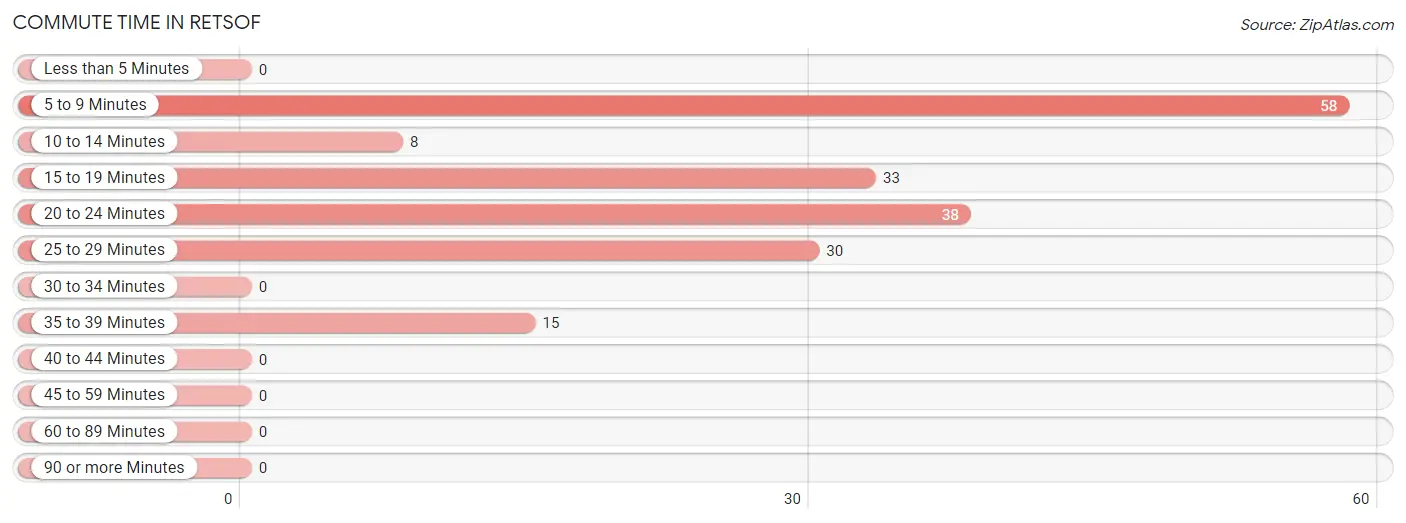
| Commute Time | # Commuters | % Commuters |
| Less than 5 Minutes | 0 | 0.0% |
| 5 to 9 Minutes | 58 | 31.9% |
| 10 to 14 Minutes | 8 | 4.4% |
| 15 to 19 Minutes | 33 | 18.1% |
| 20 to 24 Minutes | 38 | 20.9% |
| 25 to 29 Minutes | 30 | 16.5% |
| 30 to 34 Minutes | 0 | 0.0% |
| 35 to 39 Minutes | 15 | 8.2% |
| 40 to 44 Minutes | 0 | 0.0% |
| 45 to 59 Minutes | 0 | 0.0% |
| 60 to 89 Minutes | 0 | 0.0% |
| 90 or more Minutes | 0 | 0.0% |
Commute Time by Sex in Retsof
The most common commute times in Retsof are 15 to 19 minutes (33 commuters, 58.9%) for males and 5 to 9 minutes (50 commuters, 39.7%) for females.
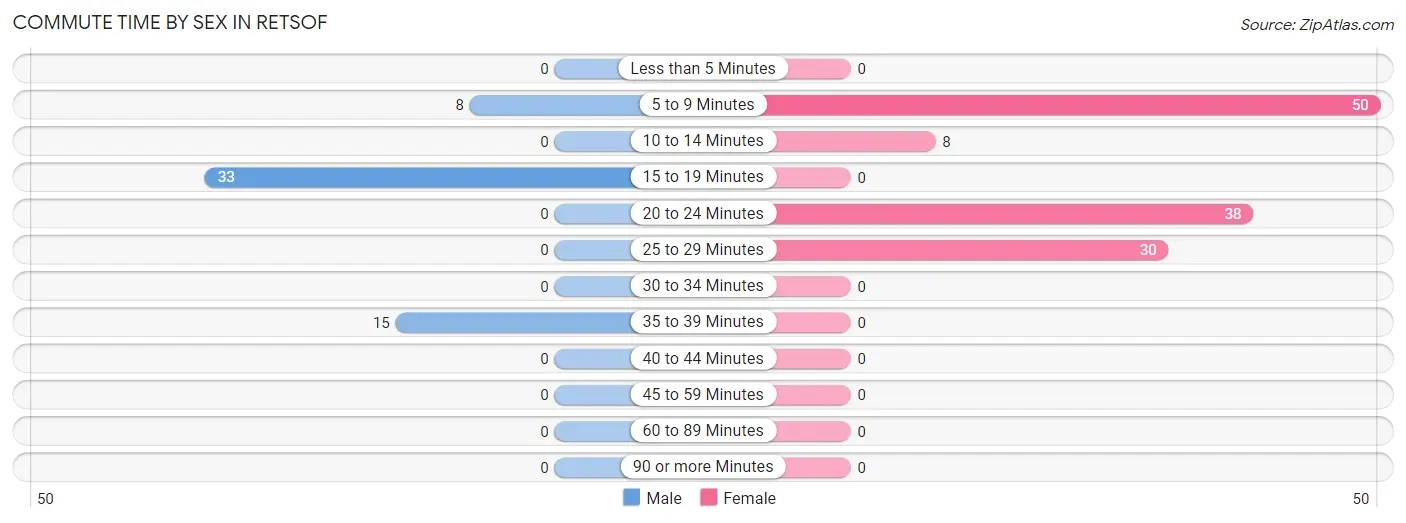
| Commute Time | Male | Female |
| Less than 5 Minutes | 0 (0.0%) | 0 (0.0%) |
| 5 to 9 Minutes | 8 (14.3%) | 50 (39.7%) |
| 10 to 14 Minutes | 0 (0.0%) | 8 (6.4%) |
| 15 to 19 Minutes | 33 (58.9%) | 0 (0.0%) |
| 20 to 24 Minutes | 0 (0.0%) | 38 (30.2%) |
| 25 to 29 Minutes | 0 (0.0%) | 30 (23.8%) |
| 30 to 34 Minutes | 0 (0.0%) | 0 (0.0%) |
| 35 to 39 Minutes | 15 (26.8%) | 0 (0.0%) |
| 40 to 44 Minutes | 0 (0.0%) | 0 (0.0%) |
| 45 to 59 Minutes | 0 (0.0%) | 0 (0.0%) |
| 60 to 89 Minutes | 0 (0.0%) | 0 (0.0%) |
| 90 or more Minutes | 0 (0.0%) | 0 (0.0%) |
Time of Departure to Work by Sex in Retsof
The most frequent times of departure to work in Retsof are 7:30 AM to 7:59 AM (33, 58.9%) for males and 7:30 AM to 7:59 AM (40, 31.8%) for females.
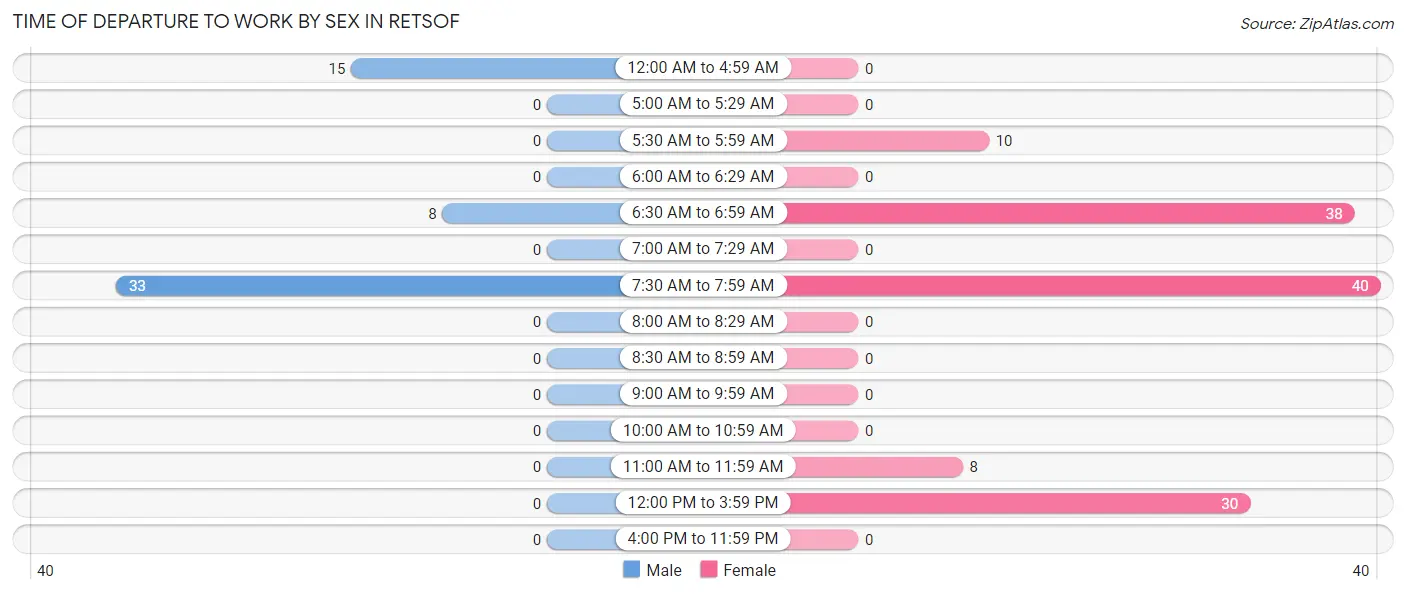
| Time of Departure | Male | Female |
| 12:00 AM to 4:59 AM | 15 (26.8%) | 0 (0.0%) |
| 5:00 AM to 5:29 AM | 0 (0.0%) | 0 (0.0%) |
| 5:30 AM to 5:59 AM | 0 (0.0%) | 10 (7.9%) |
| 6:00 AM to 6:29 AM | 0 (0.0%) | 0 (0.0%) |
| 6:30 AM to 6:59 AM | 8 (14.3%) | 38 (30.2%) |
| 7:00 AM to 7:29 AM | 0 (0.0%) | 0 (0.0%) |
| 7:30 AM to 7:59 AM | 33 (58.9%) | 40 (31.8%) |
| 8:00 AM to 8:29 AM | 0 (0.0%) | 0 (0.0%) |
| 8:30 AM to 8:59 AM | 0 (0.0%) | 0 (0.0%) |
| 9:00 AM to 9:59 AM | 0 (0.0%) | 0 (0.0%) |
| 10:00 AM to 10:59 AM | 0 (0.0%) | 0 (0.0%) |
| 11:00 AM to 11:59 AM | 0 (0.0%) | 8 (6.4%) |
| 12:00 PM to 3:59 PM | 0 (0.0%) | 30 (23.8%) |
| 4:00 PM to 11:59 PM | 0 (0.0%) | 0 (0.0%) |
| Total | 56 (100.0%) | 126 (100.0%) |
Housing Occupancy in Retsof
Occupancy by Ownership in Retsof
Of the total 82 dwellings in Retsof, owner-occupied units account for 75 (91.5%), while renter-occupied units make up 7 (8.5%).
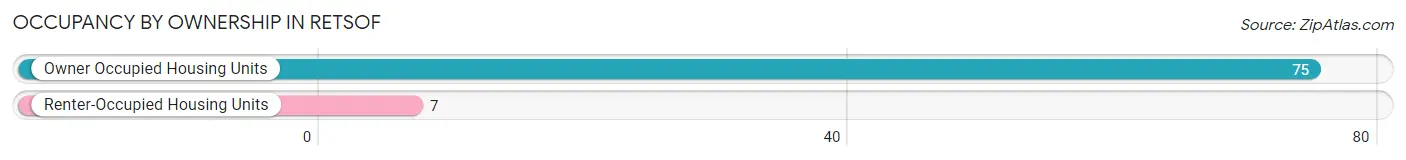
| Occupancy | # Housing Units | % Housing Units |
| Owner Occupied Housing Units | 75 | 91.5% |
| Renter-Occupied Housing Units | 7 | 8.5% |
| Total Occupied Housing Units | 82 | 100.0% |
Occupancy by Household Size in Retsof
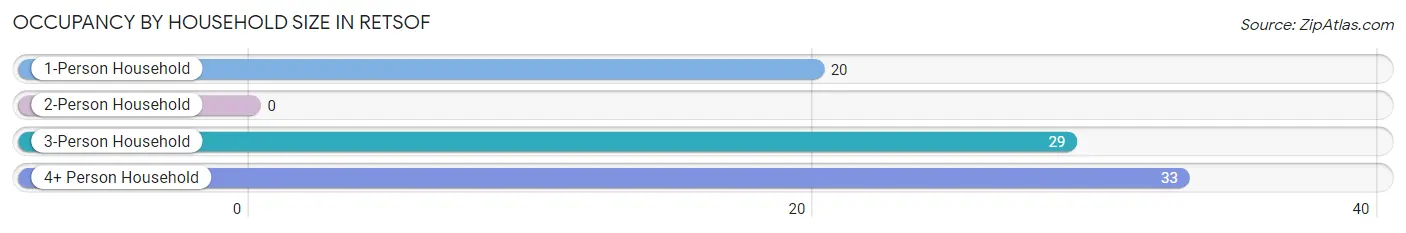
| Household Size | # Housing Units | % Housing Units |
| 1-Person Household | 20 | 24.4% |
| 2-Person Household | 0 | 0.0% |
| 3-Person Household | 29 | 35.4% |
| 4+ Person Household | 33 | 40.2% |
| Total Housing Units | 82 | 100.0% |
Occupancy by Ownership by Household Size in Retsof
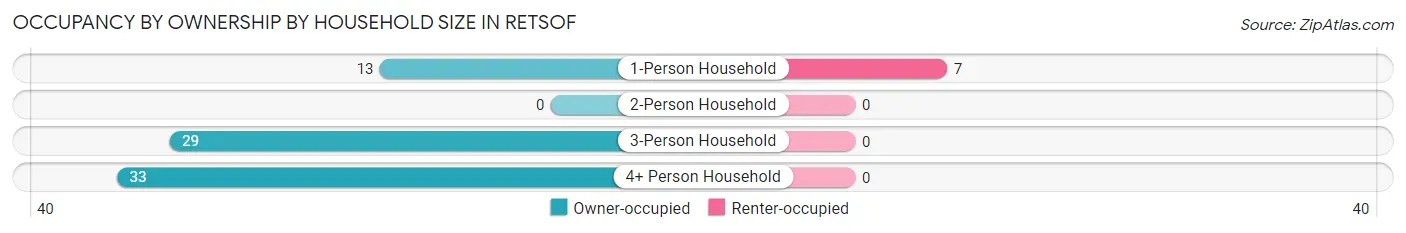
| Household Size | Owner-occupied | Renter-occupied |
| 1-Person Household | 13 (65.0%) | 7 (35.0%) |
| 2-Person Household | 0 (0.0%) | 0 (0.0%) |
| 3-Person Household | 29 (100.0%) | 0 (0.0%) |
| 4+ Person Household | 33 (100.0%) | 0 (0.0%) |
| Total Housing Units | 75 (91.5%) | 7 (8.5%) |
Occupancy by Educational Attainment in Retsof
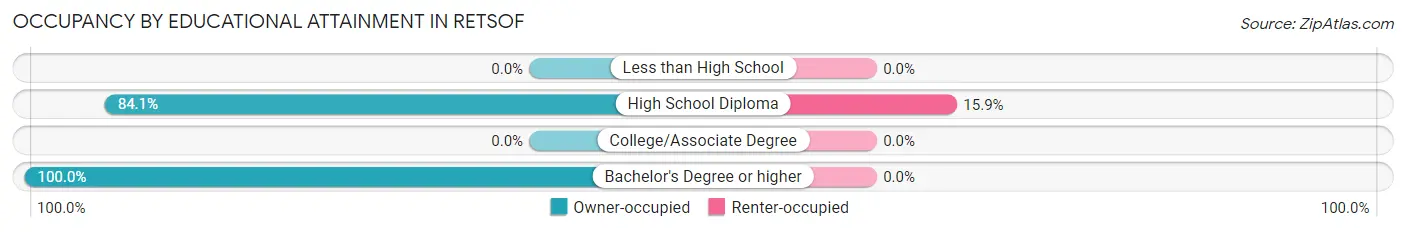
| Household Size | Owner-occupied | Renter-occupied |
| Less than High School | 0 (0.0%) | 0 (0.0%) |
| High School Diploma | 37 (84.1%) | 7 (15.9%) |
| College/Associate Degree | 0 (0.0%) | 0 (0.0%) |
| Bachelor's Degree or higher | 38 (100.0%) | 0 (0.0%) |
Occupancy by Age of Householder in Retsof
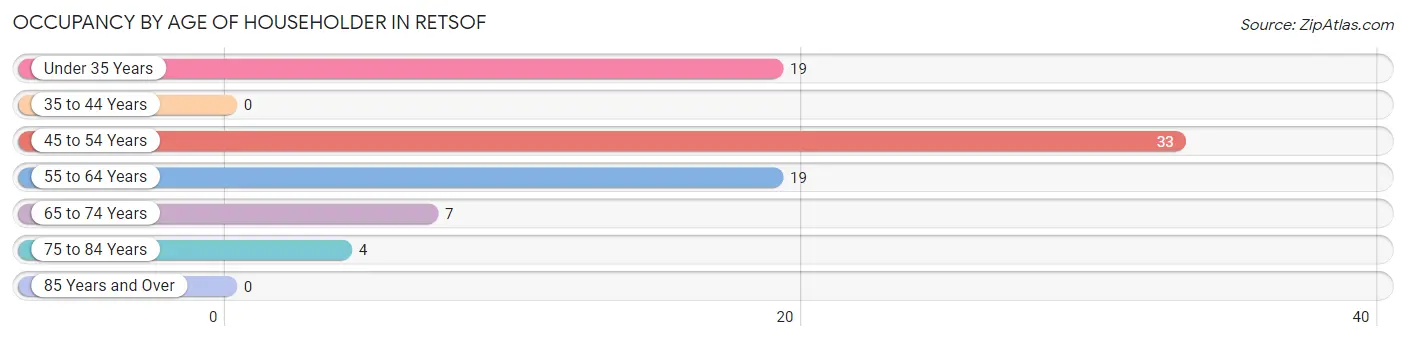
| Age Bracket | # Households | % Households |
| Under 35 Years | 19 | 23.2% |
| 35 to 44 Years | 0 | 0.0% |
| 45 to 54 Years | 33 | 40.2% |
| 55 to 64 Years | 19 | 23.2% |
| 65 to 74 Years | 7 | 8.5% |
| 75 to 84 Years | 4 | 4.9% |
| 85 Years and Over | 0 | 0.0% |
| Total | 82 | 100.0% |
Housing Finances in Retsof
Median Income by Occupancy in Retsof
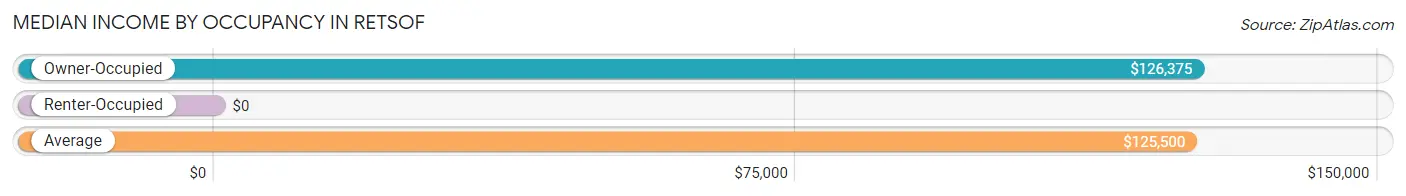
| Occupancy Type | # Households | Median Income |
| Owner-Occupied | 75 (91.5%) | $126,375 |
| Renter-Occupied | 7 (8.5%) | $0 |
| Average | 82 (100.0%) | $125,500 |
Occupancy by Householder Income Bracket in Retsof
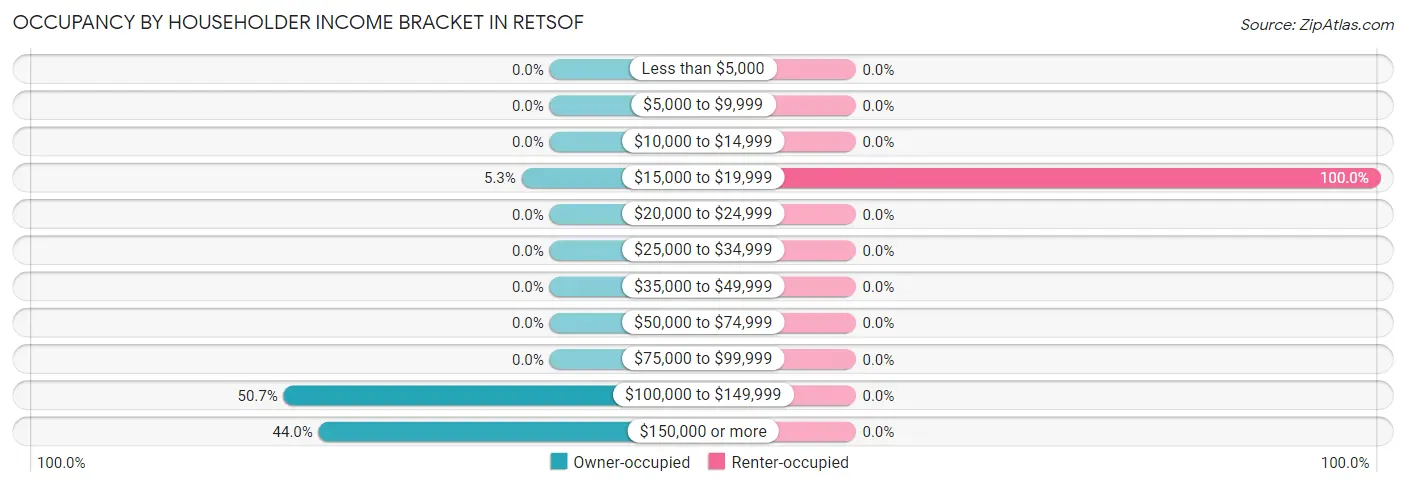
| Income Bracket | Owner-occupied | Renter-occupied |
| Less than $5,000 | 0 (0.0%) | 0 (0.0%) |
| $5,000 to $9,999 | 0 (0.0%) | 0 (0.0%) |
| $10,000 to $14,999 | 0 (0.0%) | 0 (0.0%) |
| $15,000 to $19,999 | 4 (5.3%) | 7 (100.0%) |
| $20,000 to $24,999 | 0 (0.0%) | 0 (0.0%) |
| $25,000 to $34,999 | 0 (0.0%) | 0 (0.0%) |
| $35,000 to $49,999 | 0 (0.0%) | 0 (0.0%) |
| $50,000 to $74,999 | 0 (0.0%) | 0 (0.0%) |
| $75,000 to $99,999 | 0 (0.0%) | 0 (0.0%) |
| $100,000 to $149,999 | 38 (50.7%) | 0 (0.0%) |
| $150,000 or more | 33 (44.0%) | 0 (0.0%) |
| Total | 75 (100.0%) | 7 (100.0%) |
Monthly Housing Cost Tiers in Retsof
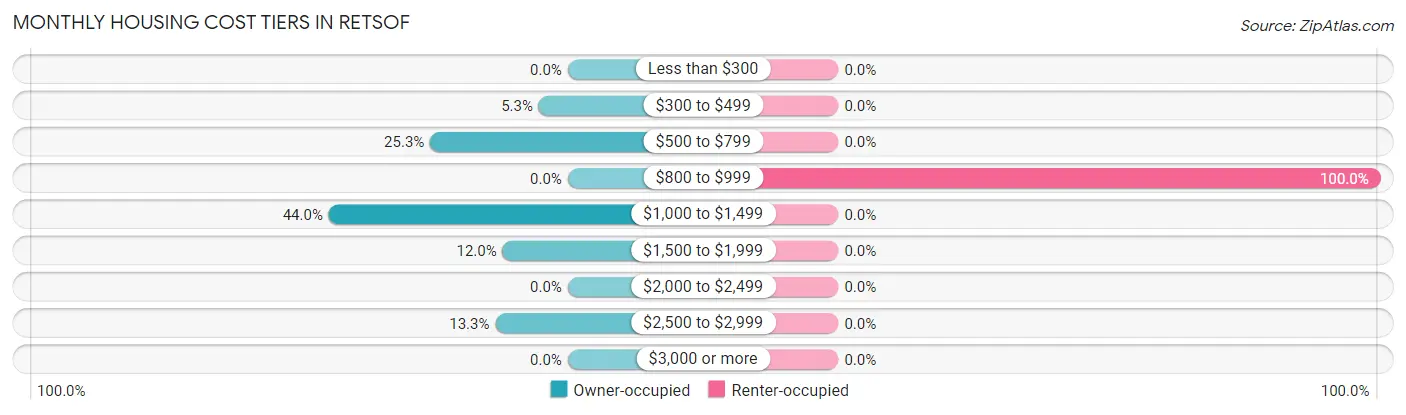
| Monthly Cost | Owner-occupied | Renter-occupied |
| Less than $300 | 0 (0.0%) | 0 (0.0%) |
| $300 to $499 | 4 (5.3%) | 0 (0.0%) |
| $500 to $799 | 19 (25.3%) | 0 (0.0%) |
| $800 to $999 | 0 (0.0%) | 7 (100.0%) |
| $1,000 to $1,499 | 33 (44.0%) | 0 (0.0%) |
| $1,500 to $1,999 | 9 (12.0%) | 0 (0.0%) |
| $2,000 to $2,499 | 0 (0.0%) | 0 (0.0%) |
| $2,500 to $2,999 | 10 (13.3%) | 0 (0.0%) |
| $3,000 or more | 0 (0.0%) | 0 (0.0%) |
| Total | 75 (100.0%) | 7 (100.0%) |
Physical Housing Characteristics in Retsof
Housing Structures in Retsof
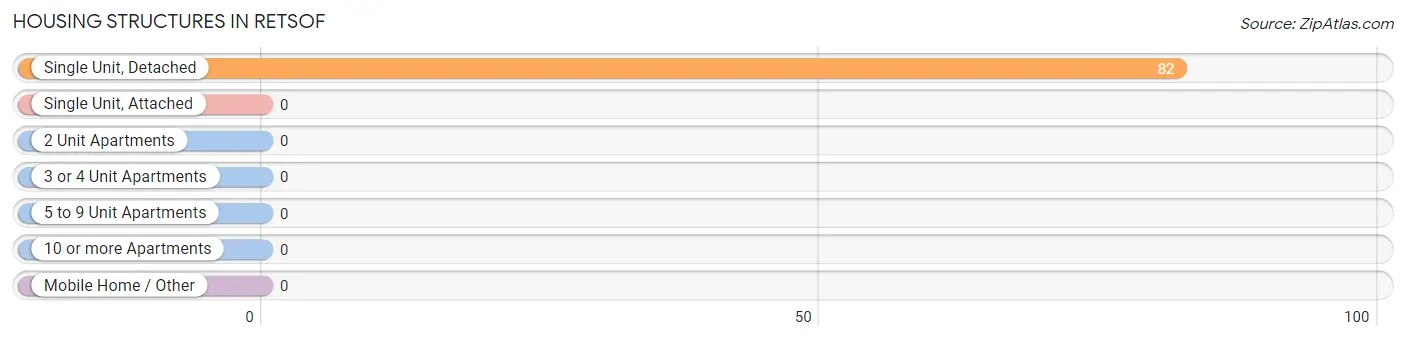
| Structure Type | # Housing Units | % Housing Units |
| Single Unit, Detached | 82 | 100.0% |
| Single Unit, Attached | 0 | 0.0% |
| 2 Unit Apartments | 0 | 0.0% |
| 3 or 4 Unit Apartments | 0 | 0.0% |
| 5 to 9 Unit Apartments | 0 | 0.0% |
| 10 or more Apartments | 0 | 0.0% |
| Mobile Home / Other | 0 | 0.0% |
| Total | 82 | 100.0% |
Housing Structures by Occupancy in Retsof
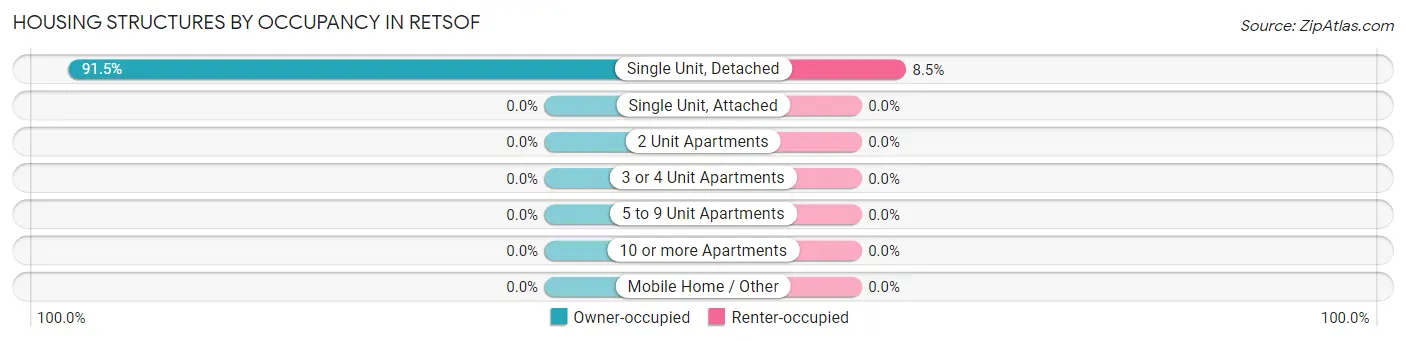
| Structure Type | Owner-occupied | Renter-occupied |
| Single Unit, Detached | 75 (91.5%) | 7 (8.5%) |
| Single Unit, Attached | 0 (0.0%) | 0 (0.0%) |
| 2 Unit Apartments | 0 (0.0%) | 0 (0.0%) |
| 3 or 4 Unit Apartments | 0 (0.0%) | 0 (0.0%) |
| 5 to 9 Unit Apartments | 0 (0.0%) | 0 (0.0%) |
| 10 or more Apartments | 0 (0.0%) | 0 (0.0%) |
| Mobile Home / Other | 0 (0.0%) | 0 (0.0%) |
| Total | 75 (91.5%) | 7 (8.5%) |
Housing Structures by Number of Rooms in Retsof
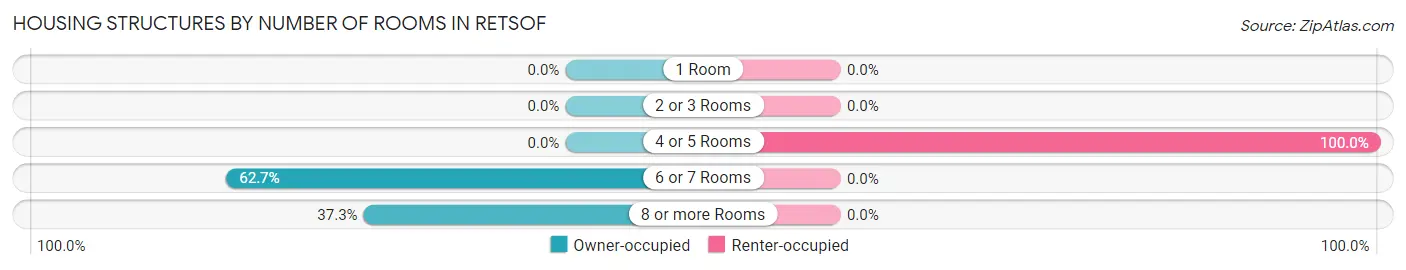
| Number of Rooms | Owner-occupied | Renter-occupied |
| 1 Room | 0 (0.0%) | 0 (0.0%) |
| 2 or 3 Rooms | 0 (0.0%) | 0 (0.0%) |
| 4 or 5 Rooms | 0 (0.0%) | 7 (100.0%) |
| 6 or 7 Rooms | 47 (62.7%) | 0 (0.0%) |
| 8 or more Rooms | 28 (37.3%) | 0 (0.0%) |
| Total | 75 (100.0%) | 7 (100.0%) |
Housing Structure by Heating Type in Retsof
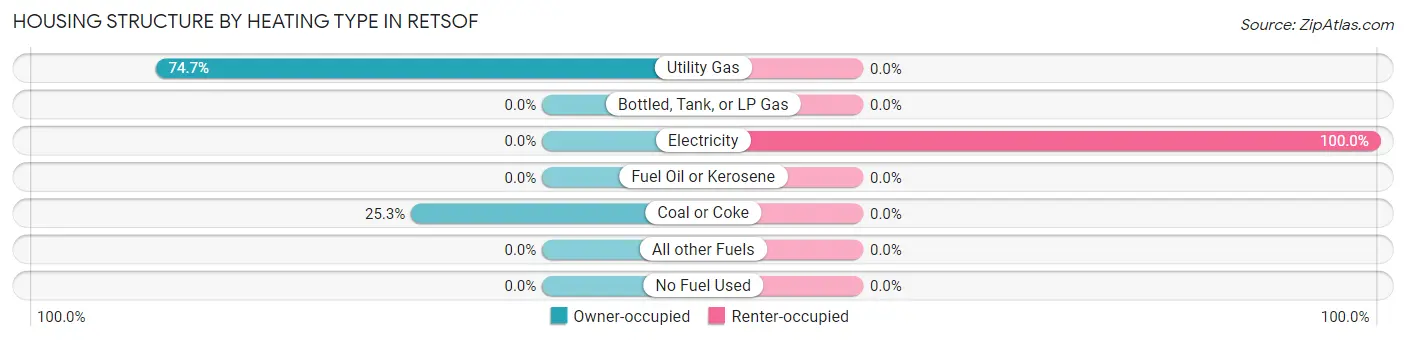
| Heating Type | Owner-occupied | Renter-occupied |
| Utility Gas | 56 (74.7%) | 0 (0.0%) |
| Bottled, Tank, or LP Gas | 0 (0.0%) | 0 (0.0%) |
| Electricity | 0 (0.0%) | 7 (100.0%) |
| Fuel Oil or Kerosene | 0 (0.0%) | 0 (0.0%) |
| Coal or Coke | 19 (25.3%) | 0 (0.0%) |
| All other Fuels | 0 (0.0%) | 0 (0.0%) |
| No Fuel Used | 0 (0.0%) | 0 (0.0%) |
| Total | 75 (100.0%) | 7 (100.0%) |
Household Vehicle Usage in Retsof
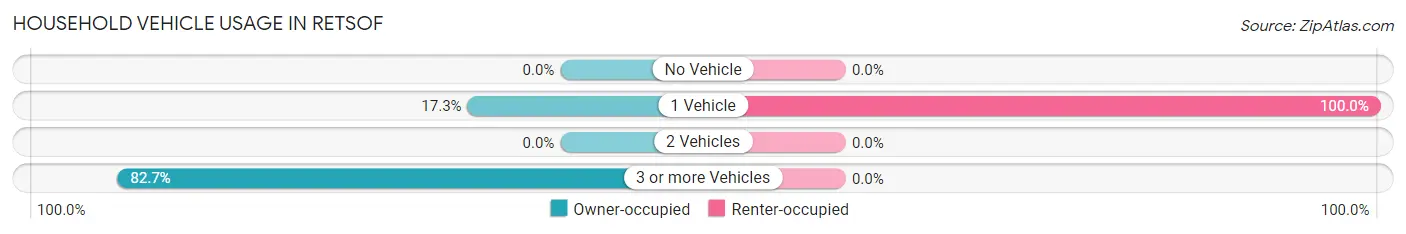
| Vehicles per Household | Owner-occupied | Renter-occupied |
| No Vehicle | 0 (0.0%) | 0 (0.0%) |
| 1 Vehicle | 13 (17.3%) | 7 (100.0%) |
| 2 Vehicles | 0 (0.0%) | 0 (0.0%) |
| 3 or more Vehicles | 62 (82.7%) | 0 (0.0%) |
| Total | 75 (100.0%) | 7 (100.0%) |
Real Estate & Mortgages in Retsof
Real Estate and Mortgage Overview in Retsof
| Characteristic | Without Mortgage | With Mortgage |
| Housing Units | 23 | 52 |
| Median Property Value | - | - |
| Median Household Income | - | - |
| Monthly Housing Costs | - | - |
| Real Estate Taxes | - | - |
Property Value by Mortgage Status in Retsof
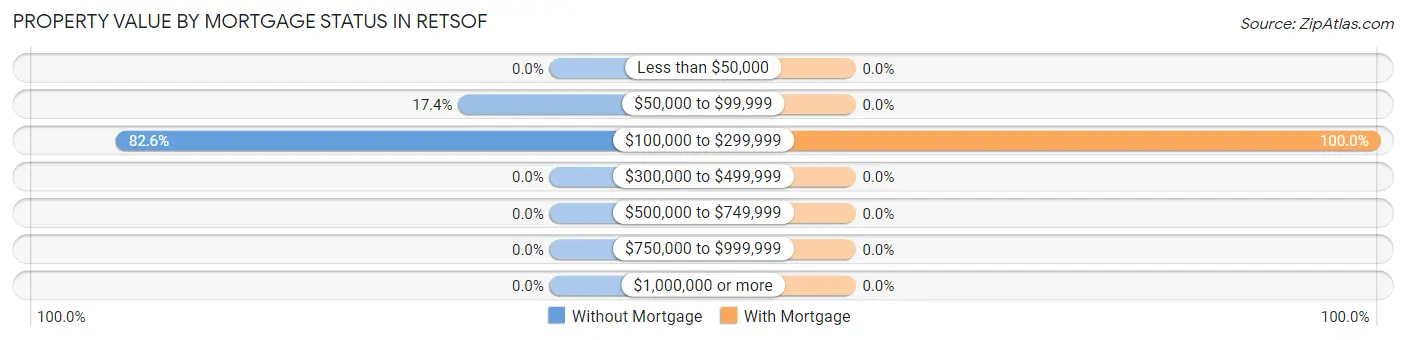
| Property Value | Without Mortgage | With Mortgage |
| Less than $50,000 | 0 (0.0%) | 0 (0.0%) |
| $50,000 to $99,999 | 4 (17.4%) | 0 (0.0%) |
| $100,000 to $299,999 | 19 (82.6%) | 52 (100.0%) |
| $300,000 to $499,999 | 0 (0.0%) | 0 (0.0%) |
| $500,000 to $749,999 | 0 (0.0%) | 0 (0.0%) |
| $750,000 to $999,999 | 0 (0.0%) | 0 (0.0%) |
| $1,000,000 or more | 0 (0.0%) | 0 (0.0%) |
| Total | 23 (100.0%) | 52 (100.0%) |
Household Income by Mortgage Status in Retsof
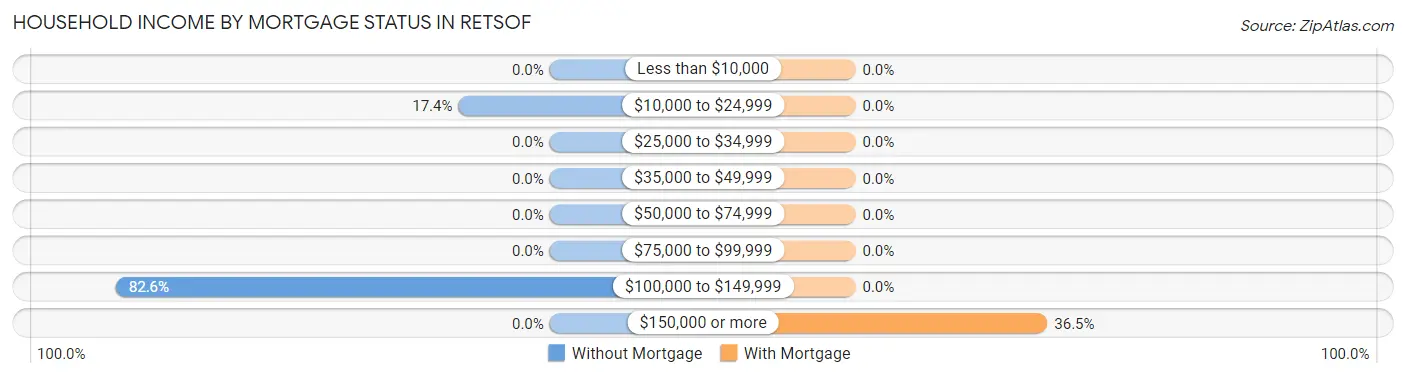
| Household Income | Without Mortgage | With Mortgage |
| Less than $10,000 | 0 (0.0%) | 0 (0.0%) |
| $10,000 to $24,999 | 4 (17.4%) | 0 (0.0%) |
| $25,000 to $34,999 | 0 (0.0%) | 0 (0.0%) |
| $35,000 to $49,999 | 0 (0.0%) | 0 (0.0%) |
| $50,000 to $74,999 | 0 (0.0%) | 0 (0.0%) |
| $75,000 to $99,999 | 0 (0.0%) | 0 (0.0%) |
| $100,000 to $149,999 | 19 (82.6%) | 0 (0.0%) |
| $150,000 or more | 0 (0.0%) | 19 (36.5%) |
| Total | 23 (100.0%) | 52 (100.0%) |
Property Value to Household Income Ratio in Retsof
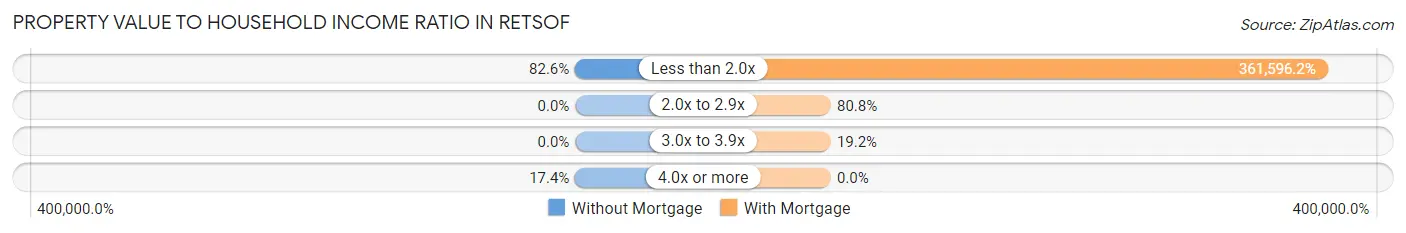
| Value-to-Income Ratio | Without Mortgage | With Mortgage |
| Less than 2.0x | 19 (82.6%) | 188,030 (361,596.1%) |
| 2.0x to 2.9x | 0 (0.0%) | 42 (80.8%) |
| 3.0x to 3.9x | 0 (0.0%) | 10 (19.2%) |
| 4.0x or more | 4 (17.4%) | 0 (0.0%) |
| Total | 23 (100.0%) | 52 (100.0%) |
Real Estate Taxes by Mortgage Status in Retsof
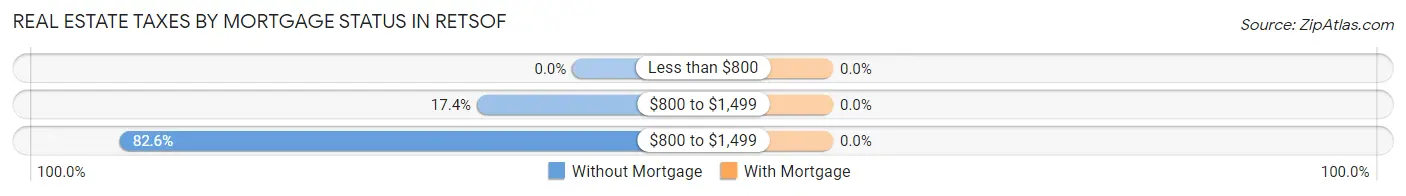
| Property Taxes | Without Mortgage | With Mortgage |
| Less than $800 | 0 (0.0%) | 0 (0.0%) |
| $800 to $1,499 | 4 (17.4%) | 0 (0.0%) |
| $800 to $1,499 | 19 (82.6%) | 0 (0.0%) |
| Total | 23 (100.0%) | 52 (100.0%) |
Health & Disability in Retsof
Health Insurance Coverage by Age in Retsof
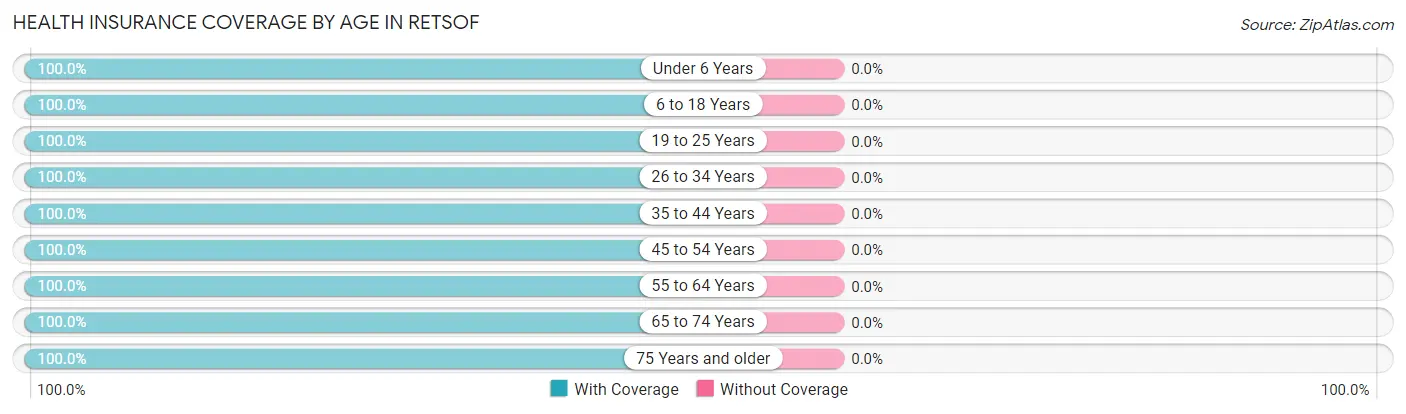
| Age Bracket | With Coverage | Without Coverage |
| Under 6 Years | 15 (100.0%) | 0 (0.0%) |
| 6 to 18 Years | 38 (100.0%) | 0 (0.0%) |
| 19 to 25 Years | 40 (100.0%) | 0 (0.0%) |
| 26 to 34 Years | 19 (100.0%) | 0 (0.0%) |
| 35 to 44 Years | 15 (100.0%) | 0 (0.0%) |
| 45 to 54 Years | 79 (100.0%) | 0 (0.0%) |
| 55 to 64 Years | 19 (100.0%) | 0 (0.0%) |
| 65 to 74 Years | 7 (100.0%) | 0 (0.0%) |
| 75 Years and older | 4 (100.0%) | 0 (0.0%) |
| Total | 236 (100.0%) | 0 (0.0%) |
Health Insurance Coverage by Citizenship Status in Retsof
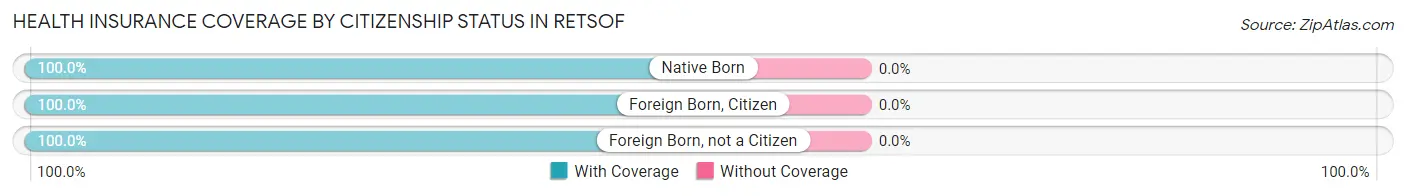
| Citizenship Status | With Coverage | Without Coverage |
| Native Born | 15 (100.0%) | 0 (0.0%) |
| Foreign Born, Citizen | 38 (100.0%) | 0 (0.0%) |
| Foreign Born, not a Citizen | 40 (100.0%) | 0 (0.0%) |
Health Insurance Coverage by Household Income in Retsof
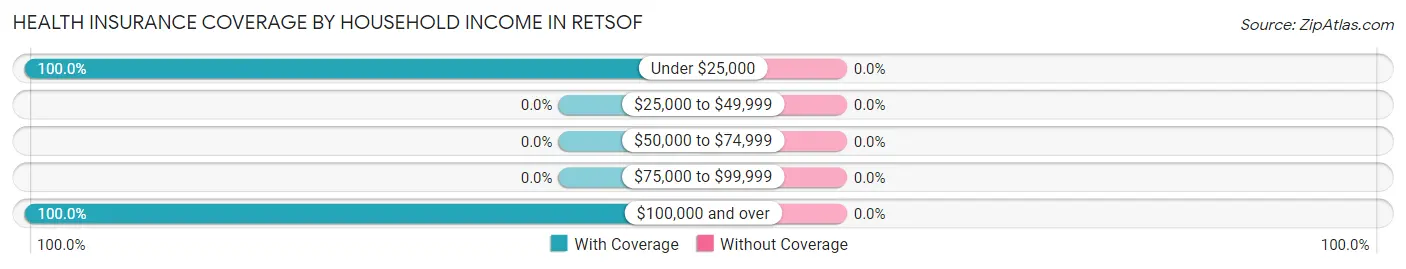
| Household Income | With Coverage | Without Coverage |
| Under $25,000 | 11 (100.0%) | 0 (0.0%) |
| $25,000 to $49,999 | 0 (0.0%) | 0 (0.0%) |
| $50,000 to $74,999 | 0 (0.0%) | 0 (0.0%) |
| $75,000 to $99,999 | 0 (0.0%) | 0 (0.0%) |
| $100,000 and over | 225 (100.0%) | 0 (0.0%) |
Public vs Private Health Insurance Coverage by Age in Retsof
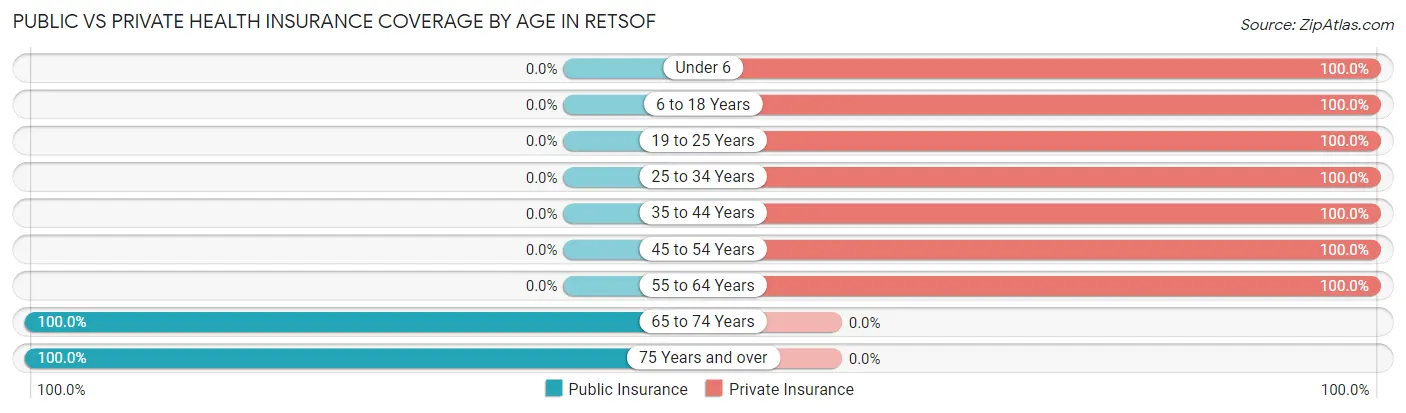
| Age Bracket | Public Insurance | Private Insurance |
| Under 6 | 0 (0.0%) | 15 (100.0%) |
| 6 to 18 Years | 0 (0.0%) | 38 (100.0%) |
| 19 to 25 Years | 0 (0.0%) | 40 (100.0%) |
| 25 to 34 Years | 0 (0.0%) | 19 (100.0%) |
| 35 to 44 Years | 0 (0.0%) | 15 (100.0%) |
| 45 to 54 Years | 0 (0.0%) | 79 (100.0%) |
| 55 to 64 Years | 0 (0.0%) | 19 (100.0%) |
| 65 to 74 Years | 7 (100.0%) | 0 (0.0%) |
| 75 Years and over | 4 (100.0%) | 0 (0.0%) |
| Total | 11 (4.7%) | 225 (95.3%) |
Disability Status by Sex by Age in Retsof
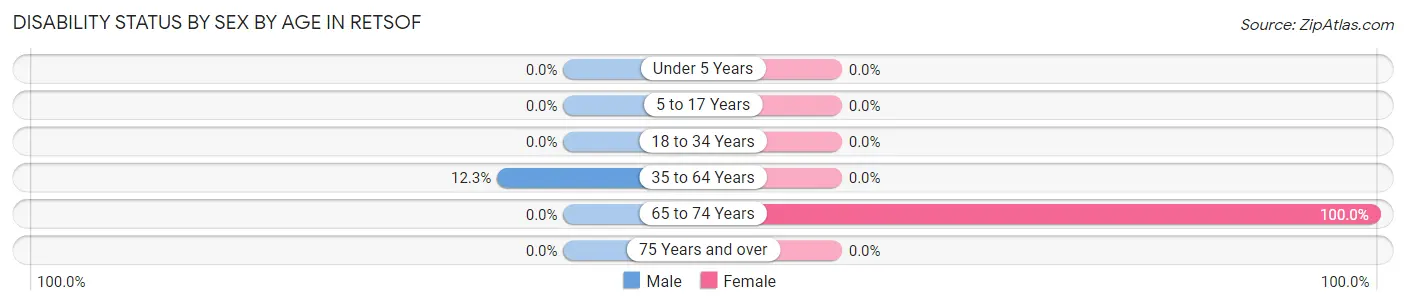
| Age Bracket | Male | Female |
| Under 5 Years | 0 (0.0%) | 0 (0.0%) |
| 5 to 17 Years | 0 (0.0%) | 0 (0.0%) |
| 18 to 34 Years | 0 (0.0%) | 0 (0.0%) |
| 35 to 64 Years | 8 (12.3%) | 0 (0.0%) |
| 65 to 74 Years | 0 (0.0%) | 7 (100.0%) |
| 75 Years and over | 0 (0.0%) | 0 (0.0%) |
Disability Class by Sex by Age in Retsof
Disability Class: Hearing Difficulty
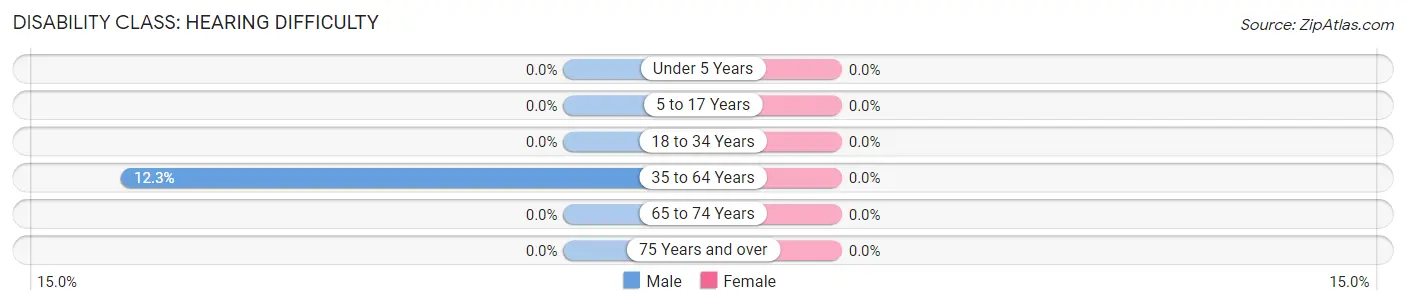
| Age Bracket | Male | Female |
| Under 5 Years | 0 (0.0%) | 0 (0.0%) |
| 5 to 17 Years | 0 (0.0%) | 0 (0.0%) |
| 18 to 34 Years | 0 (0.0%) | 0 (0.0%) |
| 35 to 64 Years | 8 (12.3%) | 0 (0.0%) |
| 65 to 74 Years | 0 (0.0%) | 0 (0.0%) |
| 75 Years and over | 0 (0.0%) | 0 (0.0%) |
Disability Class: Vision Difficulty
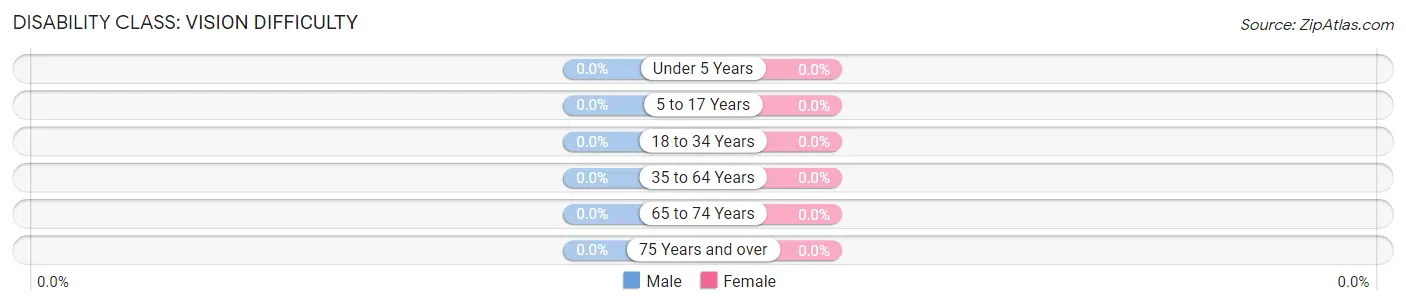
| Age Bracket | Male | Female |
| Under 5 Years | 0 (0.0%) | 0 (0.0%) |
| 5 to 17 Years | 0 (0.0%) | 0 (0.0%) |
| 18 to 34 Years | 0 (0.0%) | 0 (0.0%) |
| 35 to 64 Years | 0 (0.0%) | 0 (0.0%) |
| 65 to 74 Years | 0 (0.0%) | 0 (0.0%) |
| 75 Years and over | 0 (0.0%) | 0 (0.0%) |
Disability Class: Cognitive Difficulty

| Age Bracket | Male | Female |
| 5 to 17 Years | 0 (0.0%) | 0 (0.0%) |
| 18 to 34 Years | 0 (0.0%) | 0 (0.0%) |
| 35 to 64 Years | 0 (0.0%) | 0 (0.0%) |
| 65 to 74 Years | 0 (0.0%) | 0 (0.0%) |
| 75 Years and over | 0 (0.0%) | 0 (0.0%) |
Disability Class: Ambulatory Difficulty
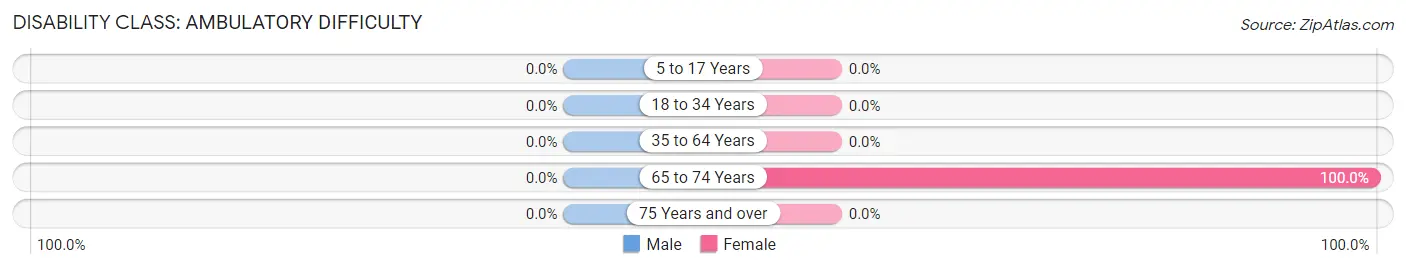
| Age Bracket | Male | Female |
| 5 to 17 Years | 0 (0.0%) | 0 (0.0%) |
| 18 to 34 Years | 0 (0.0%) | 0 (0.0%) |
| 35 to 64 Years | 0 (0.0%) | 0 (0.0%) |
| 65 to 74 Years | 0 (0.0%) | 7 (100.0%) |
| 75 Years and over | 0 (0.0%) | 0 (0.0%) |
Disability Class: Self-Care Difficulty
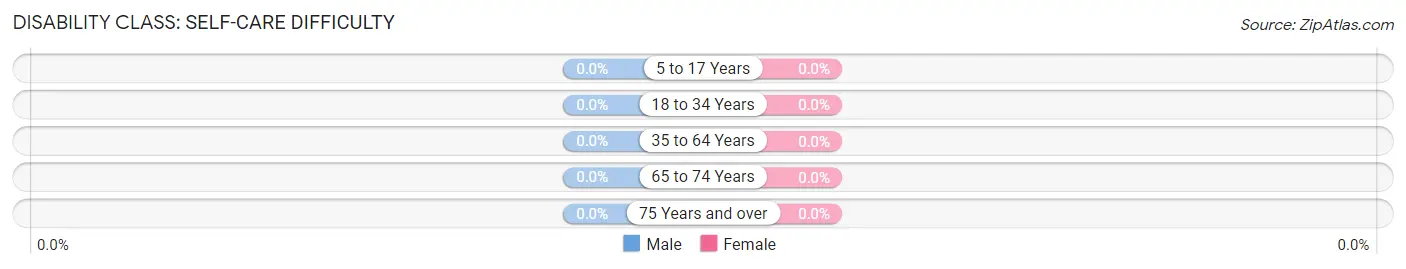
| Age Bracket | Male | Female |
| 5 to 17 Years | 0 (0.0%) | 0 (0.0%) |
| 18 to 34 Years | 0 (0.0%) | 0 (0.0%) |
| 35 to 64 Years | 0 (0.0%) | 0 (0.0%) |
| 65 to 74 Years | 0 (0.0%) | 0 (0.0%) |
| 75 Years and over | 0 (0.0%) | 0 (0.0%) |
Technology Access in Retsof
Computing Device Access in Retsof
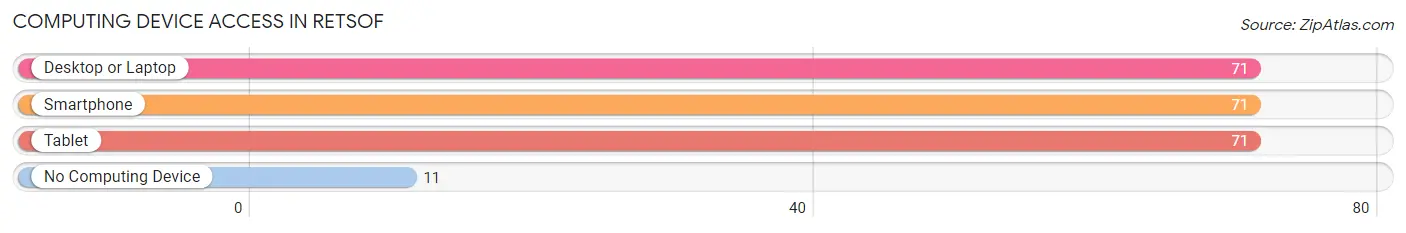
| Device Type | # Households | % Households |
| Desktop or Laptop | 71 | 86.6% |
| Smartphone | 71 | 86.6% |
| Tablet | 71 | 86.6% |
| No Computing Device | 11 | 13.4% |
| Total | 82 | 100.0% |
Internet Access in Retsof
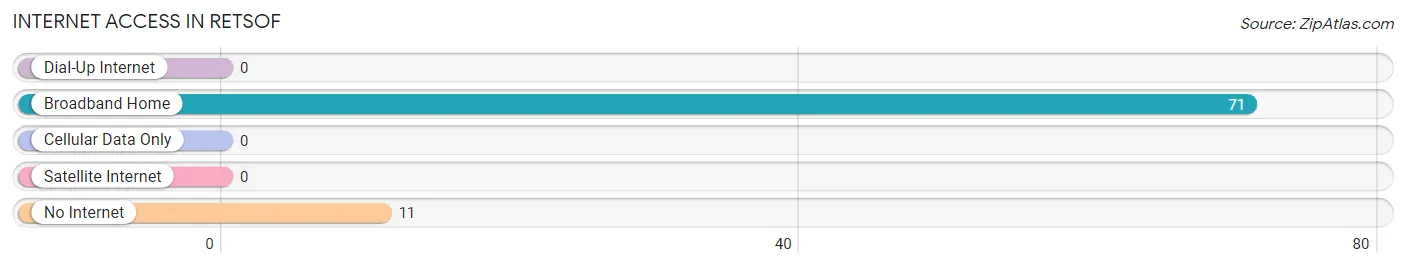
| Internet Type | # Households | % Households |
| Dial-Up Internet | 0 | 0.0% |
| Broadband Home | 71 | 86.6% |
| Cellular Data Only | 0 | 0.0% |
| Satellite Internet | 0 | 0.0% |
| No Internet | 11 | 13.4% |
| Total | 82 | 100.0% |
Retsof Summary
Retsof, New York is a small hamlet located in the town of York, Livingston County, New York. It is situated on the Genesee River, about 25 miles south of Rochester. The hamlet was founded in 1812 and is named after the Retsof family, who were among the first settlers in the area.
Geography
Retsof is located in the Finger Lakes region of New York, and is situated on the Genesee River. The hamlet is surrounded by rolling hills and farmland, and is located in a rural area. The nearest major city is Rochester, which is about 25 miles away.
Climate
Retsof has a humid continental climate, with cold winters and warm summers. The average annual temperature is around 50°F, with an average high of around 70°F in the summer and an average low of around 30°F in the winter. The area receives an average of around 40 inches of precipitation per year, with most of it falling in the form of snow in the winter months.
Demographics
As of the 2010 census, the population of Retsof was 1,093. The population is predominantly white (97.3%), with a small percentage of African Americans (1.2%) and Hispanics (1.5%). The median household income is $45,000, and the median age is 43.
Economy
Retsof is a small, rural community, and the economy is largely based on agriculture. The area is home to several farms, which produce a variety of crops, including corn, soybeans, and hay. There are also several small businesses in the area, including a few restaurants, a gas station, and a few retail stores.
The hamlet is also home to a few small manufacturing companies, which produce a variety of products, including furniture, clothing, and electronics. The area is also home to a few small wineries, which produce a variety of wines.
Conclusion
Retsof, New York is a small hamlet located in the town of York, Livingston County, New York. It is situated on the Genesee River, about 25 miles south of Rochester. The hamlet was founded in 1812 and is named after the Retsof family, who were among the first settlers in the area. The population of Retsof is predominantly white, and the economy is largely based on agriculture. There are also several small businesses in the area, including a few restaurants, a gas station, and a few retail stores. The area is also home to a few small manufacturing companies, which produce a variety of products, and a few small wineries, which produce a variety of wines.
Common Questions
What is Per Capita Income in Retsof?
Per Capita income in Retsof is $45,223.
What is the Median Family Income in Retsof?
Median Family Income in Retsof is $187,652.
What is the Median Household income in Retsof?
Median Household Income in Retsof is $125,500.
What is Income or Wage Gap in Retsof?
Income or Wage Gap in Retsof is 86.1%.
Women in Retsof earn 13.9 cents for every dollar earned by a man.
What is Inequality or Gini Index in Retsof?
Inequality or Gini Index in Retsof is 0.21.
What is the Total Population of Retsof?
Total Population of Retsof is 236.
What is the Total Male Population of Retsof?
Total Male Population of Retsof is 80.
What is the Total Female Population of Retsof?
Total Female Population of Retsof is 156.
What is the Ratio of Males per 100 Females in Retsof?
There are 51.28 Males per 100 Females in Retsof.
What is the Ratio of Females per 100 Males in Retsof?
There are 195.00 Females per 100 Males in Retsof.
What is the Median Population Age in Retsof?
Median Population Age in Retsof is 41.4 Years.
What is the Average Family Size in Retsof
Average Family Size in Retsof is 3.5 People.
What is the Average Household Size in Retsof
Average Household Size in Retsof is 2.9 People.
How Large is the Labor Force in Retsof?
There are 191 People in the Labor Forcein in Retsof.
What is the Percentage of People in the Labor Force in Retsof?
86.4% of People are in the Labor Force in Retsof.