Sandy Ridge, PA Map & Demographics
Sandy Ridge Map
Sandy Ridge Overview
$17,604
PER CAPITA INCOME
0.53
INEQUALITY / GINI INDEX
258
TOTAL POPULATION
130
MALE POPULATION
128
FEMALE POPULATION
101.56
MALES / 100 FEMALES
98.46
FEMALES / 100 MALES
53.1
MEDIAN AGE
2.7
AVG FAMILY SIZE
2.4
AVG HOUSEHOLD SIZE
106
LABOR FORCE [ PEOPLE ]
47.5%
PERCENT IN LABOR FORCE
Sandy Ridge Zip Codes
Sandy Ridge Area Codes
Income in Sandy Ridge
Income Overview in Sandy Ridge
| Characteristic | Number | Measure |
| Per Capita Income | 258 | $17,604 |
| Median Family Income | 86 | $0 |
| Mean Family Income | 86 | $46,971 |
| Median Household Income | 109 | $0 |
| Mean Household Income | 109 | $40,813 |
| Income Deficit | 86 | $0 |
| Wage / Income Gap (%) | 258 | 0.00% |
| Wage / Income Gap ($) | 258 | 100.00¢ per $1 |
| Gini / Inequality Index | 258 | 0.53 |
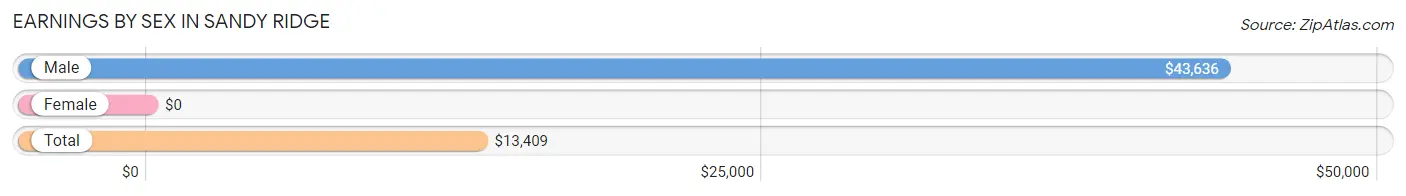
Earnings by Sex in Sandy Ridge
| Sex | Number | Average Earnings |
| Male | 68 (43.6%) | $43,636 |
| Female | 88 (56.4%) | $0 |
| Total | 156 (100.0%) | $13,409 |
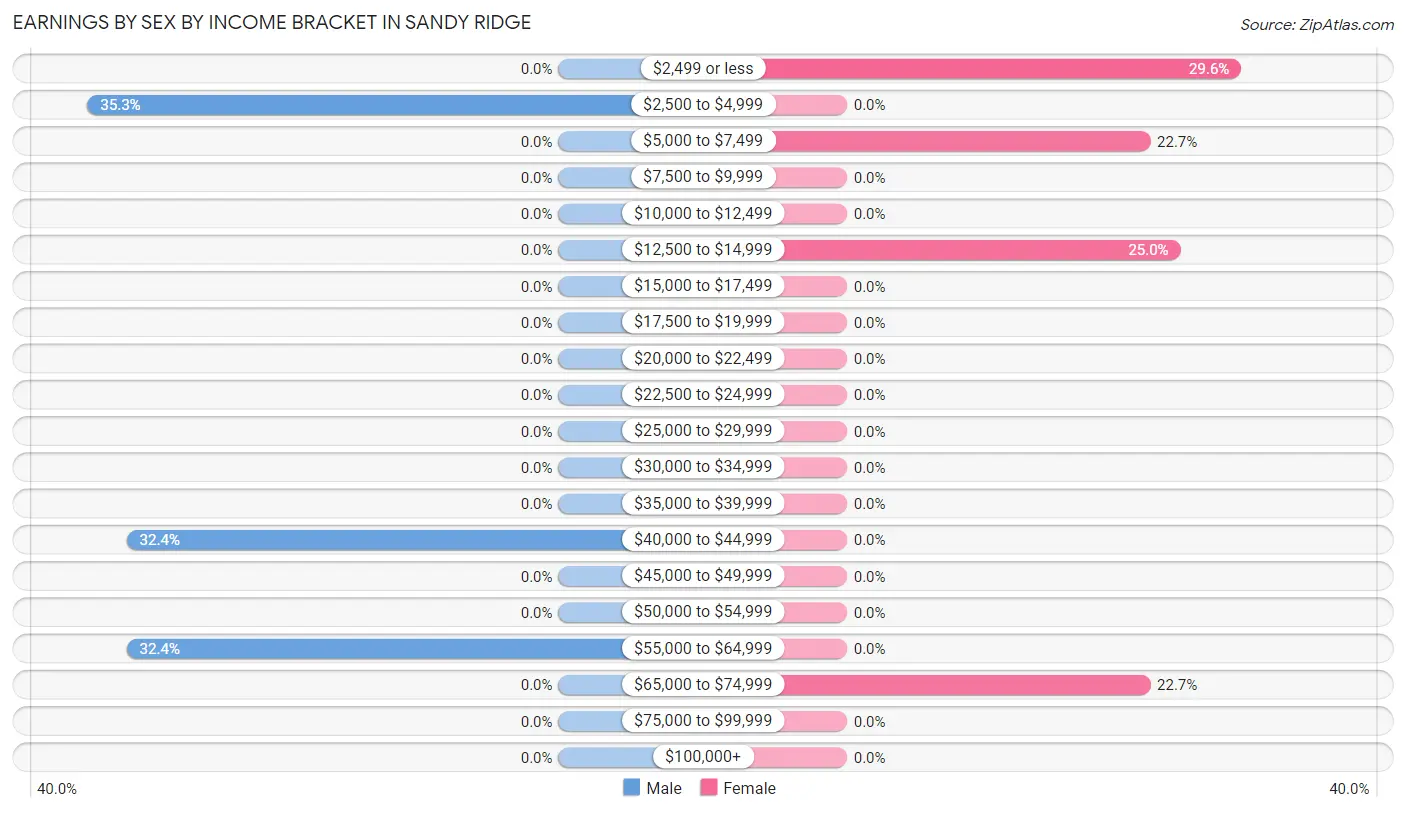
Earnings by Sex by Income Bracket in Sandy Ridge
The most common earnings brackets in Sandy Ridge are $2,500 to $4,999 for men (24 | 35.3%) and $2,499 or less for women (26 | 29.5%).
| Income | Male | Female |
| $2,499 or less | 0 (0.0%) | 26 (29.5%) |
| $2,500 to $4,999 | 24 (35.3%) | 0 (0.0%) |
| $5,000 to $7,499 | 0 (0.0%) | 20 (22.7%) |
| $7,500 to $9,999 | 0 (0.0%) | 0 (0.0%) |
| $10,000 to $12,499 | 0 (0.0%) | 0 (0.0%) |
| $12,500 to $14,999 | 0 (0.0%) | 22 (25.0%) |
| $15,000 to $17,499 | 0 (0.0%) | 0 (0.0%) |
| $17,500 to $19,999 | 0 (0.0%) | 0 (0.0%) |
| $20,000 to $22,499 | 0 (0.0%) | 0 (0.0%) |
| $22,500 to $24,999 | 0 (0.0%) | 0 (0.0%) |
| $25,000 to $29,999 | 0 (0.0%) | 0 (0.0%) |
| $30,000 to $34,999 | 0 (0.0%) | 0 (0.0%) |
| $35,000 to $39,999 | 0 (0.0%) | 0 (0.0%) |
| $40,000 to $44,999 | 22 (32.4%) | 0 (0.0%) |
| $45,000 to $49,999 | 0 (0.0%) | 0 (0.0%) |
| $50,000 to $54,999 | 0 (0.0%) | 0 (0.0%) |
| $55,000 to $64,999 | 22 (32.4%) | 0 (0.0%) |
| $65,000 to $74,999 | 0 (0.0%) | 20 (22.7%) |
| $75,000 to $99,999 | 0 (0.0%) | 0 (0.0%) |
| $100,000+ | 0 (0.0%) | 0 (0.0%) |
| Total | 68 (100.0%) | 88 (100.0%) |
Earnings by Sex by Educational Attainment in Sandy Ridge
| Educational Attainment | Male Income | Female Income |
| Less than High School | - | - |
| High School Diploma | - | - |
| College or Associate's Degree | - | - |
| Bachelor's Degree | - | - |
| Graduate Degree | - | - |
| Total | - | - |
Family Income in Sandy Ridge
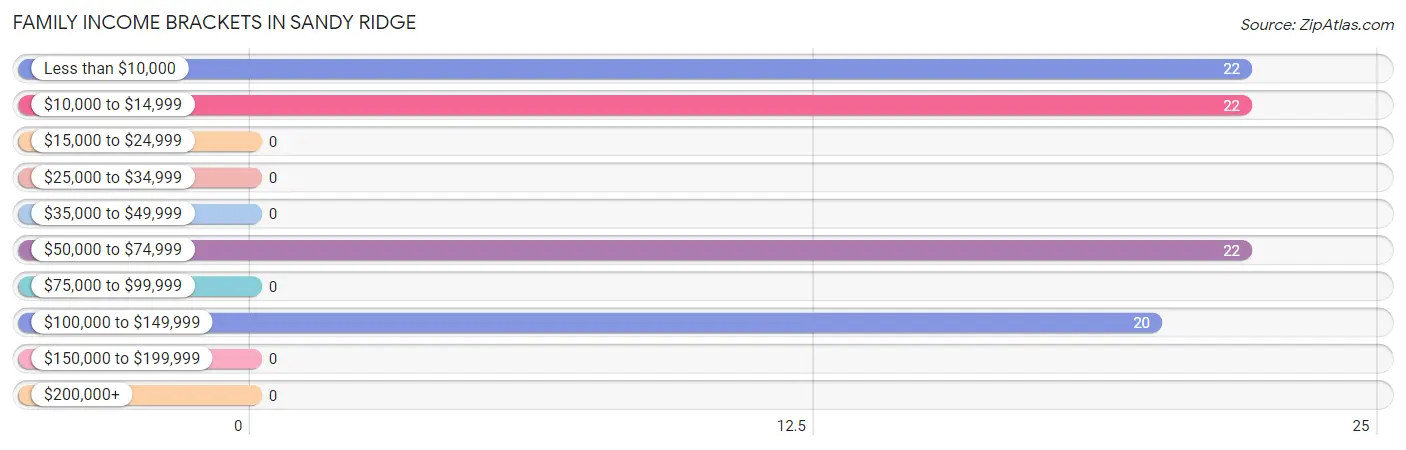
Family Income Brackets in Sandy Ridge
According to the Sandy Ridge family income data, there are 22 families falling into the less than $10,000 income range, which is the most common income bracket and makes up 25.6% of all families.
| Income Bracket | # Families | % Families |
| Less than $10,000 | 22 | 25.6% |
| $10,000 to $14,999 | 22 | 25.6% |
| $15,000 to $24,999 | 0 | 0.0% |
| $25,000 to $34,999 | 0 | 0.0% |
| $35,000 to $49,999 | 0 | 0.0% |
| $50,000 to $74,999 | 22 | 25.6% |
| $75,000 to $99,999 | 0 | 0.0% |
| $100,000 to $149,999 | 20 | 23.3% |
| $150,000 to $199,999 | 0 | 0.0% |
| $200,000+ | 0 | 0.0% |
Family Income by Famaliy Size in Sandy Ridge
| Income Bracket | # Families | Median Income |
| 2-Person Families | 44 (51.2%) | $0 |
| 3-Person Families | 0 (0.0%) | $0 |
| 4-Person Families | 42 (48.8%) | $0 |
| 5-Person Families | 0 (0.0%) | $0 |
| 6-Person Families | 0 (0.0%) | $0 |
| 7+ Person Families | 0 (0.0%) | $0 |
| Total | 86 (100.0%) | $0 |
Family Income by Number of Earners in Sandy Ridge
| Number of Earners | # Families | Median Income |
| No Earners | 22 (25.6%) | $0 |
| 1 Earner | 22 (25.6%) | $0 |
| 2 Earners | 22 (25.6%) | $0 |
| 3+ Earners | 20 (23.3%) | $0 |
| Total | 86 (100.0%) | $0 |
Household Income in Sandy Ridge
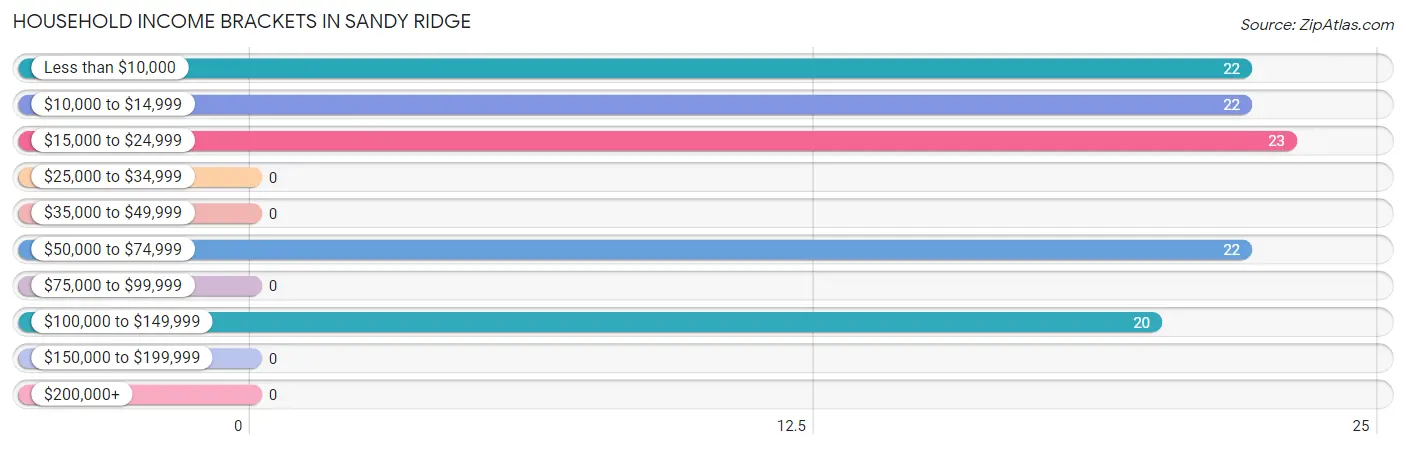
Household Income Brackets in Sandy Ridge
With 23 households falling in the category, the $15,000 to $24,999 income range is the most frequent in Sandy Ridge, accounting for 21.1% of all households.
| Income Bracket | # Households | % Households |
| Less than $10,000 | 22 | 20.2% |
| $10,000 to $14,999 | 22 | 20.2% |
| $15,000 to $24,999 | 23 | 21.1% |
| $25,000 to $34,999 | 0 | 0.0% |
| $35,000 to $49,999 | 0 | 0.0% |
| $50,000 to $74,999 | 22 | 20.2% |
| $75,000 to $99,999 | 0 | 0.0% |
| $100,000 to $149,999 | 20 | 18.3% |
| $150,000 to $199,999 | 0 | 0.0% |
| $200,000+ | 0 | 0.0% |
Household Income by Householder Age in Sandy Ridge
The median household income in Sandy Ridge is $0, with the highest median household income of $14,943 found in the 45 to 64 years age bracket for the primary householder. A total of 87 households (79.8%) fall into this category.
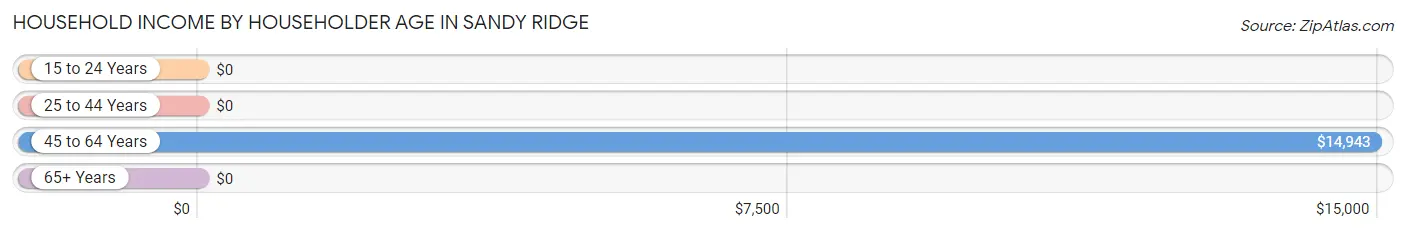
| Income Bracket | # Households | Median Income |
| 15 to 24 Years | 0 (0.0%) | $0 |
| 25 to 44 Years | 22 (20.2%) | $0 |
| 45 to 64 Years | 87 (79.8%) | $14,943 |
| 65+ Years | 0 (0.0%) | $0 |
| Total | 109 (100.0%) | $0 |
Poverty in Sandy Ridge
Income Below Poverty by Sex and Age in Sandy Ridge
With 17.7% poverty level for males and 33.6% for females among the residents of Sandy Ridge, 55 to 64 year old males and 55 to 64 year old females are the most vulnerable to poverty, with 22 males (50.0%) and 43 females (100.0%) in their respective age groups living below the poverty level.
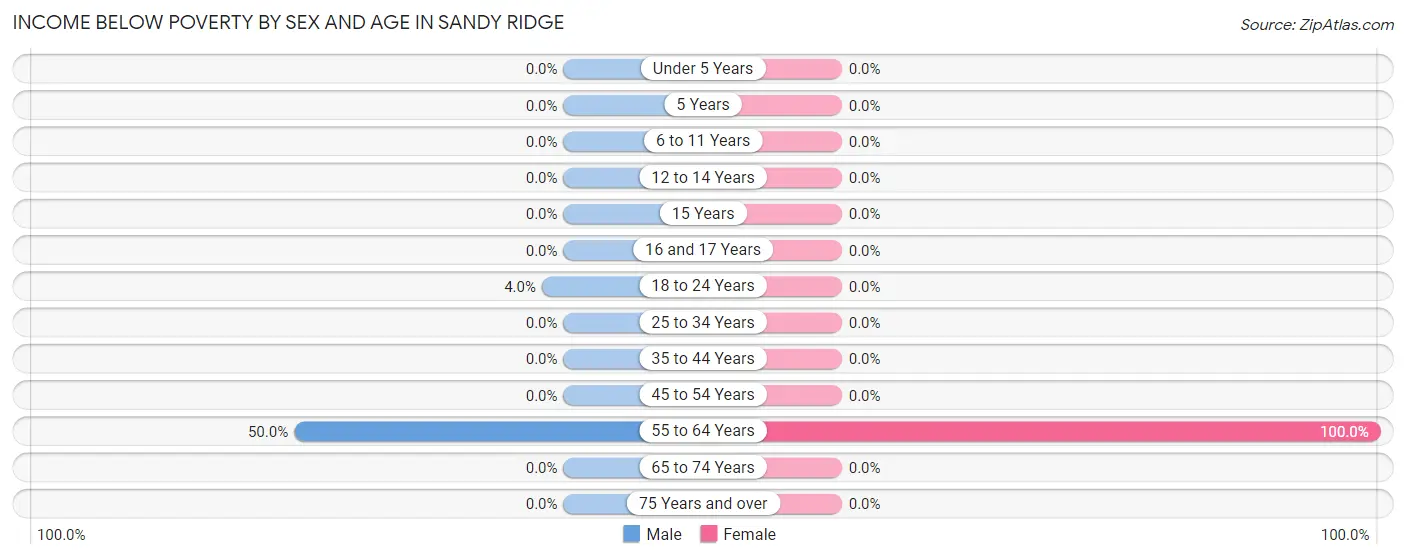
| Age Bracket | Male | Female |
| Under 5 Years | 0 (0.0%) | 0 (0.0%) |
| 5 Years | 0 (0.0%) | 0 (0.0%) |
| 6 to 11 Years | 0 (0.0%) | 0 (0.0%) |
| 12 to 14 Years | 0 (0.0%) | 0 (0.0%) |
| 15 Years | 0 (0.0%) | 0 (0.0%) |
| 16 and 17 Years | 0 (0.0%) | 0 (0.0%) |
| 18 to 24 Years | 1 (4.0%) | 0 (0.0%) |
| 25 to 34 Years | 0 (0.0%) | 0 (0.0%) |
| 35 to 44 Years | 0 (0.0%) | 0 (0.0%) |
| 45 to 54 Years | 0 (0.0%) | 0 (0.0%) |
| 55 to 64 Years | 22 (50.0%) | 43 (100.0%) |
| 65 to 74 Years | 0 (0.0%) | 0 (0.0%) |
| 75 Years and over | 0 (0.0%) | 0 (0.0%) |
| Total | 23 (17.7%) | 43 (33.6%) |
Income Above Poverty by Sex and Age in Sandy Ridge
According to the poverty statistics in Sandy Ridge, males aged under 5 years and females aged 6 to 11 years are the age groups that are most secure financially, with 100.0% of males and 100.0% of females in these age groups living above the poverty line.
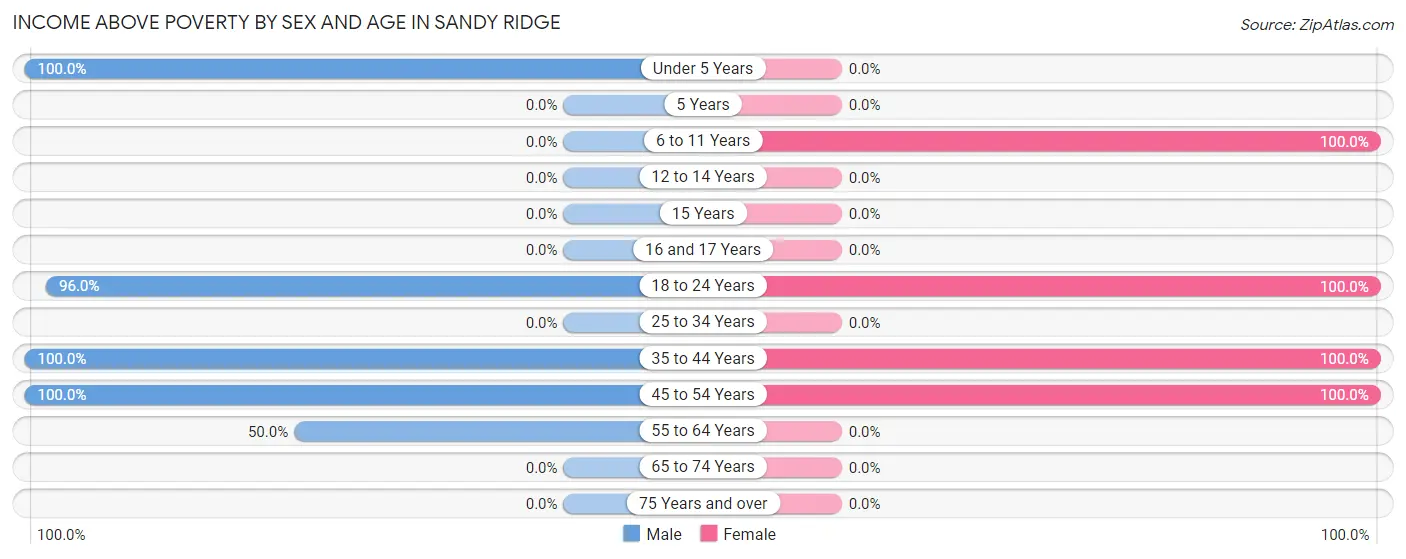
| Age Bracket | Male | Female |
| Under 5 Years | 16 (100.0%) | 0 (0.0%) |
| 5 Years | 0 (0.0%) | 0 (0.0%) |
| 6 to 11 Years | 0 (0.0%) | 19 (100.0%) |
| 12 to 14 Years | 0 (0.0%) | 0 (0.0%) |
| 15 Years | 0 (0.0%) | 0 (0.0%) |
| 16 and 17 Years | 0 (0.0%) | 0 (0.0%) |
| 18 to 24 Years | 24 (96.0%) | 26 (100.0%) |
| 25 to 34 Years | 0 (0.0%) | 0 (0.0%) |
| 35 to 44 Years | 22 (100.0%) | 20 (100.0%) |
| 45 to 54 Years | 23 (100.0%) | 20 (100.0%) |
| 55 to 64 Years | 22 (50.0%) | 0 (0.0%) |
| 65 to 74 Years | 0 (0.0%) | 0 (0.0%) |
| 75 Years and over | 0 (0.0%) | 0 (0.0%) |
| Total | 107 (82.3%) | 85 (66.4%) |
Income Below Poverty Among Married-Couple Families in Sandy Ridge
The poverty statistics for married-couple families in Sandy Ridge show that 34.4% or 22 of the total 64 families live below the poverty line. Families with no children have the highest poverty rate of 52.4%, comprising of 22 families. On the other hand, families with 1 or 2 children have the lowest poverty rate of 0.0%, which includes 0 families.
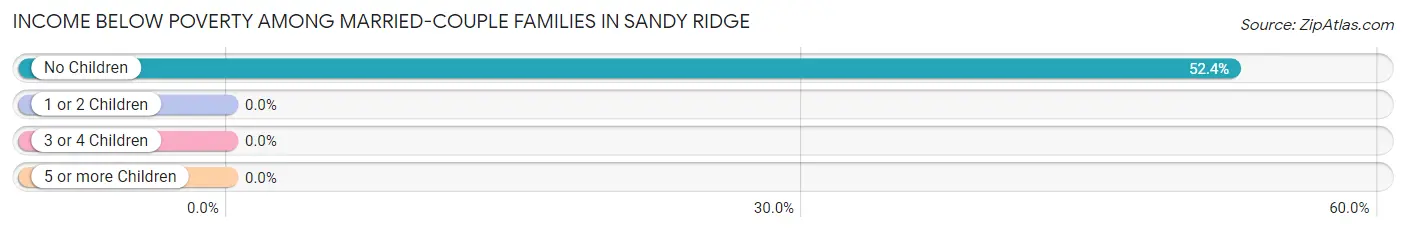
| Children | Above Poverty | Below Poverty |
| No Children | 20 (47.6%) | 22 (52.4%) |
| 1 or 2 Children | 22 (100.0%) | 0 (0.0%) |
| 3 or 4 Children | 0 (0.0%) | 0 (0.0%) |
| 5 or more Children | 0 (0.0%) | 0 (0.0%) |
| Total | 42 (65.6%) | 22 (34.4%) |
Income Below Poverty Among Single-Parent Households in Sandy Ridge
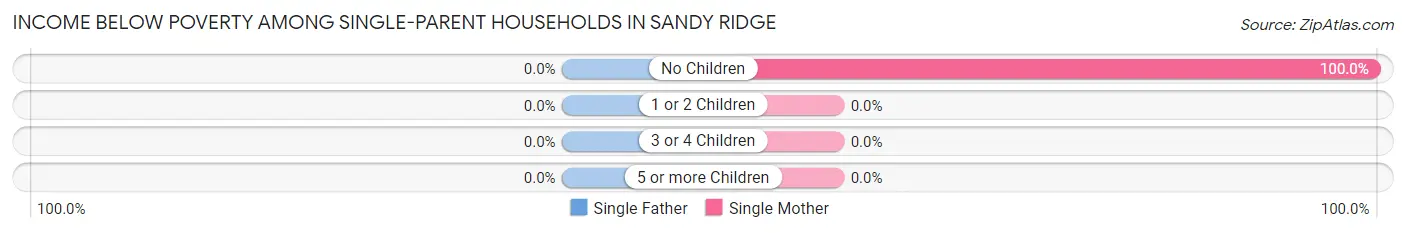
| Children | Single Father | Single Mother |
| No Children | 0 (0.0%) | 22 (100.0%) |
| 1 or 2 Children | 0 (0.0%) | 0 (0.0%) |
| 3 or 4 Children | 0 (0.0%) | 0 (0.0%) |
| 5 or more Children | 0 (0.0%) | 0 (0.0%) |
| Total | 0 (0.0%) | 22 (100.0%) |
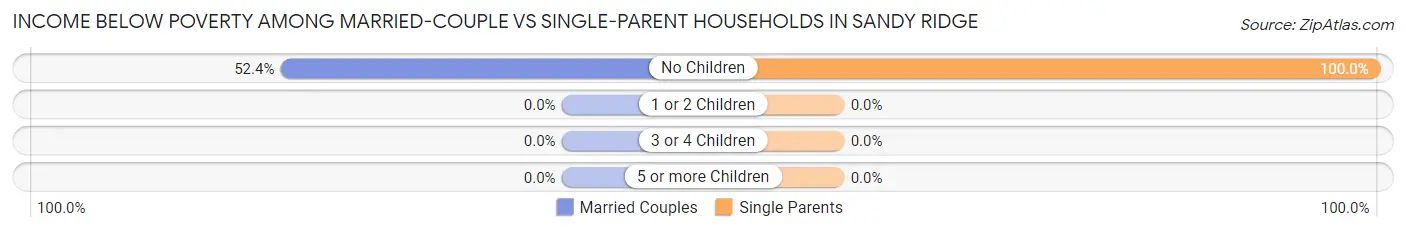
Income Below Poverty Among Married-Couple vs Single-Parent Households in Sandy Ridge
The poverty data for Sandy Ridge shows that 22 of the married-couple family households (34.4%) and 22 of the single-parent households (100.0%) are living below the poverty level. Within the married-couple family households, those with no children have the highest poverty rate, with 22 households (52.4%) falling below the poverty line. Among the single-parent households, those with no children have the highest poverty rate, with 22 household (100.0%) living below poverty.
| Children | Married-Couple Families | Single-Parent Households |
| No Children | 22 (52.4%) | 22 (100.0%) |
| 1 or 2 Children | 0 (0.0%) | 0 (0.0%) |
| 3 or 4 Children | 0 (0.0%) | 0 (0.0%) |
| 5 or more Children | 0 (0.0%) | 0 (0.0%) |
| Total | 22 (34.4%) | 22 (100.0%) |
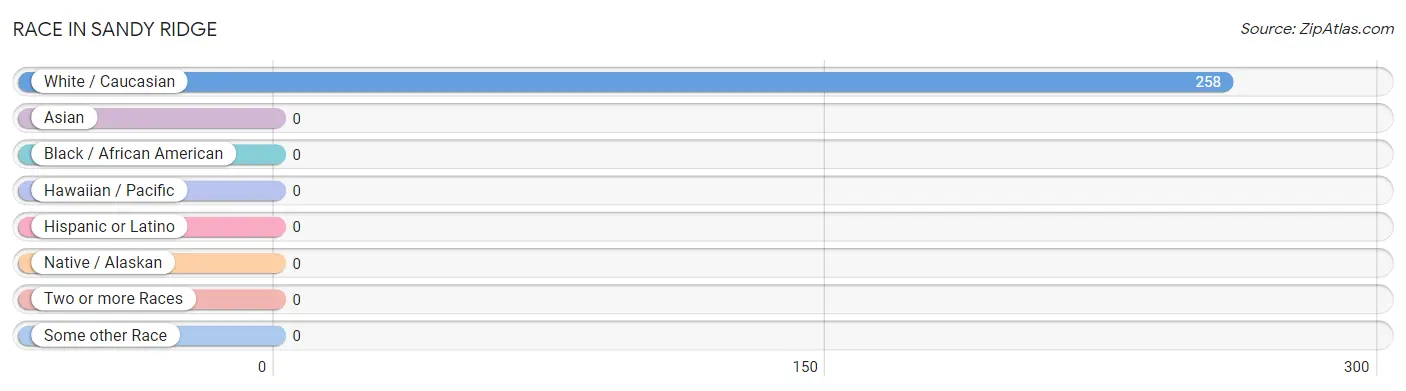
Race in Sandy Ridge
The most populous races in Sandy Ridge are , and White / Caucasian (258 | 100.0%).
| Race | # Population | % Population |
| Asian | 0 | 0.0% |
| Black / African American | 0 | 0.0% |
| Hawaiian / Pacific | 0 | 0.0% |
| Hispanic or Latino | 0 | 0.0% |
| Native / Alaskan | 0 | 0.0% |
| White / Caucasian | 258 | 100.0% |
| Two or more Races | 0 | 0.0% |
| Some other Race | 0 | 0.0% |
| Total | 258 | 100.0% |
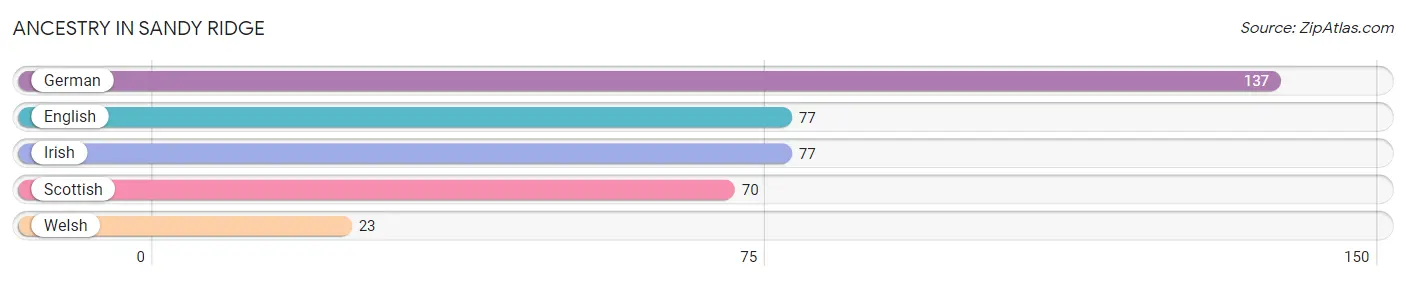
Ancestry in Sandy Ridge
The most populous ancestries reported in Sandy Ridge are German (137 | 53.1%), English (77 | 29.8%), Irish (77 | 29.8%), Scottish (70 | 27.1%), and Welsh (23 | 8.9%), together accounting for 148.8% of all Sandy Ridge residents.
| Ancestry | # Population | % Population |
| English | 77 | 29.8% |
| German | 137 | 53.1% |
| Irish | 77 | 29.8% |
| Scottish | 70 | 27.1% |
| Welsh | 23 | 8.9% | View All 5 Rows |
Immigrants in Sandy Ridge

| Immigration Origin | # Population | % Population | View All 0 Rows |
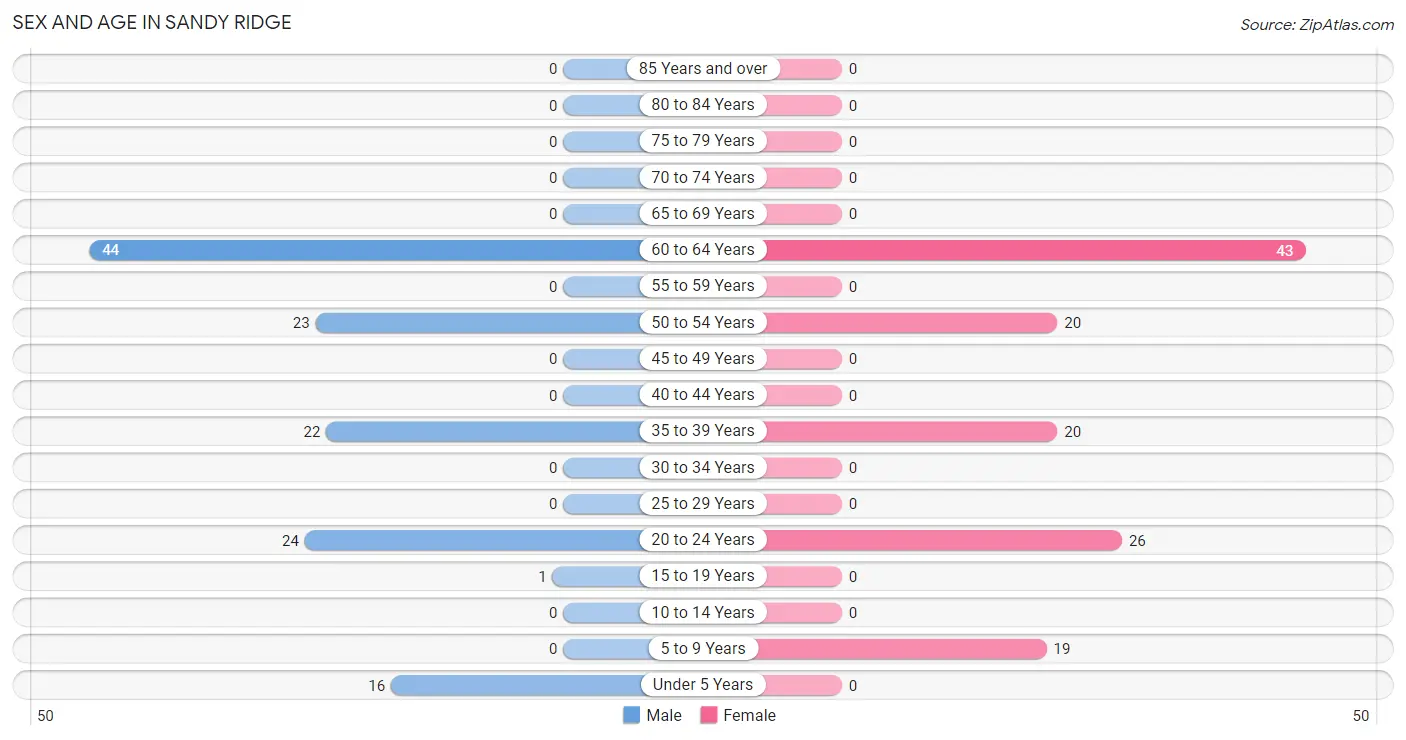
Sex and Age in Sandy Ridge
Sex and Age in Sandy Ridge
The most populous age groups in Sandy Ridge are 60 to 64 Years (44 | 33.9%) for men and 60 to 64 Years (43 | 33.6%) for women.
| Age Bracket | Male | Female |
| Under 5 Years | 16 (12.3%) | 0 (0.0%) |
| 5 to 9 Years | 0 (0.0%) | 19 (14.8%) |
| 10 to 14 Years | 0 (0.0%) | 0 (0.0%) |
| 15 to 19 Years | 1 (0.8%) | 0 (0.0%) |
| 20 to 24 Years | 24 (18.5%) | 26 (20.3%) |
| 25 to 29 Years | 0 (0.0%) | 0 (0.0%) |
| 30 to 34 Years | 0 (0.0%) | 0 (0.0%) |
| 35 to 39 Years | 22 (16.9%) | 20 (15.6%) |
| 40 to 44 Years | 0 (0.0%) | 0 (0.0%) |
| 45 to 49 Years | 0 (0.0%) | 0 (0.0%) |
| 50 to 54 Years | 23 (17.7%) | 20 (15.6%) |
| 55 to 59 Years | 0 (0.0%) | 0 (0.0%) |
| 60 to 64 Years | 44 (33.9%) | 43 (33.6%) |
| 65 to 69 Years | 0 (0.0%) | 0 (0.0%) |
| 70 to 74 Years | 0 (0.0%) | 0 (0.0%) |
| 75 to 79 Years | 0 (0.0%) | 0 (0.0%) |
| 80 to 84 Years | 0 (0.0%) | 0 (0.0%) |
| 85 Years and over | 0 (0.0%) | 0 (0.0%) |
| Total | 130 (100.0%) | 128 (100.0%) |
Families and Households in Sandy Ridge
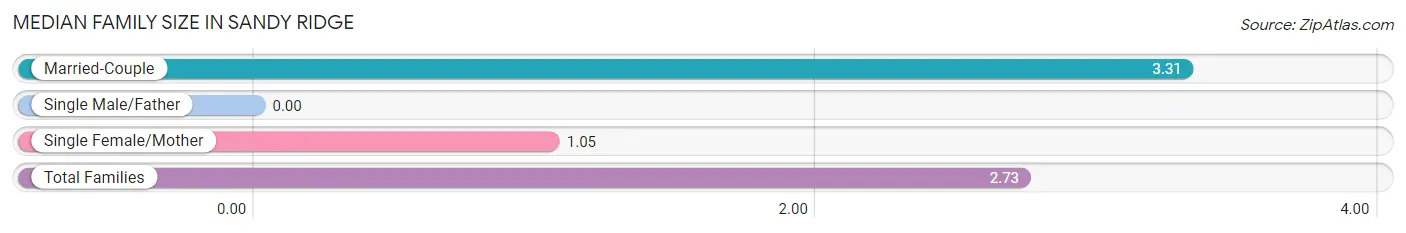
Median Family Size in Sandy Ridge
| Family Type | # Families | Family Size |
| Married-Couple | 64 (74.4%) | 3.31 |
| Single Male/Father | 0 (0.0%) | - |
| Single Female/Mother | 22 (25.6%) | 1.05 |
| Total Families | 86 (100.0%) | 2.73 |
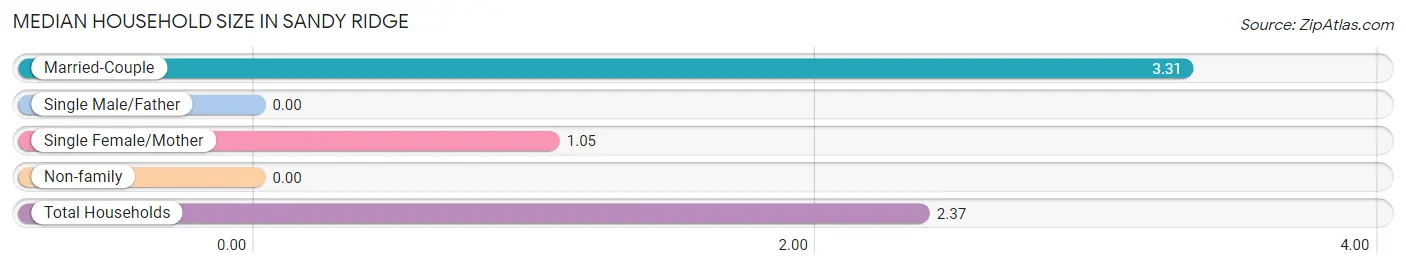
Median Household Size in Sandy Ridge
| Household Type | # Households | Household Size |
| Married-Couple | 64 (58.7%) | 3.31 |
| Single Male/Father | 0 (0.0%) | - |
| Single Female/Mother | 22 (20.2%) | 1.05 |
| Non-family | 23 (21.1%) | - |
| Total Households | 109 (100.0%) | 2.37 |
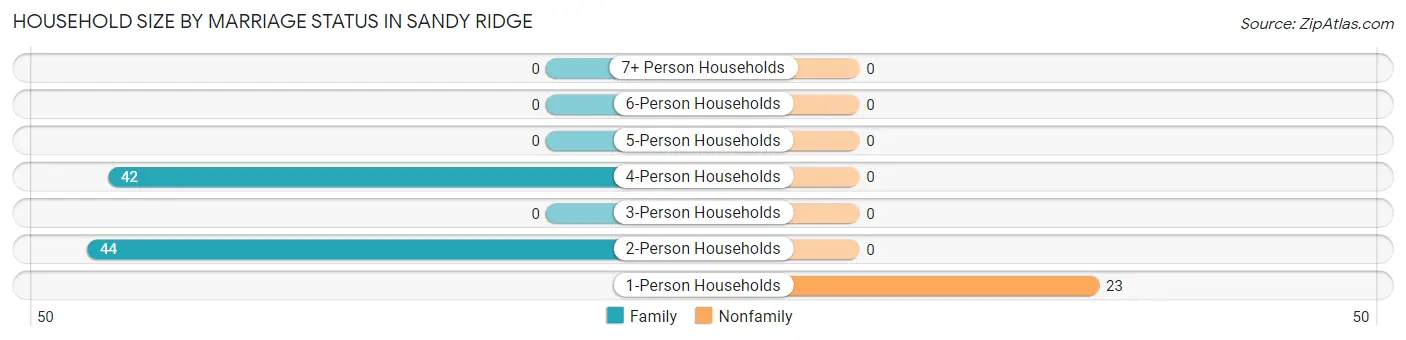
Household Size by Marriage Status in Sandy Ridge
Out of a total of 109 households in Sandy Ridge, 86 (78.9%) are family households, while 23 (21.1%) are nonfamily households. The most numerous type of family households are 2-person households, comprising 44, and the most common type of nonfamily households are 1-person households, comprising 23.
| Household Size | Family Households | Nonfamily Households |
| 1-Person Households | - | 23 (21.1%) |
| 2-Person Households | 44 (40.4%) | 0 (0.0%) |
| 3-Person Households | 0 (0.0%) | 0 (0.0%) |
| 4-Person Households | 42 (38.5%) | 0 (0.0%) |
| 5-Person Households | 0 (0.0%) | 0 (0.0%) |
| 6-Person Households | 0 (0.0%) | 0 (0.0%) |
| 7+ Person Households | 0 (0.0%) | 0 (0.0%) |
| Total | 86 (78.9%) | 23 (21.1%) |
Female Fertility in Sandy Ridge
Fertility by Age in Sandy Ridge
| Age Bracket | Women with Births | Births / 1,000 Women |
| 15 to 19 years | 0 (0.0%) | 0.0 |
| 20 to 34 years | 0 (0.0%) | 0.0 |
| 35 to 50 years | 0 (0.0%) | 0.0 |
| Total | 0 (0.0%) | 0.0 |
Fertility by Age by Marriage Status in Sandy Ridge
| Age Bracket | Married | Unmarried |
| 15 to 19 years | 0 (0.0%) | 0 (0.0%) |
| 20 to 34 years | 0 (0.0%) | 0 (0.0%) |
| 35 to 50 years | 0 (0.0%) | 0 (0.0%) |
| Total | 0 (0.0%) | 0 (0.0%) |
Fertility by Education in Sandy Ridge
| Educational Attainment | Women with Births | Births / 1,000 Women |
| Less than High School | 0 (0.0%) | 0.0 |
| High School Diploma | 0 (0.0%) | 0.0 |
| College or Associate's Degree | 0 (0.0%) | 0.0 |
| Bachelor's Degree | 0 (0.0%) | 0.0 |
| Graduate Degree | 0 (0.0%) | 0.0 |
| Total | 0 (0.0%) | 0.0 |
Fertility by Education by Marriage Status in Sandy Ridge
| Educational Attainment | Married | Unmarried |
| Less than High School | 0 (0.0%) | 0 (0.0%) |
| High School Diploma | 0 (0.0%) | 0 (0.0%) |
| College or Associate's Degree | 0 (0.0%) | 0 (0.0%) |
| Bachelor's Degree | 0 (0.0%) | 0 (0.0%) |
| Graduate Degree | 0 (0.0%) | 0 (0.0%) |
| Total | 0 (0.0%) | 0 (0.0%) |
Employment Characteristics in Sandy Ridge
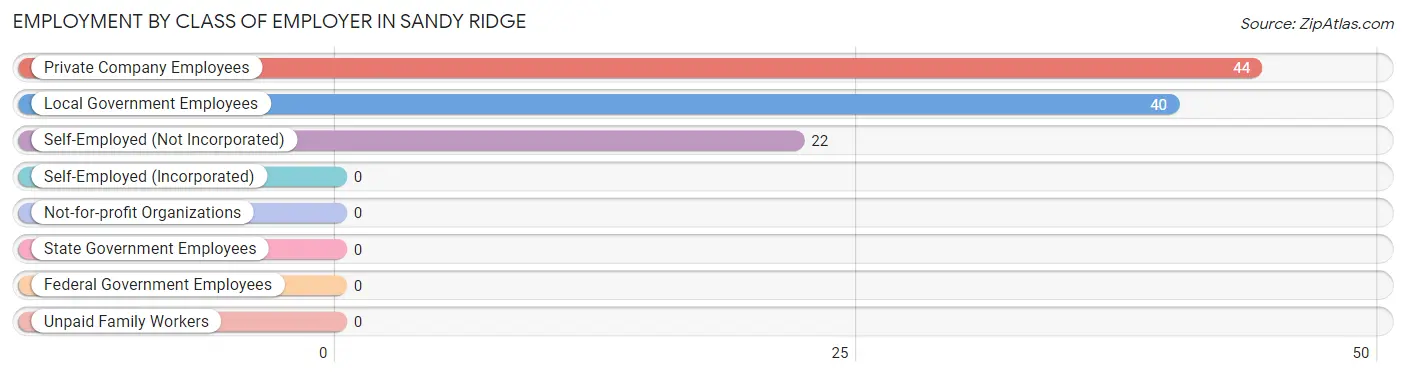
Employment by Class of Employer in Sandy Ridge
Among the 106 employed individuals in Sandy Ridge, private company employees (44 | 41.5%), local government employees (40 | 37.7%), and self-employed (not incorporated) (22 | 20.7%) make up the most common classes of employment.
| Employer Class | # Employees | % Employees |
| Private Company Employees | 44 | 41.5% |
| Self-Employed (Incorporated) | 0 | 0.0% |
| Self-Employed (Not Incorporated) | 22 | 20.7% |
| Not-for-profit Organizations | 0 | 0.0% |
| Local Government Employees | 40 | 37.7% |
| State Government Employees | 0 | 0.0% |
| Federal Government Employees | 0 | 0.0% |
| Unpaid Family Workers | 0 | 0.0% |
| Total | 106 | 100.0% |
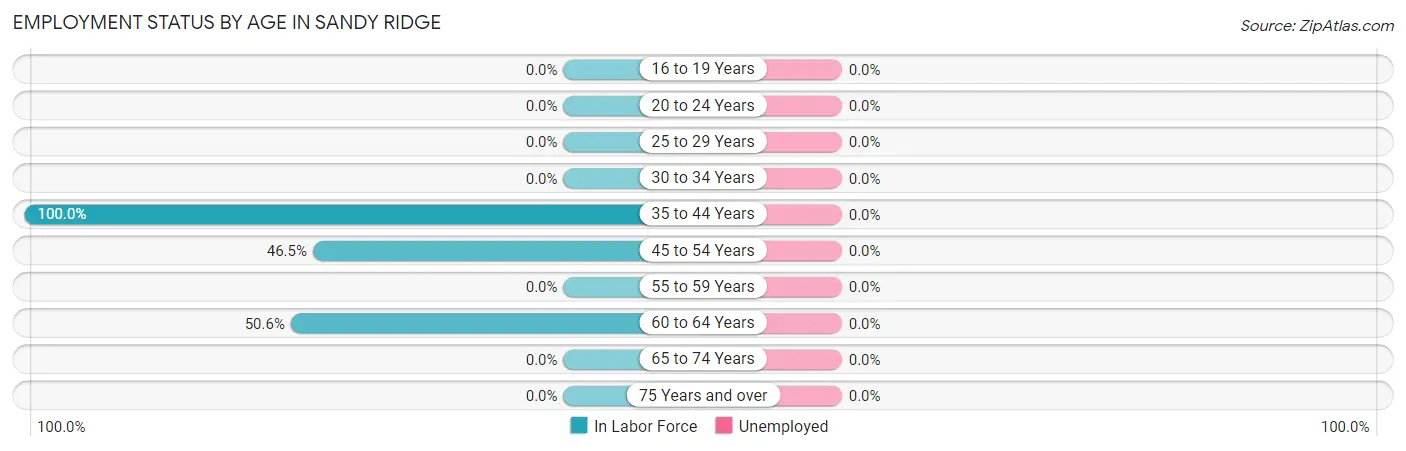
Employment Status by Age in Sandy Ridge
| Age Bracket | In Labor Force | Unemployed |
| 16 to 19 Years | 0 (0.0%) | 0 (0.0%) |
| 20 to 24 Years | 0 (0.0%) | 0 (0.0%) |
| 25 to 29 Years | 0 (0.0%) | 0 (0.0%) |
| 30 to 34 Years | 0 (0.0%) | 0 (0.0%) |
| 35 to 44 Years | 42 (100.0%) | 0 (0.0%) |
| 45 to 54 Years | 20 (46.5%) | 0 (0.0%) |
| 55 to 59 Years | 0 (0.0%) | 0 (0.0%) |
| 60 to 64 Years | 44 (50.6%) | 0 (0.0%) |
| 65 to 74 Years | 0 (0.0%) | 0 (0.0%) |
| 75 Years and over | 0 (0.0%) | 0 (0.0%) |
| Total | 106 (47.5%) | 0 (0.0%) |
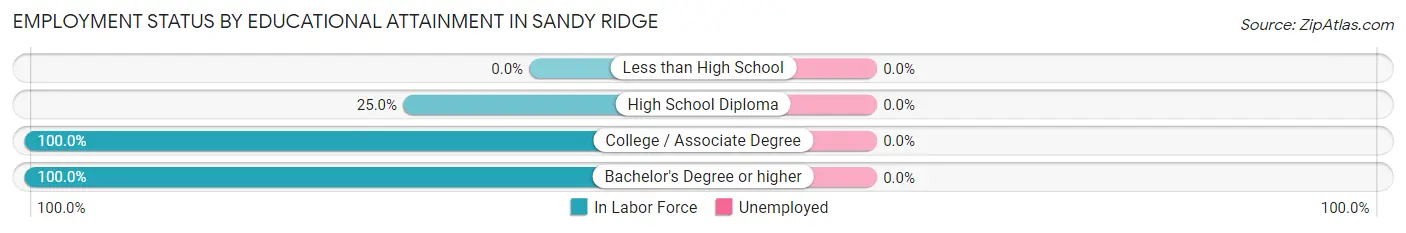
Employment Status by Educational Attainment in Sandy Ridge
| Educational Attainment | In Labor Force | Unemployed |
| Less than High School | 0 (0.0%) | 0 (0.0%) |
| High School Diploma | 22 (25.0%) | 0 (0.0%) |
| College / Associate Degree | 44 (100.0%) | 0 (0.0%) |
| Bachelor's Degree or higher | 40 (100.0%) | 0 (0.0%) |
| Total | 106 (61.6%) | 0 (0.0%) |
Employment Occupations by Sex in Sandy Ridge
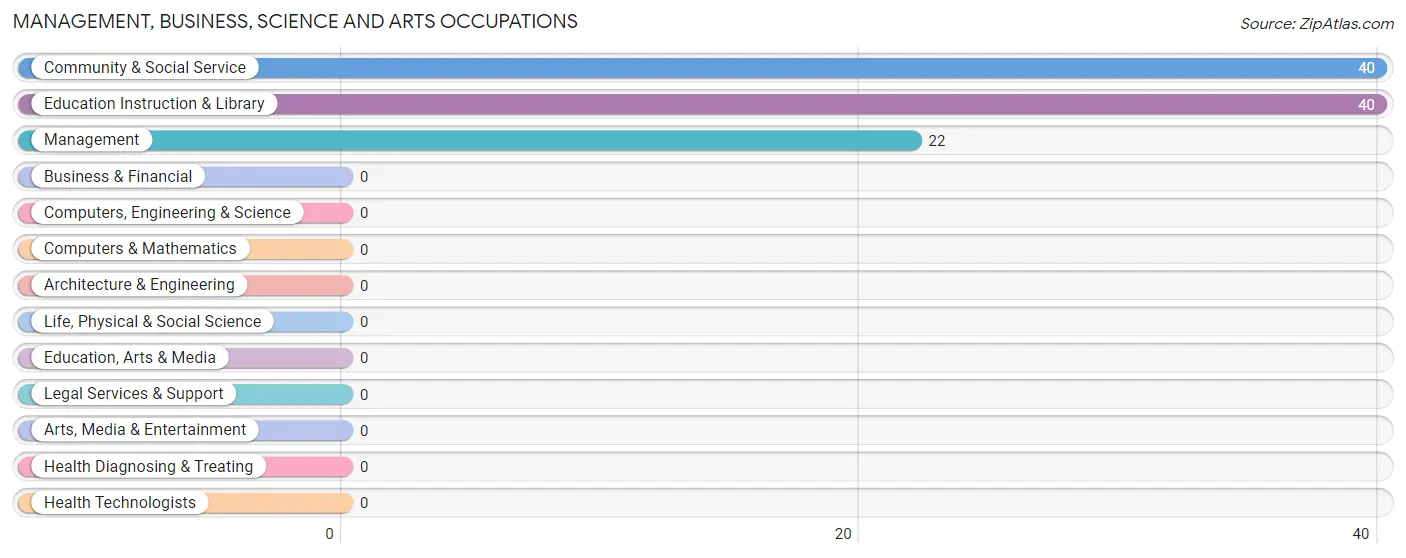
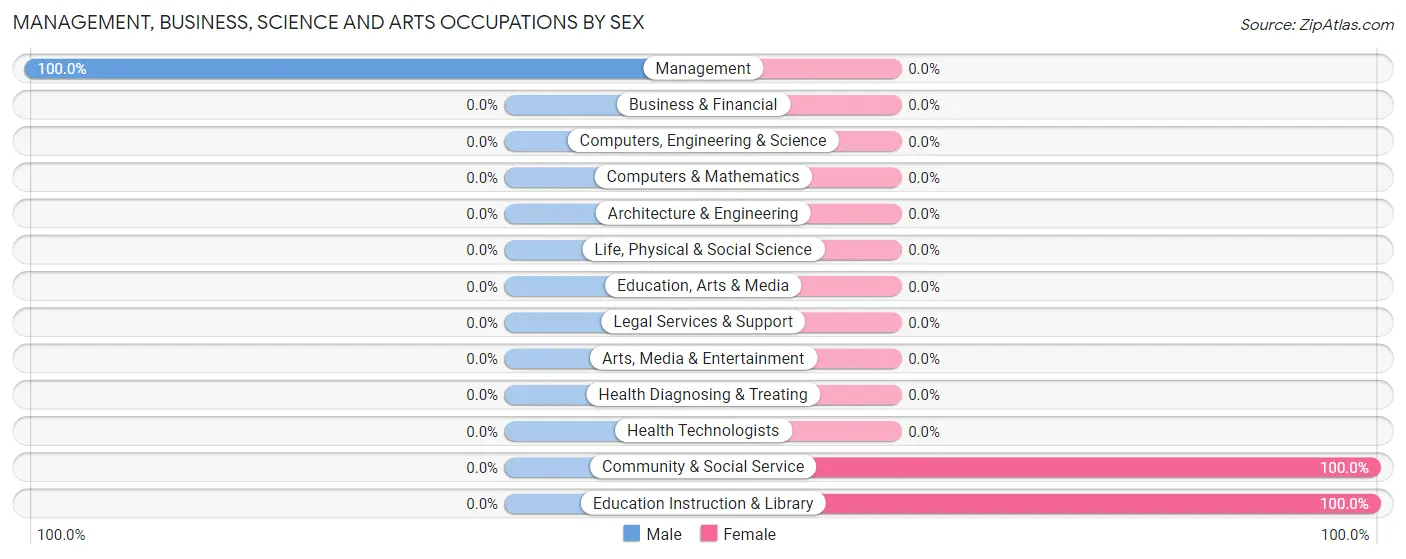
Management, Business, Science and Arts Occupations
The most common Management, Business, Science and Arts occupations in Sandy Ridge are Community & Social Service (40 | 37.7%), Education Instruction & Library (40 | 37.7%), and Management (22 | 20.7%).
Management, Business, Science and Arts Occupations by Sex
| Occupation | Male | Female |
| Management | 22 (100.0%) | 0 (0.0%) |
| Business & Financial | 0 (0.0%) | 0 (0.0%) |
| Computers, Engineering & Science | 0 (0.0%) | 0 (0.0%) |
| Computers & Mathematics | 0 (0.0%) | 0 (0.0%) |
| Architecture & Engineering | 0 (0.0%) | 0 (0.0%) |
| Life, Physical & Social Science | 0 (0.0%) | 0 (0.0%) |
| Community & Social Service | 0 (0.0%) | 40 (100.0%) |
| Education, Arts & Media | 0 (0.0%) | 0 (0.0%) |
| Legal Services & Support | 0 (0.0%) | 0 (0.0%) |
| Education Instruction & Library | 0 (0.0%) | 40 (100.0%) |
| Arts, Media & Entertainment | 0 (0.0%) | 0 (0.0%) |
| Health Diagnosing & Treating | 0 (0.0%) | 0 (0.0%) |
| Health Technologists | 0 (0.0%) | 0 (0.0%) |
| Total (Category) | 22 (35.5%) | 40 (64.5%) |
| Total (Overall) | 44 (41.5%) | 62 (58.5%) |
Services Occupations
Services Occupations by Sex
| Occupation | Male | Female |
| Healthcare Support | 0 (0.0%) | 0 (0.0%) |
| Security & Protection | 0 (0.0%) | 0 (0.0%) |
| Firefighting & Prevention | 0 (0.0%) | 0 (0.0%) |
| Law Enforcement | 0 (0.0%) | 0 (0.0%) |
| Food Preparation & Serving | 0 (0.0%) | 0 (0.0%) |
| Cleaning & Maintenance | 0 (0.0%) | 0 (0.0%) |
| Personal Care & Service | 0 (0.0%) | 0 (0.0%) |
| Total (Category) | 0 (0.0%) | 0 (0.0%) |
| Total (Overall) | 44 (41.5%) | 62 (58.5%) |
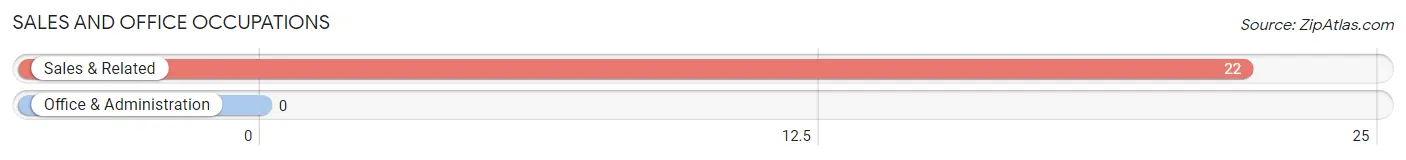
Sales and Office Occupations
The most common Sales and Office occupations in Sandy Ridge are , and Sales & Related (22 | 20.7%).
Sales and Office Occupations by Sex
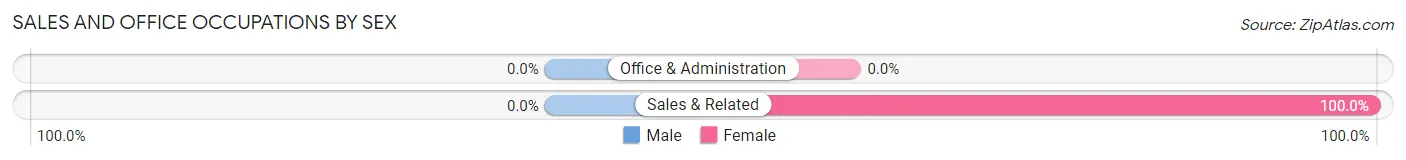
| Occupation | Male | Female |
| Sales & Related | 0 (0.0%) | 22 (100.0%) |
| Office & Administration | 0 (0.0%) | 0 (0.0%) |
| Total (Category) | 0 (0.0%) | 22 (100.0%) |
| Total (Overall) | 44 (41.5%) | 62 (58.5%) |
Natural Resources, Construction and Maintenance Occupations
The most common Natural Resources, Construction and Maintenance occupations in Sandy Ridge are , and Construction & Extraction (22 | 20.7%).
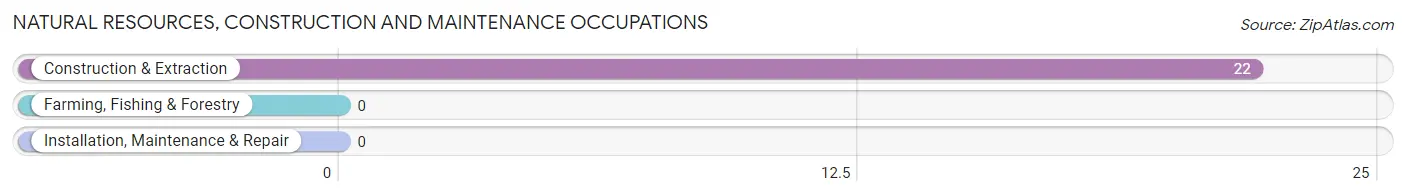
Natural Resources, Construction and Maintenance Occupations by Sex
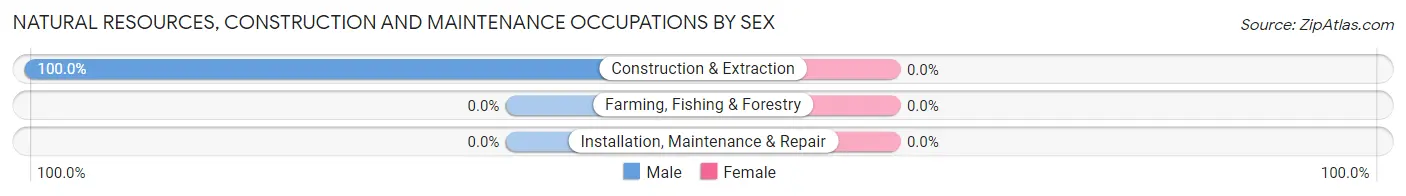
| Occupation | Male | Female |
| Farming, Fishing & Forestry | 0 (0.0%) | 0 (0.0%) |
| Construction & Extraction | 22 (100.0%) | 0 (0.0%) |
| Installation, Maintenance & Repair | 0 (0.0%) | 0 (0.0%) |
| Total (Category) | 22 (100.0%) | 0 (0.0%) |
| Total (Overall) | 44 (41.5%) | 62 (58.5%) |
Production, Transportation and Moving Occupations
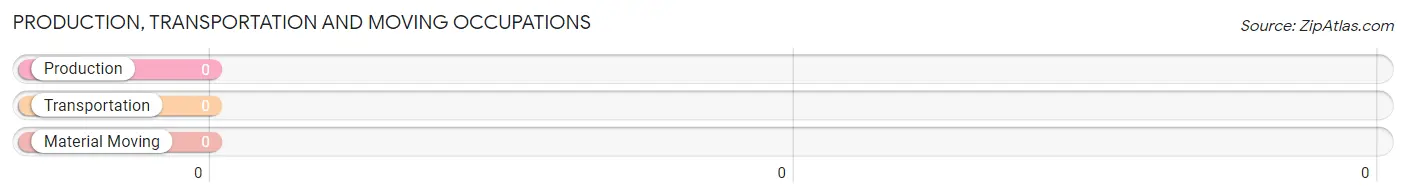
Production, Transportation and Moving Occupations by Sex
| Occupation | Male | Female |
| Production | 0 (0.0%) | 0 (0.0%) |
| Transportation | 0 (0.0%) | 0 (0.0%) |
| Material Moving | 0 (0.0%) | 0 (0.0%) |
| Total (Category) | 0 (0.0%) | 0 (0.0%) |
| Total (Overall) | 44 (41.5%) | 62 (58.5%) |
Employment Industries by Sex in Sandy Ridge
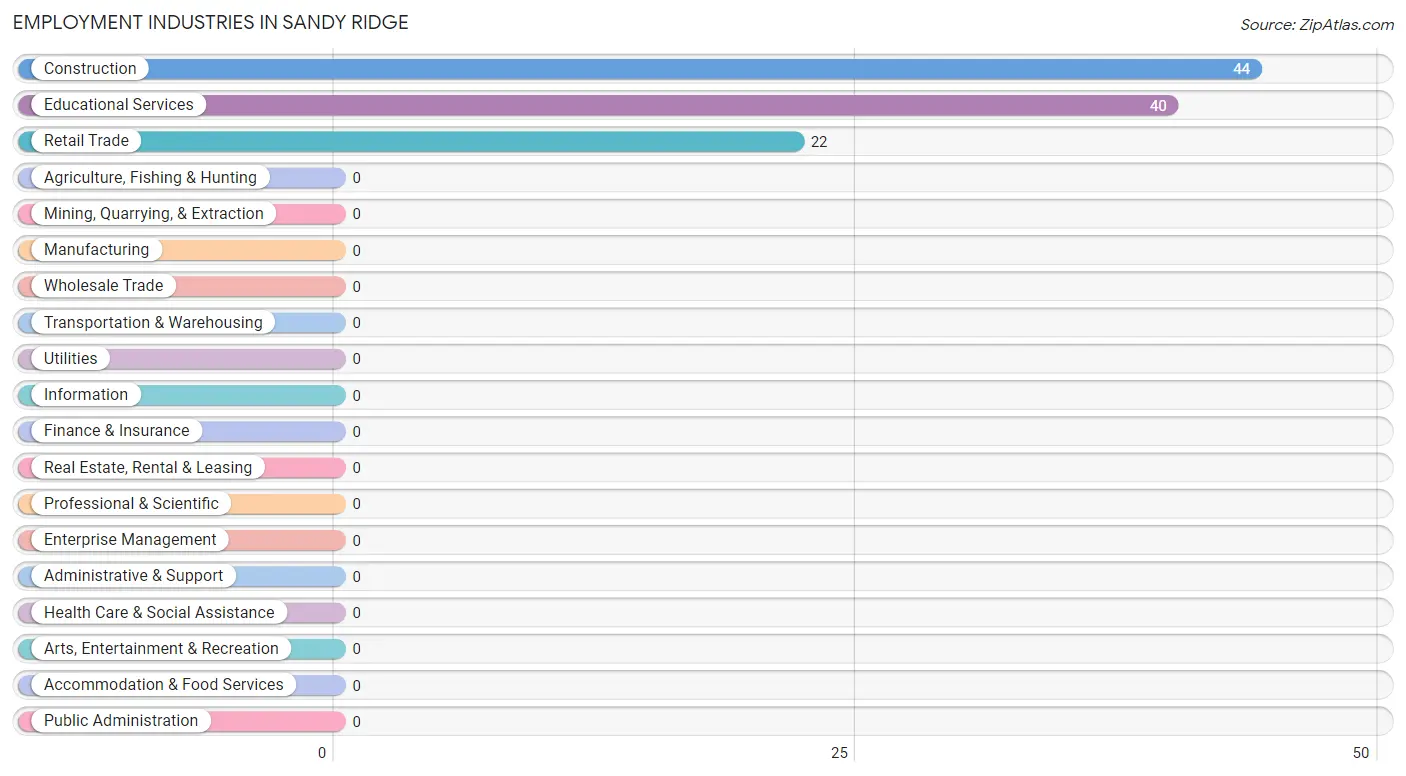
Employment Industries in Sandy Ridge
The major employment industries in Sandy Ridge include Construction (44 | 41.5%), Educational Services (40 | 37.7%), and Retail Trade (22 | 20.7%).
Employment Industries by Sex in Sandy Ridge
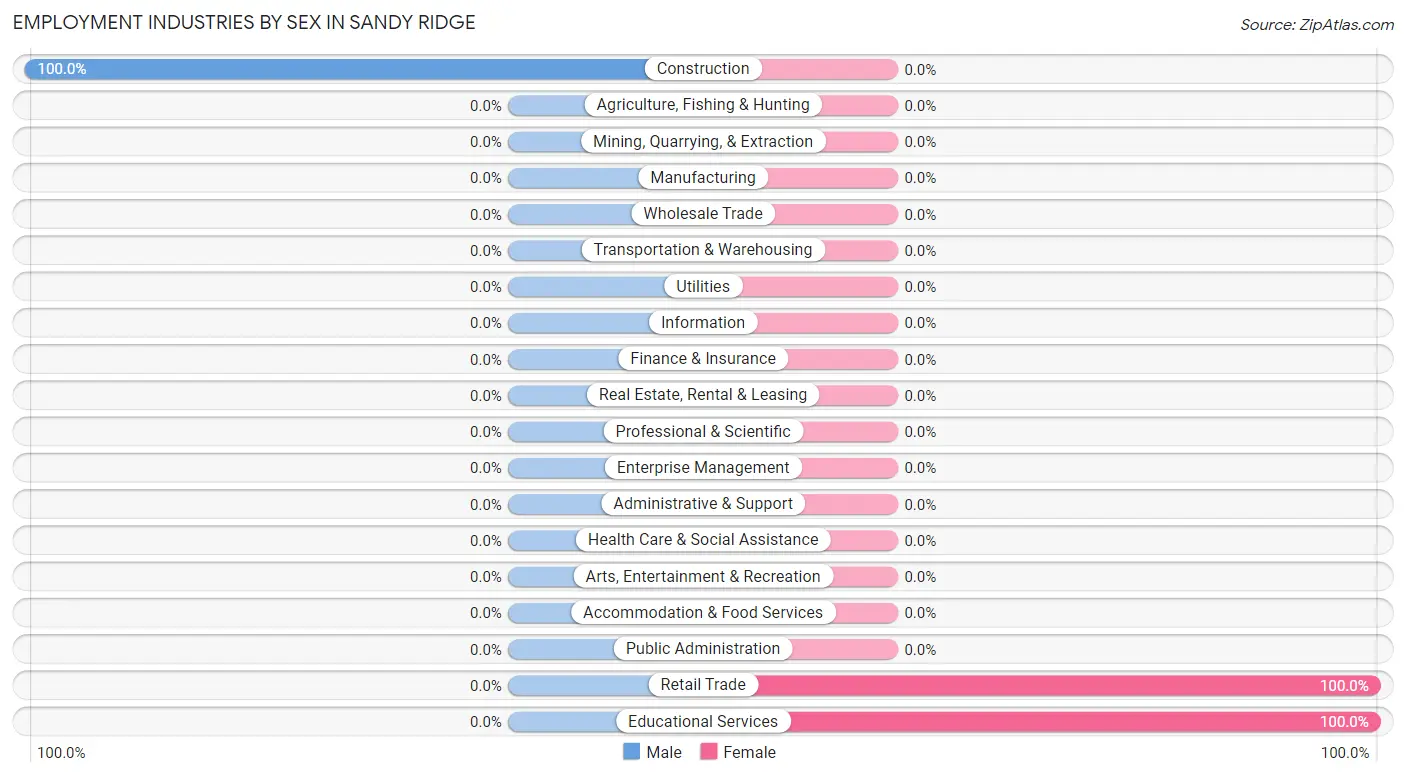
| Industry | Male | Female |
| Agriculture, Fishing & Hunting | 0 (0.0%) | 0 (0.0%) |
| Mining, Quarrying, & Extraction | 0 (0.0%) | 0 (0.0%) |
| Construction | 44 (100.0%) | 0 (0.0%) |
| Manufacturing | 0 (0.0%) | 0 (0.0%) |
| Wholesale Trade | 0 (0.0%) | 0 (0.0%) |
| Retail Trade | 0 (0.0%) | 22 (100.0%) |
| Transportation & Warehousing | 0 (0.0%) | 0 (0.0%) |
| Utilities | 0 (0.0%) | 0 (0.0%) |
| Information | 0 (0.0%) | 0 (0.0%) |
| Finance & Insurance | 0 (0.0%) | 0 (0.0%) |
| Real Estate, Rental & Leasing | 0 (0.0%) | 0 (0.0%) |
| Professional & Scientific | 0 (0.0%) | 0 (0.0%) |
| Enterprise Management | 0 (0.0%) | 0 (0.0%) |
| Administrative & Support | 0 (0.0%) | 0 (0.0%) |
| Educational Services | 0 (0.0%) | 40 (100.0%) |
| Health Care & Social Assistance | 0 (0.0%) | 0 (0.0%) |
| Arts, Entertainment & Recreation | 0 (0.0%) | 0 (0.0%) |
| Accommodation & Food Services | 0 (0.0%) | 0 (0.0%) |
| Public Administration | 0 (0.0%) | 0 (0.0%) |
| Total | 44 (41.5%) | 62 (58.5%) |
Education in Sandy Ridge
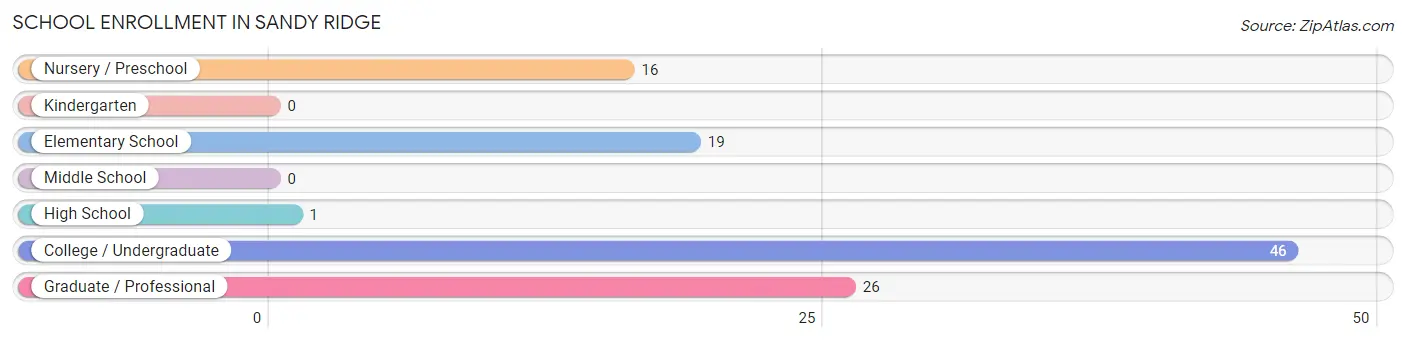
School Enrollment in Sandy Ridge
The most common levels of schooling among the 108 students in Sandy Ridge are college / undergraduate (46 | 42.6%), graduate / professional (26 | 24.1%), and elementary school (19 | 17.6%).
| School Level | # Students | % Students |
| Nursery / Preschool | 16 | 14.8% |
| Kindergarten | 0 | 0.0% |
| Elementary School | 19 | 17.6% |
| Middle School | 0 | 0.0% |
| High School | 1 | 0.9% |
| College / Undergraduate | 46 | 42.6% |
| Graduate / Professional | 26 | 24.1% |
| Total | 108 | 100.0% |
School Enrollment by Age by Funding Source in Sandy Ridge
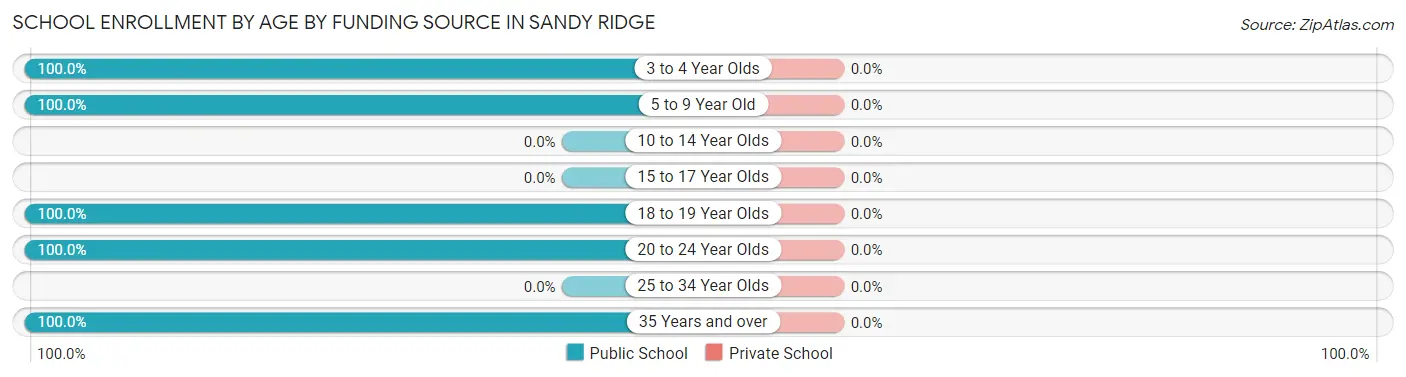
| Age Bracket | Public School | Private School |
| 3 to 4 Year Olds | 16 (100.0%) | 0 (0.0%) |
| 5 to 9 Year Old | 19 (100.0%) | 0 (0.0%) |
| 10 to 14 Year Olds | 0 (0.0%) | 0 (0.0%) |
| 15 to 17 Year Olds | 0 (0.0%) | 0 (0.0%) |
| 18 to 19 Year Olds | 1 (100.0%) | 0 (0.0%) |
| 20 to 24 Year Olds | 50 (100.0%) | 0 (0.0%) |
| 25 to 34 Year Olds | 0 (0.0%) | 0 (0.0%) |
| 35 Years and over | 22 (100.0%) | 0 (0.0%) |
| Total | 108 (100.0%) | 0 (0.0%) |
Educational Attainment by Field of Study in Sandy Ridge
Education (20 | 50.0%), and liberal arts & history (20 | 50.0%) are the most common fields of study among 40 individuals in Sandy Ridge who have obtained a bachelor's degree or higher.
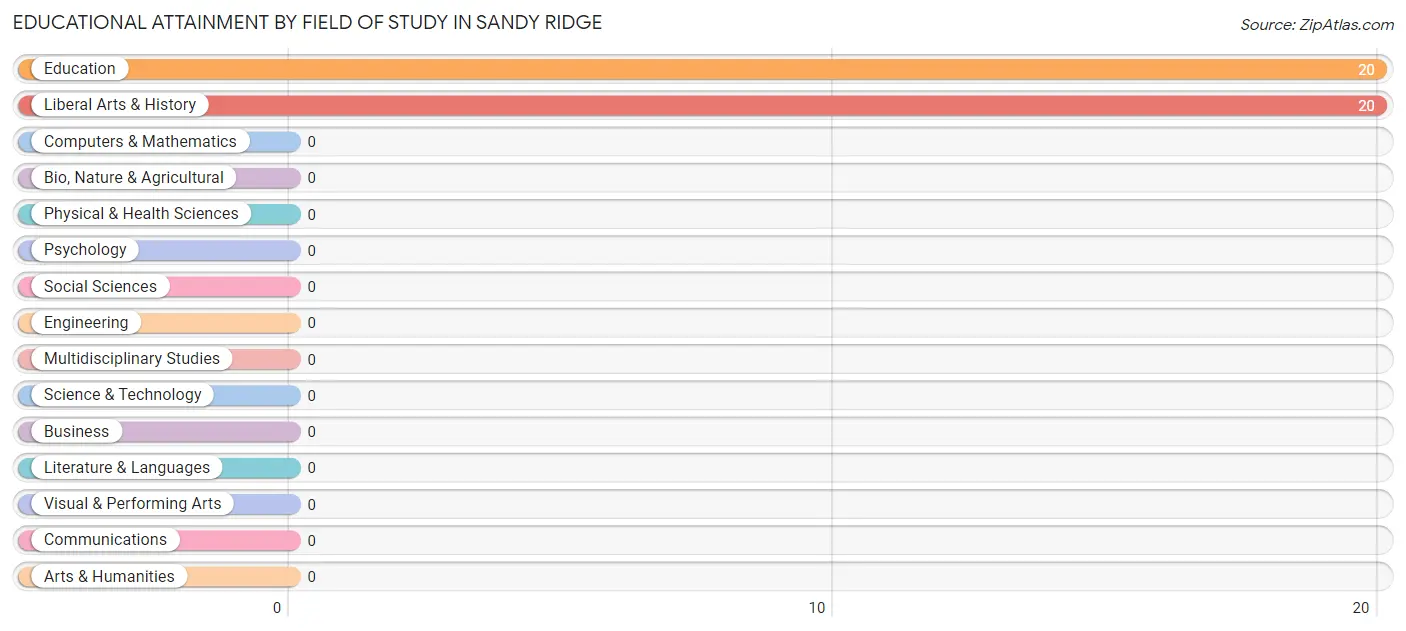
| Field of Study | # Graduates | % Graduates |
| Computers & Mathematics | 0 | 0.0% |
| Bio, Nature & Agricultural | 0 | 0.0% |
| Physical & Health Sciences | 0 | 0.0% |
| Psychology | 0 | 0.0% |
| Social Sciences | 0 | 0.0% |
| Engineering | 0 | 0.0% |
| Multidisciplinary Studies | 0 | 0.0% |
| Science & Technology | 0 | 0.0% |
| Business | 0 | 0.0% |
| Education | 20 | 50.0% |
| Literature & Languages | 0 | 0.0% |
| Liberal Arts & History | 20 | 50.0% |
| Visual & Performing Arts | 0 | 0.0% |
| Communications | 0 | 0.0% |
| Arts & Humanities | 0 | 0.0% |
| Total | 40 | 100.0% |
Transportation & Commute in Sandy Ridge
Vehicle Availability by Sex in Sandy Ridge
The most prevalent vehicle ownership categories in Sandy Ridge are males with 2 vehicles (22, accounting for 50.0%) and females with 2 vehicles (20, making up 35.5%).
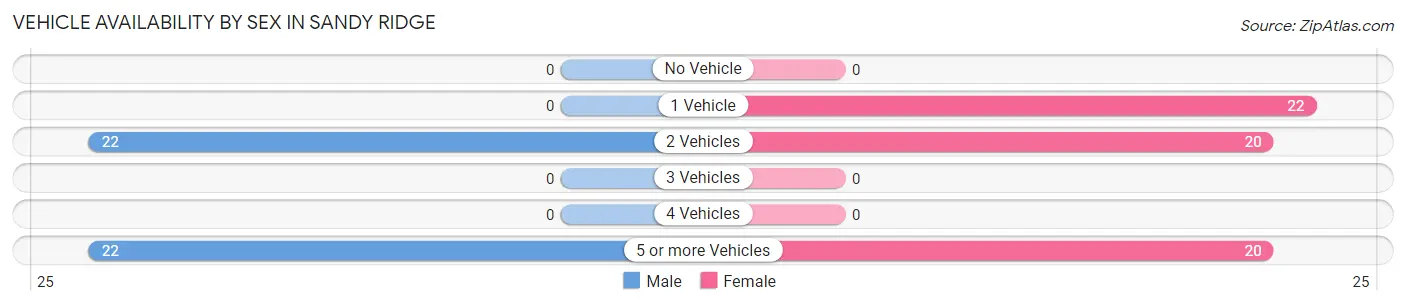
| Vehicles Available | Male | Female |
| No Vehicle | 0 (0.0%) | 0 (0.0%) |
| 1 Vehicle | 0 (0.0%) | 22 (35.5%) |
| 2 Vehicles | 22 (50.0%) | 20 (32.3%) |
| 3 Vehicles | 0 (0.0%) | 0 (0.0%) |
| 4 Vehicles | 0 (0.0%) | 0 (0.0%) |
| 5 or more Vehicles | 22 (50.0%) | 20 (32.3%) |
| Total | 44 (100.0%) | 62 (100.0%) |
Commute Time in Sandy Ridge
The most frequently occuring commute durations in Sandy Ridge are 20 to 24 minutes (22 commuters, 25.6%), 35 to 39 minutes (22 commuters, 25.6%), and 40 to 44 minutes (22 commuters, 25.6%).
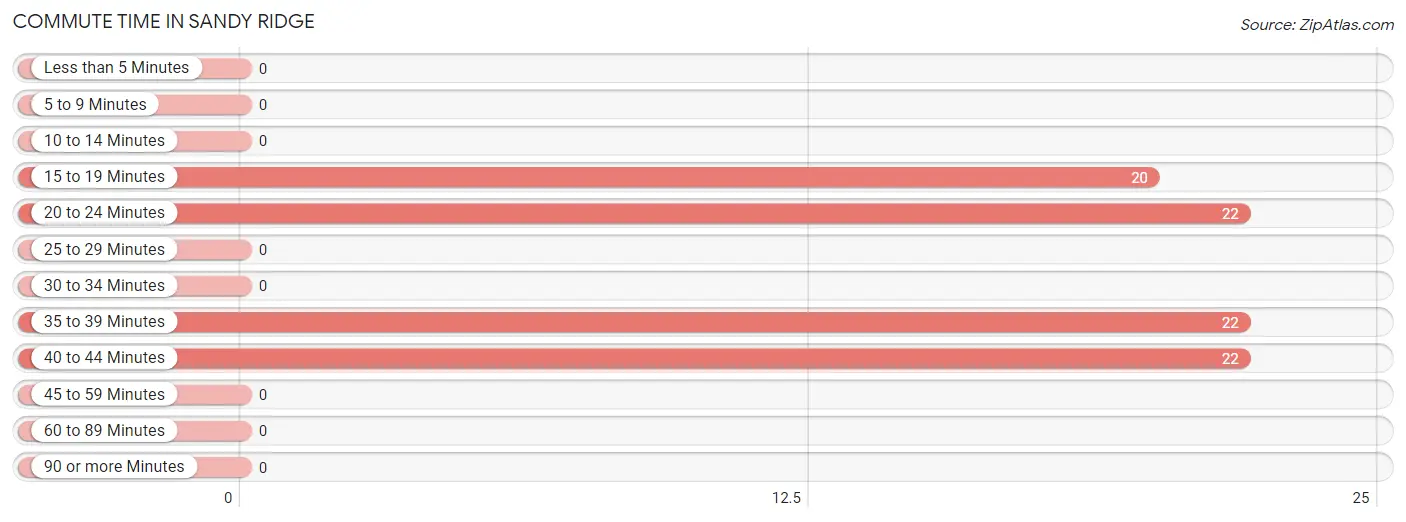
| Commute Time | # Commuters | % Commuters |
| Less than 5 Minutes | 0 | 0.0% |
| 5 to 9 Minutes | 0 | 0.0% |
| 10 to 14 Minutes | 0 | 0.0% |
| 15 to 19 Minutes | 20 | 23.3% |
| 20 to 24 Minutes | 22 | 25.6% |
| 25 to 29 Minutes | 0 | 0.0% |
| 30 to 34 Minutes | 0 | 0.0% |
| 35 to 39 Minutes | 22 | 25.6% |
| 40 to 44 Minutes | 22 | 25.6% |
| 45 to 59 Minutes | 0 | 0.0% |
| 60 to 89 Minutes | 0 | 0.0% |
| 90 or more Minutes | 0 | 0.0% |
Commute Time by Sex in Sandy Ridge
The most common commute times in Sandy Ridge are 35 to 39 minutes (22 commuters, 50.0%) for males and 20 to 24 minutes (22 commuters, 52.4%) for females.
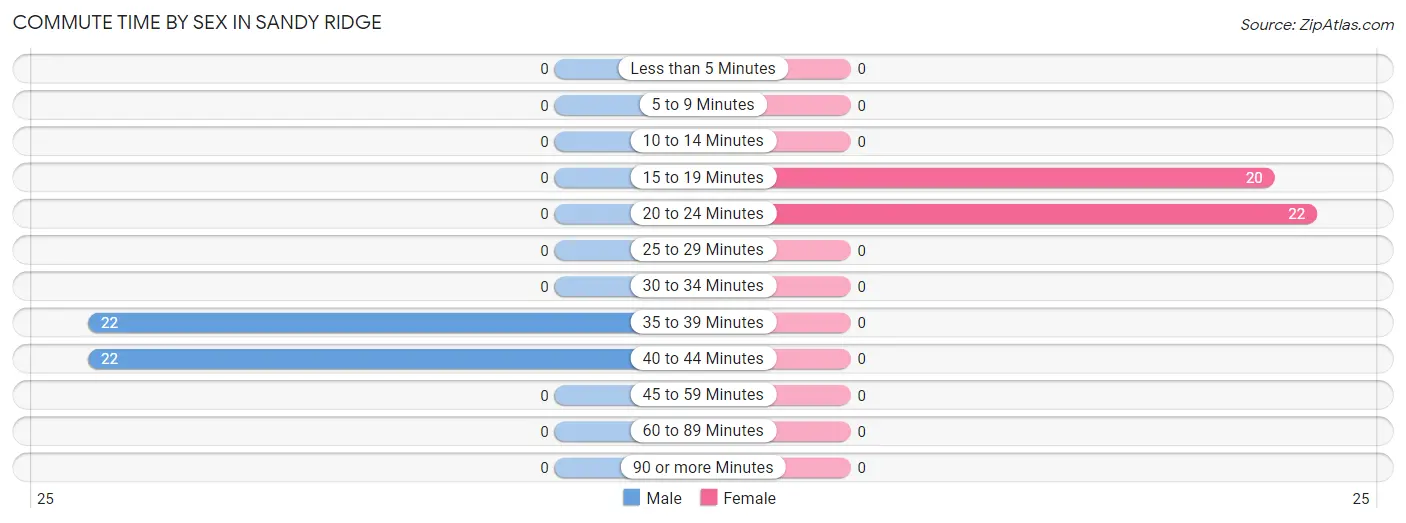
| Commute Time | Male | Female |
| Less than 5 Minutes | 0 (0.0%) | 0 (0.0%) |
| 5 to 9 Minutes | 0 (0.0%) | 0 (0.0%) |
| 10 to 14 Minutes | 0 (0.0%) | 0 (0.0%) |
| 15 to 19 Minutes | 0 (0.0%) | 20 (47.6%) |
| 20 to 24 Minutes | 0 (0.0%) | 22 (52.4%) |
| 25 to 29 Minutes | 0 (0.0%) | 0 (0.0%) |
| 30 to 34 Minutes | 0 (0.0%) | 0 (0.0%) |
| 35 to 39 Minutes | 22 (50.0%) | 0 (0.0%) |
| 40 to 44 Minutes | 22 (50.0%) | 0 (0.0%) |
| 45 to 59 Minutes | 0 (0.0%) | 0 (0.0%) |
| 60 to 89 Minutes | 0 (0.0%) | 0 (0.0%) |
| 90 or more Minutes | 0 (0.0%) | 0 (0.0%) |
Time of Departure to Work by Sex in Sandy Ridge
The most frequent times of departure to work in Sandy Ridge are 6:30 AM to 6:59 AM (22, 50.0%) for males and 7:00 AM to 7:29 AM (42, 100.0%) for females.
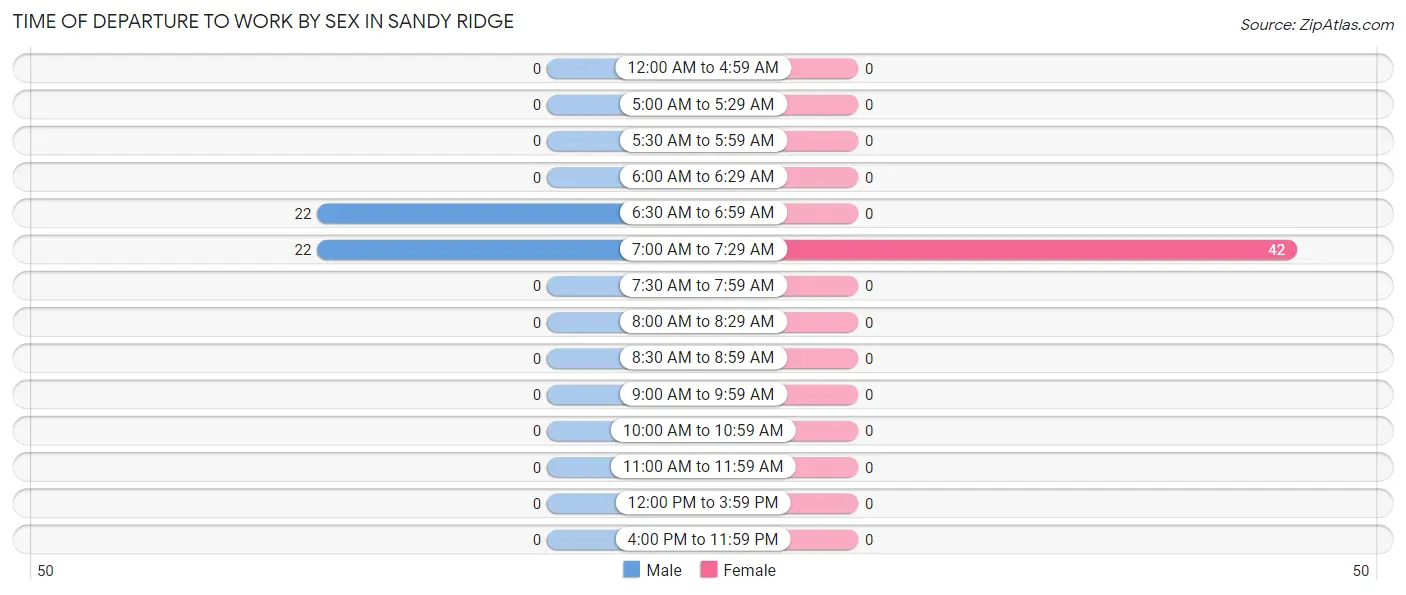
| Time of Departure | Male | Female |
| 12:00 AM to 4:59 AM | 0 (0.0%) | 0 (0.0%) |
| 5:00 AM to 5:29 AM | 0 (0.0%) | 0 (0.0%) |
| 5:30 AM to 5:59 AM | 0 (0.0%) | 0 (0.0%) |
| 6:00 AM to 6:29 AM | 0 (0.0%) | 0 (0.0%) |
| 6:30 AM to 6:59 AM | 22 (50.0%) | 0 (0.0%) |
| 7:00 AM to 7:29 AM | 22 (50.0%) | 42 (100.0%) |
| 7:30 AM to 7:59 AM | 0 (0.0%) | 0 (0.0%) |
| 8:00 AM to 8:29 AM | 0 (0.0%) | 0 (0.0%) |
| 8:30 AM to 8:59 AM | 0 (0.0%) | 0 (0.0%) |
| 9:00 AM to 9:59 AM | 0 (0.0%) | 0 (0.0%) |
| 10:00 AM to 10:59 AM | 0 (0.0%) | 0 (0.0%) |
| 11:00 AM to 11:59 AM | 0 (0.0%) | 0 (0.0%) |
| 12:00 PM to 3:59 PM | 0 (0.0%) | 0 (0.0%) |
| 4:00 PM to 11:59 PM | 0 (0.0%) | 0 (0.0%) |
| Total | 44 (100.0%) | 42 (100.0%) |
Housing Occupancy in Sandy Ridge
Occupancy by Ownership in Sandy Ridge
Of the total 109 dwellings in Sandy Ridge, owner-occupied units account for 87 (79.8%), while renter-occupied units make up 22 (20.2%).
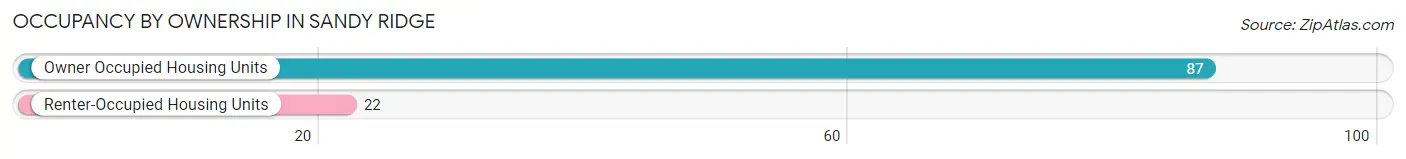
| Occupancy | # Housing Units | % Housing Units |
| Owner Occupied Housing Units | 87 | 79.8% |
| Renter-Occupied Housing Units | 22 | 20.2% |
| Total Occupied Housing Units | 109 | 100.0% |
Occupancy by Household Size in Sandy Ridge
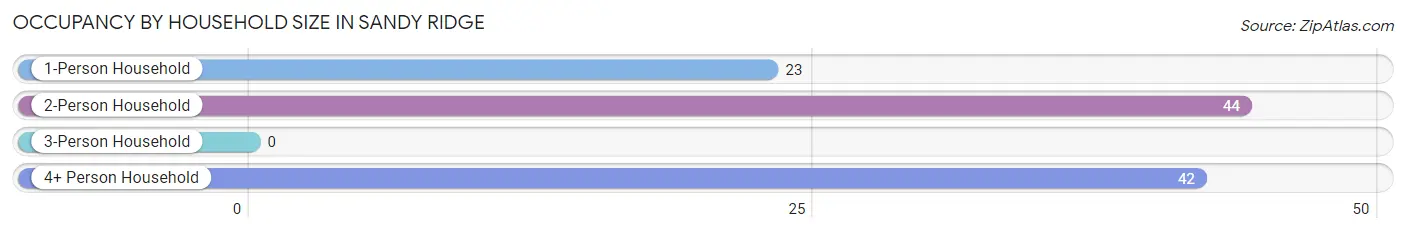
| Household Size | # Housing Units | % Housing Units |
| 1-Person Household | 23 | 21.1% |
| 2-Person Household | 44 | 40.4% |
| 3-Person Household | 0 | 0.0% |
| 4+ Person Household | 42 | 38.5% |
| Total Housing Units | 109 | 100.0% |
Occupancy by Ownership by Household Size in Sandy Ridge
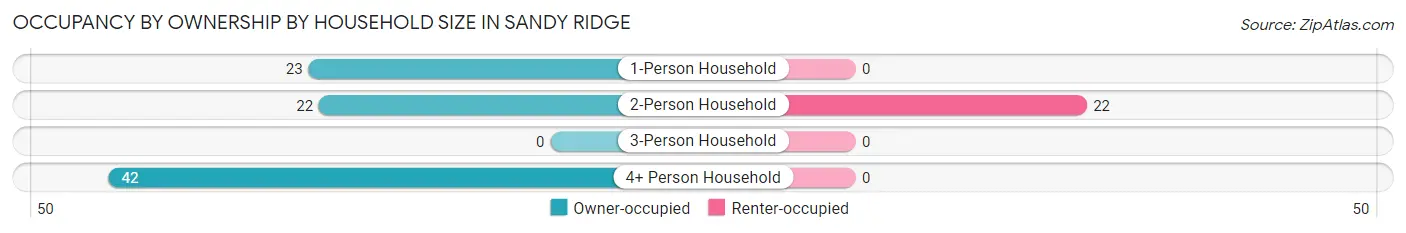
| Household Size | Owner-occupied | Renter-occupied |
| 1-Person Household | 23 (100.0%) | 0 (0.0%) |
| 2-Person Household | 22 (50.0%) | 22 (50.0%) |
| 3-Person Household | 0 (0.0%) | 0 (0.0%) |
| 4+ Person Household | 42 (100.0%) | 0 (0.0%) |
| Total Housing Units | 87 (79.8%) | 22 (20.2%) |
Occupancy by Educational Attainment in Sandy Ridge
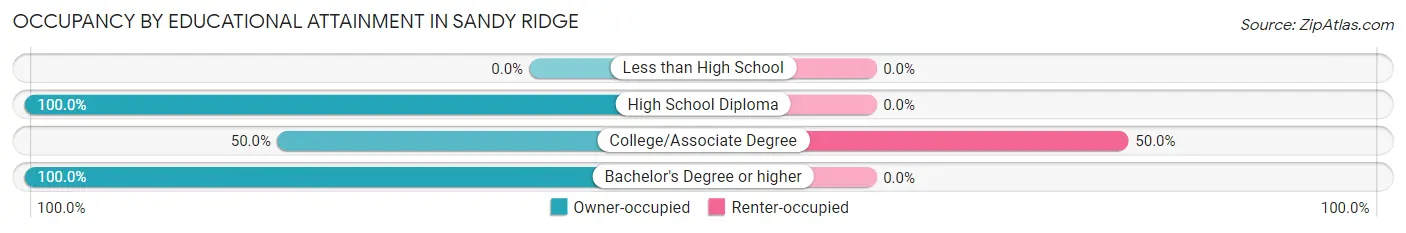
| Household Size | Owner-occupied | Renter-occupied |
| Less than High School | 0 (0.0%) | 0 (0.0%) |
| High School Diploma | 45 (100.0%) | 0 (0.0%) |
| College/Associate Degree | 22 (50.0%) | 22 (50.0%) |
| Bachelor's Degree or higher | 20 (100.0%) | 0 (0.0%) |
Occupancy by Age of Householder in Sandy Ridge
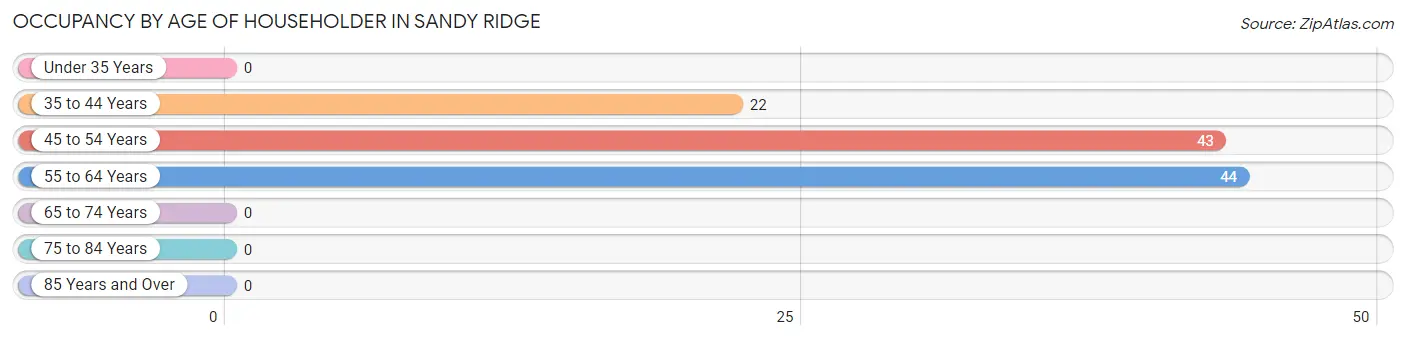
| Age Bracket | # Households | % Households |
| Under 35 Years | 0 | 0.0% |
| 35 to 44 Years | 22 | 20.2% |
| 45 to 54 Years | 43 | 39.5% |
| 55 to 64 Years | 44 | 40.4% |
| 65 to 74 Years | 0 | 0.0% |
| 75 to 84 Years | 0 | 0.0% |
| 85 Years and Over | 0 | 0.0% |
| Total | 109 | 100.0% |
Housing Finances in Sandy Ridge
Median Income by Occupancy in Sandy Ridge
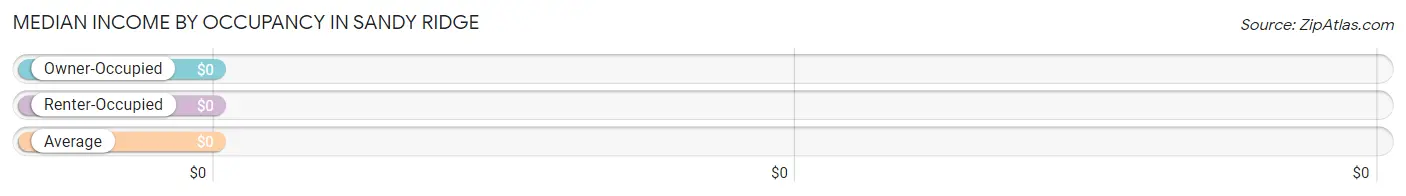
| Occupancy Type | # Households | Median Income |
| Owner-Occupied | 87 (79.8%) | $0 |
| Renter-Occupied | 22 (20.2%) | $0 |
| Average | 109 (100.0%) | $0 |
Occupancy by Householder Income Bracket in Sandy Ridge
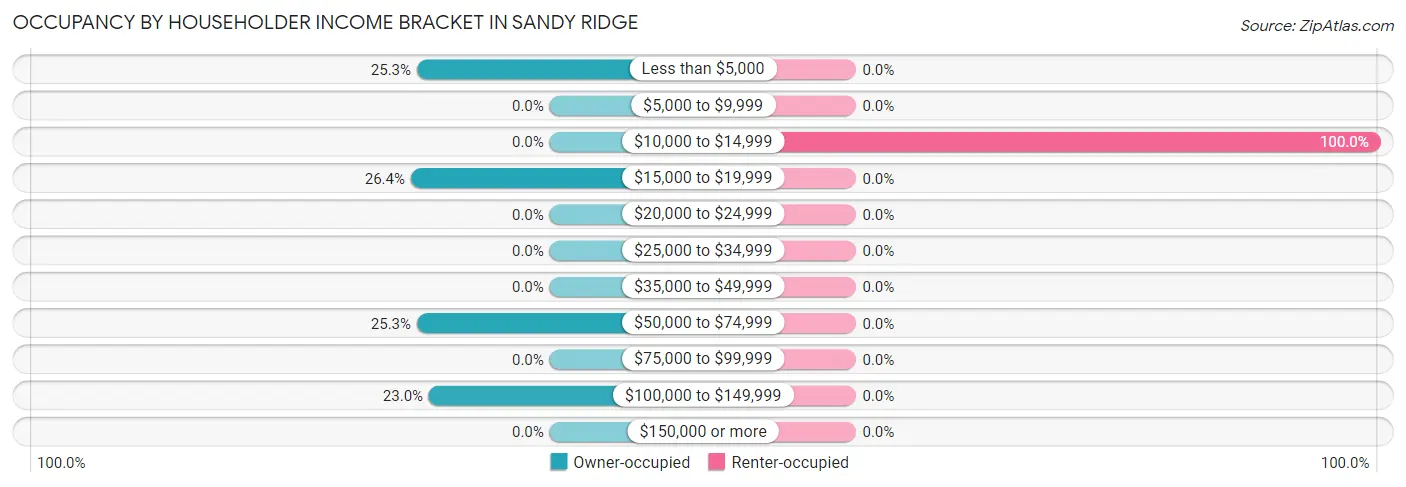
| Income Bracket | Owner-occupied | Renter-occupied |
| Less than $5,000 | 22 (25.3%) | 0 (0.0%) |
| $5,000 to $9,999 | 0 (0.0%) | 0 (0.0%) |
| $10,000 to $14,999 | 0 (0.0%) | 22 (100.0%) |
| $15,000 to $19,999 | 23 (26.4%) | 0 (0.0%) |
| $20,000 to $24,999 | 0 (0.0%) | 0 (0.0%) |
| $25,000 to $34,999 | 0 (0.0%) | 0 (0.0%) |
| $35,000 to $49,999 | 0 (0.0%) | 0 (0.0%) |
| $50,000 to $74,999 | 22 (25.3%) | 0 (0.0%) |
| $75,000 to $99,999 | 0 (0.0%) | 0 (0.0%) |
| $100,000 to $149,999 | 20 (23.0%) | 0 (0.0%) |
| $150,000 or more | 0 (0.0%) | 0 (0.0%) |
| Total | 87 (100.0%) | 22 (100.0%) |
Monthly Housing Cost Tiers in Sandy Ridge
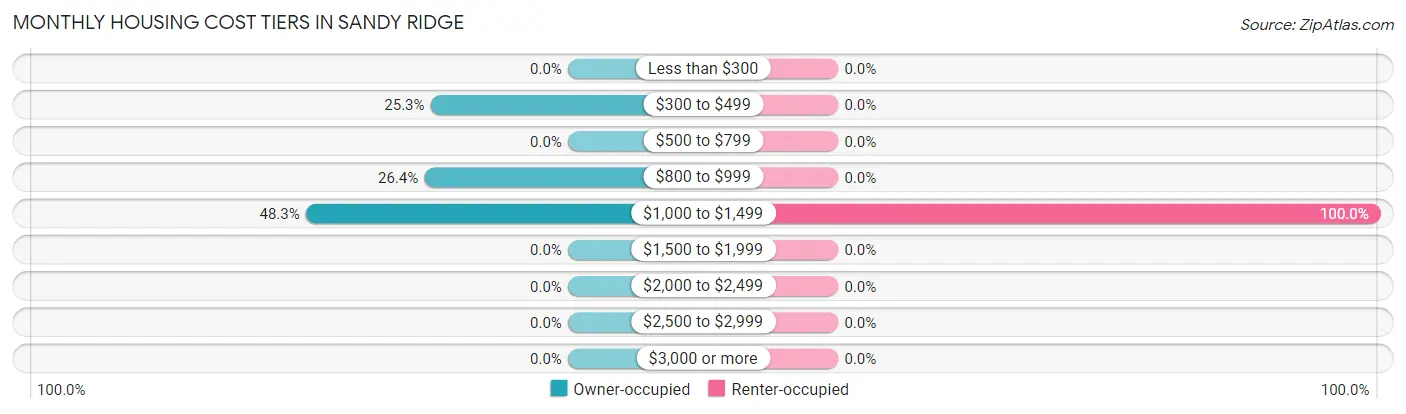
| Monthly Cost | Owner-occupied | Renter-occupied |
| Less than $300 | 0 (0.0%) | 0 (0.0%) |
| $300 to $499 | 22 (25.3%) | 0 (0.0%) |
| $500 to $799 | 0 (0.0%) | 0 (0.0%) |
| $800 to $999 | 23 (26.4%) | 0 (0.0%) |
| $1,000 to $1,499 | 42 (48.3%) | 22 (100.0%) |
| $1,500 to $1,999 | 0 (0.0%) | 0 (0.0%) |
| $2,000 to $2,499 | 0 (0.0%) | 0 (0.0%) |
| $2,500 to $2,999 | 0 (0.0%) | 0 (0.0%) |
| $3,000 or more | 0 (0.0%) | 0 (0.0%) |
| Total | 87 (100.0%) | 22 (100.0%) |
Physical Housing Characteristics in Sandy Ridge
Housing Structures in Sandy Ridge
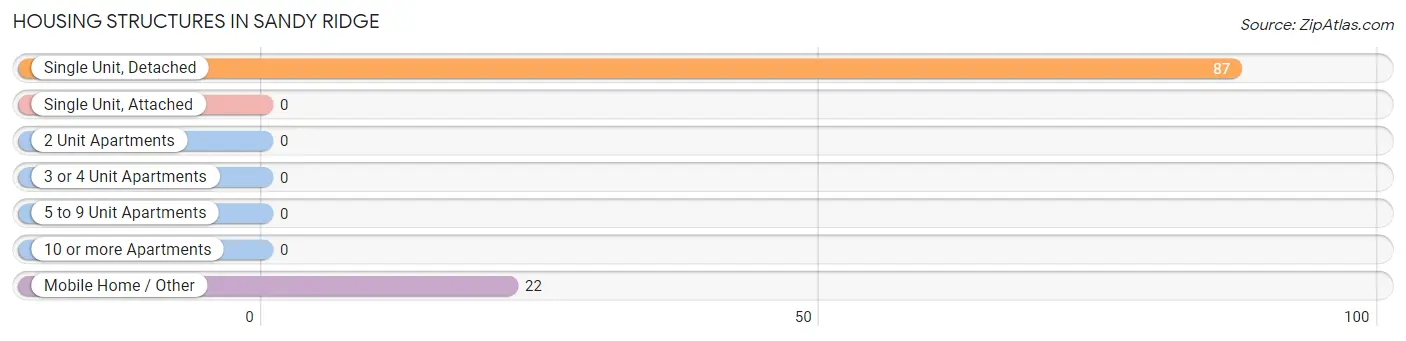
| Structure Type | # Housing Units | % Housing Units |
| Single Unit, Detached | 87 | 79.8% |
| Single Unit, Attached | 0 | 0.0% |
| 2 Unit Apartments | 0 | 0.0% |
| 3 or 4 Unit Apartments | 0 | 0.0% |
| 5 to 9 Unit Apartments | 0 | 0.0% |
| 10 or more Apartments | 0 | 0.0% |
| Mobile Home / Other | 22 | 20.2% |
| Total | 109 | 100.0% |
Housing Structures by Occupancy in Sandy Ridge
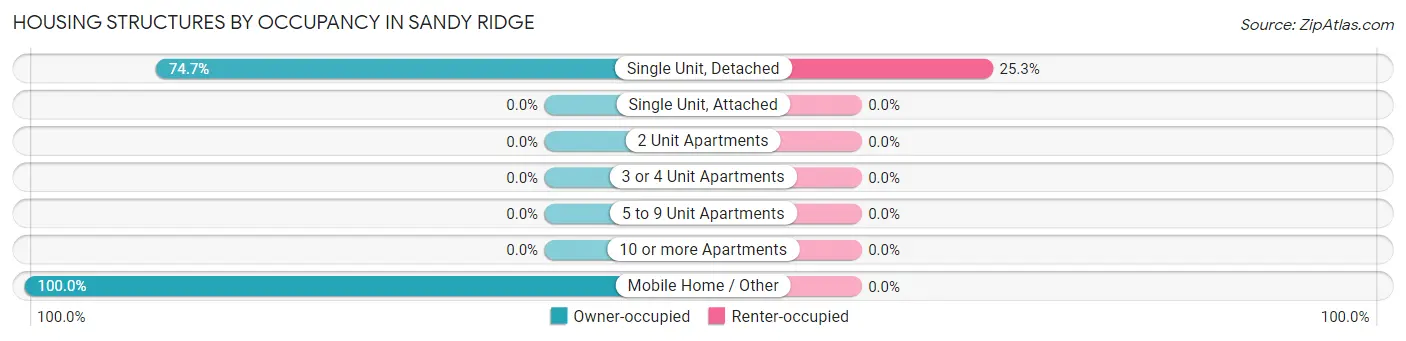
| Structure Type | Owner-occupied | Renter-occupied |
| Single Unit, Detached | 65 (74.7%) | 22 (25.3%) |
| Single Unit, Attached | 0 (0.0%) | 0 (0.0%) |
| 2 Unit Apartments | 0 (0.0%) | 0 (0.0%) |
| 3 or 4 Unit Apartments | 0 (0.0%) | 0 (0.0%) |
| 5 to 9 Unit Apartments | 0 (0.0%) | 0 (0.0%) |
| 10 or more Apartments | 0 (0.0%) | 0 (0.0%) |
| Mobile Home / Other | 22 (100.0%) | 0 (0.0%) |
| Total | 87 (79.8%) | 22 (20.2%) |
Housing Structures by Number of Rooms in Sandy Ridge
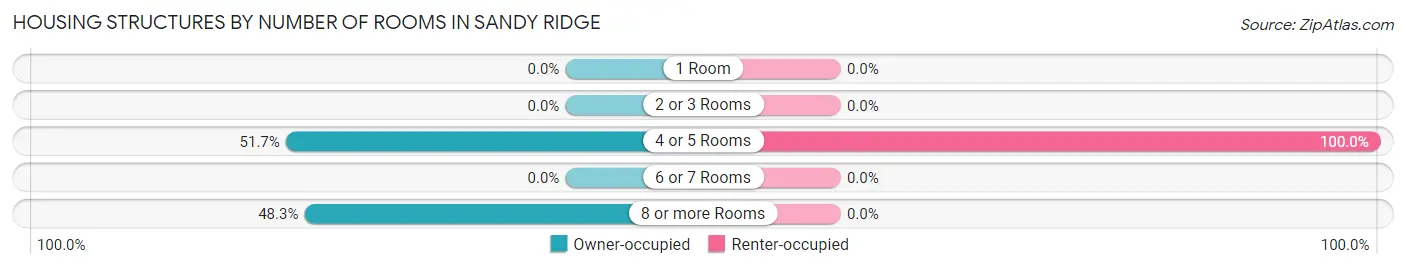
| Number of Rooms | Owner-occupied | Renter-occupied |
| 1 Room | 0 (0.0%) | 0 (0.0%) |
| 2 or 3 Rooms | 0 (0.0%) | 0 (0.0%) |
| 4 or 5 Rooms | 45 (51.7%) | 22 (100.0%) |
| 6 or 7 Rooms | 0 (0.0%) | 0 (0.0%) |
| 8 or more Rooms | 42 (48.3%) | 0 (0.0%) |
| Total | 87 (100.0%) | 22 (100.0%) |
Housing Structure by Heating Type in Sandy Ridge
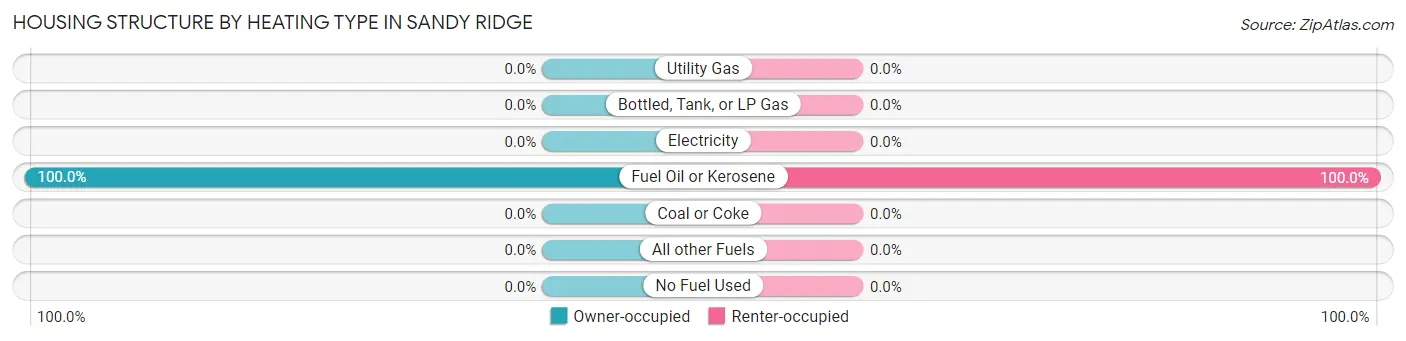
| Heating Type | Owner-occupied | Renter-occupied |
| Utility Gas | 0 (0.0%) | 0 (0.0%) |
| Bottled, Tank, or LP Gas | 0 (0.0%) | 0 (0.0%) |
| Electricity | 0 (0.0%) | 0 (0.0%) |
| Fuel Oil or Kerosene | 87 (100.0%) | 22 (100.0%) |
| Coal or Coke | 0 (0.0%) | 0 (0.0%) |
| All other Fuels | 0 (0.0%) | 0 (0.0%) |
| No Fuel Used | 0 (0.0%) | 0 (0.0%) |
| Total | 87 (100.0%) | 22 (100.0%) |
Household Vehicle Usage in Sandy Ridge
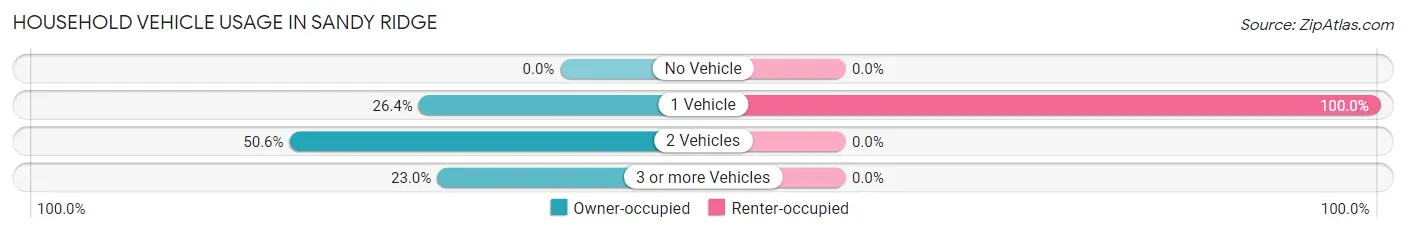
| Vehicles per Household | Owner-occupied | Renter-occupied |
| No Vehicle | 0 (0.0%) | 0 (0.0%) |
| 1 Vehicle | 23 (26.4%) | 22 (100.0%) |
| 2 Vehicles | 44 (50.6%) | 0 (0.0%) |
| 3 or more Vehicles | 20 (23.0%) | 0 (0.0%) |
| Total | 87 (100.0%) | 22 (100.0%) |
Real Estate & Mortgages in Sandy Ridge
Real Estate and Mortgage Overview in Sandy Ridge
| Characteristic | Without Mortgage | With Mortgage |
| Housing Units | 45 | 42 |
| Median Property Value | - | - |
| Median Household Income | - | - |
| Monthly Housing Costs | - | - |
| Real Estate Taxes | - | - |
Property Value by Mortgage Status in Sandy Ridge
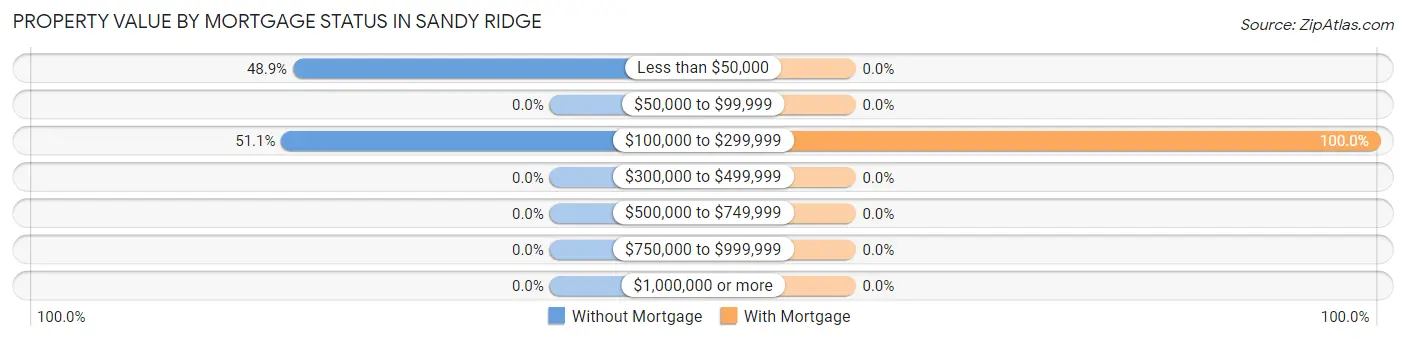
| Property Value | Without Mortgage | With Mortgage |
| Less than $50,000 | 22 (48.9%) | 0 (0.0%) |
| $50,000 to $99,999 | 0 (0.0%) | 0 (0.0%) |
| $100,000 to $299,999 | 23 (51.1%) | 42 (100.0%) |
| $300,000 to $499,999 | 0 (0.0%) | 0 (0.0%) |
| $500,000 to $749,999 | 0 (0.0%) | 0 (0.0%) |
| $750,000 to $999,999 | 0 (0.0%) | 0 (0.0%) |
| $1,000,000 or more | 0 (0.0%) | 0 (0.0%) |
| Total | 45 (100.0%) | 42 (100.0%) |
Household Income by Mortgage Status in Sandy Ridge
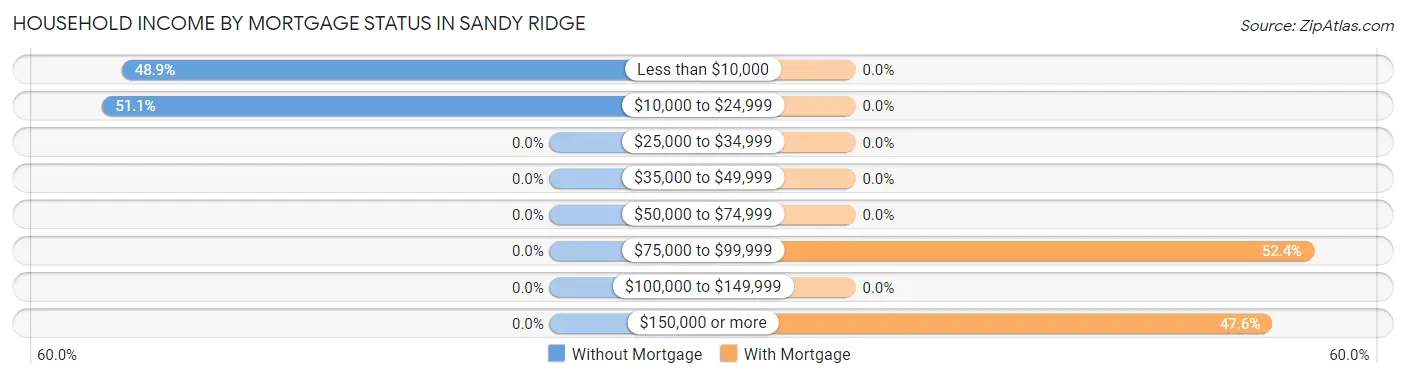
| Household Income | Without Mortgage | With Mortgage |
| Less than $10,000 | 22 (48.9%) | 0 (0.0%) |
| $10,000 to $24,999 | 23 (51.1%) | 0 (0.0%) |
| $25,000 to $34,999 | 0 (0.0%) | 0 (0.0%) |
| $35,000 to $49,999 | 0 (0.0%) | 0 (0.0%) |
| $50,000 to $74,999 | 0 (0.0%) | 0 (0.0%) |
| $75,000 to $99,999 | 0 (0.0%) | 22 (52.4%) |
| $100,000 to $149,999 | 0 (0.0%) | 0 (0.0%) |
| $150,000 or more | 0 (0.0%) | 20 (47.6%) |
| Total | 45 (100.0%) | 42 (100.0%) |
Property Value to Household Income Ratio in Sandy Ridge
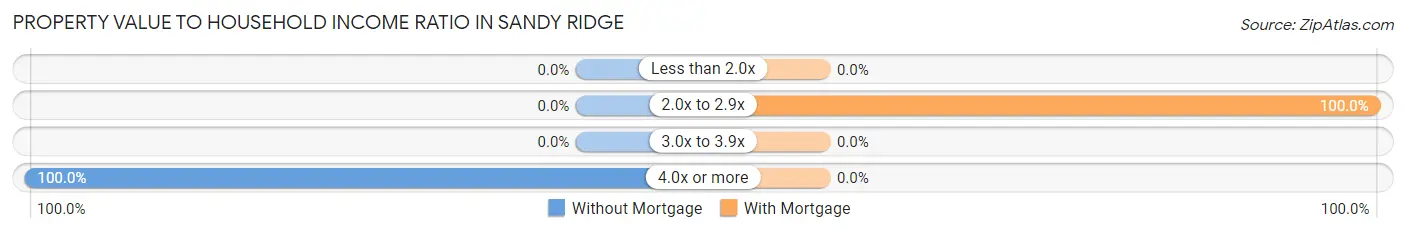
| Value-to-Income Ratio | Without Mortgage | With Mortgage |
| Less than 2.0x | 0 (0.0%) | 0 (0.0%) |
| 2.0x to 2.9x | 0 (0.0%) | 42 (100.0%) |
| 3.0x to 3.9x | 0 (0.0%) | 0 (0.0%) |
| 4.0x or more | 45 (100.0%) | 0 (0.0%) |
| Total | 45 (100.0%) | 42 (100.0%) |
Real Estate Taxes by Mortgage Status in Sandy Ridge
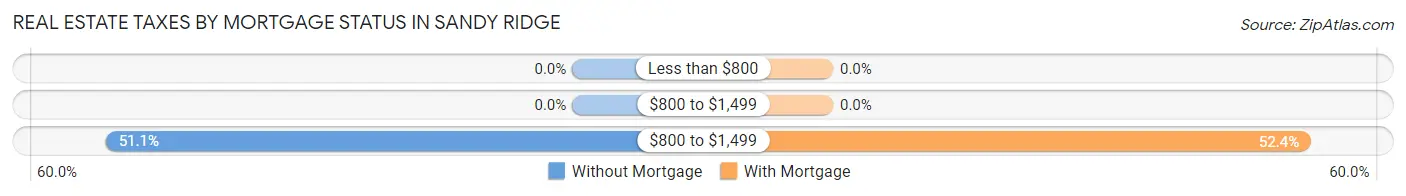
| Property Taxes | Without Mortgage | With Mortgage |
| Less than $800 | 0 (0.0%) | 0 (0.0%) |
| $800 to $1,499 | 0 (0.0%) | 0 (0.0%) |
| $800 to $1,499 | 23 (51.1%) | 22 (52.4%) |
| Total | 45 (100.0%) | 42 (100.0%) |
Health & Disability in Sandy Ridge
Health Insurance Coverage by Age in Sandy Ridge
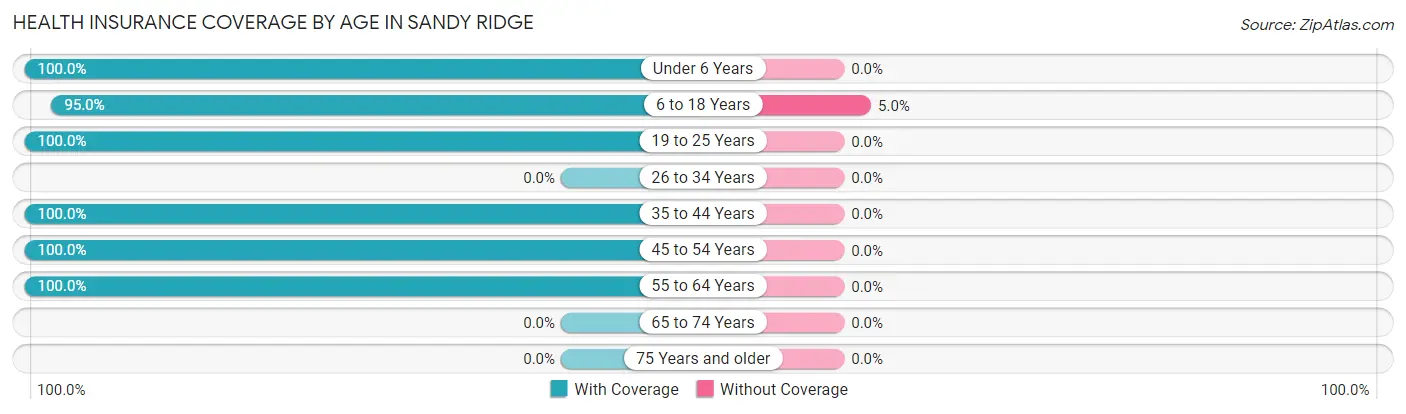
| Age Bracket | With Coverage | Without Coverage |
| Under 6 Years | 16 (100.0%) | 0 (0.0%) |
| 6 to 18 Years | 19 (95.0%) | 1 (5.0%) |
| 19 to 25 Years | 50 (100.0%) | 0 (0.0%) |
| 26 to 34 Years | 0 (0.0%) | 0 (0.0%) |
| 35 to 44 Years | 42 (100.0%) | 0 (0.0%) |
| 45 to 54 Years | 43 (100.0%) | 0 (0.0%) |
| 55 to 64 Years | 87 (100.0%) | 0 (0.0%) |
| 65 to 74 Years | 0 (0.0%) | 0 (0.0%) |
| 75 Years and older | 0 (0.0%) | 0 (0.0%) |
| Total | 257 (99.6%) | 1 (0.4%) |
Health Insurance Coverage by Citizenship Status in Sandy Ridge
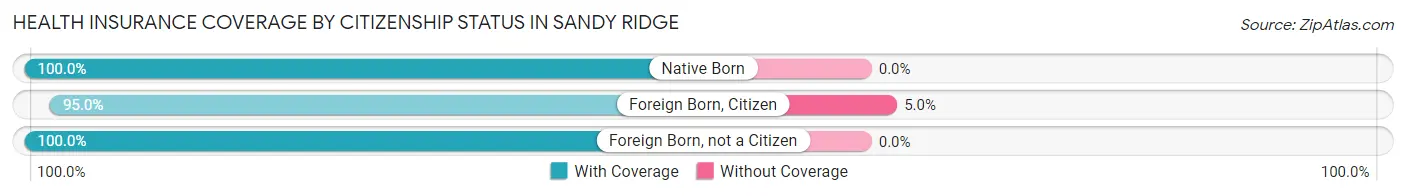
| Citizenship Status | With Coverage | Without Coverage |
| Native Born | 16 (100.0%) | 0 (0.0%) |
| Foreign Born, Citizen | 19 (95.0%) | 1 (5.0%) |
| Foreign Born, not a Citizen | 50 (100.0%) | 0 (0.0%) |
Health Insurance Coverage by Household Income in Sandy Ridge

| Household Income | With Coverage | Without Coverage |
| Under $25,000 | 88 (98.9%) | 1 (1.1%) |
| $25,000 to $49,999 | 0 (0.0%) | 0 (0.0%) |
| $50,000 to $74,999 | 77 (100.0%) | 0 (0.0%) |
| $75,000 to $99,999 | 0 (0.0%) | 0 (0.0%) |
| $100,000 and over | 92 (100.0%) | 0 (0.0%) |
Public vs Private Health Insurance Coverage by Age in Sandy Ridge
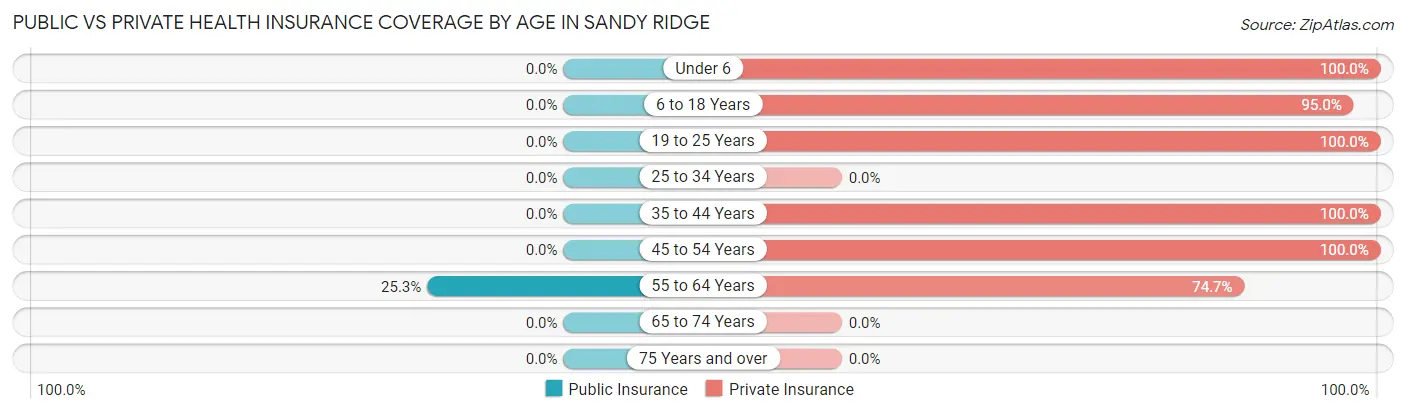
| Age Bracket | Public Insurance | Private Insurance |
| Under 6 | 0 (0.0%) | 16 (100.0%) |
| 6 to 18 Years | 0 (0.0%) | 19 (95.0%) |
| 19 to 25 Years | 0 (0.0%) | 50 (100.0%) |
| 25 to 34 Years | 0 (0.0%) | 0 (0.0%) |
| 35 to 44 Years | 0 (0.0%) | 42 (100.0%) |
| 45 to 54 Years | 0 (0.0%) | 43 (100.0%) |
| 55 to 64 Years | 22 (25.3%) | 65 (74.7%) |
| 65 to 74 Years | 0 (0.0%) | 0 (0.0%) |
| 75 Years and over | 0 (0.0%) | 0 (0.0%) |
| Total | 22 (8.5%) | 235 (91.1%) |
Disability Status by Sex by Age in Sandy Ridge
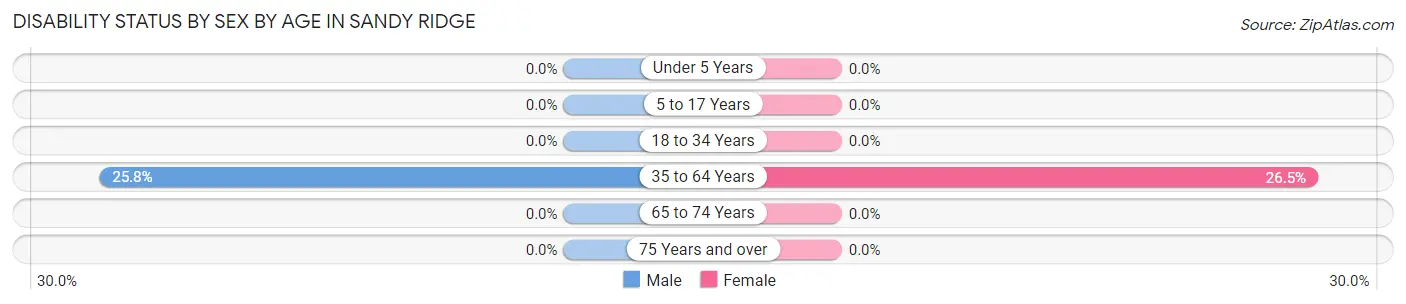
| Age Bracket | Male | Female |
| Under 5 Years | 0 (0.0%) | 0 (0.0%) |
| 5 to 17 Years | 0 (0.0%) | 0 (0.0%) |
| 18 to 34 Years | 0 (0.0%) | 0 (0.0%) |
| 35 to 64 Years | 23 (25.8%) | 22 (26.5%) |
| 65 to 74 Years | 0 (0.0%) | 0 (0.0%) |
| 75 Years and over | 0 (0.0%) | 0 (0.0%) |
Disability Class by Sex by Age in Sandy Ridge
Disability Class: Hearing Difficulty
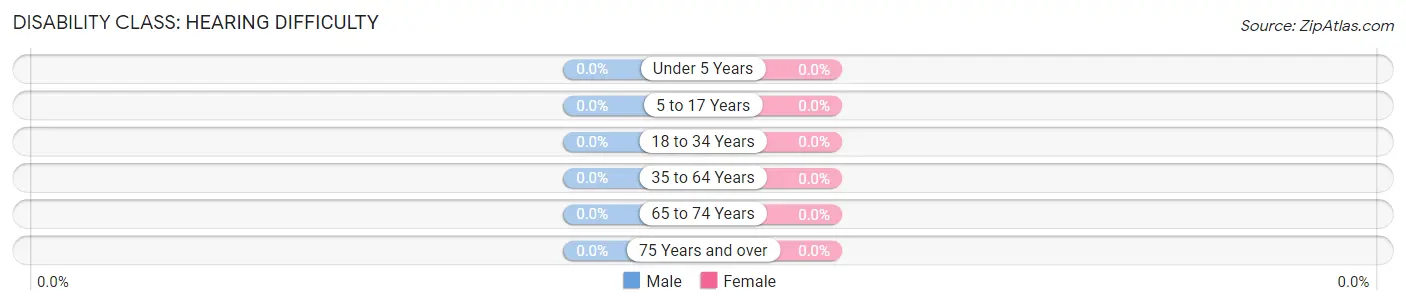
| Age Bracket | Male | Female |
| Under 5 Years | 0 (0.0%) | 0 (0.0%) |
| 5 to 17 Years | 0 (0.0%) | 0 (0.0%) |
| 18 to 34 Years | 0 (0.0%) | 0 (0.0%) |
| 35 to 64 Years | 0 (0.0%) | 0 (0.0%) |
| 65 to 74 Years | 0 (0.0%) | 0 (0.0%) |
| 75 Years and over | 0 (0.0%) | 0 (0.0%) |
Disability Class: Vision Difficulty
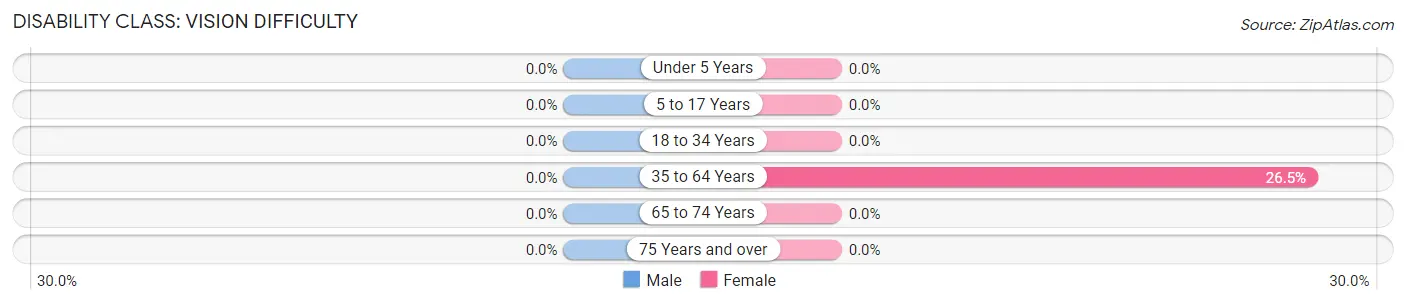
| Age Bracket | Male | Female |
| Under 5 Years | 0 (0.0%) | 0 (0.0%) |
| 5 to 17 Years | 0 (0.0%) | 0 (0.0%) |
| 18 to 34 Years | 0 (0.0%) | 0 (0.0%) |
| 35 to 64 Years | 0 (0.0%) | 22 (26.5%) |
| 65 to 74 Years | 0 (0.0%) | 0 (0.0%) |
| 75 Years and over | 0 (0.0%) | 0 (0.0%) |
Disability Class: Cognitive Difficulty
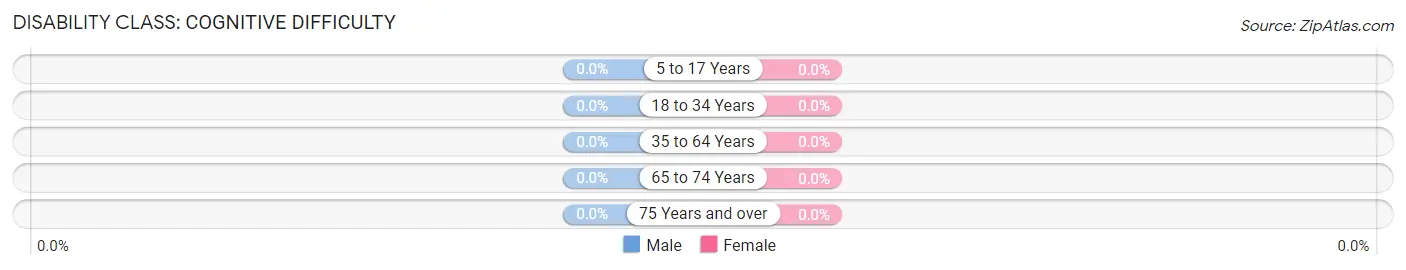
| Age Bracket | Male | Female |
| 5 to 17 Years | 0 (0.0%) | 0 (0.0%) |
| 18 to 34 Years | 0 (0.0%) | 0 (0.0%) |
| 35 to 64 Years | 0 (0.0%) | 0 (0.0%) |
| 65 to 74 Years | 0 (0.0%) | 0 (0.0%) |
| 75 Years and over | 0 (0.0%) | 0 (0.0%) |
Disability Class: Ambulatory Difficulty
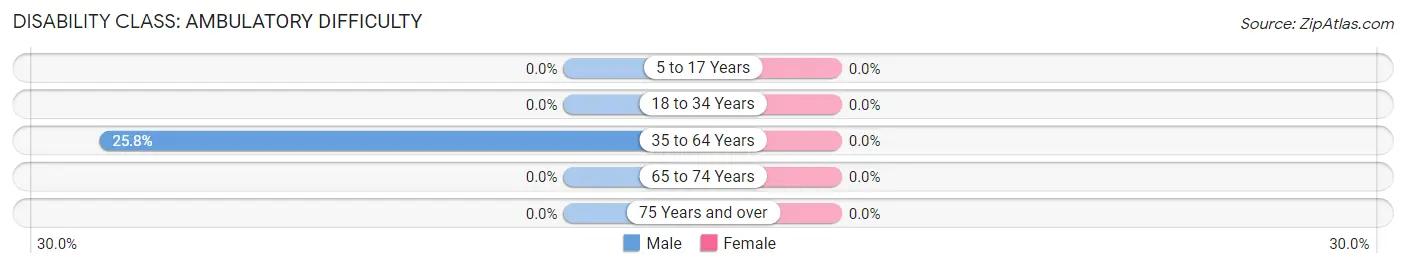
| Age Bracket | Male | Female |
| 5 to 17 Years | 0 (0.0%) | 0 (0.0%) |
| 18 to 34 Years | 0 (0.0%) | 0 (0.0%) |
| 35 to 64 Years | 23 (25.8%) | 0 (0.0%) |
| 65 to 74 Years | 0 (0.0%) | 0 (0.0%) |
| 75 Years and over | 0 (0.0%) | 0 (0.0%) |
Disability Class: Self-Care Difficulty
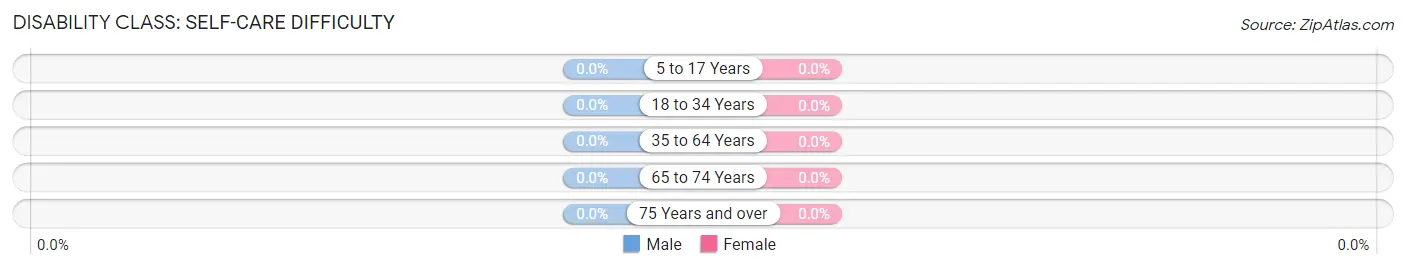
| Age Bracket | Male | Female |
| 5 to 17 Years | 0 (0.0%) | 0 (0.0%) |
| 18 to 34 Years | 0 (0.0%) | 0 (0.0%) |
| 35 to 64 Years | 0 (0.0%) | 0 (0.0%) |
| 65 to 74 Years | 0 (0.0%) | 0 (0.0%) |
| 75 Years and over | 0 (0.0%) | 0 (0.0%) |
Technology Access in Sandy Ridge
Computing Device Access in Sandy Ridge
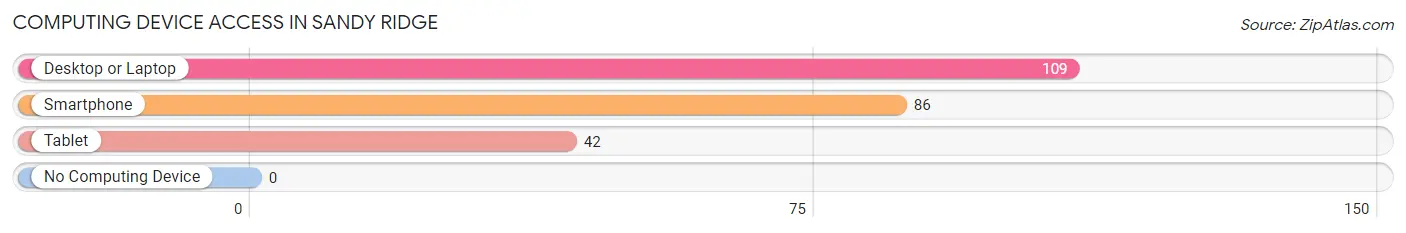
| Device Type | # Households | % Households |
| Desktop or Laptop | 109 | 100.0% |
| Smartphone | 86 | 78.9% |
| Tablet | 42 | 38.5% |
| No Computing Device | 0 | 0.0% |
| Total | 109 | 100.0% |
Internet Access in Sandy Ridge
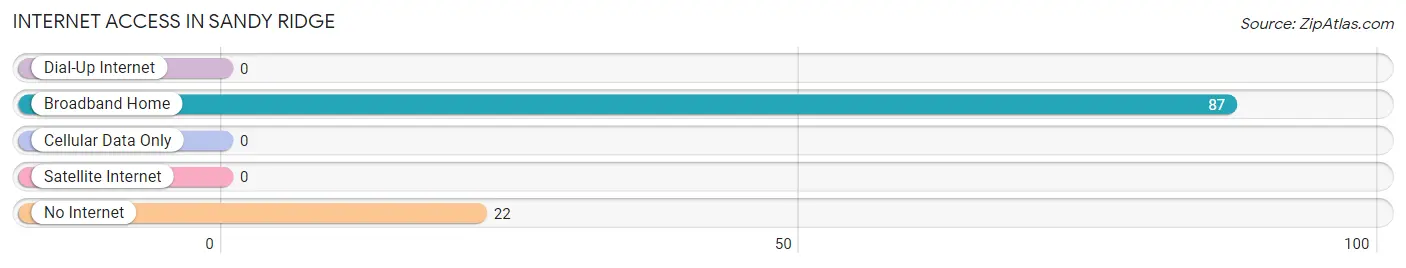
| Internet Type | # Households | % Households |
| Dial-Up Internet | 0 | 0.0% |
| Broadband Home | 87 | 79.8% |
| Cellular Data Only | 0 | 0.0% |
| Satellite Internet | 0 | 0.0% |
| No Internet | 22 | 20.2% |
| Total | 109 | 100.0% |
Sandy Ridge Summary
Sandy Ridge is a small borough located in Centre County, Pennsylvania. It is situated in the Nittany Valley, a region of the Appalachian Mountains. The population of Sandy Ridge was 545 at the 2010 census.
History
Sandy Ridge was first settled in the late 1700s by German immigrants. The town was originally known as “Sandy Ridge” due to its location on a ridge of sandstone. The town was officially incorporated in 1876.
In the late 1800s, Sandy Ridge was a thriving agricultural community. The town was home to several mills, including a grist mill, a saw mill, and a woolen mill. The town also had a blacksmith shop, a general store, and a post office.
In the early 1900s, Sandy Ridge began to decline as the local economy shifted away from agriculture. The mills closed and the population began to decline. By the 1950s, the population had dropped to just over 200 people.
Geography
Sandy Ridge is located in Centre County, Pennsylvania. It is situated in the Nittany Valley, a region of the Appalachian Mountains. The borough is bordered by Potter Township to the north, Spring Township to the east, and Halfmoon Township to the south and west.
The terrain of Sandy Ridge is mostly hilly, with some flat areas. The highest point in the borough is 1,890 feet above sea level. The borough is located in the Nittany Valley, which is known for its fertile soil and abundant wildlife.
Economy
Sandy Ridge’s economy is largely based on agriculture. The borough is home to several farms, which produce a variety of crops, including corn, soybeans, hay, and wheat. The borough also has several small businesses, including a general store, a gas station, and a restaurant.
Demographics
As of the 2010 census, the population of Sandy Ridge was 545. The racial makeup of the borough was 97.3% White, 0.7% African American, 0.2% Native American, 0.2% Asian, and 1.6% from two or more races. The median household income was $45,833.
Conclusion
Sandy Ridge is a small borough located in Centre County, Pennsylvania. It is situated in the Nittany Valley, a region of the Appalachian Mountains. The population of Sandy Ridge was 545 at the 2010 census. The borough’s economy is largely based on agriculture, and the median household income was $45,833. Sandy Ridge is a quiet, rural community with a rich history and a bright future.
Common Questions
What is Per Capita Income in Sandy Ridge?
Per Capita income in Sandy Ridge is $17,604.
What is Inequality or Gini Index in Sandy Ridge?
Inequality or Gini Index in Sandy Ridge is 0.53.
What is the Total Population of Sandy Ridge?
Total Population of Sandy Ridge is 258.
What is the Total Male Population of Sandy Ridge?
Total Male Population of Sandy Ridge is 130.
What is the Total Female Population of Sandy Ridge?
Total Female Population of Sandy Ridge is 128.
What is the Ratio of Males per 100 Females in Sandy Ridge?
There are 101.56 Males per 100 Females in Sandy Ridge.
What is the Ratio of Females per 100 Males in Sandy Ridge?
There are 98.46 Females per 100 Males in Sandy Ridge.
What is the Median Population Age in Sandy Ridge?
Median Population Age in Sandy Ridge is 53.1 Years.
What is the Average Family Size in Sandy Ridge
Average Family Size in Sandy Ridge is 2.7 People.
What is the Average Household Size in Sandy Ridge
Average Household Size in Sandy Ridge is 2.4 People.
How Large is the Labor Force in Sandy Ridge?
There are 106 People in the Labor Forcein in Sandy Ridge.
What is the Percentage of People in the Labor Force in Sandy Ridge?
47.5% of People are in the Labor Force in Sandy Ridge.