Fairfield borough, PA Map & Demographics
Fairfield borough Overview
$29,324
PER CAPITA INCOME
$67,679
AVG FAMILY INCOME
$61,071
AVG HOUSEHOLD INCOME
36.4%
WAGE / INCOME GAP [ % ]
63.6¢/ $1
WAGE / INCOME GAP [ $ ]
0.41
INEQUALITY / GINI INDEX
683
TOTAL POPULATION
352
MALE POPULATION
331
FEMALE POPULATION
106.34
MALES / 100 FEMALES
94.03
FEMALES / 100 MALES
45.6
MEDIAN AGE
3.4
AVG FAMILY SIZE
2.6
AVG HOUSEHOLD SIZE
280
LABOR FORCE [ PEOPLE ]
49.0%
PERCENT IN LABOR FORCE
3.9%
UNEMPLOYMENT RATE
Income in Fairfield borough
Income Overview in Fairfield borough
Per Capita Income in Fairfield borough is $29,324, while median incomes of families and households are $67,679 and $61,071 respectively.
| Characteristic | Number | Measure |
| Per Capita Income | 683 | $29,324 |
| Median Family Income | 174 | $67,679 |
| Mean Family Income | 174 | $80,875 |
| Median Household Income | 266 | $61,071 |
| Mean Household Income | 266 | $73,325 |
| Income Deficit | 174 | $0 |
| Wage / Income Gap (%) | 683 | 36.39% |
| Wage / Income Gap ($) | 683 | 63.61¢ per $1 |
| Gini / Inequality Index | 683 | 0.41 |
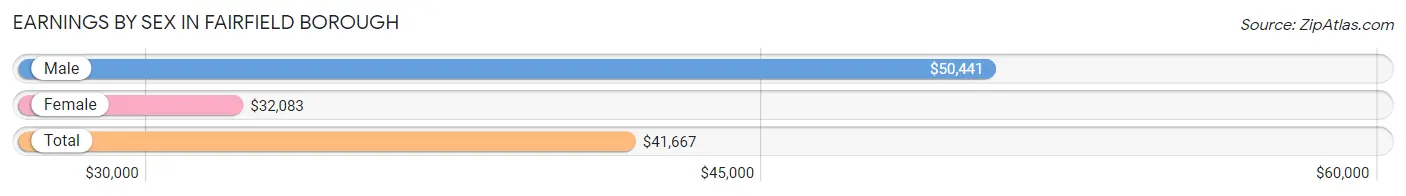
Earnings by Sex in Fairfield borough
Average Earnings in Fairfield borough are $41,667, $50,441 for men and $32,083 for women, a difference of 36.4%.
| Sex | Number | Average Earnings |
| Male | 162 (55.1%) | $50,441 |
| Female | 132 (44.9%) | $32,083 |
| Total | 294 (100.0%) | $41,667 |
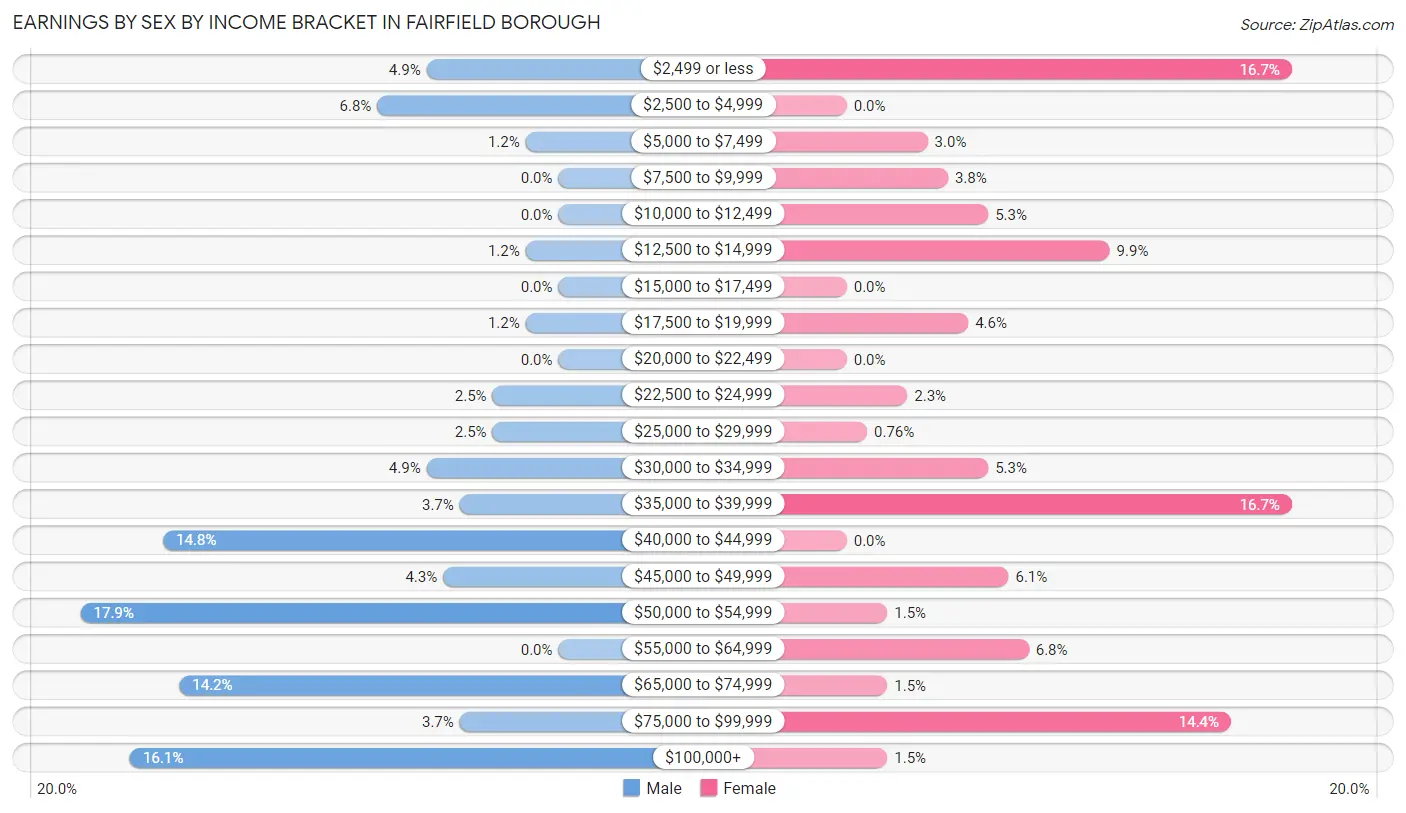
Earnings by Sex by Income Bracket in Fairfield borough
The most common earnings brackets in Fairfield borough are $50,000 to $54,999 for men (29 | 17.9%) and $2,499 or less for women (22 | 16.7%).
| Income | Male | Female |
| $2,499 or less | 8 (4.9%) | 22 (16.7%) |
| $2,500 to $4,999 | 11 (6.8%) | 0 (0.0%) |
| $5,000 to $7,499 | 2 (1.2%) | 4 (3.0%) |
| $7,500 to $9,999 | 0 (0.0%) | 5 (3.8%) |
| $10,000 to $12,499 | 0 (0.0%) | 7 (5.3%) |
| $12,500 to $14,999 | 2 (1.2%) | 13 (9.9%) |
| $15,000 to $17,499 | 0 (0.0%) | 0 (0.0%) |
| $17,500 to $19,999 | 2 (1.2%) | 6 (4.5%) |
| $20,000 to $22,499 | 0 (0.0%) | 0 (0.0%) |
| $22,500 to $24,999 | 4 (2.5%) | 3 (2.3%) |
| $25,000 to $29,999 | 4 (2.5%) | 1 (0.8%) |
| $30,000 to $34,999 | 8 (4.9%) | 7 (5.3%) |
| $35,000 to $39,999 | 6 (3.7%) | 22 (16.7%) |
| $40,000 to $44,999 | 24 (14.8%) | 0 (0.0%) |
| $45,000 to $49,999 | 7 (4.3%) | 8 (6.1%) |
| $50,000 to $54,999 | 29 (17.9%) | 2 (1.5%) |
| $55,000 to $64,999 | 0 (0.0%) | 9 (6.8%) |
| $65,000 to $74,999 | 23 (14.2%) | 2 (1.5%) |
| $75,000 to $99,999 | 6 (3.7%) | 19 (14.4%) |
| $100,000+ | 26 (16.1%) | 2 (1.5%) |
| Total | 162 (100.0%) | 132 (100.0%) |
Earnings by Sex by Educational Attainment in Fairfield borough
Average earnings in Fairfield borough are $51,667 for men and $35,500 for women, a difference of 31.3%. Men with an educational attainment of graduate degree enjoy the highest average annual earnings of $138,438, while those with college or associate's degree education earn the least with $40,667. Women with an educational attainment of graduate degree earn the most with the average annual earnings of $73,750, while those with high school diploma education have the smallest earnings of $36,875.

| Educational Attainment | Male Income | Female Income |
| Less than High School | - | - |
| High School Diploma | $53,125 | $36,875 |
| College or Associate's Degree | $40,667 | $0 |
| Bachelor's Degree | $70,750 | $0 |
| Graduate Degree | $138,438 | $73,750 |
| Total | $51,667 | $35,500 |
Family Income in Fairfield borough
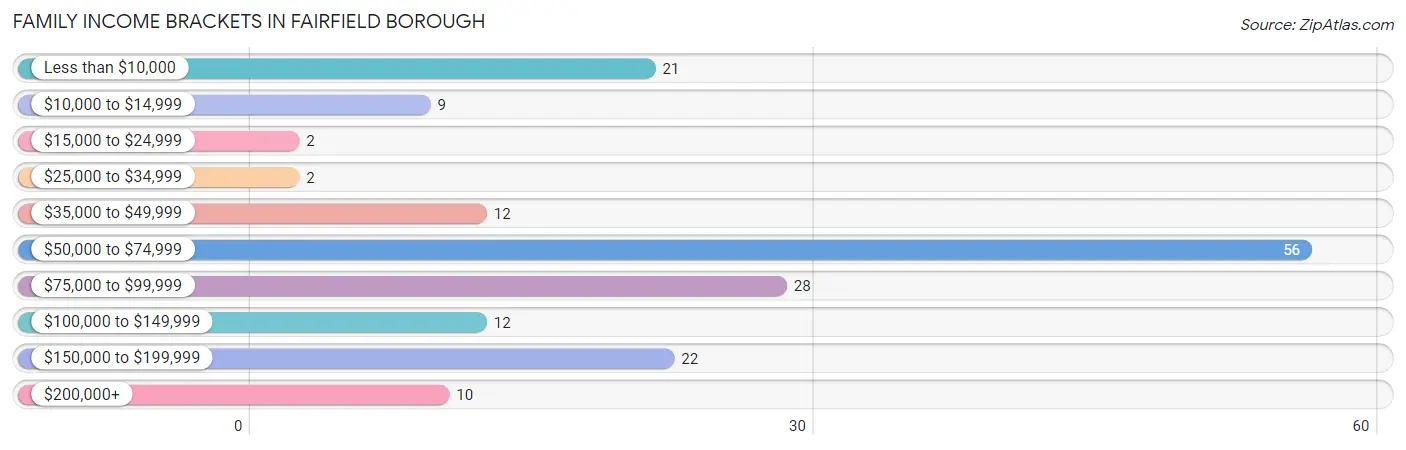
Family Income Brackets in Fairfield borough
According to the Fairfield borough family income data, there are 56 families falling into the $50,000 to $74,999 income range, which is the most common income bracket and makes up 32.2% of all families. Conversely, the $15,000 to $24,999 income bracket is the least frequent group with only 2 families (1.1%) belonging to this category.
| Income Bracket | # Families | % Families |
| Less than $10,000 | 21 | 12.1% |
| $10,000 to $14,999 | 9 | 5.2% |
| $15,000 to $24,999 | 2 | 1.1% |
| $25,000 to $34,999 | 2 | 1.1% |
| $35,000 to $49,999 | 12 | 6.9% |
| $50,000 to $74,999 | 56 | 32.2% |
| $75,000 to $99,999 | 28 | 16.1% |
| $100,000 to $149,999 | 12 | 6.9% |
| $150,000 to $199,999 | 22 | 12.6% |
| $200,000+ | 10 | 5.7% |
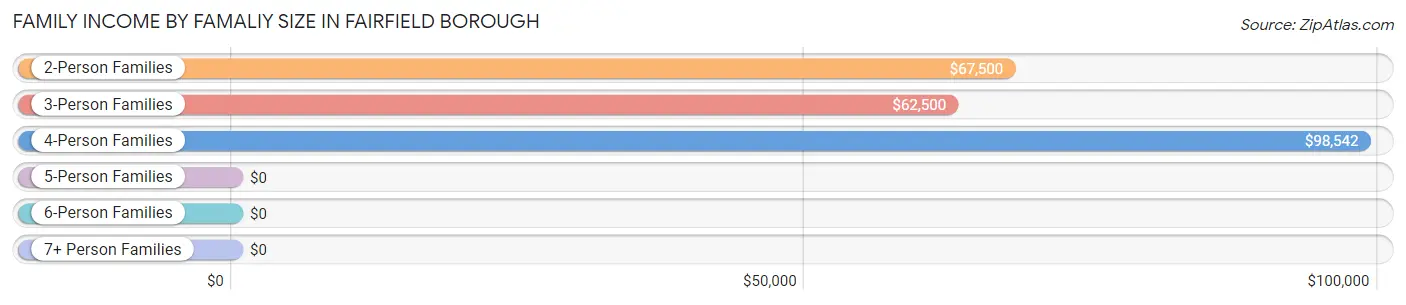
Family Income by Famaliy Size in Fairfield borough
4-person families (17 | 9.8%) account for the highest median family income in Fairfield borough with $98,542 per family, while 2-person families (84 | 48.3%) have the highest median income of $33,750 per family member.
| Income Bracket | # Families | Median Income |
| 2-Person Families | 84 (48.3%) | $67,500 |
| 3-Person Families | 34 (19.5%) | $62,500 |
| 4-Person Families | 17 (9.8%) | $98,542 |
| 5-Person Families | 29 (16.7%) | $0 |
| 6-Person Families | 10 (5.8%) | $0 |
| 7+ Person Families | 0 (0.0%) | $0 |
| Total | 174 (100.0%) | $67,679 |
Family Income by Number of Earners in Fairfield borough
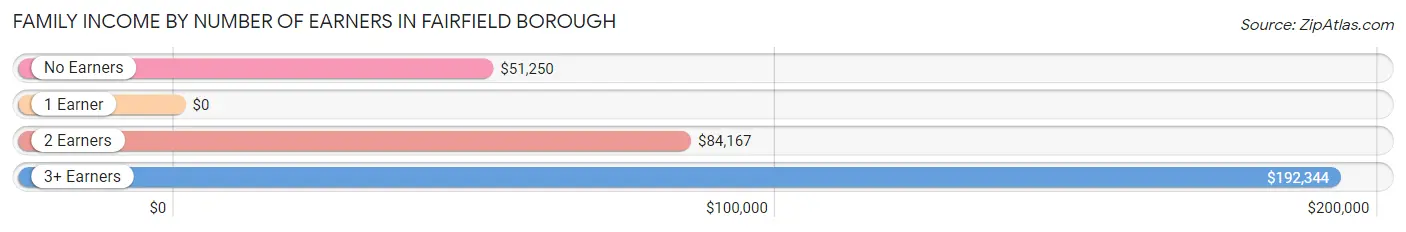
| Number of Earners | # Families | Median Income |
| No Earners | 40 (23.0%) | $51,250 |
| 1 Earner | 59 (33.9%) | $0 |
| 2 Earners | 54 (31.0%) | $84,167 |
| 3+ Earners | 21 (12.1%) | $192,344 |
| Total | 174 (100.0%) | $67,679 |
Household Income in Fairfield borough
Household Income Brackets in Fairfield borough
With 74 households falling in the category, the $50,000 to $74,999 income range is the most frequent in Fairfield borough, accounting for 27.8% of all households. In contrast, only 11 households (4.1%) fall into the $10,000 to $14,999 income bracket, making it the least populous group.
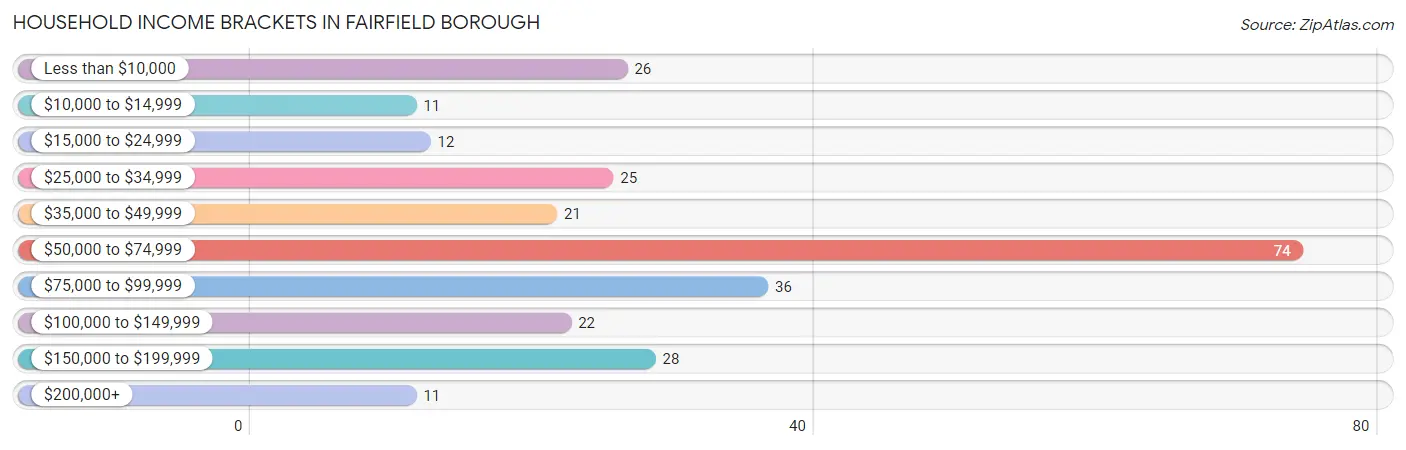
| Income Bracket | # Households | % Households |
| Less than $10,000 | 26 | 9.8% |
| $10,000 to $14,999 | 11 | 4.1% |
| $15,000 to $24,999 | 12 | 4.5% |
| $25,000 to $34,999 | 25 | 9.4% |
| $35,000 to $49,999 | 21 | 7.9% |
| $50,000 to $74,999 | 74 | 27.8% |
| $75,000 to $99,999 | 36 | 13.5% |
| $100,000 to $149,999 | 22 | 8.3% |
| $150,000 to $199,999 | 28 | 10.5% |
| $200,000+ | 11 | 4.1% |
Household Income by Householder Age in Fairfield borough
The median household income in Fairfield borough is $61,071, with the highest median household income of $113,125 found in the 45 to 64 years age bracket for the primary householder. A total of 89 households (33.5%) fall into this category.
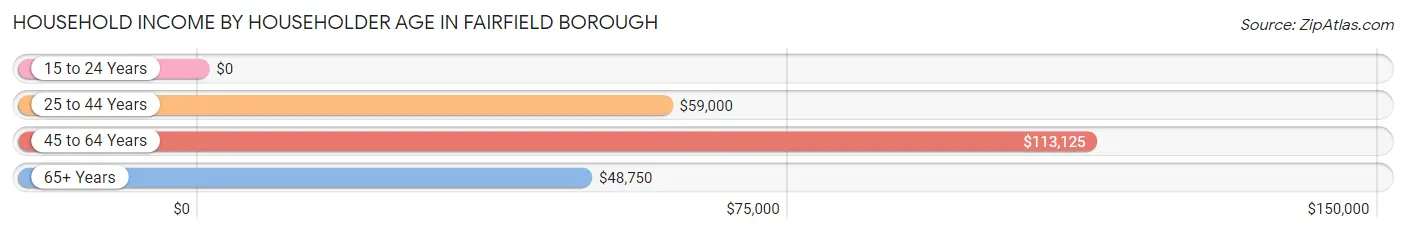
| Income Bracket | # Households | Median Income |
| 15 to 24 Years | 0 (0.0%) | $0 |
| 25 to 44 Years | 60 (22.6%) | $59,000 |
| 45 to 64 Years | 89 (33.5%) | $113,125 |
| 65+ Years | 117 (44.0%) | $48,750 |
| Total | 266 (100.0%) | $61,071 |
Poverty in Fairfield borough
Income Below Poverty by Sex and Age in Fairfield borough
With 23.9% poverty level for males and 20.8% for females among the residents of Fairfield borough, 15 year old males and 12 to 14 year old females are the most vulnerable to poverty, with 19 males (90.5%) and 27 females (71.1%) in their respective age groups living below the poverty level.
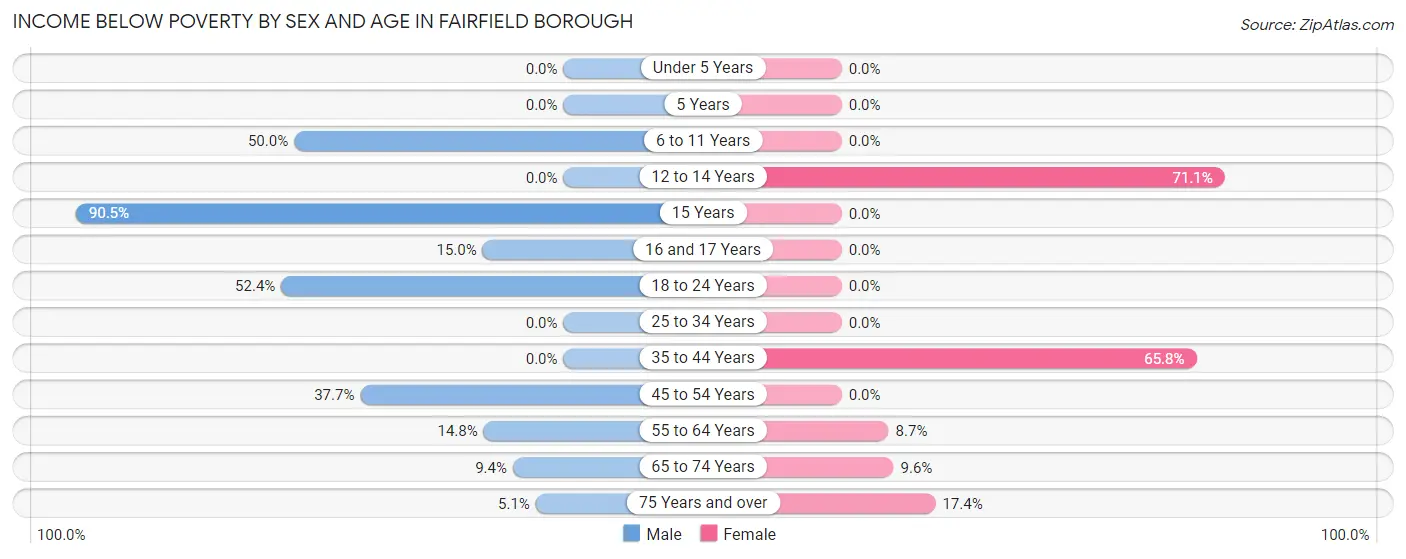
| Age Bracket | Male | Female |
| Under 5 Years | 0 (0.0%) | 0 (0.0%) |
| 5 Years | 0 (0.0%) | 0 (0.0%) |
| 6 to 11 Years | 5 (50.0%) | 0 (0.0%) |
| 12 to 14 Years | 0 (0.0%) | 27 (71.1%) |
| 15 Years | 19 (90.5%) | 0 (0.0%) |
| 16 and 17 Years | 6 (15.0%) | 0 (0.0%) |
| 18 to 24 Years | 22 (52.4%) | 0 (0.0%) |
| 25 to 34 Years | 0 (0.0%) | 0 (0.0%) |
| 35 to 44 Years | 0 (0.0%) | 25 (65.8%) |
| 45 to 54 Years | 23 (37.7%) | 0 (0.0%) |
| 55 to 64 Years | 4 (14.8%) | 4 (8.7%) |
| 65 to 74 Years | 3 (9.4%) | 5 (9.6%) |
| 75 Years and over | 2 (5.1%) | 8 (17.4%) |
| Total | 84 (23.9%) | 69 (20.8%) |
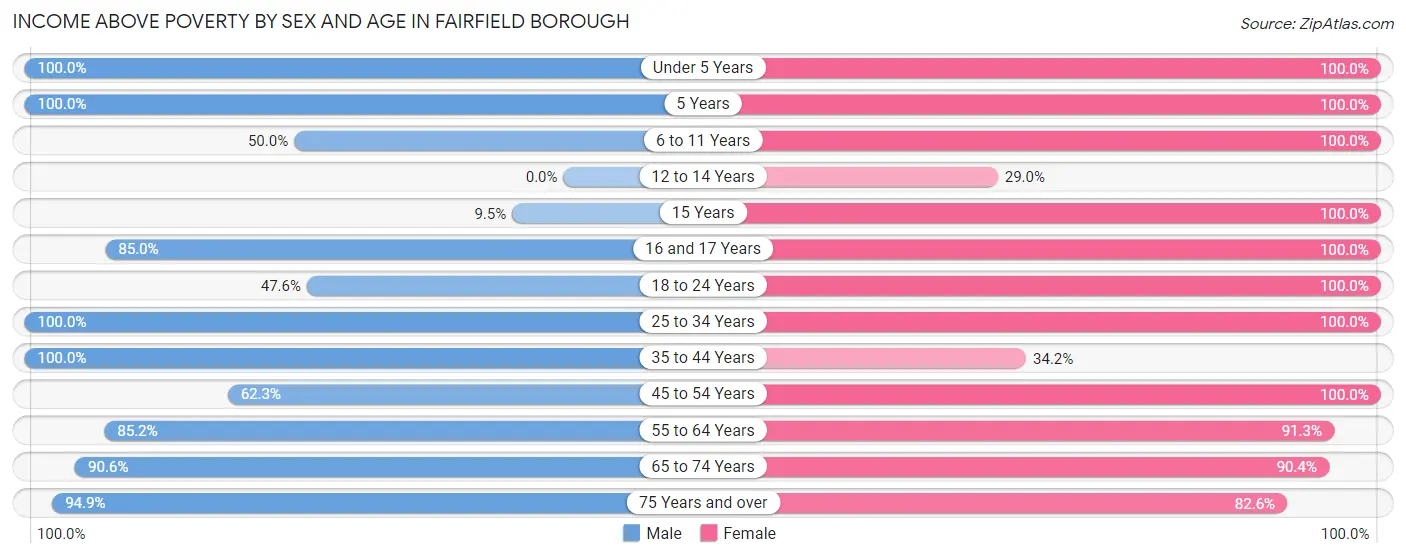
Income Above Poverty by Sex and Age in Fairfield borough
According to the poverty statistics in Fairfield borough, males aged under 5 years and females aged under 5 years are the age groups that are most secure financially, with 100.0% of males and 100.0% of females in these age groups living above the poverty line.
| Age Bracket | Male | Female |
| Under 5 Years | 15 (100.0%) | 8 (100.0%) |
| 5 Years | 2 (100.0%) | 2 (100.0%) |
| 6 to 11 Years | 5 (50.0%) | 15 (100.0%) |
| 12 to 14 Years | 0 (0.0%) | 11 (28.9%) |
| 15 Years | 2 (9.5%) | 1 (100.0%) |
| 16 and 17 Years | 34 (85.0%) | 19 (100.0%) |
| 18 to 24 Years | 20 (47.6%) | 17 (100.0%) |
| 25 to 34 Years | 32 (100.0%) | 7 (100.0%) |
| 35 to 44 Years | 31 (100.0%) | 13 (34.2%) |
| 45 to 54 Years | 38 (62.3%) | 42 (100.0%) |
| 55 to 64 Years | 23 (85.2%) | 42 (91.3%) |
| 65 to 74 Years | 29 (90.6%) | 47 (90.4%) |
| 75 Years and over | 37 (94.9%) | 38 (82.6%) |
| Total | 268 (76.1%) | 262 (79.1%) |
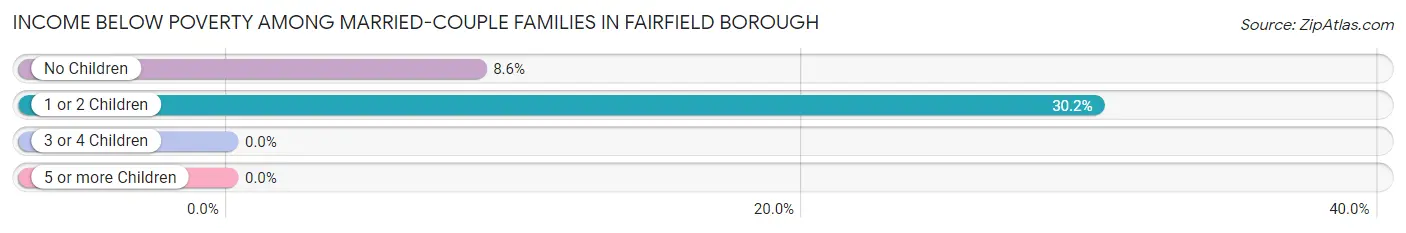
Income Below Poverty Among Married-Couple Families in Fairfield borough
The poverty statistics for married-couple families in Fairfield borough show that 17.8% or 26 of the total 146 families live below the poverty line. Families with 1 or 2 children have the highest poverty rate of 30.2%, comprising of 19 families. On the other hand, families with 3 or 4 children have the lowest poverty rate of 0.0%, which includes 0 families.
| Children | Above Poverty | Below Poverty |
| No Children | 74 (91.4%) | 7 (8.6%) |
| 1 or 2 Children | 44 (69.8%) | 19 (30.2%) |
| 3 or 4 Children | 2 (100.0%) | 0 (0.0%) |
| 5 or more Children | 0 (0.0%) | 0 (0.0%) |
| Total | 120 (82.2%) | 26 (17.8%) |
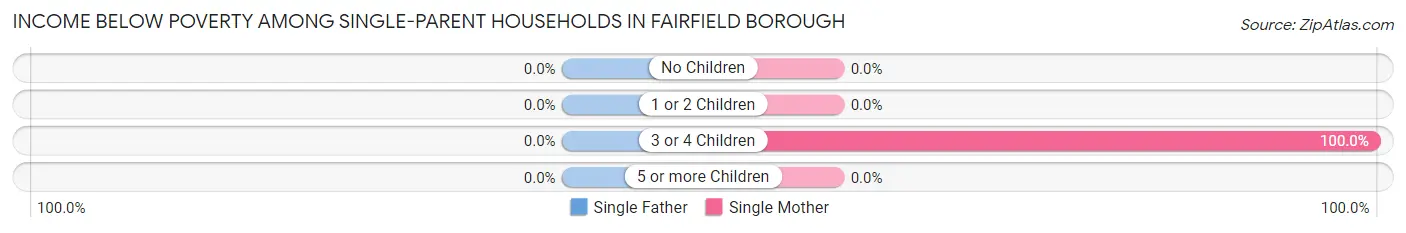
Income Below Poverty Among Single-Parent Households in Fairfield borough
| Children | Single Father | Single Mother |
| No Children | 0 (0.0%) | 0 (0.0%) |
| 1 or 2 Children | 0 (0.0%) | 0 (0.0%) |
| 3 or 4 Children | 0 (0.0%) | 6 (100.0%) |
| 5 or more Children | 0 (0.0%) | 0 (0.0%) |
| Total | 0 (0.0%) | 6 (24.0%) |
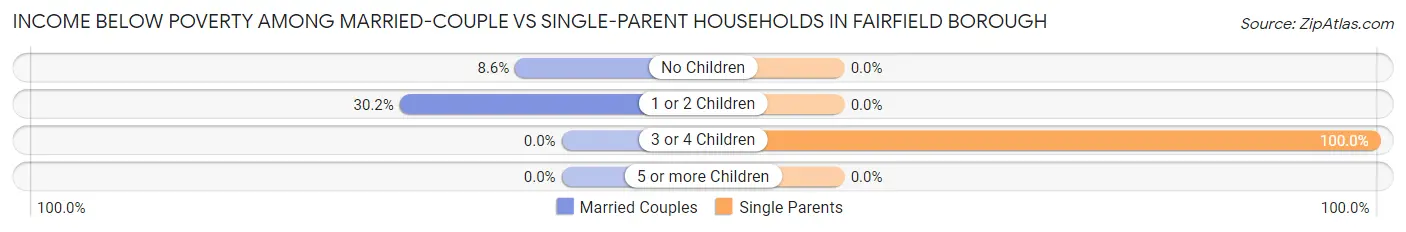
Income Below Poverty Among Married-Couple vs Single-Parent Households in Fairfield borough
The poverty data for Fairfield borough shows that 26 of the married-couple family households (17.8%) and 6 of the single-parent households (21.4%) are living below the poverty level. Within the married-couple family households, those with 1 or 2 children have the highest poverty rate, with 19 households (30.2%) falling below the poverty line. Among the single-parent households, those with 3 or 4 children have the highest poverty rate, with 6 household (100.0%) living below poverty.
| Children | Married-Couple Families | Single-Parent Households |
| No Children | 7 (8.6%) | 0 (0.0%) |
| 1 or 2 Children | 19 (30.2%) | 0 (0.0%) |
| 3 or 4 Children | 0 (0.0%) | 6 (100.0%) |
| 5 or more Children | 0 (0.0%) | 0 (0.0%) |
| Total | 26 (17.8%) | 6 (21.4%) |
Race in Fairfield borough
The most populous races in Fairfield borough are White / Caucasian (640 | 93.7%), Two or more Races (43 | 6.3%), and Hispanic or Latino (10 | 1.5%).
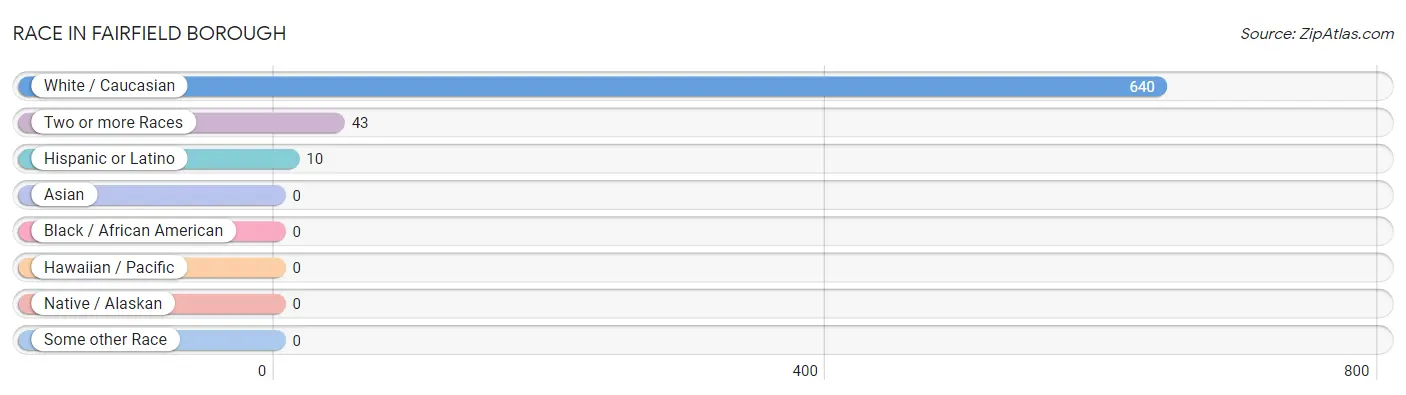
| Race | # Population | % Population |
| Asian | 0 | 0.0% |
| Black / African American | 0 | 0.0% |
| Hawaiian / Pacific | 0 | 0.0% |
| Hispanic or Latino | 10 | 1.5% |
| Native / Alaskan | 0 | 0.0% |
| White / Caucasian | 640 | 93.7% |
| Two or more Races | 43 | 6.3% |
| Some other Race | 0 | 0.0% |
| Total | 683 | 100.0% |
Ancestry in Fairfield borough
The most populous ancestries reported in Fairfield borough are German (200 | 29.3%), Irish (88 | 12.9%), English (72 | 10.5%), American (39 | 5.7%), and Italian (22 | 3.2%), together accounting for 61.6% of all Fairfield borough residents.
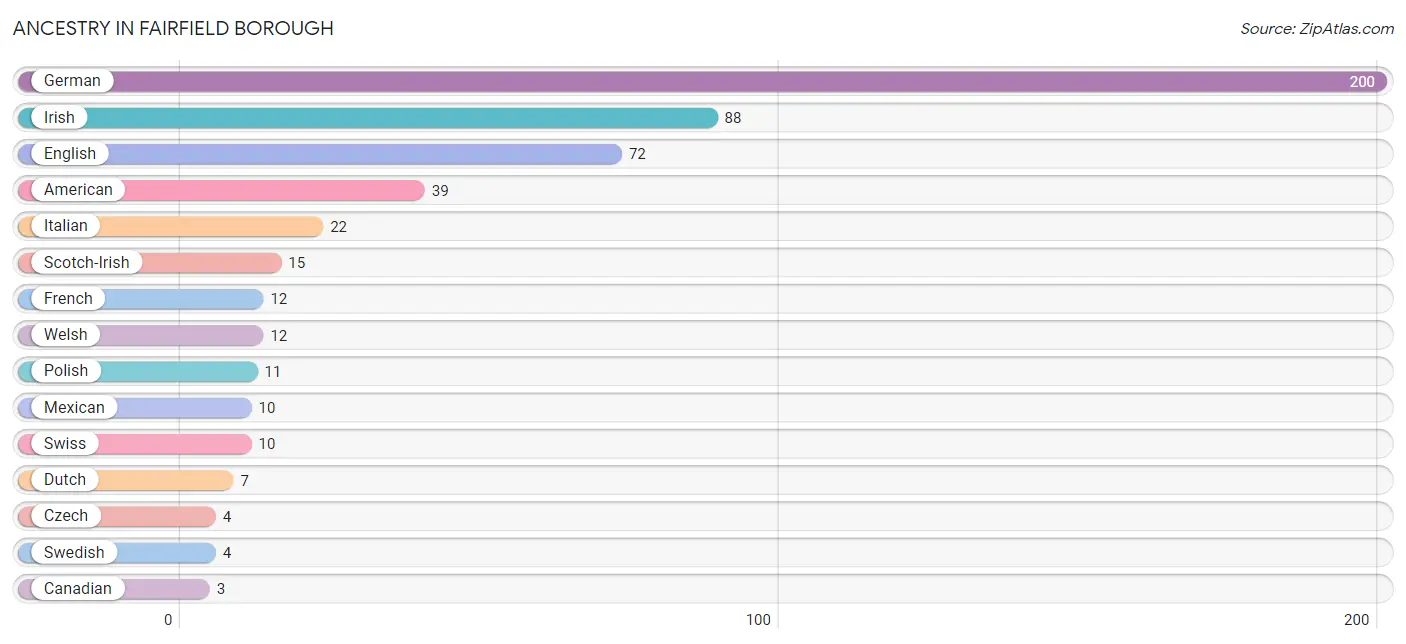
| Ancestry | # Population | % Population |
| American | 39 | 5.7% |
| British | 2 | 0.3% |
| Canadian | 3 | 0.4% |
| Czech | 4 | 0.6% |
| Dutch | 7 | 1.0% |
| Eastern European | 2 | 0.3% |
| English | 72 | 10.5% |
| European | 2 | 0.3% |
| French | 12 | 1.8% |
| German | 200 | 29.3% |
| Hungarian | 2 | 0.3% |
| Irish | 88 | 12.9% |
| Italian | 22 | 3.2% |
| Mexican | 10 | 1.5% |
| Polish | 11 | 1.6% |
| Portuguese | 2 | 0.3% |
| Scotch-Irish | 15 | 2.2% |
| Scottish | 2 | 0.3% |
| Swedish | 4 | 0.6% |
| Swiss | 10 | 1.5% |
| Welsh | 12 | 1.8% | View All 21 Rows |
Immigrants in Fairfield borough
The most numerous immigrant groups reported in Fairfield borough came from England (2 | 0.3%), Europe (2 | 0.3%), and Northern Europe (2 | 0.3%), together accounting for 0.9% of all Fairfield borough residents.
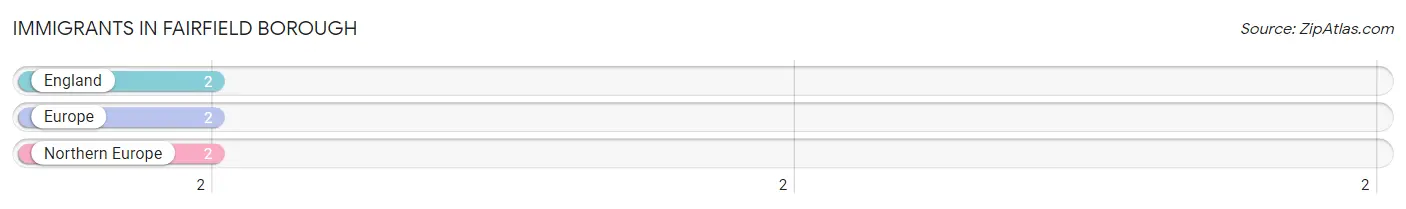
| Immigration Origin | # Population | % Population |
| England | 2 | 0.3% |
| Europe | 2 | 0.3% |
| Northern Europe | 2 | 0.3% | View All 3 Rows |
Sex and Age in Fairfield borough
Sex and Age in Fairfield borough
The most populous age groups in Fairfield borough are 15 to 19 Years (92 | 26.1%) for men and 10 to 14 Years (46 | 13.9%) for women.
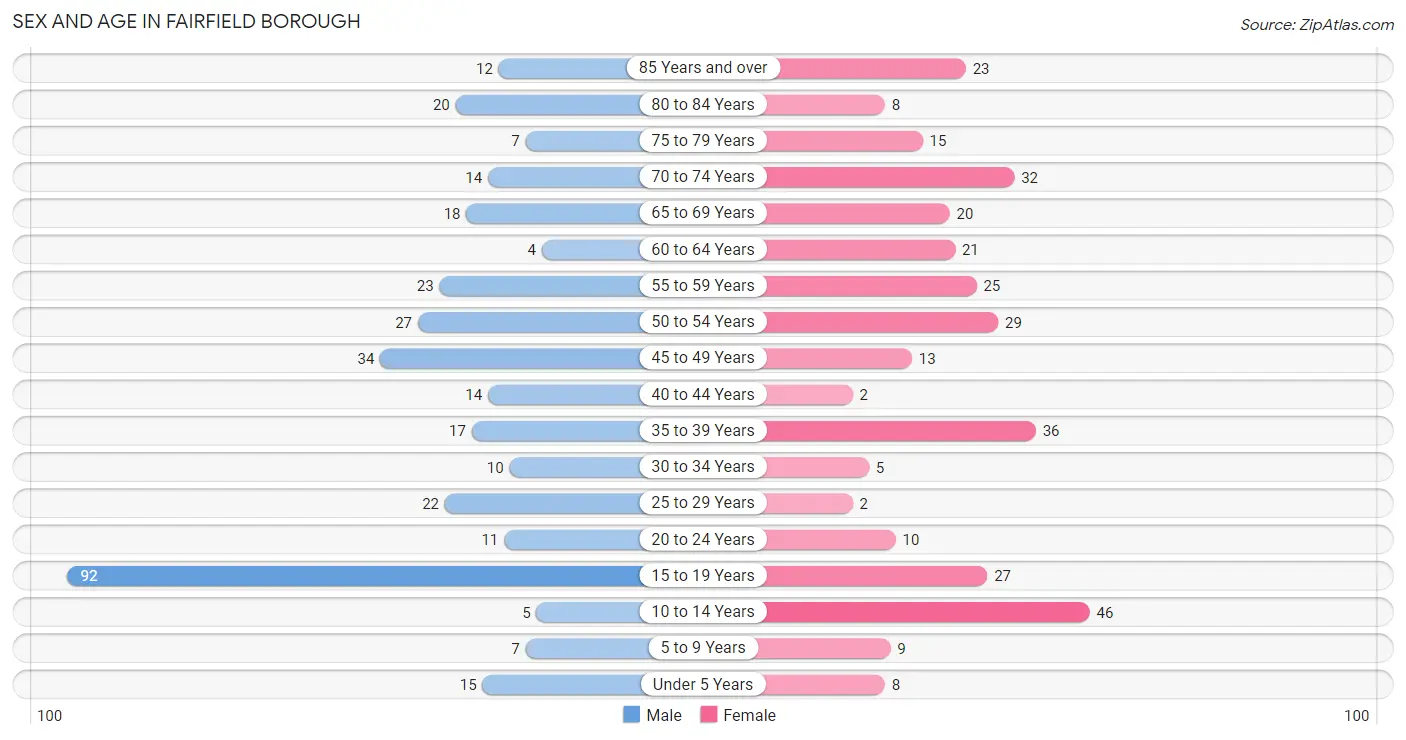
| Age Bracket | Male | Female |
| Under 5 Years | 15 (4.3%) | 8 (2.4%) |
| 5 to 9 Years | 7 (2.0%) | 9 (2.7%) |
| 10 to 14 Years | 5 (1.4%) | 46 (13.9%) |
| 15 to 19 Years | 92 (26.1%) | 27 (8.2%) |
| 20 to 24 Years | 11 (3.1%) | 10 (3.0%) |
| 25 to 29 Years | 22 (6.2%) | 2 (0.6%) |
| 30 to 34 Years | 10 (2.8%) | 5 (1.5%) |
| 35 to 39 Years | 17 (4.8%) | 36 (10.9%) |
| 40 to 44 Years | 14 (4.0%) | 2 (0.6%) |
| 45 to 49 Years | 34 (9.7%) | 13 (3.9%) |
| 50 to 54 Years | 27 (7.7%) | 29 (8.8%) |
| 55 to 59 Years | 23 (6.5%) | 25 (7.5%) |
| 60 to 64 Years | 4 (1.1%) | 21 (6.3%) |
| 65 to 69 Years | 18 (5.1%) | 20 (6.0%) |
| 70 to 74 Years | 14 (4.0%) | 32 (9.7%) |
| 75 to 79 Years | 7 (2.0%) | 15 (4.5%) |
| 80 to 84 Years | 20 (5.7%) | 8 (2.4%) |
| 85 Years and over | 12 (3.4%) | 23 (7.0%) |
| Total | 352 (100.0%) | 331 (100.0%) |
Families and Households in Fairfield borough
Median Family Size in Fairfield borough
The median family size in Fairfield borough is 3.37 persons per family, with married-couple families (146 | 83.9%) accounting for the largest median family size of 3.47 persons per family. On the other hand, single male/father families (3 | 1.7%) represent the smallest median family size with 1.67 persons per family.
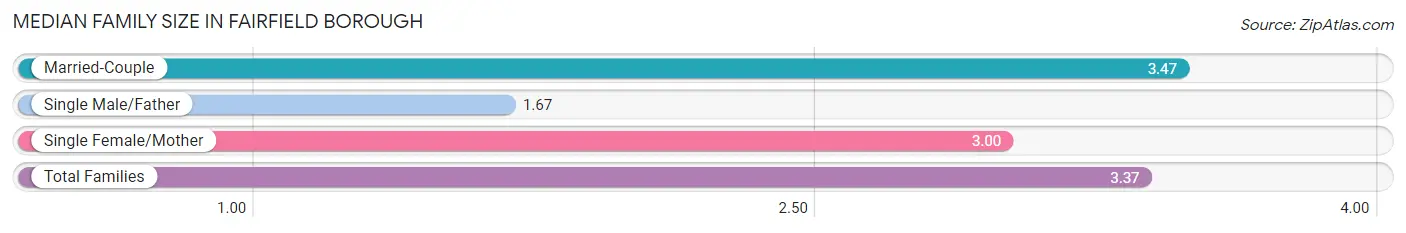
| Family Type | # Families | Family Size |
| Married-Couple | 146 (83.9%) | 3.47 |
| Single Male/Father | 3 (1.7%) | 1.67 |
| Single Female/Mother | 25 (14.4%) | 3.00 |
| Total Families | 174 (100.0%) | 3.37 |
Median Household Size in Fairfield borough
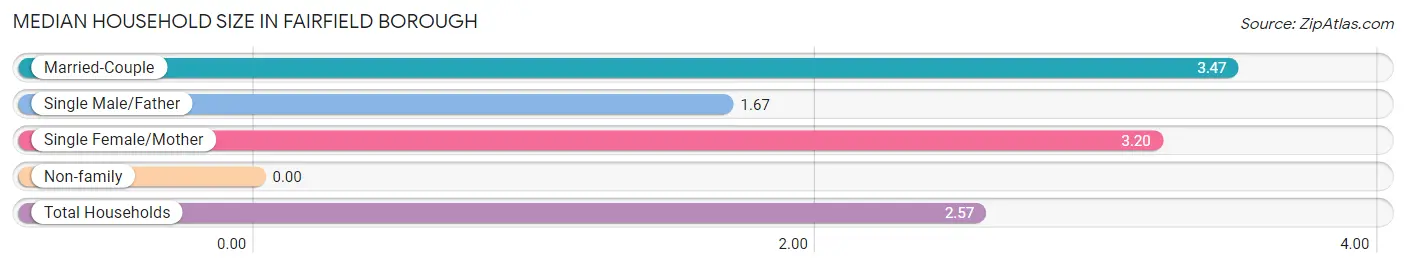
| Household Type | # Households | Household Size |
| Married-Couple | 146 (54.9%) | 3.47 |
| Single Male/Father | 3 (1.1%) | 1.67 |
| Single Female/Mother | 25 (9.4%) | 3.20 |
| Non-family | 92 (34.6%) | - |
| Total Households | 266 (100.0%) | 2.57 |
Household Size by Marriage Status in Fairfield borough
Out of a total of 266 households in Fairfield borough, 174 (65.4%) are family households, while 92 (34.6%) are nonfamily households. The most numerous type of family households are 2-person households, comprising 84, and the most common type of nonfamily households are 1-person households, comprising 92.
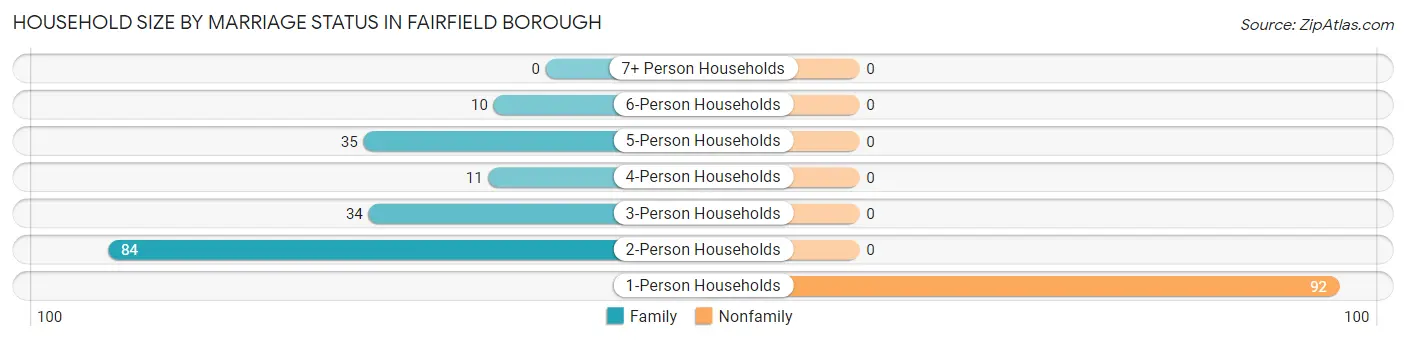
| Household Size | Family Households | Nonfamily Households |
| 1-Person Households | - | 92 (34.6%) |
| 2-Person Households | 84 (31.6%) | 0 (0.0%) |
| 3-Person Households | 34 (12.8%) | 0 (0.0%) |
| 4-Person Households | 11 (4.1%) | 0 (0.0%) |
| 5-Person Households | 35 (13.2%) | 0 (0.0%) |
| 6-Person Households | 10 (3.8%) | 0 (0.0%) |
| 7+ Person Households | 0 (0.0%) | 0 (0.0%) |
| Total | 174 (65.4%) | 92 (34.6%) |
Female Fertility in Fairfield borough
Fertility by Age in Fairfield borough
Average fertility rate in Fairfield borough is 20.0 births per 1,000 women. Women in the age bracket of 20 to 34 years have the highest fertility rate with 118.0 births per 1,000 women. Women in the age bracket of 20 to 34 years acount for 100.0% of all women with births.
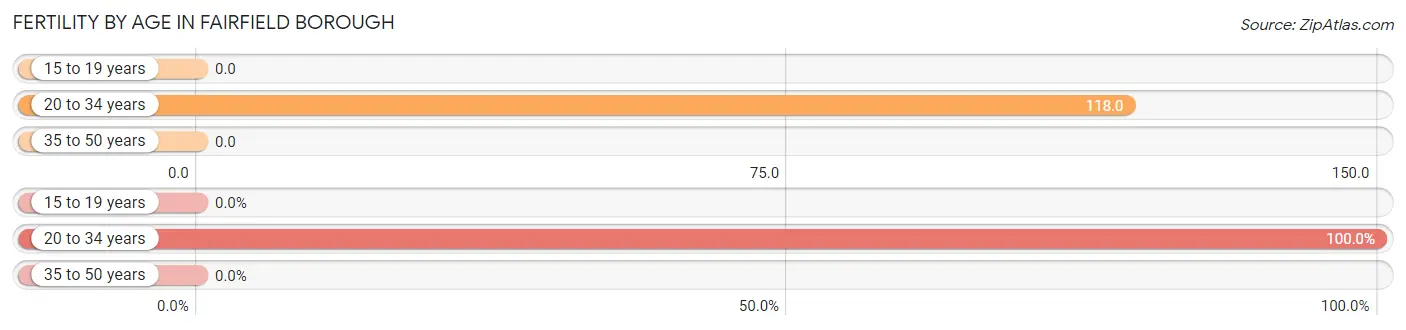
| Age Bracket | Women with Births | Births / 1,000 Women |
| 15 to 19 years | 0 (0.0%) | 0.0 |
| 20 to 34 years | 2 (100.0%) | 118.0 |
| 35 to 50 years | 0 (0.0%) | 0.0 |
| Total | 2 (100.0%) | 20.0 |
Fertility by Age by Marriage Status in Fairfield borough
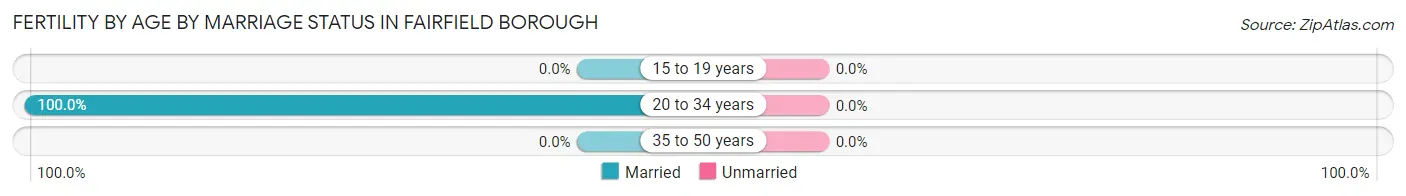
| Age Bracket | Married | Unmarried |
| 15 to 19 years | 0 (0.0%) | 0 (0.0%) |
| 20 to 34 years | 2 (100.0%) | 0 (0.0%) |
| 35 to 50 years | 0 (0.0%) | 0 (0.0%) |
| Total | 2 (100.0%) | 0 (0.0%) |
Fertility by Education in Fairfield borough
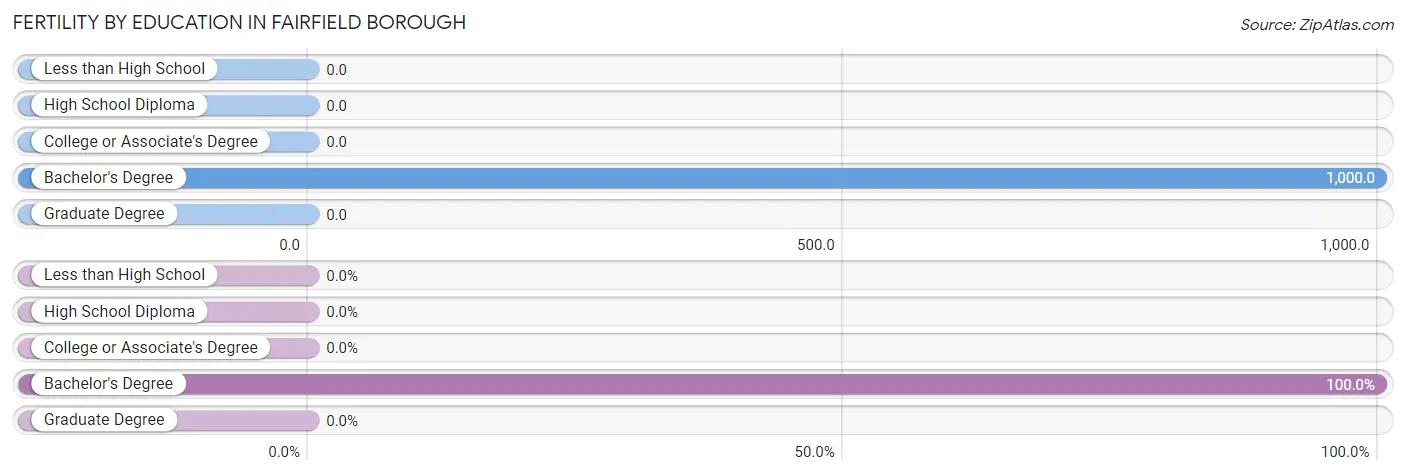
| Educational Attainment | Women with Births | Births / 1,000 Women |
| Less than High School | 0 (0.0%) | 0.0 |
| High School Diploma | 0 (0.0%) | 0.0 |
| College or Associate's Degree | 0 (0.0%) | 0.0 |
| Bachelor's Degree | 2 (100.0%) | 1,000.0 |
| Graduate Degree | 0 (0.0%) | 0.0 |
| Total | 2 (100.0%) | 20.0 |
Fertility by Education by Marriage Status in Fairfield borough
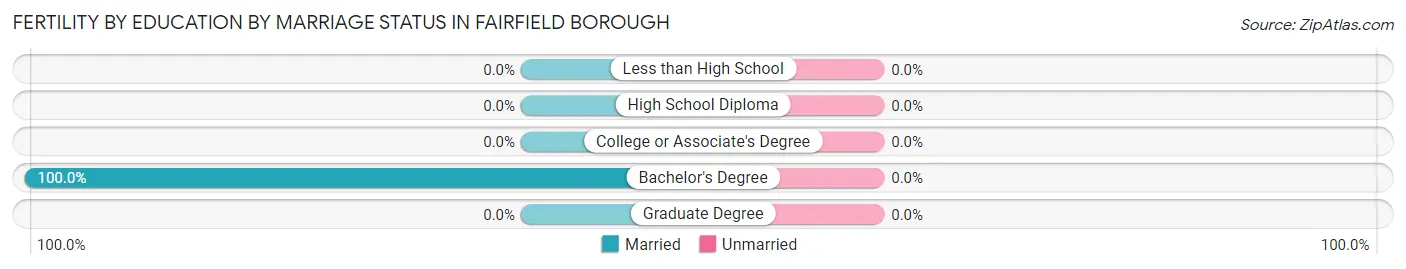
| Educational Attainment | Married | Unmarried |
| Less than High School | 0 (0.0%) | 0 (0.0%) |
| High School Diploma | 0 (0.0%) | 0 (0.0%) |
| College or Associate's Degree | 0 (0.0%) | 0 (0.0%) |
| Bachelor's Degree | 2 (100.0%) | 0 (0.0%) |
| Graduate Degree | 0 (0.0%) | 0 (0.0%) |
| Total | 2 (100.0%) | 0 (0.0%) |
Employment Characteristics in Fairfield borough
Employment by Class of Employer in Fairfield borough
Among the 257 employed individuals in Fairfield borough, private company employees (171 | 66.5%), federal government employees (31 | 12.1%), and local government employees (21 | 8.2%) make up the most common classes of employment.
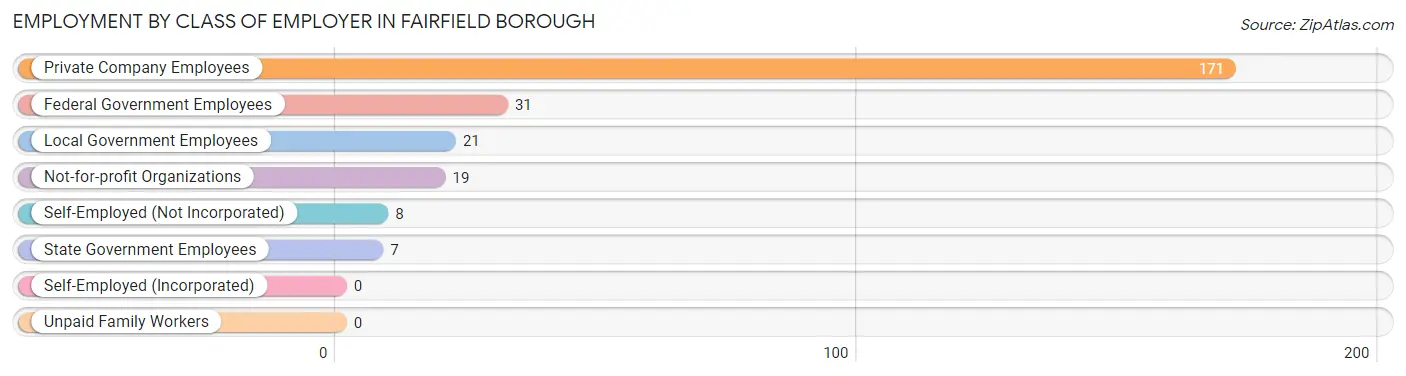
| Employer Class | # Employees | % Employees |
| Private Company Employees | 171 | 66.5% |
| Self-Employed (Incorporated) | 0 | 0.0% |
| Self-Employed (Not Incorporated) | 8 | 3.1% |
| Not-for-profit Organizations | 19 | 7.4% |
| Local Government Employees | 21 | 8.2% |
| State Government Employees | 7 | 2.7% |
| Federal Government Employees | 31 | 12.1% |
| Unpaid Family Workers | 0 | 0.0% |
| Total | 257 | 100.0% |
Employment Status by Age in Fairfield borough
According to the labor force statistics for Fairfield borough, out of the total population over 16 years of age (571), 49.0% or 280 individuals are in the labor force, with 3.9% or 11 of them unemployed. The age group with the highest labor force participation rate is 25 to 29 years, with 100.0% or 24 individuals in the labor force. Within the labor force, the 16 to 19 years age range has the highest percentage of unemployed individuals, with 56.3% or 9 of them being unemployed.
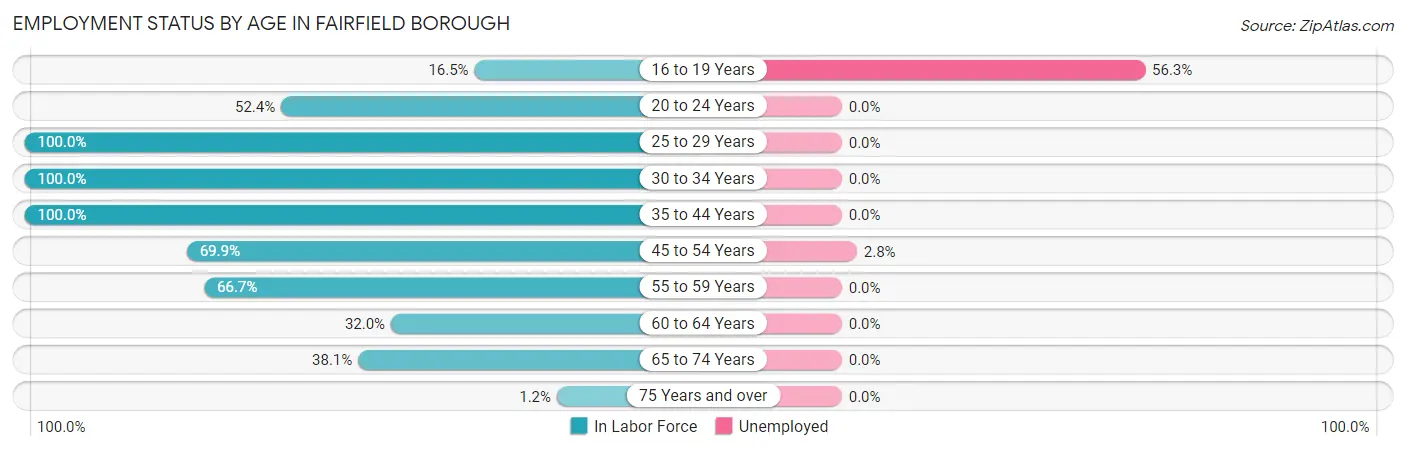
| Age Bracket | In Labor Force | Unemployed |
| 16 to 19 Years | 16 (16.5%) | 9 (56.3%) |
| 20 to 24 Years | 11 (52.4%) | 0 (0.0%) |
| 25 to 29 Years | 24 (100.0%) | 0 (0.0%) |
| 30 to 34 Years | 15 (100.0%) | 0 (0.0%) |
| 35 to 44 Years | 69 (100.0%) | 0 (0.0%) |
| 45 to 54 Years | 72 (69.9%) | 2 (2.8%) |
| 55 to 59 Years | 32 (66.7%) | 0 (0.0%) |
| 60 to 64 Years | 8 (32.0%) | 0 (0.0%) |
| 65 to 74 Years | 32 (38.1%) | 0 (0.0%) |
| 75 Years and over | 1 (1.2%) | 0 (0.0%) |
| Total | 280 (49.0%) | 11 (3.9%) |
Employment Status by Educational Attainment in Fairfield borough
According to labor force statistics for Fairfield borough, 77.5% of individuals (220) out of the total population between 25 and 64 years of age (284) are in the labor force, with 0.9% or 2 of them being unemployed. The group with the highest labor force participation rate are those with the educational attainment of bachelor's degree or higher, with 93.4% or 57 individuals in the labor force. Within the labor force, individuals with high school diploma education have the highest percentage of unemployment, with 2.6% or 2 of them being unemployed.
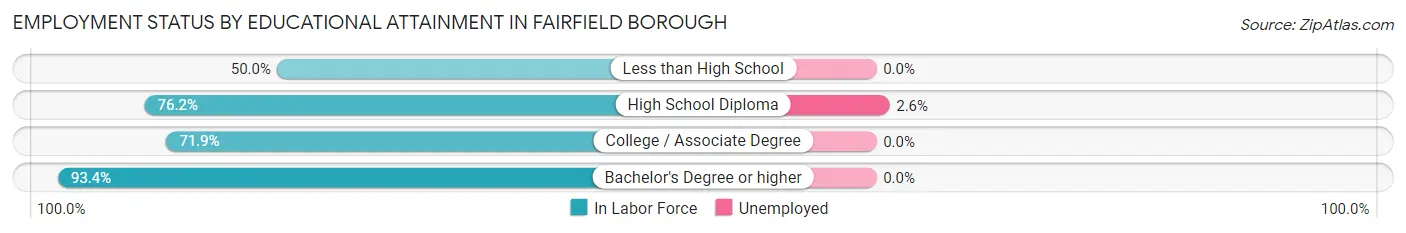
| Educational Attainment | In Labor Force | Unemployed |
| Less than High School | 4 (50.0%) | 0 (0.0%) |
| High School Diploma | 77 (76.2%) | 3 (2.6%) |
| College / Associate Degree | 82 (71.9%) | 0 (0.0%) |
| Bachelor's Degree or higher | 57 (93.4%) | 0 (0.0%) |
| Total | 220 (77.5%) | 3 (0.9%) |
Employment Occupations by Sex in Fairfield borough
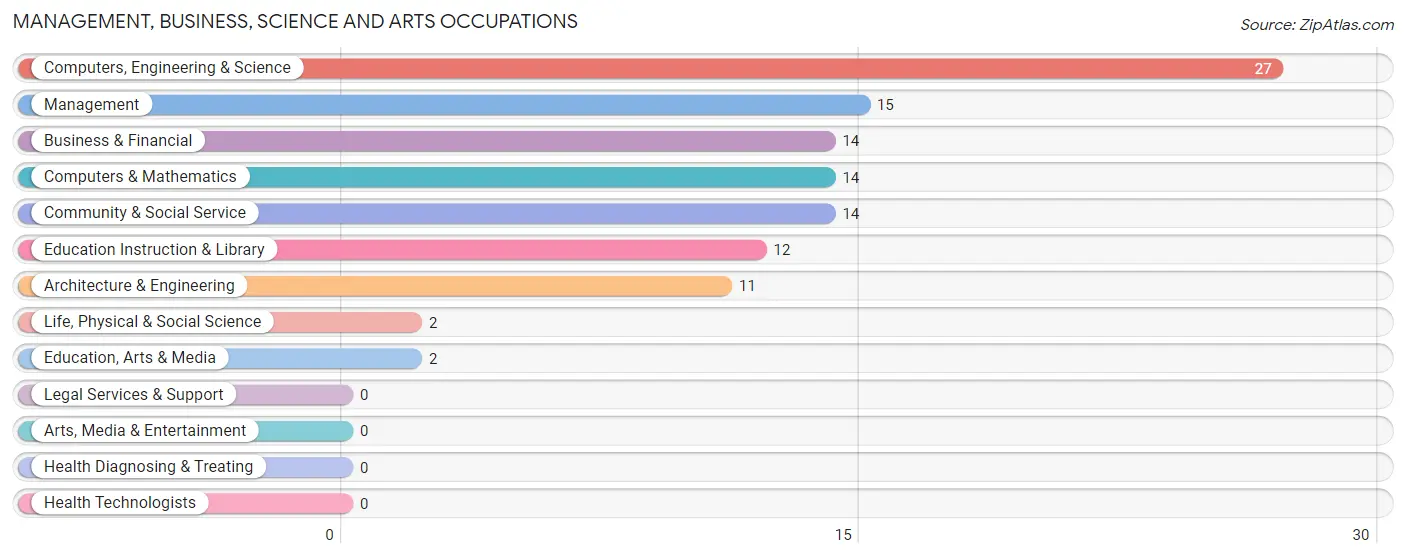
Management, Business, Science and Arts Occupations
The most common Management, Business, Science and Arts occupations in Fairfield borough are Computers, Engineering & Science (27 | 10.0%), Management (15 | 5.6%), Business & Financial (14 | 5.2%), Computers & Mathematics (14 | 5.2%), and Community & Social Service (14 | 5.2%).
Management, Business, Science and Arts Occupations by Sex
Within the Management, Business, Science and Arts occupations in Fairfield borough, the most male-oriented occupations are Business & Financial (71.4%), Computers & Mathematics (64.3%), and Computers, Engineering & Science (51.8%), while the most female-oriented occupations are Life, Physical & Social Science (100.0%), Community & Social Service (100.0%), and Education, Arts & Media (100.0%).
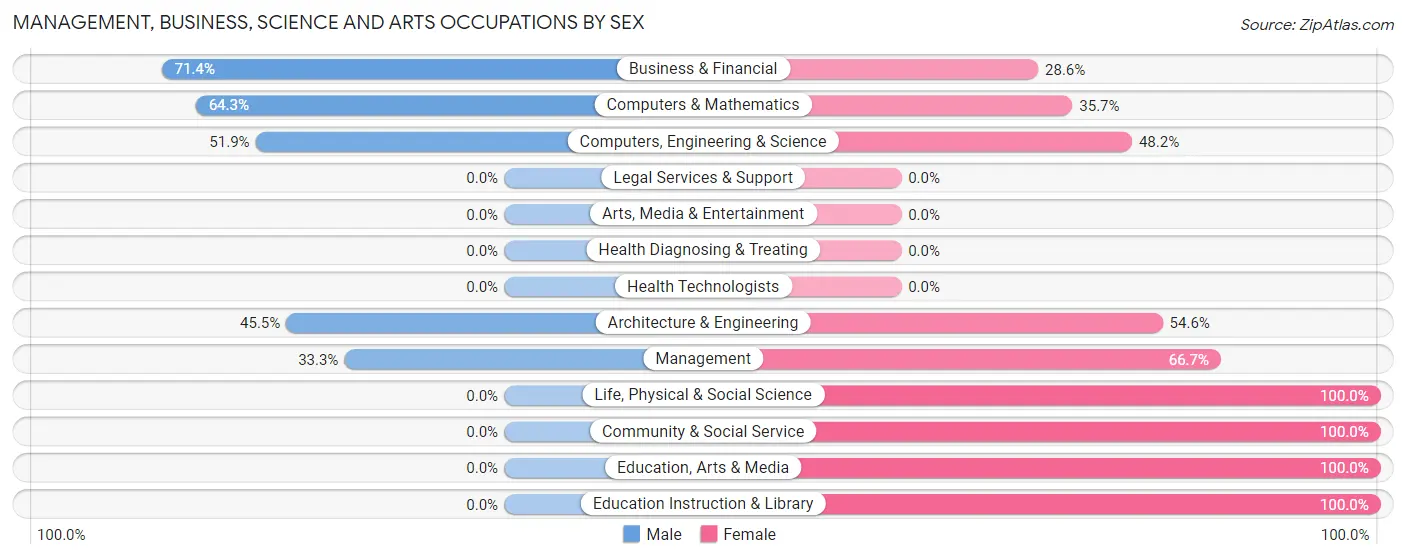
| Occupation | Male | Female |
| Management | 5 (33.3%) | 10 (66.7%) |
| Business & Financial | 10 (71.4%) | 4 (28.6%) |
| Computers, Engineering & Science | 14 (51.8%) | 13 (48.1%) |
| Computers & Mathematics | 9 (64.3%) | 5 (35.7%) |
| Architecture & Engineering | 5 (45.5%) | 6 (54.5%) |
| Life, Physical & Social Science | 0 (0.0%) | 2 (100.0%) |
| Community & Social Service | 0 (0.0%) | 14 (100.0%) |
| Education, Arts & Media | 0 (0.0%) | 2 (100.0%) |
| Legal Services & Support | 0 (0.0%) | 0 (0.0%) |
| Education Instruction & Library | 0 (0.0%) | 12 (100.0%) |
| Arts, Media & Entertainment | 0 (0.0%) | 0 (0.0%) |
| Health Diagnosing & Treating | 0 (0.0%) | 0 (0.0%) |
| Health Technologists | 0 (0.0%) | 0 (0.0%) |
| Total (Category) | 29 (41.4%) | 41 (58.6%) |
| Total (Overall) | 143 (53.2%) | 126 (46.8%) |
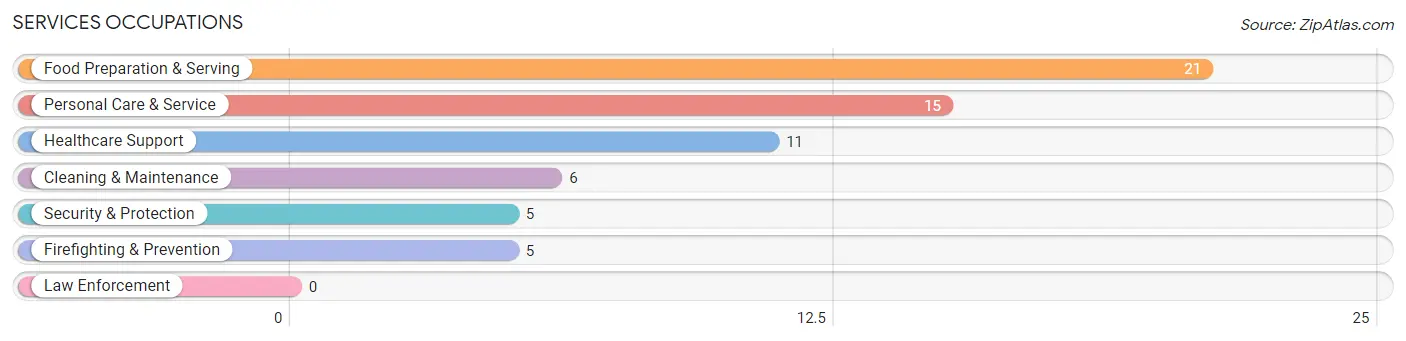
Services Occupations
The most common Services occupations in Fairfield borough are Food Preparation & Serving (21 | 7.8%), Personal Care & Service (15 | 5.6%), Healthcare Support (11 | 4.1%), Cleaning & Maintenance (6 | 2.2%), and Security & Protection (5 | 1.9%).
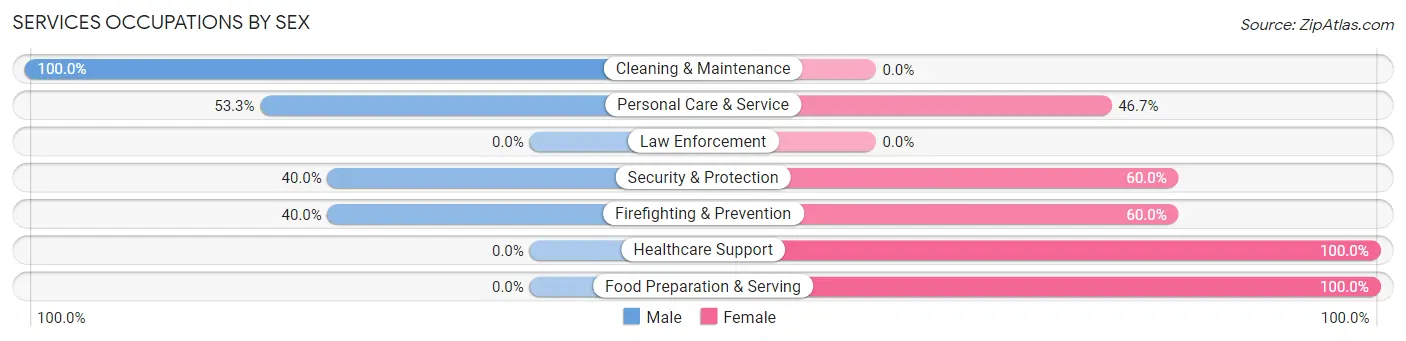
Services Occupations by Sex
Within the Services occupations in Fairfield borough, the most male-oriented occupations are Cleaning & Maintenance (100.0%), Personal Care & Service (53.3%), and Security & Protection (40.0%), while the most female-oriented occupations are Healthcare Support (100.0%), Food Preparation & Serving (100.0%), and Security & Protection (60.0%).
| Occupation | Male | Female |
| Healthcare Support | 0 (0.0%) | 11 (100.0%) |
| Security & Protection | 2 (40.0%) | 3 (60.0%) |
| Firefighting & Prevention | 2 (40.0%) | 3 (60.0%) |
| Law Enforcement | 0 (0.0%) | 0 (0.0%) |
| Food Preparation & Serving | 0 (0.0%) | 21 (100.0%) |
| Cleaning & Maintenance | 6 (100.0%) | 0 (0.0%) |
| Personal Care & Service | 8 (53.3%) | 7 (46.7%) |
| Total (Category) | 16 (27.6%) | 42 (72.4%) |
| Total (Overall) | 143 (53.2%) | 126 (46.8%) |
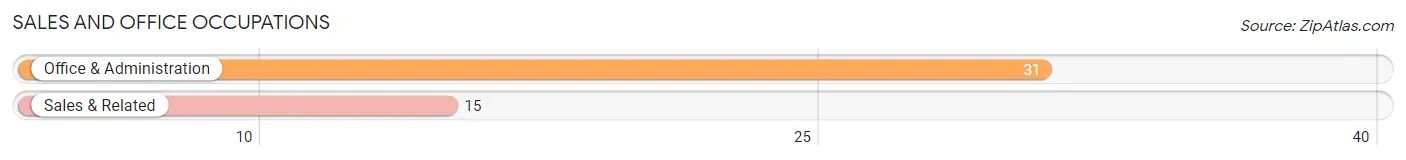
Sales and Office Occupations
The most common Sales and Office occupations in Fairfield borough are Office & Administration (31 | 11.5%), and Sales & Related (15 | 5.6%).
Sales and Office Occupations by Sex
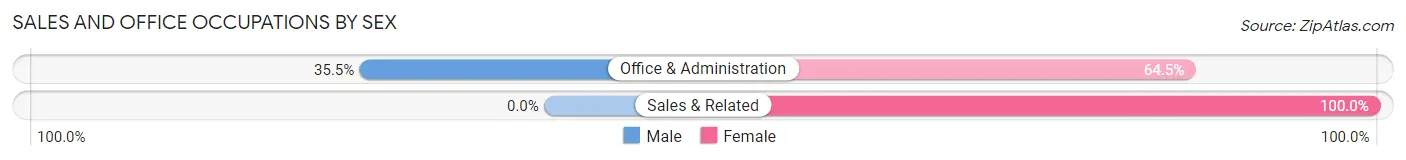
| Occupation | Male | Female |
| Sales & Related | 0 (0.0%) | 15 (100.0%) |
| Office & Administration | 11 (35.5%) | 20 (64.5%) |
| Total (Category) | 11 (23.9%) | 35 (76.1%) |
| Total (Overall) | 143 (53.2%) | 126 (46.8%) |
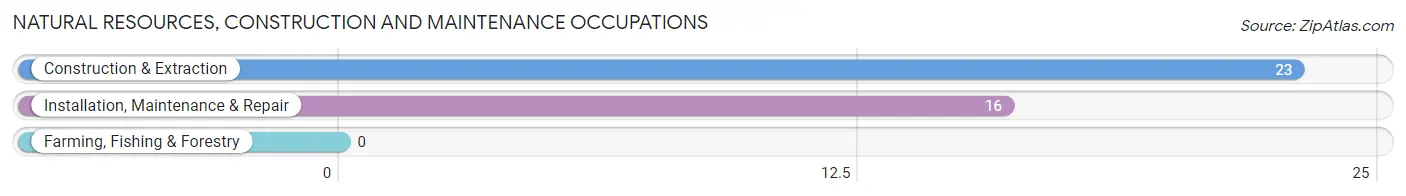
Natural Resources, Construction and Maintenance Occupations
The most common Natural Resources, Construction and Maintenance occupations in Fairfield borough are Construction & Extraction (23 | 8.6%), and Installation, Maintenance & Repair (16 | 5.9%).
Natural Resources, Construction and Maintenance Occupations by Sex
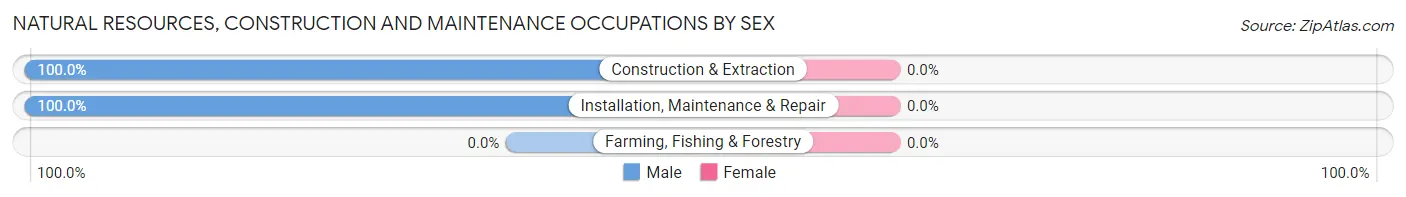
| Occupation | Male | Female |
| Farming, Fishing & Forestry | 0 (0.0%) | 0 (0.0%) |
| Construction & Extraction | 23 (100.0%) | 0 (0.0%) |
| Installation, Maintenance & Repair | 16 (100.0%) | 0 (0.0%) |
| Total (Category) | 39 (100.0%) | 0 (0.0%) |
| Total (Overall) | 143 (53.2%) | 126 (46.8%) |
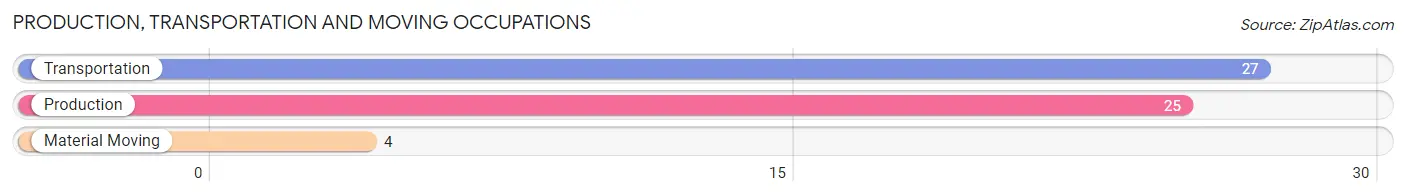
Production, Transportation and Moving Occupations
The most common Production, Transportation and Moving occupations in Fairfield borough are Transportation (27 | 10.0%), Production (25 | 9.3%), and Material Moving (4 | 1.5%).
Production, Transportation and Moving Occupations by Sex
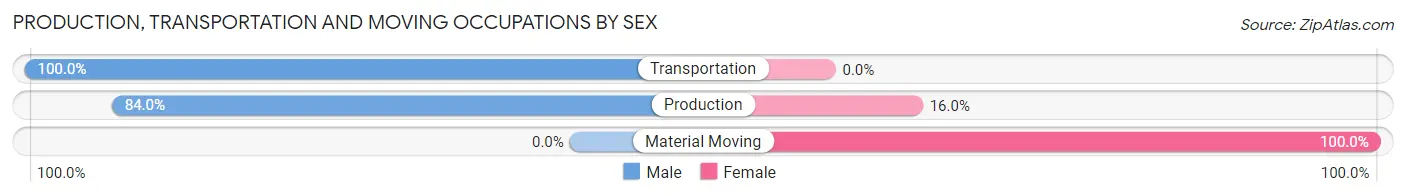
| Occupation | Male | Female |
| Production | 21 (84.0%) | 4 (16.0%) |
| Transportation | 27 (100.0%) | 0 (0.0%) |
| Material Moving | 0 (0.0%) | 4 (100.0%) |
| Total (Category) | 48 (85.7%) | 8 (14.3%) |
| Total (Overall) | 143 (53.2%) | 126 (46.8%) |
Employment Industries by Sex in Fairfield borough
Employment Industries in Fairfield borough
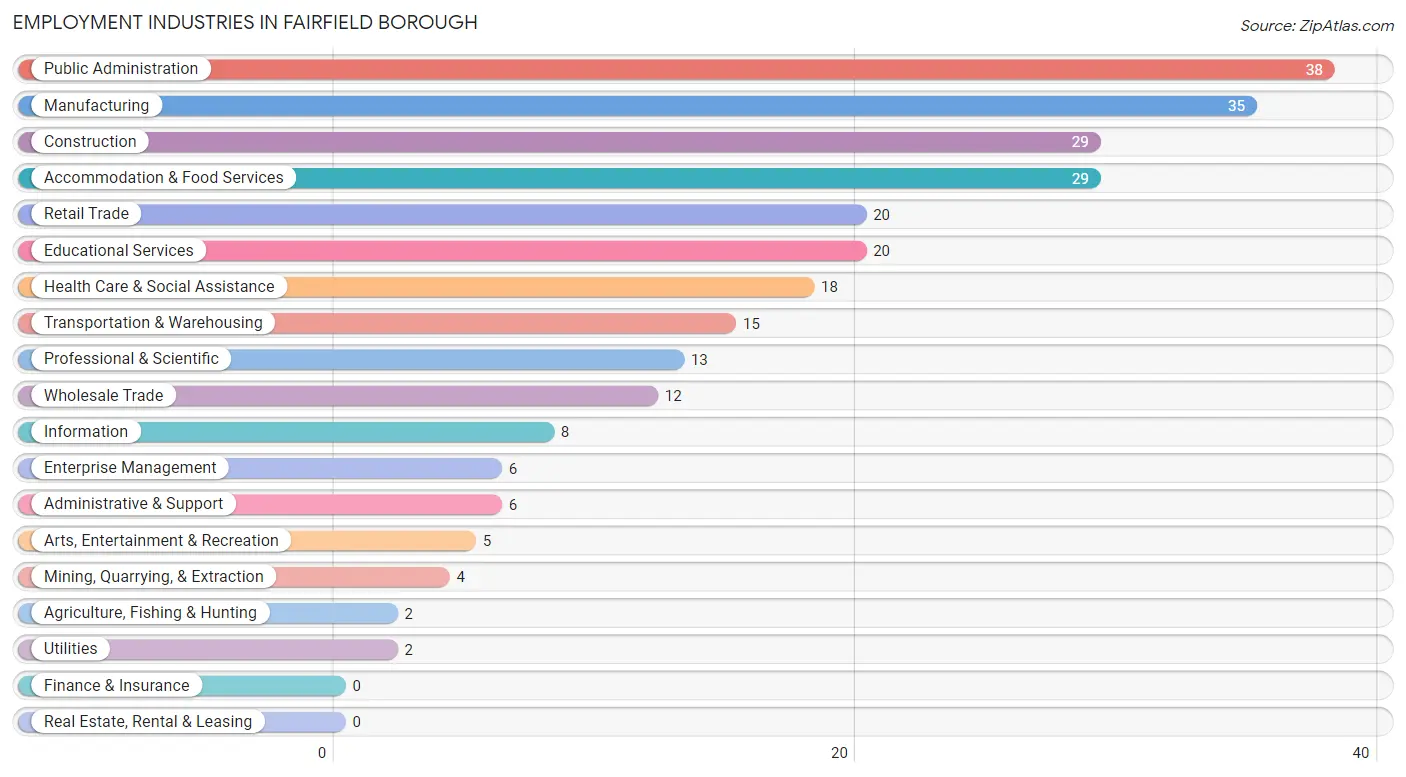
The major employment industries in Fairfield borough include Public Administration (38 | 14.1%), Manufacturing (35 | 13.0%), Construction (29 | 10.8%), Accommodation & Food Services (29 | 10.8%), and Retail Trade (20 | 7.4%).
Employment Industries by Sex in Fairfield borough
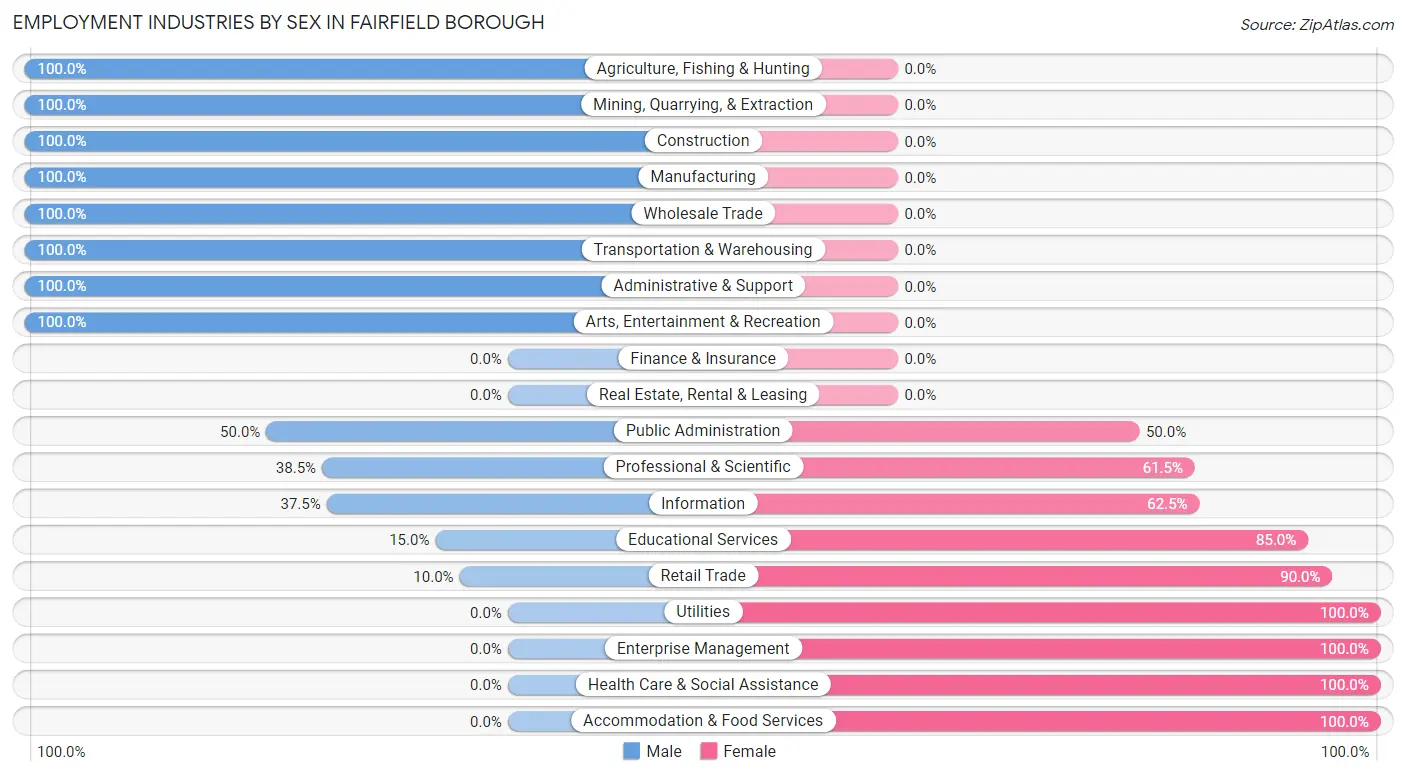
The Fairfield borough industries that see more men than women are Agriculture, Fishing & Hunting (100.0%), Mining, Quarrying, & Extraction (100.0%), and Construction (100.0%), whereas the industries that tend to have a higher number of women are Utilities (100.0%), Enterprise Management (100.0%), and Health Care & Social Assistance (100.0%).
| Industry | Male | Female |
| Agriculture, Fishing & Hunting | 2 (100.0%) | 0 (0.0%) |
| Mining, Quarrying, & Extraction | 4 (100.0%) | 0 (0.0%) |
| Construction | 29 (100.0%) | 0 (0.0%) |
| Manufacturing | 35 (100.0%) | 0 (0.0%) |
| Wholesale Trade | 12 (100.0%) | 0 (0.0%) |
| Retail Trade | 2 (10.0%) | 18 (90.0%) |
| Transportation & Warehousing | 15 (100.0%) | 0 (0.0%) |
| Utilities | 0 (0.0%) | 2 (100.0%) |
| Information | 3 (37.5%) | 5 (62.5%) |
| Finance & Insurance | 0 (0.0%) | 0 (0.0%) |
| Real Estate, Rental & Leasing | 0 (0.0%) | 0 (0.0%) |
| Professional & Scientific | 5 (38.5%) | 8 (61.5%) |
| Enterprise Management | 0 (0.0%) | 6 (100.0%) |
| Administrative & Support | 6 (100.0%) | 0 (0.0%) |
| Educational Services | 3 (15.0%) | 17 (85.0%) |
| Health Care & Social Assistance | 0 (0.0%) | 18 (100.0%) |
| Arts, Entertainment & Recreation | 5 (100.0%) | 0 (0.0%) |
| Accommodation & Food Services | 0 (0.0%) | 29 (100.0%) |
| Public Administration | 19 (50.0%) | 19 (50.0%) |
| Total | 143 (53.2%) | 126 (46.8%) |
Education in Fairfield borough
School Enrollment in Fairfield borough
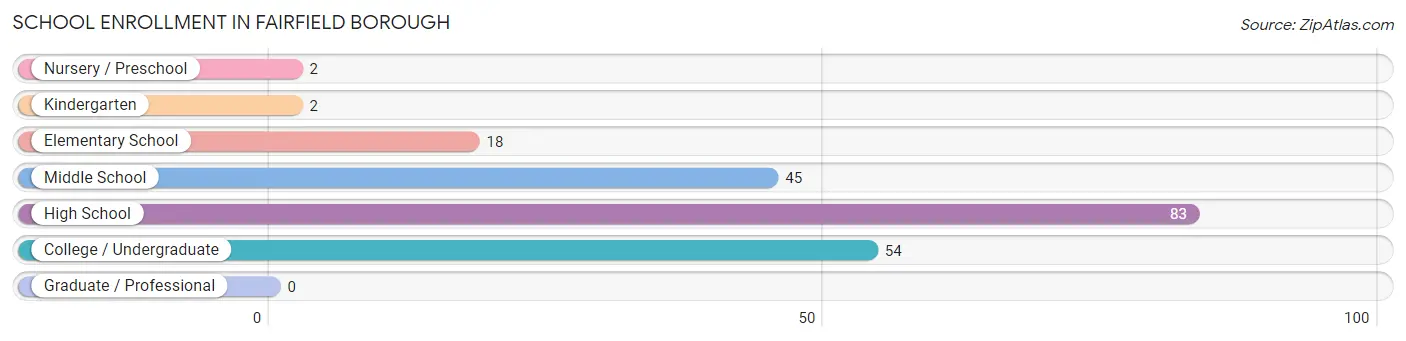
The most common levels of schooling among the 204 students in Fairfield borough are high school (83 | 40.7%), college / undergraduate (54 | 26.5%), and middle school (45 | 22.1%).
| School Level | # Students | % Students |
| Nursery / Preschool | 2 | 1.0% |
| Kindergarten | 2 | 1.0% |
| Elementary School | 18 | 8.8% |
| Middle School | 45 | 22.1% |
| High School | 83 | 40.7% |
| College / Undergraduate | 54 | 26.5% |
| Graduate / Professional | 0 | 0.0% |
| Total | 204 | 100.0% |
School Enrollment by Age by Funding Source in Fairfield borough
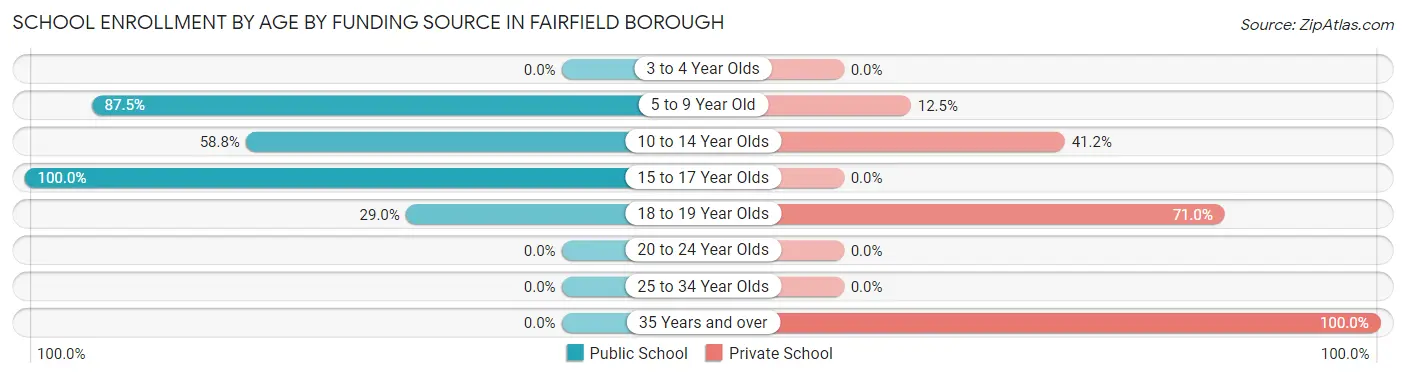
Out of a total of 204 students who are enrolled in schools in Fairfield borough, 70 (34.3%) attend a private institution, while the remaining 134 (65.7%) are enrolled in public schools. The age group of 35 years and over has the highest likelihood of being enrolled in private schools, with 25 (100.0% in the age bracket) enrolled. Conversely, the age group of 15 to 17 year olds has the lowest likelihood of being enrolled in a private school, with 81 (100.0% in the age bracket) attending a public institution.
| Age Bracket | Public School | Private School |
| 3 to 4 Year Olds | 0 (0.0%) | 0 (0.0%) |
| 5 to 9 Year Old | 14 (87.5%) | 2 (12.5%) |
| 10 to 14 Year Olds | 30 (58.8%) | 21 (41.2%) |
| 15 to 17 Year Olds | 81 (100.0%) | 0 (0.0%) |
| 18 to 19 Year Olds | 9 (29.0%) | 22 (71.0%) |
| 20 to 24 Year Olds | 0 (0.0%) | 0 (0.0%) |
| 25 to 34 Year Olds | 0 (0.0%) | 0 (0.0%) |
| 35 Years and over | 0 (0.0%) | 25 (100.0%) |
| Total | 134 (65.7%) | 70 (34.3%) |
Educational Attainment by Field of Study in Fairfield borough
Education (34 | 33.7%), business (15 | 14.8%), social sciences (14 | 13.9%), bio, nature & agricultural (11 | 10.9%), and engineering (8 | 7.9%) are the most common fields of study among 101 individuals in Fairfield borough who have obtained a bachelor's degree or higher.
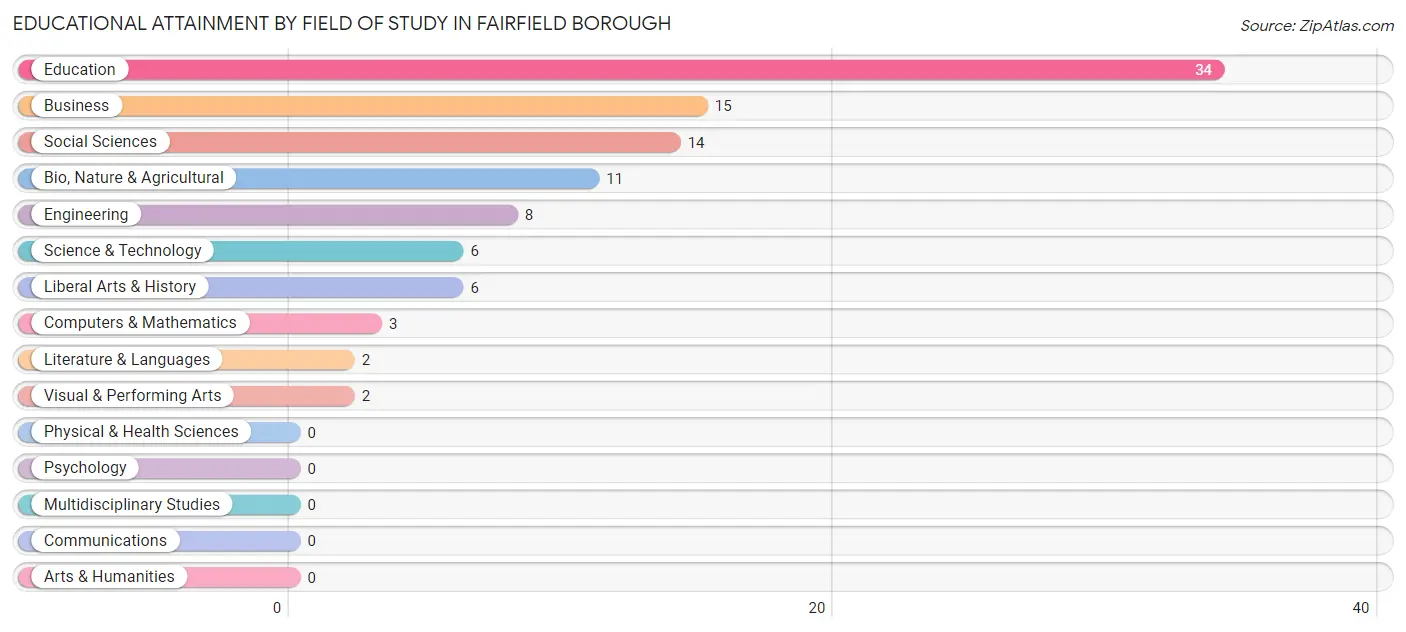
| Field of Study | # Graduates | % Graduates |
| Computers & Mathematics | 3 | 3.0% |
| Bio, Nature & Agricultural | 11 | 10.9% |
| Physical & Health Sciences | 0 | 0.0% |
| Psychology | 0 | 0.0% |
| Social Sciences | 14 | 13.9% |
| Engineering | 8 | 7.9% |
| Multidisciplinary Studies | 0 | 0.0% |
| Science & Technology | 6 | 5.9% |
| Business | 15 | 14.8% |
| Education | 34 | 33.7% |
| Literature & Languages | 2 | 2.0% |
| Liberal Arts & History | 6 | 5.9% |
| Visual & Performing Arts | 2 | 2.0% |
| Communications | 0 | 0.0% |
| Arts & Humanities | 0 | 0.0% |
| Total | 101 | 100.0% |
Transportation & Commute in Fairfield borough
Vehicle Availability by Sex in Fairfield borough
The most prevalent vehicle ownership categories in Fairfield borough are males with 3 vehicles (51, accounting for 38.9%) and females with 3 vehicles (71, making up 40.5%).
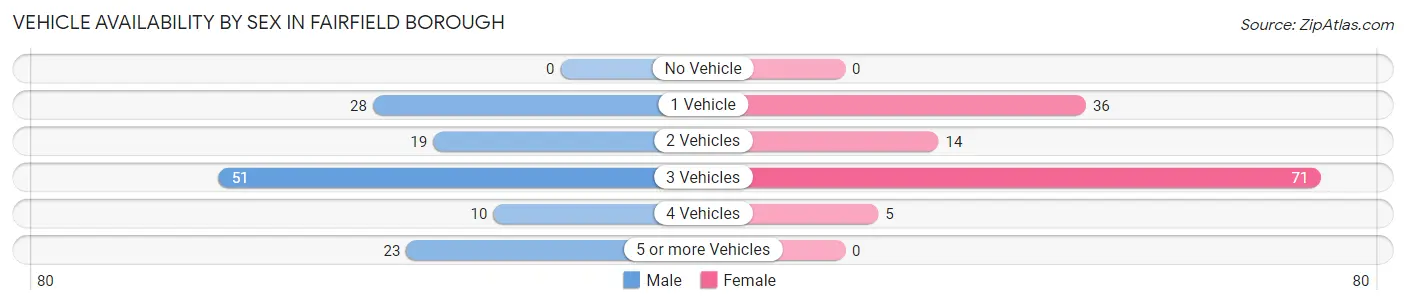
| Vehicles Available | Male | Female |
| No Vehicle | 0 (0.0%) | 0 (0.0%) |
| 1 Vehicle | 28 (21.4%) | 36 (28.6%) |
| 2 Vehicles | 19 (14.5%) | 14 (11.1%) |
| 3 Vehicles | 51 (38.9%) | 71 (56.4%) |
| 4 Vehicles | 10 (7.6%) | 5 (4.0%) |
| 5 or more Vehicles | 23 (17.6%) | 0 (0.0%) |
| Total | 131 (100.0%) | 126 (100.0%) |
Commute Time in Fairfield borough
The most frequently occuring commute durations in Fairfield borough are 20 to 24 minutes (55 commuters, 23.5%), 90 or more minutes (30 commuters, 12.8%), and 15 to 19 minutes (27 commuters, 11.5%).
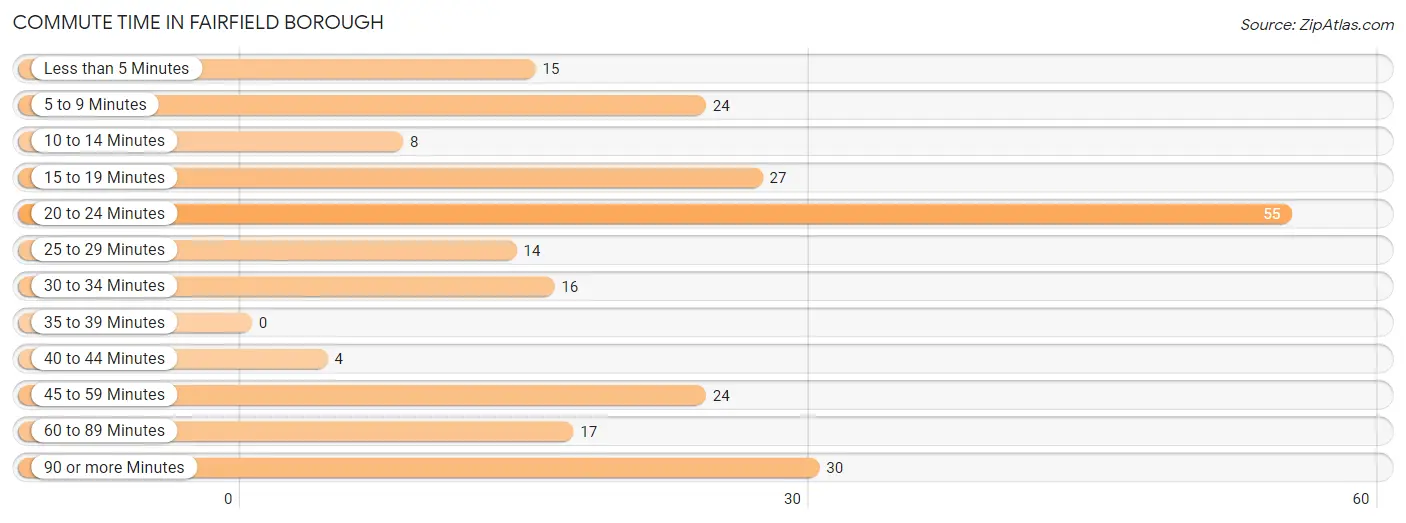
| Commute Time | # Commuters | % Commuters |
| Less than 5 Minutes | 15 | 6.4% |
| 5 to 9 Minutes | 24 | 10.3% |
| 10 to 14 Minutes | 8 | 3.4% |
| 15 to 19 Minutes | 27 | 11.5% |
| 20 to 24 Minutes | 55 | 23.5% |
| 25 to 29 Minutes | 14 | 6.0% |
| 30 to 34 Minutes | 16 | 6.8% |
| 35 to 39 Minutes | 0 | 0.0% |
| 40 to 44 Minutes | 4 | 1.7% |
| 45 to 59 Minutes | 24 | 10.3% |
| 60 to 89 Minutes | 17 | 7.3% |
| 90 or more Minutes | 30 | 12.8% |
Commute Time by Sex in Fairfield borough
The most common commute times in Fairfield borough are 90 or more minutes (22 commuters, 19.1%) for males and 20 to 24 minutes (44 commuters, 37.0%) for females.
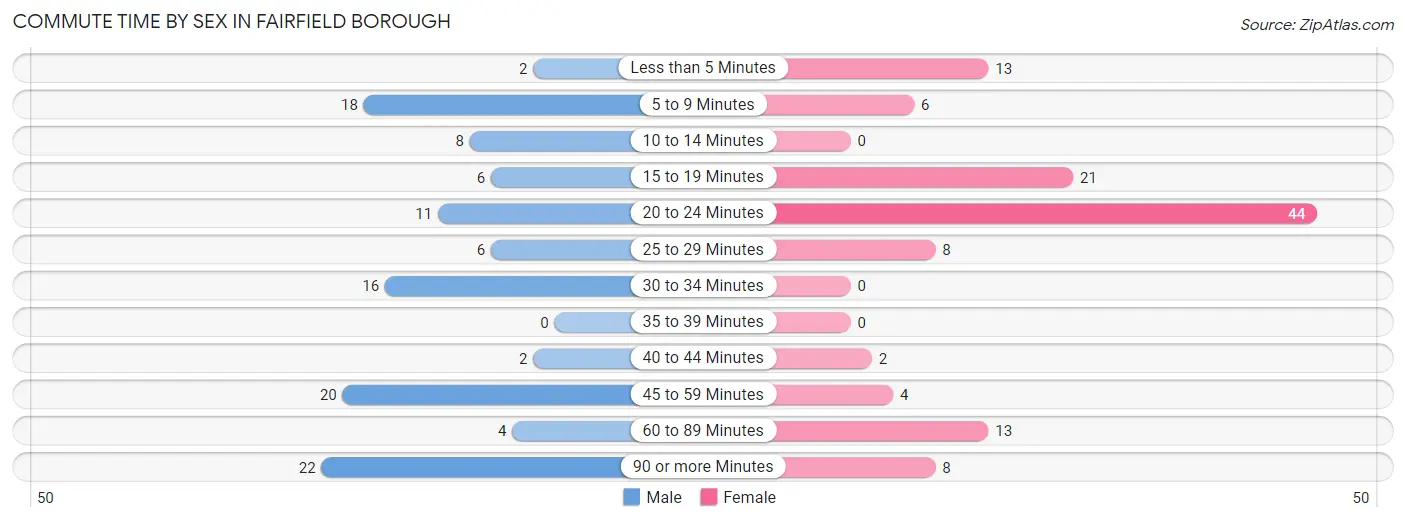
| Commute Time | Male | Female |
| Less than 5 Minutes | 2 (1.7%) | 13 (10.9%) |
| 5 to 9 Minutes | 18 (15.7%) | 6 (5.0%) |
| 10 to 14 Minutes | 8 (7.0%) | 0 (0.0%) |
| 15 to 19 Minutes | 6 (5.2%) | 21 (17.6%) |
| 20 to 24 Minutes | 11 (9.6%) | 44 (37.0%) |
| 25 to 29 Minutes | 6 (5.2%) | 8 (6.7%) |
| 30 to 34 Minutes | 16 (13.9%) | 0 (0.0%) |
| 35 to 39 Minutes | 0 (0.0%) | 0 (0.0%) |
| 40 to 44 Minutes | 2 (1.7%) | 2 (1.7%) |
| 45 to 59 Minutes | 20 (17.4%) | 4 (3.4%) |
| 60 to 89 Minutes | 4 (3.5%) | 13 (10.9%) |
| 90 or more Minutes | 22 (19.1%) | 8 (6.7%) |
Time of Departure to Work by Sex in Fairfield borough
The most frequent times of departure to work in Fairfield borough are 7:00 AM to 7:29 AM (36, 31.3%) for males and 6:30 AM to 6:59 AM (31, 26.1%) for females.
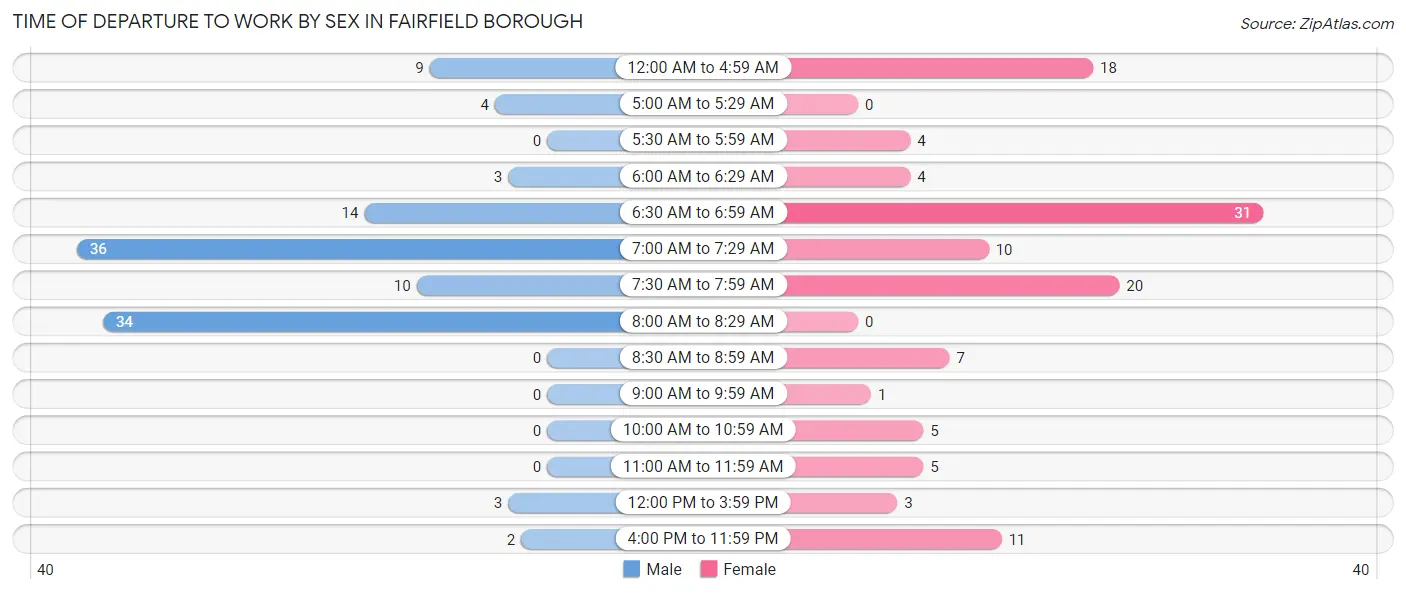
| Time of Departure | Male | Female |
| 12:00 AM to 4:59 AM | 9 (7.8%) | 18 (15.1%) |
| 5:00 AM to 5:29 AM | 4 (3.5%) | 0 (0.0%) |
| 5:30 AM to 5:59 AM | 0 (0.0%) | 4 (3.4%) |
| 6:00 AM to 6:29 AM | 3 (2.6%) | 4 (3.4%) |
| 6:30 AM to 6:59 AM | 14 (12.2%) | 31 (26.1%) |
| 7:00 AM to 7:29 AM | 36 (31.3%) | 10 (8.4%) |
| 7:30 AM to 7:59 AM | 10 (8.7%) | 20 (16.8%) |
| 8:00 AM to 8:29 AM | 34 (29.6%) | 0 (0.0%) |
| 8:30 AM to 8:59 AM | 0 (0.0%) | 7 (5.9%) |
| 9:00 AM to 9:59 AM | 0 (0.0%) | 1 (0.8%) |
| 10:00 AM to 10:59 AM | 0 (0.0%) | 5 (4.2%) |
| 11:00 AM to 11:59 AM | 0 (0.0%) | 5 (4.2%) |
| 12:00 PM to 3:59 PM | 3 (2.6%) | 3 (2.5%) |
| 4:00 PM to 11:59 PM | 2 (1.7%) | 11 (9.2%) |
| Total | 115 (100.0%) | 119 (100.0%) |
Housing Occupancy in Fairfield borough
Occupancy by Ownership in Fairfield borough
Of the total 266 dwellings in Fairfield borough, owner-occupied units account for 177 (66.5%), while renter-occupied units make up 89 (33.5%).
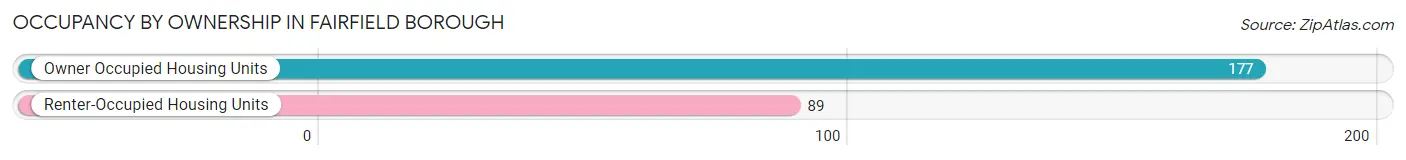
| Occupancy | # Housing Units | % Housing Units |
| Owner Occupied Housing Units | 177 | 66.5% |
| Renter-Occupied Housing Units | 89 | 33.5% |
| Total Occupied Housing Units | 266 | 100.0% |
Occupancy by Household Size in Fairfield borough
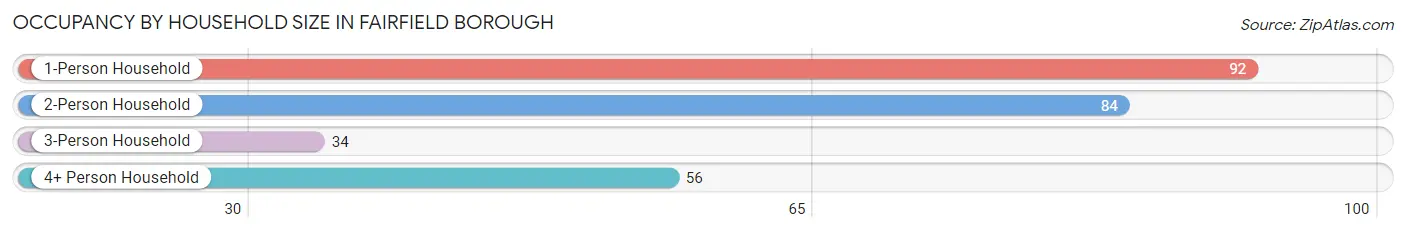
| Household Size | # Housing Units | % Housing Units |
| 1-Person Household | 92 | 34.6% |
| 2-Person Household | 84 | 31.6% |
| 3-Person Household | 34 | 12.8% |
| 4+ Person Household | 56 | 21.0% |
| Total Housing Units | 266 | 100.0% |
Occupancy by Ownership by Household Size in Fairfield borough
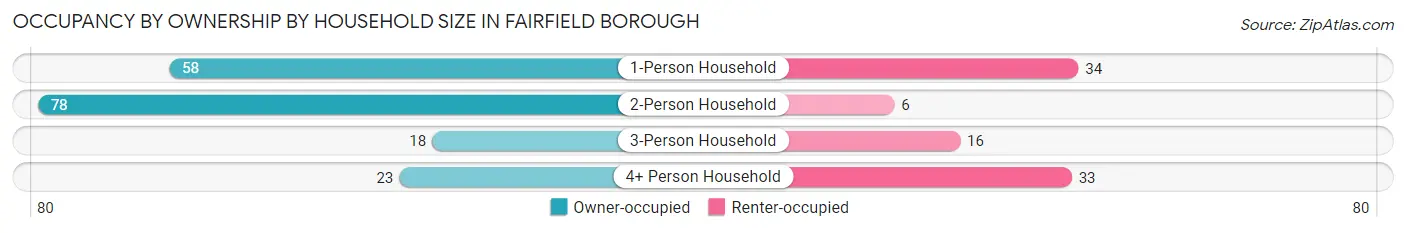
| Household Size | Owner-occupied | Renter-occupied |
| 1-Person Household | 58 (63.0%) | 34 (37.0%) |
| 2-Person Household | 78 (92.9%) | 6 (7.1%) |
| 3-Person Household | 18 (52.9%) | 16 (47.1%) |
| 4+ Person Household | 23 (41.1%) | 33 (58.9%) |
| Total Housing Units | 177 (66.5%) | 89 (33.5%) |
Occupancy by Educational Attainment in Fairfield borough
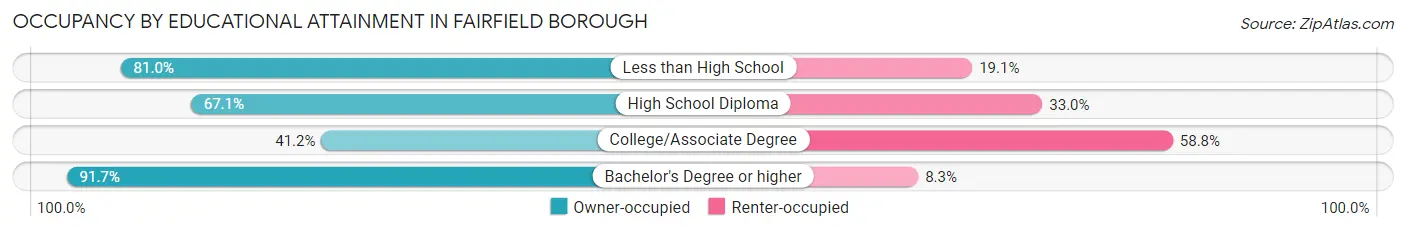
| Household Size | Owner-occupied | Renter-occupied |
| Less than High School | 17 (80.9%) | 4 (19.1%) |
| High School Diploma | 59 (67.0%) | 29 (33.0%) |
| College/Associate Degree | 35 (41.2%) | 50 (58.8%) |
| Bachelor's Degree or higher | 66 (91.7%) | 6 (8.3%) |
Occupancy by Age of Householder in Fairfield borough
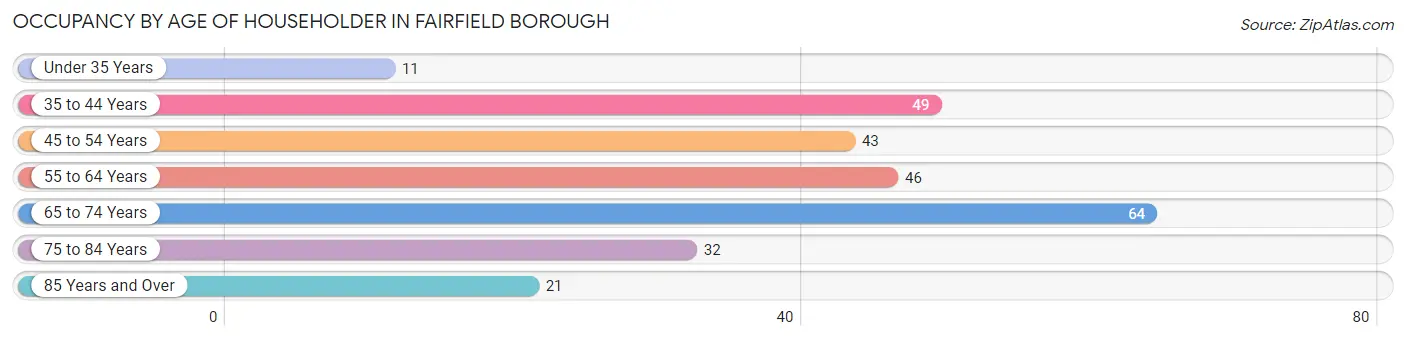
| Age Bracket | # Households | % Households |
| Under 35 Years | 11 | 4.1% |
| 35 to 44 Years | 49 | 18.4% |
| 45 to 54 Years | 43 | 16.2% |
| 55 to 64 Years | 46 | 17.3% |
| 65 to 74 Years | 64 | 24.1% |
| 75 to 84 Years | 32 | 12.0% |
| 85 Years and Over | 21 | 7.9% |
| Total | 266 | 100.0% |
Housing Finances in Fairfield borough
Median Income by Occupancy in Fairfield borough
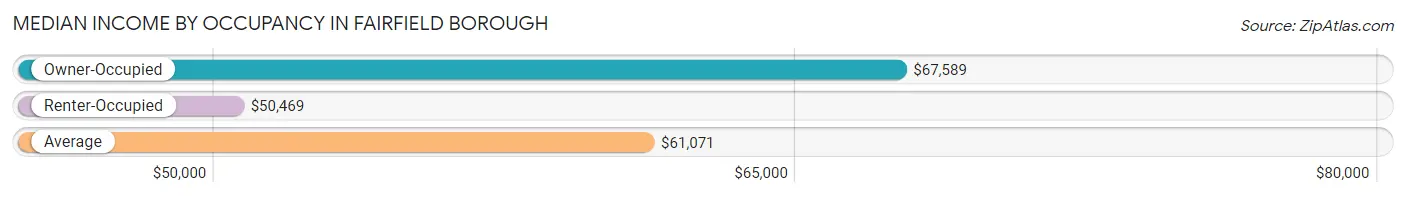
| Occupancy Type | # Households | Median Income |
| Owner-Occupied | 177 (66.5%) | $67,589 |
| Renter-Occupied | 89 (33.5%) | $50,469 |
| Average | 266 (100.0%) | $61,071 |
Occupancy by Householder Income Bracket in Fairfield borough
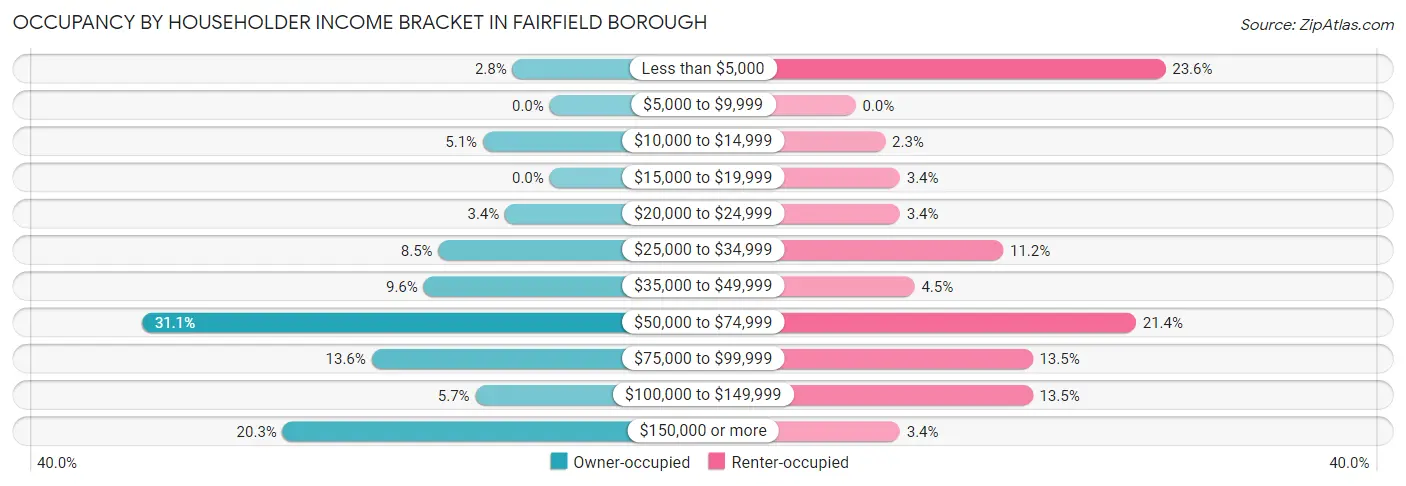
| Income Bracket | Owner-occupied | Renter-occupied |
| Less than $5,000 | 5 (2.8%) | 21 (23.6%) |
| $5,000 to $9,999 | 0 (0.0%) | 0 (0.0%) |
| $10,000 to $14,999 | 9 (5.1%) | 2 (2.2%) |
| $15,000 to $19,999 | 0 (0.0%) | 3 (3.4%) |
| $20,000 to $24,999 | 6 (3.4%) | 3 (3.4%) |
| $25,000 to $34,999 | 15 (8.5%) | 10 (11.2%) |
| $35,000 to $49,999 | 17 (9.6%) | 4 (4.5%) |
| $50,000 to $74,999 | 55 (31.1%) | 19 (21.3%) |
| $75,000 to $99,999 | 24 (13.6%) | 12 (13.5%) |
| $100,000 to $149,999 | 10 (5.7%) | 12 (13.5%) |
| $150,000 or more | 36 (20.3%) | 3 (3.4%) |
| Total | 177 (100.0%) | 89 (100.0%) |
Monthly Housing Cost Tiers in Fairfield borough
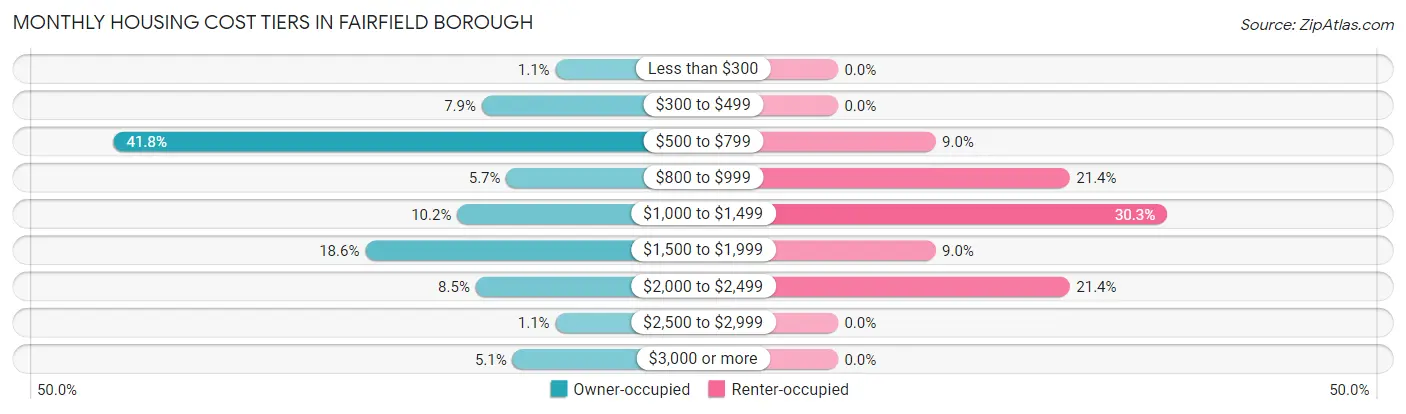
| Monthly Cost | Owner-occupied | Renter-occupied |
| Less than $300 | 2 (1.1%) | 0 (0.0%) |
| $300 to $499 | 14 (7.9%) | 0 (0.0%) |
| $500 to $799 | 74 (41.8%) | 8 (9.0%) |
| $800 to $999 | 10 (5.7%) | 19 (21.3%) |
| $1,000 to $1,499 | 18 (10.2%) | 27 (30.3%) |
| $1,500 to $1,999 | 33 (18.6%) | 8 (9.0%) |
| $2,000 to $2,499 | 15 (8.5%) | 19 (21.3%) |
| $2,500 to $2,999 | 2 (1.1%) | 0 (0.0%) |
| $3,000 or more | 9 (5.1%) | 0 (0.0%) |
| Total | 177 (100.0%) | 89 (100.0%) |
Physical Housing Characteristics in Fairfield borough
Housing Structures in Fairfield borough
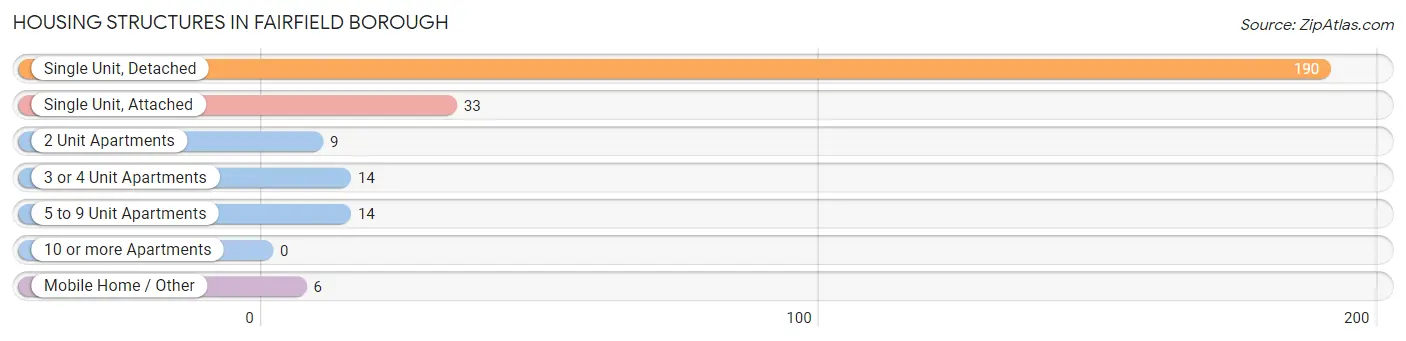
| Structure Type | # Housing Units | % Housing Units |
| Single Unit, Detached | 190 | 71.4% |
| Single Unit, Attached | 33 | 12.4% |
| 2 Unit Apartments | 9 | 3.4% |
| 3 or 4 Unit Apartments | 14 | 5.3% |
| 5 to 9 Unit Apartments | 14 | 5.3% |
| 10 or more Apartments | 0 | 0.0% |
| Mobile Home / Other | 6 | 2.3% |
| Total | 266 | 100.0% |
Housing Structures by Occupancy in Fairfield borough
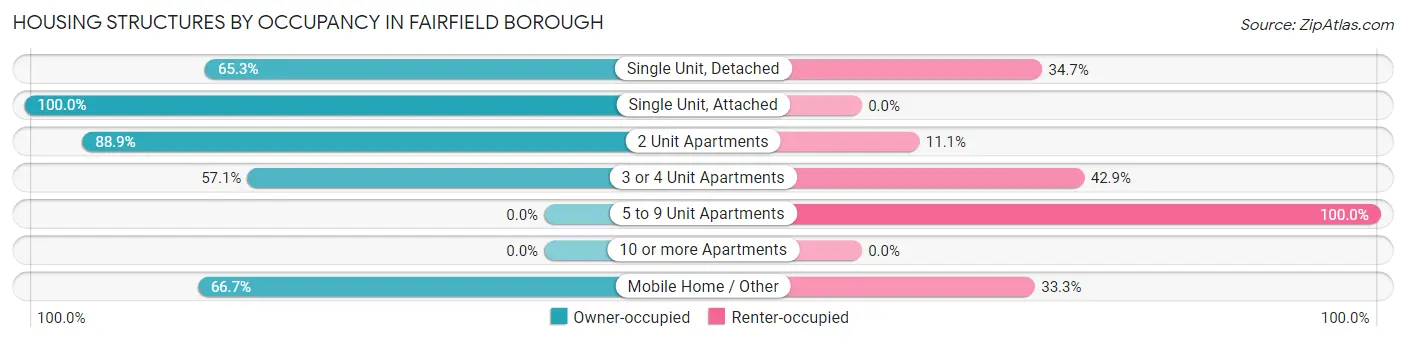
| Structure Type | Owner-occupied | Renter-occupied |
| Single Unit, Detached | 124 (65.3%) | 66 (34.7%) |
| Single Unit, Attached | 33 (100.0%) | 0 (0.0%) |
| 2 Unit Apartments | 8 (88.9%) | 1 (11.1%) |
| 3 or 4 Unit Apartments | 8 (57.1%) | 6 (42.9%) |
| 5 to 9 Unit Apartments | 0 (0.0%) | 14 (100.0%) |
| 10 or more Apartments | 0 (0.0%) | 0 (0.0%) |
| Mobile Home / Other | 4 (66.7%) | 2 (33.3%) |
| Total | 177 (66.5%) | 89 (33.5%) |
Housing Structures by Number of Rooms in Fairfield borough
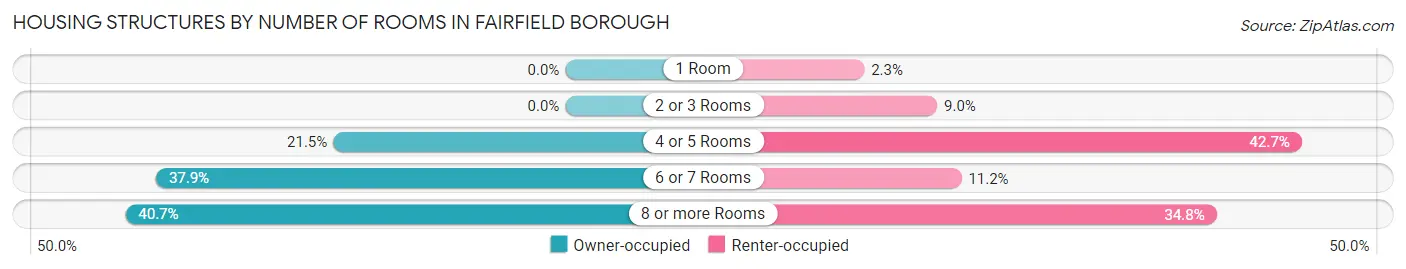
| Number of Rooms | Owner-occupied | Renter-occupied |
| 1 Room | 0 (0.0%) | 2 (2.2%) |
| 2 or 3 Rooms | 0 (0.0%) | 8 (9.0%) |
| 4 or 5 Rooms | 38 (21.5%) | 38 (42.7%) |
| 6 or 7 Rooms | 67 (37.9%) | 10 (11.2%) |
| 8 or more Rooms | 72 (40.7%) | 31 (34.8%) |
| Total | 177 (100.0%) | 89 (100.0%) |
Housing Structure by Heating Type in Fairfield borough
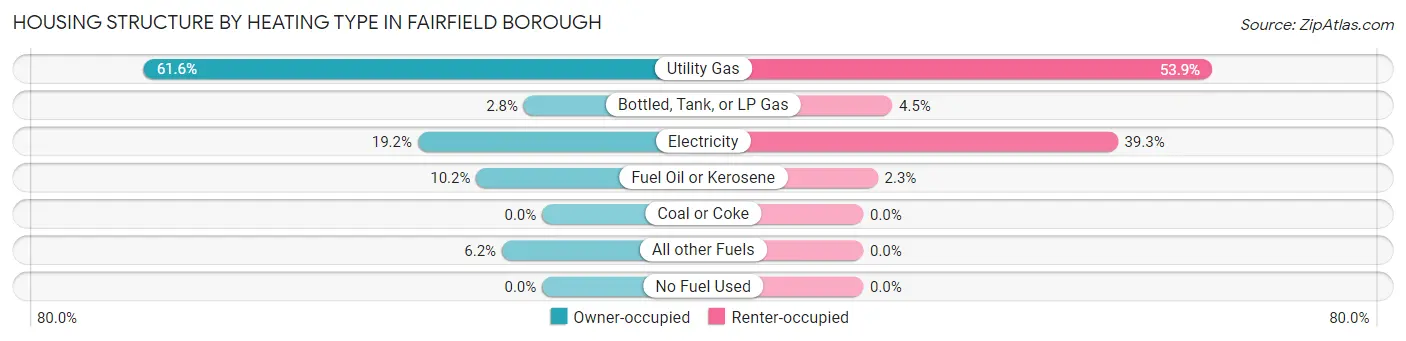
| Heating Type | Owner-occupied | Renter-occupied |
| Utility Gas | 109 (61.6%) | 48 (53.9%) |
| Bottled, Tank, or LP Gas | 5 (2.8%) | 4 (4.5%) |
| Electricity | 34 (19.2%) | 35 (39.3%) |
| Fuel Oil or Kerosene | 18 (10.2%) | 2 (2.2%) |
| Coal or Coke | 0 (0.0%) | 0 (0.0%) |
| All other Fuels | 11 (6.2%) | 0 (0.0%) |
| No Fuel Used | 0 (0.0%) | 0 (0.0%) |
| Total | 177 (100.0%) | 89 (100.0%) |
Household Vehicle Usage in Fairfield borough
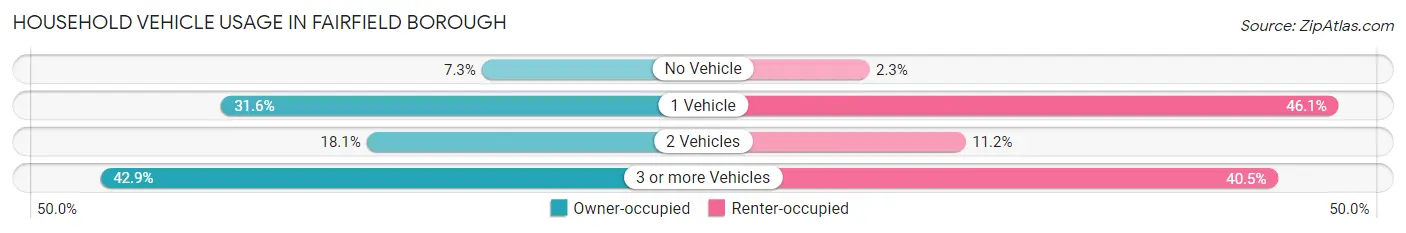
| Vehicles per Household | Owner-occupied | Renter-occupied |
| No Vehicle | 13 (7.3%) | 2 (2.2%) |
| 1 Vehicle | 56 (31.6%) | 41 (46.1%) |
| 2 Vehicles | 32 (18.1%) | 10 (11.2%) |
| 3 or more Vehicles | 76 (42.9%) | 36 (40.5%) |
| Total | 177 (100.0%) | 89 (100.0%) |
Real Estate & Mortgages in Fairfield borough
Real Estate and Mortgage Overview in Fairfield borough
| Characteristic | Without Mortgage | With Mortgage |
| Housing Units | 99 | 78 |
| Median Property Value | $226,300 | $206,300 |
| Median Household Income | $56,563 | $27 |
| Monthly Housing Costs | $670 | $9 |
| Real Estate Taxes | $3,068 | $0 |
Property Value by Mortgage Status in Fairfield borough
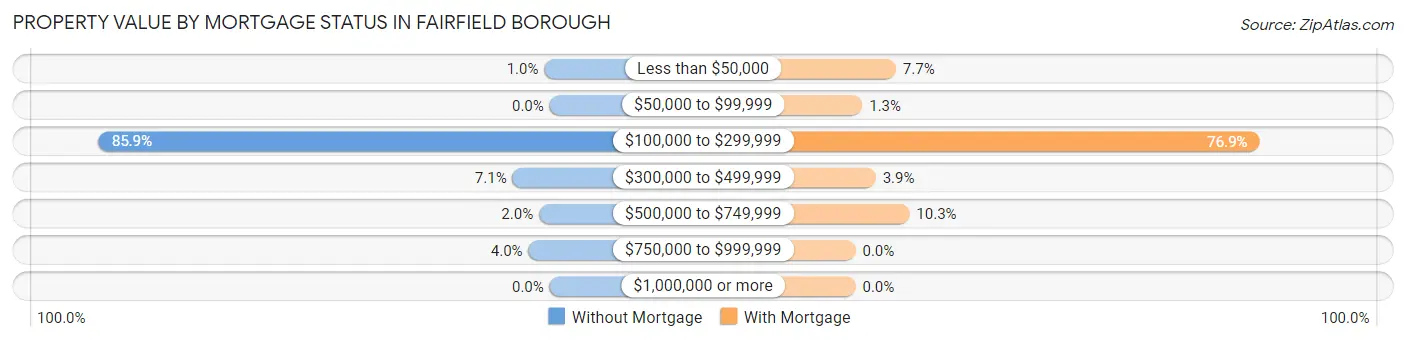
| Property Value | Without Mortgage | With Mortgage |
| Less than $50,000 | 1 (1.0%) | 6 (7.7%) |
| $50,000 to $99,999 | 0 (0.0%) | 1 (1.3%) |
| $100,000 to $299,999 | 85 (85.9%) | 60 (76.9%) |
| $300,000 to $499,999 | 7 (7.1%) | 3 (3.8%) |
| $500,000 to $749,999 | 2 (2.0%) | 8 (10.3%) |
| $750,000 to $999,999 | 4 (4.0%) | 0 (0.0%) |
| $1,000,000 or more | 0 (0.0%) | 0 (0.0%) |
| Total | 99 (100.0%) | 78 (100.0%) |
Household Income by Mortgage Status in Fairfield borough
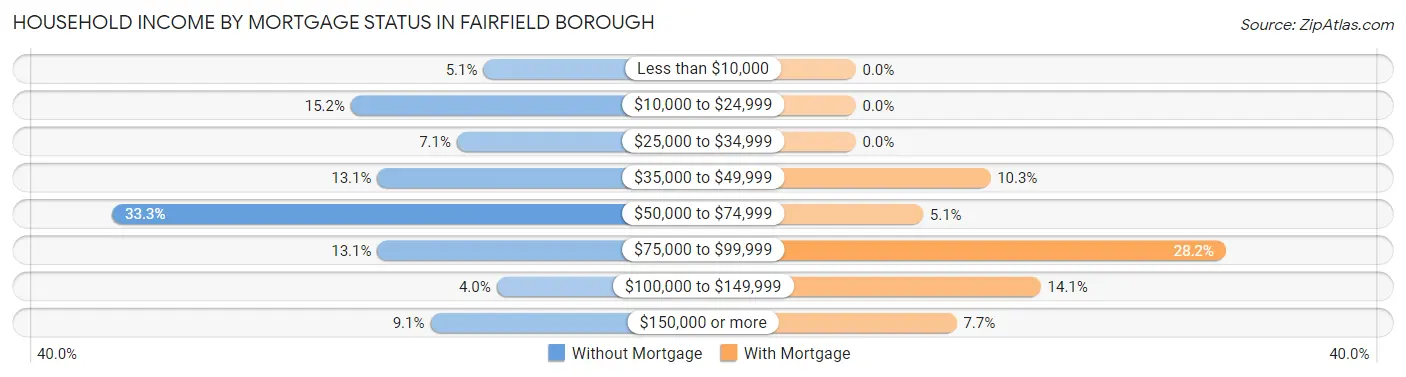
| Household Income | Without Mortgage | With Mortgage |
| Less than $10,000 | 5 (5.1%) | 0 (0.0%) |
| $10,000 to $24,999 | 15 (15.1%) | 0 (0.0%) |
| $25,000 to $34,999 | 7 (7.1%) | 0 (0.0%) |
| $35,000 to $49,999 | 13 (13.1%) | 8 (10.3%) |
| $50,000 to $74,999 | 33 (33.3%) | 4 (5.1%) |
| $75,000 to $99,999 | 13 (13.1%) | 22 (28.2%) |
| $100,000 to $149,999 | 4 (4.0%) | 11 (14.1%) |
| $150,000 or more | 9 (9.1%) | 6 (7.7%) |
| Total | 99 (100.0%) | 78 (100.0%) |
Property Value to Household Income Ratio in Fairfield borough
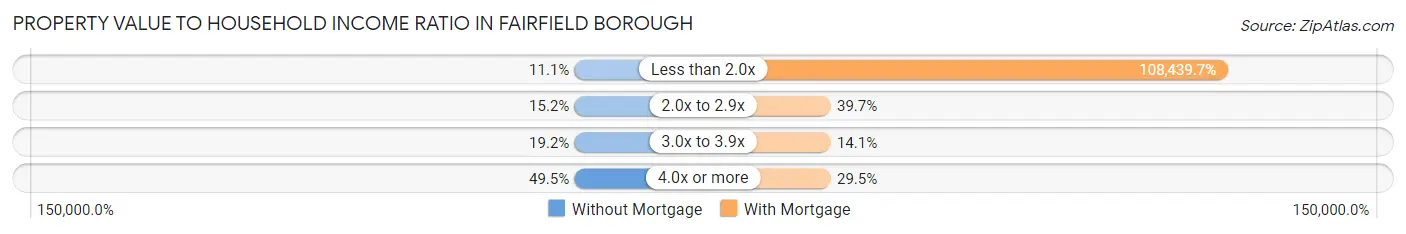
| Value-to-Income Ratio | Without Mortgage | With Mortgage |
| Less than 2.0x | 11 (11.1%) | 84,583 (108,439.7%) |
| 2.0x to 2.9x | 15 (15.1%) | 31 (39.7%) |
| 3.0x to 3.9x | 19 (19.2%) | 11 (14.1%) |
| 4.0x or more | 49 (49.5%) | 23 (29.5%) |
| Total | 99 (100.0%) | 78 (100.0%) |
Real Estate Taxes by Mortgage Status in Fairfield borough
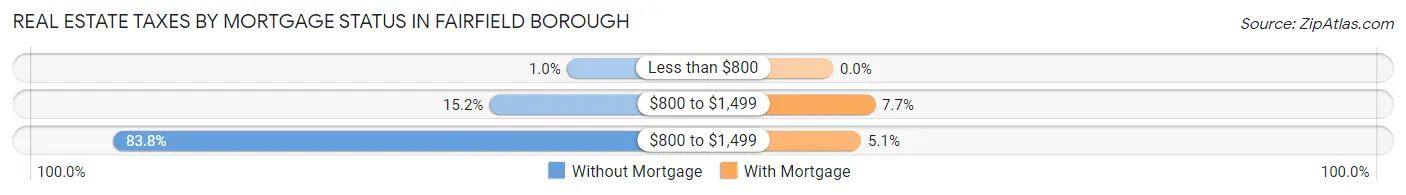
| Property Taxes | Without Mortgage | With Mortgage |
| Less than $800 | 1 (1.0%) | 0 (0.0%) |
| $800 to $1,499 | 15 (15.1%) | 6 (7.7%) |
| $800 to $1,499 | 83 (83.8%) | 4 (5.1%) |
| Total | 99 (100.0%) | 78 (100.0%) |
Health & Disability in Fairfield borough
Health Insurance Coverage by Age in Fairfield borough
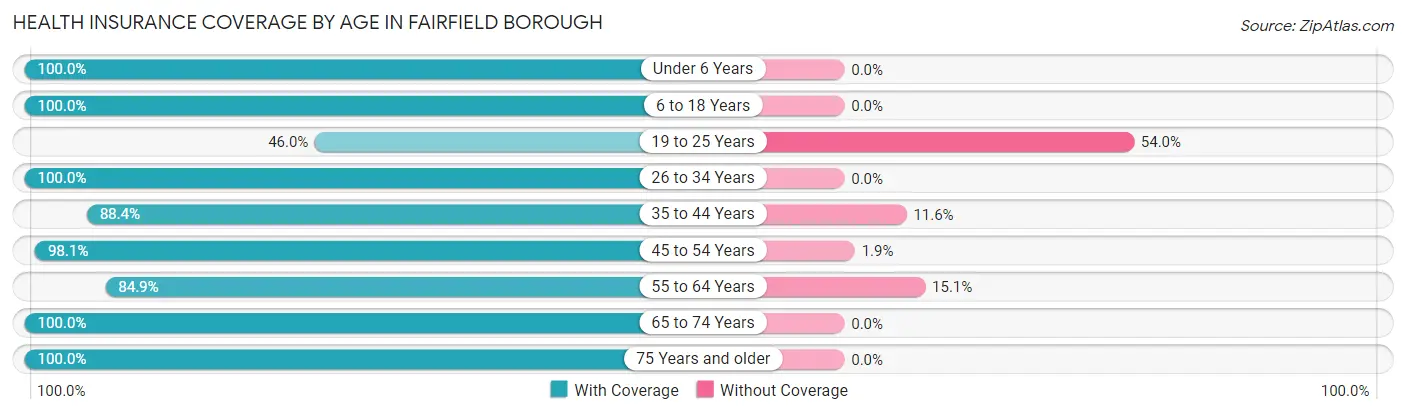
| Age Bracket | With Coverage | Without Coverage |
| Under 6 Years | 27 (100.0%) | 0 (0.0%) |
| 6 to 18 Years | 153 (100.0%) | 0 (0.0%) |
| 19 to 25 Years | 23 (46.0%) | 27 (54.0%) |
| 26 to 34 Years | 39 (100.0%) | 0 (0.0%) |
| 35 to 44 Years | 61 (88.4%) | 8 (11.6%) |
| 45 to 54 Years | 101 (98.1%) | 2 (1.9%) |
| 55 to 64 Years | 62 (84.9%) | 11 (15.1%) |
| 65 to 74 Years | 84 (100.0%) | 0 (0.0%) |
| 75 Years and older | 85 (100.0%) | 0 (0.0%) |
| Total | 635 (93.0%) | 48 (7.0%) |
Health Insurance Coverage by Citizenship Status in Fairfield borough
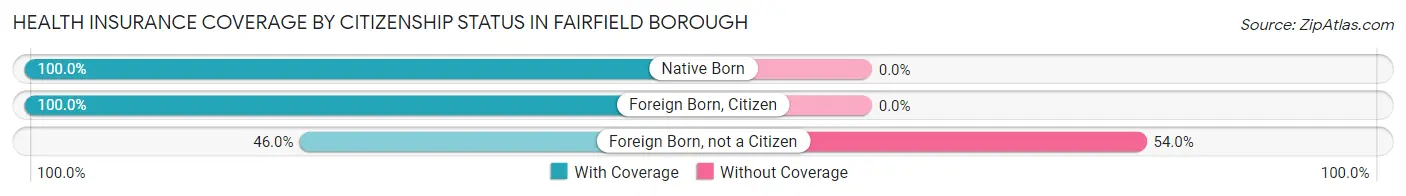
| Citizenship Status | With Coverage | Without Coverage |
| Native Born | 27 (100.0%) | 0 (0.0%) |
| Foreign Born, Citizen | 153 (100.0%) | 0 (0.0%) |
| Foreign Born, not a Citizen | 23 (46.0%) | 27 (54.0%) |
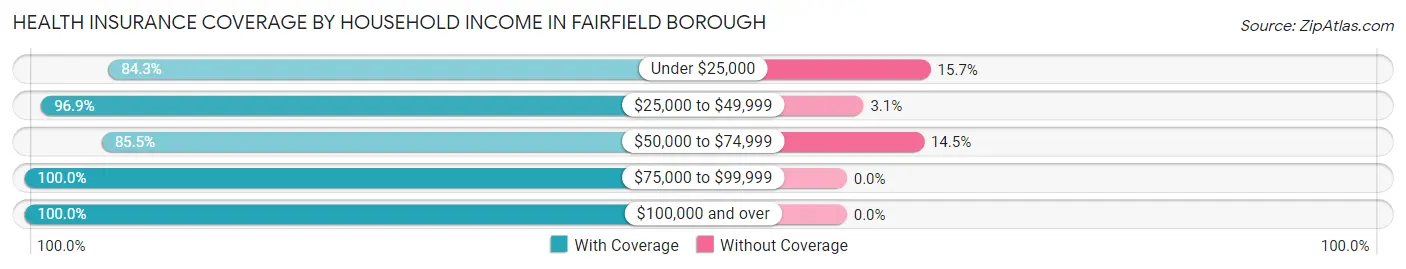
Health Insurance Coverage by Household Income in Fairfield borough
| Household Income | With Coverage | Without Coverage |
| Under $25,000 | 118 (84.3%) | 22 (15.7%) |
| $25,000 to $49,999 | 62 (96.9%) | 2 (3.1%) |
| $50,000 to $74,999 | 142 (85.5%) | 24 (14.5%) |
| $75,000 to $99,999 | 101 (100.0%) | 0 (0.0%) |
| $100,000 and over | 212 (100.0%) | 0 (0.0%) |
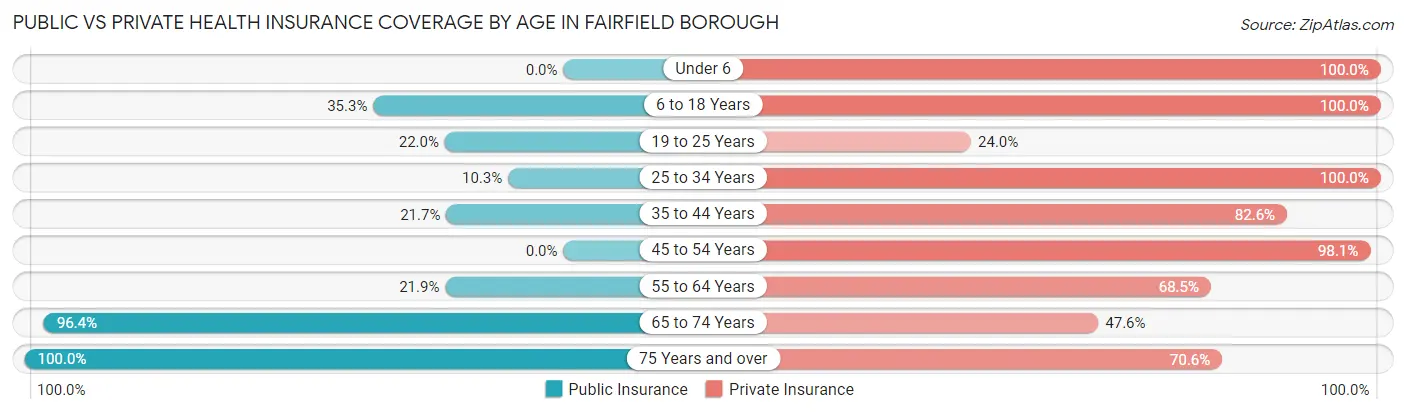
Public vs Private Health Insurance Coverage by Age in Fairfield borough
| Age Bracket | Public Insurance | Private Insurance |
| Under 6 | 0 (0.0%) | 27 (100.0%) |
| 6 to 18 Years | 54 (35.3%) | 153 (100.0%) |
| 19 to 25 Years | 11 (22.0%) | 12 (24.0%) |
| 25 to 34 Years | 4 (10.3%) | 39 (100.0%) |
| 35 to 44 Years | 15 (21.7%) | 57 (82.6%) |
| 45 to 54 Years | 0 (0.0%) | 101 (98.1%) |
| 55 to 64 Years | 16 (21.9%) | 50 (68.5%) |
| 65 to 74 Years | 81 (96.4%) | 40 (47.6%) |
| 75 Years and over | 85 (100.0%) | 60 (70.6%) |
| Total | 266 (39.0%) | 539 (78.9%) |
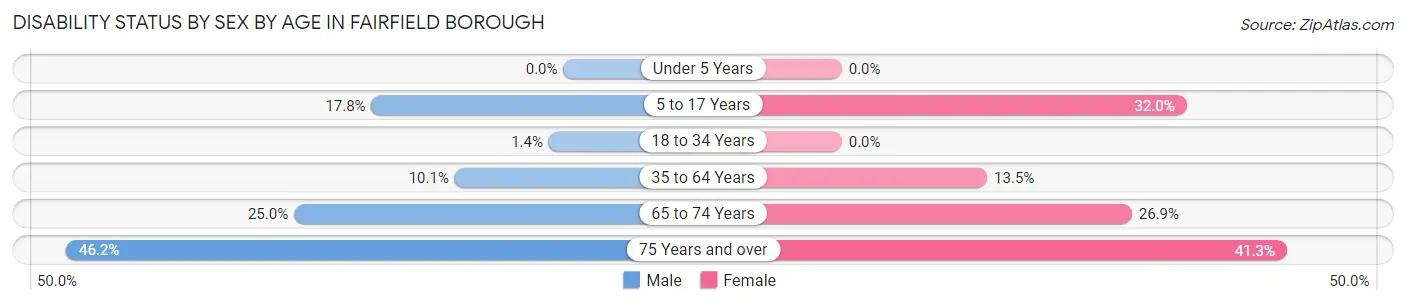
Disability Status by Sex by Age in Fairfield borough
| Age Bracket | Male | Female |
| Under 5 Years | 0 (0.0%) | 0 (0.0%) |
| 5 to 17 Years | 13 (17.8%) | 24 (32.0%) |
| 18 to 34 Years | 1 (1.3%) | 0 (0.0%) |
| 35 to 64 Years | 12 (10.1%) | 17 (13.5%) |
| 65 to 74 Years | 8 (25.0%) | 14 (26.9%) |
| 75 Years and over | 18 (46.2%) | 19 (41.3%) |
Disability Class by Sex by Age in Fairfield borough
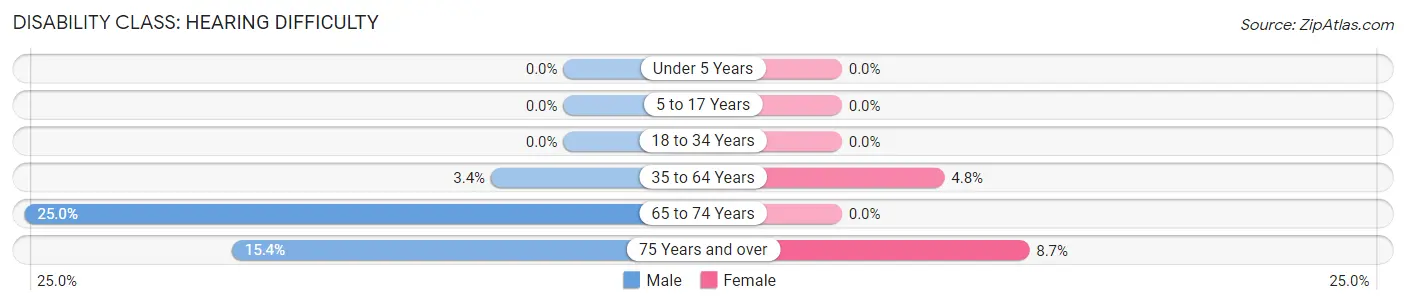
Disability Class: Hearing Difficulty
| Age Bracket | Male | Female |
| Under 5 Years | 0 (0.0%) | 0 (0.0%) |
| 5 to 17 Years | 0 (0.0%) | 0 (0.0%) |
| 18 to 34 Years | 0 (0.0%) | 0 (0.0%) |
| 35 to 64 Years | 4 (3.4%) | 6 (4.8%) |
| 65 to 74 Years | 8 (25.0%) | 0 (0.0%) |
| 75 Years and over | 6 (15.4%) | 4 (8.7%) |
Disability Class: Vision Difficulty
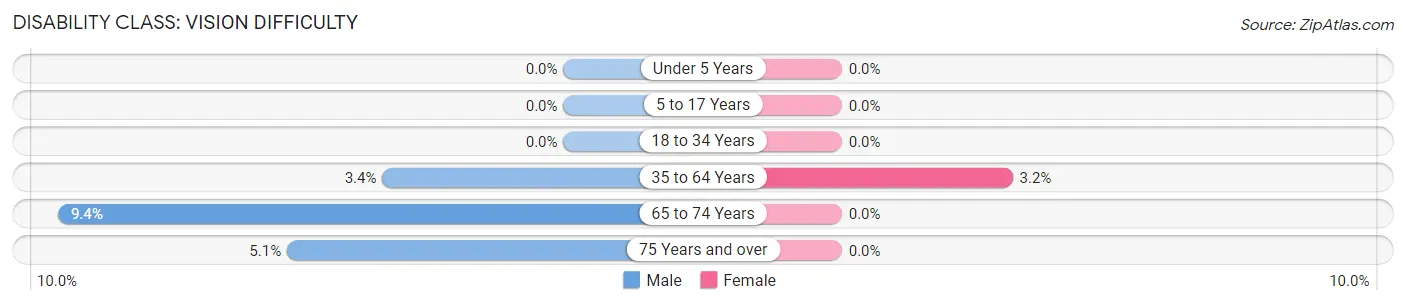
| Age Bracket | Male | Female |
| Under 5 Years | 0 (0.0%) | 0 (0.0%) |
| 5 to 17 Years | 0 (0.0%) | 0 (0.0%) |
| 18 to 34 Years | 0 (0.0%) | 0 (0.0%) |
| 35 to 64 Years | 4 (3.4%) | 4 (3.2%) |
| 65 to 74 Years | 3 (9.4%) | 0 (0.0%) |
| 75 Years and over | 2 (5.1%) | 0 (0.0%) |
Disability Class: Cognitive Difficulty
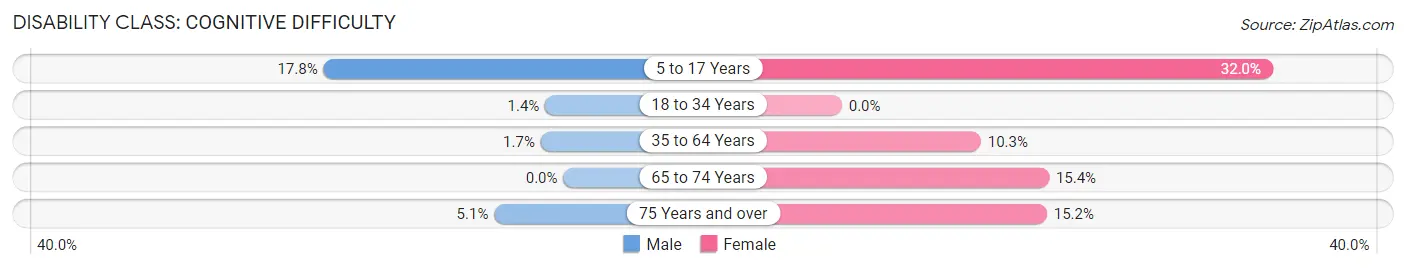
| Age Bracket | Male | Female |
| 5 to 17 Years | 13 (17.8%) | 24 (32.0%) |
| 18 to 34 Years | 1 (1.3%) | 0 (0.0%) |
| 35 to 64 Years | 2 (1.7%) | 13 (10.3%) |
| 65 to 74 Years | 0 (0.0%) | 8 (15.4%) |
| 75 Years and over | 2 (5.1%) | 7 (15.2%) |
Disability Class: Ambulatory Difficulty
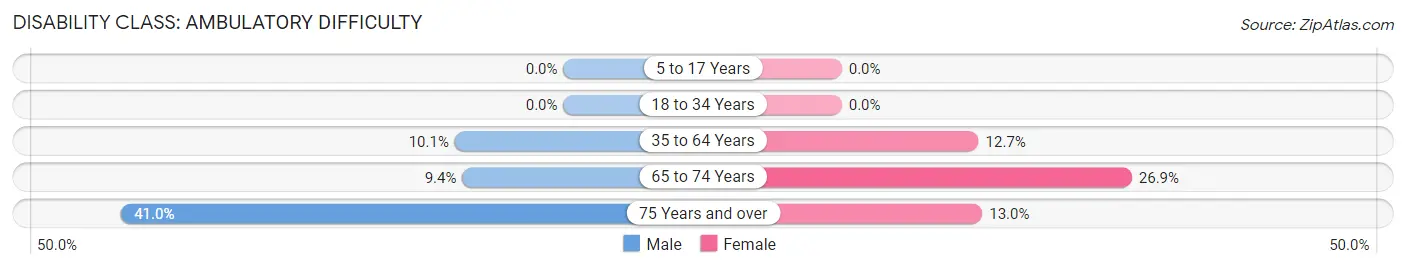
| Age Bracket | Male | Female |
| 5 to 17 Years | 0 (0.0%) | 0 (0.0%) |
| 18 to 34 Years | 0 (0.0%) | 0 (0.0%) |
| 35 to 64 Years | 12 (10.1%) | 16 (12.7%) |
| 65 to 74 Years | 3 (9.4%) | 14 (26.9%) |
| 75 Years and over | 16 (41.0%) | 6 (13.0%) |
Disability Class: Self-Care Difficulty
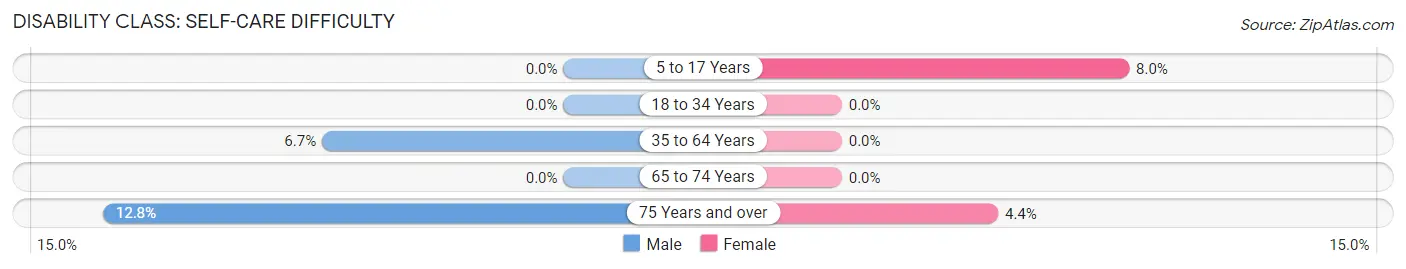
| Age Bracket | Male | Female |
| 5 to 17 Years | 0 (0.0%) | 6 (8.0%) |
| 18 to 34 Years | 0 (0.0%) | 0 (0.0%) |
| 35 to 64 Years | 8 (6.7%) | 0 (0.0%) |
| 65 to 74 Years | 0 (0.0%) | 0 (0.0%) |
| 75 Years and over | 5 (12.8%) | 2 (4.3%) |
Technology Access in Fairfield borough
Computing Device Access in Fairfield borough
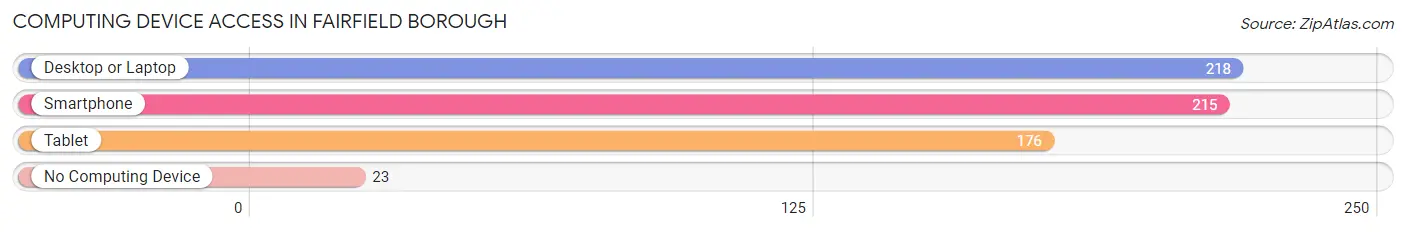
| Device Type | # Households | % Households |
| Desktop or Laptop | 218 | 82.0% |
| Smartphone | 215 | 80.8% |
| Tablet | 176 | 66.2% |
| No Computing Device | 23 | 8.6% |
| Total | 266 | 100.0% |
Internet Access in Fairfield borough
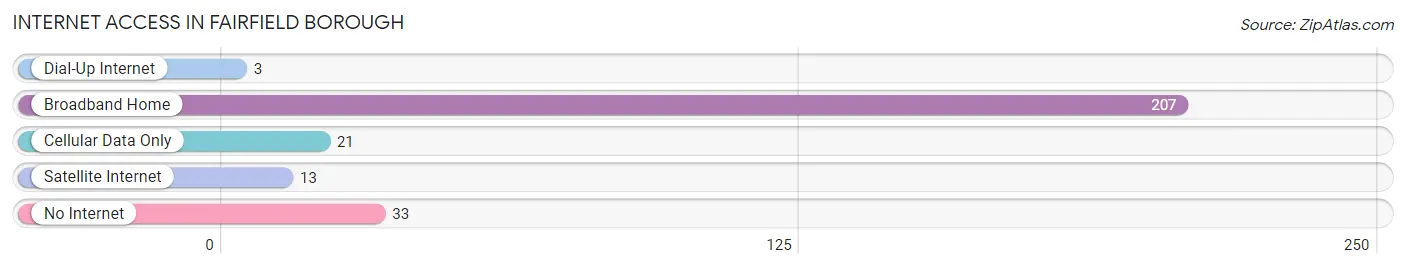
| Internet Type | # Households | % Households |
| Dial-Up Internet | 3 | 1.1% |
| Broadband Home | 207 | 77.8% |
| Cellular Data Only | 21 | 7.9% |
| Satellite Internet | 13 | 4.9% |
| No Internet | 33 | 12.4% |
| Total | 266 | 100.0% |
Fairfield borough Summary
Fairfield Borough is a small borough located in Adams County, Pennsylvania. It is situated in the south-central part of the state, approximately 20 miles west of Gettysburg. The borough is bordered by the townships of Cumberland, Straban, and Mount Pleasant. According to the 2010 census, the population of Fairfield Borough was 1,845.
History
Fairfield Borough was founded in 1790 by a group of settlers from Maryland. The town was originally known as “Fairfield Crossroads” due to its location at the intersection of two major roads. The town was officially incorporated in 1845 and was named after the nearby Fairfield Inn.
The town was an important stop on the Underground Railroad, with many of the town’s residents helping to hide and transport escaped slaves. During the Civil War, the town was the site of a major battle between Union and Confederate forces.
Geography
Fairfield Borough is located in south-central Pennsylvania, approximately 20 miles west of Gettysburg. The borough is situated in the Cumberland Valley, which is part of the Appalachian Mountains. The borough is bordered by the townships of Cumberland, Straban, and Mount Pleasant.
The borough is located at an elevation of 590 feet above sea level. The terrain is mostly rolling hills, with some flat areas. The climate is temperate, with hot summers and cold winters.
Economy
The economy of Fairfield Borough is largely based on agriculture and tourism. The town is home to several farms, which produce a variety of crops, including corn, wheat, and hay. The town is also home to several wineries, which produce a variety of wines.
The town is also a popular tourist destination, with many visitors coming to explore the town’s historic sites and enjoy the scenic views. The town is home to several bed and breakfasts, as well as a variety of restaurants and shops.
Demographics
According to the 2010 census, the population of Fairfield Borough was 1,845. The population is predominantly white (94.3%), with a small percentage of African Americans (2.2%) and Hispanics (2.2%). The median household income is $45,000, and the median age is 43.
The town is home to several churches, including the Fairfield United Methodist Church, the Fairfield Presbyterian Church, and the Fairfield Baptist Church. The town is also home to a variety of businesses, including a grocery store, a hardware store, and a pharmacy.
Conclusion
Fairfield Borough is a small borough located in Adams County, Pennsylvania. It is situated in the south-central part of the state, approximately 20 miles west of Gettysburg. The borough is bordered by the townships of Cumberland, Straban, and Mount Pleasant. According to the 2010 census, the population of Fairfield Borough was 1,845. The economy of Fairfield Borough is largely based on agriculture and tourism, and the population is predominantly white. The town is home to several churches, businesses, and historic sites, making it a popular tourist destination.
Common Questions
What is Per Capita Income in Fairfield borough?
Per Capita income in Fairfield borough is $29,324.
What is the Median Family Income in Fairfield borough?
Median Family Income in Fairfield borough is $67,679.
What is the Median Household income in Fairfield borough?
Median Household Income in Fairfield borough is $61,071.
What is Income or Wage Gap in Fairfield borough?
Income or Wage Gap in Fairfield borough is 36.4%.
Women in Fairfield borough earn 63.6 cents for every dollar earned by a man.
What is Inequality or Gini Index in Fairfield borough?
Inequality or Gini Index in Fairfield borough is 0.41.
What is the Total Population of Fairfield borough?
Total Population of Fairfield borough is 683.
What is the Total Male Population of Fairfield borough?
Total Male Population of Fairfield borough is 352.
What is the Total Female Population of Fairfield borough?
Total Female Population of Fairfield borough is 331.
What is the Ratio of Males per 100 Females in Fairfield borough?
There are 106.34 Males per 100 Females in Fairfield borough.
What is the Ratio of Females per 100 Males in Fairfield borough?
There are 94.03 Females per 100 Males in Fairfield borough.
What is the Median Population Age in Fairfield borough?
Median Population Age in Fairfield borough is 45.6 Years.
What is the Average Family Size in Fairfield borough
Average Family Size in Fairfield borough is 3.4 People.
What is the Average Household Size in Fairfield borough
Average Household Size in Fairfield borough is 2.6 People.
How Large is the Labor Force in Fairfield borough?
There are 280 People in the Labor Forcein in Fairfield borough.
What is the Percentage of People in the Labor Force in Fairfield borough?
49.0% of People are in the Labor Force in Fairfield borough.
What is the Unemployment Rate in Fairfield borough?
Unemployment Rate in Fairfield borough is 3.9%.