Zip Codes with the Highest Percentage of Families with Income Below $10,000 in Pittston, PA
RELATED REPORTS & OPTIONS
Family Income | $0-10k
Pittston
Compare Zip Codes
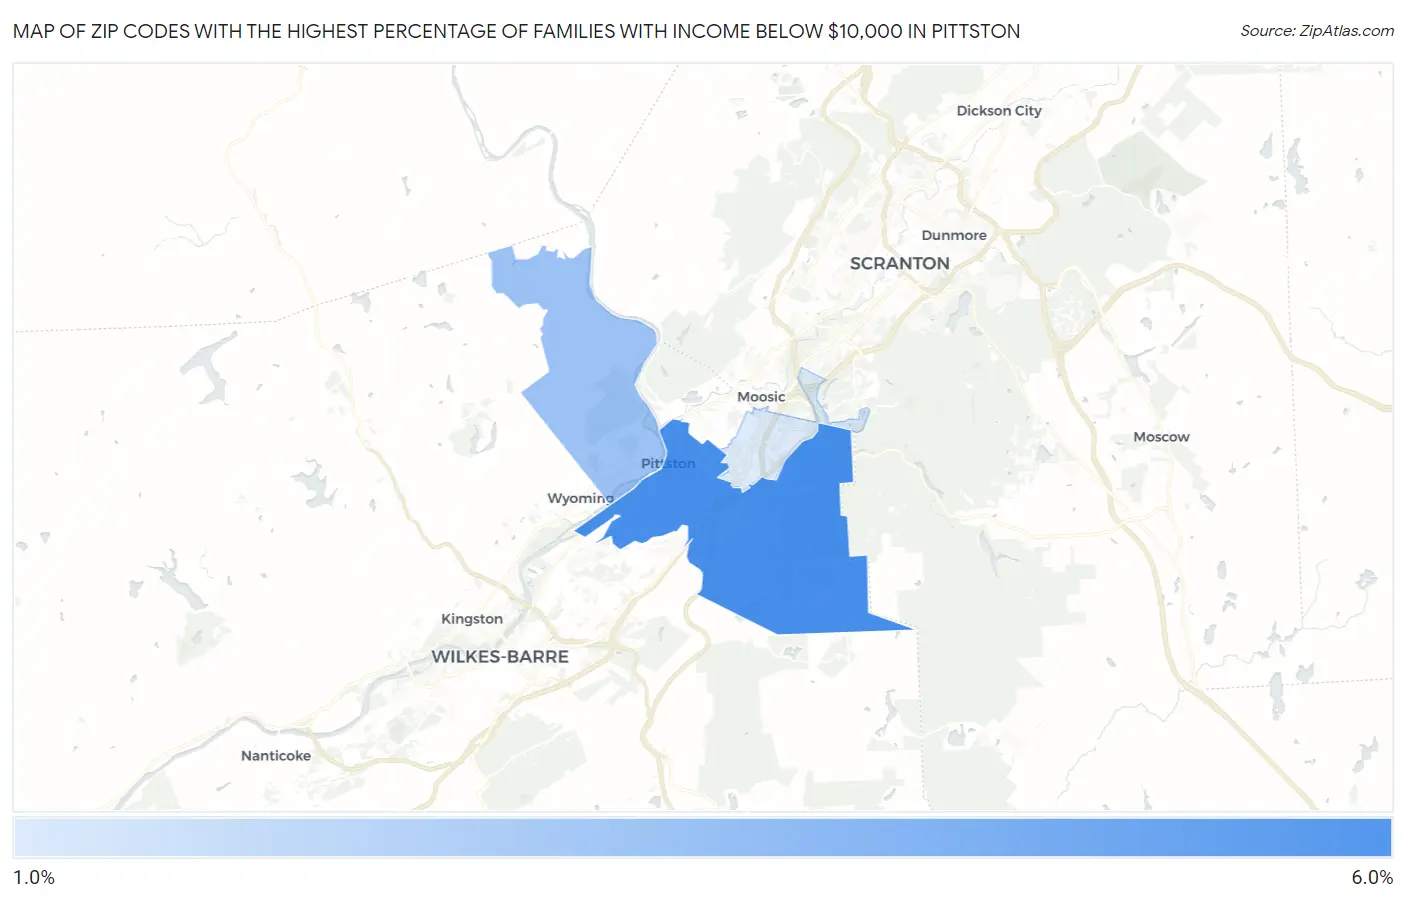
Map of Zip Codes with the Highest Percentage of Families with Income Below $10,000 in Pittston
1.3%
5.6%
Zip Codes with the Highest Percentage of Families with Income Below $10,000 in Pittston, PA
| Zip Code | Families with Income < $10k | vs State | vs National | |
| 1. | 18640 | 5.6% | 2.9%(+2.70)#197 | 3.1%(+2.50)#5,183 |
| 2. | 18643 | 3.1% | 2.9%(+0.200)#471 | 3.1%(=0.000)#10,885 |
| 3. | 18641 | 1.3% | 2.9%(-1.60)#938 | 3.1%(-1.80)#18,922 |
1
Common Questions
What are the Top Zip Codes with the Highest Percentage of Families with Income Below $10,000 in Pittston, PA?
Top Zip Codes with the Highest Percentage of Families with Income Below $10,000 in Pittston, PA are:
What zip code has the Highest Percentage of Families with Income Below $10,000 in Pittston, PA?
18640 has the Highest Percentage of Families with Income Below $10,000 in Pittston, PA with 5.6%.
What is the Percentage of Families with Income Below $10,000 in Pittston, PA?
Percentage of Families with Income Below $10,000 in Pittston is 11.7%.
What is the Percentage of Families with Income Below $10,000 in Pennsylvania?
Percentage of Families with Income Below $10,000 in Pennsylvania is 2.9%.
What is the Percentage of Families with Income Below $10,000 in the United States?
Percentage of Families with Income Below $10,000 in the United States is 3.1%.