Beaver Falls, PA Map & Demographics
Beaver Falls Map
Beaver Falls Overview
$20,070
PER CAPITA INCOME
$55,040
AVG FAMILY INCOME
$39,194
AVG HOUSEHOLD INCOME
26.8%
WAGE / INCOME GAP [ % ]
73.2¢/ $1
WAGE / INCOME GAP [ $ ]
0.45
INEQUALITY / GINI INDEX
8,934
TOTAL POPULATION
4,186
MALE POPULATION
4,748
FEMALE POPULATION
88.16
MALES / 100 FEMALES
113.43
FEMALES / 100 MALES
32.2
MEDIAN AGE
3.1
AVG FAMILY SIZE
2.3
AVG HOUSEHOLD SIZE
4,237
LABOR FORCE [ PEOPLE ]
59.9%
PERCENT IN LABOR FORCE
11.5%
UNEMPLOYMENT RATE
Beaver Falls Zip Codes
Income in Beaver Falls
Income Overview in Beaver Falls
Per Capita Income in Beaver Falls is $20,070, while median incomes of families and households are $55,040 and $39,194 respectively.
| Characteristic | Number | Measure |
| Per Capita Income | 8,934 | $20,070 |
| Median Family Income | 1,797 | $55,040 |
| Mean Family Income | 1,797 | $60,622 |
| Median Household Income | 3,484 | $39,194 |
| Mean Household Income | 3,484 | $48,714 |
| Income Deficit | 1,797 | $0 |
| Wage / Income Gap (%) | 8,934 | 26.85% |
| Wage / Income Gap ($) | 8,934 | 73.15¢ per $1 |
| Gini / Inequality Index | 8,934 | 0.45 |
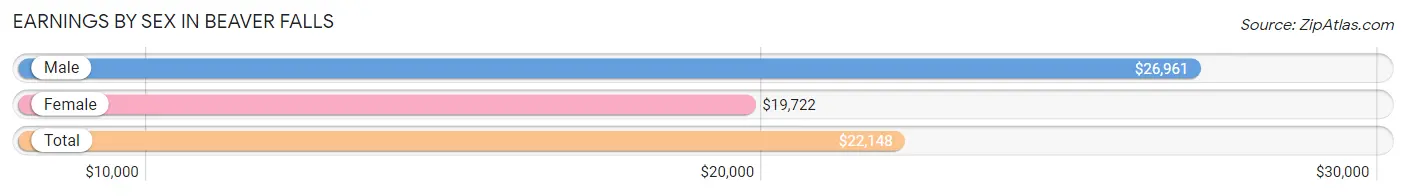
Earnings by Sex in Beaver Falls
Average Earnings in Beaver Falls are $22,148, $26,961 for men and $19,722 for women, a difference of 26.9%.
| Sex | Number | Average Earnings |
| Male | 2,093 (48.4%) | $26,961 |
| Female | 2,232 (51.6%) | $19,722 |
| Total | 4,325 (100.0%) | $22,148 |
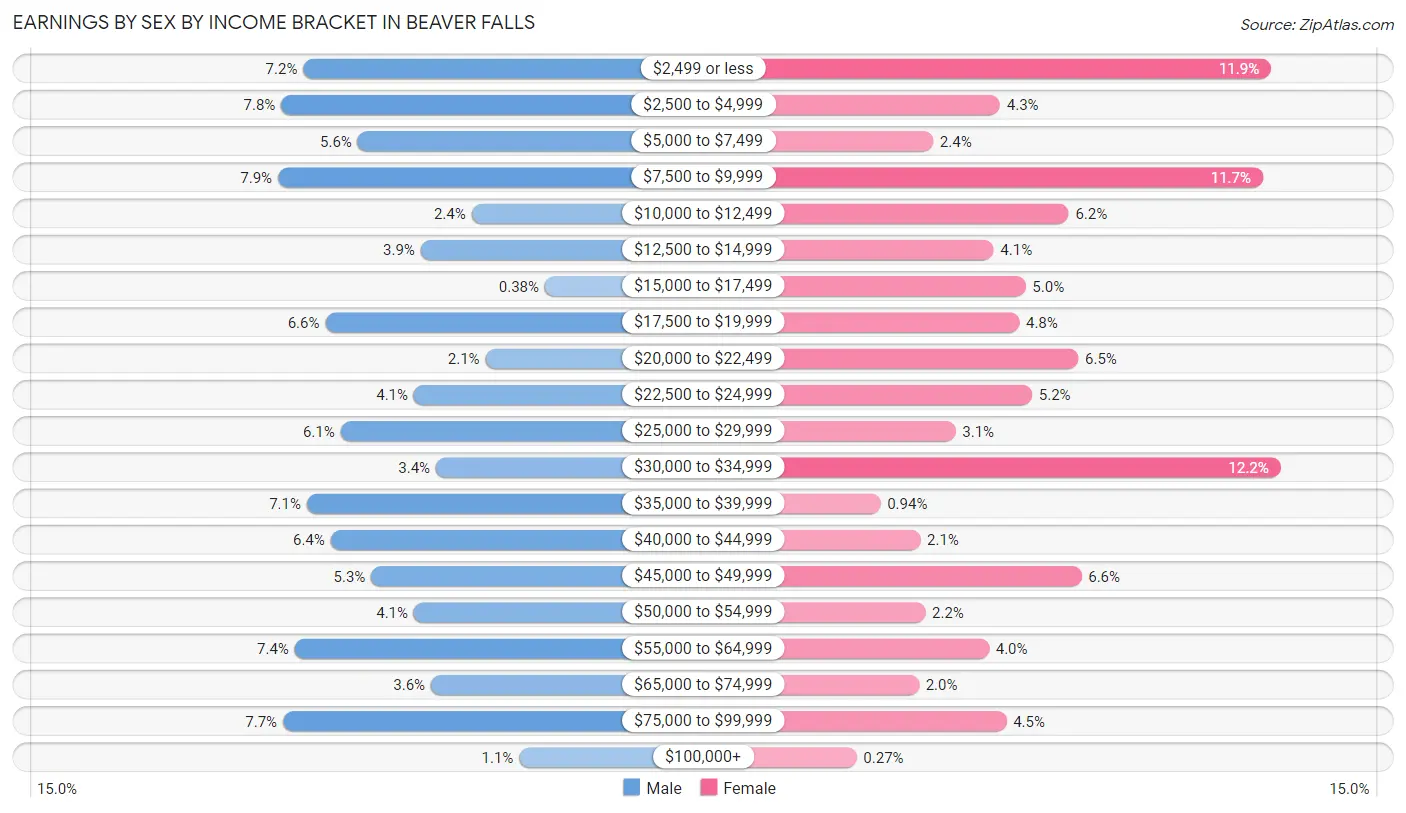
Earnings by Sex by Income Bracket in Beaver Falls
The most common earnings brackets in Beaver Falls are $7,500 to $9,999 for men (165 | 7.9%) and $30,000 to $34,999 for women (272 | 12.2%).
| Income | Male | Female |
| $2,499 or less | 150 (7.2%) | 266 (11.9%) |
| $2,500 to $4,999 | 163 (7.8%) | 96 (4.3%) |
| $5,000 to $7,499 | 118 (5.6%) | 54 (2.4%) |
| $7,500 to $9,999 | 165 (7.9%) | 261 (11.7%) |
| $10,000 to $12,499 | 51 (2.4%) | 139 (6.2%) |
| $12,500 to $14,999 | 81 (3.9%) | 92 (4.1%) |
| $15,000 to $17,499 | 8 (0.4%) | 112 (5.0%) |
| $17,500 to $19,999 | 137 (6.6%) | 108 (4.8%) |
| $20,000 to $22,499 | 43 (2.1%) | 145 (6.5%) |
| $22,500 to $24,999 | 85 (4.1%) | 116 (5.2%) |
| $25,000 to $29,999 | 128 (6.1%) | 68 (3.0%) |
| $30,000 to $34,999 | 72 (3.4%) | 272 (12.2%) |
| $35,000 to $39,999 | 148 (7.1%) | 21 (0.9%) |
| $40,000 to $44,999 | 134 (6.4%) | 46 (2.1%) |
| $45,000 to $49,999 | 110 (5.3%) | 147 (6.6%) |
| $50,000 to $54,999 | 85 (4.1%) | 49 (2.2%) |
| $55,000 to $64,999 | 155 (7.4%) | 89 (4.0%) |
| $65,000 to $74,999 | 75 (3.6%) | 45 (2.0%) |
| $75,000 to $99,999 | 162 (7.7%) | 100 (4.5%) |
| $100,000+ | 23 (1.1%) | 6 (0.3%) |
| Total | 2,093 (100.0%) | 2,232 (100.0%) |
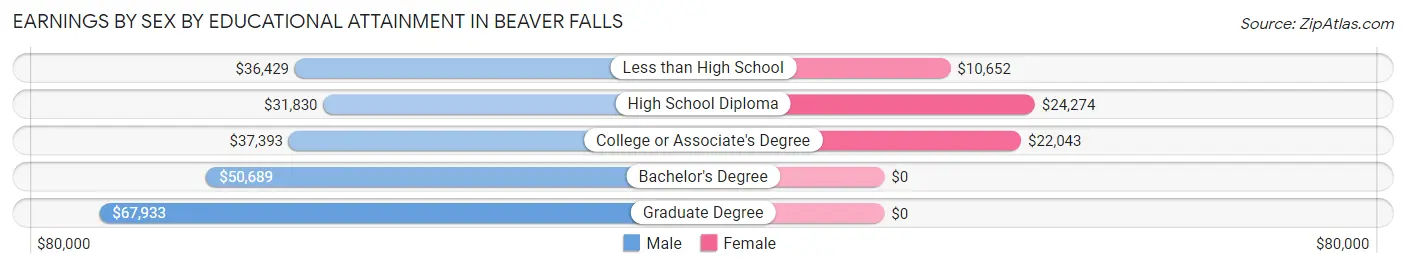
Earnings by Sex by Educational Attainment in Beaver Falls
Average earnings in Beaver Falls are $39,245 for men and $24,071 for women, a difference of 38.7%. Men with an educational attainment of graduate degree enjoy the highest average annual earnings of $67,933, while those with high school diploma education earn the least with $31,830. Women with an educational attainment of high school diploma earn the most with the average annual earnings of $24,274, while those with less than high school education have the smallest earnings of $10,652.
| Educational Attainment | Male Income | Female Income |
| Less than High School | $36,429 | $10,652 |
| High School Diploma | $31,830 | $24,274 |
| College or Associate's Degree | $37,393 | $22,043 |
| Bachelor's Degree | $50,689 | $0 |
| Graduate Degree | $67,933 | $0 |
| Total | $39,245 | $24,071 |
Family Income in Beaver Falls
Family Income Brackets in Beaver Falls
According to the Beaver Falls family income data, there are 420 families falling into the $50,000 to $74,999 income range, which is the most common income bracket and makes up 23.4% of all families. Conversely, the $150,000 to $199,999 income bracket is the least frequent group with only 23 families (1.3%) belonging to this category.
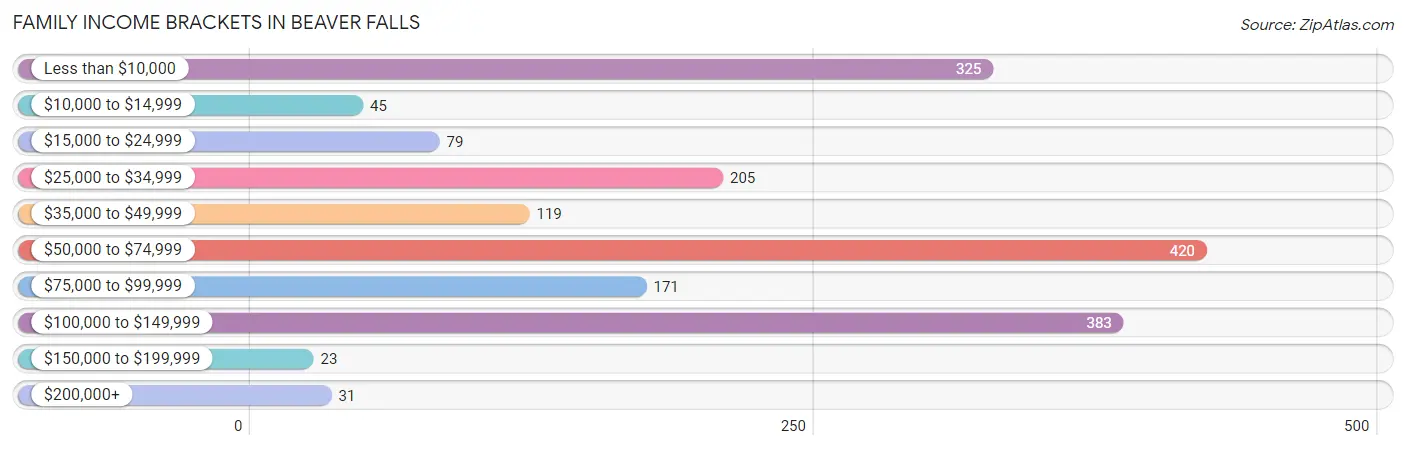
| Income Bracket | # Families | % Families |
| Less than $10,000 | 325 | 18.1% |
| $10,000 to $14,999 | 45 | 2.5% |
| $15,000 to $24,999 | 79 | 4.4% |
| $25,000 to $34,999 | 205 | 11.4% |
| $35,000 to $49,999 | 119 | 6.6% |
| $50,000 to $74,999 | 420 | 23.4% |
| $75,000 to $99,999 | 171 | 9.5% |
| $100,000 to $149,999 | 383 | 21.3% |
| $150,000 to $199,999 | 23 | 1.3% |
| $200,000+ | 31 | 1.7% |
Family Income by Famaliy Size in Beaver Falls
3-person families (433 | 24.1%) account for the highest median family income in Beaver Falls with $68,958 per family, while 2-person families (696 | 38.7%) have the highest median income of $27,386 per family member.
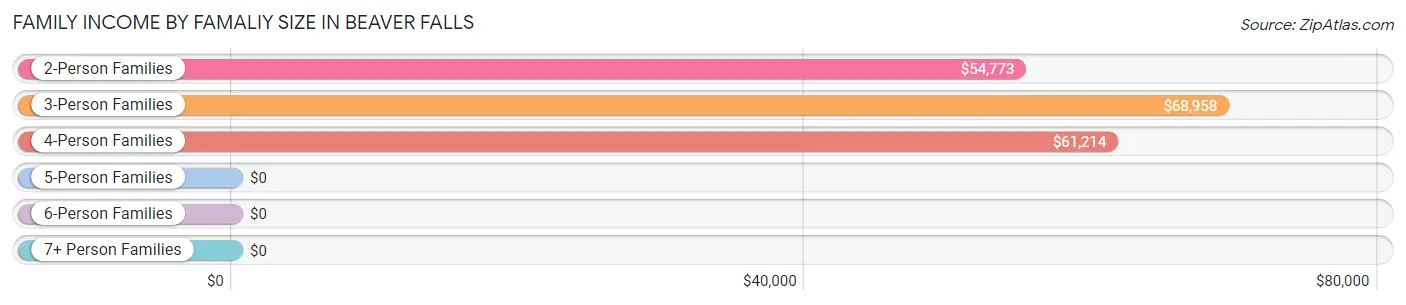
| Income Bracket | # Families | Median Income |
| 2-Person Families | 696 (38.7%) | $54,773 |
| 3-Person Families | 433 (24.1%) | $68,958 |
| 4-Person Families | 292 (16.3%) | $61,214 |
| 5-Person Families | 316 (17.6%) | $0 |
| 6-Person Families | 60 (3.3%) | $0 |
| 7+ Person Families | 0 (0.0%) | $0 |
| Total | 1,797 (100.0%) | $55,040 |
Family Income by Number of Earners in Beaver Falls
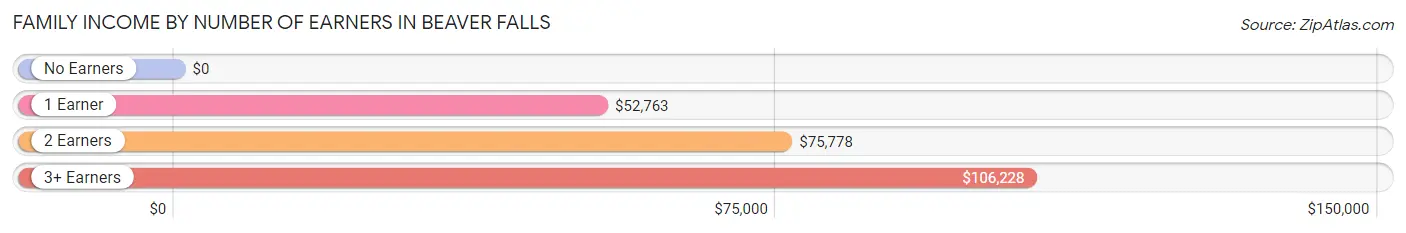
| Number of Earners | # Families | Median Income |
| No Earners | 406 (22.6%) | $0 |
| 1 Earner | 664 (36.9%) | $52,763 |
| 2 Earners | 591 (32.9%) | $75,778 |
| 3+ Earners | 136 (7.6%) | $106,228 |
| Total | 1,797 (100.0%) | $55,040 |
Household Income in Beaver Falls
Household Income Brackets in Beaver Falls
With 606 households falling in the category, the $50,000 to $74,999 income range is the most frequent in Beaver Falls, accounting for 17.4% of all households. In contrast, only 31 households (0.9%) fall into the $200,000+ income bracket, making it the least populous group.
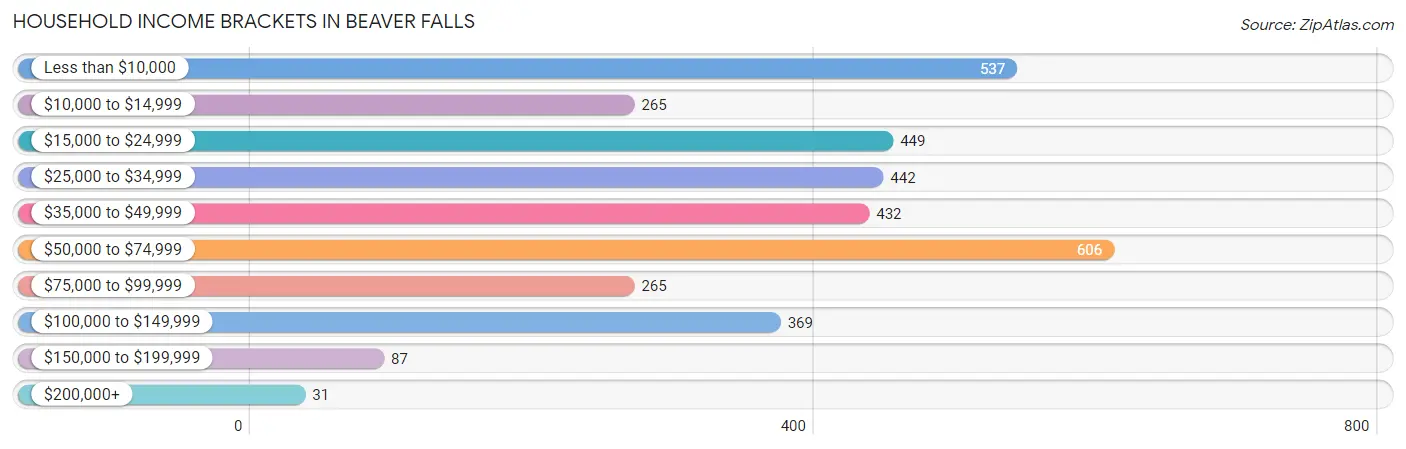
| Income Bracket | # Households | % Households |
| Less than $10,000 | 537 | 15.4% |
| $10,000 to $14,999 | 265 | 7.6% |
| $15,000 to $24,999 | 449 | 12.9% |
| $25,000 to $34,999 | 442 | 12.7% |
| $35,000 to $49,999 | 432 | 12.4% |
| $50,000 to $74,999 | 606 | 17.4% |
| $75,000 to $99,999 | 265 | 7.6% |
| $100,000 to $149,999 | 369 | 10.6% |
| $150,000 to $199,999 | 87 | 2.5% |
| $200,000+ | 31 | 0.9% |
Household Income by Householder Age in Beaver Falls
The median household income in Beaver Falls is $39,194, with the highest median household income of $46,250 found in the 45 to 64 years age bracket for the primary householder. A total of 1,210 households (34.7%) fall into this category. Meanwhile, the 15 to 24 years age bracket for the primary householder has the lowest median household income of $0, with 238 households (6.8%) in this group.
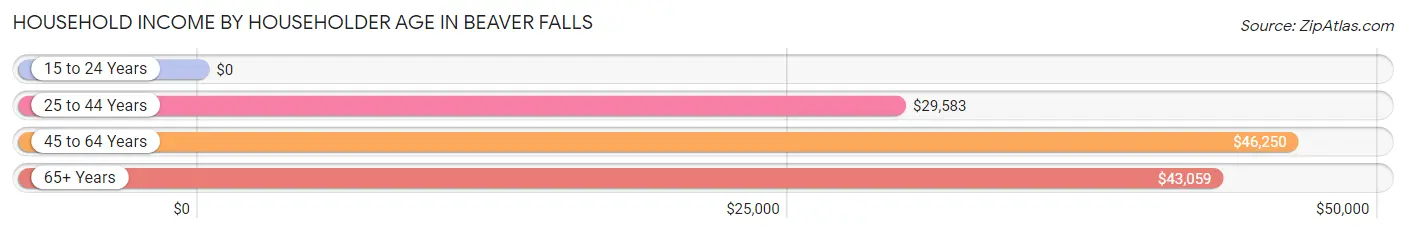
| Income Bracket | # Households | Median Income |
| 15 to 24 Years | 238 (6.8%) | $0 |
| 25 to 44 Years | 1,039 (29.8%) | $29,583 |
| 45 to 64 Years | 1,210 (34.7%) | $46,250 |
| 65+ Years | 997 (28.6%) | $43,059 |
| Total | 3,484 (100.0%) | $39,194 |
Poverty in Beaver Falls
Income Below Poverty by Sex and Age in Beaver Falls
With 23.2% poverty level for males and 30.0% for females among the residents of Beaver Falls, 6 to 11 year old males and under 5 year old females are the most vulnerable to poverty, with 233 males (68.9%) and 231 females (68.8%) in their respective age groups living below the poverty level.
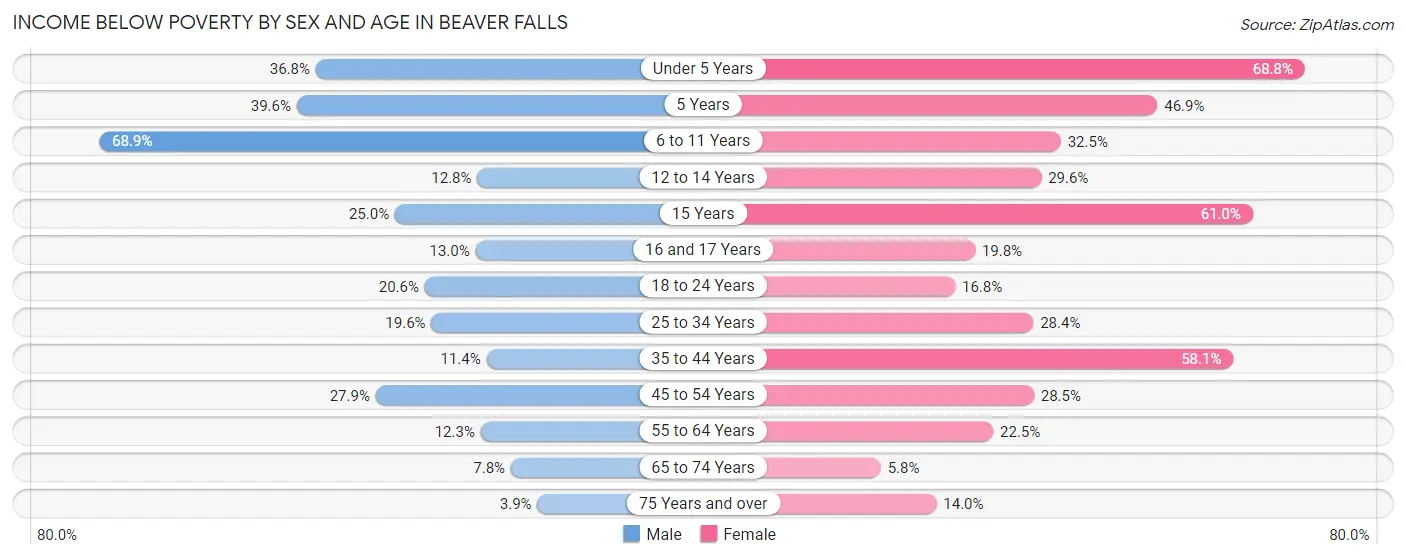
| Age Bracket | Male | Female |
| Under 5 Years | 129 (36.7%) | 231 (68.8%) |
| 5 Years | 19 (39.6%) | 52 (46.9%) |
| 6 to 11 Years | 233 (68.9%) | 79 (32.5%) |
| 12 to 14 Years | 12 (12.8%) | 45 (29.6%) |
| 15 Years | 22 (25.0%) | 36 (61.0%) |
| 16 and 17 Years | 18 (13.0%) | 17 (19.8%) |
| 18 to 24 Years | 80 (20.6%) | 54 (16.8%) |
| 25 to 34 Years | 142 (19.6%) | 176 (28.4%) |
| 35 to 44 Years | 48 (11.4%) | 222 (58.1%) |
| 45 to 54 Years | 90 (27.9%) | 128 (28.5%) |
| 55 to 64 Years | 54 (12.3%) | 131 (22.5%) |
| 65 to 74 Years | 19 (7.8%) | 27 (5.8%) |
| 75 Years and over | 6 (3.8%) | 50 (14.0%) |
| Total | 872 (23.2%) | 1,248 (30.0%) |
Income Above Poverty by Sex and Age in Beaver Falls
According to the poverty statistics in Beaver Falls, males aged 75 years and over and females aged 65 to 74 years are the age groups that are most secure financially, with 96.2% of males and 94.2% of females in these age groups living above the poverty line.
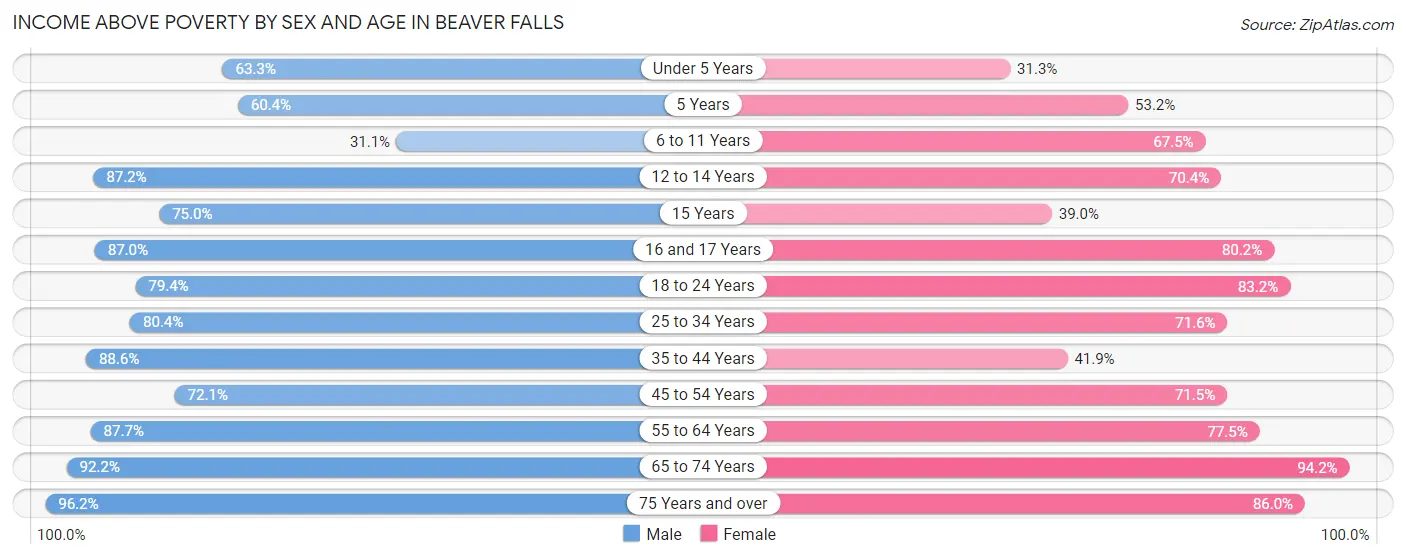
| Age Bracket | Male | Female |
| Under 5 Years | 222 (63.2%) | 105 (31.2%) |
| 5 Years | 29 (60.4%) | 59 (53.1%) |
| 6 to 11 Years | 105 (31.1%) | 164 (67.5%) |
| 12 to 14 Years | 82 (87.2%) | 107 (70.4%) |
| 15 Years | 66 (75.0%) | 23 (39.0%) |
| 16 and 17 Years | 120 (87.0%) | 69 (80.2%) |
| 18 to 24 Years | 309 (79.4%) | 267 (83.2%) |
| 25 to 34 Years | 583 (80.4%) | 443 (71.6%) |
| 35 to 44 Years | 373 (88.6%) | 160 (41.9%) |
| 45 to 54 Years | 233 (72.1%) | 321 (71.5%) |
| 55 to 64 Years | 386 (87.7%) | 452 (77.5%) |
| 65 to 74 Years | 225 (92.2%) | 440 (94.2%) |
| 75 Years and over | 150 (96.2%) | 306 (86.0%) |
| Total | 2,883 (76.8%) | 2,916 (70.0%) |
Income Below Poverty Among Married-Couple Families in Beaver Falls
The poverty statistics for married-couple families in Beaver Falls show that 7.9% or 73 of the total 926 families live below the poverty line. Families with 3 or 4 children have the highest poverty rate of 24.1%, comprising of 13 families. On the other hand, families with no children have the lowest poverty rate of 4.1%, which includes 22 families.
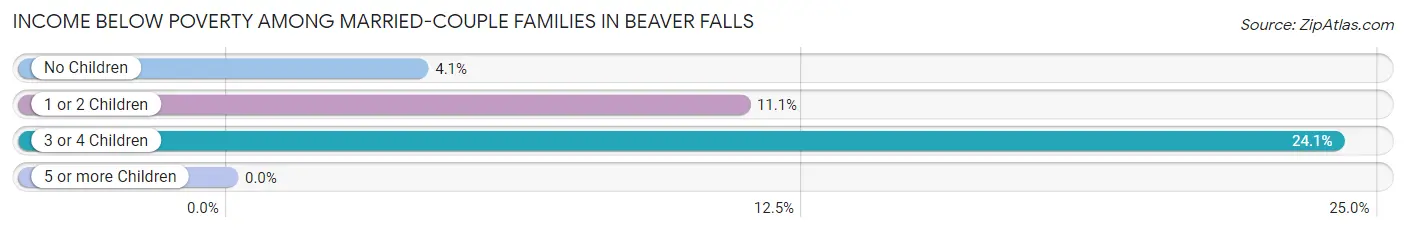
| Children | Above Poverty | Below Poverty |
| No Children | 509 (95.9%) | 22 (4.1%) |
| 1 or 2 Children | 303 (88.9%) | 38 (11.1%) |
| 3 or 4 Children | 41 (75.9%) | 13 (24.1%) |
| 5 or more Children | 0 (0.0%) | 0 (0.0%) |
| Total | 853 (92.1%) | 73 (7.9%) |
Income Below Poverty Among Single-Parent Households in Beaver Falls
According to the poverty data in Beaver Falls, 2.9% or 3 single-father households and 44.1% or 339 single-mother households are living below the poverty line. Among single-father households, those with 1 or 2 children have the highest poverty rate, with 3 households (3.7%) experiencing poverty. Likewise, among single-mother households, those with 5 or more children have the highest poverty rate, with 28 households (100.0%) falling below the poverty line.
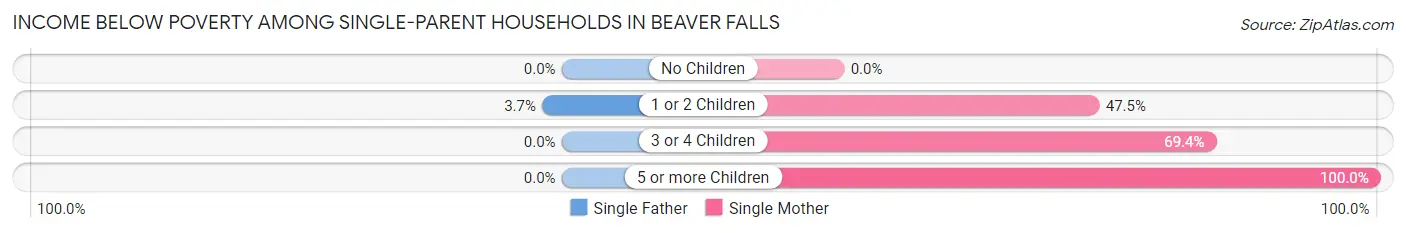
| Children | Single Father | Single Mother |
| No Children | 0 (0.0%) | 0 (0.0%) |
| 1 or 2 Children | 3 (3.7%) | 134 (47.5%) |
| 3 or 4 Children | 0 (0.0%) | 177 (69.4%) |
| 5 or more Children | 0 (0.0%) | 28 (100.0%) |
| Total | 3 (2.9%) | 339 (44.1%) |
Income Below Poverty Among Married-Couple vs Single-Parent Households in Beaver Falls
The poverty data for Beaver Falls shows that 73 of the married-couple family households (7.9%) and 342 of the single-parent households (39.3%) are living below the poverty level. Within the married-couple family households, those with 3 or 4 children have the highest poverty rate, with 13 households (24.1%) falling below the poverty line. Among the single-parent households, those with 5 or more children have the highest poverty rate, with 28 household (100.0%) living below poverty.
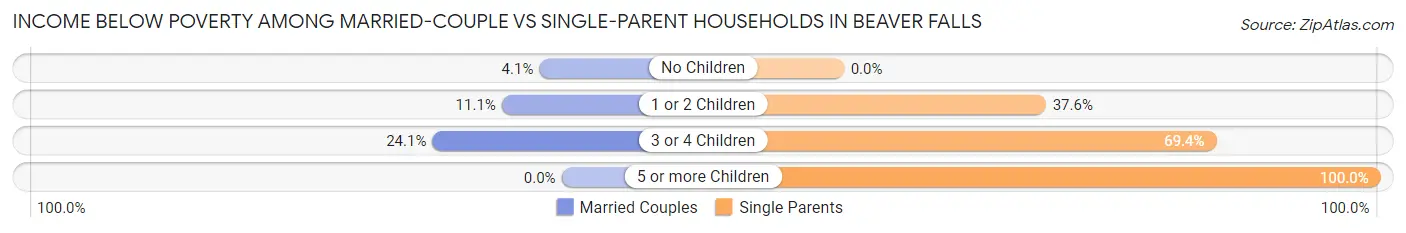
| Children | Married-Couple Families | Single-Parent Households |
| No Children | 22 (4.1%) | 0 (0.0%) |
| 1 or 2 Children | 38 (11.1%) | 137 (37.6%) |
| 3 or 4 Children | 13 (24.1%) | 177 (69.4%) |
| 5 or more Children | 0 (0.0%) | 28 (100.0%) |
| Total | 73 (7.9%) | 342 (39.3%) |
Race in Beaver Falls
The most populous races in Beaver Falls are White / Caucasian (6,133 | 68.6%), Black / African American (1,936 | 21.7%), and Two or more Races (566 | 6.3%).
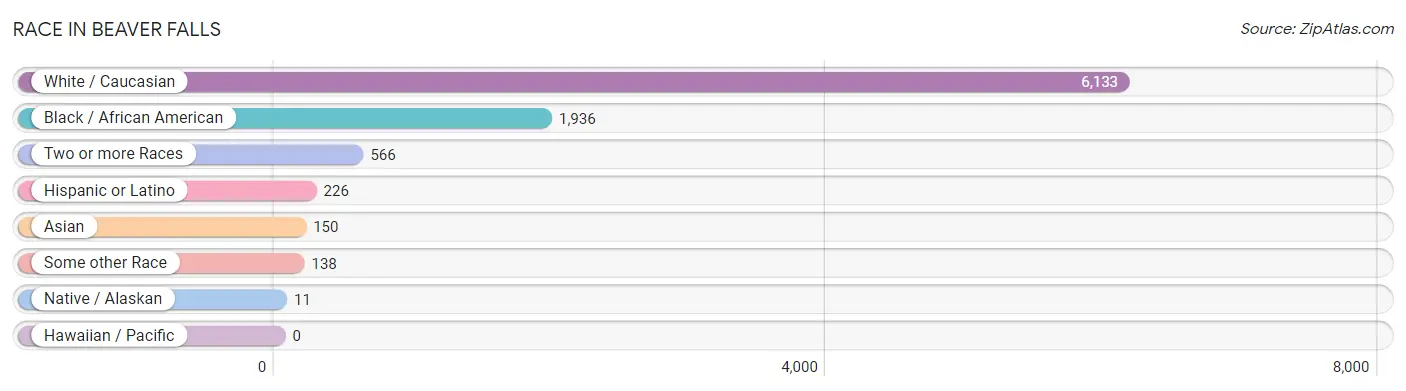
| Race | # Population | % Population |
| Asian | 150 | 1.7% |
| Black / African American | 1,936 | 21.7% |
| Hawaiian / Pacific | 0 | 0.0% |
| Hispanic or Latino | 226 | 2.5% |
| Native / Alaskan | 11 | 0.1% |
| White / Caucasian | 6,133 | 68.6% |
| Two or more Races | 566 | 6.3% |
| Some other Race | 138 | 1.5% |
| Total | 8,934 | 100.0% |
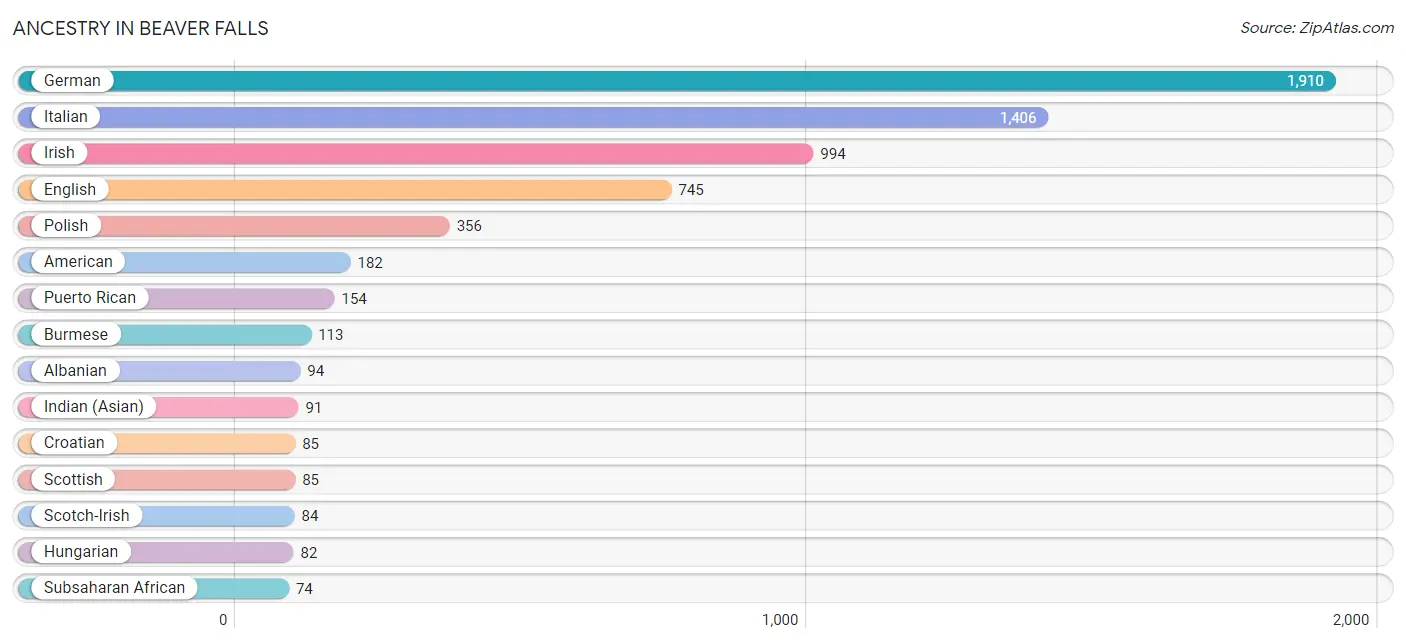
Ancestry in Beaver Falls
The most populous ancestries reported in Beaver Falls are German (1,910 | 21.4%), Italian (1,406 | 15.7%), Irish (994 | 11.1%), English (745 | 8.3%), and Polish (356 | 4.0%), together accounting for 60.6% of all Beaver Falls residents.
| Ancestry | # Population | % Population |
| African | 33 | 0.4% |
| Albanian | 94 | 1.1% |
| American | 182 | 2.0% |
| Arab | 9 | 0.1% |
| Austrian | 29 | 0.3% |
| Blackfeet | 5 | 0.1% |
| British | 5 | 0.1% |
| Burmese | 113 | 1.3% |
| Central American | 3 | 0.0% |
| Cherokee | 17 | 0.2% |
| Chilean | 2 | 0.0% |
| Croatian | 85 | 0.9% |
| Cypriot | 12 | 0.1% |
| Czech | 37 | 0.4% |
| Dutch | 73 | 0.8% |
| Eastern European | 19 | 0.2% |
| Ecuadorian | 36 | 0.4% |
| English | 745 | 8.3% |
| European | 62 | 0.7% |
| French | 55 | 0.6% |
| German | 1,910 | 21.4% |
| Greek | 67 | 0.7% |
| Honduran | 3 | 0.0% |
| Hungarian | 82 | 0.9% |
| Indian (Asian) | 91 | 1.0% |
| Irish | 994 | 11.1% |
| Italian | 1,406 | 15.7% |
| Jamaican | 10 | 0.1% |
| Korean | 25 | 0.3% |
| Lithuanian | 15 | 0.2% |
| Mexican | 31 | 0.4% |
| Nigerian | 41 | 0.5% |
| Norwegian | 18 | 0.2% |
| Polish | 356 | 4.0% |
| Puerto Rican | 154 | 1.7% |
| Romanian | 41 | 0.5% |
| Russian | 34 | 0.4% |
| Scotch-Irish | 84 | 0.9% |
| Scottish | 85 | 0.9% |
| Serbian | 16 | 0.2% |
| Sioux | 20 | 0.2% |
| Slavic | 3 | 0.0% |
| Slovak | 71 | 0.8% |
| South American | 38 | 0.4% |
| Subsaharan African | 74 | 0.8% |
| Swedish | 46 | 0.5% |
| Swiss | 59 | 0.7% |
| Syrian | 9 | 0.1% |
| Thai | 5 | 0.1% |
| Turkish | 7 | 0.1% |
| Ukrainian | 31 | 0.4% |
| Welsh | 46 | 0.5% |
| West Indian | 17 | 0.2% | View All 53 Rows |
Immigrants in Beaver Falls
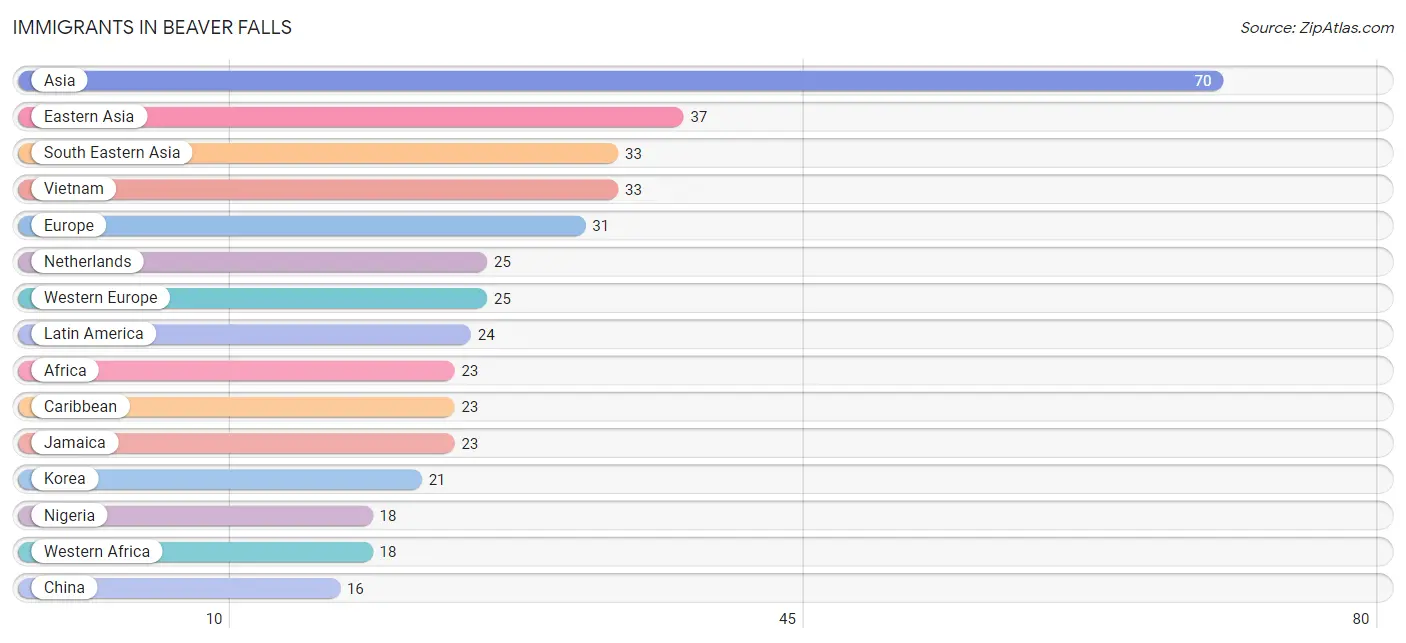
The most numerous immigrant groups reported in Beaver Falls came from Asia (70 | 0.8%), Eastern Asia (37 | 0.4%), South Eastern Asia (33 | 0.4%), Vietnam (33 | 0.4%), and Europe (31 | 0.4%), together accounting for 2.3% of all Beaver Falls residents.
| Immigration Origin | # Population | % Population |
| Africa | 23 | 0.3% |
| Asia | 70 | 0.8% |
| Caribbean | 23 | 0.3% |
| Central America | 1 | 0.0% |
| China | 16 | 0.2% |
| Eastern Africa | 5 | 0.1% |
| Eastern Asia | 37 | 0.4% |
| Eastern Europe | 6 | 0.1% |
| Europe | 31 | 0.4% |
| Jamaica | 23 | 0.3% |
| Korea | 21 | 0.2% |
| Latin America | 24 | 0.3% |
| Mexico | 1 | 0.0% |
| Netherlands | 25 | 0.3% |
| Nigeria | 18 | 0.2% |
| Romania | 6 | 0.1% |
| South Eastern Asia | 33 | 0.4% |
| Uganda | 5 | 0.1% |
| Vietnam | 33 | 0.4% |
| Western Africa | 18 | 0.2% |
| Western Europe | 25 | 0.3% | View All 21 Rows |
Sex and Age in Beaver Falls
Sex and Age in Beaver Falls
The most populous age groups in Beaver Falls are 20 to 24 Years (550 | 13.1%) for men and 20 to 24 Years (461 | 9.7%) for women.
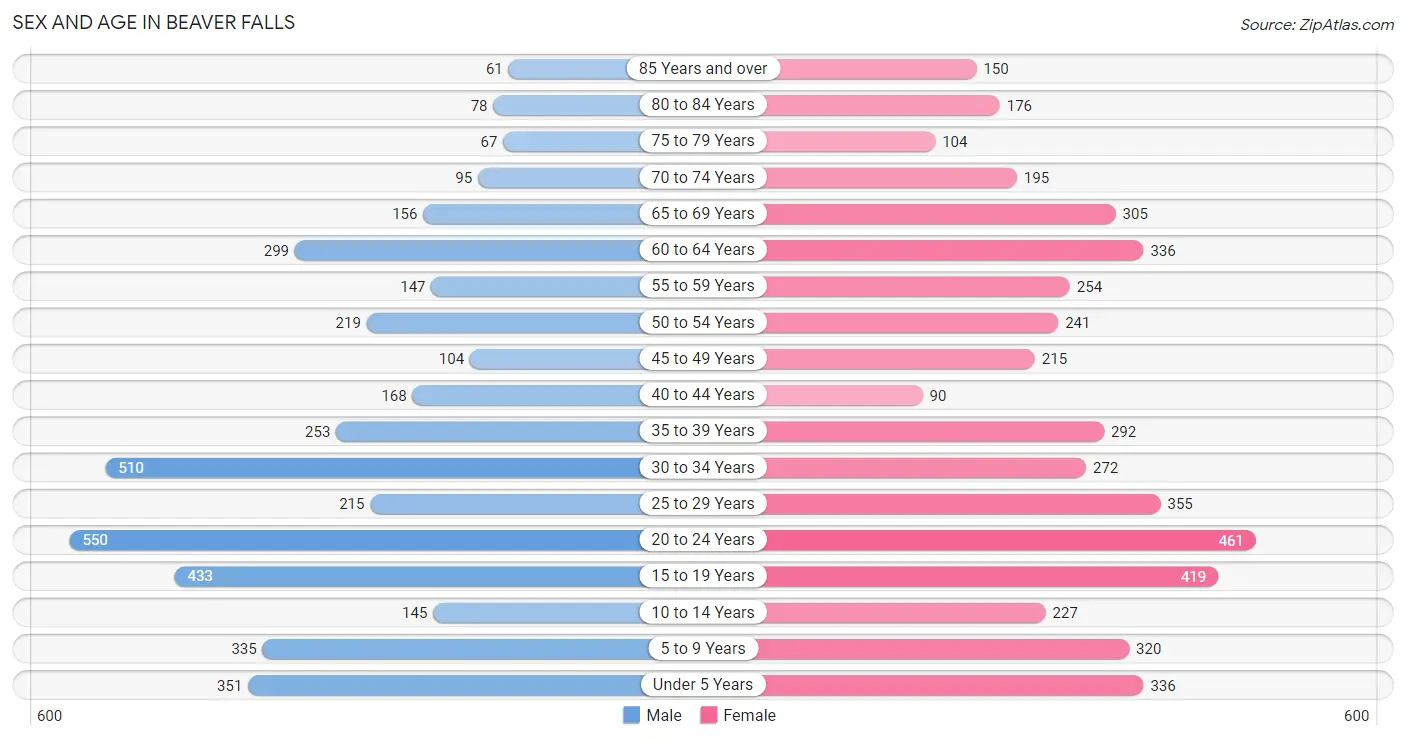
| Age Bracket | Male | Female |
| Under 5 Years | 351 (8.4%) | 336 (7.1%) |
| 5 to 9 Years | 335 (8.0%) | 320 (6.7%) |
| 10 to 14 Years | 145 (3.5%) | 227 (4.8%) |
| 15 to 19 Years | 433 (10.3%) | 419 (8.8%) |
| 20 to 24 Years | 550 (13.1%) | 461 (9.7%) |
| 25 to 29 Years | 215 (5.1%) | 355 (7.5%) |
| 30 to 34 Years | 510 (12.2%) | 272 (5.7%) |
| 35 to 39 Years | 253 (6.0%) | 292 (6.1%) |
| 40 to 44 Years | 168 (4.0%) | 90 (1.9%) |
| 45 to 49 Years | 104 (2.5%) | 215 (4.5%) |
| 50 to 54 Years | 219 (5.2%) | 241 (5.1%) |
| 55 to 59 Years | 147 (3.5%) | 254 (5.3%) |
| 60 to 64 Years | 299 (7.1%) | 336 (7.1%) |
| 65 to 69 Years | 156 (3.7%) | 305 (6.4%) |
| 70 to 74 Years | 95 (2.3%) | 195 (4.1%) |
| 75 to 79 Years | 67 (1.6%) | 104 (2.2%) |
| 80 to 84 Years | 78 (1.9%) | 176 (3.7%) |
| 85 Years and over | 61 (1.5%) | 150 (3.2%) |
| Total | 4,186 (100.0%) | 4,748 (100.0%) |
Families and Households in Beaver Falls
Median Family Size in Beaver Falls
The median family size in Beaver Falls is 3.09 persons per family, with single male/father families (103 | 5.7%) accounting for the largest median family size of 3.58 persons per family. On the other hand, married-couple families (926 | 51.5%) represent the smallest median family size with 3.04 persons per family.
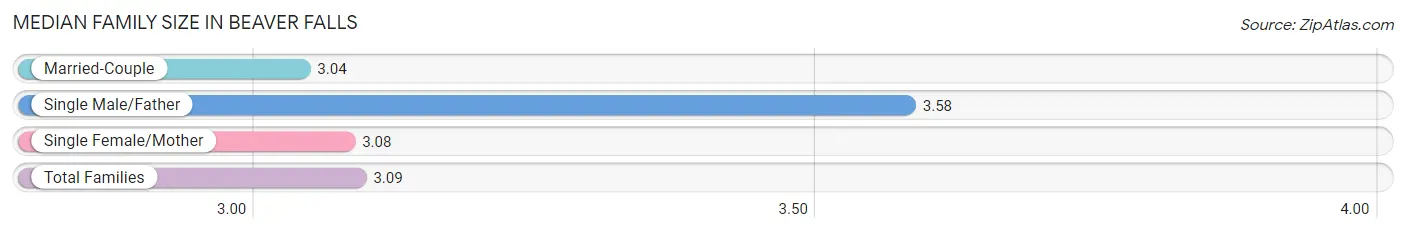
| Family Type | # Families | Family Size |
| Married-Couple | 926 (51.5%) | 3.04 |
| Single Male/Father | 103 (5.7%) | 3.58 |
| Single Female/Mother | 768 (42.7%) | 3.08 |
| Total Families | 1,797 (100.0%) | 3.09 |
Median Household Size in Beaver Falls
The median household size in Beaver Falls is 2.26 persons per household, with single male/father households (103 | 3.0%) accounting for the largest median household size of 3.97 persons per household. non-family households (1,687 | 48.4%) represent the smallest median household size with 1.25 persons per household.
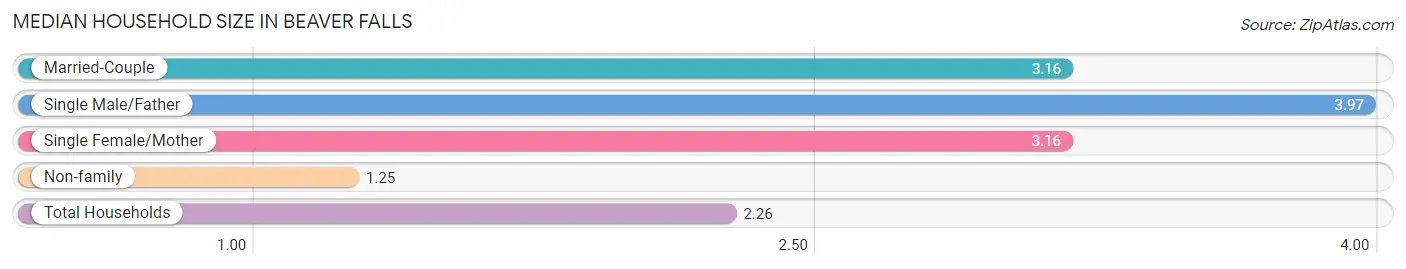
| Household Type | # Households | Household Size |
| Married-Couple | 926 (26.6%) | 3.16 |
| Single Male/Father | 103 (3.0%) | 3.97 |
| Single Female/Mother | 768 (22.0%) | 3.16 |
| Non-family | 1,687 (48.4%) | 1.25 |
| Total Households | 3,484 (100.0%) | 2.26 |
Household Size by Marriage Status in Beaver Falls
Out of a total of 3,484 households in Beaver Falls, 1,797 (51.6%) are family households, while 1,687 (48.4%) are nonfamily households. The most numerous type of family households are 2-person households, comprising 678, and the most common type of nonfamily households are 1-person households, comprising 1,388.
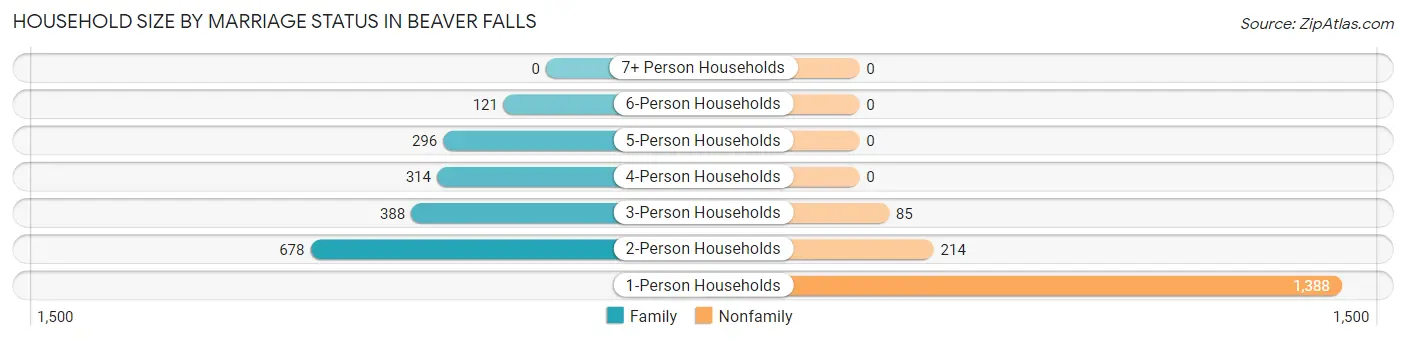
| Household Size | Family Households | Nonfamily Households |
| 1-Person Households | - | 1,388 (39.8%) |
| 2-Person Households | 678 (19.5%) | 214 (6.1%) |
| 3-Person Households | 388 (11.1%) | 85 (2.4%) |
| 4-Person Households | 314 (9.0%) | 0 (0.0%) |
| 5-Person Households | 296 (8.5%) | 0 (0.0%) |
| 6-Person Households | 121 (3.5%) | 0 (0.0%) |
| 7+ Person Households | 0 (0.0%) | 0 (0.0%) |
| Total | 1,797 (51.6%) | 1,687 (48.4%) |
Female Fertility in Beaver Falls
Fertility by Age in Beaver Falls
Average fertility rate in Beaver Falls is 94.0 births per 1,000 women. Women in the age bracket of 20 to 34 years have the highest fertility rate with 184.0 births per 1,000 women. Women in the age bracket of 20 to 34 years acount for 100.0% of all women with births.
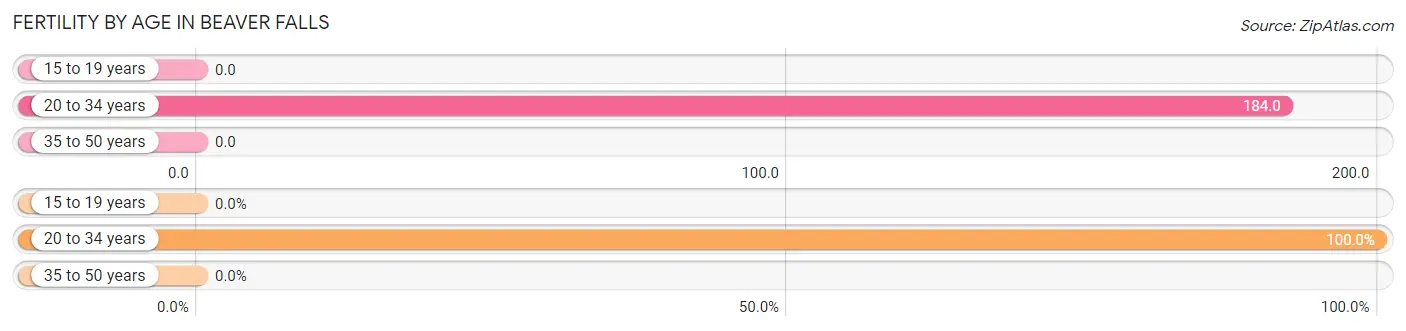
| Age Bracket | Women with Births | Births / 1,000 Women |
| 15 to 19 years | 0 (0.0%) | 0.0 |
| 20 to 34 years | 200 (100.0%) | 184.0 |
| 35 to 50 years | 0 (0.0%) | 0.0 |
| Total | 200 (100.0%) | 94.0 |
Fertility by Age by Marriage Status in Beaver Falls
23.5% of women with births (200) in Beaver Falls are married. The highest percentage of unmarried women with births falls into 20 to 34 years age bracket with 76.5% of them unmarried at the time of birth, while the lowest percentage of unmarried women with births belong to 20 to 34 years age bracket with 76.5% of them unmarried.
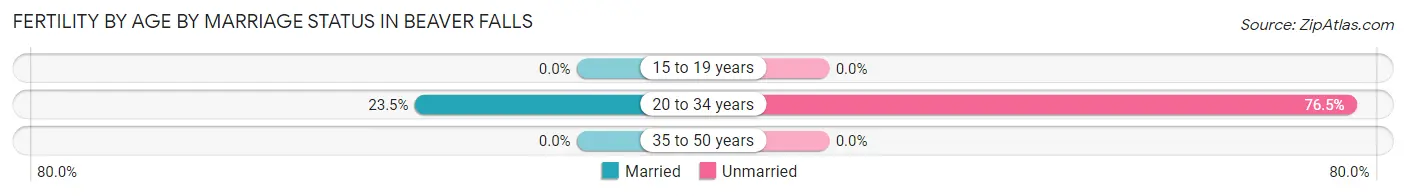
| Age Bracket | Married | Unmarried |
| 15 to 19 years | 0 (0.0%) | 0 (0.0%) |
| 20 to 34 years | 47 (23.5%) | 153 (76.5%) |
| 35 to 50 years | 0 (0.0%) | 0 (0.0%) |
| Total | 47 (23.5%) | 153 (76.5%) |
Fertility by Education in Beaver Falls
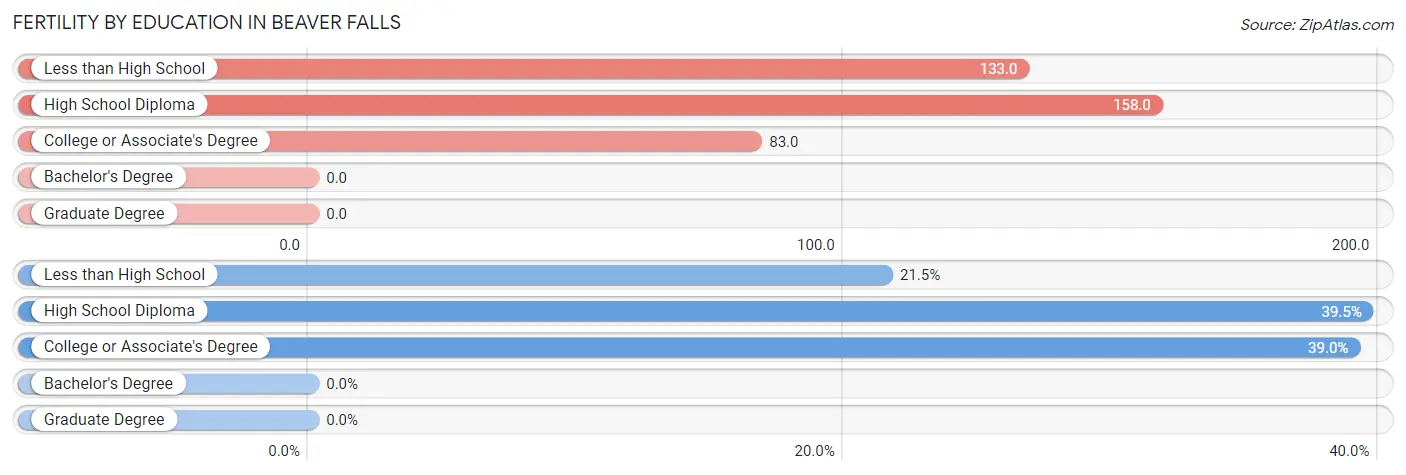
| Educational Attainment | Women with Births | Births / 1,000 Women |
| Less than High School | 43 (21.5%) | 133.0 |
| High School Diploma | 79 (39.5%) | 158.0 |
| College or Associate's Degree | 78 (39.0%) | 83.0 |
| Bachelor's Degree | 0 (0.0%) | 0.0 |
| Graduate Degree | 0 (0.0%) | 0.0 |
| Total | 200 (100.0%) | 94.0 |
Fertility by Education by Marriage Status in Beaver Falls
76.5% of women with births in Beaver Falls are unmarried. Women with the educational attainment of college or associate's degree are most likely to be married with 60.3% of them married at childbirth, while women with the educational attainment of less than high school are least likely to be married with 100.0% of them unmarried at childbirth.
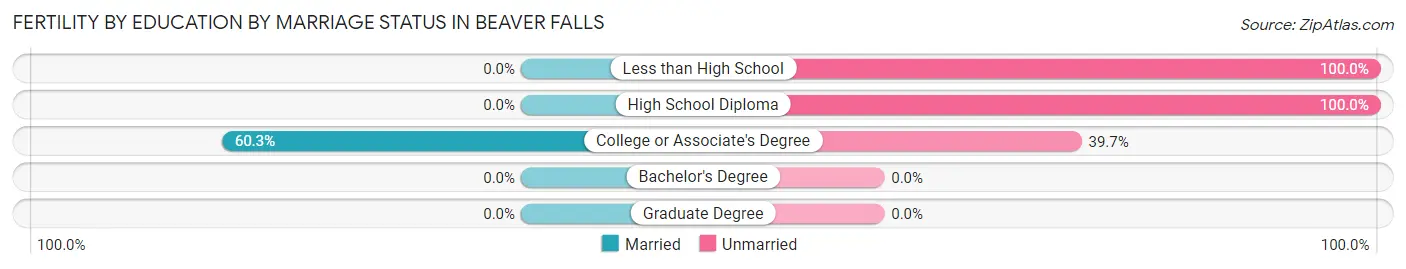
| Educational Attainment | Married | Unmarried |
| Less than High School | 0 (0.0%) | 43 (100.0%) |
| High School Diploma | 0 (0.0%) | 79 (100.0%) |
| College or Associate's Degree | 47 (60.3%) | 31 (39.7%) |
| Bachelor's Degree | 0 (0.0%) | 0 (0.0%) |
| Graduate Degree | 0 (0.0%) | 0 (0.0%) |
| Total | 47 (23.5%) | 153 (76.5%) |
Employment Characteristics in Beaver Falls
Employment by Class of Employer in Beaver Falls
Among the 3,557 employed individuals in Beaver Falls, private company employees (2,343 | 65.9%), not-for-profit organizations (618 | 17.4%), and local government employees (272 | 7.6%) make up the most common classes of employment.
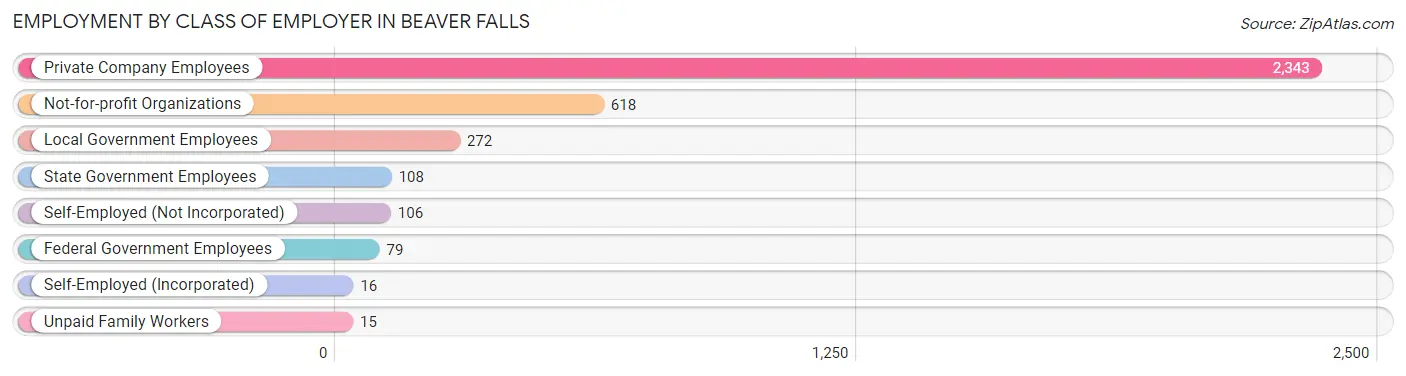
| Employer Class | # Employees | % Employees |
| Private Company Employees | 2,343 | 65.9% |
| Self-Employed (Incorporated) | 16 | 0.4% |
| Self-Employed (Not Incorporated) | 106 | 3.0% |
| Not-for-profit Organizations | 618 | 17.4% |
| Local Government Employees | 272 | 7.6% |
| State Government Employees | 108 | 3.0% |
| Federal Government Employees | 79 | 2.2% |
| Unpaid Family Workers | 15 | 0.4% |
| Total | 3,557 | 100.0% |
Employment Status by Age in Beaver Falls
According to the labor force statistics for Beaver Falls, out of the total population over 16 years of age (7,073), 59.9% or 4,237 individuals are in the labor force, with 11.5% or 487 of them unemployed. The age group with the highest labor force participation rate is 30 to 34 years, with 86.6% or 677 individuals in the labor force. Within the labor force, the 55 to 59 years age range has the highest percentage of unemployed individuals, with 33.0% or 63 of them being unemployed.
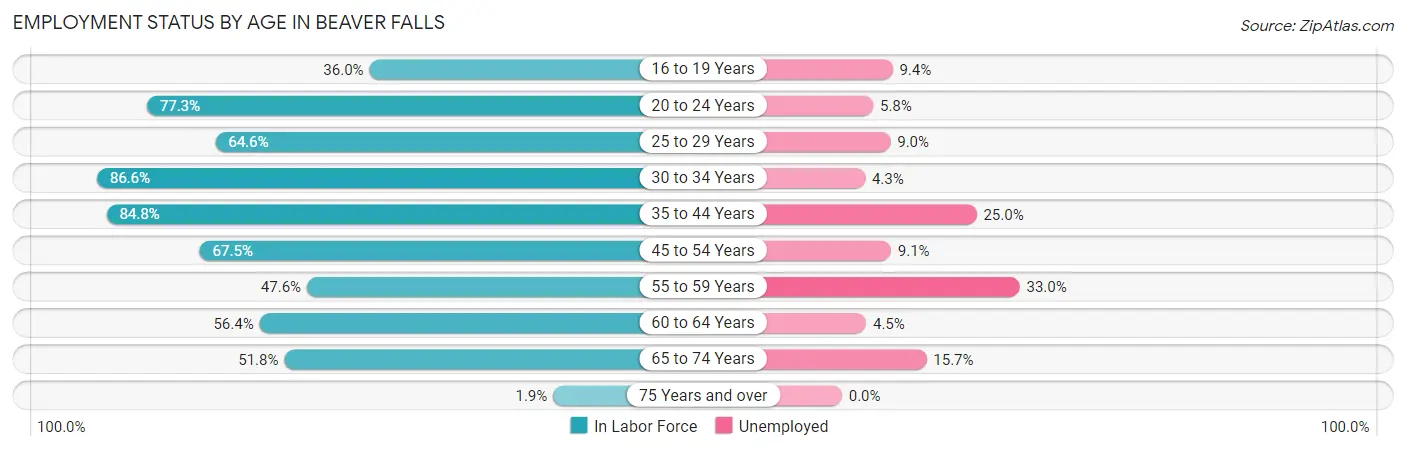
| Age Bracket | In Labor Force | Unemployed |
| 16 to 19 Years | 254 (36.0%) | 24 (9.4%) |
| 20 to 24 Years | 782 (77.3%) | 45 (5.8%) |
| 25 to 29 Years | 368 (64.6%) | 33 (9.0%) |
| 30 to 34 Years | 677 (86.6%) | 29 (4.3%) |
| 35 to 44 Years | 681 (84.8%) | 170 (25.0%) |
| 45 to 54 Years | 526 (67.5%) | 48 (9.1%) |
| 55 to 59 Years | 191 (47.6%) | 63 (33.0%) |
| 60 to 64 Years | 358 (56.4%) | 16 (4.5%) |
| 65 to 74 Years | 389 (51.8%) | 61 (15.7%) |
| 75 Years and over | 12 (1.9%) | 0 (0.0%) |
| Total | 4,237 (59.9%) | 487 (11.5%) |
Employment Status by Educational Attainment in Beaver Falls
According to labor force statistics for Beaver Falls, 70.6% of individuals (2,803) out of the total population between 25 and 64 years of age (3,970) are in the labor force, with 12.8% or 359 of them being unemployed. The group with the highest labor force participation rate are those with the educational attainment of bachelor's degree or higher, with 82.4% or 607 individuals in the labor force. Within the labor force, individuals with college / associate degree education have the highest percentage of unemployment, with 26.8% or 234 of them being unemployed.
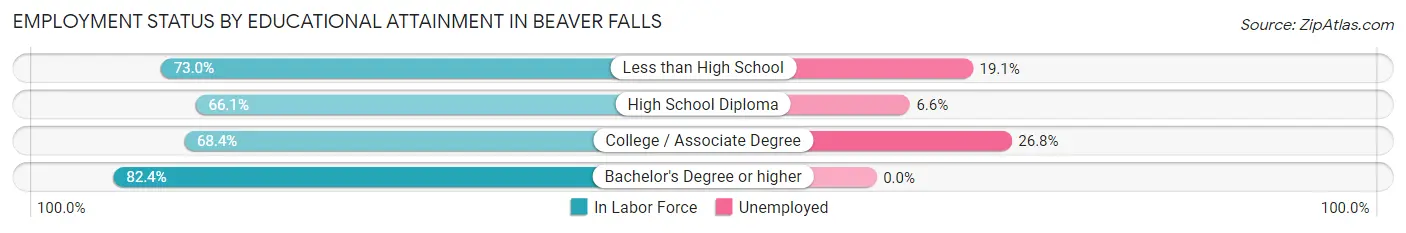
| Educational Attainment | In Labor Force | Unemployed |
| Less than High School | 303 (73.0%) | 79 (19.1%) |
| High School Diploma | 1,019 (66.1%) | 102 (6.6%) |
| College / Associate Degree | 873 (68.4%) | 342 (26.8%) |
| Bachelor's Degree or higher | 607 (82.4%) | 0 (0.0%) |
| Total | 2,803 (70.6%) | 508 (12.8%) |
Employment Occupations by Sex in Beaver Falls
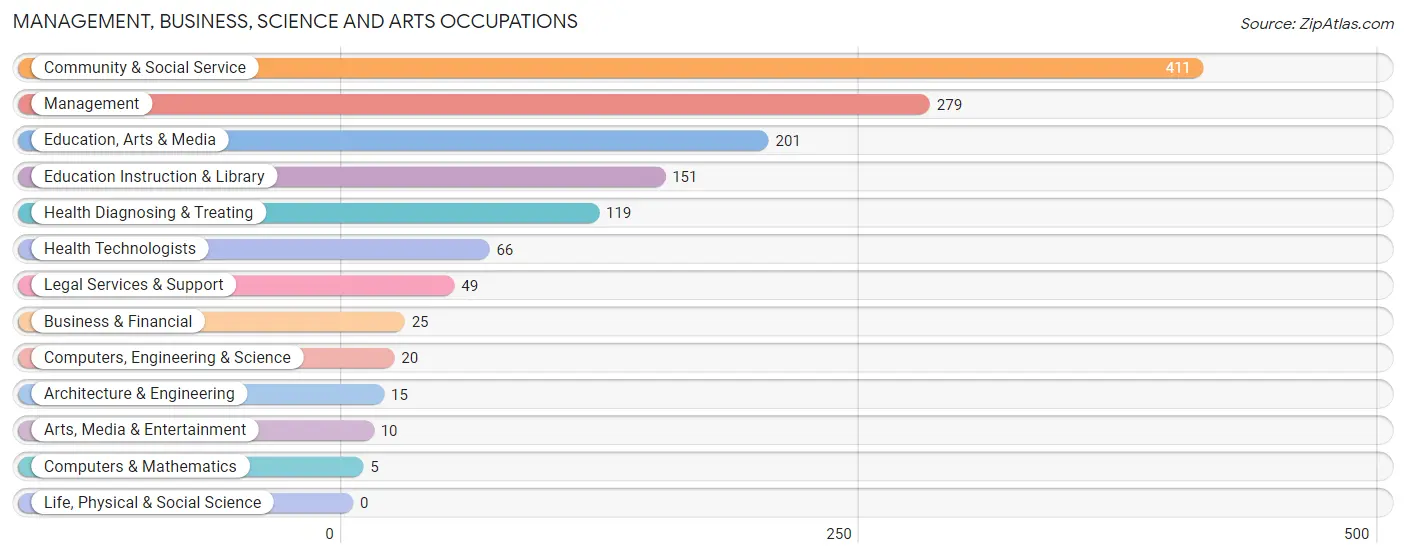
Management, Business, Science and Arts Occupations
The most common Management, Business, Science and Arts occupations in Beaver Falls are Community & Social Service (411 | 11.0%), Management (279 | 7.4%), Education, Arts & Media (201 | 5.4%), Education Instruction & Library (151 | 4.0%), and Health Diagnosing & Treating (119 | 3.2%).
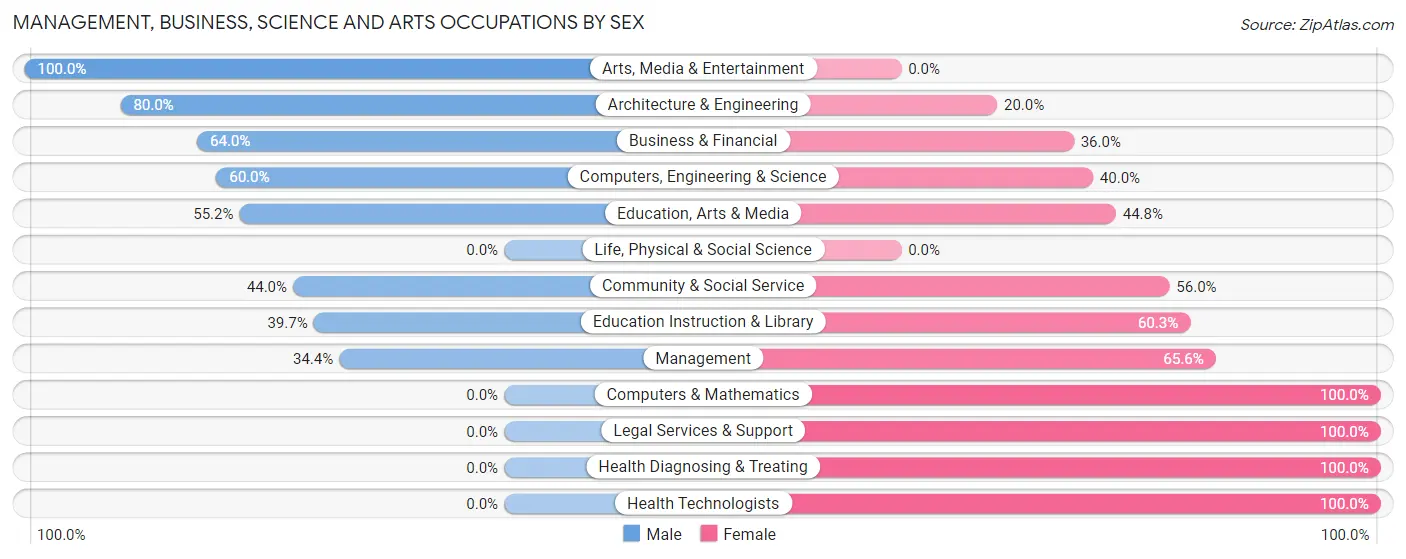
Management, Business, Science and Arts Occupations by Sex
Within the Management, Business, Science and Arts occupations in Beaver Falls, the most male-oriented occupations are Arts, Media & Entertainment (100.0%), Architecture & Engineering (80.0%), and Business & Financial (64.0%), while the most female-oriented occupations are Computers & Mathematics (100.0%), Legal Services & Support (100.0%), and Health Diagnosing & Treating (100.0%).
| Occupation | Male | Female |
| Management | 96 (34.4%) | 183 (65.6%) |
| Business & Financial | 16 (64.0%) | 9 (36.0%) |
| Computers, Engineering & Science | 12 (60.0%) | 8 (40.0%) |
| Computers & Mathematics | 0 (0.0%) | 5 (100.0%) |
| Architecture & Engineering | 12 (80.0%) | 3 (20.0%) |
| Life, Physical & Social Science | 0 (0.0%) | 0 (0.0%) |
| Community & Social Service | 181 (44.0%) | 230 (56.0%) |
| Education, Arts & Media | 111 (55.2%) | 90 (44.8%) |
| Legal Services & Support | 0 (0.0%) | 49 (100.0%) |
| Education Instruction & Library | 60 (39.7%) | 91 (60.3%) |
| Arts, Media & Entertainment | 10 (100.0%) | 0 (0.0%) |
| Health Diagnosing & Treating | 0 (0.0%) | 119 (100.0%) |
| Health Technologists | 0 (0.0%) | 66 (100.0%) |
| Total (Category) | 305 (35.7%) | 549 (64.3%) |
| Total (Overall) | 1,839 (49.1%) | 1,909 (50.9%) |
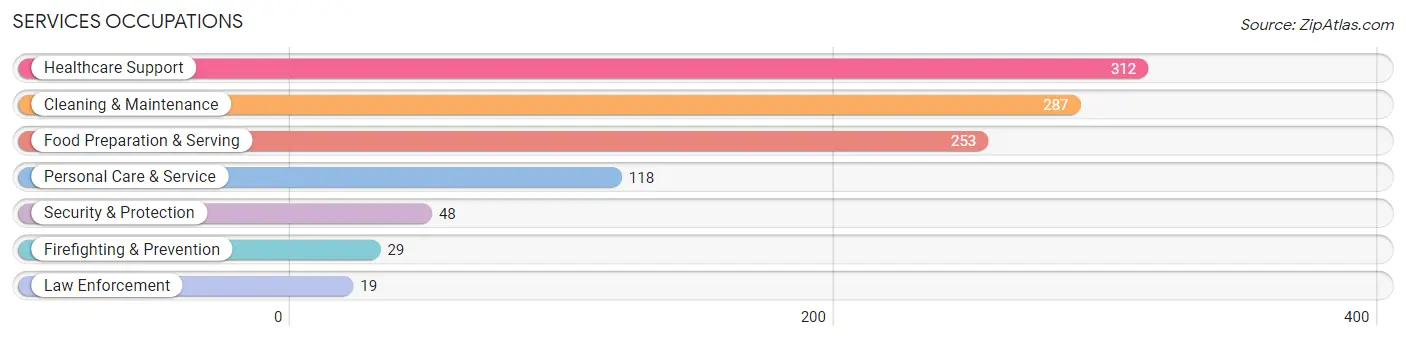
Services Occupations
The most common Services occupations in Beaver Falls are Healthcare Support (312 | 8.3%), Cleaning & Maintenance (287 | 7.7%), Food Preparation & Serving (253 | 6.8%), Personal Care & Service (118 | 3.2%), and Security & Protection (48 | 1.3%).
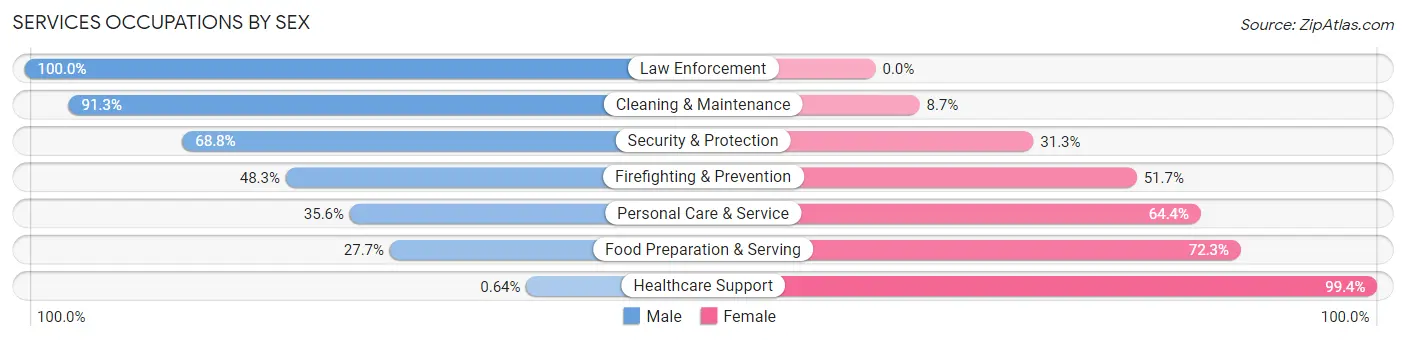
Services Occupations by Sex
Within the Services occupations in Beaver Falls, the most male-oriented occupations are Law Enforcement (100.0%), Cleaning & Maintenance (91.3%), and Security & Protection (68.8%), while the most female-oriented occupations are Healthcare Support (99.4%), Food Preparation & Serving (72.3%), and Personal Care & Service (64.4%).
| Occupation | Male | Female |
| Healthcare Support | 2 (0.6%) | 310 (99.4%) |
| Security & Protection | 33 (68.8%) | 15 (31.2%) |
| Firefighting & Prevention | 14 (48.3%) | 15 (51.7%) |
| Law Enforcement | 19 (100.0%) | 0 (0.0%) |
| Food Preparation & Serving | 70 (27.7%) | 183 (72.3%) |
| Cleaning & Maintenance | 262 (91.3%) | 25 (8.7%) |
| Personal Care & Service | 42 (35.6%) | 76 (64.4%) |
| Total (Category) | 409 (40.2%) | 609 (59.8%) |
| Total (Overall) | 1,839 (49.1%) | 1,909 (50.9%) |
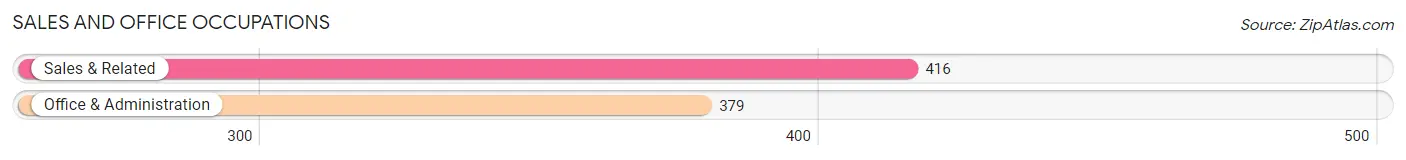
Sales and Office Occupations
The most common Sales and Office occupations in Beaver Falls are Sales & Related (416 | 11.1%), and Office & Administration (379 | 10.1%).
Sales and Office Occupations by Sex
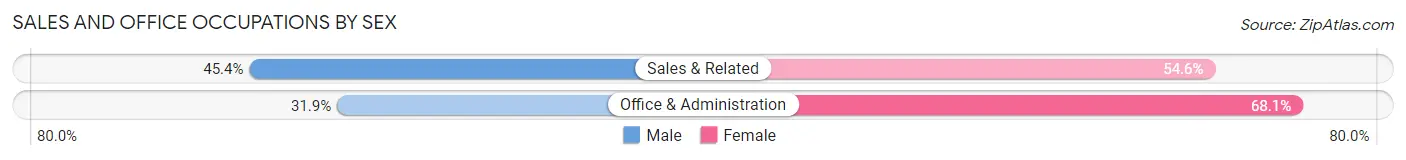
| Occupation | Male | Female |
| Sales & Related | 189 (45.4%) | 227 (54.6%) |
| Office & Administration | 121 (31.9%) | 258 (68.1%) |
| Total (Category) | 310 (39.0%) | 485 (61.0%) |
| Total (Overall) | 1,839 (49.1%) | 1,909 (50.9%) |
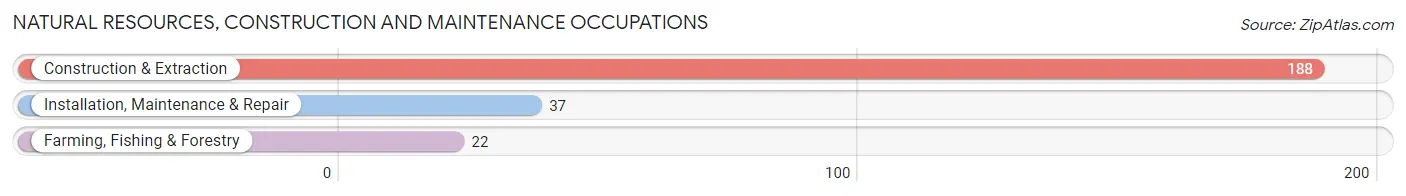
Natural Resources, Construction and Maintenance Occupations
The most common Natural Resources, Construction and Maintenance occupations in Beaver Falls are Construction & Extraction (188 | 5.0%), Installation, Maintenance & Repair (37 | 1.0%), and Farming, Fishing & Forestry (22 | 0.6%).
Natural Resources, Construction and Maintenance Occupations by Sex
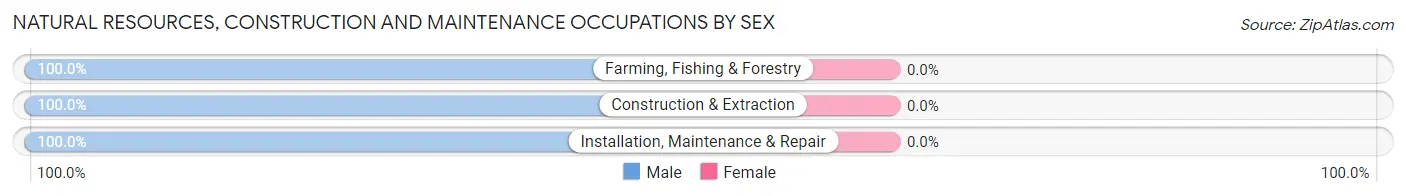
| Occupation | Male | Female |
| Farming, Fishing & Forestry | 22 (100.0%) | 0 (0.0%) |
| Construction & Extraction | 188 (100.0%) | 0 (0.0%) |
| Installation, Maintenance & Repair | 37 (100.0%) | 0 (0.0%) |
| Total (Category) | 247 (100.0%) | 0 (0.0%) |
| Total (Overall) | 1,839 (49.1%) | 1,909 (50.9%) |
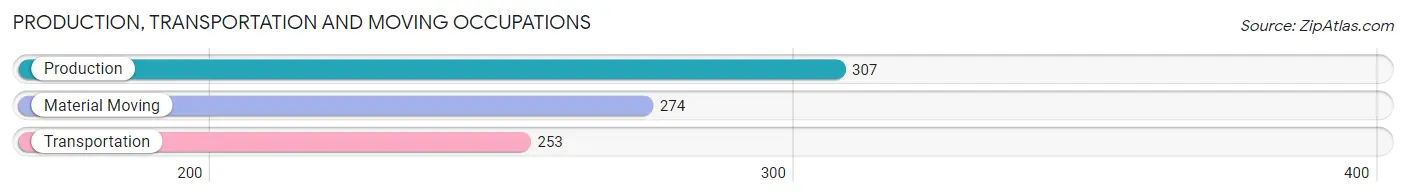
Production, Transportation and Moving Occupations
The most common Production, Transportation and Moving occupations in Beaver Falls are Production (307 | 8.2%), Material Moving (274 | 7.3%), and Transportation (253 | 6.8%).
Production, Transportation and Moving Occupations by Sex
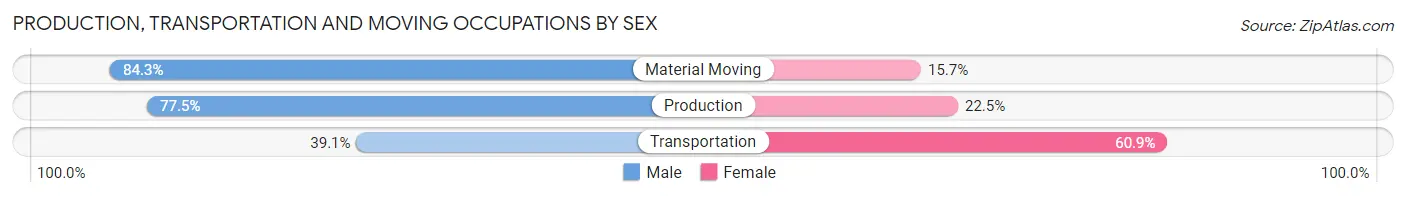
| Occupation | Male | Female |
| Production | 238 (77.5%) | 69 (22.5%) |
| Transportation | 99 (39.1%) | 154 (60.9%) |
| Material Moving | 231 (84.3%) | 43 (15.7%) |
| Total (Category) | 568 (68.1%) | 266 (31.9%) |
| Total (Overall) | 1,839 (49.1%) | 1,909 (50.9%) |
Employment Industries by Sex in Beaver Falls
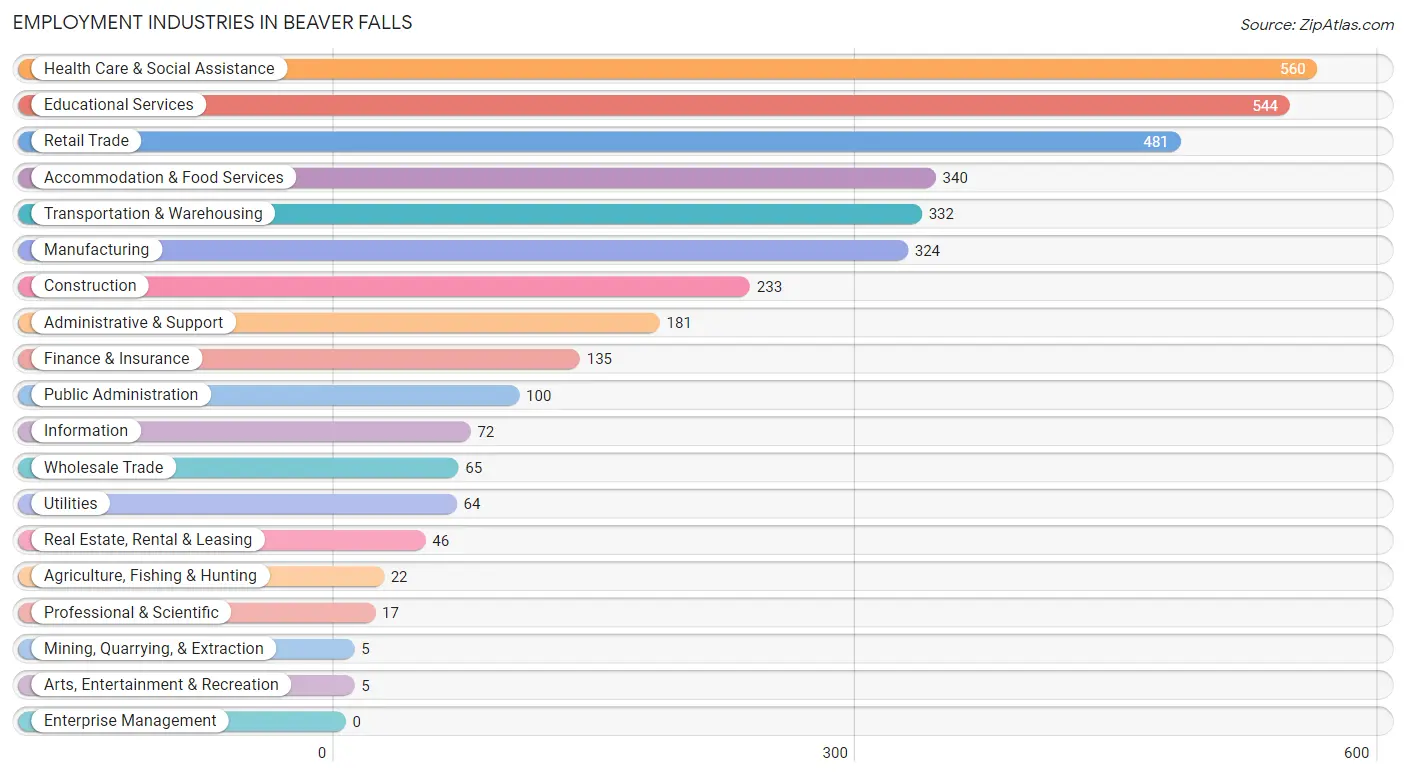
Employment Industries in Beaver Falls
The major employment industries in Beaver Falls include Health Care & Social Assistance (560 | 14.9%), Educational Services (544 | 14.5%), Retail Trade (481 | 12.8%), Accommodation & Food Services (340 | 9.1%), and Transportation & Warehousing (332 | 8.9%).
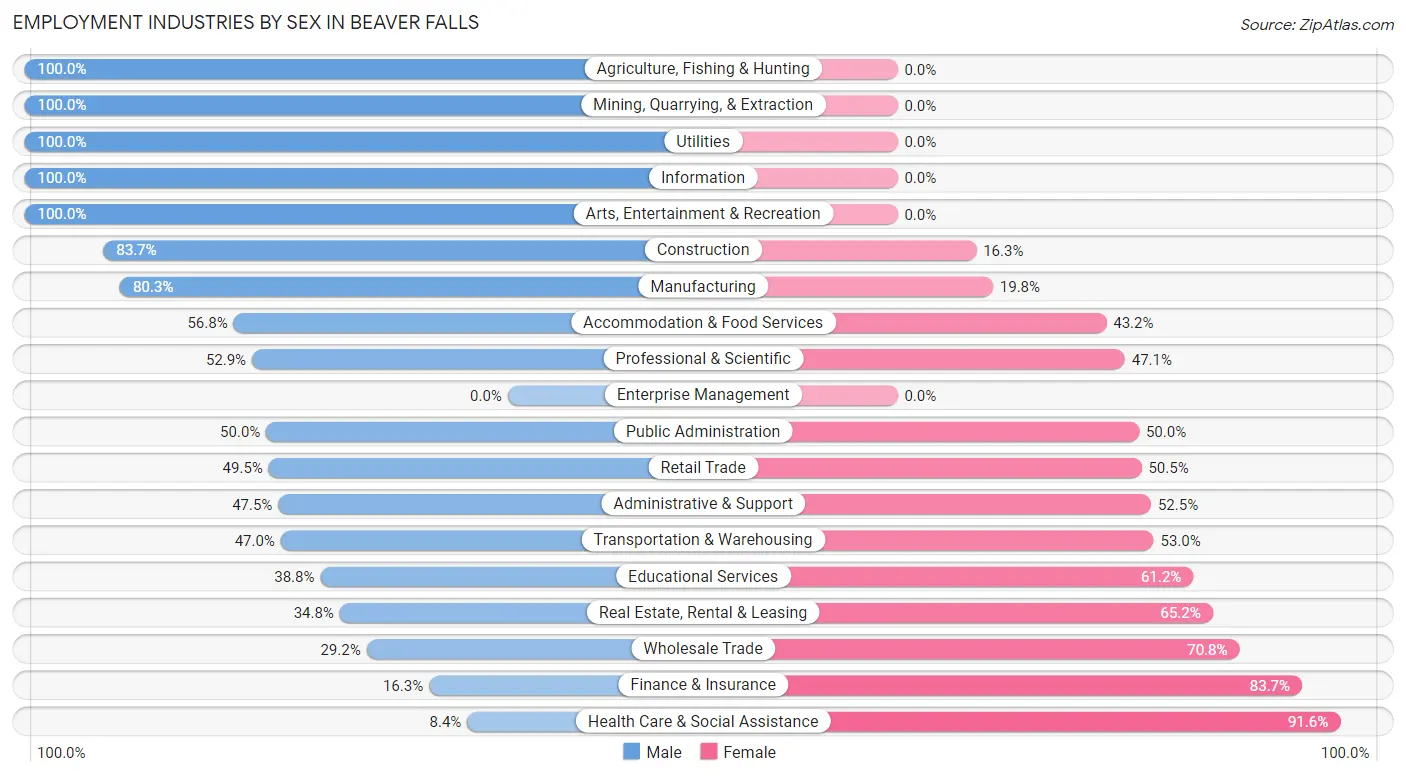
Employment Industries by Sex in Beaver Falls
The Beaver Falls industries that see more men than women are Agriculture, Fishing & Hunting (100.0%), Mining, Quarrying, & Extraction (100.0%), and Utilities (100.0%), whereas the industries that tend to have a higher number of women are Health Care & Social Assistance (91.6%), Finance & Insurance (83.7%), and Wholesale Trade (70.8%).
| Industry | Male | Female |
| Agriculture, Fishing & Hunting | 22 (100.0%) | 0 (0.0%) |
| Mining, Quarrying, & Extraction | 5 (100.0%) | 0 (0.0%) |
| Construction | 195 (83.7%) | 38 (16.3%) |
| Manufacturing | 260 (80.2%) | 64 (19.8%) |
| Wholesale Trade | 19 (29.2%) | 46 (70.8%) |
| Retail Trade | 238 (49.5%) | 243 (50.5%) |
| Transportation & Warehousing | 156 (47.0%) | 176 (53.0%) |
| Utilities | 64 (100.0%) | 0 (0.0%) |
| Information | 72 (100.0%) | 0 (0.0%) |
| Finance & Insurance | 22 (16.3%) | 113 (83.7%) |
| Real Estate, Rental & Leasing | 16 (34.8%) | 30 (65.2%) |
| Professional & Scientific | 9 (52.9%) | 8 (47.1%) |
| Enterprise Management | 0 (0.0%) | 0 (0.0%) |
| Administrative & Support | 86 (47.5%) | 95 (52.5%) |
| Educational Services | 211 (38.8%) | 333 (61.2%) |
| Health Care & Social Assistance | 47 (8.4%) | 513 (91.6%) |
| Arts, Entertainment & Recreation | 5 (100.0%) | 0 (0.0%) |
| Accommodation & Food Services | 193 (56.8%) | 147 (43.2%) |
| Public Administration | 50 (50.0%) | 50 (50.0%) |
| Total | 1,839 (49.1%) | 1,909 (50.9%) |
Education in Beaver Falls
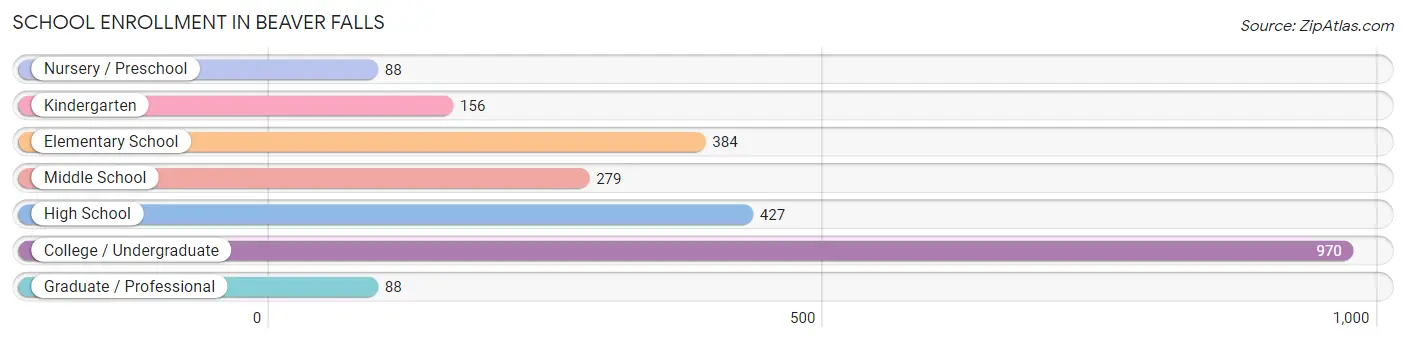
School Enrollment in Beaver Falls
The most common levels of schooling among the 2,392 students in Beaver Falls are college / undergraduate (970 | 40.6%), high school (427 | 17.8%), and elementary school (384 | 16.1%).
| School Level | # Students | % Students |
| Nursery / Preschool | 88 | 3.7% |
| Kindergarten | 156 | 6.5% |
| Elementary School | 384 | 16.1% |
| Middle School | 279 | 11.7% |
| High School | 427 | 17.8% |
| College / Undergraduate | 970 | 40.6% |
| Graduate / Professional | 88 | 3.7% |
| Total | 2,392 | 100.0% |
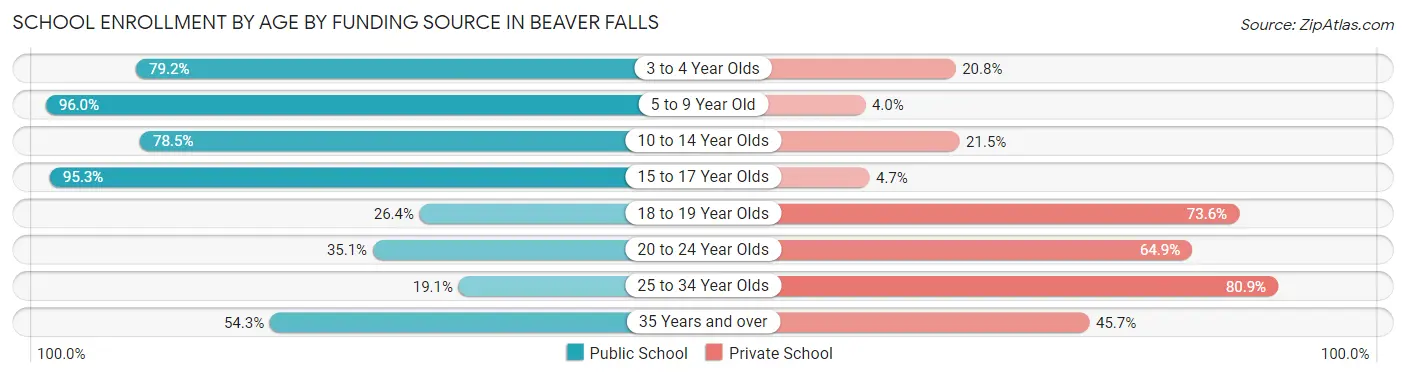
School Enrollment by Age by Funding Source in Beaver Falls
Out of a total of 2,392 students who are enrolled in schools in Beaver Falls, 866 (36.2%) attend a private institution, while the remaining 1,526 (63.8%) are enrolled in public schools. The age group of 25 to 34 year olds has the highest likelihood of being enrolled in private schools, with 55 (80.9% in the age bracket) enrolled. Conversely, the age group of 5 to 9 year old has the lowest likelihood of being enrolled in a private school, with 509 (96.0% in the age bracket) attending a public institution.
| Age Bracket | Public School | Private School |
| 3 to 4 Year Olds | 61 (79.2%) | 16 (20.8%) |
| 5 to 9 Year Old | 509 (96.0%) | 21 (4.0%) |
| 10 to 14 Year Olds | 292 (78.5%) | 80 (21.5%) |
| 15 to 17 Year Olds | 323 (95.3%) | 16 (4.7%) |
| 18 to 19 Year Olds | 114 (26.4%) | 318 (73.6%) |
| 20 to 24 Year Olds | 177 (35.1%) | 327 (64.9%) |
| 25 to 34 Year Olds | 13 (19.1%) | 55 (80.9%) |
| 35 Years and over | 38 (54.3%) | 32 (45.7%) |
| Total | 1,526 (63.8%) | 866 (36.2%) |
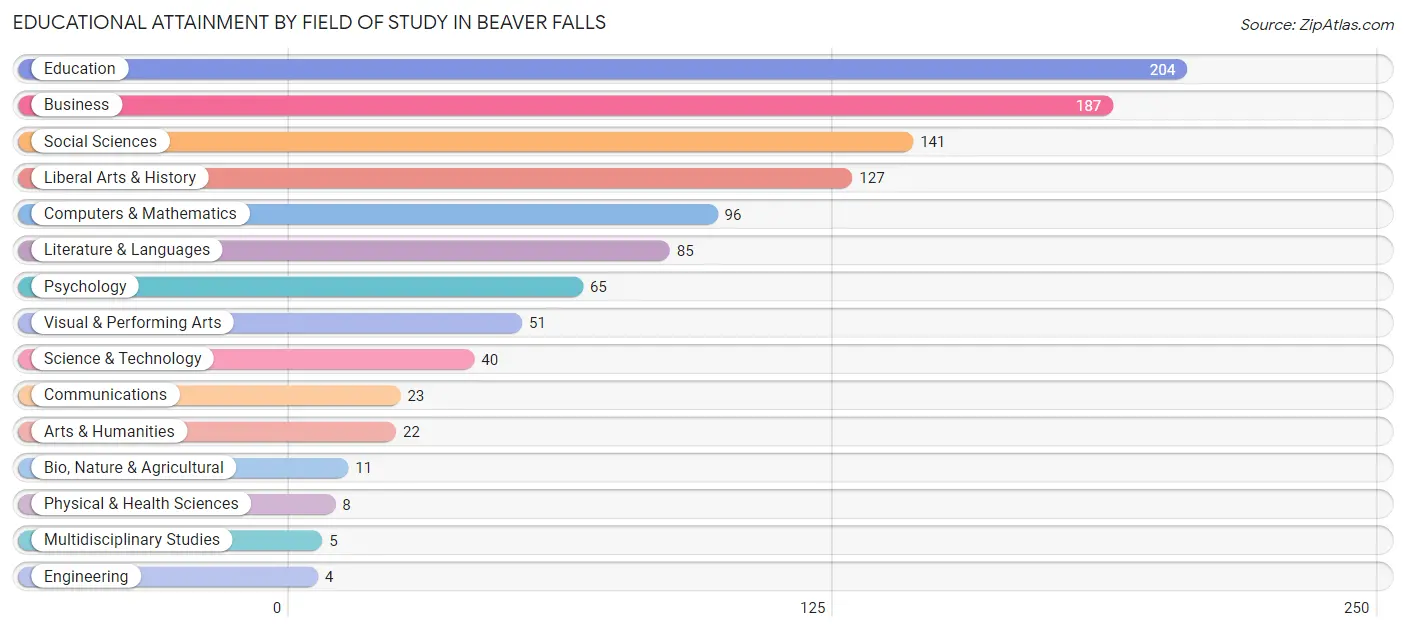
Educational Attainment by Field of Study in Beaver Falls
Education (204 | 19.1%), business (187 | 17.5%), social sciences (141 | 13.2%), liberal arts & history (127 | 11.9%), and computers & mathematics (96 | 9.0%) are the most common fields of study among 1,069 individuals in Beaver Falls who have obtained a bachelor's degree or higher.
| Field of Study | # Graduates | % Graduates |
| Computers & Mathematics | 96 | 9.0% |
| Bio, Nature & Agricultural | 11 | 1.0% |
| Physical & Health Sciences | 8 | 0.7% |
| Psychology | 65 | 6.1% |
| Social Sciences | 141 | 13.2% |
| Engineering | 4 | 0.4% |
| Multidisciplinary Studies | 5 | 0.5% |
| Science & Technology | 40 | 3.7% |
| Business | 187 | 17.5% |
| Education | 204 | 19.1% |
| Literature & Languages | 85 | 8.0% |
| Liberal Arts & History | 127 | 11.9% |
| Visual & Performing Arts | 51 | 4.8% |
| Communications | 23 | 2.1% |
| Arts & Humanities | 22 | 2.1% |
| Total | 1,069 | 100.0% |
Transportation & Commute in Beaver Falls
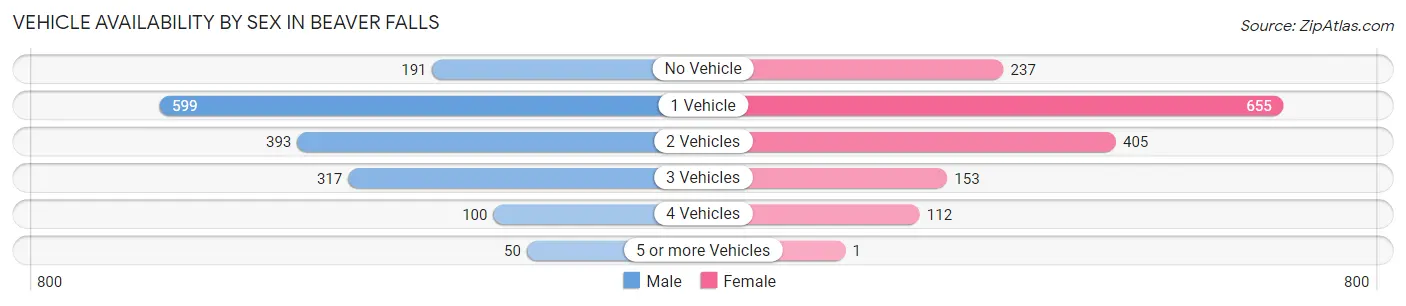
Vehicle Availability by Sex in Beaver Falls
The most prevalent vehicle ownership categories in Beaver Falls are males with 1 vehicle (599, accounting for 36.3%) and females with 1 vehicle (655, making up 38.3%).
| Vehicles Available | Male | Female |
| No Vehicle | 191 (11.6%) | 237 (15.2%) |
| 1 Vehicle | 599 (36.3%) | 655 (41.9%) |
| 2 Vehicles | 393 (23.8%) | 405 (25.9%) |
| 3 Vehicles | 317 (19.2%) | 153 (9.8%) |
| 4 Vehicles | 100 (6.1%) | 112 (7.2%) |
| 5 or more Vehicles | 50 (3.0%) | 1 (0.1%) |
| Total | 1,650 (100.0%) | 1,563 (100.0%) |
Commute Time in Beaver Falls
The most frequently occuring commute durations in Beaver Falls are 5 to 9 minutes (658 commuters, 19.4%), 10 to 14 minutes (494 commuters, 14.6%), and 15 to 19 minutes (453 commuters, 13.4%).
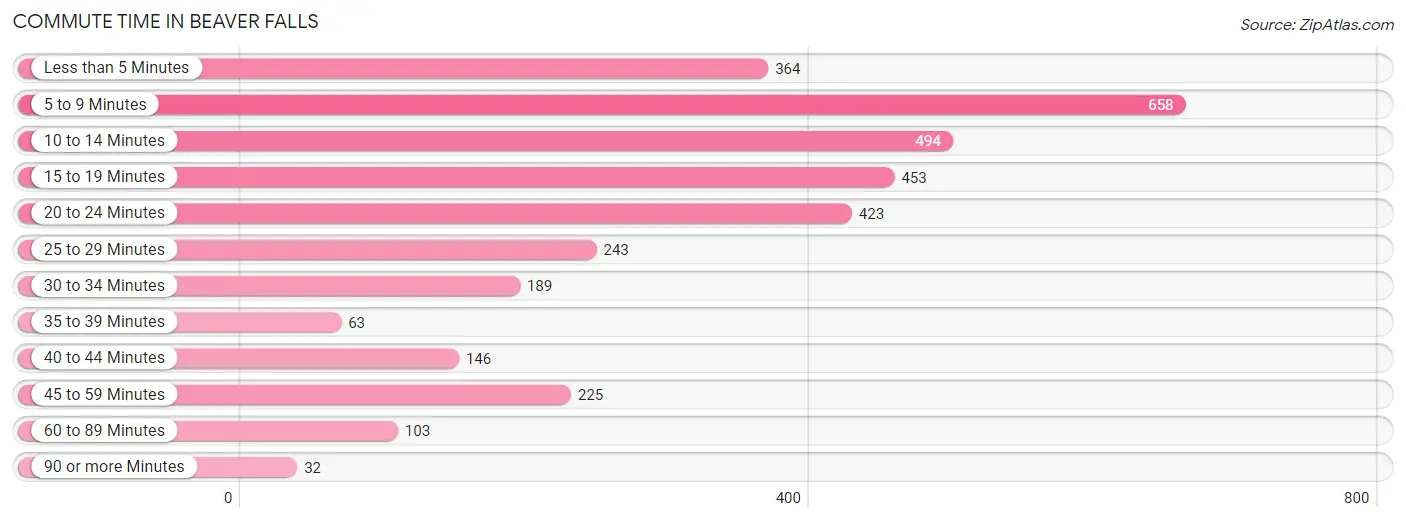
| Commute Time | # Commuters | % Commuters |
| Less than 5 Minutes | 364 | 10.7% |
| 5 to 9 Minutes | 658 | 19.4% |
| 10 to 14 Minutes | 494 | 14.6% |
| 15 to 19 Minutes | 453 | 13.4% |
| 20 to 24 Minutes | 423 | 12.5% |
| 25 to 29 Minutes | 243 | 7.2% |
| 30 to 34 Minutes | 189 | 5.6% |
| 35 to 39 Minutes | 63 | 1.9% |
| 40 to 44 Minutes | 146 | 4.3% |
| 45 to 59 Minutes | 225 | 6.6% |
| 60 to 89 Minutes | 103 | 3.0% |
| 90 or more Minutes | 32 | 0.9% |
Commute Time by Sex in Beaver Falls
The most common commute times in Beaver Falls are 5 to 9 minutes (359 commuters, 21.1%) for males and less than 5 minutes (333 commuters, 19.7%) for females.
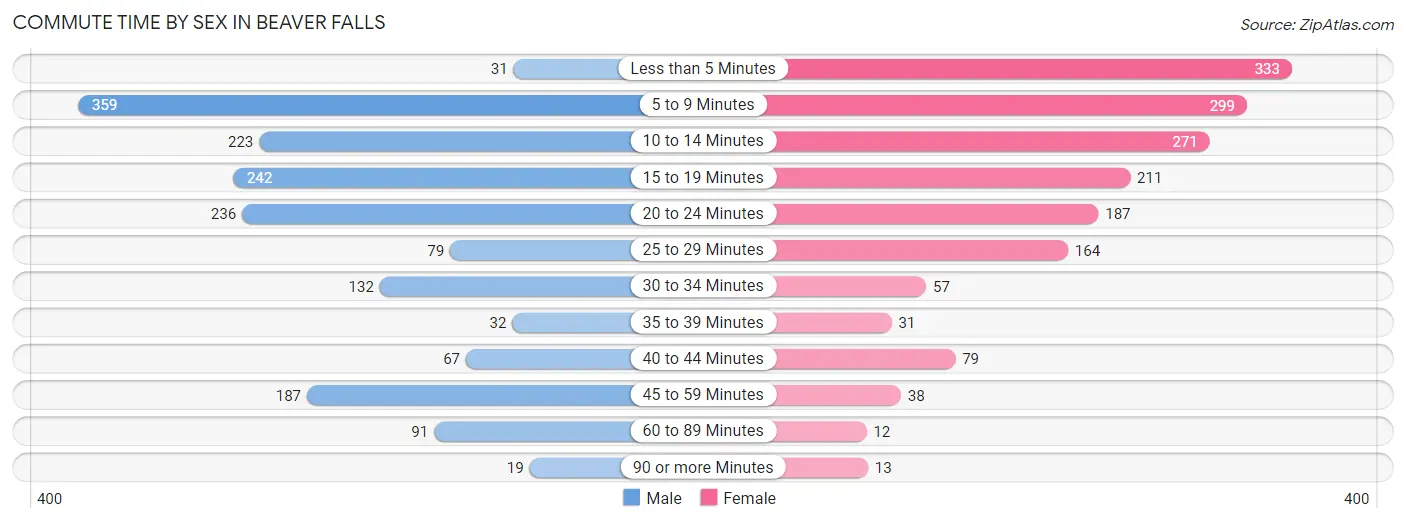
| Commute Time | Male | Female |
| Less than 5 Minutes | 31 (1.8%) | 333 (19.7%) |
| 5 to 9 Minutes | 359 (21.1%) | 299 (17.6%) |
| 10 to 14 Minutes | 223 (13.1%) | 271 (16.0%) |
| 15 to 19 Minutes | 242 (14.2%) | 211 (12.4%) |
| 20 to 24 Minutes | 236 (13.9%) | 187 (11.0%) |
| 25 to 29 Minutes | 79 (4.6%) | 164 (9.7%) |
| 30 to 34 Minutes | 132 (7.8%) | 57 (3.4%) |
| 35 to 39 Minutes | 32 (1.9%) | 31 (1.8%) |
| 40 to 44 Minutes | 67 (4.0%) | 79 (4.7%) |
| 45 to 59 Minutes | 187 (11.0%) | 38 (2.2%) |
| 60 to 89 Minutes | 91 (5.4%) | 12 (0.7%) |
| 90 or more Minutes | 19 (1.1%) | 13 (0.8%) |
Time of Departure to Work by Sex in Beaver Falls
The most frequent times of departure to work in Beaver Falls are 5:30 AM to 5:59 AM (471, 27.7%) for males and 7:30 AM to 7:59 AM (308, 18.2%) for females.
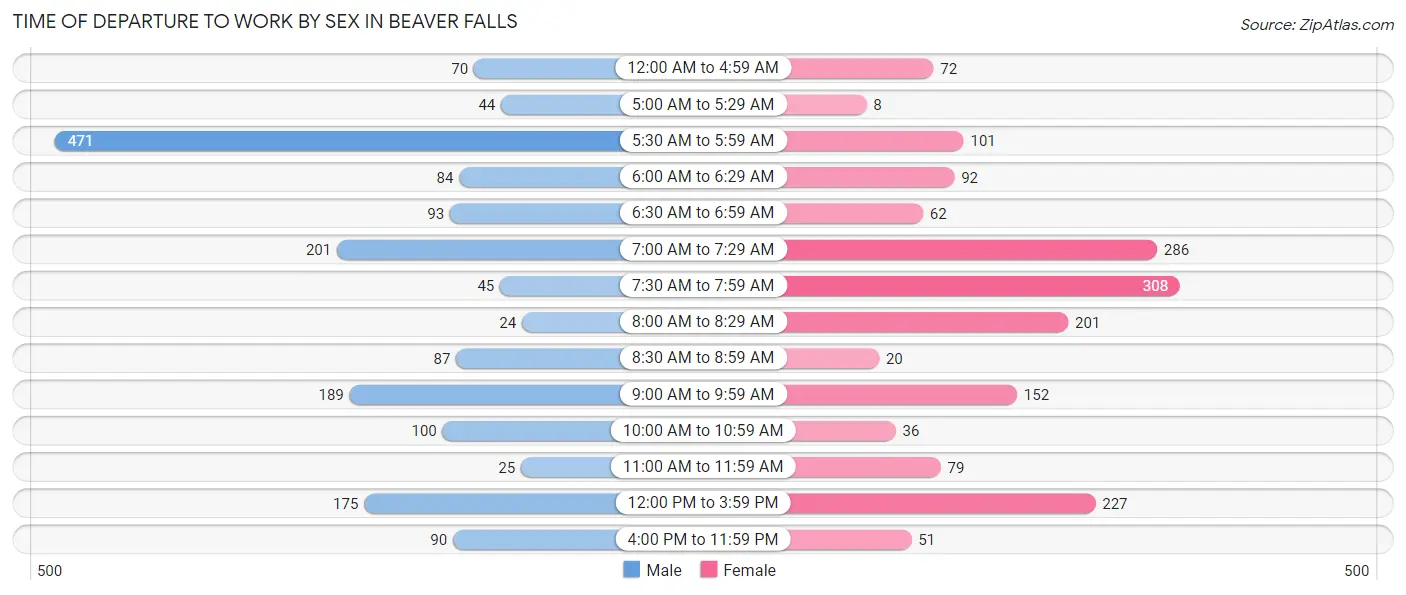
| Time of Departure | Male | Female |
| 12:00 AM to 4:59 AM | 70 (4.1%) | 72 (4.3%) |
| 5:00 AM to 5:29 AM | 44 (2.6%) | 8 (0.5%) |
| 5:30 AM to 5:59 AM | 471 (27.7%) | 101 (6.0%) |
| 6:00 AM to 6:29 AM | 84 (5.0%) | 92 (5.4%) |
| 6:30 AM to 6:59 AM | 93 (5.5%) | 62 (3.7%) |
| 7:00 AM to 7:29 AM | 201 (11.8%) | 286 (16.9%) |
| 7:30 AM to 7:59 AM | 45 (2.6%) | 308 (18.2%) |
| 8:00 AM to 8:29 AM | 24 (1.4%) | 201 (11.9%) |
| 8:30 AM to 8:59 AM | 87 (5.1%) | 20 (1.2%) |
| 9:00 AM to 9:59 AM | 189 (11.1%) | 152 (9.0%) |
| 10:00 AM to 10:59 AM | 100 (5.9%) | 36 (2.1%) |
| 11:00 AM to 11:59 AM | 25 (1.5%) | 79 (4.7%) |
| 12:00 PM to 3:59 PM | 175 (10.3%) | 227 (13.4%) |
| 4:00 PM to 11:59 PM | 90 (5.3%) | 51 (3.0%) |
| Total | 1,698 (100.0%) | 1,695 (100.0%) |
Housing Occupancy in Beaver Falls
Occupancy by Ownership in Beaver Falls
Of the total 3,484 dwellings in Beaver Falls, owner-occupied units account for 1,553 (44.6%), while renter-occupied units make up 1,931 (55.4%).
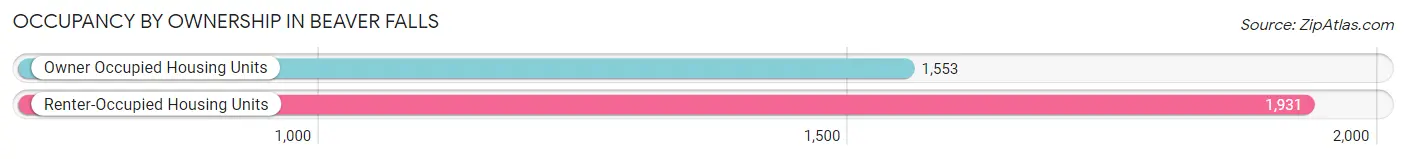
| Occupancy | # Housing Units | % Housing Units |
| Owner Occupied Housing Units | 1,553 | 44.6% |
| Renter-Occupied Housing Units | 1,931 | 55.4% |
| Total Occupied Housing Units | 3,484 | 100.0% |
Occupancy by Household Size in Beaver Falls
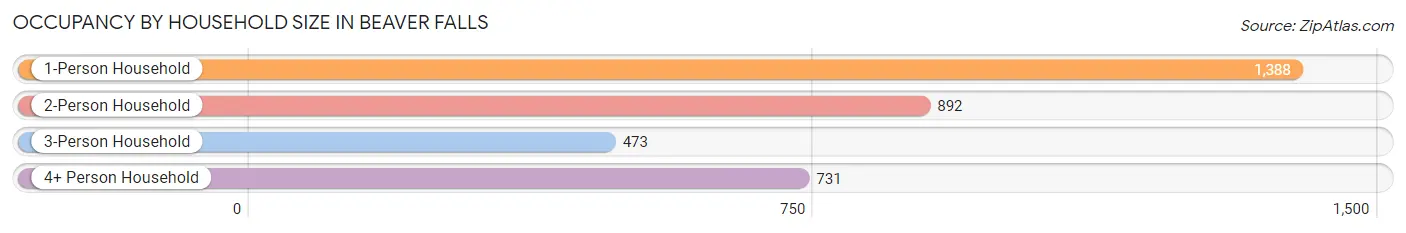
| Household Size | # Housing Units | % Housing Units |
| 1-Person Household | 1,388 | 39.8% |
| 2-Person Household | 892 | 25.6% |
| 3-Person Household | 473 | 13.6% |
| 4+ Person Household | 731 | 21.0% |
| Total Housing Units | 3,484 | 100.0% |
Occupancy by Ownership by Household Size in Beaver Falls
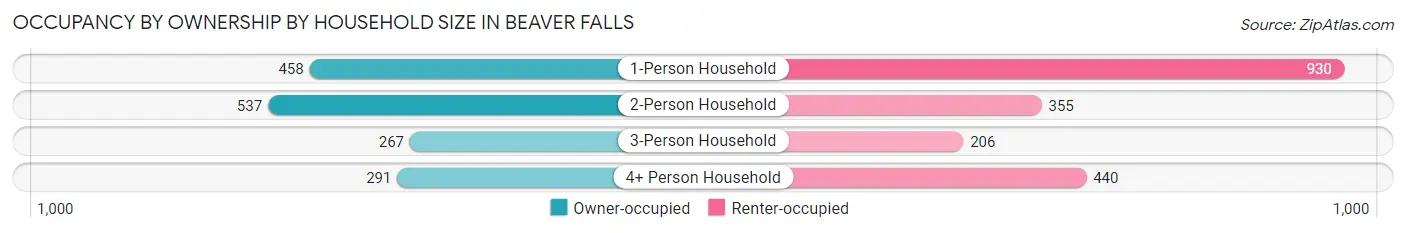
| Household Size | Owner-occupied | Renter-occupied |
| 1-Person Household | 458 (33.0%) | 930 (67.0%) |
| 2-Person Household | 537 (60.2%) | 355 (39.8%) |
| 3-Person Household | 267 (56.5%) | 206 (43.5%) |
| 4+ Person Household | 291 (39.8%) | 440 (60.2%) |
| Total Housing Units | 1,553 (44.6%) | 1,931 (55.4%) |
Occupancy by Educational Attainment in Beaver Falls
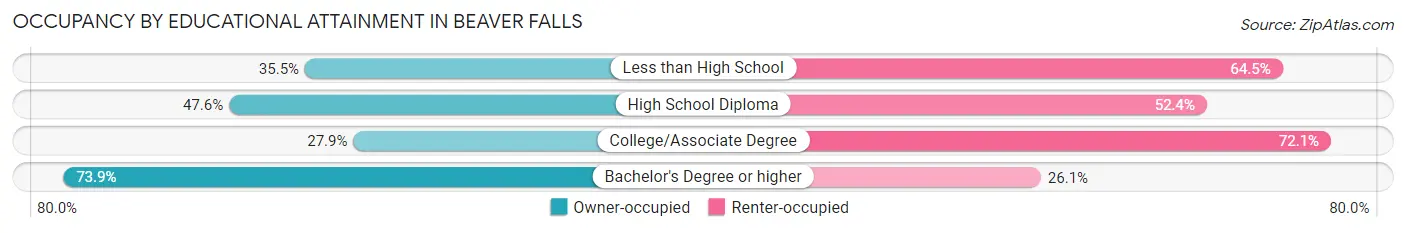
| Household Size | Owner-occupied | Renter-occupied |
| Less than High School | 172 (35.5%) | 312 (64.5%) |
| High School Diploma | 606 (47.6%) | 668 (52.4%) |
| College/Associate Degree | 303 (27.9%) | 784 (72.1%) |
| Bachelor's Degree or higher | 472 (73.9%) | 167 (26.1%) |
Occupancy by Age of Householder in Beaver Falls
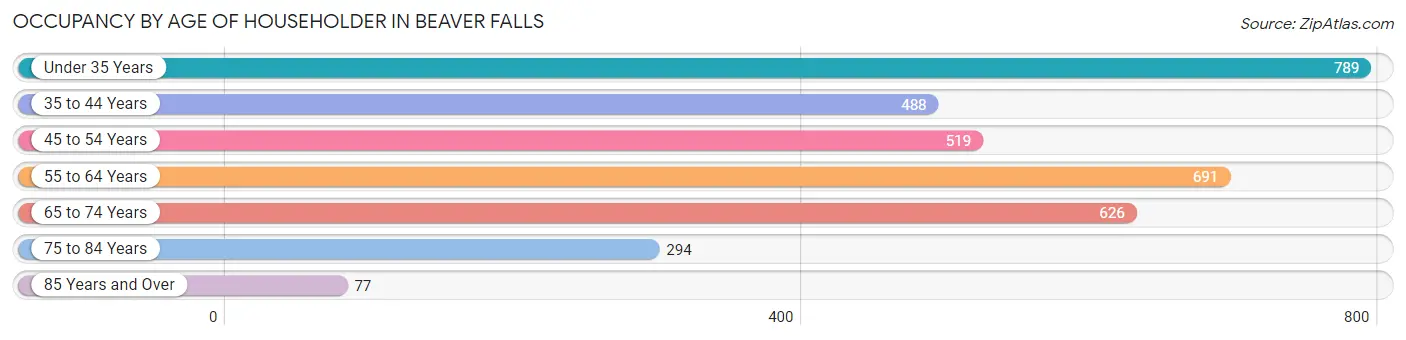
| Age Bracket | # Households | % Households |
| Under 35 Years | 789 | 22.7% |
| 35 to 44 Years | 488 | 14.0% |
| 45 to 54 Years | 519 | 14.9% |
| 55 to 64 Years | 691 | 19.8% |
| 65 to 74 Years | 626 | 18.0% |
| 75 to 84 Years | 294 | 8.4% |
| 85 Years and Over | 77 | 2.2% |
| Total | 3,484 | 100.0% |
Housing Finances in Beaver Falls
Median Income by Occupancy in Beaver Falls
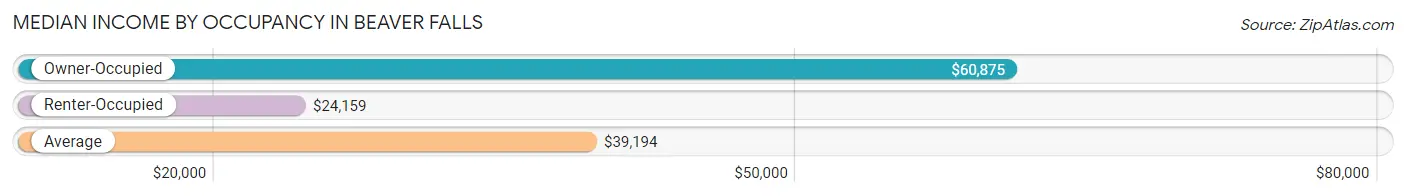
| Occupancy Type | # Households | Median Income |
| Owner-Occupied | 1,553 (44.6%) | $60,875 |
| Renter-Occupied | 1,931 (55.4%) | $24,159 |
| Average | 3,484 (100.0%) | $39,194 |
Occupancy by Householder Income Bracket in Beaver Falls
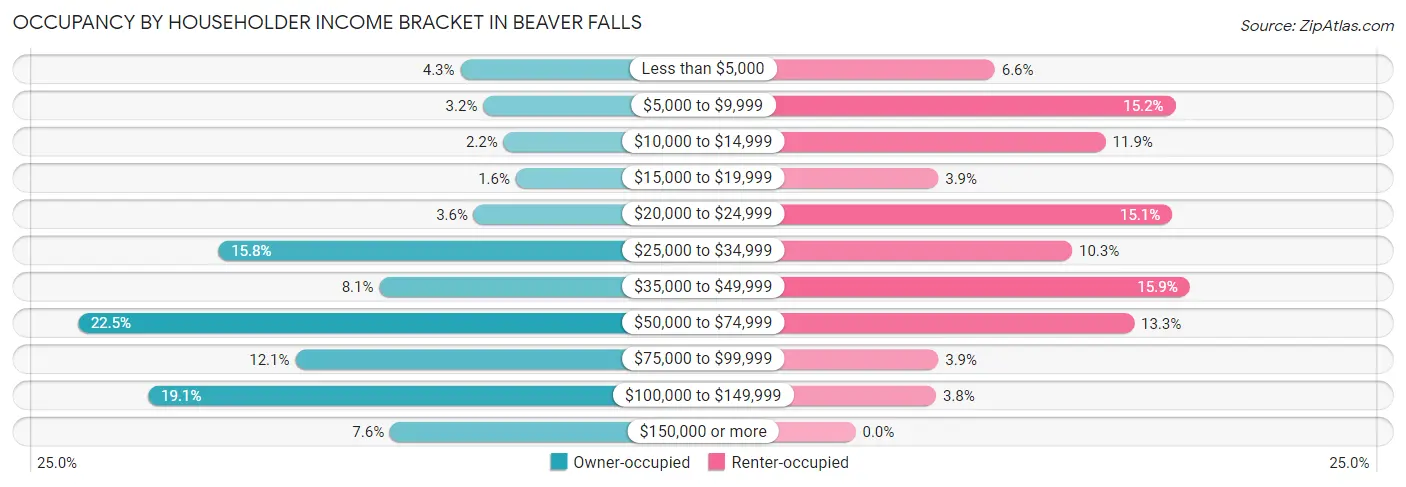
| Income Bracket | Owner-occupied | Renter-occupied |
| Less than $5,000 | 66 (4.3%) | 128 (6.6%) |
| $5,000 to $9,999 | 49 (3.2%) | 294 (15.2%) |
| $10,000 to $14,999 | 34 (2.2%) | 230 (11.9%) |
| $15,000 to $19,999 | 25 (1.6%) | 76 (3.9%) |
| $20,000 to $24,999 | 56 (3.6%) | 291 (15.1%) |
| $25,000 to $34,999 | 245 (15.8%) | 199 (10.3%) |
| $35,000 to $49,999 | 126 (8.1%) | 307 (15.9%) |
| $50,000 to $74,999 | 349 (22.5%) | 256 (13.3%) |
| $75,000 to $99,999 | 188 (12.1%) | 76 (3.9%) |
| $100,000 to $149,999 | 297 (19.1%) | 74 (3.8%) |
| $150,000 or more | 118 (7.6%) | 0 (0.0%) |
| Total | 1,553 (100.0%) | 1,931 (100.0%) |
Monthly Housing Cost Tiers in Beaver Falls
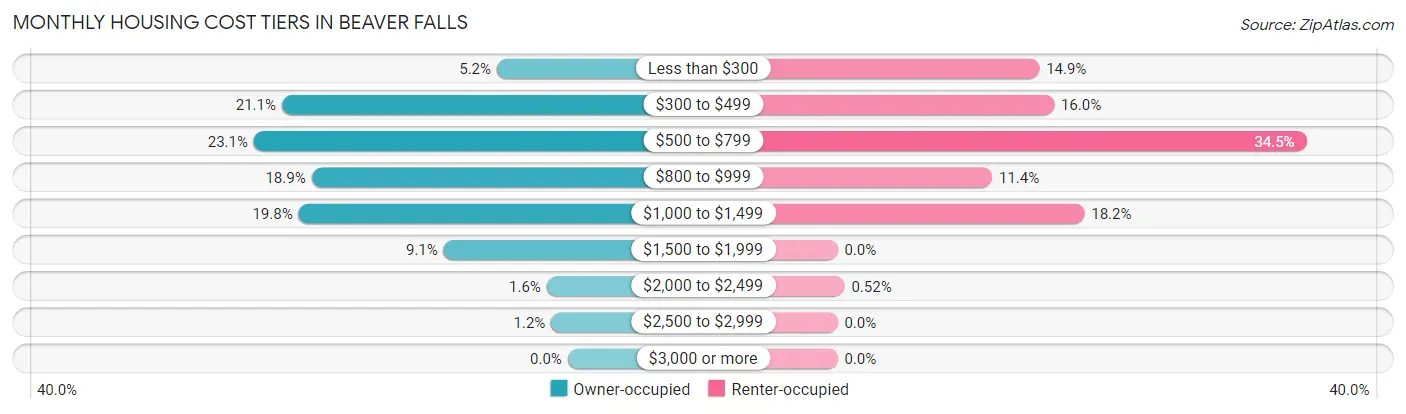
| Monthly Cost | Owner-occupied | Renter-occupied |
| Less than $300 | 81 (5.2%) | 287 (14.9%) |
| $300 to $499 | 327 (21.1%) | 308 (16.0%) |
| $500 to $799 | 359 (23.1%) | 667 (34.5%) |
| $800 to $999 | 293 (18.9%) | 220 (11.4%) |
| $1,000 to $1,499 | 308 (19.8%) | 351 (18.2%) |
| $1,500 to $1,999 | 142 (9.1%) | 0 (0.0%) |
| $2,000 to $2,499 | 24 (1.5%) | 10 (0.5%) |
| $2,500 to $2,999 | 19 (1.2%) | 0 (0.0%) |
| $3,000 or more | 0 (0.0%) | 0 (0.0%) |
| Total | 1,553 (100.0%) | 1,931 (100.0%) |
Physical Housing Characteristics in Beaver Falls
Housing Structures in Beaver Falls
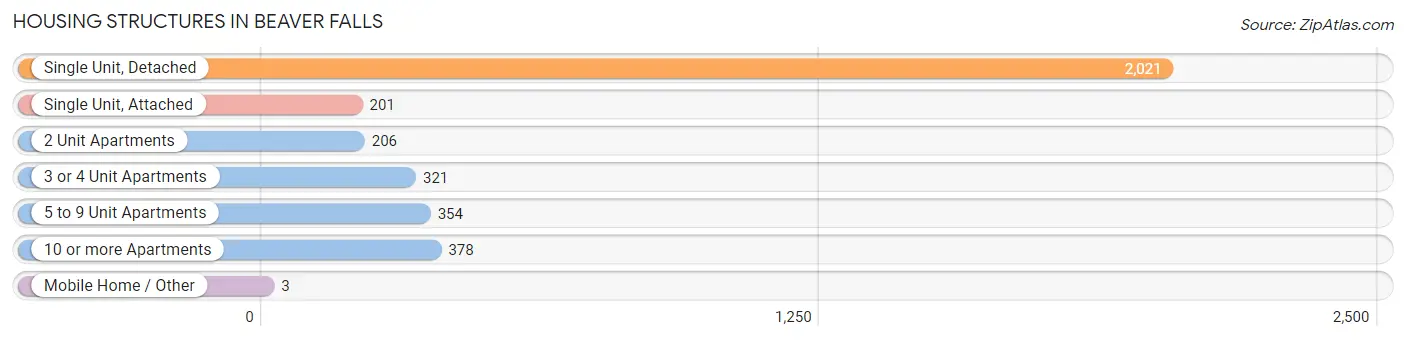
| Structure Type | # Housing Units | % Housing Units |
| Single Unit, Detached | 2,021 | 58.0% |
| Single Unit, Attached | 201 | 5.8% |
| 2 Unit Apartments | 206 | 5.9% |
| 3 or 4 Unit Apartments | 321 | 9.2% |
| 5 to 9 Unit Apartments | 354 | 10.2% |
| 10 or more Apartments | 378 | 10.8% |
| Mobile Home / Other | 3 | 0.1% |
| Total | 3,484 | 100.0% |
Housing Structures by Occupancy in Beaver Falls
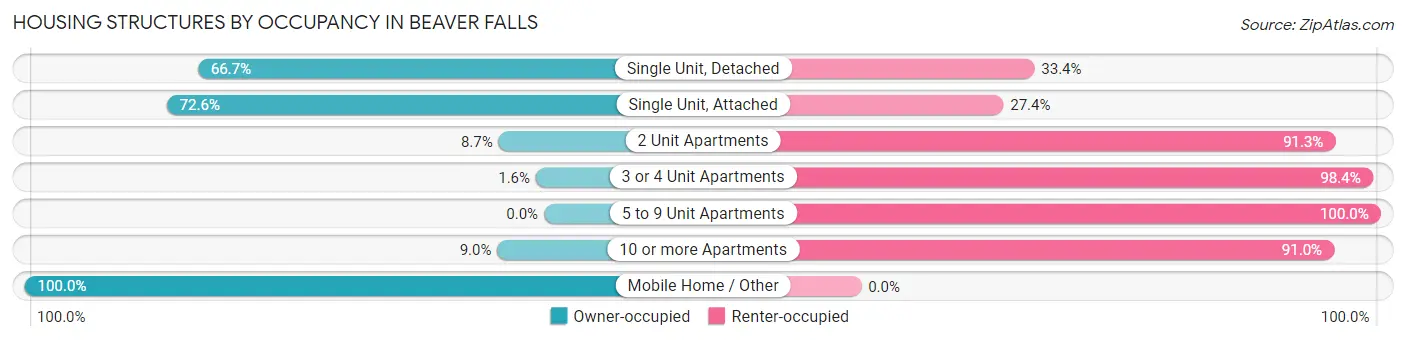
| Structure Type | Owner-occupied | Renter-occupied |
| Single Unit, Detached | 1,347 (66.6%) | 674 (33.4%) |
| Single Unit, Attached | 146 (72.6%) | 55 (27.4%) |
| 2 Unit Apartments | 18 (8.7%) | 188 (91.3%) |
| 3 or 4 Unit Apartments | 5 (1.6%) | 316 (98.4%) |
| 5 to 9 Unit Apartments | 0 (0.0%) | 354 (100.0%) |
| 10 or more Apartments | 34 (9.0%) | 344 (91.0%) |
| Mobile Home / Other | 3 (100.0%) | 0 (0.0%) |
| Total | 1,553 (44.6%) | 1,931 (55.4%) |
Housing Structures by Number of Rooms in Beaver Falls
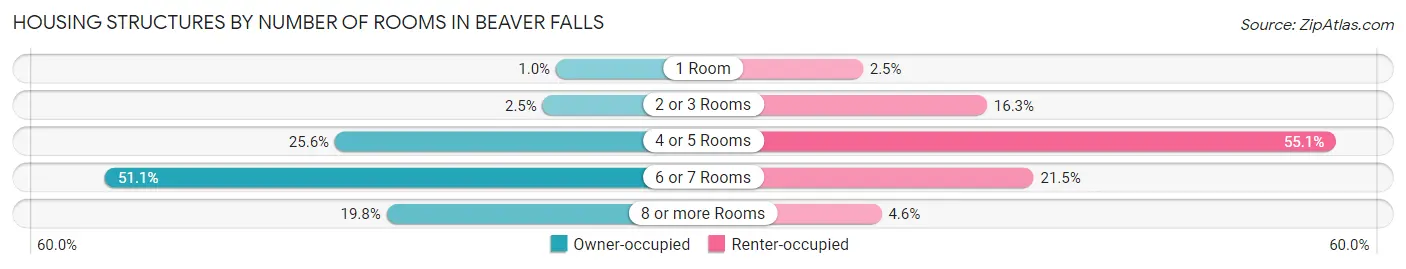
| Number of Rooms | Owner-occupied | Renter-occupied |
| 1 Room | 16 (1.0%) | 49 (2.5%) |
| 2 or 3 Rooms | 39 (2.5%) | 315 (16.3%) |
| 4 or 5 Rooms | 397 (25.6%) | 1,063 (55.0%) |
| 6 or 7 Rooms | 793 (51.1%) | 415 (21.5%) |
| 8 or more Rooms | 308 (19.8%) | 89 (4.6%) |
| Total | 1,553 (100.0%) | 1,931 (100.0%) |
Housing Structure by Heating Type in Beaver Falls
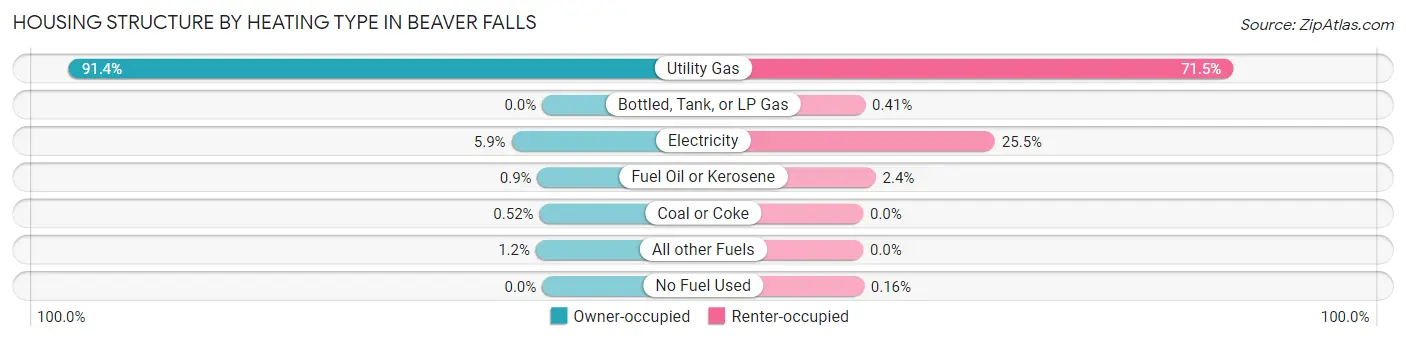
| Heating Type | Owner-occupied | Renter-occupied |
| Utility Gas | 1,420 (91.4%) | 1,381 (71.5%) |
| Bottled, Tank, or LP Gas | 0 (0.0%) | 8 (0.4%) |
| Electricity | 92 (5.9%) | 492 (25.5%) |
| Fuel Oil or Kerosene | 14 (0.9%) | 47 (2.4%) |
| Coal or Coke | 8 (0.5%) | 0 (0.0%) |
| All other Fuels | 19 (1.2%) | 0 (0.0%) |
| No Fuel Used | 0 (0.0%) | 3 (0.2%) |
| Total | 1,553 (100.0%) | 1,931 (100.0%) |
Household Vehicle Usage in Beaver Falls
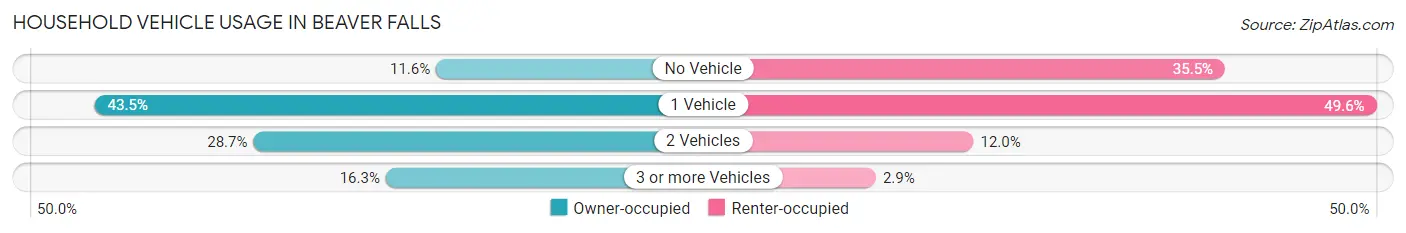
| Vehicles per Household | Owner-occupied | Renter-occupied |
| No Vehicle | 180 (11.6%) | 685 (35.5%) |
| 1 Vehicle | 675 (43.5%) | 958 (49.6%) |
| 2 Vehicles | 445 (28.6%) | 232 (12.0%) |
| 3 or more Vehicles | 253 (16.3%) | 56 (2.9%) |
| Total | 1,553 (100.0%) | 1,931 (100.0%) |
Real Estate & Mortgages in Beaver Falls
Real Estate and Mortgage Overview in Beaver Falls
| Characteristic | Without Mortgage | With Mortgage |
| Housing Units | 724 | 829 |
| Median Property Value | $58,300 | $96,900 |
| Median Household Income | $40,000 | $109 |
| Monthly Housing Costs | $485 | $0 |
| Real Estate Taxes | $1,124 | $0 |
Property Value by Mortgage Status in Beaver Falls
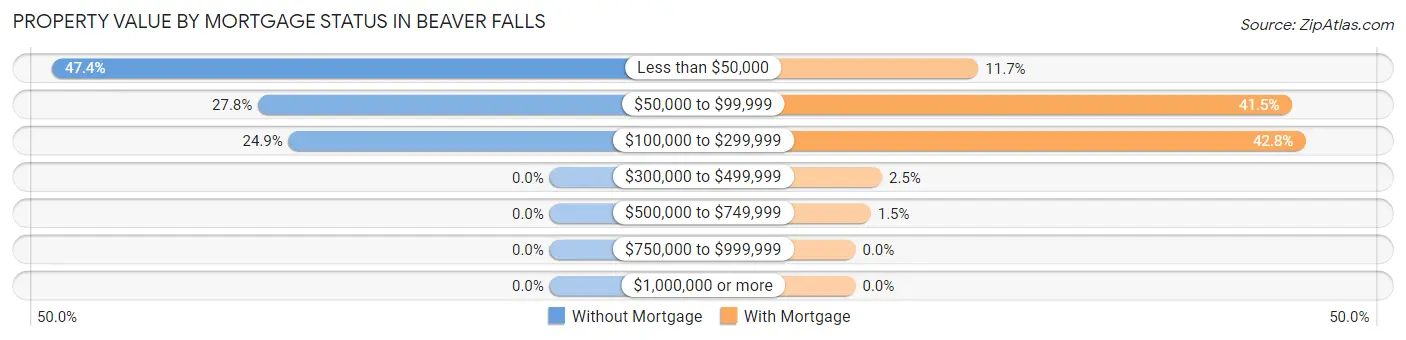
| Property Value | Without Mortgage | With Mortgage |
| Less than $50,000 | 343 (47.4%) | 97 (11.7%) |
| $50,000 to $99,999 | 201 (27.8%) | 344 (41.5%) |
| $100,000 to $299,999 | 180 (24.9%) | 355 (42.8%) |
| $300,000 to $499,999 | 0 (0.0%) | 21 (2.5%) |
| $500,000 to $749,999 | 0 (0.0%) | 12 (1.5%) |
| $750,000 to $999,999 | 0 (0.0%) | 0 (0.0%) |
| $1,000,000 or more | 0 (0.0%) | 0 (0.0%) |
| Total | 724 (100.0%) | 829 (100.0%) |
Household Income by Mortgage Status in Beaver Falls
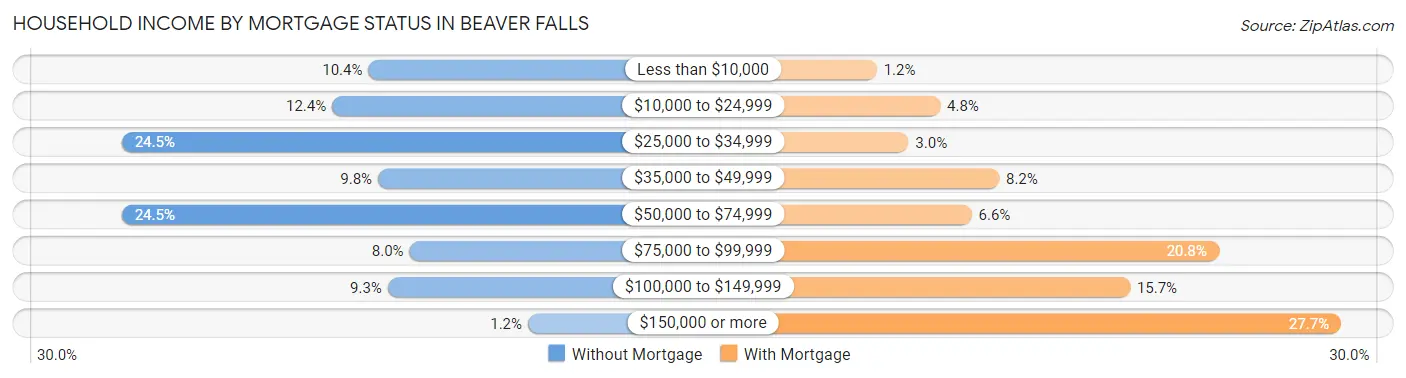
| Household Income | Without Mortgage | With Mortgage |
| Less than $10,000 | 75 (10.4%) | 10 (1.2%) |
| $10,000 to $24,999 | 90 (12.4%) | 40 (4.8%) |
| $25,000 to $34,999 | 177 (24.4%) | 25 (3.0%) |
| $35,000 to $49,999 | 71 (9.8%) | 68 (8.2%) |
| $50,000 to $74,999 | 177 (24.4%) | 55 (6.6%) |
| $75,000 to $99,999 | 58 (8.0%) | 172 (20.7%) |
| $100,000 to $149,999 | 67 (9.2%) | 130 (15.7%) |
| $150,000 or more | 9 (1.2%) | 230 (27.7%) |
| Total | 724 (100.0%) | 829 (100.0%) |
Property Value to Household Income Ratio in Beaver Falls
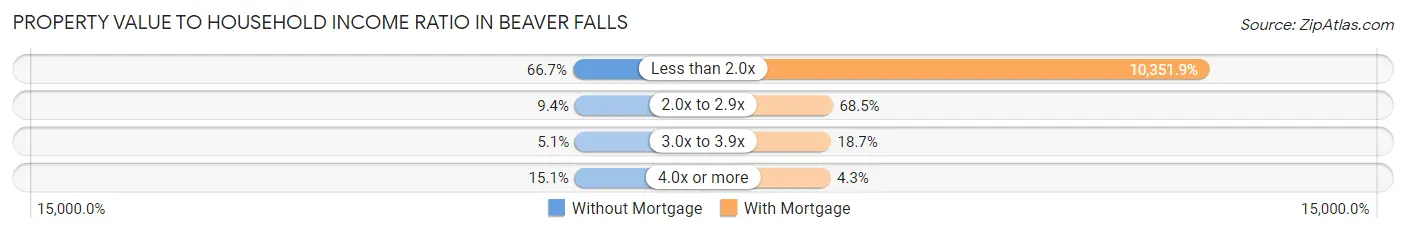
| Value-to-Income Ratio | Without Mortgage | With Mortgage |
| Less than 2.0x | 483 (66.7%) | 85,817 (10,351.9%) |
| 2.0x to 2.9x | 68 (9.4%) | 568 (68.5%) |
| 3.0x to 3.9x | 37 (5.1%) | 155 (18.7%) |
| 4.0x or more | 109 (15.1%) | 36 (4.3%) |
| Total | 724 (100.0%) | 829 (100.0%) |
Real Estate Taxes by Mortgage Status in Beaver Falls
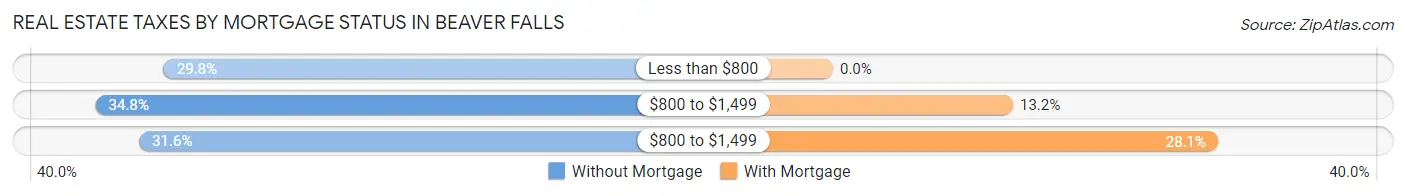
| Property Taxes | Without Mortgage | With Mortgage |
| Less than $800 | 216 (29.8%) | 0 (0.0%) |
| $800 to $1,499 | 252 (34.8%) | 109 (13.2%) |
| $800 to $1,499 | 229 (31.6%) | 233 (28.1%) |
| Total | 724 (100.0%) | 829 (100.0%) |
Health & Disability in Beaver Falls
Health Insurance Coverage by Age in Beaver Falls
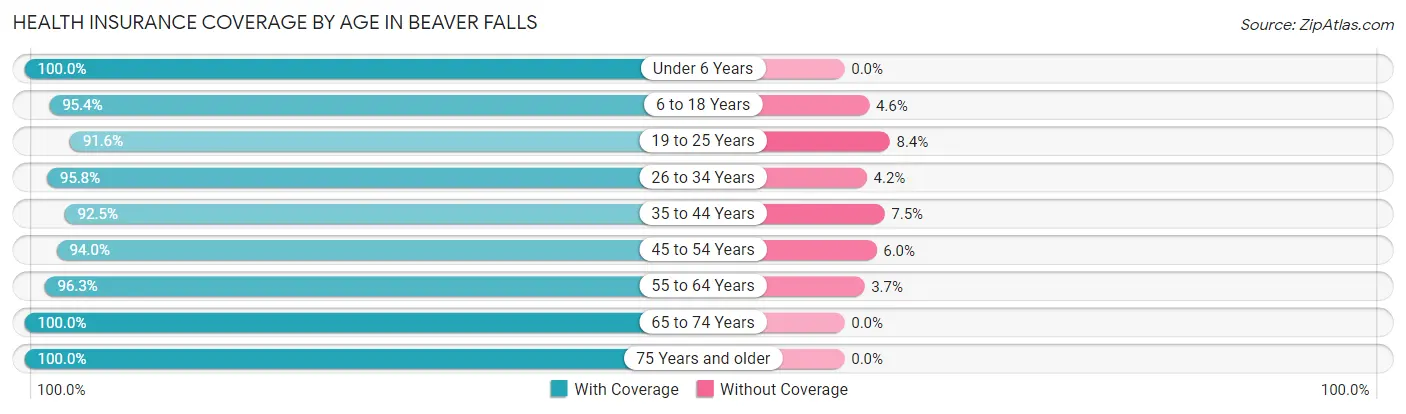
| Age Bracket | With Coverage | Without Coverage |
| Under 6 Years | 887 (100.0%) | 0 (0.0%) |
| 6 to 18 Years | 1,391 (95.4%) | 67 (4.6%) |
| 19 to 25 Years | 1,237 (91.6%) | 114 (8.4%) |
| 26 to 34 Years | 1,174 (95.8%) | 51 (4.2%) |
| 35 to 44 Years | 743 (92.5%) | 60 (7.5%) |
| 45 to 54 Years | 726 (94.0%) | 46 (6.0%) |
| 55 to 64 Years | 985 (96.3%) | 38 (3.7%) |
| 65 to 74 Years | 711 (100.0%) | 0 (0.0%) |
| 75 Years and older | 512 (100.0%) | 0 (0.0%) |
| Total | 8,366 (95.7%) | 376 (4.3%) |
Health Insurance Coverage by Citizenship Status in Beaver Falls
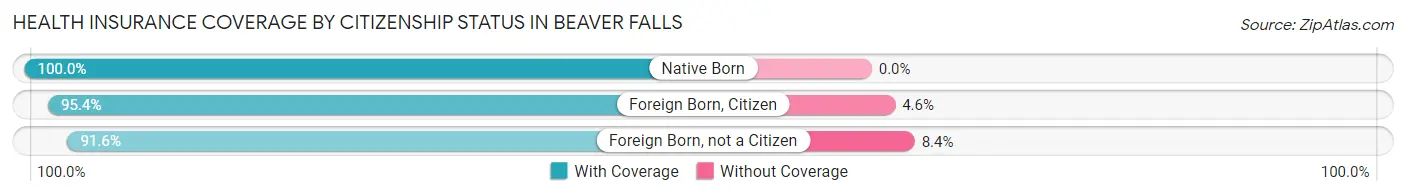
| Citizenship Status | With Coverage | Without Coverage |
| Native Born | 887 (100.0%) | 0 (0.0%) |
| Foreign Born, Citizen | 1,391 (95.4%) | 67 (4.6%) |
| Foreign Born, not a Citizen | 1,237 (91.6%) | 114 (8.4%) |
Health Insurance Coverage by Household Income in Beaver Falls
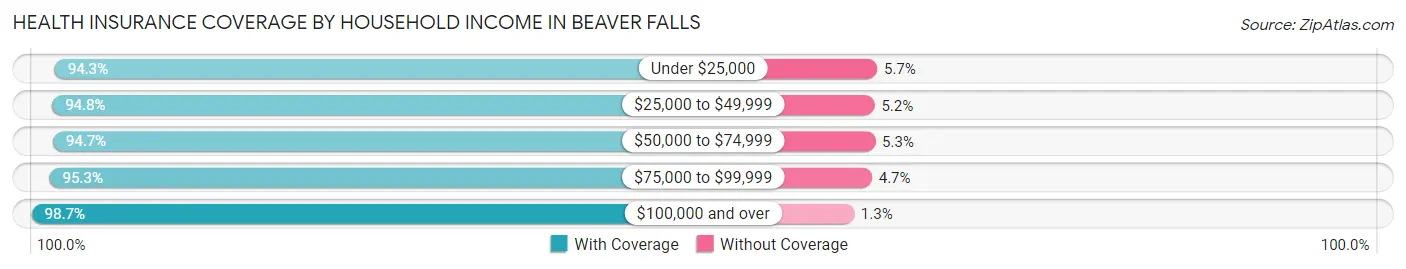
| Household Income | With Coverage | Without Coverage |
| Under $25,000 | 2,180 (94.3%) | 131 (5.7%) |
| $25,000 to $49,999 | 1,556 (94.8%) | 85 (5.2%) |
| $50,000 to $74,999 | 1,515 (94.7%) | 85 (5.3%) |
| $75,000 to $99,999 | 631 (95.3%) | 31 (4.7%) |
| $100,000 and over | 1,628 (98.7%) | 22 (1.3%) |
Public vs Private Health Insurance Coverage by Age in Beaver Falls
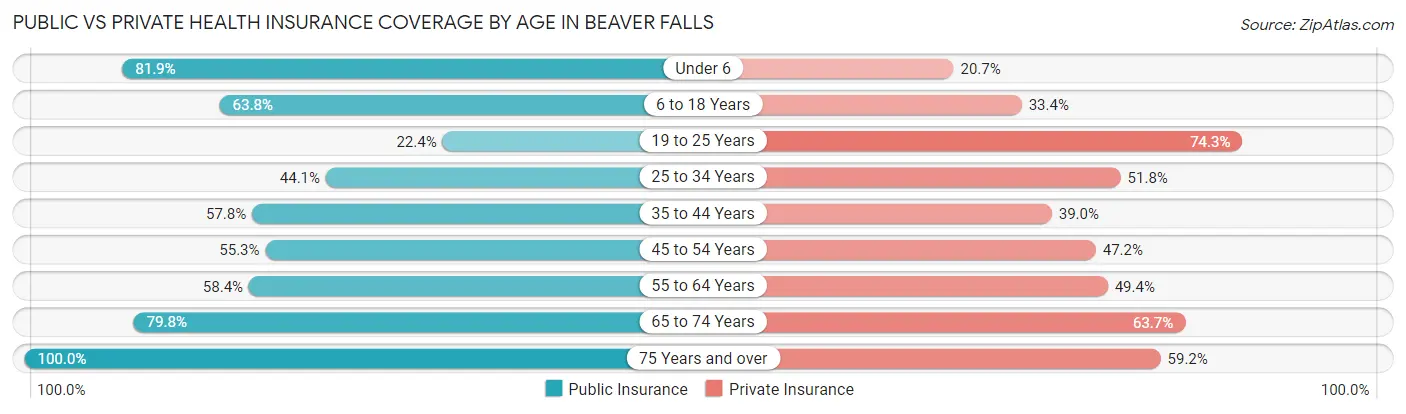
| Age Bracket | Public Insurance | Private Insurance |
| Under 6 | 726 (81.9%) | 184 (20.7%) |
| 6 to 18 Years | 930 (63.8%) | 487 (33.4%) |
| 19 to 25 Years | 303 (22.4%) | 1,004 (74.3%) |
| 25 to 34 Years | 540 (44.1%) | 634 (51.8%) |
| 35 to 44 Years | 464 (57.8%) | 313 (39.0%) |
| 45 to 54 Years | 427 (55.3%) | 364 (47.1%) |
| 55 to 64 Years | 597 (58.4%) | 505 (49.4%) |
| 65 to 74 Years | 567 (79.7%) | 453 (63.7%) |
| 75 Years and over | 512 (100.0%) | 303 (59.2%) |
| Total | 5,066 (58.0%) | 4,247 (48.6%) |
Disability Status by Sex by Age in Beaver Falls
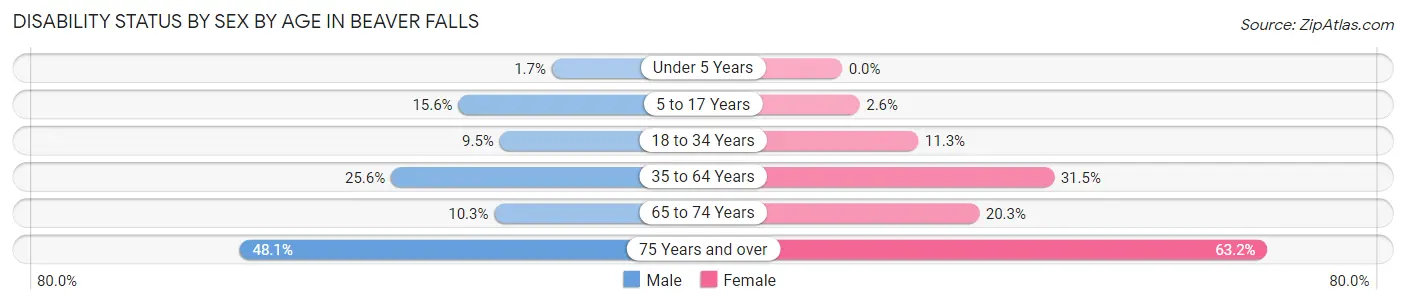
| Age Bracket | Male | Female |
| Under 5 Years | 6 (1.7%) | 0 (0.0%) |
| 5 to 17 Years | 110 (15.6%) | 18 (2.6%) |
| 18 to 34 Years | 140 (9.5%) | 153 (11.3%) |
| 35 to 64 Years | 303 (25.6%) | 445 (31.5%) |
| 65 to 74 Years | 25 (10.2%) | 95 (20.3%) |
| 75 Years and over | 75 (48.1%) | 225 (63.2%) |
Disability Class by Sex by Age in Beaver Falls
Disability Class: Hearing Difficulty
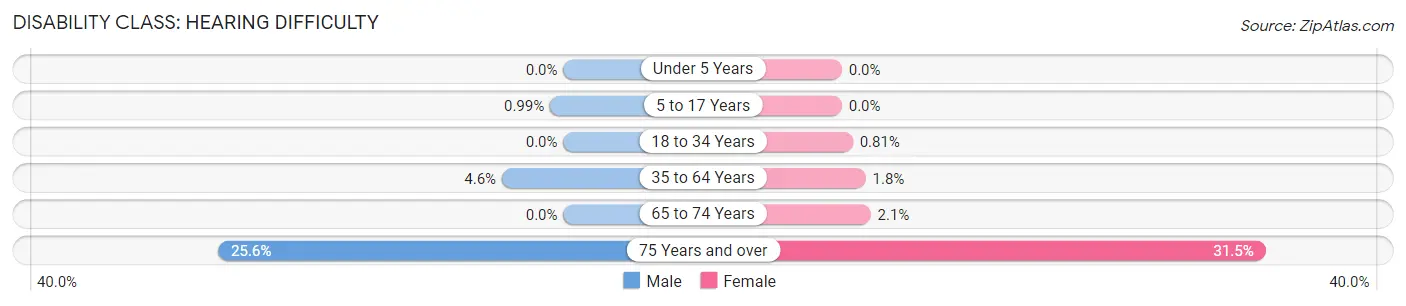
| Age Bracket | Male | Female |
| Under 5 Years | 0 (0.0%) | 0 (0.0%) |
| 5 to 17 Years | 7 (1.0%) | 0 (0.0%) |
| 18 to 34 Years | 0 (0.0%) | 11 (0.8%) |
| 35 to 64 Years | 54 (4.6%) | 25 (1.8%) |
| 65 to 74 Years | 0 (0.0%) | 10 (2.1%) |
| 75 Years and over | 40 (25.6%) | 112 (31.5%) |
Disability Class: Vision Difficulty
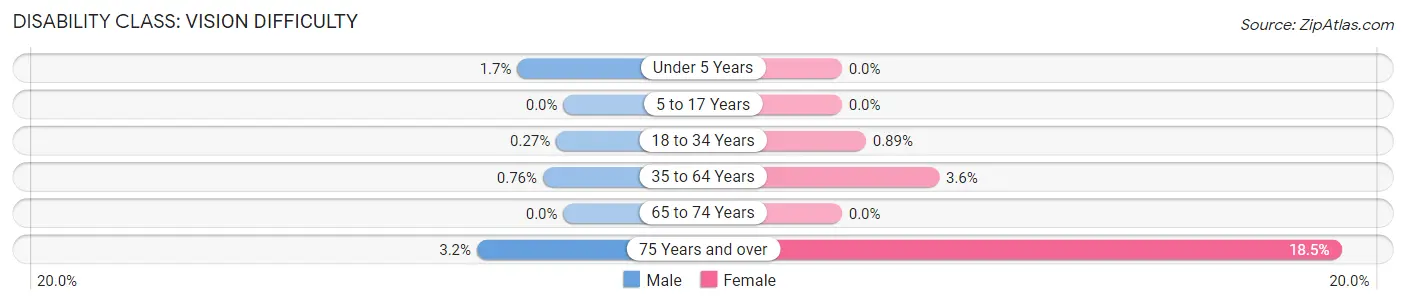
| Age Bracket | Male | Female |
| Under 5 Years | 6 (1.7%) | 0 (0.0%) |
| 5 to 17 Years | 0 (0.0%) | 0 (0.0%) |
| 18 to 34 Years | 4 (0.3%) | 12 (0.9%) |
| 35 to 64 Years | 9 (0.8%) | 51 (3.6%) |
| 65 to 74 Years | 0 (0.0%) | 0 (0.0%) |
| 75 Years and over | 5 (3.2%) | 66 (18.5%) |
Disability Class: Cognitive Difficulty
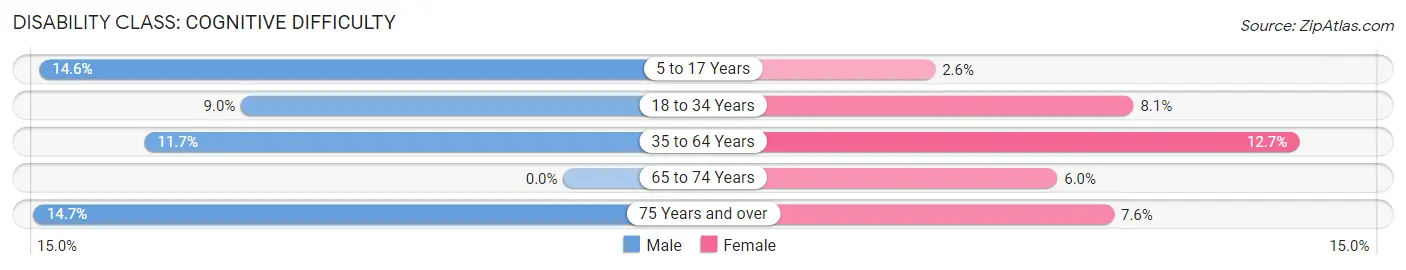
| Age Bracket | Male | Female |
| 5 to 17 Years | 103 (14.6%) | 18 (2.6%) |
| 18 to 34 Years | 133 (9.0%) | 110 (8.1%) |
| 35 to 64 Years | 138 (11.7%) | 180 (12.7%) |
| 65 to 74 Years | 0 (0.0%) | 28 (6.0%) |
| 75 Years and over | 23 (14.7%) | 27 (7.6%) |
Disability Class: Ambulatory Difficulty
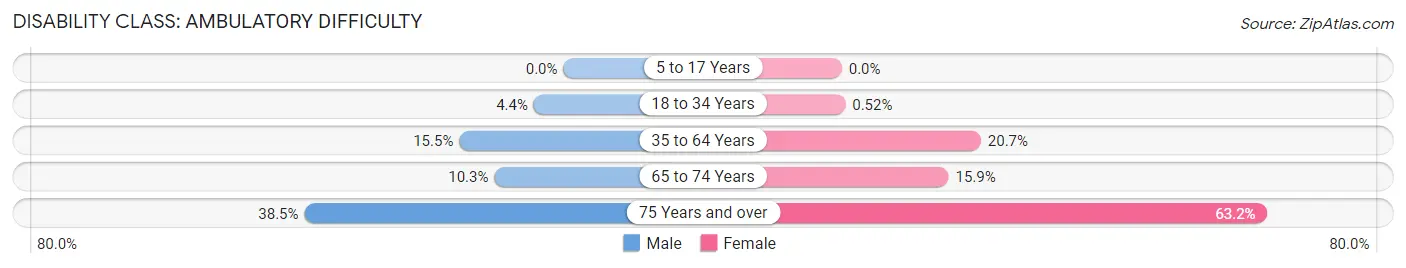
| Age Bracket | Male | Female |
| 5 to 17 Years | 0 (0.0%) | 0 (0.0%) |
| 18 to 34 Years | 65 (4.4%) | 7 (0.5%) |
| 35 to 64 Years | 183 (15.5%) | 292 (20.6%) |
| 65 to 74 Years | 25 (10.2%) | 74 (15.9%) |
| 75 Years and over | 60 (38.5%) | 225 (63.2%) |
Disability Class: Self-Care Difficulty
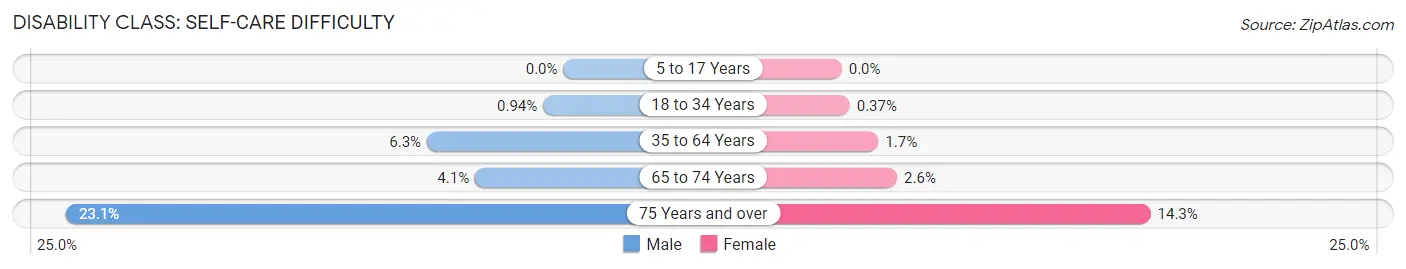
| Age Bracket | Male | Female |
| 5 to 17 Years | 0 (0.0%) | 0 (0.0%) |
| 18 to 34 Years | 14 (0.9%) | 5 (0.4%) |
| 35 to 64 Years | 75 (6.3%) | 24 (1.7%) |
| 65 to 74 Years | 10 (4.1%) | 12 (2.6%) |
| 75 Years and over | 36 (23.1%) | 51 (14.3%) |
Technology Access in Beaver Falls
Computing Device Access in Beaver Falls
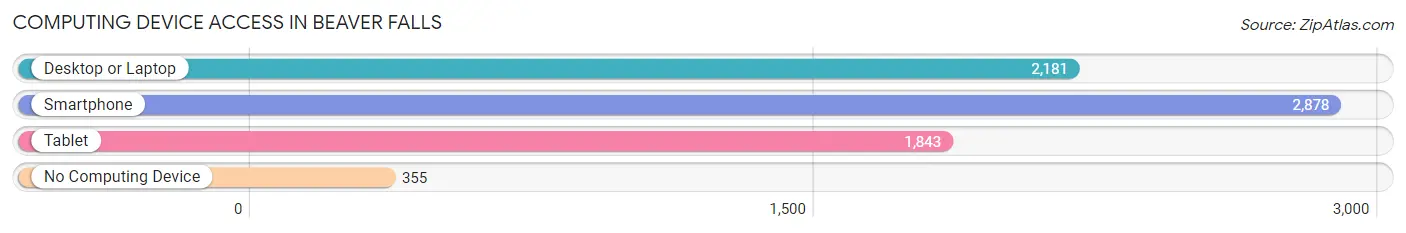
| Device Type | # Households | % Households |
| Desktop or Laptop | 2,181 | 62.6% |
| Smartphone | 2,878 | 82.6% |
| Tablet | 1,843 | 52.9% |
| No Computing Device | 355 | 10.2% |
| Total | 3,484 | 100.0% |
Internet Access in Beaver Falls
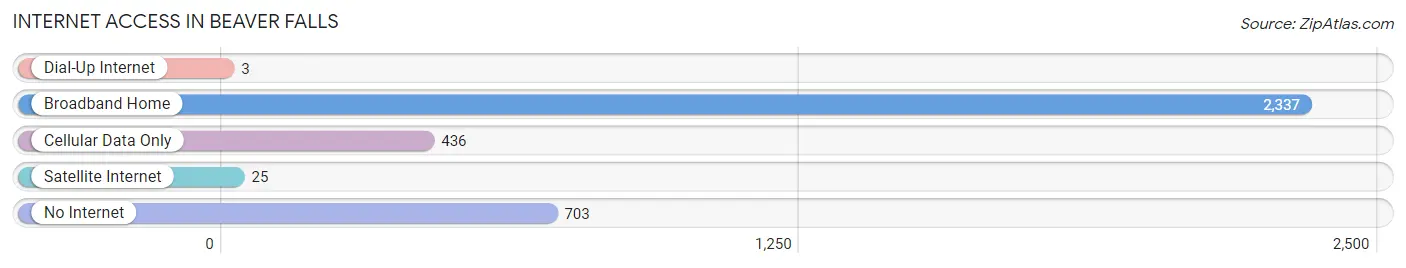
| Internet Type | # Households | % Households |
| Dial-Up Internet | 3 | 0.1% |
| Broadband Home | 2,337 | 67.1% |
| Cellular Data Only | 436 | 12.5% |
| Satellite Internet | 25 | 0.7% |
| No Internet | 703 | 20.2% |
| Total | 3,484 | 100.0% |
Beaver Falls Summary
Beaver Falls is a city located in Beaver County, Pennsylvania, United States. It is located along the Beaver River, approximately 25 miles northwest of Pittsburgh. The population was 8,987 at the 2010 census.
History
Beaver Falls was founded in 1800 by William B. Foster, a settler from New Jersey. The city was originally named Fallston, but was later changed to Beaver Falls in 1802. The city was incorporated as a borough in 1868 and as a city in 1892.
The city was an important industrial center in the late 19th and early 20th centuries. It was home to several steel mills, including the Beaver Falls Iron and Steel Company, which was founded in 1872. The city was also home to the Beaver Falls Cutlery Company, which was founded in 1876 and was one of the largest cutlery manufacturers in the United States.
Geography
Beaver Falls is located at 40°45'25" North, 80°19'37" West (40.756944, -80.326944). According to the United States Census Bureau, the city has a total area of 2.2 square miles, all of it land.
Economy
Beaver Falls is home to several businesses and industries. The city is home to the Beaver Falls Iron and Steel Company, which produces steel products for the construction and automotive industries. The city is also home to the Beaver Falls Cutlery Company, which produces cutlery for the food service industry.
The city is also home to several retail stores, including Walmart, Target, and Kmart. The city is also home to several restaurants, including McDonald's, Burger King, and Wendy's.
Demographics
As of the 2010 census, there were 8,987 people, 3,845 households, and 2,323 families residing in the city. The population density was 4,093.3 people per square mile. The racial makeup of the city was 79.2% White, 16.2% African American, 0.3% Native American, 0.7% Asian, 0.1% Pacific Islander, 1.2% from other races, and 2.3% from two or more races. Hispanic or Latino of any race were 3.2% of the population.
The median income for a household in the city was $27,917, and the median income for a family was $35,938. Males had a median income of $30,917 versus $22,917 for females. The per capita income for the city was $14,945. About 17.2% of families and 20.3% of the population were below the poverty line, including 28.2% of those under age 18 and 11.2% of those age 65 or over.
Common Questions
What is Per Capita Income in Beaver Falls?
Per Capita income in Beaver Falls is $20,070.
What is the Median Family Income in Beaver Falls?
Median Family Income in Beaver Falls is $55,040.
What is the Median Household income in Beaver Falls?
Median Household Income in Beaver Falls is $39,194.
What is Income or Wage Gap in Beaver Falls?
Income or Wage Gap in Beaver Falls is 26.8%.
Women in Beaver Falls earn 73.2 cents for every dollar earned by a man.
What is Inequality or Gini Index in Beaver Falls?
Inequality or Gini Index in Beaver Falls is 0.45.
What is the Total Population of Beaver Falls?
Total Population of Beaver Falls is 8,934.
What is the Total Male Population of Beaver Falls?
Total Male Population of Beaver Falls is 4,186.
What is the Total Female Population of Beaver Falls?
Total Female Population of Beaver Falls is 4,748.
What is the Ratio of Males per 100 Females in Beaver Falls?
There are 88.16 Males per 100 Females in Beaver Falls.
What is the Ratio of Females per 100 Males in Beaver Falls?
There are 113.43 Females per 100 Males in Beaver Falls.
What is the Median Population Age in Beaver Falls?
Median Population Age in Beaver Falls is 32.2 Years.
What is the Average Family Size in Beaver Falls
Average Family Size in Beaver Falls is 3.1 People.
What is the Average Household Size in Beaver Falls
Average Household Size in Beaver Falls is 2.3 People.
How Large is the Labor Force in Beaver Falls?
There are 4,237 People in the Labor Forcein in Beaver Falls.
What is the Percentage of People in the Labor Force in Beaver Falls?
59.9% of People are in the Labor Force in Beaver Falls.
What is the Unemployment Rate in Beaver Falls?
Unemployment Rate in Beaver Falls is 11.5%.