Zip Codes with the Highest Percentage of Families with Income Below $10,000 in Pittsburgh, PA
RELATED REPORTS & OPTIONS
Family Income | $0-10k
Pittsburgh
Compare Zip Codes
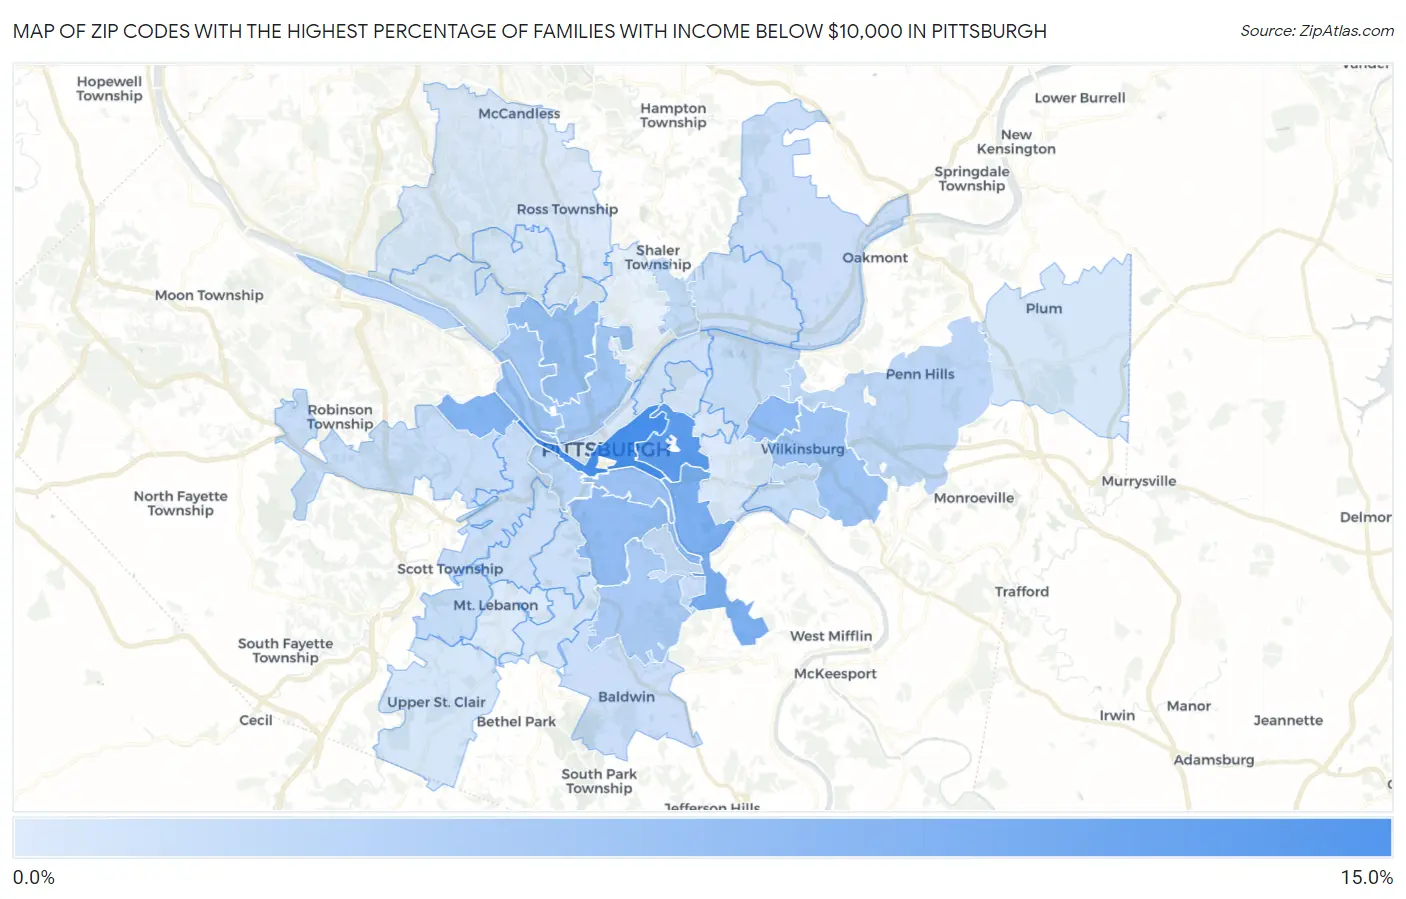
Map of Zip Codes with the Highest Percentage of Families with Income Below $10,000 in Pittsburgh
0.70%
13.8%
Zip Codes with the Highest Percentage of Families with Income Below $10,000 in Pittsburgh, PA
| Zip Code | Families with Income < $10k | vs State | vs National | |
| 1. | 15219 | 13.8% | 2.9%(+10.9)#35 | 3.1%(+10.7)#1,000 |
| 2. | 15213 | 11.8% | 2.9%(+8.90)#48 | 3.1%(+8.70)#1,368 |
| 3. | 15207 | 9.0% | 2.9%(+6.10)#87 | 3.1%(+5.90)#2,366 |
| 4. | 15204 | 8.3% | 2.9%(+5.40)#101 | 3.1%(+5.20)#2,783 |
| 5. | 15208 | 7.3% | 2.9%(+4.40)#132 | 3.1%(+4.20)#3,408 |
| 6. | 15210 | 7.2% | 2.9%(+4.30)#133 | 3.1%(+4.10)#3,474 |
| 7. | 15214 | 6.5% | 2.9%(+3.60)#154 | 3.1%(+3.40)#4,119 |
| 8. | 15203 | 6.3% | 2.9%(+3.40)#161 | 3.1%(+3.20)#4,327 |
| 9. | 15221 | 6.0% | 2.9%(+3.10)#174 | 3.1%(+2.90)#4,643 |
| 10. | 15233 | 5.9% | 2.9%(+3.00)#182 | 3.1%(+2.80)#4,840 |
| 11. | 15212 | 5.5% | 2.9%(+2.60)#207 | 3.1%(+2.40)#5,314 |
| 12. | 15227 | 5.0% | 2.9%(+2.10)#249 | 3.1%(+1.90)#6,097 |
| 13. | 15225 | 3.9% | 2.9%(+1.00)#359 | 3.1%(+0.800)#8,607 |
| 14. | 15211 | 3.5% | 2.9%(+0.600)#408 | 3.1%(+0.400)#9,597 |
| 15. | 15235 | 3.3% | 2.9%(+0.400)#438 | 3.1%(+0.200)#10,131 |
| 16. | 15223 | 2.8% | 2.9%(-0.100)#538 | 3.1%(-0.300)#11,996 |
| 17. | 15206 | 2.7% | 2.9%(-0.200)#557 | 3.1%(-0.400)#12,284 |
| 18. | 15218 | 2.6% | 2.9%(-0.300)#578 | 3.1%(-0.500)#12,760 |
| 19. | 15243 | 2.6% | 2.9%(-0.300)#579 | 3.1%(-0.500)#12,763 |
| 20. | 15205 | 2.5% | 2.9%(-0.400)#599 | 3.1%(-0.600)#13,125 |
| 21. | 15220 | 2.5% | 2.9%(-0.400)#600 | 3.1%(-0.600)#13,152 |
| 22. | 15236 | 2.2% | 2.9%(-0.700)#654 | 3.1%(-0.900)#14,377 |
| 23. | 15238 | 2.2% | 2.9%(-0.700)#659 | 3.1%(-0.900)#14,476 |
| 24. | 15226 | 2.1% | 2.9%(-0.800)#683 | 3.1%(-1.000)#14,950 |
| 25. | 15216 | 2.0% | 2.9%(-0.900)#702 | 3.1%(-1.10)#15,364 |
| 26. | 15215 | 2.0% | 2.9%(-0.900)#705 | 3.1%(-1.10)#15,431 |
| 27. | 15201 | 1.8% | 2.9%(-1.10)#765 | 3.1%(-1.30)#16,404 |
| 28. | 15224 | 1.7% | 2.9%(-1.20)#801 | 3.1%(-1.40)#16,873 |
| 29. | 15234 | 1.4% | 2.9%(-1.50)#899 | 3.1%(-1.70)#18,347 |
| 30. | 15239 | 1.3% | 2.9%(-1.60)#931 | 3.1%(-1.80)#18,801 |
| 31. | 15229 | 1.3% | 2.9%(-1.60)#933 | 3.1%(-1.80)#18,843 |
| 32. | 15241 | 1.2% | 2.9%(-1.70)#959 | 3.1%(-1.90)#19,323 |
| 33. | 15202 | 1.2% | 2.9%(-1.70)#960 | 3.1%(-1.90)#19,337 |
| 34. | 15222 | 1.1% | 2.9%(-1.80)#996 | 3.1%(-2.00)#19,959 |
| 35. | 15232 | 1.0% | 2.9%(-1.90)#1,018 | 3.1%(-2.10)#20,385 |
| 36. | 15237 | 0.80% | 2.9%(-2.10)#1,061 | 3.1%(-2.30)#21,191 |
| 37. | 15217 | 0.80% | 2.9%(-2.10)#1,067 | 3.1%(-2.30)#21,254 |
| 38. | 15228 | 0.70% | 2.9%(-2.20)#1,096 | 3.1%(-2.40)#21,747 |
1
Common Questions
What are the Top 10 Zip Codes with the Highest Percentage of Families with Income Below $10,000 in Pittsburgh, PA?
Top 10 Zip Codes with the Highest Percentage of Families with Income Below $10,000 in Pittsburgh, PA are:
What zip code has the Highest Percentage of Families with Income Below $10,000 in Pittsburgh, PA?
15219 has the Highest Percentage of Families with Income Below $10,000 in Pittsburgh, PA with 13.8%.
What is the Percentage of Families with Income Below $10,000 in Pittsburgh, PA?
Percentage of Families with Income Below $10,000 in Pittsburgh is 5.1%.
What is the Percentage of Families with Income Below $10,000 in Pennsylvania?
Percentage of Families with Income Below $10,000 in Pennsylvania is 2.9%.
What is the Percentage of Families with Income Below $10,000 in the United States?
Percentage of Families with Income Below $10,000 in the United States is 3.1%.