Perryopolis borough, PA Map & Demographics
Perryopolis borough Overview
$30,614
PER CAPITA INCOME
$74,851
AVG FAMILY INCOME
$56,643
AVG HOUSEHOLD INCOME
61.4%
WAGE / INCOME GAP [ % ]
38.6¢/ $1
WAGE / INCOME GAP [ $ ]
0.44
INEQUALITY / GINI INDEX
1,537
TOTAL POPULATION
763
MALE POPULATION
774
FEMALE POPULATION
98.58
MALES / 100 FEMALES
101.44
FEMALES / 100 MALES
45.6
MEDIAN AGE
2.6
AVG FAMILY SIZE
2.1
AVG HOUSEHOLD SIZE
784
LABOR FORCE [ PEOPLE ]
61.8%
PERCENT IN LABOR FORCE
7.4%
UNEMPLOYMENT RATE
Income in Perryopolis borough
Income Overview in Perryopolis borough
Per Capita Income in Perryopolis borough is $30,614, while median incomes of families and households are $74,851 and $56,643 respectively.
| Characteristic | Number | Measure |
| Per Capita Income | 1,537 | $30,614 |
| Median Family Income | 467 | $74,851 |
| Mean Family Income | 467 | $83,115 |
| Median Household Income | 728 | $56,643 |
| Mean Household Income | 728 | $66,437 |
| Income Deficit | 467 | $0 |
| Wage / Income Gap (%) | 1,537 | 61.43% |
| Wage / Income Gap ($) | 1,537 | 38.57¢ per $1 |
| Gini / Inequality Index | 1,537 | 0.44 |
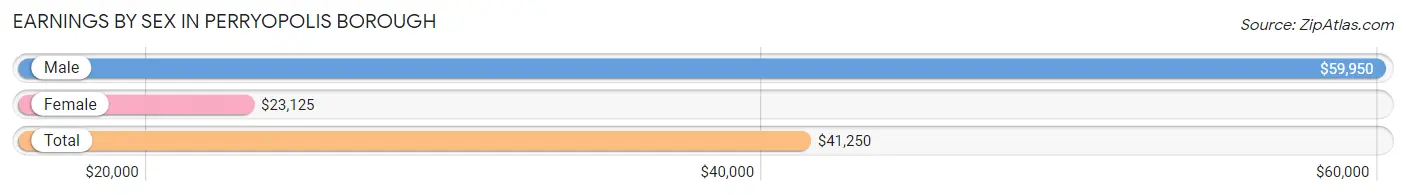
Earnings by Sex in Perryopolis borough
Average Earnings in Perryopolis borough are $41,250, $59,950 for men and $23,125 for women, a difference of 61.4%.
| Sex | Number | Average Earnings |
| Male | 381 (48.5%) | $59,950 |
| Female | 405 (51.5%) | $23,125 |
| Total | 786 (100.0%) | $41,250 |
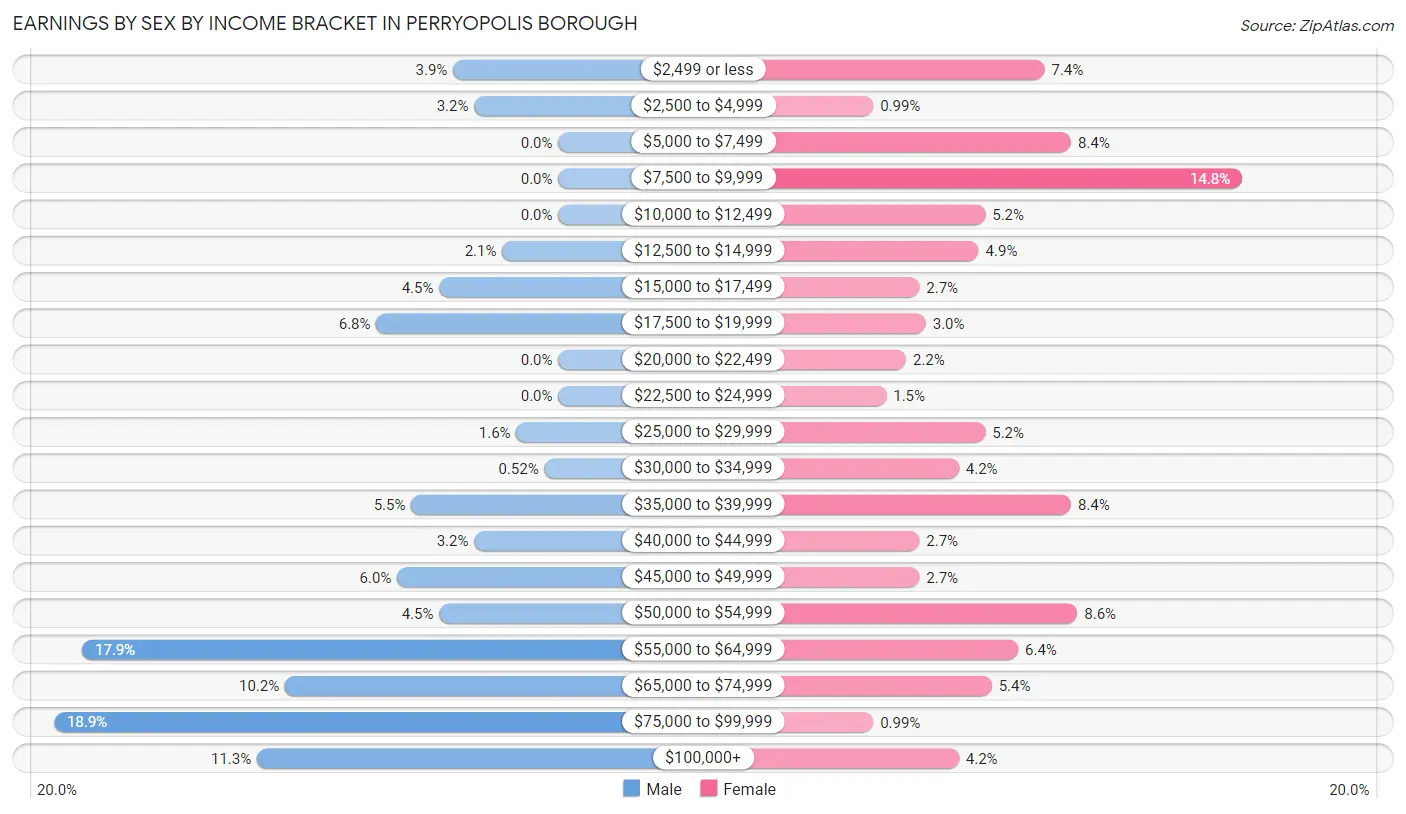
Earnings by Sex by Income Bracket in Perryopolis borough
The most common earnings brackets in Perryopolis borough are $75,000 to $99,999 for men (72 | 18.9%) and $7,500 to $9,999 for women (60 | 14.8%).
| Income | Male | Female |
| $2,499 or less | 15 (3.9%) | 30 (7.4%) |
| $2,500 to $4,999 | 12 (3.2%) | 4 (1.0%) |
| $5,000 to $7,499 | 0 (0.0%) | 34 (8.4%) |
| $7,500 to $9,999 | 0 (0.0%) | 60 (14.8%) |
| $10,000 to $12,499 | 0 (0.0%) | 21 (5.2%) |
| $12,500 to $14,999 | 8 (2.1%) | 20 (4.9%) |
| $15,000 to $17,499 | 17 (4.5%) | 11 (2.7%) |
| $17,500 to $19,999 | 26 (6.8%) | 12 (3.0%) |
| $20,000 to $22,499 | 0 (0.0%) | 9 (2.2%) |
| $22,500 to $24,999 | 0 (0.0%) | 6 (1.5%) |
| $25,000 to $29,999 | 6 (1.6%) | 21 (5.2%) |
| $30,000 to $34,999 | 2 (0.5%) | 17 (4.2%) |
| $35,000 to $39,999 | 21 (5.5%) | 34 (8.4%) |
| $40,000 to $44,999 | 12 (3.2%) | 11 (2.7%) |
| $45,000 to $49,999 | 23 (6.0%) | 11 (2.7%) |
| $50,000 to $54,999 | 17 (4.5%) | 35 (8.6%) |
| $55,000 to $64,999 | 68 (17.8%) | 26 (6.4%) |
| $65,000 to $74,999 | 39 (10.2%) | 22 (5.4%) |
| $75,000 to $99,999 | 72 (18.9%) | 4 (1.0%) |
| $100,000+ | 43 (11.3%) | 17 (4.2%) |
| Total | 381 (100.0%) | 405 (100.0%) |
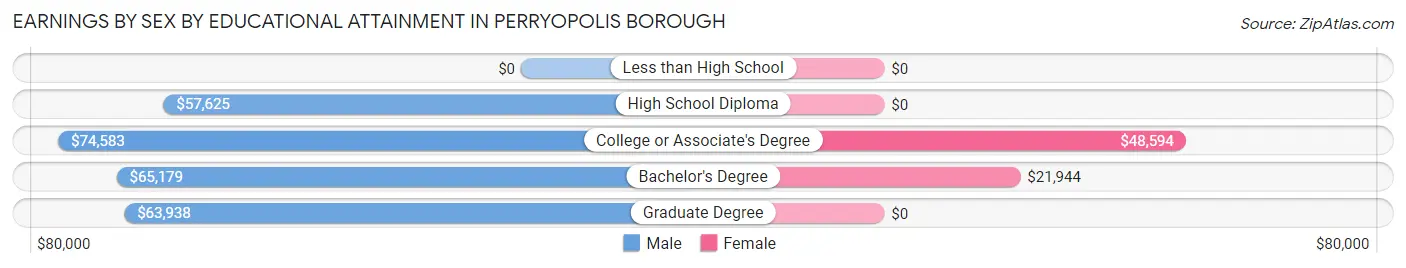
Earnings by Sex by Educational Attainment in Perryopolis borough
Average earnings in Perryopolis borough are $64,129 for men and $26,369 for women, a difference of 58.9%. Men with an educational attainment of college or associate's degree enjoy the highest average annual earnings of $74,583, while those with high school diploma education earn the least with $57,625. Women with an educational attainment of college or associate's degree earn the most with the average annual earnings of $48,594, while those with bachelor's degree education have the smallest earnings of $21,944.
| Educational Attainment | Male Income | Female Income |
| Less than High School | - | - |
| High School Diploma | $57,625 | $0 |
| College or Associate's Degree | $74,583 | $48,594 |
| Bachelor's Degree | $65,179 | $21,944 |
| Graduate Degree | $63,938 | $0 |
| Total | $64,129 | $26,369 |
Family Income in Perryopolis borough
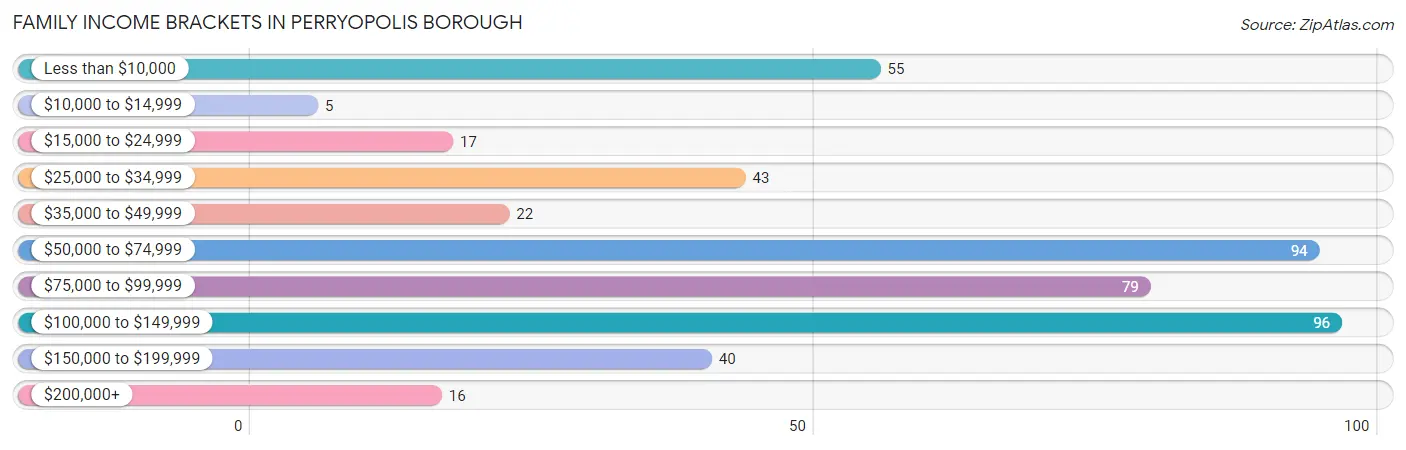
Family Income Brackets in Perryopolis borough
According to the Perryopolis borough family income data, there are 96 families falling into the $100,000 to $149,999 income range, which is the most common income bracket and makes up 20.6% of all families. Conversely, the $10,000 to $14,999 income bracket is the least frequent group with only 5 families (1.1%) belonging to this category.
| Income Bracket | # Families | % Families |
| Less than $10,000 | 55 | 11.8% |
| $10,000 to $14,999 | 5 | 1.1% |
| $15,000 to $24,999 | 17 | 3.6% |
| $25,000 to $34,999 | 43 | 9.2% |
| $35,000 to $49,999 | 22 | 4.7% |
| $50,000 to $74,999 | 94 | 20.1% |
| $75,000 to $99,999 | 79 | 16.9% |
| $100,000 to $149,999 | 96 | 20.6% |
| $150,000 to $199,999 | 40 | 8.6% |
| $200,000+ | 16 | 3.4% |
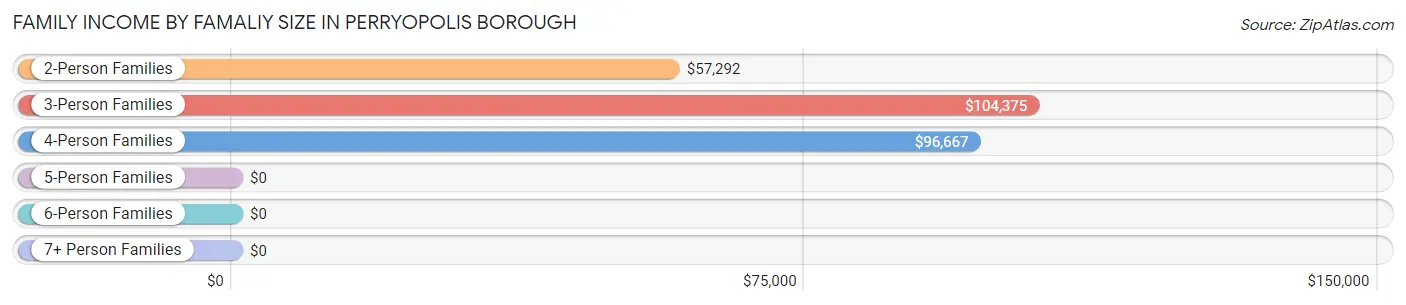
Family Income by Famaliy Size in Perryopolis borough
3-person families (107 | 22.9%) account for the highest median family income in Perryopolis borough with $104,375 per family, while 3-person families (107 | 22.9%) have the highest median income of $34,792 per family member.
| Income Bracket | # Families | Median Income |
| 2-Person Families | 264 (56.5%) | $57,292 |
| 3-Person Families | 107 (22.9%) | $104,375 |
| 4-Person Families | 88 (18.8%) | $96,667 |
| 5-Person Families | 4 (0.9%) | $0 |
| 6-Person Families | 0 (0.0%) | $0 |
| 7+ Person Families | 4 (0.9%) | $0 |
| Total | 467 (100.0%) | $74,851 |
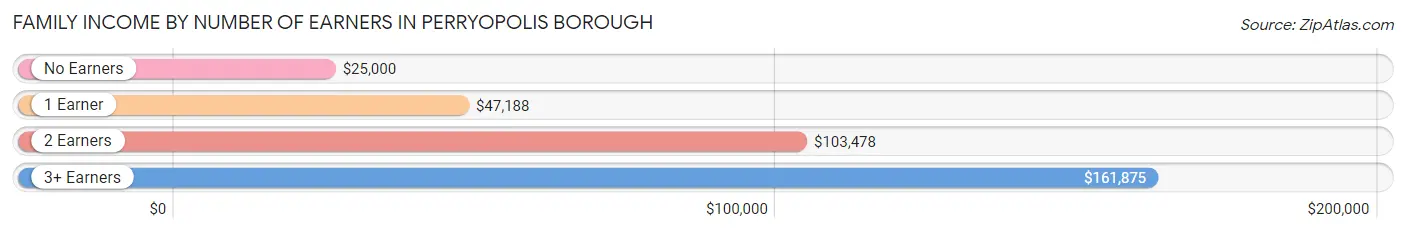
Family Income by Number of Earners in Perryopolis borough
The median family income in Perryopolis borough is $74,851, with families comprising 3+ earners (42) having the highest median family income of $161,875, while families with no earners (112) have the lowest median family income of $25,000, accounting for 9.0% and 24.0% of families, respectively.
| Number of Earners | # Families | Median Income |
| No Earners | 112 (24.0%) | $25,000 |
| 1 Earner | 113 (24.2%) | $47,188 |
| 2 Earners | 200 (42.8%) | $103,478 |
| 3+ Earners | 42 (9.0%) | $161,875 |
| Total | 467 (100.0%) | $74,851 |
Household Income in Perryopolis borough
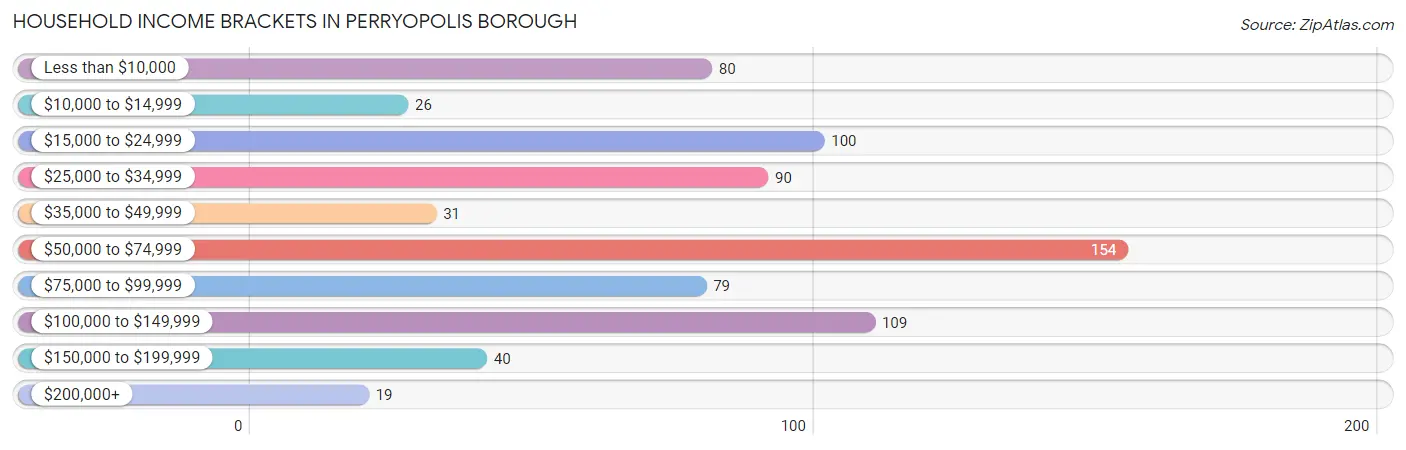
Household Income Brackets in Perryopolis borough
With 154 households falling in the category, the $50,000 to $74,999 income range is the most frequent in Perryopolis borough, accounting for 21.1% of all households. In contrast, only 19 households (2.6%) fall into the $200,000+ income bracket, making it the least populous group.
| Income Bracket | # Households | % Households |
| Less than $10,000 | 80 | 11.0% |
| $10,000 to $14,999 | 26 | 3.6% |
| $15,000 to $24,999 | 100 | 13.7% |
| $25,000 to $34,999 | 90 | 12.4% |
| $35,000 to $49,999 | 31 | 4.3% |
| $50,000 to $74,999 | 154 | 21.2% |
| $75,000 to $99,999 | 79 | 10.9% |
| $100,000 to $149,999 | 109 | 15.0% |
| $150,000 to $199,999 | 40 | 5.5% |
| $200,000+ | 19 | 2.6% |
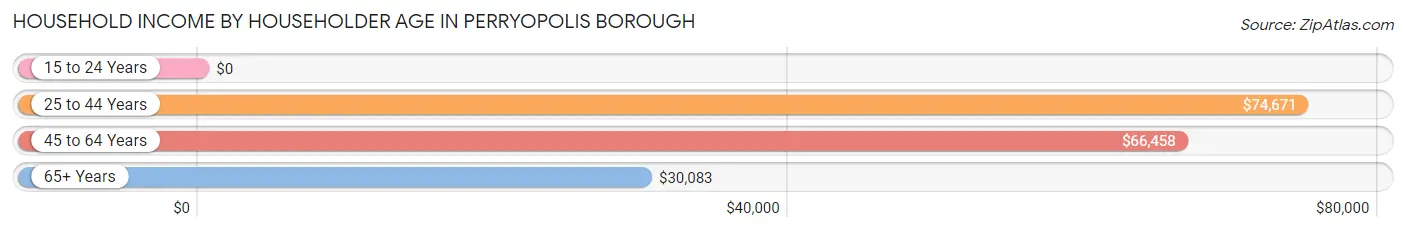
Household Income by Householder Age in Perryopolis borough
The median household income in Perryopolis borough is $56,643, with the highest median household income of $74,671 found in the 25 to 44 years age bracket for the primary householder. A total of 203 households (27.9%) fall into this category. Meanwhile, the 15 to 24 years age bracket for the primary householder has the lowest median household income of $0, with 4 households (0.5%) in this group.
| Income Bracket | # Households | Median Income |
| 15 to 24 Years | 4 (0.5%) | $0 |
| 25 to 44 Years | 203 (27.9%) | $74,671 |
| 45 to 64 Years | 280 (38.5%) | $66,458 |
| 65+ Years | 241 (33.1%) | $30,083 |
| Total | 728 (100.0%) | $56,643 |
Poverty in Perryopolis borough
Income Below Poverty by Sex and Age in Perryopolis borough
With 12.2% poverty level for males and 19.5% for females among the residents of Perryopolis borough, under 5 year old males and 15 year old females are the most vulnerable to poverty, with 16 males (41.0%) and 6 females (50.0%) in their respective age groups living below the poverty level.
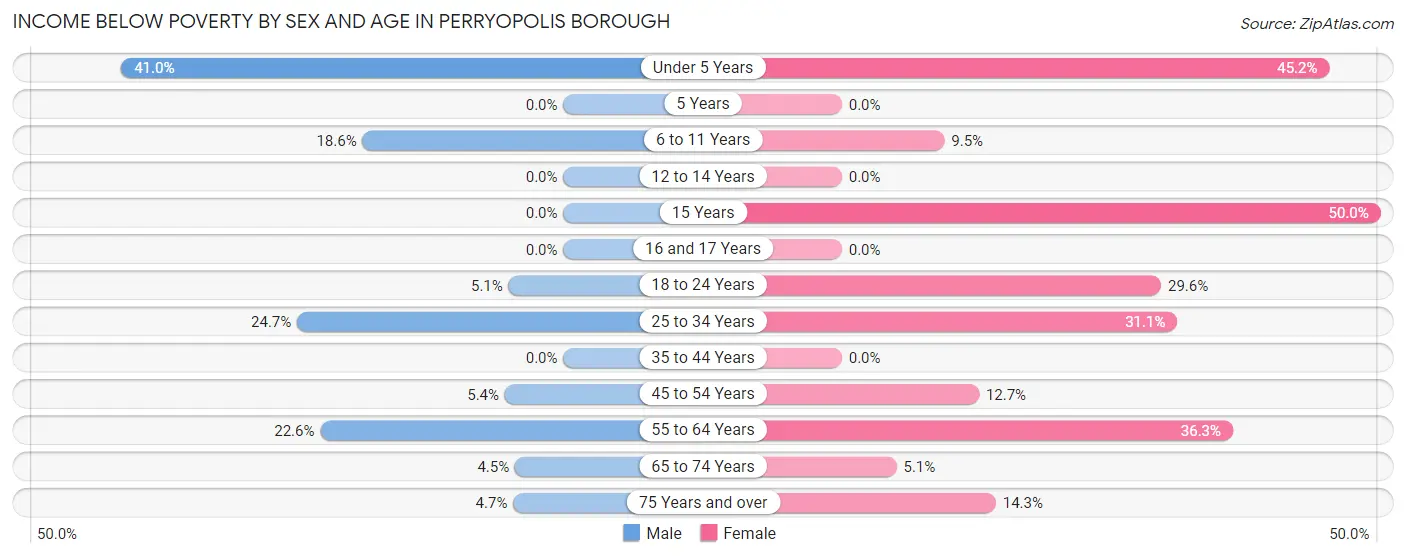
| Age Bracket | Male | Female |
| Under 5 Years | 16 (41.0%) | 19 (45.2%) |
| 5 Years | 0 (0.0%) | 0 (0.0%) |
| 6 to 11 Years | 11 (18.6%) | 6 (9.5%) |
| 12 to 14 Years | 0 (0.0%) | 0 (0.0%) |
| 15 Years | 0 (0.0%) | 6 (50.0%) |
| 16 and 17 Years | 0 (0.0%) | 0 (0.0%) |
| 18 to 24 Years | 3 (5.1%) | 8 (29.6%) |
| 25 to 34 Years | 21 (24.7%) | 33 (31.1%) |
| 35 to 44 Years | 0 (0.0%) | 0 (0.0%) |
| 45 to 54 Years | 5 (5.4%) | 14 (12.7%) |
| 55 to 64 Years | 30 (22.6%) | 45 (36.3%) |
| 65 to 74 Years | 3 (4.5%) | 3 (5.1%) |
| 75 Years and over | 4 (4.6%) | 17 (14.3%) |
| Total | 93 (12.2%) | 151 (19.5%) |
Income Above Poverty by Sex and Age in Perryopolis borough
According to the poverty statistics in Perryopolis borough, males aged 5 years and females aged 5 years are the age groups that are most secure financially, with 100.0% of males and 100.0% of females in these age groups living above the poverty line.
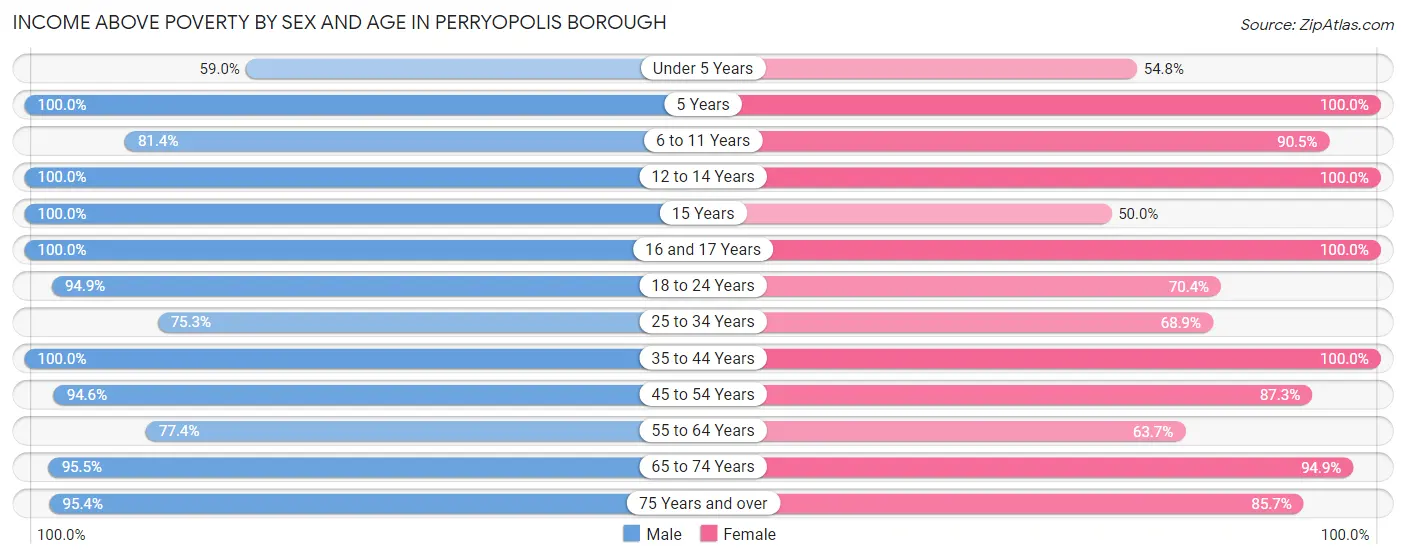
| Age Bracket | Male | Female |
| Under 5 Years | 23 (59.0%) | 23 (54.8%) |
| 5 Years | 9 (100.0%) | 9 (100.0%) |
| 6 to 11 Years | 48 (81.4%) | 57 (90.5%) |
| 12 to 14 Years | 24 (100.0%) | 7 (100.0%) |
| 15 Years | 5 (100.0%) | 6 (50.0%) |
| 16 and 17 Years | 8 (100.0%) | 5 (100.0%) |
| 18 to 24 Years | 56 (94.9%) | 19 (70.4%) |
| 25 to 34 Years | 64 (75.3%) | 73 (68.9%) |
| 35 to 44 Years | 97 (100.0%) | 91 (100.0%) |
| 45 to 54 Years | 87 (94.6%) | 96 (87.3%) |
| 55 to 64 Years | 103 (77.4%) | 79 (63.7%) |
| 65 to 74 Years | 64 (95.5%) | 56 (94.9%) |
| 75 Years and over | 82 (95.4%) | 102 (85.7%) |
| Total | 670 (87.8%) | 623 (80.5%) |
Income Below Poverty Among Married-Couple Families in Perryopolis borough
The poverty statistics for married-couple families in Perryopolis borough show that 6.1% or 23 of the total 375 families live below the poverty line. Families with 1 or 2 children have the highest poverty rate of 13.7%, comprising of 17 families. On the other hand, families with 3 or 4 children have the lowest poverty rate of 0.0%, which includes 0 families.
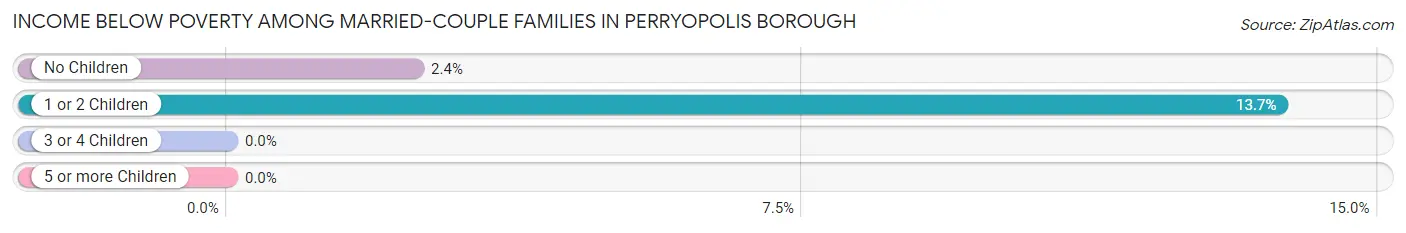
| Children | Above Poverty | Below Poverty |
| No Children | 241 (97.6%) | 6 (2.4%) |
| 1 or 2 Children | 107 (86.3%) | 17 (13.7%) |
| 3 or 4 Children | 4 (100.0%) | 0 (0.0%) |
| 5 or more Children | 0 (0.0%) | 0 (0.0%) |
| Total | 352 (93.9%) | 23 (6.1%) |
Income Below Poverty Among Single-Parent Households in Perryopolis borough
According to the poverty data in Perryopolis borough, 27.3% or 9 single-father households and 61.0% or 36 single-mother households are living below the poverty line. Among single-father households, those with 1 or 2 children have the highest poverty rate, with 5 households (27.8%) experiencing poverty. Likewise, among single-mother households, those with 3 or 4 children have the highest poverty rate, with 8 households (100.0%) falling below the poverty line.
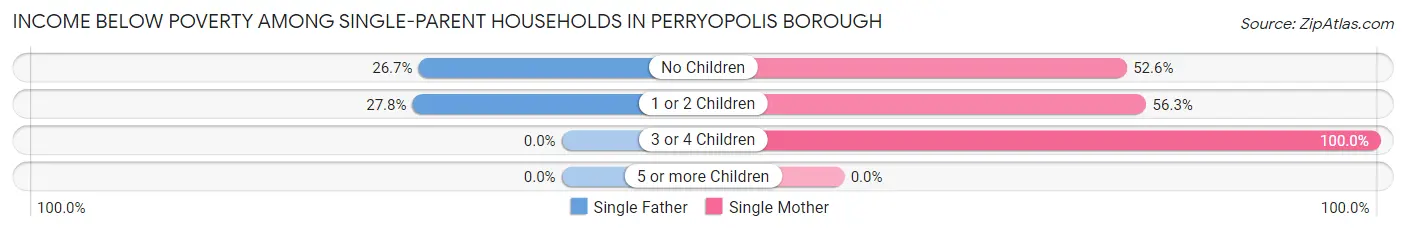
| Children | Single Father | Single Mother |
| No Children | 4 (26.7%) | 10 (52.6%) |
| 1 or 2 Children | 5 (27.8%) | 18 (56.2%) |
| 3 or 4 Children | 0 (0.0%) | 8 (100.0%) |
| 5 or more Children | 0 (0.0%) | 0 (0.0%) |
| Total | 9 (27.3%) | 36 (61.0%) |
Income Below Poverty Among Married-Couple vs Single-Parent Households in Perryopolis borough
The poverty data for Perryopolis borough shows that 23 of the married-couple family households (6.1%) and 45 of the single-parent households (48.9%) are living below the poverty level. Within the married-couple family households, those with 1 or 2 children have the highest poverty rate, with 17 households (13.7%) falling below the poverty line. Among the single-parent households, those with 3 or 4 children have the highest poverty rate, with 8 household (100.0%) living below poverty.
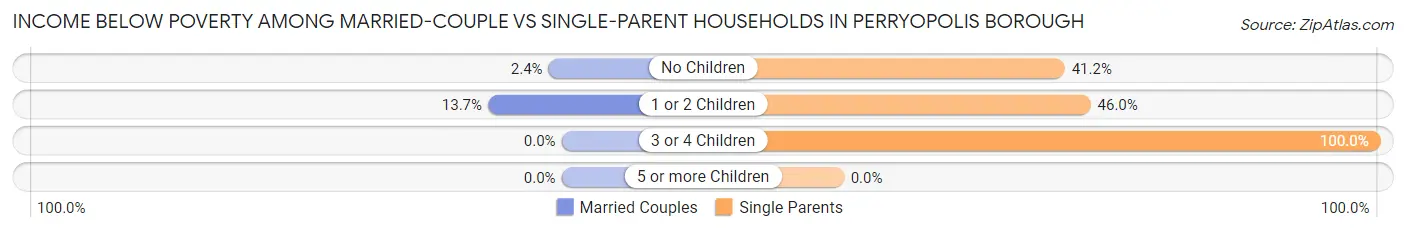
| Children | Married-Couple Families | Single-Parent Households |
| No Children | 6 (2.4%) | 14 (41.2%) |
| 1 or 2 Children | 17 (13.7%) | 23 (46.0%) |
| 3 or 4 Children | 0 (0.0%) | 8 (100.0%) |
| 5 or more Children | 0 (0.0%) | 0 (0.0%) |
| Total | 23 (6.1%) | 45 (48.9%) |
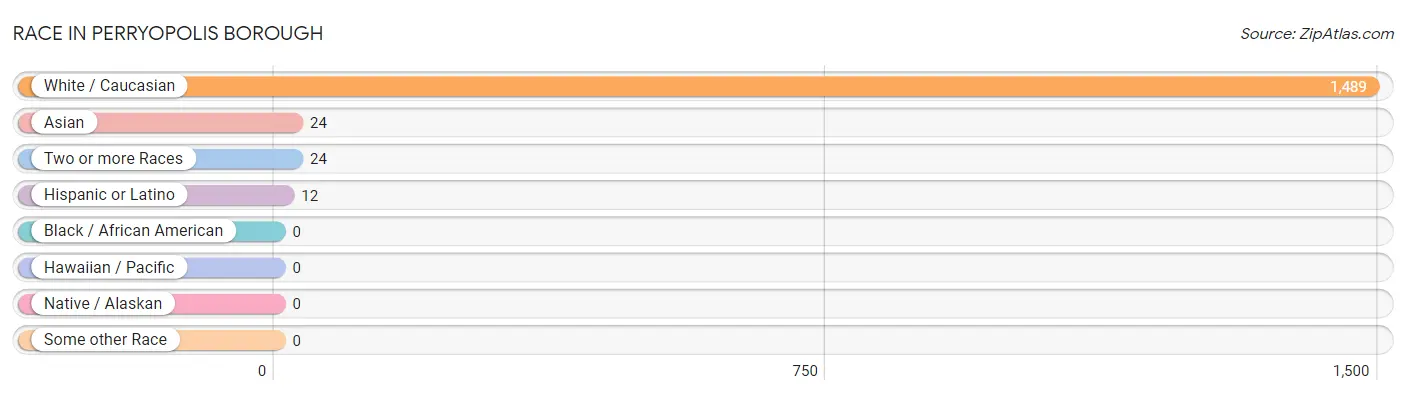
Race in Perryopolis borough
The most populous races in Perryopolis borough are White / Caucasian (1,489 | 96.9%), Asian (24 | 1.6%), and Two or more Races (24 | 1.6%).
| Race | # Population | % Population |
| Asian | 24 | 1.6% |
| Black / African American | 0 | 0.0% |
| Hawaiian / Pacific | 0 | 0.0% |
| Hispanic or Latino | 12 | 0.8% |
| Native / Alaskan | 0 | 0.0% |
| White / Caucasian | 1,489 | 96.9% |
| Two or more Races | 24 | 1.6% |
| Some other Race | 0 | 0.0% |
| Total | 1,537 | 100.0% |
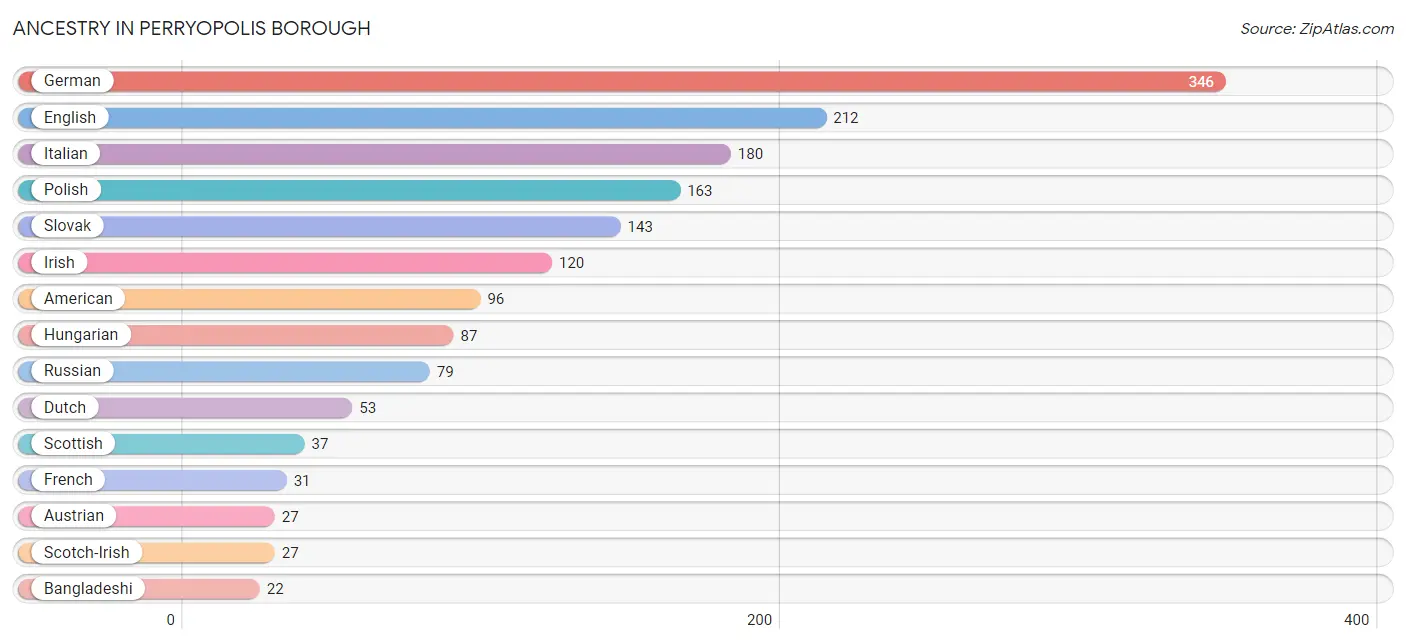
Ancestry in Perryopolis borough
The most populous ancestries reported in Perryopolis borough are German (346 | 22.5%), English (212 | 13.8%), Italian (180 | 11.7%), Polish (163 | 10.6%), and Slovak (143 | 9.3%), together accounting for 67.9% of all Perryopolis borough residents.
| Ancestry | # Population | % Population |
| American | 96 | 6.2% |
| Arab | 3 | 0.2% |
| Austrian | 27 | 1.8% |
| Bangladeshi | 22 | 1.4% |
| Burmese | 2 | 0.1% |
| Carpatho Rusyn | 8 | 0.5% |
| Croatian | 15 | 1.0% |
| Czechoslovakian | 6 | 0.4% |
| Dutch | 53 | 3.5% |
| English | 212 | 13.8% |
| Finnish | 3 | 0.2% |
| French | 31 | 2.0% |
| German | 346 | 22.5% |
| Greek | 3 | 0.2% |
| Hungarian | 87 | 5.7% |
| Irish | 120 | 7.8% |
| Italian | 180 | 11.7% |
| Lebanese | 3 | 0.2% |
| Mexican | 12 | 0.8% |
| Pennsylvania German | 6 | 0.4% |
| Polish | 163 | 10.6% |
| Russian | 79 | 5.1% |
| Samoan | 11 | 0.7% |
| Scotch-Irish | 27 | 1.8% |
| Scottish | 37 | 2.4% |
| Slovak | 143 | 9.3% |
| Ukrainian | 6 | 0.4% |
| Welsh | 20 | 1.3% | View All 28 Rows |
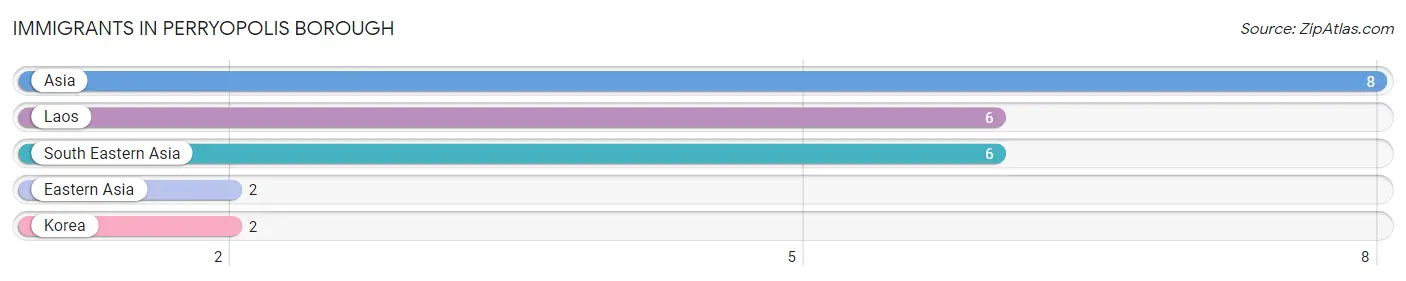
Immigrants in Perryopolis borough
The most numerous immigrant groups reported in Perryopolis borough came from Asia (8 | 0.5%), Laos (6 | 0.4%), South Eastern Asia (6 | 0.4%), Eastern Asia (2 | 0.1%), and Korea (2 | 0.1%), together accounting for 1.6% of all Perryopolis borough residents.
| Immigration Origin | # Population | % Population |
| Asia | 8 | 0.5% |
| Eastern Asia | 2 | 0.1% |
| Korea | 2 | 0.1% |
| Laos | 6 | 0.4% |
| South Eastern Asia | 6 | 0.4% | View All 5 Rows |
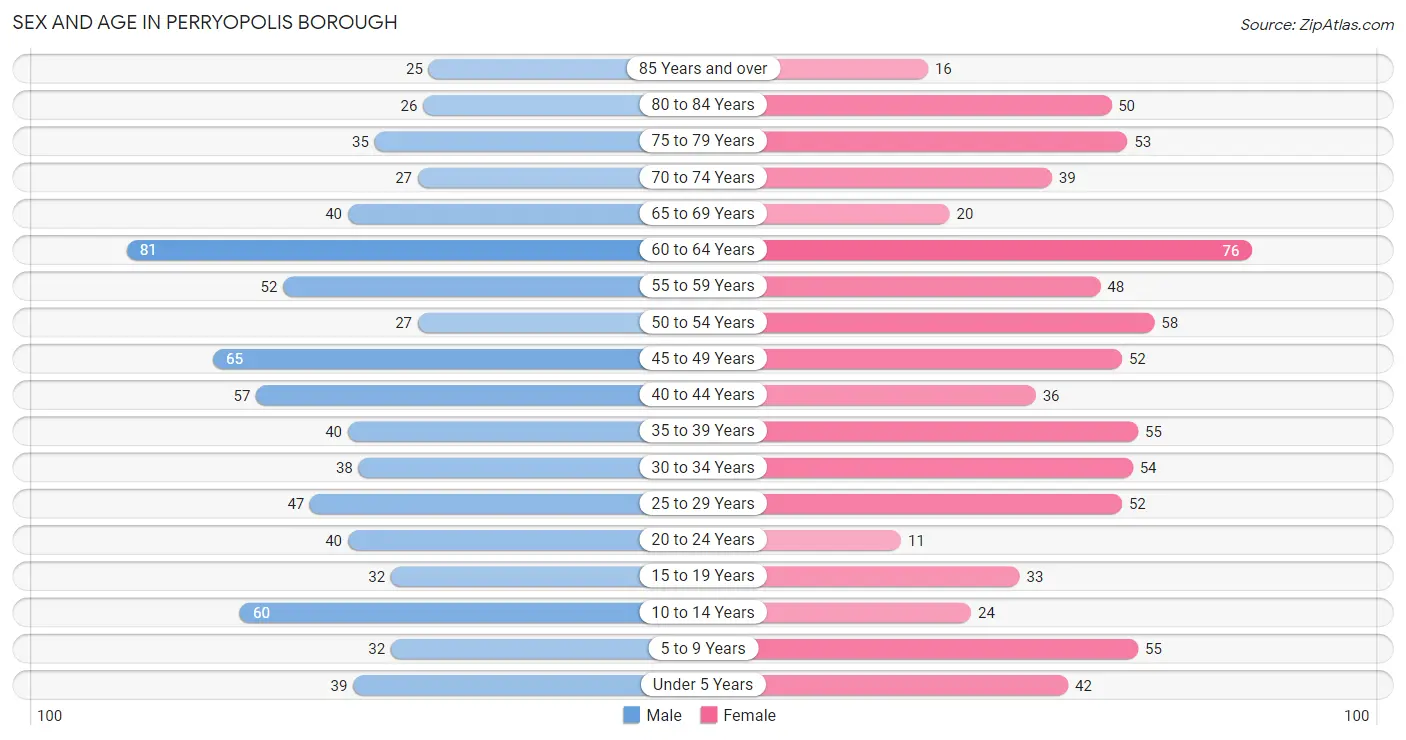
Sex and Age in Perryopolis borough
Sex and Age in Perryopolis borough
The most populous age groups in Perryopolis borough are 60 to 64 Years (81 | 10.6%) for men and 60 to 64 Years (76 | 9.8%) for women.
| Age Bracket | Male | Female |
| Under 5 Years | 39 (5.1%) | 42 (5.4%) |
| 5 to 9 Years | 32 (4.2%) | 55 (7.1%) |
| 10 to 14 Years | 60 (7.9%) | 24 (3.1%) |
| 15 to 19 Years | 32 (4.2%) | 33 (4.3%) |
| 20 to 24 Years | 40 (5.2%) | 11 (1.4%) |
| 25 to 29 Years | 47 (6.2%) | 52 (6.7%) |
| 30 to 34 Years | 38 (5.0%) | 54 (7.0%) |
| 35 to 39 Years | 40 (5.2%) | 55 (7.1%) |
| 40 to 44 Years | 57 (7.5%) | 36 (4.6%) |
| 45 to 49 Years | 65 (8.5%) | 52 (6.7%) |
| 50 to 54 Years | 27 (3.5%) | 58 (7.5%) |
| 55 to 59 Years | 52 (6.8%) | 48 (6.2%) |
| 60 to 64 Years | 81 (10.6%) | 76 (9.8%) |
| 65 to 69 Years | 40 (5.2%) | 20 (2.6%) |
| 70 to 74 Years | 27 (3.5%) | 39 (5.0%) |
| 75 to 79 Years | 35 (4.6%) | 53 (6.9%) |
| 80 to 84 Years | 26 (3.4%) | 50 (6.5%) |
| 85 Years and over | 25 (3.3%) | 16 (2.1%) |
| Total | 763 (100.0%) | 774 (100.0%) |
Families and Households in Perryopolis borough
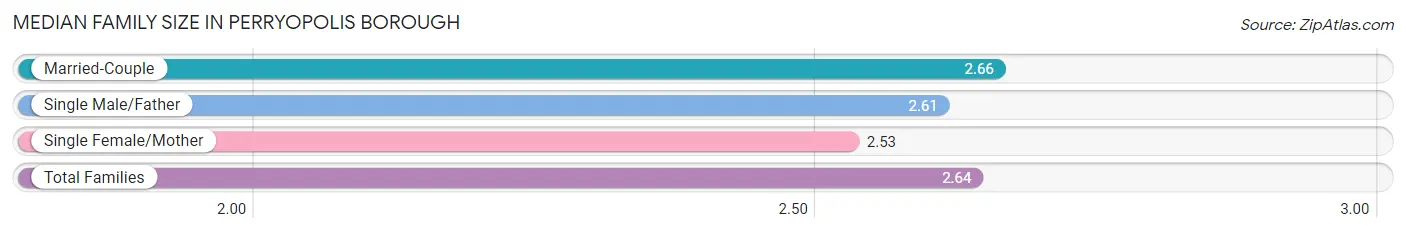
Median Family Size in Perryopolis borough
The median family size in Perryopolis borough is 2.64 persons per family, with married-couple families (375 | 80.3%) accounting for the largest median family size of 2.66 persons per family. On the other hand, single female/mother families (59 | 12.6%) represent the smallest median family size with 2.53 persons per family.
| Family Type | # Families | Family Size |
| Married-Couple | 375 (80.3%) | 2.66 |
| Single Male/Father | 33 (7.1%) | 2.61 |
| Single Female/Mother | 59 (12.6%) | 2.53 |
| Total Families | 467 (100.0%) | 2.64 |
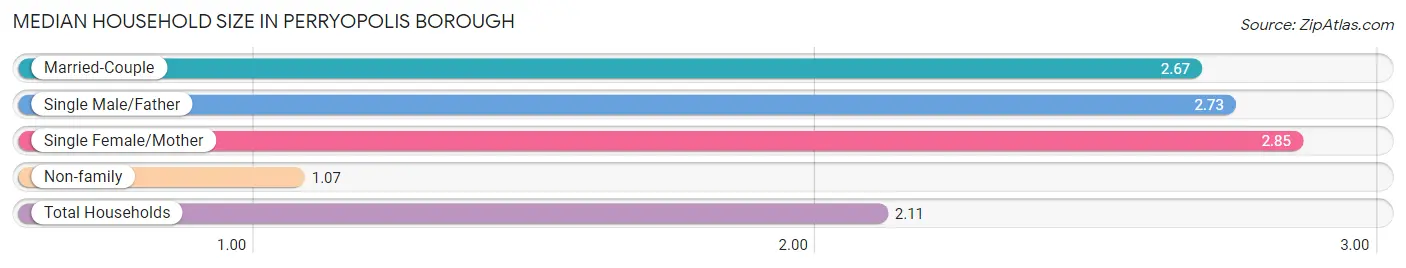
Median Household Size in Perryopolis borough
The median household size in Perryopolis borough is 2.11 persons per household, with single female/mother households (59 | 8.1%) accounting for the largest median household size of 2.85 persons per household. non-family households (261 | 35.8%) represent the smallest median household size with 1.07 persons per household.
| Household Type | # Households | Household Size |
| Married-Couple | 375 (51.5%) | 2.67 |
| Single Male/Father | 33 (4.5%) | 2.73 |
| Single Female/Mother | 59 (8.1%) | 2.85 |
| Non-family | 261 (35.8%) | 1.07 |
| Total Households | 728 (100.0%) | 2.11 |
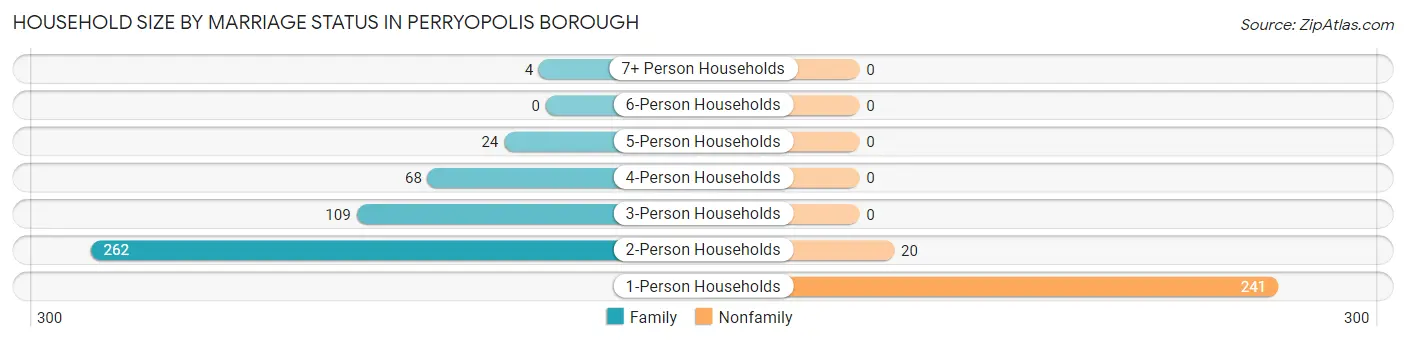
Household Size by Marriage Status in Perryopolis borough
Out of a total of 728 households in Perryopolis borough, 467 (64.1%) are family households, while 261 (35.8%) are nonfamily households. The most numerous type of family households are 2-person households, comprising 262, and the most common type of nonfamily households are 1-person households, comprising 241.
| Household Size | Family Households | Nonfamily Households |
| 1-Person Households | - | 241 (33.1%) |
| 2-Person Households | 262 (36.0%) | 20 (2.8%) |
| 3-Person Households | 109 (15.0%) | 0 (0.0%) |
| 4-Person Households | 68 (9.3%) | 0 (0.0%) |
| 5-Person Households | 24 (3.3%) | 0 (0.0%) |
| 6-Person Households | 0 (0.0%) | 0 (0.0%) |
| 7+ Person Households | 4 (0.5%) | 0 (0.0%) |
| Total | 467 (64.1%) | 261 (35.8%) |
Female Fertility in Perryopolis borough
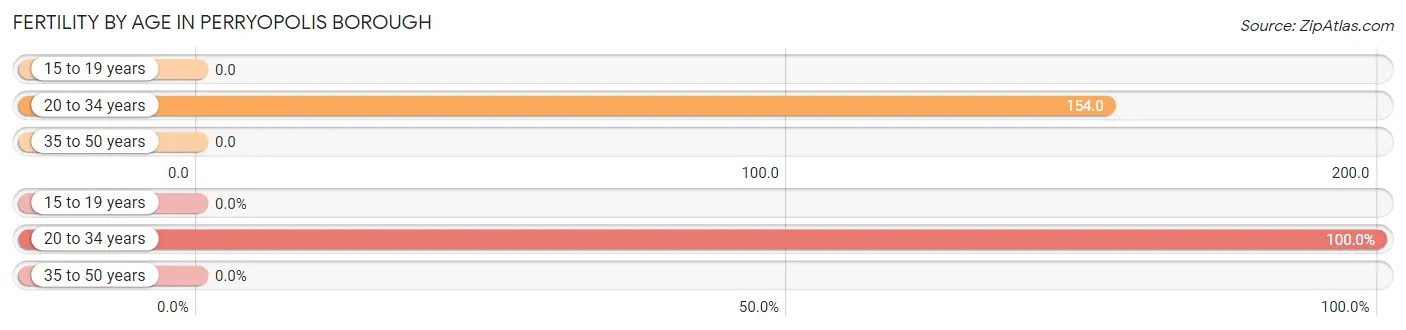
Fertility by Age in Perryopolis borough
Average fertility rate in Perryopolis borough is 60.0 births per 1,000 women. Women in the age bracket of 20 to 34 years have the highest fertility rate with 154.0 births per 1,000 women. Women in the age bracket of 20 to 34 years acount for 100.0% of all women with births.
| Age Bracket | Women with Births | Births / 1,000 Women |
| 15 to 19 years | 0 (0.0%) | 0.0 |
| 20 to 34 years | 18 (100.0%) | 154.0 |
| 35 to 50 years | 0 (0.0%) | 0.0 |
| Total | 18 (100.0%) | 60.0 |
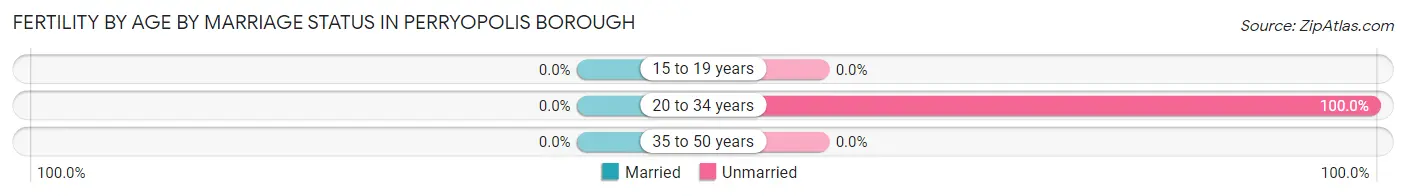
Fertility by Age by Marriage Status in Perryopolis borough
| Age Bracket | Married | Unmarried |
| 15 to 19 years | 0 (0.0%) | 0 (0.0%) |
| 20 to 34 years | 0 (0.0%) | 18 (100.0%) |
| 35 to 50 years | 0 (0.0%) | 0 (0.0%) |
| Total | 0 (0.0%) | 18 (100.0%) |
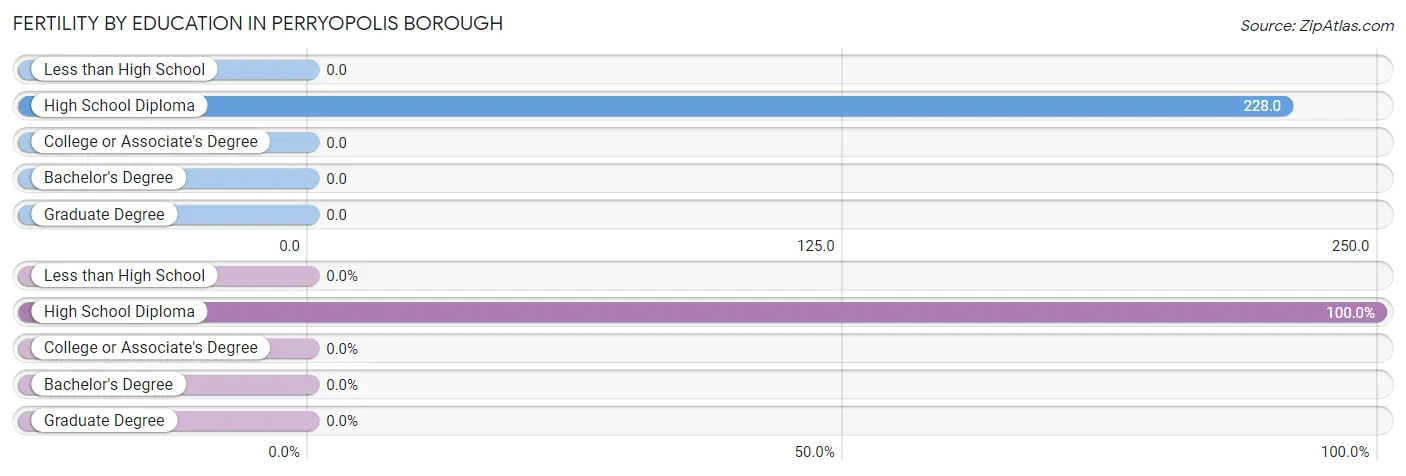
Fertility by Education in Perryopolis borough
| Educational Attainment | Women with Births | Births / 1,000 Women |
| Less than High School | 0 (0.0%) | 0.0 |
| High School Diploma | 18 (100.0%) | 228.0 |
| College or Associate's Degree | 0 (0.0%) | 0.0 |
| Bachelor's Degree | 0 (0.0%) | 0.0 |
| Graduate Degree | 0 (0.0%) | 0.0 |
| Total | 18 (100.0%) | 60.0 |
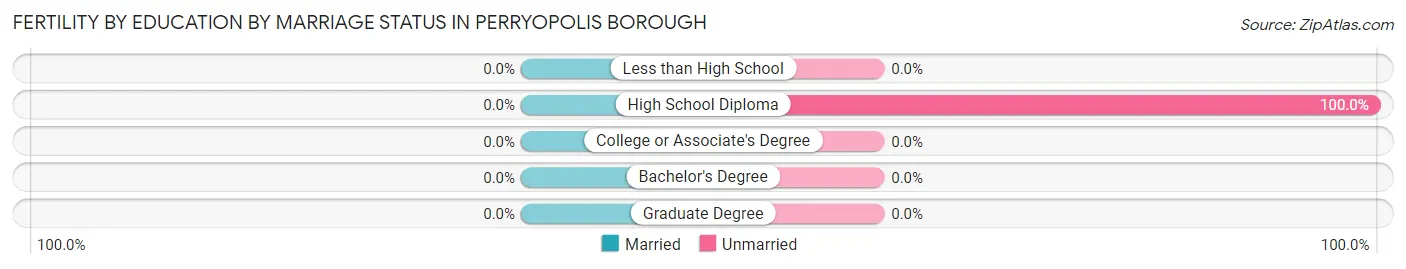
Fertility by Education by Marriage Status in Perryopolis borough
| Educational Attainment | Married | Unmarried |
| Less than High School | 0 (0.0%) | 0 (0.0%) |
| High School Diploma | 0 (0.0%) | 18 (100.0%) |
| College or Associate's Degree | 0 (0.0%) | 0 (0.0%) |
| Bachelor's Degree | 0 (0.0%) | 0 (0.0%) |
| Graduate Degree | 0 (0.0%) | 0 (0.0%) |
| Total | 0 (0.0%) | 18 (100.0%) |
Employment Characteristics in Perryopolis borough
Employment by Class of Employer in Perryopolis borough
Among the 703 employed individuals in Perryopolis borough, private company employees (421 | 59.9%), local government employees (71 | 10.1%), and not-for-profit organizations (65 | 9.2%) make up the most common classes of employment.
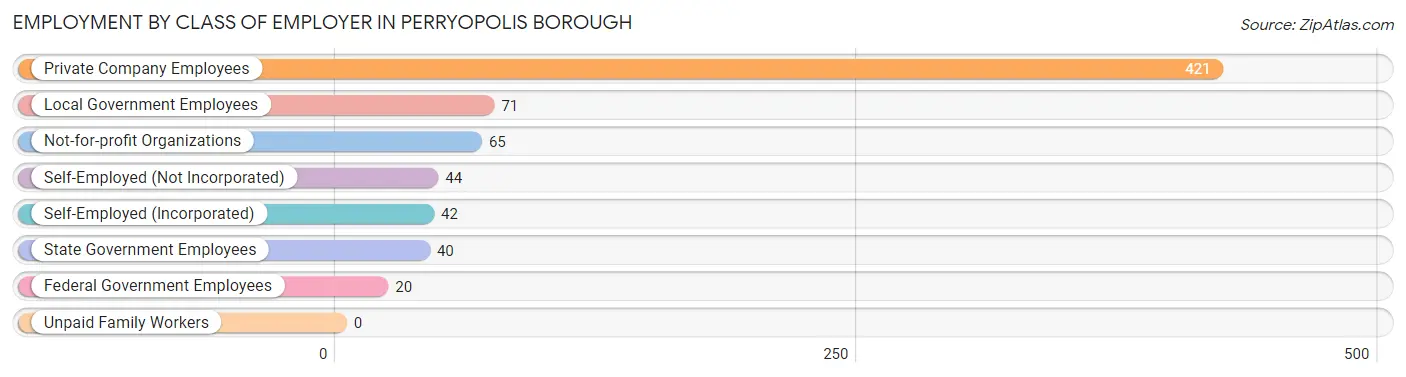
| Employer Class | # Employees | % Employees |
| Private Company Employees | 421 | 59.9% |
| Self-Employed (Incorporated) | 42 | 6.0% |
| Self-Employed (Not Incorporated) | 44 | 6.3% |
| Not-for-profit Organizations | 65 | 9.2% |
| Local Government Employees | 71 | 10.1% |
| State Government Employees | 40 | 5.7% |
| Federal Government Employees | 20 | 2.8% |
| Unpaid Family Workers | 0 | 0.0% |
| Total | 703 | 100.0% |
Employment Status by Age in Perryopolis borough
According to the labor force statistics for Perryopolis borough, out of the total population over 16 years of age (1,268), 61.8% or 784 individuals are in the labor force, with 7.4% or 58 of them unemployed. The age group with the highest labor force participation rate is 35 to 44 years, with 97.9% or 184 individuals in the labor force. Within the labor force, the 25 to 29 years age range has the highest percentage of unemployed individuals, with 32.2% or 28 of them being unemployed.
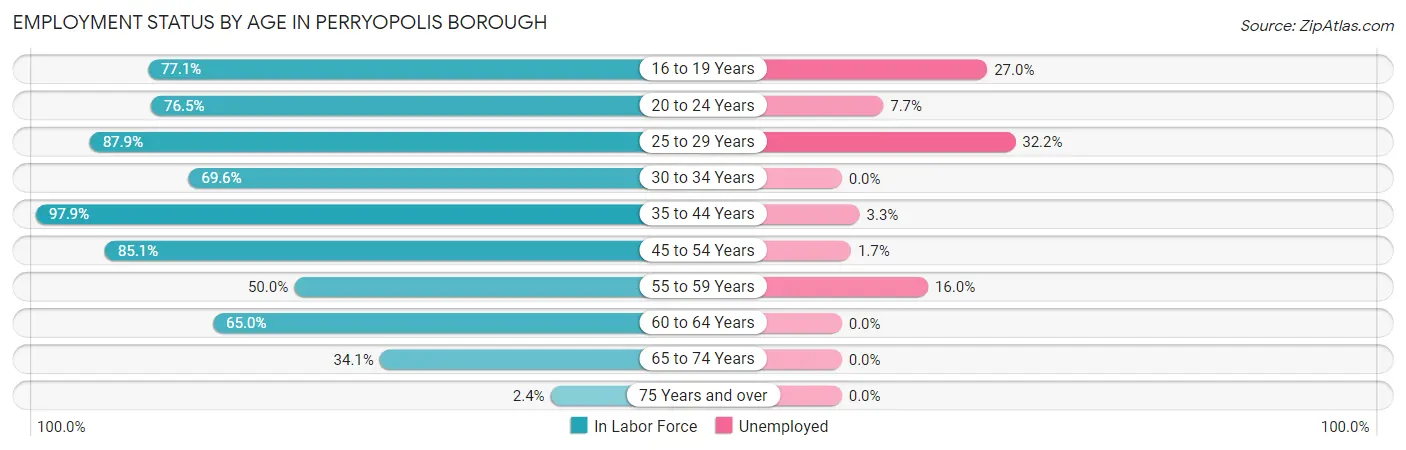
| Age Bracket | In Labor Force | Unemployed |
| 16 to 19 Years | 37 (77.1%) | 10 (27.0%) |
| 20 to 24 Years | 39 (76.5%) | 3 (7.7%) |
| 25 to 29 Years | 87 (87.9%) | 28 (32.2%) |
| 30 to 34 Years | 64 (69.6%) | 0 (0.0%) |
| 35 to 44 Years | 184 (97.9%) | 6 (3.3%) |
| 45 to 54 Years | 172 (85.1%) | 3 (1.7%) |
| 55 to 59 Years | 50 (50.0%) | 8 (16.0%) |
| 60 to 64 Years | 102 (65.0%) | 0 (0.0%) |
| 65 to 74 Years | 43 (34.1%) | 0 (0.0%) |
| 75 Years and over | 5 (2.4%) | 0 (0.0%) |
| Total | 784 (61.8%) | 58 (7.4%) |
Employment Status by Educational Attainment in Perryopolis borough
According to labor force statistics for Perryopolis borough, 78.6% of individuals (659) out of the total population between 25 and 64 years of age (838) are in the labor force, with 6.8% or 45 of them being unemployed. The group with the highest labor force participation rate are those with the educational attainment of bachelor's degree or higher, with 98.8% or 237 individuals in the labor force. Within the labor force, individuals with high school diploma education have the highest percentage of unemployment, with 16.7% or 39 of them being unemployed.
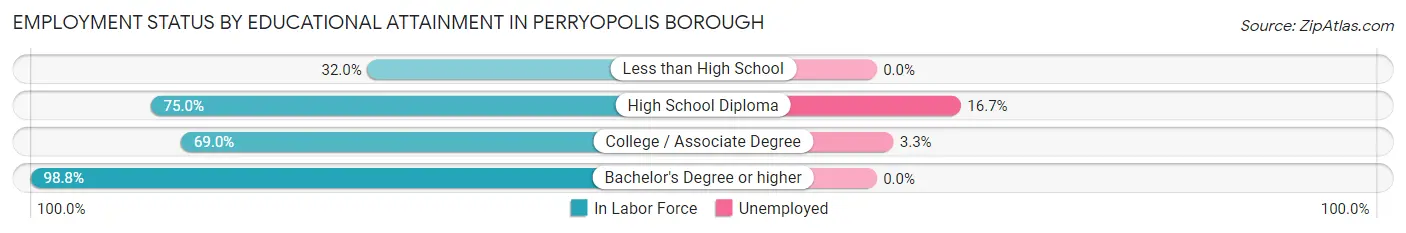
| Educational Attainment | In Labor Force | Unemployed |
| Less than High School | 8 (32.0%) | 0 (0.0%) |
| High School Diploma | 234 (75.0%) | 52 (16.7%) |
| College / Associate Degree | 180 (69.0%) | 9 (3.3%) |
| Bachelor's Degree or higher | 237 (98.8%) | 0 (0.0%) |
| Total | 659 (78.6%) | 57 (6.8%) |
Employment Occupations by Sex in Perryopolis borough
Management, Business, Science and Arts Occupations
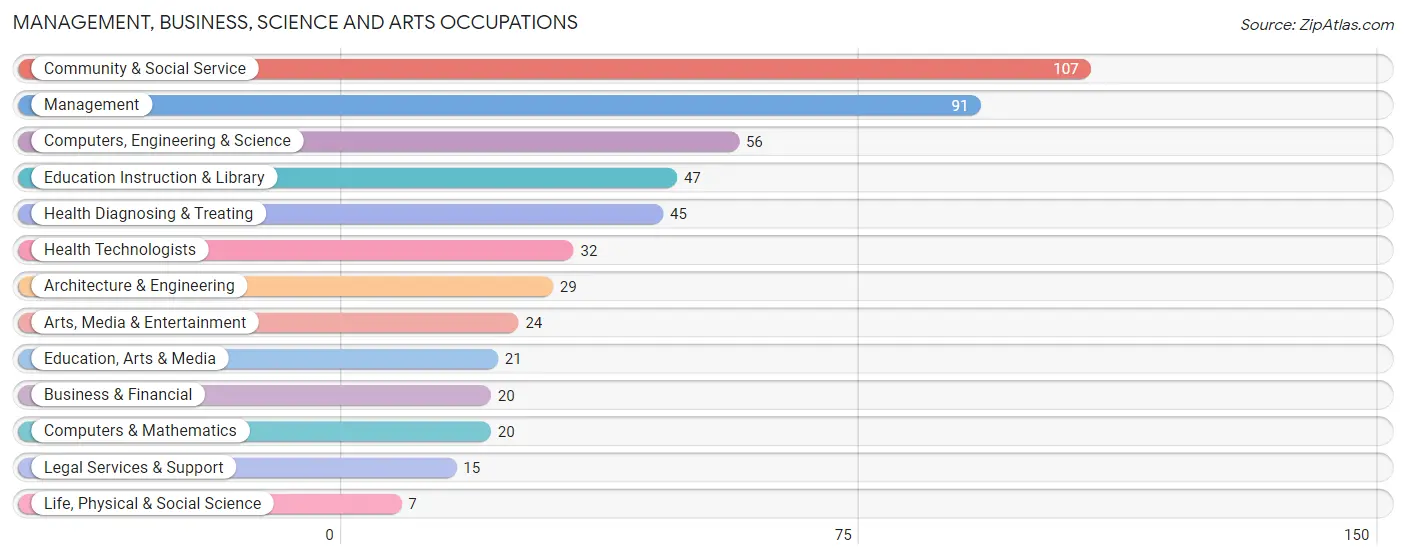
The most common Management, Business, Science and Arts occupations in Perryopolis borough are Community & Social Service (107 | 14.8%), Management (91 | 12.6%), Computers, Engineering & Science (56 | 7.7%), Education Instruction & Library (47 | 6.5%), and Health Diagnosing & Treating (45 | 6.2%).
Management, Business, Science and Arts Occupations by Sex
Within the Management, Business, Science and Arts occupations in Perryopolis borough, the most male-oriented occupations are Life, Physical & Social Science (100.0%), Computers, Engineering & Science (76.8%), and Architecture & Engineering (75.9%), while the most female-oriented occupations are Legal Services & Support (100.0%), Education Instruction & Library (100.0%), and Health Diagnosing & Treating (88.9%).
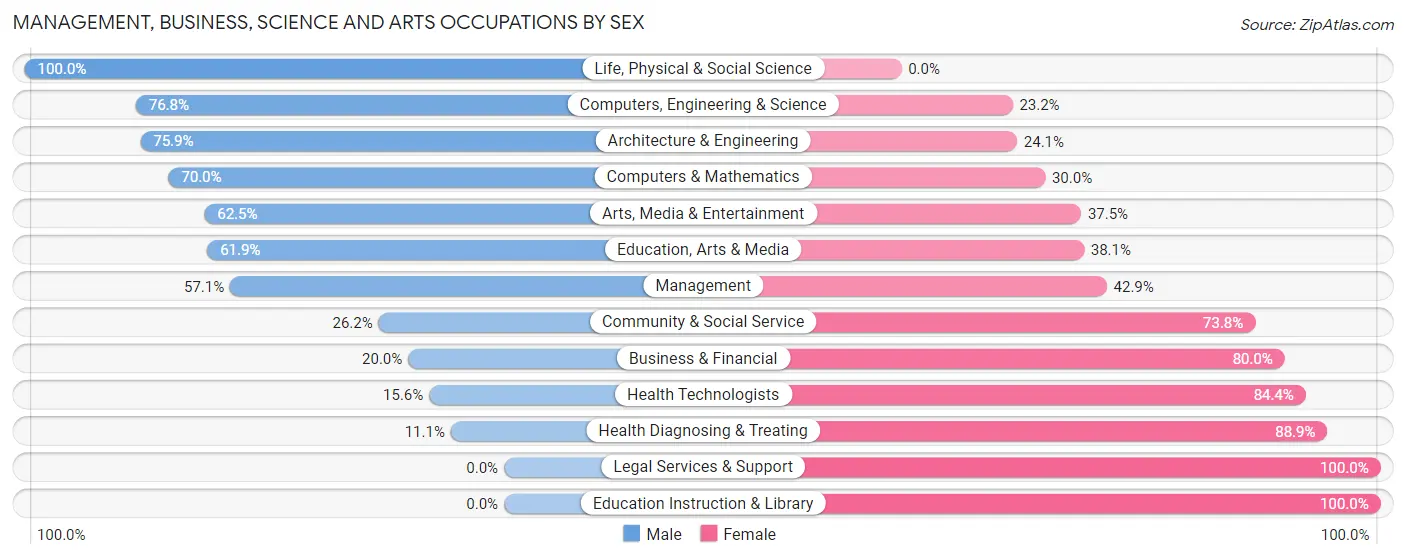
| Occupation | Male | Female |
| Management | 52 (57.1%) | 39 (42.9%) |
| Business & Financial | 4 (20.0%) | 16 (80.0%) |
| Computers, Engineering & Science | 43 (76.8%) | 13 (23.2%) |
| Computers & Mathematics | 14 (70.0%) | 6 (30.0%) |
| Architecture & Engineering | 22 (75.9%) | 7 (24.1%) |
| Life, Physical & Social Science | 7 (100.0%) | 0 (0.0%) |
| Community & Social Service | 28 (26.2%) | 79 (73.8%) |
| Education, Arts & Media | 13 (61.9%) | 8 (38.1%) |
| Legal Services & Support | 0 (0.0%) | 15 (100.0%) |
| Education Instruction & Library | 0 (0.0%) | 47 (100.0%) |
| Arts, Media & Entertainment | 15 (62.5%) | 9 (37.5%) |
| Health Diagnosing & Treating | 5 (11.1%) | 40 (88.9%) |
| Health Technologists | 5 (15.6%) | 27 (84.4%) |
| Total (Category) | 132 (41.4%) | 187 (58.6%) |
| Total (Overall) | 362 (49.9%) | 363 (50.1%) |
Services Occupations
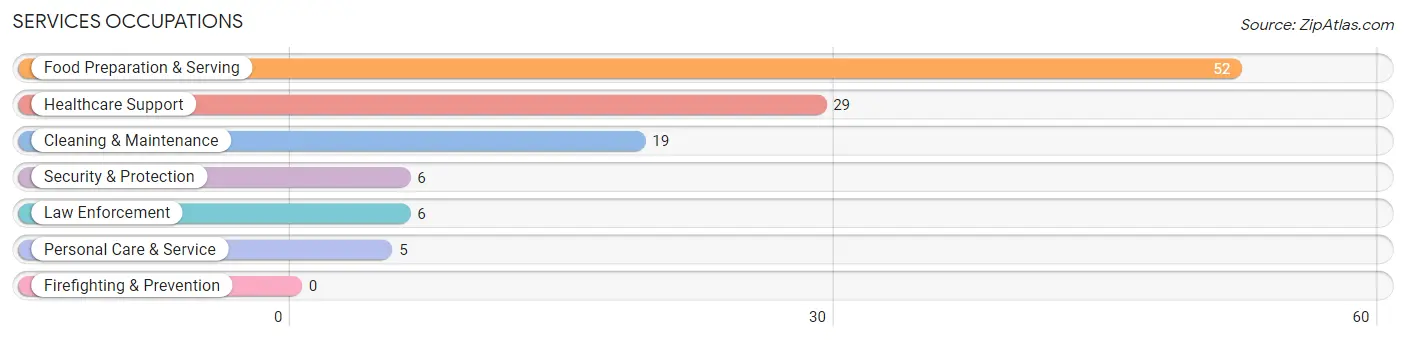
The most common Services occupations in Perryopolis borough are Food Preparation & Serving (52 | 7.2%), Healthcare Support (29 | 4.0%), Cleaning & Maintenance (19 | 2.6%), Security & Protection (6 | 0.8%), and Law Enforcement (6 | 0.8%).
Services Occupations by Sex
Within the Services occupations in Perryopolis borough, the most male-oriented occupations are Security & Protection (100.0%), Law Enforcement (100.0%), and Cleaning & Maintenance (89.5%), while the most female-oriented occupations are Personal Care & Service (100.0%), Healthcare Support (89.7%), and Food Preparation & Serving (63.5%).
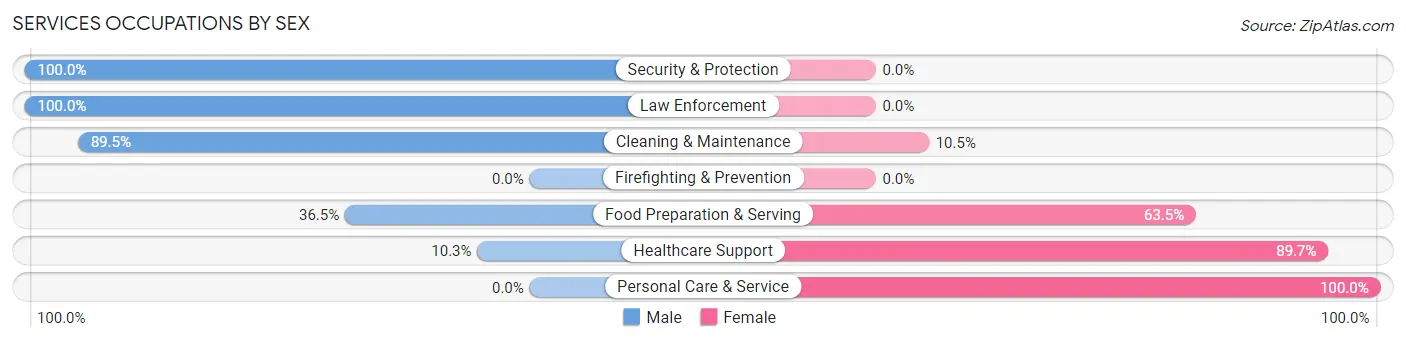
| Occupation | Male | Female |
| Healthcare Support | 3 (10.3%) | 26 (89.7%) |
| Security & Protection | 6 (100.0%) | 0 (0.0%) |
| Firefighting & Prevention | 0 (0.0%) | 0 (0.0%) |
| Law Enforcement | 6 (100.0%) | 0 (0.0%) |
| Food Preparation & Serving | 19 (36.5%) | 33 (63.5%) |
| Cleaning & Maintenance | 17 (89.5%) | 2 (10.5%) |
| Personal Care & Service | 0 (0.0%) | 5 (100.0%) |
| Total (Category) | 45 (40.5%) | 66 (59.5%) |
| Total (Overall) | 362 (49.9%) | 363 (50.1%) |
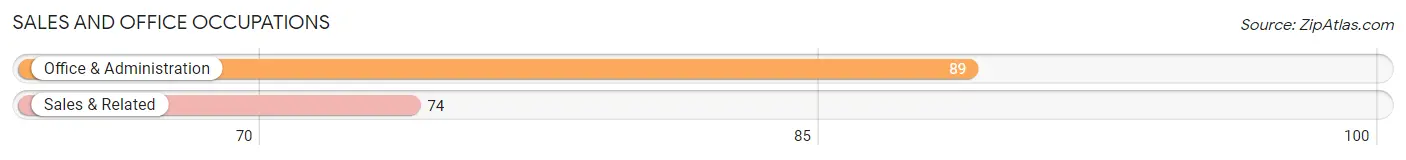
Sales and Office Occupations
The most common Sales and Office occupations in Perryopolis borough are Office & Administration (89 | 12.3%), and Sales & Related (74 | 10.2%).
Sales and Office Occupations by Sex
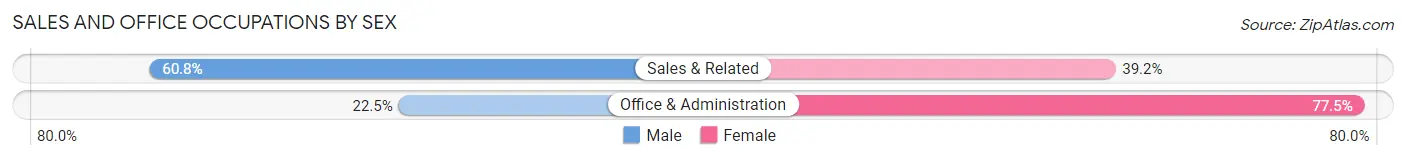
| Occupation | Male | Female |
| Sales & Related | 45 (60.8%) | 29 (39.2%) |
| Office & Administration | 20 (22.5%) | 69 (77.5%) |
| Total (Category) | 65 (39.9%) | 98 (60.1%) |
| Total (Overall) | 362 (49.9%) | 363 (50.1%) |
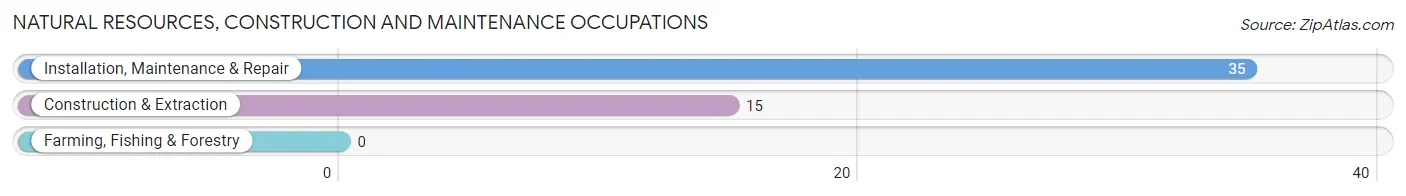
Natural Resources, Construction and Maintenance Occupations
The most common Natural Resources, Construction and Maintenance occupations in Perryopolis borough are Installation, Maintenance & Repair (35 | 4.8%), and Construction & Extraction (15 | 2.1%).
Natural Resources, Construction and Maintenance Occupations by Sex
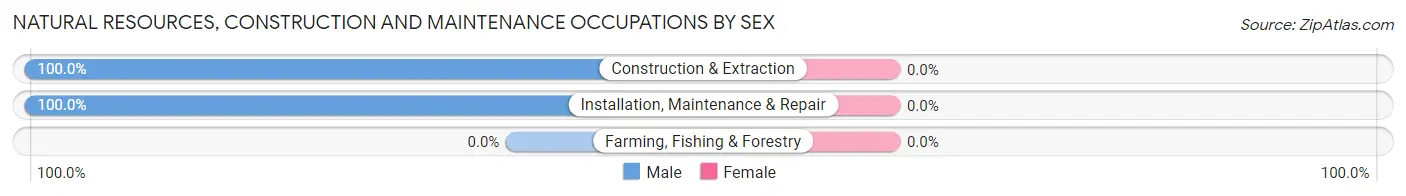
| Occupation | Male | Female |
| Farming, Fishing & Forestry | 0 (0.0%) | 0 (0.0%) |
| Construction & Extraction | 15 (100.0%) | 0 (0.0%) |
| Installation, Maintenance & Repair | 35 (100.0%) | 0 (0.0%) |
| Total (Category) | 50 (100.0%) | 0 (0.0%) |
| Total (Overall) | 362 (49.9%) | 363 (50.1%) |
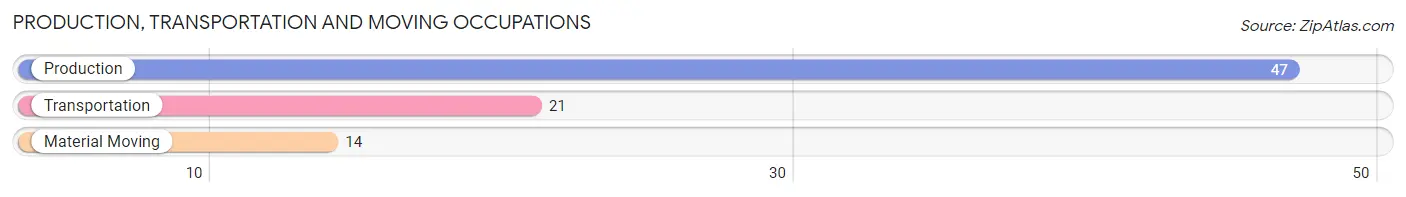
Production, Transportation and Moving Occupations
The most common Production, Transportation and Moving occupations in Perryopolis borough are Production (47 | 6.5%), Transportation (21 | 2.9%), and Material Moving (14 | 1.9%).
Production, Transportation and Moving Occupations by Sex
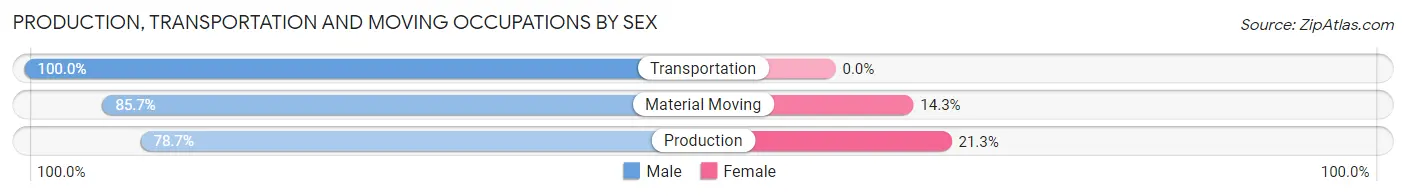
| Occupation | Male | Female |
| Production | 37 (78.7%) | 10 (21.3%) |
| Transportation | 21 (100.0%) | 0 (0.0%) |
| Material Moving | 12 (85.7%) | 2 (14.3%) |
| Total (Category) | 70 (85.4%) | 12 (14.6%) |
| Total (Overall) | 362 (49.9%) | 363 (50.1%) |
Employment Industries by Sex in Perryopolis borough
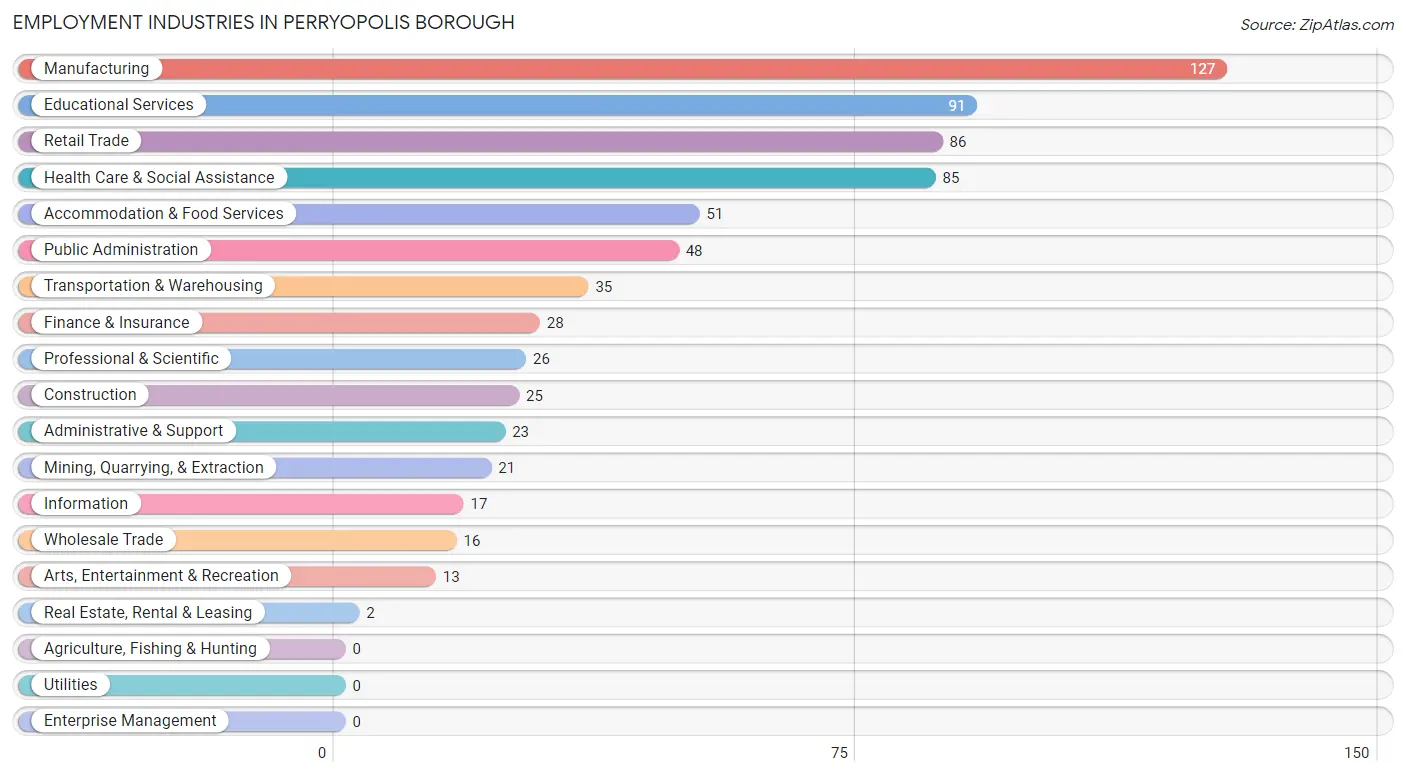
Employment Industries in Perryopolis borough
The major employment industries in Perryopolis borough include Manufacturing (127 | 17.5%), Educational Services (91 | 12.6%), Retail Trade (86 | 11.9%), Health Care & Social Assistance (85 | 11.7%), and Accommodation & Food Services (51 | 7.0%).
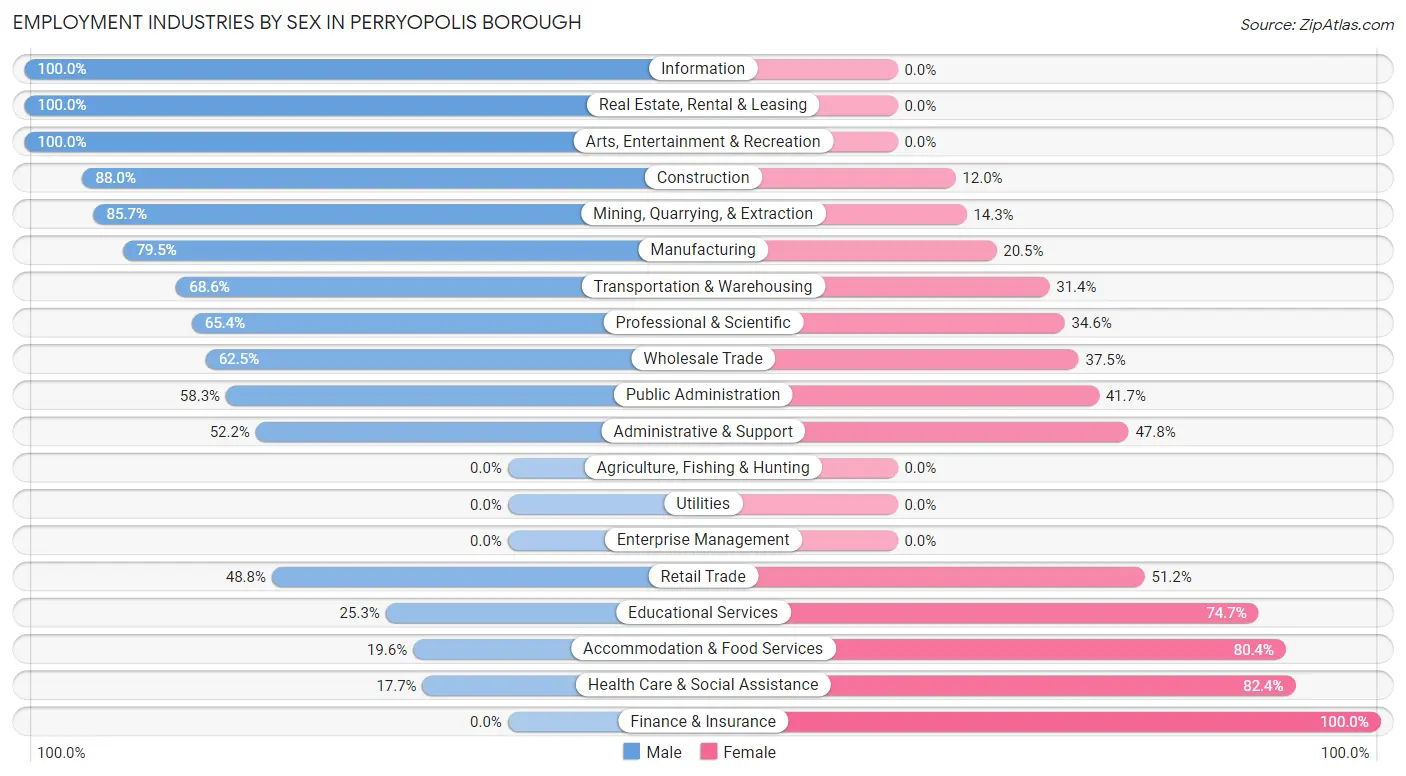
Employment Industries by Sex in Perryopolis borough
The Perryopolis borough industries that see more men than women are Information (100.0%), Real Estate, Rental & Leasing (100.0%), and Arts, Entertainment & Recreation (100.0%), whereas the industries that tend to have a higher number of women are Finance & Insurance (100.0%), Health Care & Social Assistance (82.4%), and Accommodation & Food Services (80.4%).
| Industry | Male | Female |
| Agriculture, Fishing & Hunting | 0 (0.0%) | 0 (0.0%) |
| Mining, Quarrying, & Extraction | 18 (85.7%) | 3 (14.3%) |
| Construction | 22 (88.0%) | 3 (12.0%) |
| Manufacturing | 101 (79.5%) | 26 (20.5%) |
| Wholesale Trade | 10 (62.5%) | 6 (37.5%) |
| Retail Trade | 42 (48.8%) | 44 (51.2%) |
| Transportation & Warehousing | 24 (68.6%) | 11 (31.4%) |
| Utilities | 0 (0.0%) | 0 (0.0%) |
| Information | 17 (100.0%) | 0 (0.0%) |
| Finance & Insurance | 0 (0.0%) | 28 (100.0%) |
| Real Estate, Rental & Leasing | 2 (100.0%) | 0 (0.0%) |
| Professional & Scientific | 17 (65.4%) | 9 (34.6%) |
| Enterprise Management | 0 (0.0%) | 0 (0.0%) |
| Administrative & Support | 12 (52.2%) | 11 (47.8%) |
| Educational Services | 23 (25.3%) | 68 (74.7%) |
| Health Care & Social Assistance | 15 (17.6%) | 70 (82.4%) |
| Arts, Entertainment & Recreation | 13 (100.0%) | 0 (0.0%) |
| Accommodation & Food Services | 10 (19.6%) | 41 (80.4%) |
| Public Administration | 28 (58.3%) | 20 (41.7%) |
| Total | 362 (49.9%) | 363 (50.1%) |
Education in Perryopolis borough
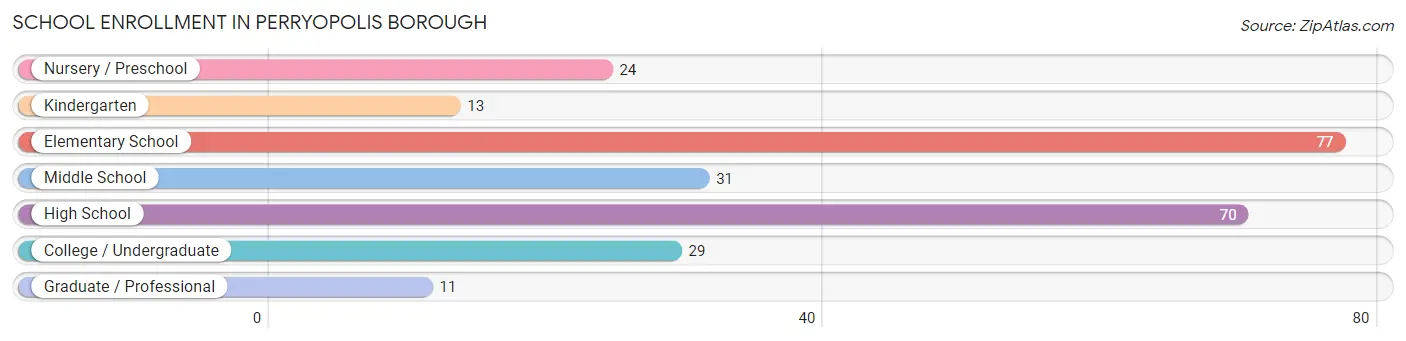
School Enrollment in Perryopolis borough
The most common levels of schooling among the 255 students in Perryopolis borough are elementary school (77 | 30.2%), high school (70 | 27.5%), and middle school (31 | 12.2%).
| School Level | # Students | % Students |
| Nursery / Preschool | 24 | 9.4% |
| Kindergarten | 13 | 5.1% |
| Elementary School | 77 | 30.2% |
| Middle School | 31 | 12.2% |
| High School | 70 | 27.5% |
| College / Undergraduate | 29 | 11.4% |
| Graduate / Professional | 11 | 4.3% |
| Total | 255 | 100.0% |
School Enrollment by Age by Funding Source in Perryopolis borough
Out of a total of 255 students who are enrolled in schools in Perryopolis borough, 48 (18.8%) attend a private institution, while the remaining 207 (81.2%) are enrolled in public schools. The age group of 3 to 4 year olds has the highest likelihood of being enrolled in private schools, with 9 (100.0% in the age bracket) enrolled. Conversely, the age group of 15 to 17 year olds has the lowest likelihood of being enrolled in a private school, with 30 (100.0% in the age bracket) attending a public institution.
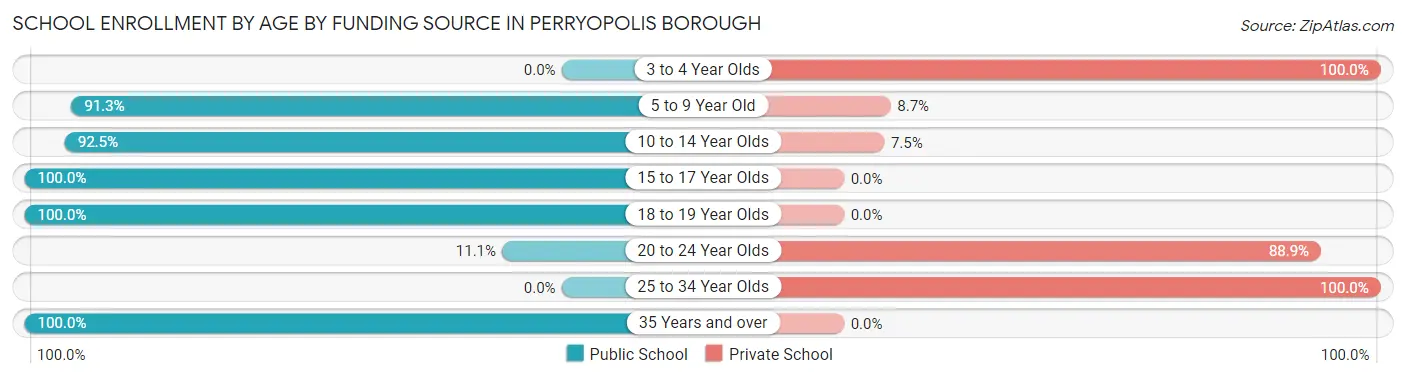
| Age Bracket | Public School | Private School |
| 3 to 4 Year Olds | 0 (0.0%) | 9 (100.0%) |
| 5 to 9 Year Old | 63 (91.3%) | 6 (8.7%) |
| 10 to 14 Year Olds | 74 (92.5%) | 6 (7.5%) |
| 15 to 17 Year Olds | 30 (100.0%) | 0 (0.0%) |
| 18 to 19 Year Olds | 22 (100.0%) | 0 (0.0%) |
| 20 to 24 Year Olds | 3 (11.1%) | 24 (88.9%) |
| 25 to 34 Year Olds | 0 (0.0%) | 3 (100.0%) |
| 35 Years and over | 15 (100.0%) | 0 (0.0%) |
| Total | 207 (81.2%) | 48 (18.8%) |
Educational Attainment by Field of Study in Perryopolis borough
Business (87 | 27.3%), education (64 | 20.1%), science & technology (41 | 12.9%), visual & performing arts (28 | 8.8%), and literature & languages (22 | 6.9%) are the most common fields of study among 319 individuals in Perryopolis borough who have obtained a bachelor's degree or higher.
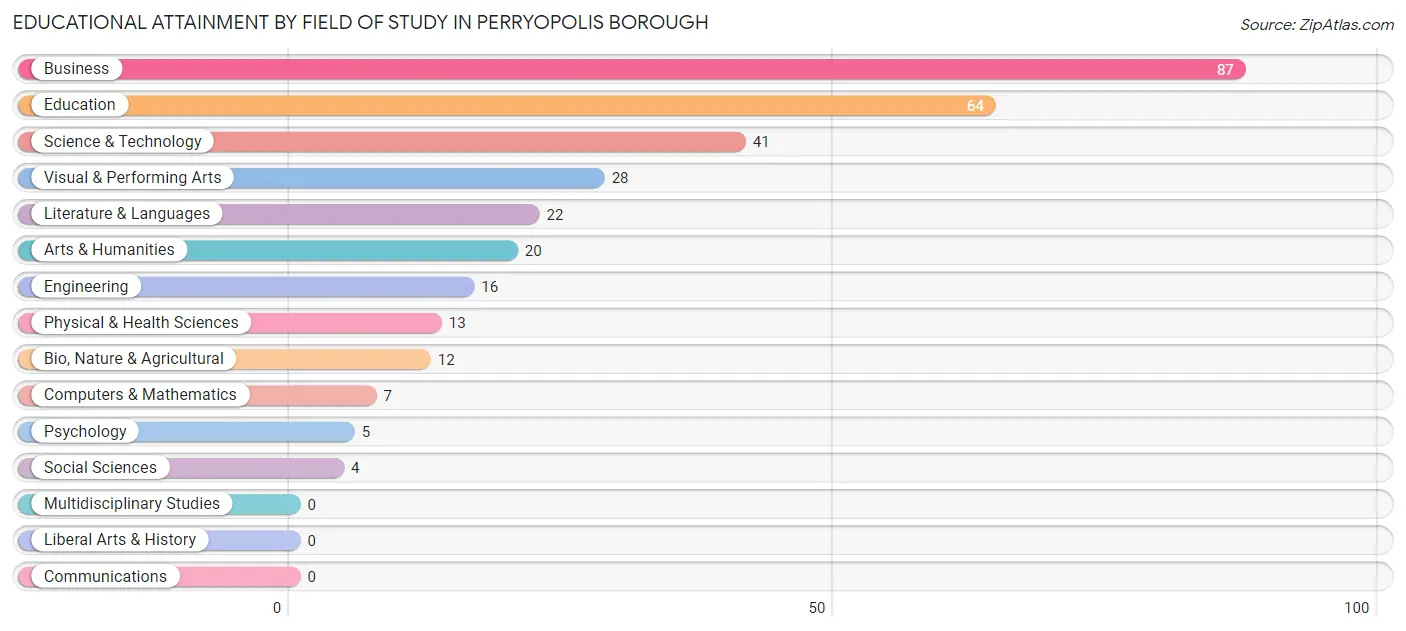
| Field of Study | # Graduates | % Graduates |
| Computers & Mathematics | 7 | 2.2% |
| Bio, Nature & Agricultural | 12 | 3.8% |
| Physical & Health Sciences | 13 | 4.1% |
| Psychology | 5 | 1.6% |
| Social Sciences | 4 | 1.3% |
| Engineering | 16 | 5.0% |
| Multidisciplinary Studies | 0 | 0.0% |
| Science & Technology | 41 | 12.9% |
| Business | 87 | 27.3% |
| Education | 64 | 20.1% |
| Literature & Languages | 22 | 6.9% |
| Liberal Arts & History | 0 | 0.0% |
| Visual & Performing Arts | 28 | 8.8% |
| Communications | 0 | 0.0% |
| Arts & Humanities | 20 | 6.3% |
| Total | 319 | 100.0% |
Transportation & Commute in Perryopolis borough
Vehicle Availability by Sex in Perryopolis borough
The most prevalent vehicle ownership categories in Perryopolis borough are males with 2 vehicles (171, accounting for 50.0%) and females with 2 vehicles (160, making up 47.4%).
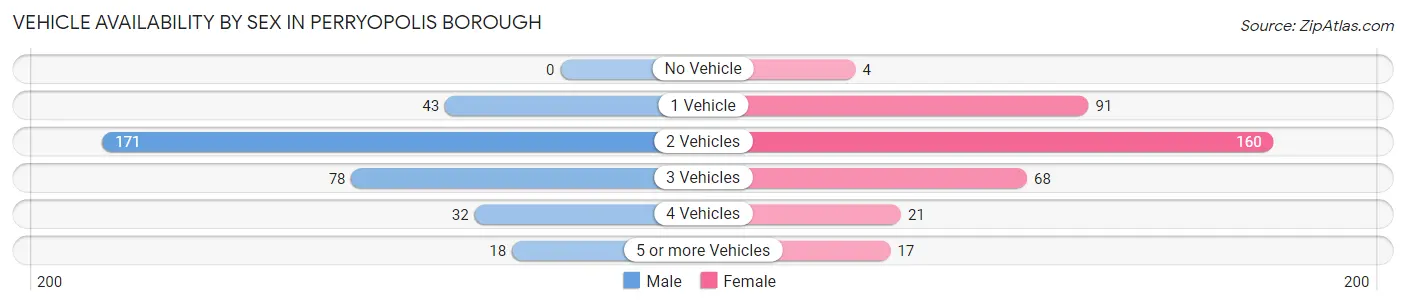
| Vehicles Available | Male | Female |
| No Vehicle | 0 (0.0%) | 4 (1.1%) |
| 1 Vehicle | 43 (12.6%) | 91 (25.2%) |
| 2 Vehicles | 171 (50.0%) | 160 (44.3%) |
| 3 Vehicles | 78 (22.8%) | 68 (18.8%) |
| 4 Vehicles | 32 (9.4%) | 21 (5.8%) |
| 5 or more Vehicles | 18 (5.3%) | 17 (4.7%) |
| Total | 342 (100.0%) | 361 (100.0%) |
Commute Time in Perryopolis borough
The most frequently occuring commute durations in Perryopolis borough are 20 to 24 minutes (124 commuters, 20.6%), 25 to 29 minutes (86 commuters, 14.3%), and 30 to 34 minutes (84 commuters, 14.0%).
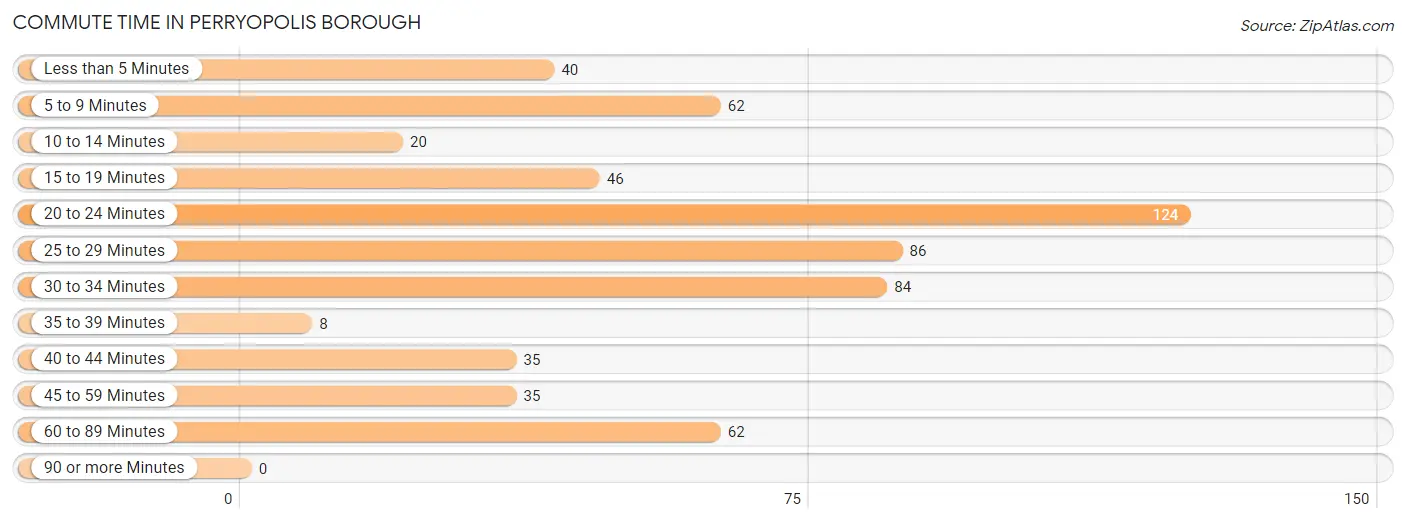
| Commute Time | # Commuters | % Commuters |
| Less than 5 Minutes | 40 | 6.6% |
| 5 to 9 Minutes | 62 | 10.3% |
| 10 to 14 Minutes | 20 | 3.3% |
| 15 to 19 Minutes | 46 | 7.6% |
| 20 to 24 Minutes | 124 | 20.6% |
| 25 to 29 Minutes | 86 | 14.3% |
| 30 to 34 Minutes | 84 | 14.0% |
| 35 to 39 Minutes | 8 | 1.3% |
| 40 to 44 Minutes | 35 | 5.8% |
| 45 to 59 Minutes | 35 | 5.8% |
| 60 to 89 Minutes | 62 | 10.3% |
| 90 or more Minutes | 0 | 0.0% |
Commute Time by Sex in Perryopolis borough
The most common commute times in Perryopolis borough are 30 to 34 minutes (70 commuters, 21.9%) for males and 20 to 24 minutes (90 commuters, 31.8%) for females.
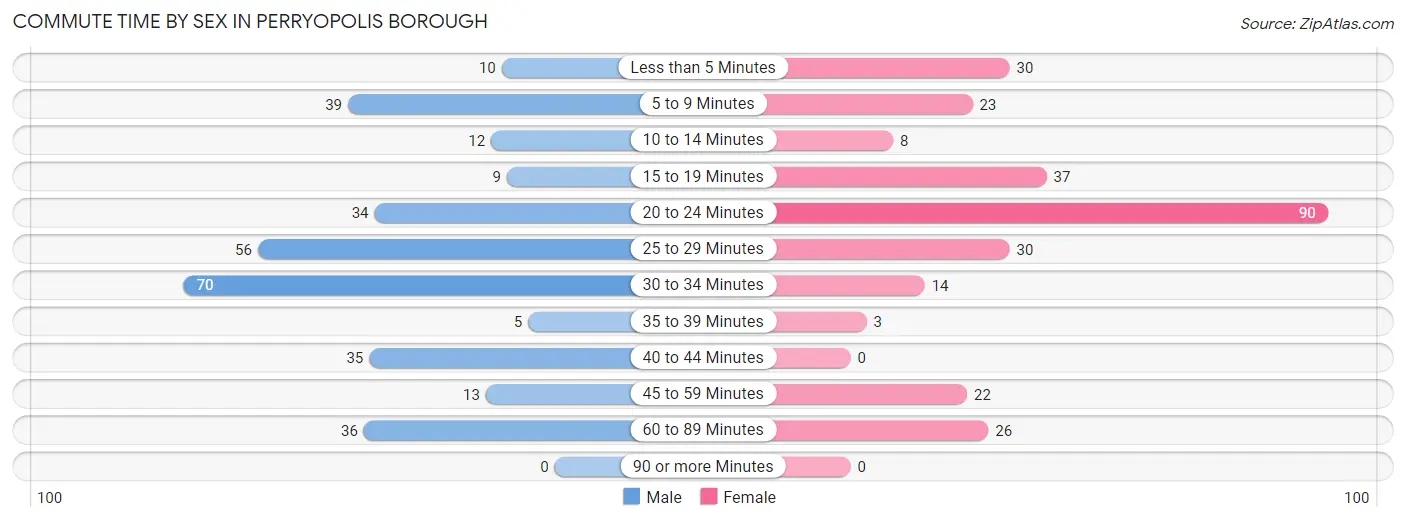
| Commute Time | Male | Female |
| Less than 5 Minutes | 10 (3.1%) | 30 (10.6%) |
| 5 to 9 Minutes | 39 (12.2%) | 23 (8.1%) |
| 10 to 14 Minutes | 12 (3.8%) | 8 (2.8%) |
| 15 to 19 Minutes | 9 (2.8%) | 37 (13.1%) |
| 20 to 24 Minutes | 34 (10.7%) | 90 (31.8%) |
| 25 to 29 Minutes | 56 (17.5%) | 30 (10.6%) |
| 30 to 34 Minutes | 70 (21.9%) | 14 (5.0%) |
| 35 to 39 Minutes | 5 (1.6%) | 3 (1.1%) |
| 40 to 44 Minutes | 35 (11.0%) | 0 (0.0%) |
| 45 to 59 Minutes | 13 (4.1%) | 22 (7.8%) |
| 60 to 89 Minutes | 36 (11.3%) | 26 (9.2%) |
| 90 or more Minutes | 0 (0.0%) | 0 (0.0%) |
Time of Departure to Work by Sex in Perryopolis borough
The most frequent times of departure to work in Perryopolis borough are 7:30 AM to 7:59 AM (61, 19.1%) for males and 7:00 AM to 7:29 AM (73, 25.8%) for females.
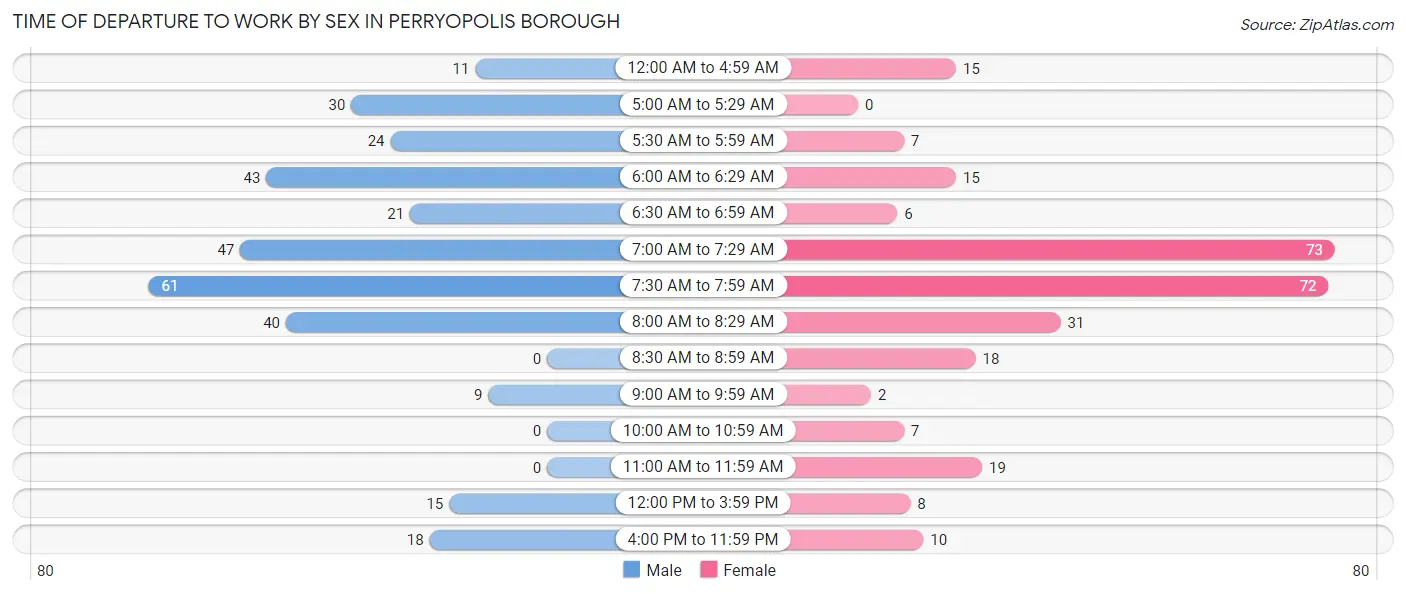
| Time of Departure | Male | Female |
| 12:00 AM to 4:59 AM | 11 (3.5%) | 15 (5.3%) |
| 5:00 AM to 5:29 AM | 30 (9.4%) | 0 (0.0%) |
| 5:30 AM to 5:59 AM | 24 (7.5%) | 7 (2.5%) |
| 6:00 AM to 6:29 AM | 43 (13.5%) | 15 (5.3%) |
| 6:30 AM to 6:59 AM | 21 (6.6%) | 6 (2.1%) |
| 7:00 AM to 7:29 AM | 47 (14.7%) | 73 (25.8%) |
| 7:30 AM to 7:59 AM | 61 (19.1%) | 72 (25.4%) |
| 8:00 AM to 8:29 AM | 40 (12.5%) | 31 (11.0%) |
| 8:30 AM to 8:59 AM | 0 (0.0%) | 18 (6.4%) |
| 9:00 AM to 9:59 AM | 9 (2.8%) | 2 (0.7%) |
| 10:00 AM to 10:59 AM | 0 (0.0%) | 7 (2.5%) |
| 11:00 AM to 11:59 AM | 0 (0.0%) | 19 (6.7%) |
| 12:00 PM to 3:59 PM | 15 (4.7%) | 8 (2.8%) |
| 4:00 PM to 11:59 PM | 18 (5.6%) | 10 (3.5%) |
| Total | 319 (100.0%) | 283 (100.0%) |
Housing Occupancy in Perryopolis borough
Occupancy by Ownership in Perryopolis borough
Of the total 728 dwellings in Perryopolis borough, owner-occupied units account for 564 (77.5%), while renter-occupied units make up 164 (22.5%).
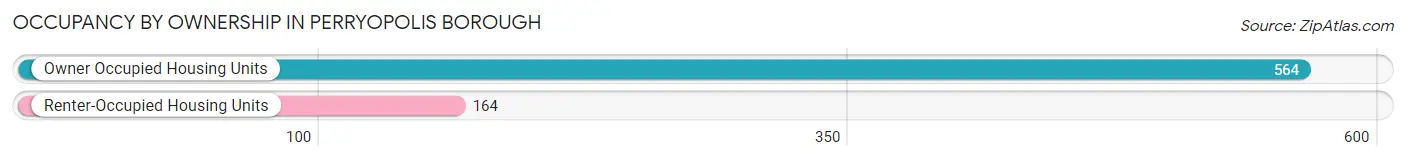
| Occupancy | # Housing Units | % Housing Units |
| Owner Occupied Housing Units | 564 | 77.5% |
| Renter-Occupied Housing Units | 164 | 22.5% |
| Total Occupied Housing Units | 728 | 100.0% |
Occupancy by Household Size in Perryopolis borough
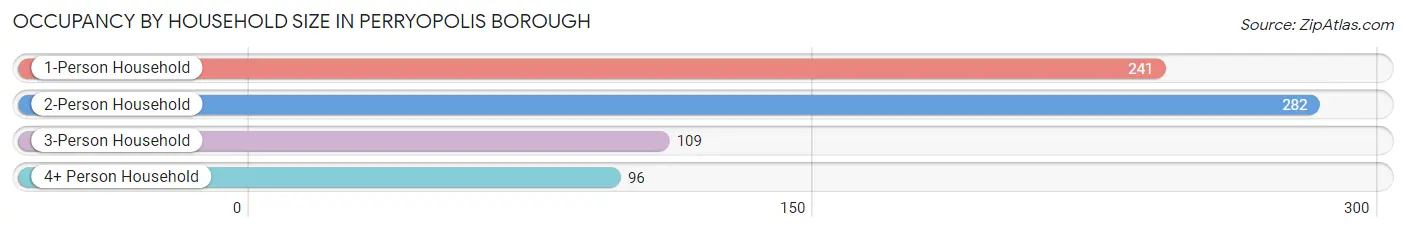
| Household Size | # Housing Units | % Housing Units |
| 1-Person Household | 241 | 33.1% |
| 2-Person Household | 282 | 38.7% |
| 3-Person Household | 109 | 15.0% |
| 4+ Person Household | 96 | 13.2% |
| Total Housing Units | 728 | 100.0% |
Occupancy by Ownership by Household Size in Perryopolis borough
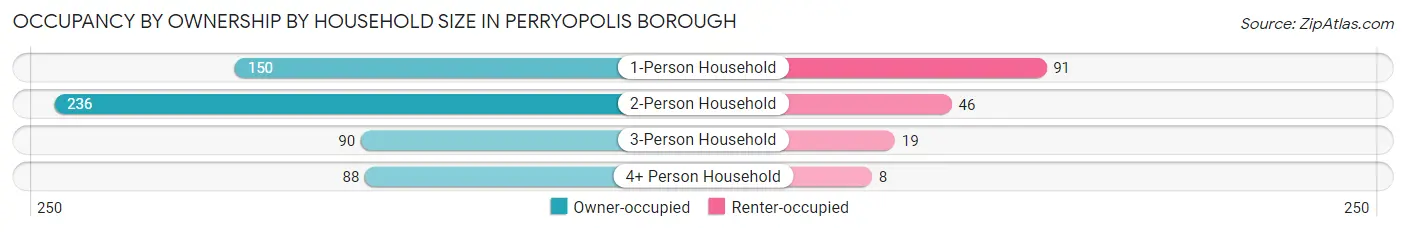
| Household Size | Owner-occupied | Renter-occupied |
| 1-Person Household | 150 (62.2%) | 91 (37.8%) |
| 2-Person Household | 236 (83.7%) | 46 (16.3%) |
| 3-Person Household | 90 (82.6%) | 19 (17.4%) |
| 4+ Person Household | 88 (91.7%) | 8 (8.3%) |
| Total Housing Units | 564 (77.5%) | 164 (22.5%) |
Occupancy by Educational Attainment in Perryopolis borough
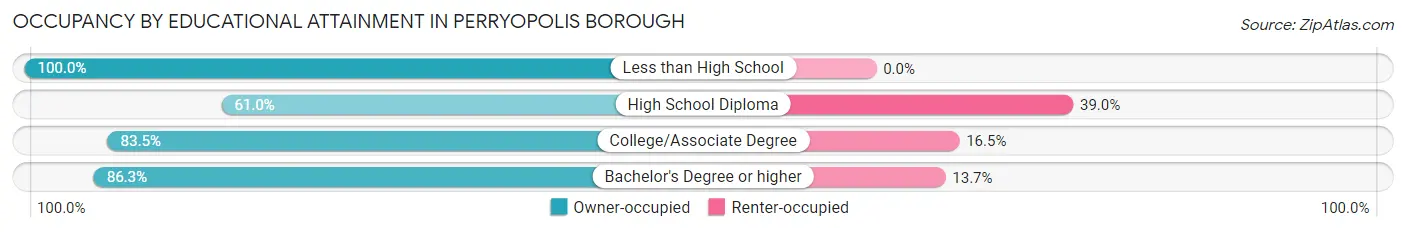
| Household Size | Owner-occupied | Renter-occupied |
| Less than High School | 63 (100.0%) | 0 (0.0%) |
| High School Diploma | 164 (61.0%) | 105 (39.0%) |
| College/Associate Degree | 142 (83.5%) | 28 (16.5%) |
| Bachelor's Degree or higher | 195 (86.3%) | 31 (13.7%) |
Occupancy by Age of Householder in Perryopolis borough
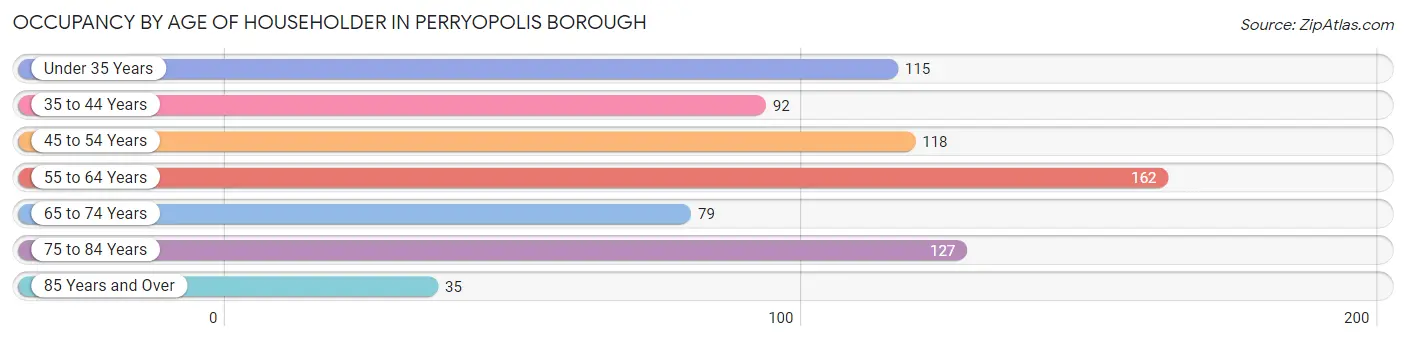
| Age Bracket | # Households | % Households |
| Under 35 Years | 115 | 15.8% |
| 35 to 44 Years | 92 | 12.6% |
| 45 to 54 Years | 118 | 16.2% |
| 55 to 64 Years | 162 | 22.3% |
| 65 to 74 Years | 79 | 10.8% |
| 75 to 84 Years | 127 | 17.4% |
| 85 Years and Over | 35 | 4.8% |
| Total | 728 | 100.0% |
Housing Finances in Perryopolis borough
Median Income by Occupancy in Perryopolis borough
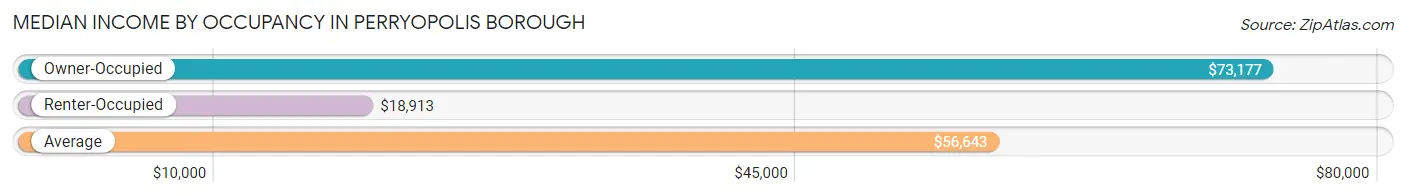
| Occupancy Type | # Households | Median Income |
| Owner-Occupied | 564 (77.5%) | $73,177 |
| Renter-Occupied | 164 (22.5%) | $18,913 |
| Average | 728 (100.0%) | $56,643 |
Occupancy by Householder Income Bracket in Perryopolis borough
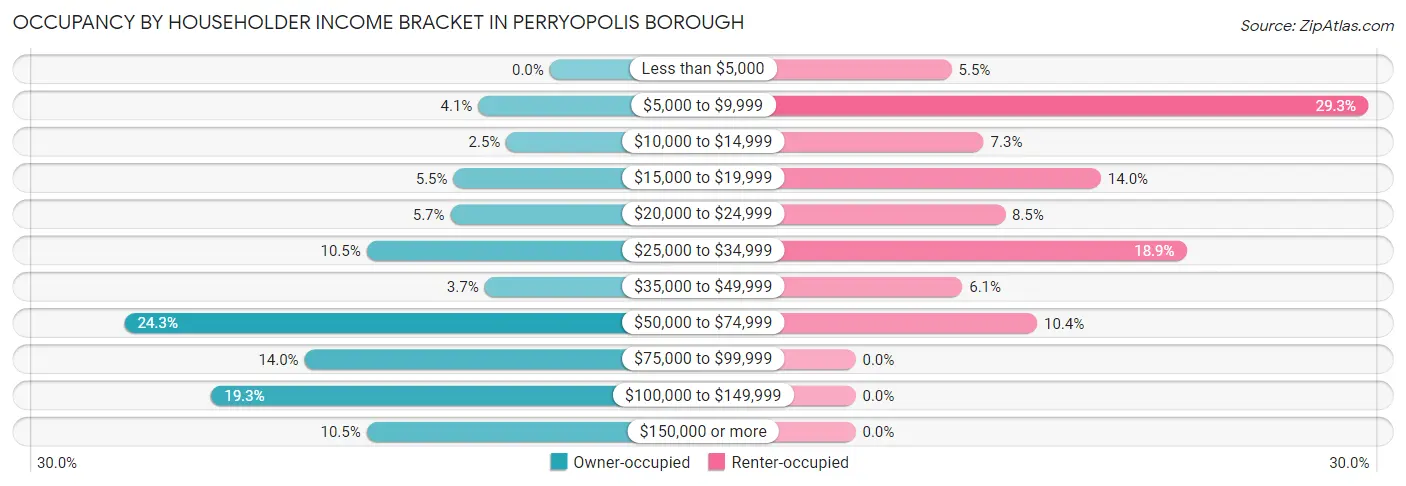
| Income Bracket | Owner-occupied | Renter-occupied |
| Less than $5,000 | 0 (0.0%) | 9 (5.5%) |
| $5,000 to $9,999 | 23 (4.1%) | 48 (29.3%) |
| $10,000 to $14,999 | 14 (2.5%) | 12 (7.3%) |
| $15,000 to $19,999 | 31 (5.5%) | 23 (14.0%) |
| $20,000 to $24,999 | 32 (5.7%) | 14 (8.5%) |
| $25,000 to $34,999 | 59 (10.5%) | 31 (18.9%) |
| $35,000 to $49,999 | 21 (3.7%) | 10 (6.1%) |
| $50,000 to $74,999 | 137 (24.3%) | 17 (10.4%) |
| $75,000 to $99,999 | 79 (14.0%) | 0 (0.0%) |
| $100,000 to $149,999 | 109 (19.3%) | 0 (0.0%) |
| $150,000 or more | 59 (10.5%) | 0 (0.0%) |
| Total | 564 (100.0%) | 164 (100.0%) |
Monthly Housing Cost Tiers in Perryopolis borough
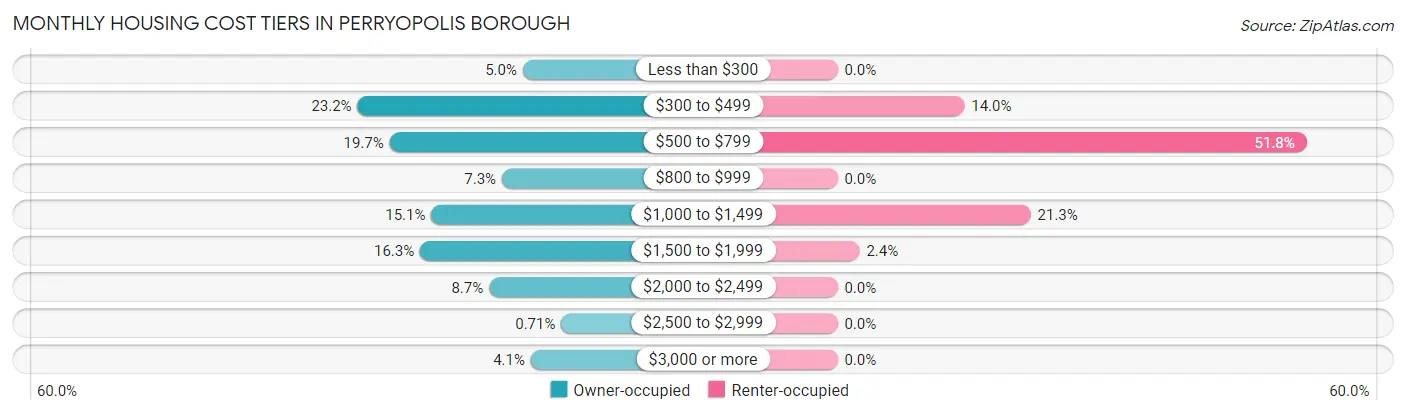
| Monthly Cost | Owner-occupied | Renter-occupied |
| Less than $300 | 28 (5.0%) | 0 (0.0%) |
| $300 to $499 | 131 (23.2%) | 23 (14.0%) |
| $500 to $799 | 111 (19.7%) | 85 (51.8%) |
| $800 to $999 | 41 (7.3%) | 0 (0.0%) |
| $1,000 to $1,499 | 85 (15.1%) | 35 (21.3%) |
| $1,500 to $1,999 | 92 (16.3%) | 4 (2.4%) |
| $2,000 to $2,499 | 49 (8.7%) | 0 (0.0%) |
| $2,500 to $2,999 | 4 (0.7%) | 0 (0.0%) |
| $3,000 or more | 23 (4.1%) | 0 (0.0%) |
| Total | 564 (100.0%) | 164 (100.0%) |
Physical Housing Characteristics in Perryopolis borough
Housing Structures in Perryopolis borough
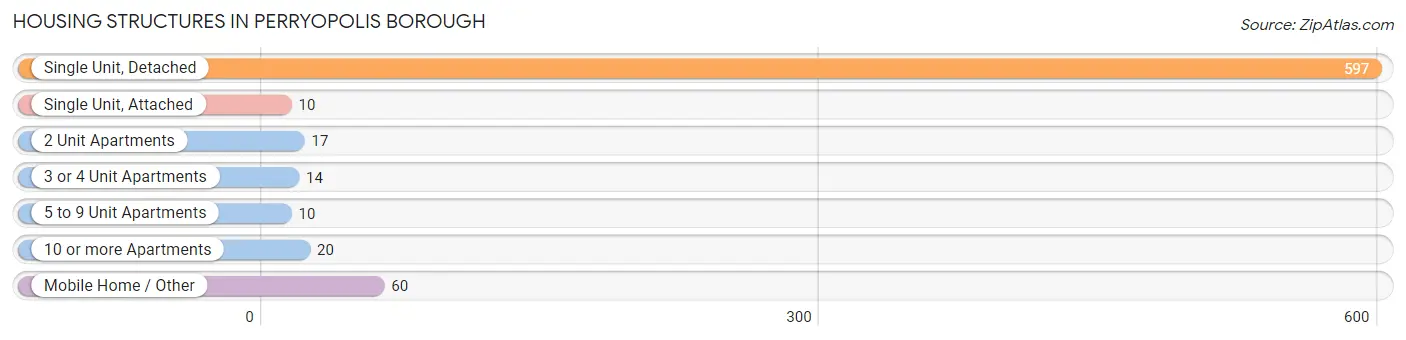
| Structure Type | # Housing Units | % Housing Units |
| Single Unit, Detached | 597 | 82.0% |
| Single Unit, Attached | 10 | 1.4% |
| 2 Unit Apartments | 17 | 2.3% |
| 3 or 4 Unit Apartments | 14 | 1.9% |
| 5 to 9 Unit Apartments | 10 | 1.4% |
| 10 or more Apartments | 20 | 2.8% |
| Mobile Home / Other | 60 | 8.2% |
| Total | 728 | 100.0% |
Housing Structures by Occupancy in Perryopolis borough
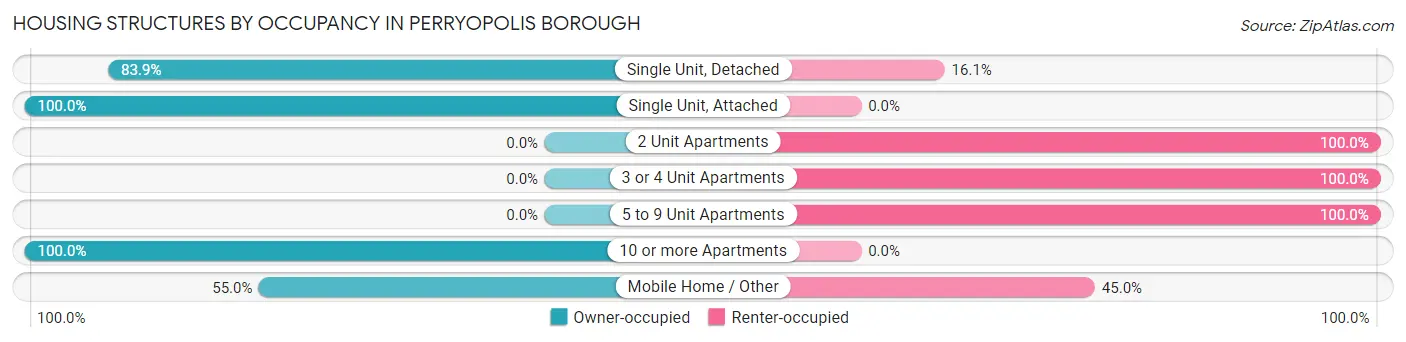
| Structure Type | Owner-occupied | Renter-occupied |
| Single Unit, Detached | 501 (83.9%) | 96 (16.1%) |
| Single Unit, Attached | 10 (100.0%) | 0 (0.0%) |
| 2 Unit Apartments | 0 (0.0%) | 17 (100.0%) |
| 3 or 4 Unit Apartments | 0 (0.0%) | 14 (100.0%) |
| 5 to 9 Unit Apartments | 0 (0.0%) | 10 (100.0%) |
| 10 or more Apartments | 20 (100.0%) | 0 (0.0%) |
| Mobile Home / Other | 33 (55.0%) | 27 (45.0%) |
| Total | 564 (77.5%) | 164 (22.5%) |
Housing Structures by Number of Rooms in Perryopolis borough
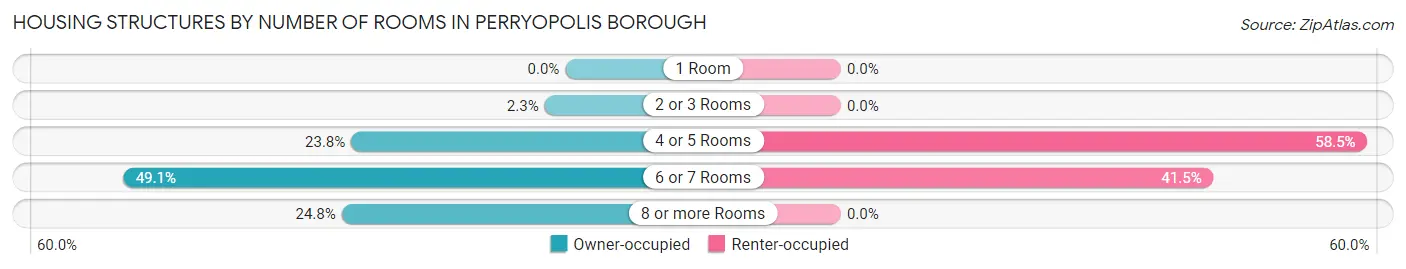
| Number of Rooms | Owner-occupied | Renter-occupied |
| 1 Room | 0 (0.0%) | 0 (0.0%) |
| 2 or 3 Rooms | 13 (2.3%) | 0 (0.0%) |
| 4 or 5 Rooms | 134 (23.8%) | 96 (58.5%) |
| 6 or 7 Rooms | 277 (49.1%) | 68 (41.5%) |
| 8 or more Rooms | 140 (24.8%) | 0 (0.0%) |
| Total | 564 (100.0%) | 164 (100.0%) |
Housing Structure by Heating Type in Perryopolis borough
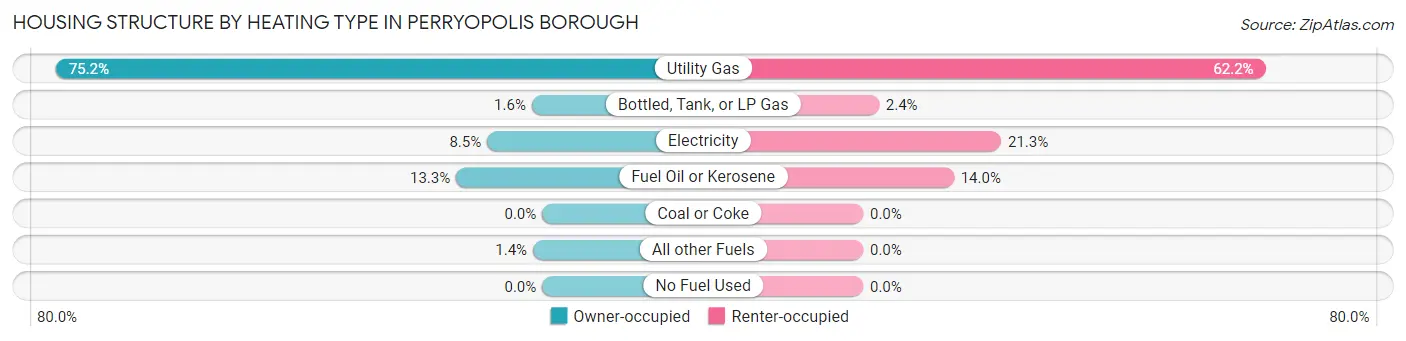
| Heating Type | Owner-occupied | Renter-occupied |
| Utility Gas | 424 (75.2%) | 102 (62.2%) |
| Bottled, Tank, or LP Gas | 9 (1.6%) | 4 (2.4%) |
| Electricity | 48 (8.5%) | 35 (21.3%) |
| Fuel Oil or Kerosene | 75 (13.3%) | 23 (14.0%) |
| Coal or Coke | 0 (0.0%) | 0 (0.0%) |
| All other Fuels | 8 (1.4%) | 0 (0.0%) |
| No Fuel Used | 0 (0.0%) | 0 (0.0%) |
| Total | 564 (100.0%) | 164 (100.0%) |
Household Vehicle Usage in Perryopolis borough
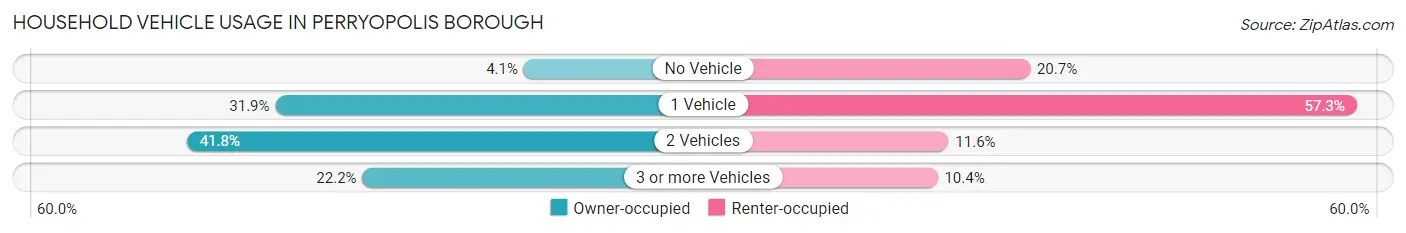
| Vehicles per Household | Owner-occupied | Renter-occupied |
| No Vehicle | 23 (4.1%) | 34 (20.7%) |
| 1 Vehicle | 180 (31.9%) | 94 (57.3%) |
| 2 Vehicles | 236 (41.8%) | 19 (11.6%) |
| 3 or more Vehicles | 125 (22.2%) | 17 (10.4%) |
| Total | 564 (100.0%) | 164 (100.0%) |
Real Estate & Mortgages in Perryopolis borough
Real Estate and Mortgage Overview in Perryopolis borough
| Characteristic | Without Mortgage | With Mortgage |
| Housing Units | 277 | 287 |
| Median Property Value | $116,800 | $230,100 |
| Median Household Income | $55,284 | $38 |
| Monthly Housing Costs | $464 | $23 |
| Real Estate Taxes | $1,803 | $4 |
Property Value by Mortgage Status in Perryopolis borough
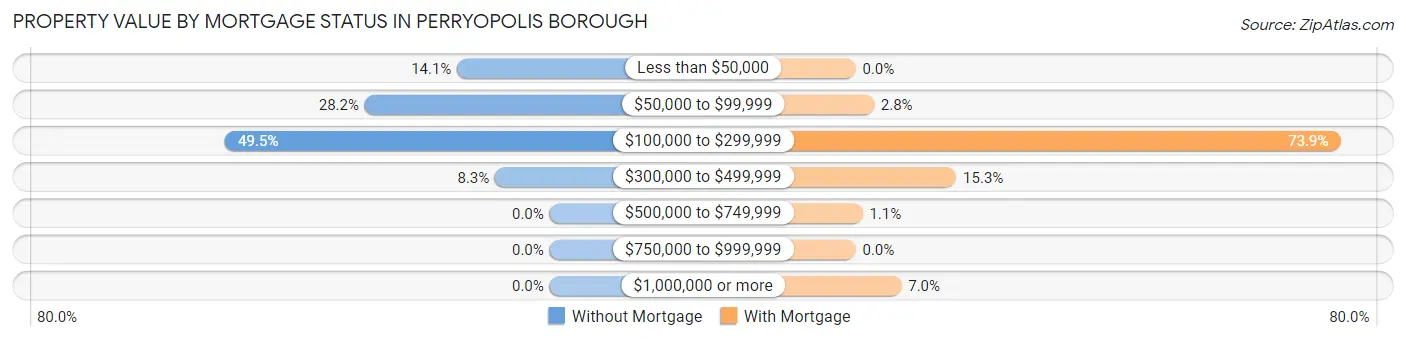
| Property Value | Without Mortgage | With Mortgage |
| Less than $50,000 | 39 (14.1%) | 0 (0.0%) |
| $50,000 to $99,999 | 78 (28.2%) | 8 (2.8%) |
| $100,000 to $299,999 | 137 (49.5%) | 212 (73.9%) |
| $300,000 to $499,999 | 23 (8.3%) | 44 (15.3%) |
| $500,000 to $749,999 | 0 (0.0%) | 3 (1.1%) |
| $750,000 to $999,999 | 0 (0.0%) | 0 (0.0%) |
| $1,000,000 or more | 0 (0.0%) | 20 (7.0%) |
| Total | 277 (100.0%) | 287 (100.0%) |
Household Income by Mortgage Status in Perryopolis borough
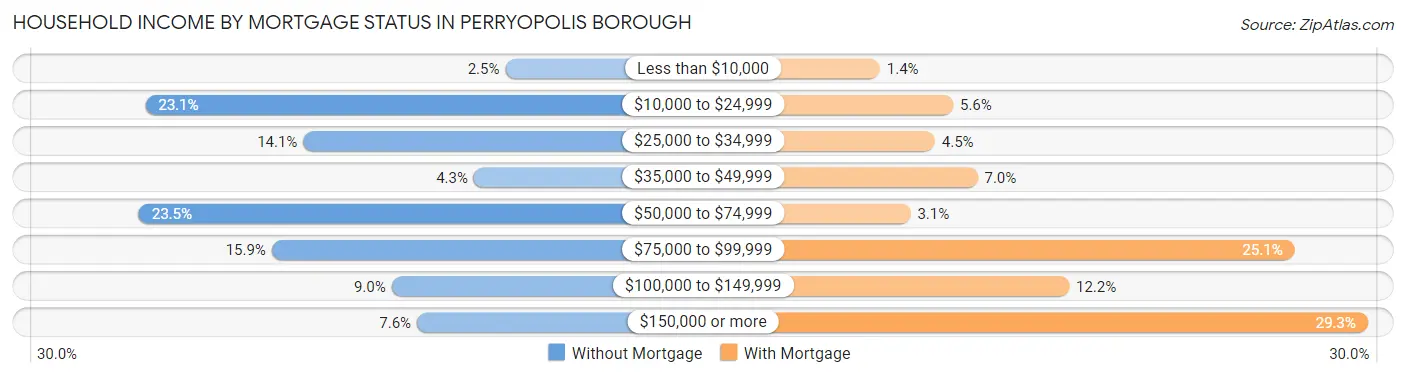
| Household Income | Without Mortgage | With Mortgage |
| Less than $10,000 | 7 (2.5%) | 4 (1.4%) |
| $10,000 to $24,999 | 64 (23.1%) | 16 (5.6%) |
| $25,000 to $34,999 | 39 (14.1%) | 13 (4.5%) |
| $35,000 to $49,999 | 12 (4.3%) | 20 (7.0%) |
| $50,000 to $74,999 | 65 (23.5%) | 9 (3.1%) |
| $75,000 to $99,999 | 44 (15.9%) | 72 (25.1%) |
| $100,000 to $149,999 | 25 (9.0%) | 35 (12.2%) |
| $150,000 or more | 21 (7.6%) | 84 (29.3%) |
| Total | 277 (100.0%) | 287 (100.0%) |
Property Value to Household Income Ratio in Perryopolis borough
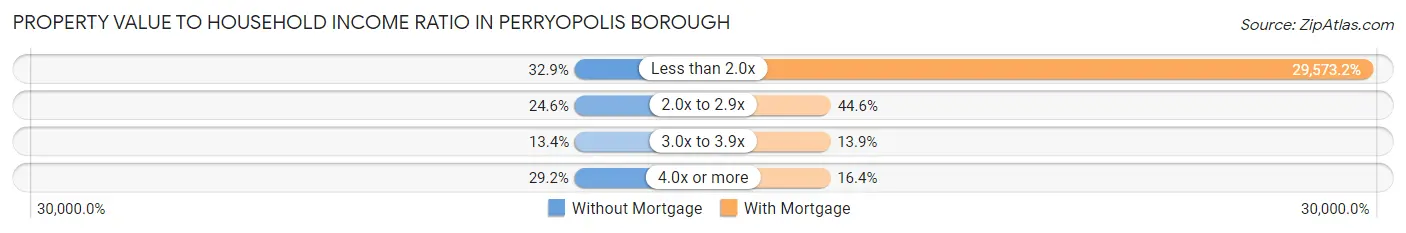
| Value-to-Income Ratio | Without Mortgage | With Mortgage |
| Less than 2.0x | 91 (32.9%) | 84,875 (29,573.2%) |
| 2.0x to 2.9x | 68 (24.5%) | 128 (44.6%) |
| 3.0x to 3.9x | 37 (13.4%) | 40 (13.9%) |
| 4.0x or more | 81 (29.2%) | 47 (16.4%) |
| Total | 277 (100.0%) | 287 (100.0%) |
Real Estate Taxes by Mortgage Status in Perryopolis borough
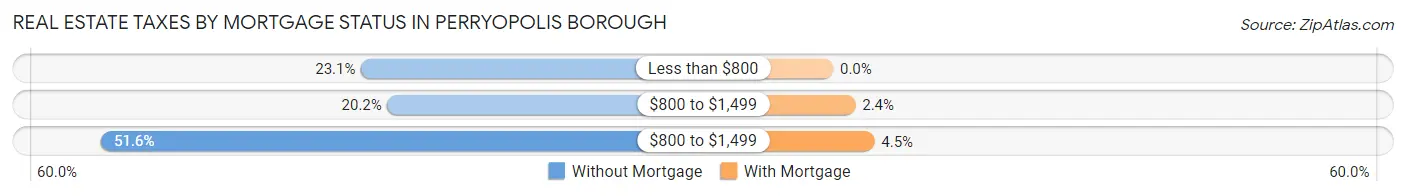
| Property Taxes | Without Mortgage | With Mortgage |
| Less than $800 | 64 (23.1%) | 0 (0.0%) |
| $800 to $1,499 | 56 (20.2%) | 7 (2.4%) |
| $800 to $1,499 | 143 (51.6%) | 13 (4.5%) |
| Total | 277 (100.0%) | 287 (100.0%) |
Health & Disability in Perryopolis borough
Health Insurance Coverage by Age in Perryopolis borough
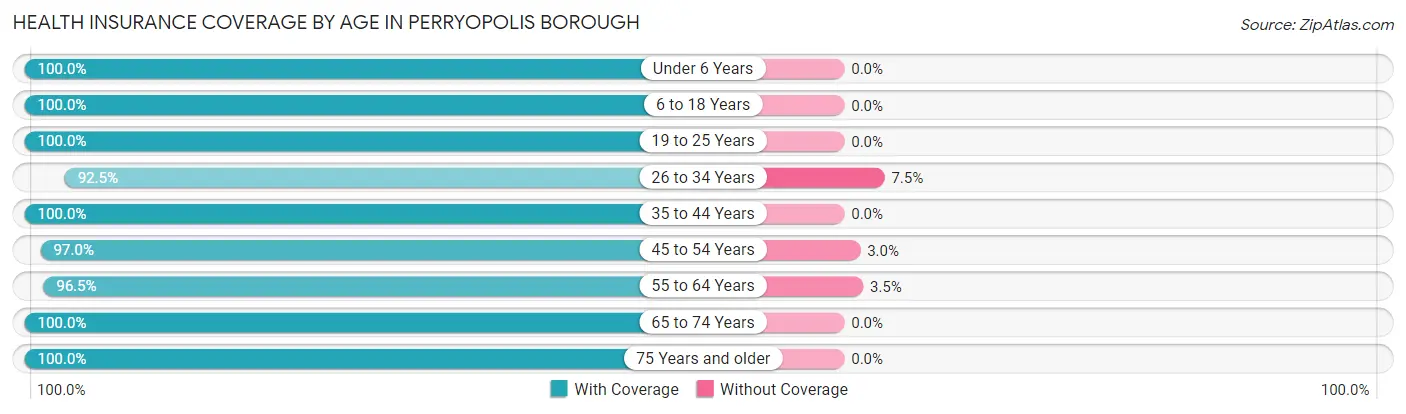
| Age Bracket | With Coverage | Without Coverage |
| Under 6 Years | 99 (100.0%) | 0 (0.0%) |
| 6 to 18 Years | 210 (100.0%) | 0 (0.0%) |
| 19 to 25 Years | 63 (100.0%) | 0 (0.0%) |
| 26 to 34 Years | 173 (92.5%) | 14 (7.5%) |
| 35 to 44 Years | 188 (100.0%) | 0 (0.0%) |
| 45 to 54 Years | 196 (97.0%) | 6 (3.0%) |
| 55 to 64 Years | 248 (96.5%) | 9 (3.5%) |
| 65 to 74 Years | 126 (100.0%) | 0 (0.0%) |
| 75 Years and older | 205 (100.0%) | 0 (0.0%) |
| Total | 1,508 (98.1%) | 29 (1.9%) |
Health Insurance Coverage by Citizenship Status in Perryopolis borough
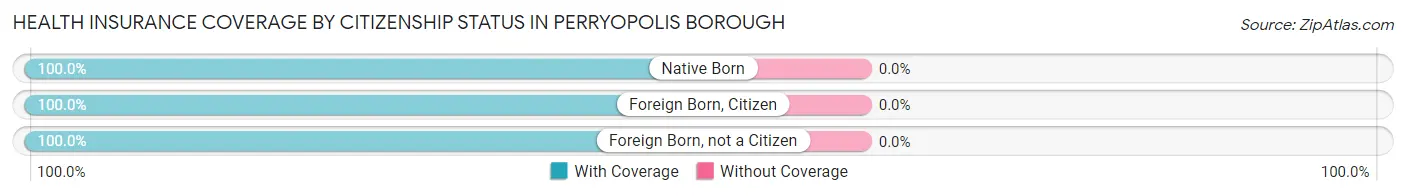
| Citizenship Status | With Coverage | Without Coverage |
| Native Born | 99 (100.0%) | 0 (0.0%) |
| Foreign Born, Citizen | 210 (100.0%) | 0 (0.0%) |
| Foreign Born, not a Citizen | 63 (100.0%) | 0 (0.0%) |
Health Insurance Coverage by Household Income in Perryopolis borough
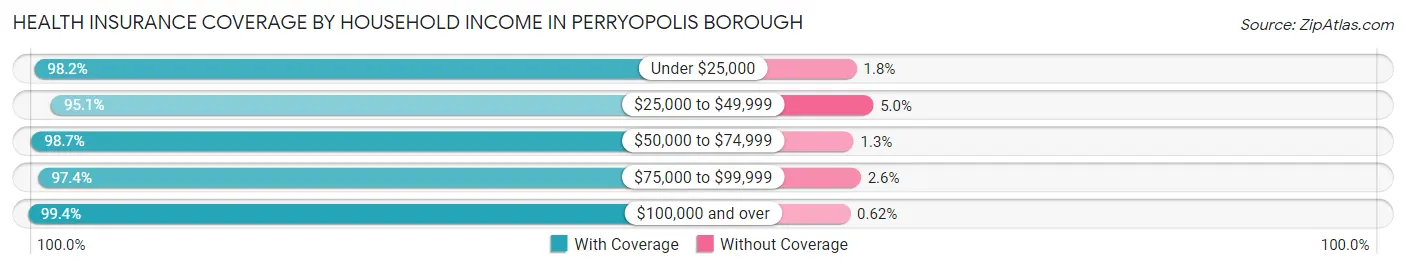
| Household Income | With Coverage | Without Coverage |
| Under $25,000 | 320 (98.2%) | 6 (1.8%) |
| $25,000 to $49,999 | 173 (95.1%) | 9 (5.0%) |
| $50,000 to $74,999 | 311 (98.7%) | 4 (1.3%) |
| $75,000 to $99,999 | 224 (97.4%) | 6 (2.6%) |
| $100,000 and over | 480 (99.4%) | 3 (0.6%) |
Public vs Private Health Insurance Coverage by Age in Perryopolis borough
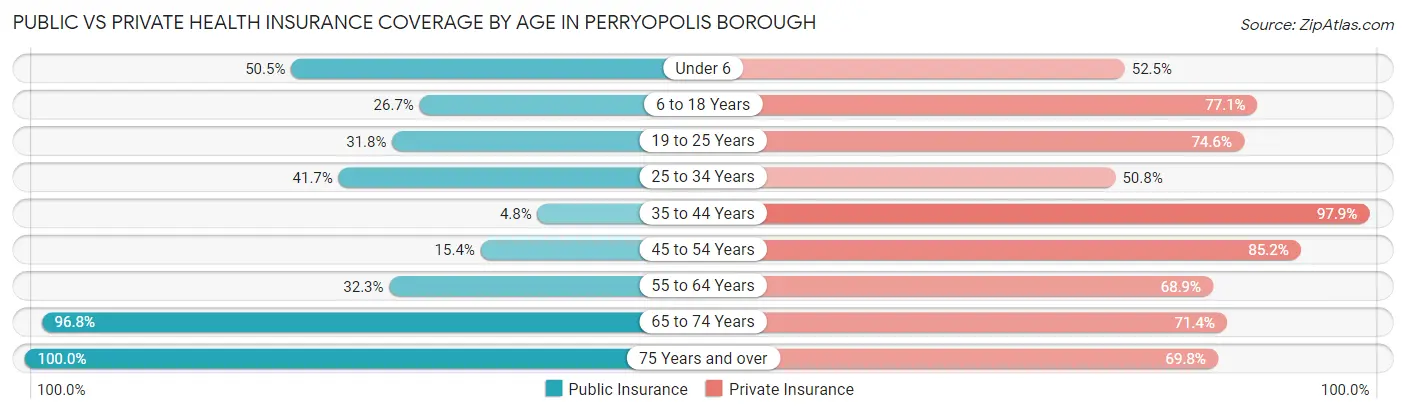
| Age Bracket | Public Insurance | Private Insurance |
| Under 6 | 50 (50.5%) | 52 (52.5%) |
| 6 to 18 Years | 56 (26.7%) | 162 (77.1%) |
| 19 to 25 Years | 20 (31.8%) | 47 (74.6%) |
| 25 to 34 Years | 78 (41.7%) | 95 (50.8%) |
| 35 to 44 Years | 9 (4.8%) | 184 (97.9%) |
| 45 to 54 Years | 31 (15.3%) | 172 (85.2%) |
| 55 to 64 Years | 83 (32.3%) | 177 (68.9%) |
| 65 to 74 Years | 122 (96.8%) | 90 (71.4%) |
| 75 Years and over | 205 (100.0%) | 143 (69.8%) |
| Total | 654 (42.5%) | 1,122 (73.0%) |
Disability Status by Sex by Age in Perryopolis borough
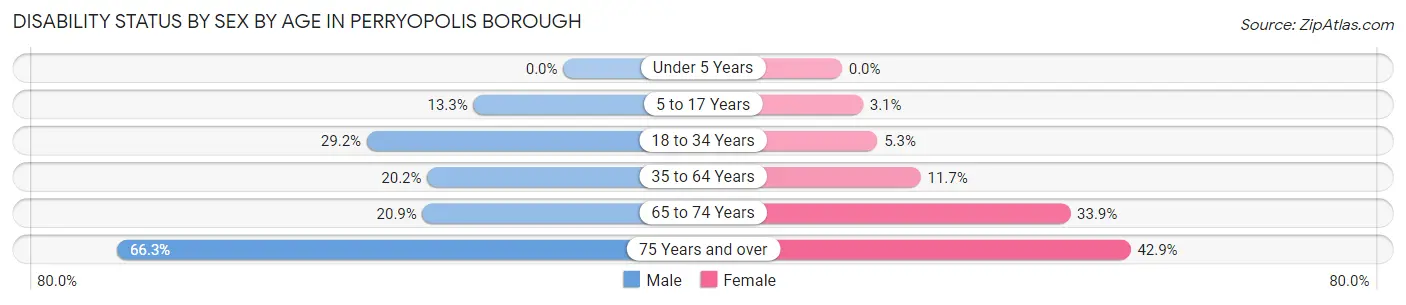
| Age Bracket | Male | Female |
| Under 5 Years | 0 (0.0%) | 0 (0.0%) |
| 5 to 17 Years | 14 (13.3%) | 3 (3.1%) |
| 18 to 34 Years | 42 (29.2%) | 7 (5.3%) |
| 35 to 64 Years | 65 (20.2%) | 38 (11.7%) |
| 65 to 74 Years | 14 (20.9%) | 20 (33.9%) |
| 75 Years and over | 57 (66.3%) | 51 (42.9%) |
Disability Class by Sex by Age in Perryopolis borough
Disability Class: Hearing Difficulty
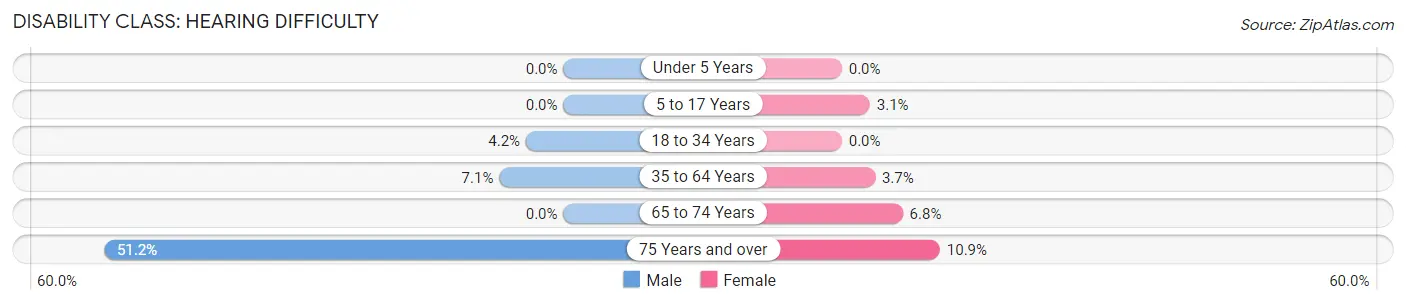
| Age Bracket | Male | Female |
| Under 5 Years | 0 (0.0%) | 0 (0.0%) |
| 5 to 17 Years | 0 (0.0%) | 3 (3.1%) |
| 18 to 34 Years | 6 (4.2%) | 0 (0.0%) |
| 35 to 64 Years | 23 (7.1%) | 12 (3.7%) |
| 65 to 74 Years | 0 (0.0%) | 4 (6.8%) |
| 75 Years and over | 44 (51.2%) | 13 (10.9%) |
Disability Class: Vision Difficulty
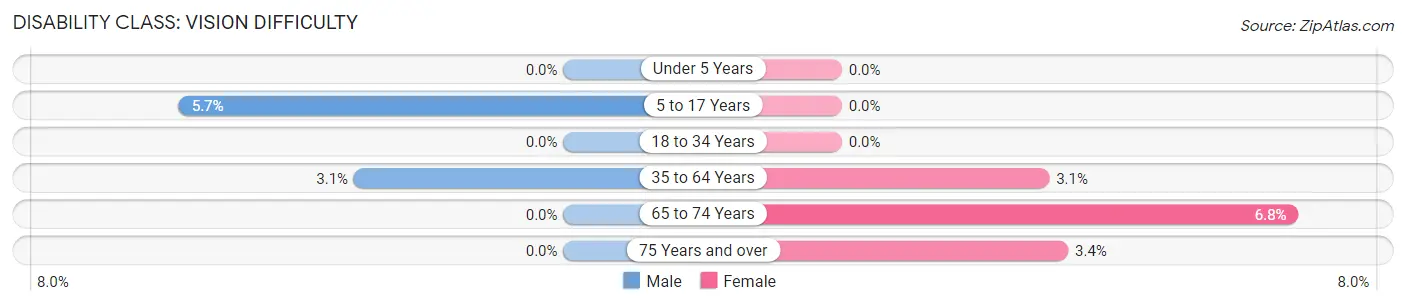
| Age Bracket | Male | Female |
| Under 5 Years | 0 (0.0%) | 0 (0.0%) |
| 5 to 17 Years | 6 (5.7%) | 0 (0.0%) |
| 18 to 34 Years | 0 (0.0%) | 0 (0.0%) |
| 35 to 64 Years | 10 (3.1%) | 10 (3.1%) |
| 65 to 74 Years | 0 (0.0%) | 4 (6.8%) |
| 75 Years and over | 0 (0.0%) | 4 (3.4%) |
Disability Class: Cognitive Difficulty
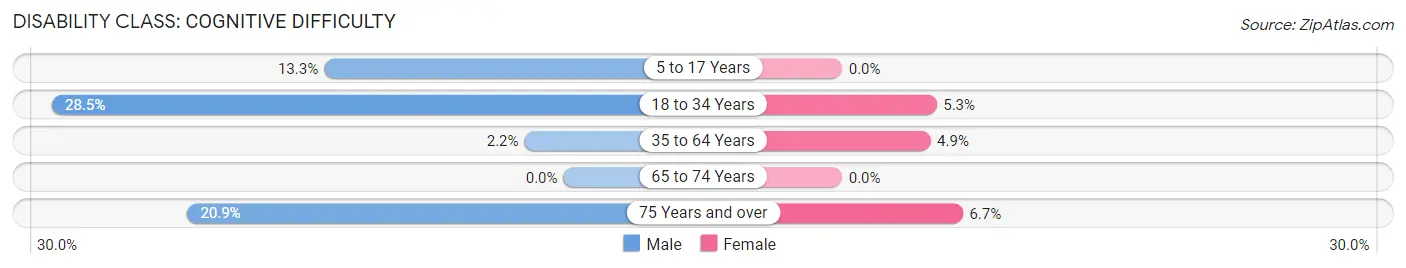
| Age Bracket | Male | Female |
| 5 to 17 Years | 14 (13.3%) | 0 (0.0%) |
| 18 to 34 Years | 41 (28.5%) | 7 (5.3%) |
| 35 to 64 Years | 7 (2.2%) | 16 (4.9%) |
| 65 to 74 Years | 0 (0.0%) | 0 (0.0%) |
| 75 Years and over | 18 (20.9%) | 8 (6.7%) |
Disability Class: Ambulatory Difficulty
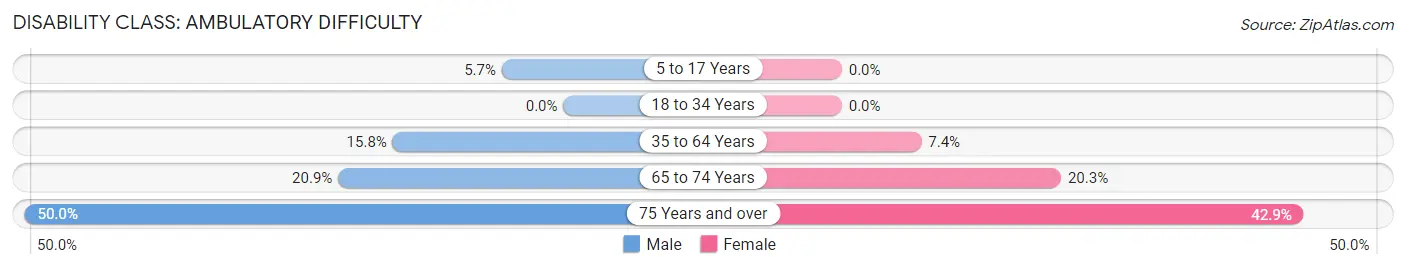
| Age Bracket | Male | Female |
| 5 to 17 Years | 6 (5.7%) | 0 (0.0%) |
| 18 to 34 Years | 0 (0.0%) | 0 (0.0%) |
| 35 to 64 Years | 51 (15.8%) | 24 (7.4%) |
| 65 to 74 Years | 14 (20.9%) | 12 (20.3%) |
| 75 Years and over | 43 (50.0%) | 51 (42.9%) |
Disability Class: Self-Care Difficulty
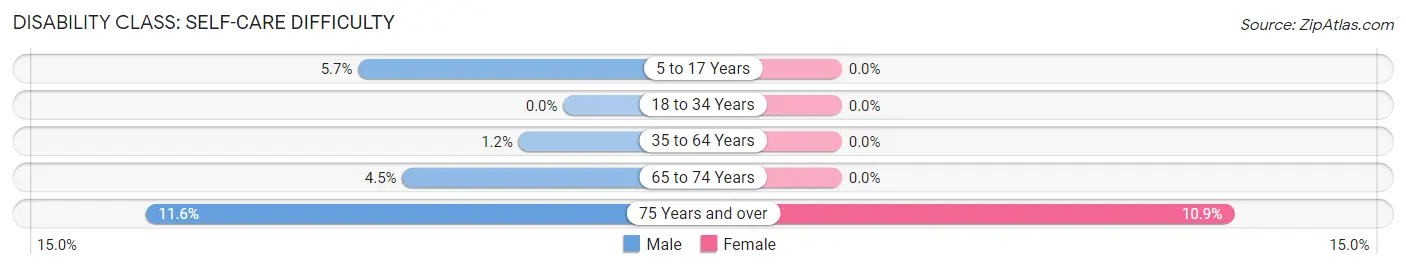
| Age Bracket | Male | Female |
| 5 to 17 Years | 6 (5.7%) | 0 (0.0%) |
| 18 to 34 Years | 0 (0.0%) | 0 (0.0%) |
| 35 to 64 Years | 4 (1.2%) | 0 (0.0%) |
| 65 to 74 Years | 3 (4.5%) | 0 (0.0%) |
| 75 Years and over | 10 (11.6%) | 13 (10.9%) |
Technology Access in Perryopolis borough
Computing Device Access in Perryopolis borough
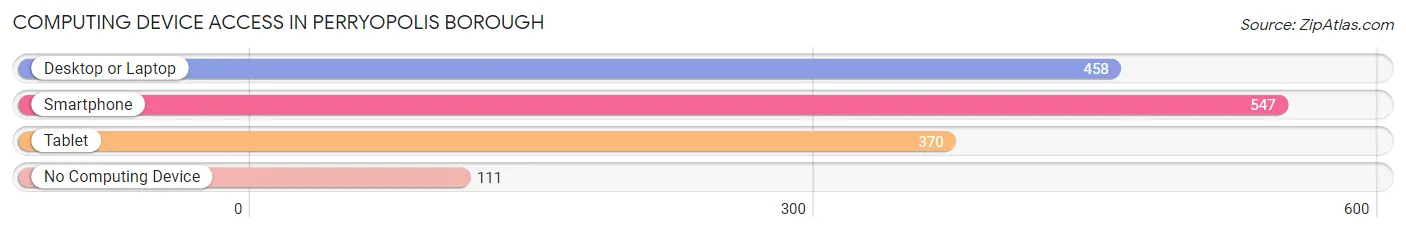
| Device Type | # Households | % Households |
| Desktop or Laptop | 458 | 62.9% |
| Smartphone | 547 | 75.1% |
| Tablet | 370 | 50.8% |
| No Computing Device | 111 | 15.2% |
| Total | 728 | 100.0% |
Internet Access in Perryopolis borough
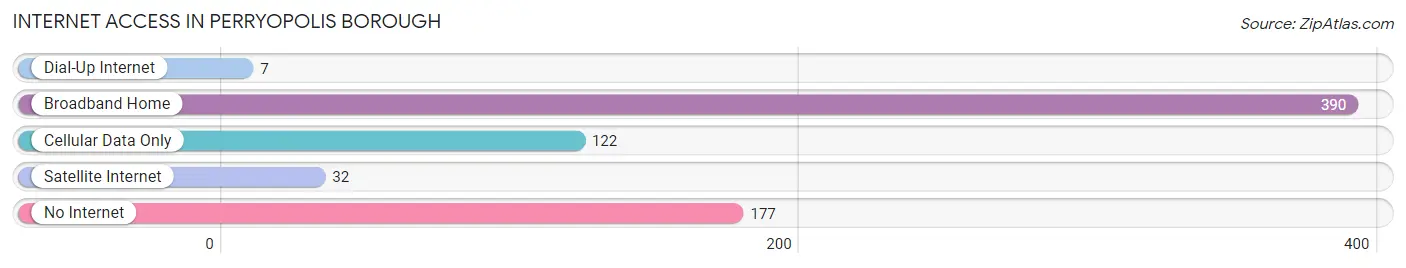
| Internet Type | # Households | % Households |
| Dial-Up Internet | 7 | 1.0% |
| Broadband Home | 390 | 53.6% |
| Cellular Data Only | 122 | 16.8% |
| Satellite Internet | 32 | 4.4% |
| No Internet | 177 | 24.3% |
| Total | 728 | 100.0% |
Perryopolis borough Summary
Perryopolis Borough is a small borough located in Fayette County, Pennsylvania. It is situated in the southwestern corner of the county, approximately 30 miles south of Pittsburgh. The borough is bordered by the townships of Bullskin, Dunbar, and Georges. The population of Perryopolis Borough was 1,845 at the 2010 census.
History
Perryopolis Borough was founded in 1817 by John Perry, a Revolutionary War veteran. The town was named after him and was originally known as Perry’s Town. The town was incorporated as a borough in 1851.
In the late 19th century, Perryopolis was a thriving industrial center. The town was home to several coal mines, brickyards, and glass factories. The town also had a large railroad yard and a number of passenger and freight trains passed through the town daily.
In the early 20th century, the town’s economy began to decline as the coal and glass industries moved away. The town’s population also began to decline as people moved away in search of better job opportunities.
Geography
Perryopolis Borough is located at 40°7'17" North, 79°45'45" West (40.1214, -79.7625). The borough has a total area of 0.9 square miles, all of which is land.
The borough is located in the southwestern corner of Fayette County, approximately 30 miles south of Pittsburgh. The borough is bordered by the townships of Bullskin, Dunbar, and Georges.
Economy
The economy of Perryopolis Borough is largely based on agriculture and tourism. The town is home to several farms, including a dairy farm, a beef farm, and a vegetable farm. The town also has several wineries and vineyards.
The town is also home to several small businesses, including a hardware store, a grocery store, and a restaurant. The town also has a post office and a bank.
Demographics
As of the 2010 census, the population of Perryopolis Borough was 1,845. The racial makeup of the borough was 97.3% White, 0.9% African American, 0.2% Native American, 0.2% Asian, 0.1% from other races, and 1.3% from two or more races. Hispanic or Latino of any race were 0.7% of the population.
The median income for a household in the borough was $37,500, and the median income for a family was $45,000. The per capita income for the borough was $18,845. About 11.3% of families and 13.2% of the population were below the poverty line, including 17.2% of those under age 18 and 8.3% of those age 65 or over.
Common Questions
What is Per Capita Income in Perryopolis borough?
Per Capita income in Perryopolis borough is $30,614.
What is the Median Family Income in Perryopolis borough?
Median Family Income in Perryopolis borough is $74,851.
What is the Median Household income in Perryopolis borough?
Median Household Income in Perryopolis borough is $56,643.
What is Income or Wage Gap in Perryopolis borough?
Income or Wage Gap in Perryopolis borough is 61.4%.
Women in Perryopolis borough earn 38.6 cents for every dollar earned by a man.
What is Inequality or Gini Index in Perryopolis borough?
Inequality or Gini Index in Perryopolis borough is 0.44.
What is the Total Population of Perryopolis borough?
Total Population of Perryopolis borough is 1,537.
What is the Total Male Population of Perryopolis borough?
Total Male Population of Perryopolis borough is 763.
What is the Total Female Population of Perryopolis borough?
Total Female Population of Perryopolis borough is 774.
What is the Ratio of Males per 100 Females in Perryopolis borough?
There are 98.58 Males per 100 Females in Perryopolis borough.
What is the Ratio of Females per 100 Males in Perryopolis borough?
There are 101.44 Females per 100 Males in Perryopolis borough.
What is the Median Population Age in Perryopolis borough?
Median Population Age in Perryopolis borough is 45.6 Years.
What is the Average Family Size in Perryopolis borough
Average Family Size in Perryopolis borough is 2.6 People.
What is the Average Household Size in Perryopolis borough
Average Household Size in Perryopolis borough is 2.1 People.
How Large is the Labor Force in Perryopolis borough?
There are 784 People in the Labor Forcein in Perryopolis borough.
What is the Percentage of People in the Labor Force in Perryopolis borough?
61.8% of People are in the Labor Force in Perryopolis borough.
What is the Unemployment Rate in Perryopolis borough?
Unemployment Rate in Perryopolis borough is 7.4%.