South Philipsburg, PA Map & Demographics
South Philipsburg Map
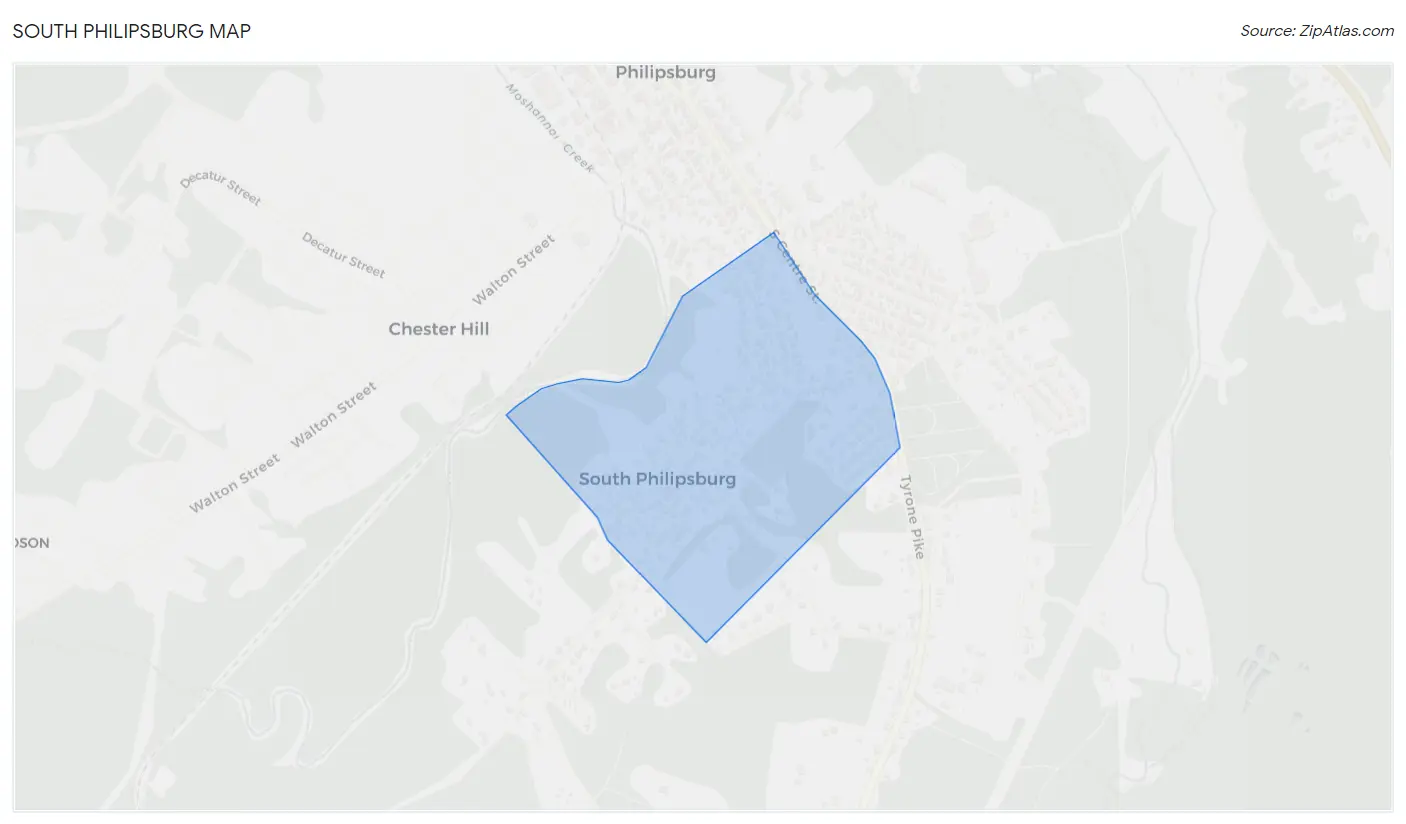
South Philipsburg Overview
$28,530
PER CAPITA INCOME
$67,115
AVG FAMILY INCOME
$56,773
AVG HOUSEHOLD INCOME
3.3%
WAGE / INCOME GAP [ % ]
96.7¢/ $1
WAGE / INCOME GAP [ $ ]
0.39
INEQUALITY / GINI INDEX
545
TOTAL POPULATION
210
MALE POPULATION
335
FEMALE POPULATION
62.69
MALES / 100 FEMALES
159.52
FEMALES / 100 MALES
45.8
MEDIAN AGE
3.3
AVG FAMILY SIZE
2.6
AVG HOUSEHOLD SIZE
162
LABOR FORCE [ PEOPLE ]
32.6%
PERCENT IN LABOR FORCE
Income in South Philipsburg
Income Overview in South Philipsburg
Per Capita Income in South Philipsburg is $28,530, while median incomes of families and households are $67,115 and $56,773 respectively.
| Characteristic | Number | Measure |
| Per Capita Income | 545 | $28,530 |
| Median Family Income | 132 | $67,115 |
| Mean Family Income | 132 | $63,329 |
| Median Household Income | 211 | $56,773 |
| Mean Household Income | 211 | $67,323 |
| Income Deficit | 132 | $0 |
| Wage / Income Gap (%) | 545 | 3.30% |
| Wage / Income Gap ($) | 545 | 96.70¢ per $1 |
| Gini / Inequality Index | 545 | 0.39 |
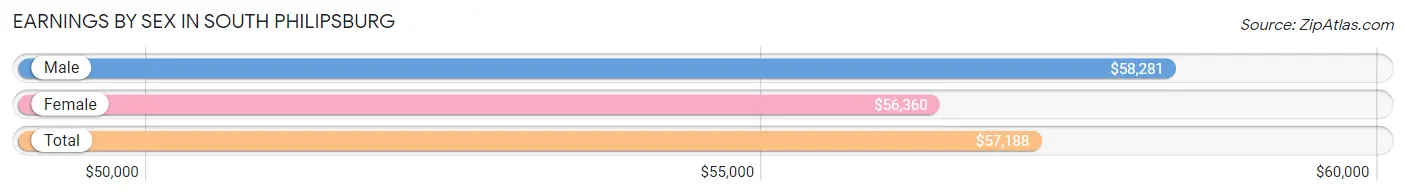
Earnings by Sex in South Philipsburg
Average Earnings in South Philipsburg are $57,188, $58,281 for men and $56,360 for women, a difference of 3.3%.
| Sex | Number | Average Earnings |
| Male | 76 (45.5%) | $58,281 |
| Female | 91 (54.5%) | $56,360 |
| Total | 167 (100.0%) | $57,188 |
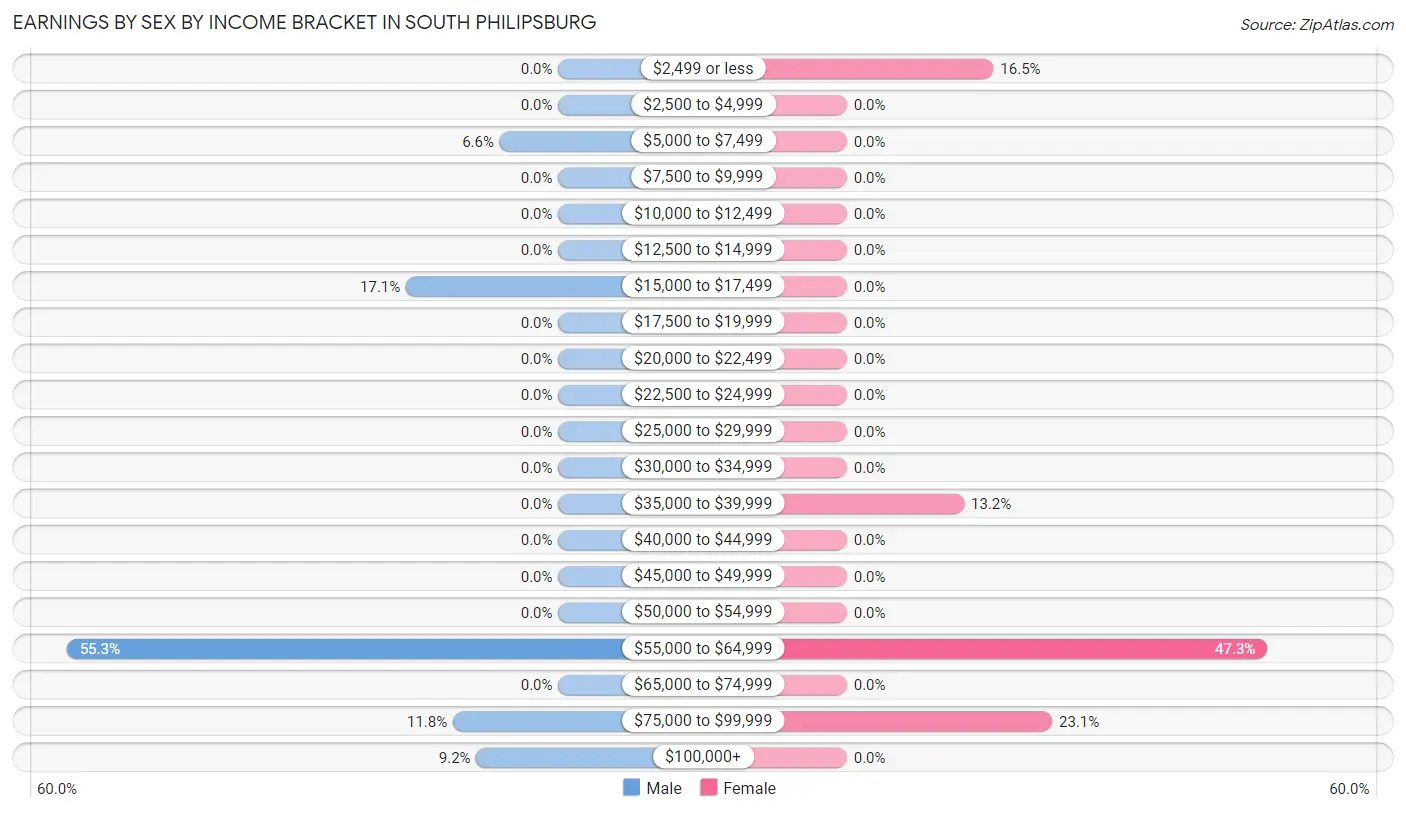
Earnings by Sex by Income Bracket in South Philipsburg
The most common earnings brackets in South Philipsburg are $55,000 to $64,999 for men (42 | 55.3%) and $55,000 to $64,999 for women (43 | 47.2%).
| Income | Male | Female |
| $2,499 or less | 0 (0.0%) | 15 (16.5%) |
| $2,500 to $4,999 | 0 (0.0%) | 0 (0.0%) |
| $5,000 to $7,499 | 5 (6.6%) | 0 (0.0%) |
| $7,500 to $9,999 | 0 (0.0%) | 0 (0.0%) |
| $10,000 to $12,499 | 0 (0.0%) | 0 (0.0%) |
| $12,500 to $14,999 | 0 (0.0%) | 0 (0.0%) |
| $15,000 to $17,499 | 13 (17.1%) | 0 (0.0%) |
| $17,500 to $19,999 | 0 (0.0%) | 0 (0.0%) |
| $20,000 to $22,499 | 0 (0.0%) | 0 (0.0%) |
| $22,500 to $24,999 | 0 (0.0%) | 0 (0.0%) |
| $25,000 to $29,999 | 0 (0.0%) | 0 (0.0%) |
| $30,000 to $34,999 | 0 (0.0%) | 0 (0.0%) |
| $35,000 to $39,999 | 0 (0.0%) | 12 (13.2%) |
| $40,000 to $44,999 | 0 (0.0%) | 0 (0.0%) |
| $45,000 to $49,999 | 0 (0.0%) | 0 (0.0%) |
| $50,000 to $54,999 | 0 (0.0%) | 0 (0.0%) |
| $55,000 to $64,999 | 42 (55.3%) | 43 (47.2%) |
| $65,000 to $74,999 | 0 (0.0%) | 0 (0.0%) |
| $75,000 to $99,999 | 9 (11.8%) | 21 (23.1%) |
| $100,000+ | 7 (9.2%) | 0 (0.0%) |
| Total | 76 (100.0%) | 91 (100.0%) |
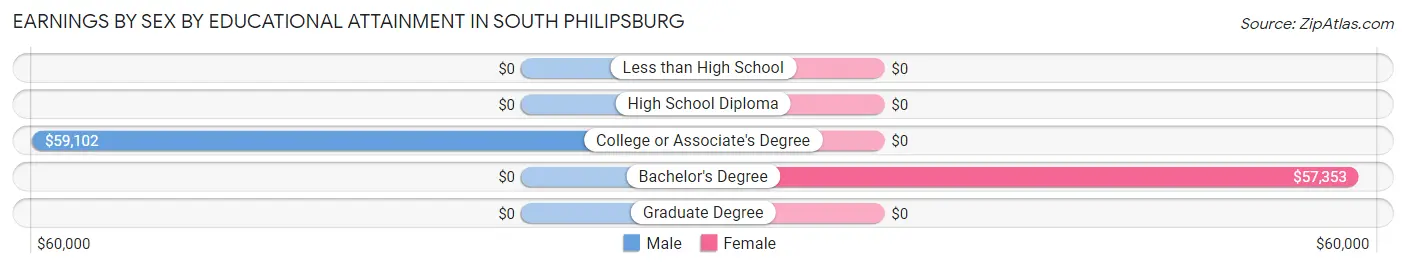
Earnings by Sex by Educational Attainment in South Philipsburg
Average earnings in South Philipsburg are $58,281 for men and $56,360 for women, a difference of 3.3%. Men with an educational attainment of college or associate's degree enjoy the highest average annual earnings of $59,102, while those with college or associate's degree education earn the least with $59,102. Women with an educational attainment of bachelor's degree earn the most with the average annual earnings of $57,353, while those with bachelor's degree education have the smallest earnings of $57,353.
| Educational Attainment | Male Income | Female Income |
| Less than High School | - | - |
| High School Diploma | - | - |
| College or Associate's Degree | $59,102 | $0 |
| Bachelor's Degree | - | - |
| Graduate Degree | - | - |
| Total | $58,281 | $56,360 |
Family Income in South Philipsburg
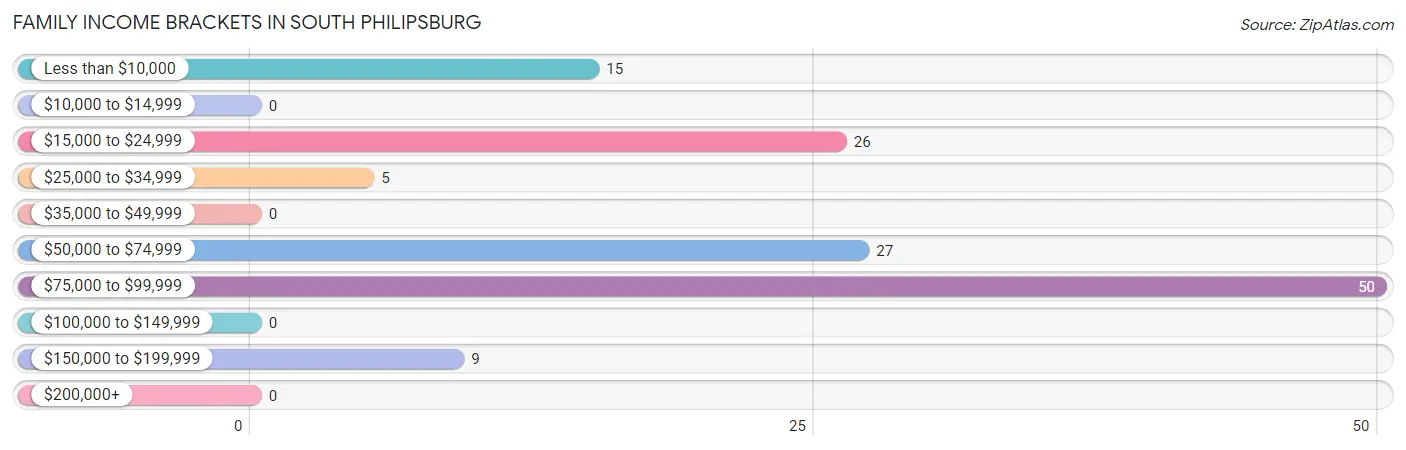
Family Income Brackets in South Philipsburg
According to the South Philipsburg family income data, there are 50 families falling into the $75,000 to $99,999 income range, which is the most common income bracket and makes up 37.9% of all families.
| Income Bracket | # Families | % Families |
| Less than $10,000 | 15 | 11.4% |
| $10,000 to $14,999 | 0 | 0.0% |
| $15,000 to $24,999 | 26 | 19.7% |
| $25,000 to $34,999 | 5 | 3.8% |
| $35,000 to $49,999 | 0 | 0.0% |
| $50,000 to $74,999 | 27 | 20.5% |
| $75,000 to $99,999 | 50 | 37.9% |
| $100,000 to $149,999 | 0 | 0.0% |
| $150,000 to $199,999 | 9 | 6.8% |
| $200,000+ | 0 | 0.0% |
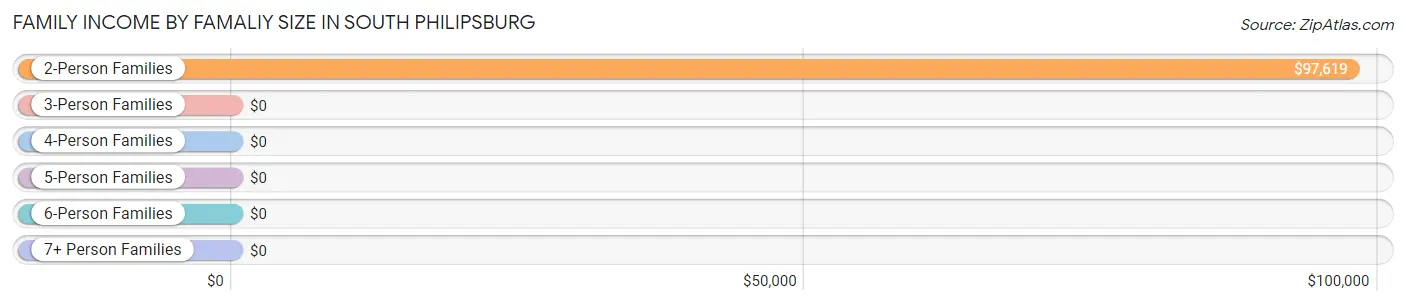
Family Income by Famaliy Size in South Philipsburg
2-person families (40 | 30.3%) account for the highest median family income in South Philipsburg with $97,619 per family, while 2-person families (40 | 30.3%) have the highest median income of $48,810 per family member.
| Income Bracket | # Families | Median Income |
| 2-Person Families | 40 (30.3%) | $97,619 |
| 3-Person Families | 92 (69.7%) | $0 |
| 4-Person Families | 0 (0.0%) | $0 |
| 5-Person Families | 0 (0.0%) | $0 |
| 6-Person Families | 0 (0.0%) | $0 |
| 7+ Person Families | 0 (0.0%) | $0 |
| Total | 132 (100.0%) | $67,115 |
Family Income by Number of Earners in South Philipsburg
| Number of Earners | # Families | Median Income |
| No Earners | 60 (45.5%) | $0 |
| 1 Earner | 50 (37.9%) | $0 |
| 2 Earners | 22 (16.7%) | $0 |
| 3+ Earners | 0 (0.0%) | $0 |
| Total | 132 (100.0%) | $67,115 |
Household Income in South Philipsburg
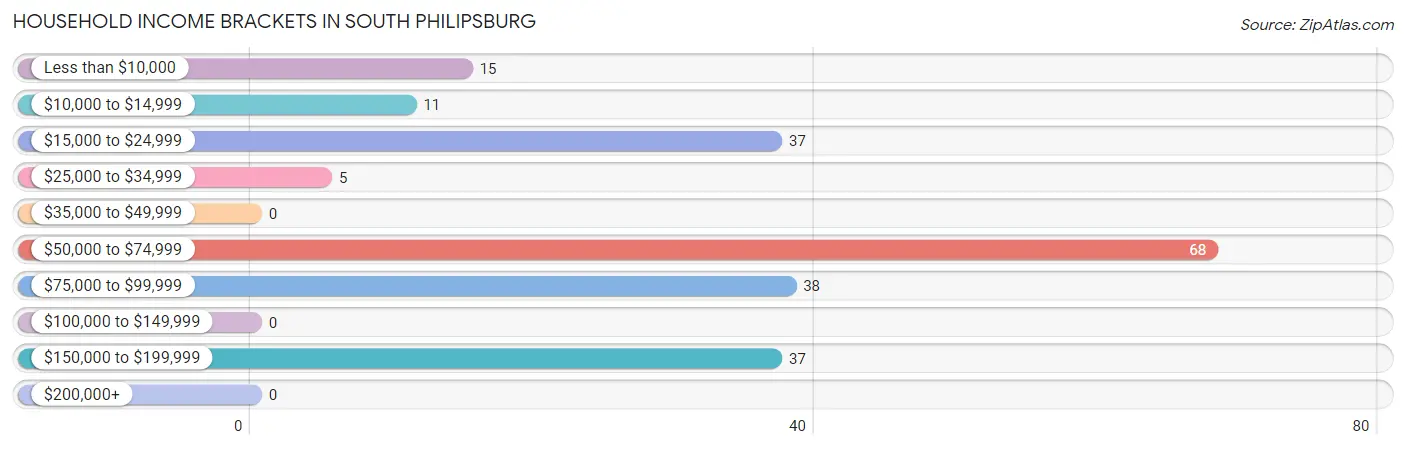
Household Income Brackets in South Philipsburg
With 68 households falling in the category, the $50,000 to $74,999 income range is the most frequent in South Philipsburg, accounting for 32.2% of all households.
| Income Bracket | # Households | % Households |
| Less than $10,000 | 15 | 7.1% |
| $10,000 to $14,999 | 11 | 5.2% |
| $15,000 to $24,999 | 37 | 17.5% |
| $25,000 to $34,999 | 5 | 2.4% |
| $35,000 to $49,999 | 0 | 0.0% |
| $50,000 to $74,999 | 68 | 32.2% |
| $75,000 to $99,999 | 38 | 18.0% |
| $100,000 to $149,999 | 0 | 0.0% |
| $150,000 to $199,999 | 37 | 17.5% |
| $200,000+ | 0 | 0.0% |
Household Income by Householder Age in South Philipsburg
The median household income in South Philipsburg is $56,773, with the highest median household income of $150,833 found in the 25 to 44 years age bracket for the primary householder. A total of 54 households (25.6%) fall into this category.
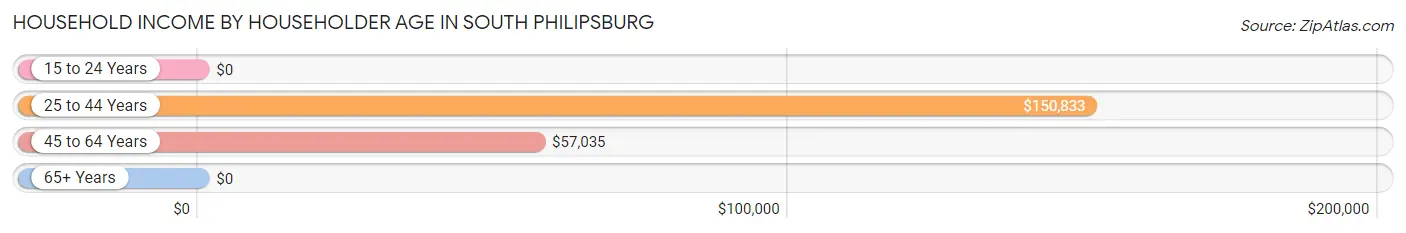
| Income Bracket | # Households | Median Income |
| 15 to 24 Years | 0 (0.0%) | $0 |
| 25 to 44 Years | 54 (25.6%) | $150,833 |
| 45 to 64 Years | 114 (54.0%) | $57,035 |
| 65+ Years | 43 (20.4%) | $0 |
| Total | 211 (100.0%) | $56,773 |
Poverty in South Philipsburg
Income Below Poverty by Sex and Age in South Philipsburg
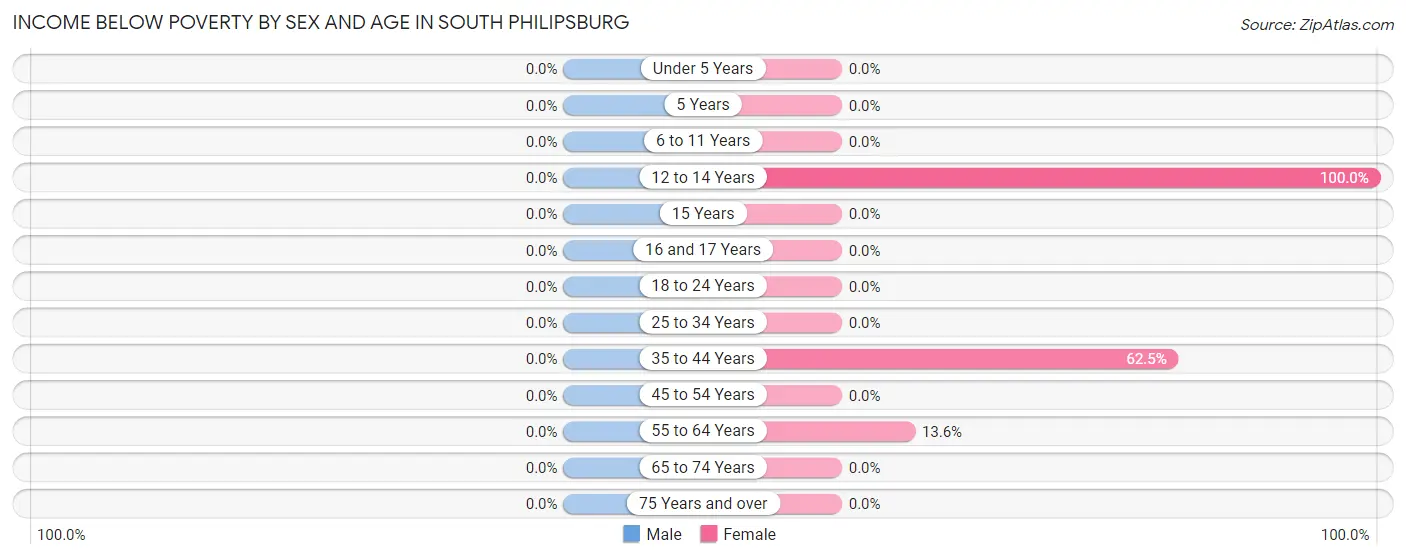
| Age Bracket | Male | Female |
| Under 5 Years | 0 (0.0%) | 0 (0.0%) |
| 5 Years | 0 (0.0%) | 0 (0.0%) |
| 6 to 11 Years | 0 (0.0%) | 0 (0.0%) |
| 12 to 14 Years | 0 (0.0%) | 24 (100.0%) |
| 15 Years | 0 (0.0%) | 0 (0.0%) |
| 16 and 17 Years | 0 (0.0%) | 0 (0.0%) |
| 18 to 24 Years | 0 (0.0%) | 0 (0.0%) |
| 25 to 34 Years | 0 (0.0%) | 0 (0.0%) |
| 35 to 44 Years | 0 (0.0%) | 15 (62.5%) |
| 45 to 54 Years | 0 (0.0%) | 0 (0.0%) |
| 55 to 64 Years | 0 (0.0%) | 11 (13.6%) |
| 65 to 74 Years | 0 (0.0%) | 0 (0.0%) |
| 75 Years and over | 0 (0.0%) | 0 (0.0%) |
| Total | 0 (0.0%) | 50 (14.9%) |
Income Above Poverty by Sex and Age in South Philipsburg
According to the poverty statistics in South Philipsburg, males aged under 5 years and females aged 6 to 11 years are the age groups that are most secure financially, with 100.0% of males and 100.0% of females in these age groups living above the poverty line.
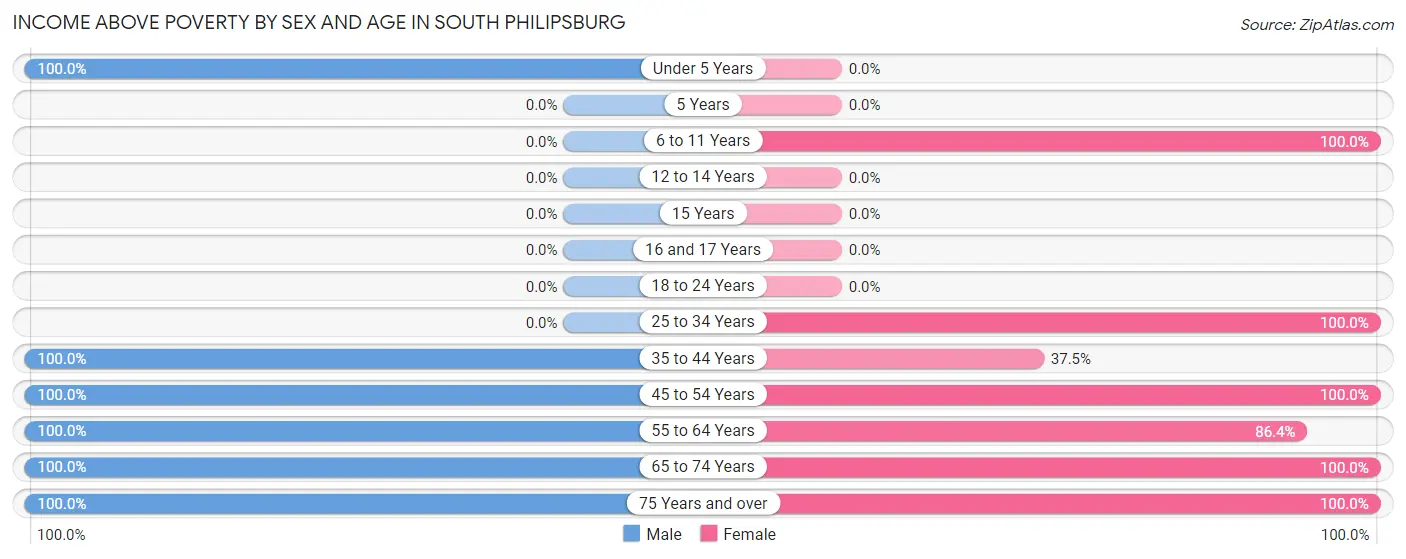
| Age Bracket | Male | Female |
| Under 5 Years | 15 (100.0%) | 0 (0.0%) |
| 5 Years | 0 (0.0%) | 0 (0.0%) |
| 6 to 11 Years | 0 (0.0%) | 9 (100.0%) |
| 12 to 14 Years | 0 (0.0%) | 0 (0.0%) |
| 15 Years | 0 (0.0%) | 0 (0.0%) |
| 16 and 17 Years | 0 (0.0%) | 0 (0.0%) |
| 18 to 24 Years | 0 (0.0%) | 0 (0.0%) |
| 25 to 34 Years | 0 (0.0%) | 73 (100.0%) |
| 35 to 44 Years | 93 (100.0%) | 9 (37.5%) |
| 45 to 54 Years | 47 (100.0%) | 78 (100.0%) |
| 55 to 64 Years | 34 (100.0%) | 70 (86.4%) |
| 65 to 74 Years | 16 (100.0%) | 15 (100.0%) |
| 75 Years and over | 5 (100.0%) | 31 (100.0%) |
| Total | 210 (100.0%) | 285 (85.1%) |
Income Below Poverty Among Married-Couple Families in South Philipsburg
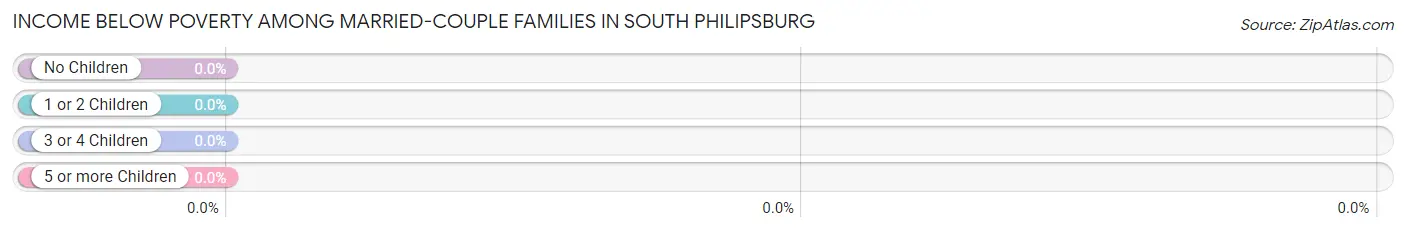
| Children | Above Poverty | Below Poverty |
| No Children | 32 (100.0%) | 0 (0.0%) |
| 1 or 2 Children | 9 (100.0%) | 0 (0.0%) |
| 3 or 4 Children | 0 (0.0%) | 0 (0.0%) |
| 5 or more Children | 0 (0.0%) | 0 (0.0%) |
| Total | 41 (100.0%) | 0 (0.0%) |
Income Below Poverty Among Single-Parent Households in South Philipsburg
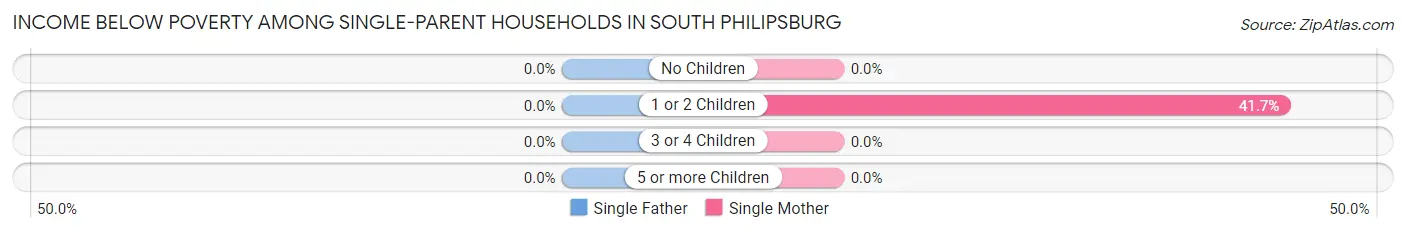
| Children | Single Father | Single Mother |
| No Children | 0 (0.0%) | 0 (0.0%) |
| 1 or 2 Children | 0 (0.0%) | 15 (41.7%) |
| 3 or 4 Children | 0 (0.0%) | 0 (0.0%) |
| 5 or more Children | 0 (0.0%) | 0 (0.0%) |
| Total | 0 (0.0%) | 15 (16.5%) |
Income Below Poverty Among Married-Couple vs Single-Parent Households in South Philipsburg
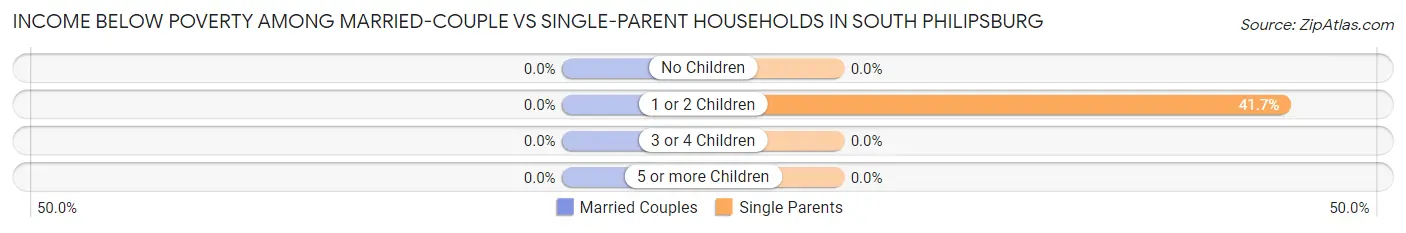
| Children | Married-Couple Families | Single-Parent Households |
| No Children | 0 (0.0%) | 0 (0.0%) |
| 1 or 2 Children | 0 (0.0%) | 15 (41.7%) |
| 3 or 4 Children | 0 (0.0%) | 0 (0.0%) |
| 5 or more Children | 0 (0.0%) | 0 (0.0%) |
| Total | 0 (0.0%) | 15 (16.5%) |
Race in South Philipsburg
The most populous races in South Philipsburg are White / Caucasian (541 | 99.3%), and Native / Alaskan (4 | 0.7%).
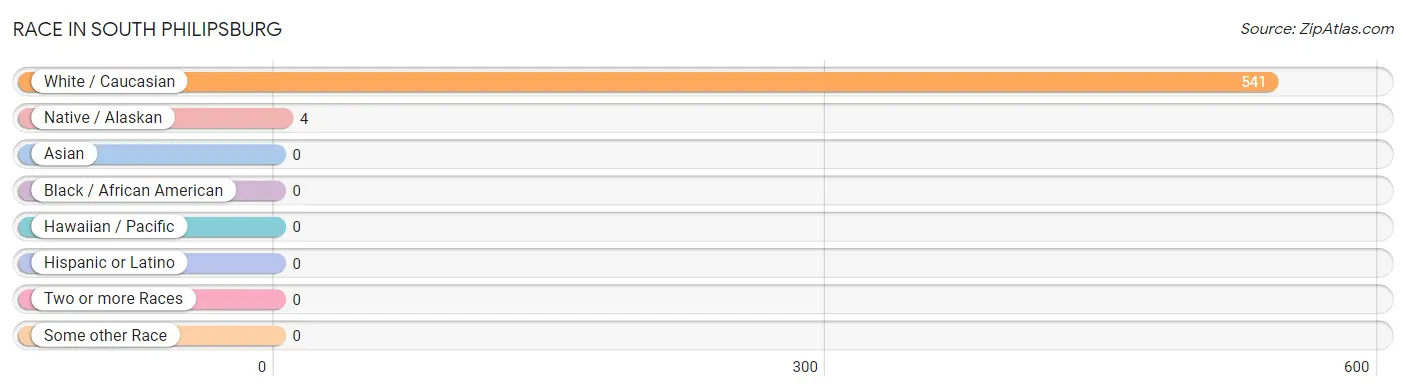
| Race | # Population | % Population |
| Asian | 0 | 0.0% |
| Black / African American | 0 | 0.0% |
| Hawaiian / Pacific | 0 | 0.0% |
| Hispanic or Latino | 0 | 0.0% |
| Native / Alaskan | 4 | 0.7% |
| White / Caucasian | 541 | 99.3% |
| Two or more Races | 0 | 0.0% |
| Some other Race | 0 | 0.0% |
| Total | 545 | 100.0% |
Ancestry in South Philipsburg
The most populous ancestries reported in South Philipsburg are English (104 | 19.1%), American (100 | 18.3%), German (66 | 12.1%), Austrian (45 | 8.3%), and Ukrainian (32 | 5.9%), together accounting for 63.7% of all South Philipsburg residents.
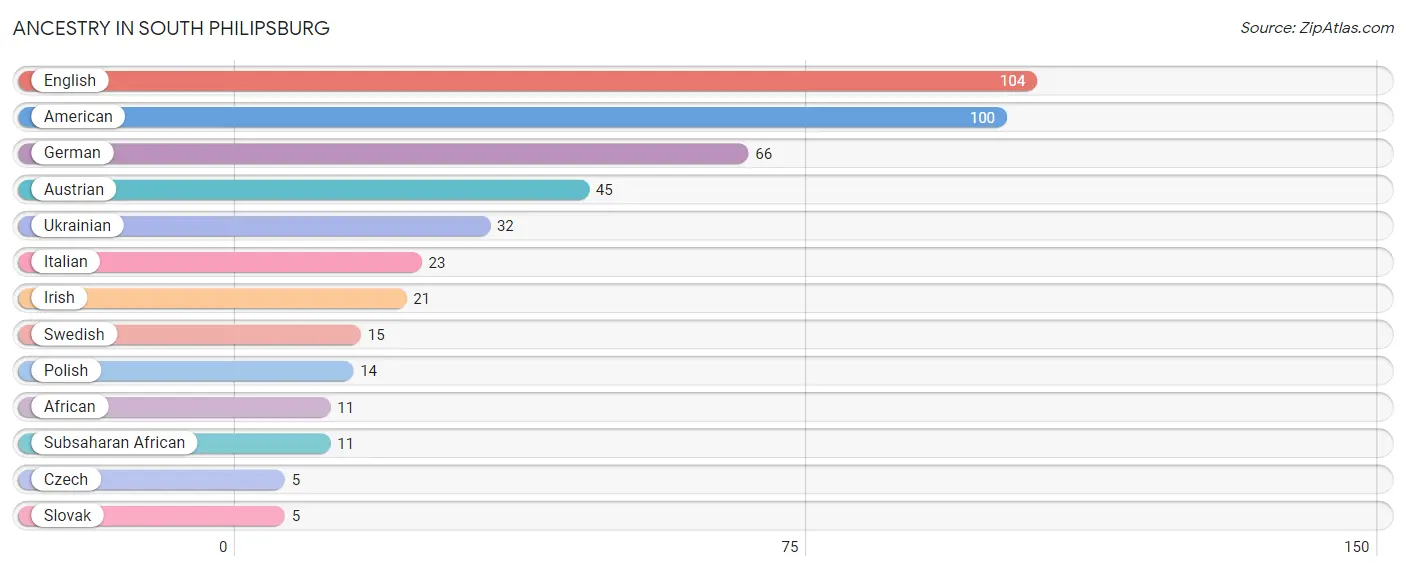
| Ancestry | # Population | % Population |
| African | 11 | 2.0% |
| American | 100 | 18.3% |
| Austrian | 45 | 8.3% |
| Czech | 5 | 0.9% |
| English | 104 | 19.1% |
| German | 66 | 12.1% |
| Irish | 21 | 3.8% |
| Italian | 23 | 4.2% |
| Polish | 14 | 2.6% |
| Slovak | 5 | 0.9% |
| Subsaharan African | 11 | 2.0% |
| Swedish | 15 | 2.8% |
| Ukrainian | 32 | 5.9% | View All 13 Rows |
Immigrants in South Philipsburg

| Immigration Origin | # Population | % Population | View All 0 Rows |
Sex and Age in South Philipsburg
Sex and Age in South Philipsburg
The most populous age groups in South Philipsburg are 40 to 44 Years (52 | 24.8%) for men and 30 to 34 Years (73 | 21.8%) for women.
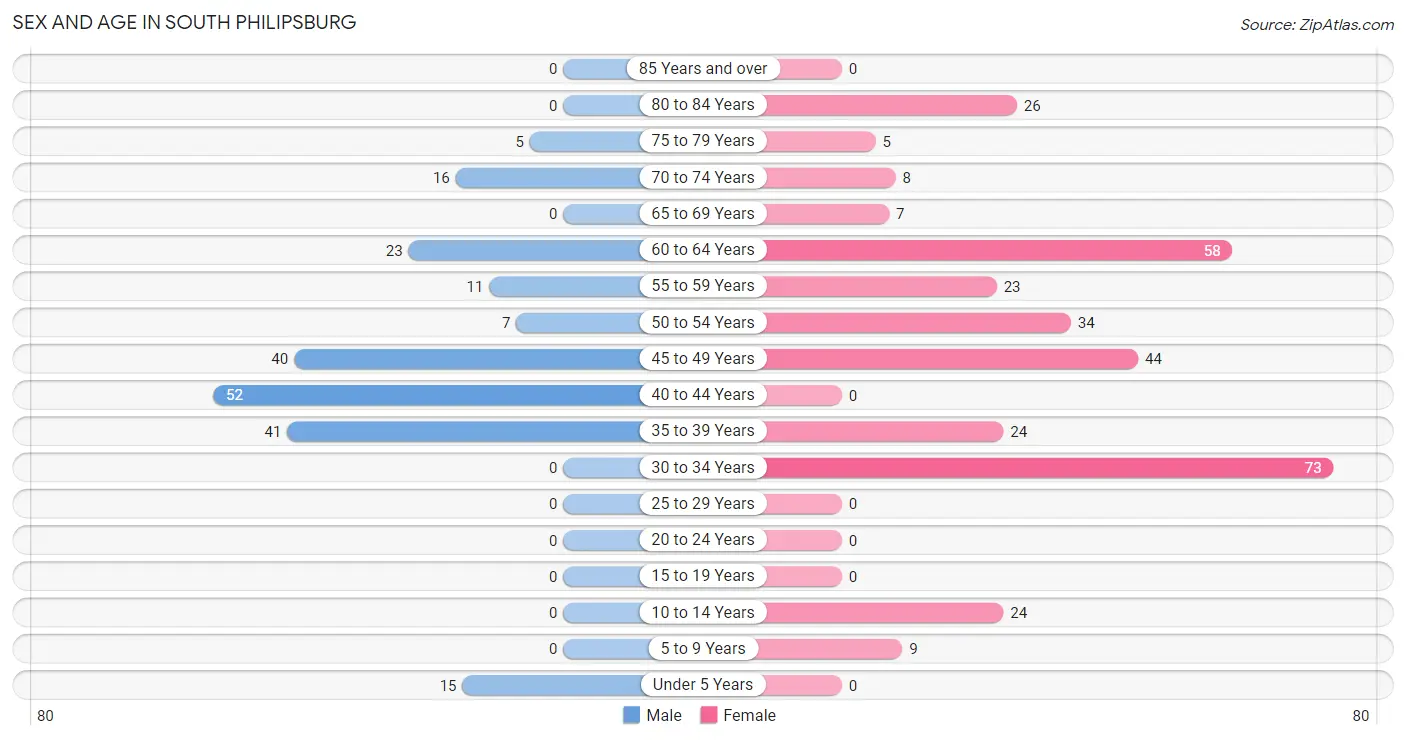
| Age Bracket | Male | Female |
| Under 5 Years | 15 (7.1%) | 0 (0.0%) |
| 5 to 9 Years | 0 (0.0%) | 9 (2.7%) |
| 10 to 14 Years | 0 (0.0%) | 24 (7.2%) |
| 15 to 19 Years | 0 (0.0%) | 0 (0.0%) |
| 20 to 24 Years | 0 (0.0%) | 0 (0.0%) |
| 25 to 29 Years | 0 (0.0%) | 0 (0.0%) |
| 30 to 34 Years | 0 (0.0%) | 73 (21.8%) |
| 35 to 39 Years | 41 (19.5%) | 24 (7.2%) |
| 40 to 44 Years | 52 (24.8%) | 0 (0.0%) |
| 45 to 49 Years | 40 (19.1%) | 44 (13.1%) |
| 50 to 54 Years | 7 (3.3%) | 34 (10.2%) |
| 55 to 59 Years | 11 (5.2%) | 23 (6.9%) |
| 60 to 64 Years | 23 (11.0%) | 58 (17.3%) |
| 65 to 69 Years | 0 (0.0%) | 7 (2.1%) |
| 70 to 74 Years | 16 (7.6%) | 8 (2.4%) |
| 75 to 79 Years | 5 (2.4%) | 5 (1.5%) |
| 80 to 84 Years | 0 (0.0%) | 26 (7.8%) |
| 85 Years and over | 0 (0.0%) | 0 (0.0%) |
| Total | 210 (100.0%) | 335 (100.0%) |
Families and Households in South Philipsburg
Median Family Size in South Philipsburg
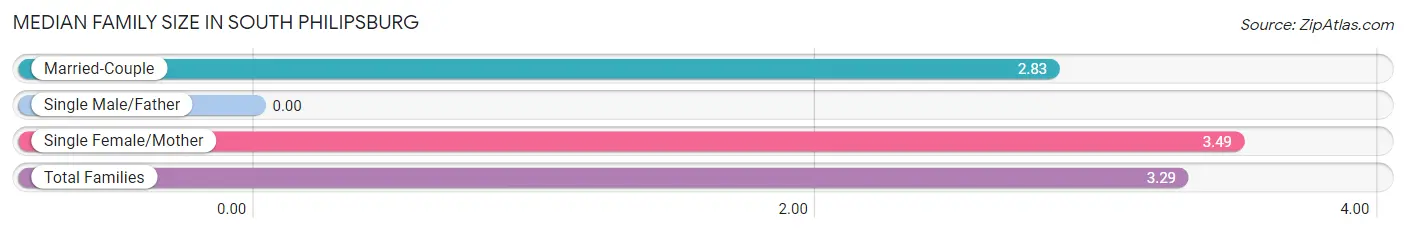
| Family Type | # Families | Family Size |
| Married-Couple | 41 (31.1%) | 2.83 |
| Single Male/Father | 0 (0.0%) | - |
| Single Female/Mother | 91 (68.9%) | 3.49 |
| Total Families | 132 (100.0%) | 3.29 |
Median Household Size in South Philipsburg
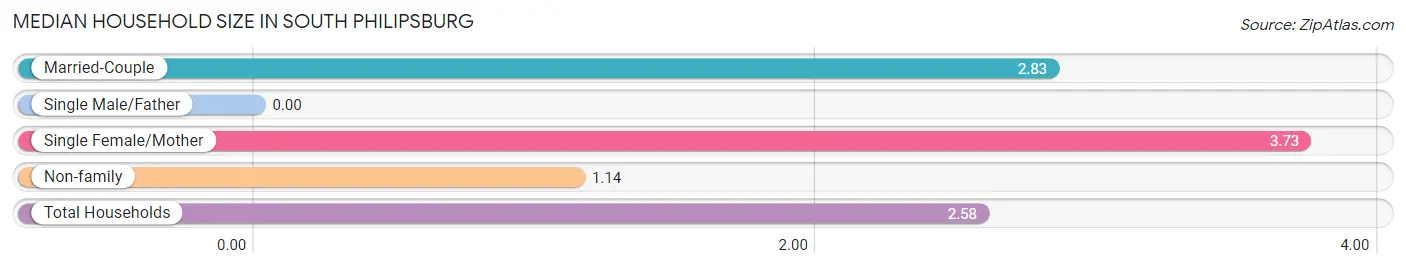
| Household Type | # Households | Household Size |
| Married-Couple | 41 (19.4%) | 2.83 |
| Single Male/Father | 0 (0.0%) | - |
| Single Female/Mother | 91 (43.1%) | 3.73 |
| Non-family | 79 (37.4%) | 1.14 |
| Total Households | 211 (100.0%) | 2.58 |
Household Size by Marriage Status in South Philipsburg
Out of a total of 211 households in South Philipsburg, 132 (62.6%) are family households, while 79 (37.4%) are nonfamily households. The most numerous type of family households are 3-person households, comprising 113, and the most common type of nonfamily households are 1-person households, comprising 65.
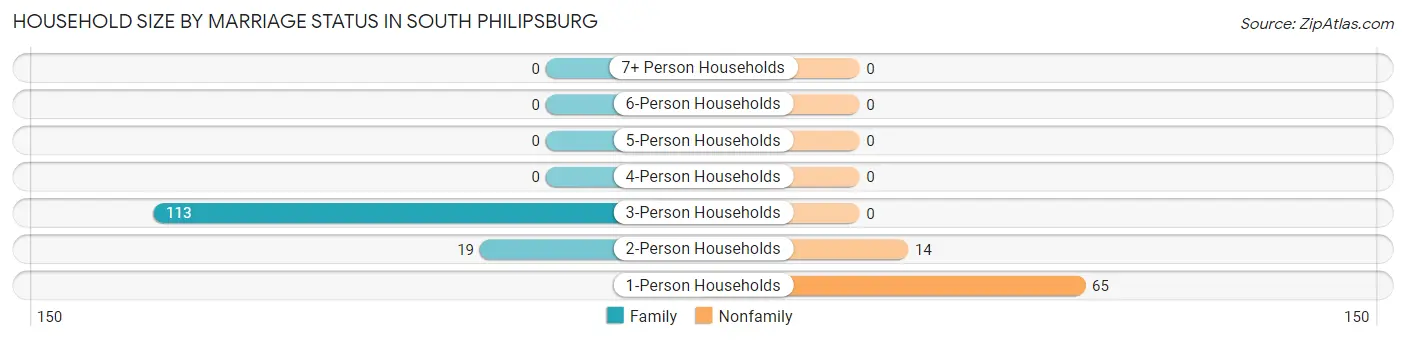
| Household Size | Family Households | Nonfamily Households |
| 1-Person Households | - | 65 (30.8%) |
| 2-Person Households | 19 (9.0%) | 14 (6.6%) |
| 3-Person Households | 113 (53.5%) | 0 (0.0%) |
| 4-Person Households | 0 (0.0%) | 0 (0.0%) |
| 5-Person Households | 0 (0.0%) | 0 (0.0%) |
| 6-Person Households | 0 (0.0%) | 0 (0.0%) |
| 7+ Person Households | 0 (0.0%) | 0 (0.0%) |
| Total | 132 (62.6%) | 79 (37.4%) |
Female Fertility in South Philipsburg
Fertility by Age in South Philipsburg
Average fertility rate in South Philipsburg is 461.0 births per 1,000 women. Women in the age bracket of 35 to 50 years have the highest fertility rate with 647.0 births per 1,000 women. Women in the age bracket of 35 to 50 years acount for 67.7% of all women with births.
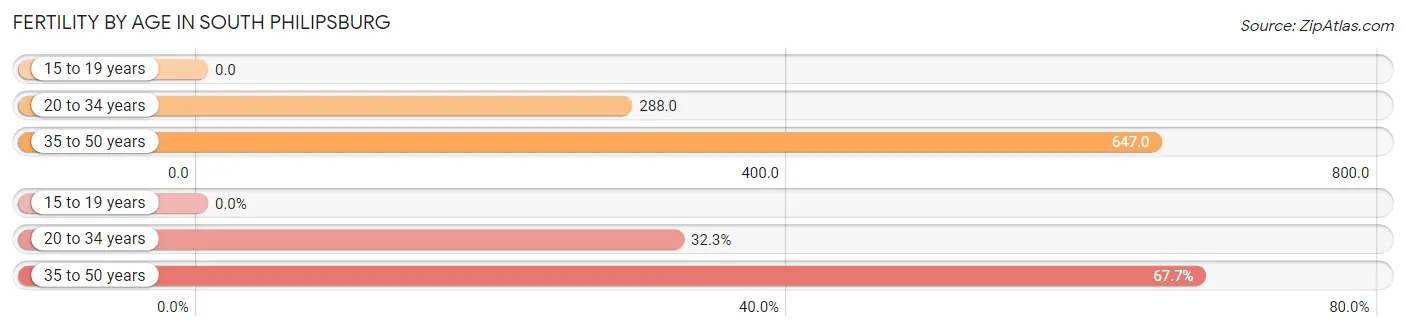
| Age Bracket | Women with Births | Births / 1,000 Women |
| 15 to 19 years | 0 (0.0%) | 0.0 |
| 20 to 34 years | 21 (32.3%) | 288.0 |
| 35 to 50 years | 44 (67.7%) | 647.0 |
| Total | 65 (100.0%) | 461.0 |
Fertility by Age by Marriage Status in South Philipsburg
67.7% of women with births (65) in South Philipsburg are married. The highest percentage of unmarried women with births falls into 20 to 34 years age bracket with 100.0% of them unmarried at the time of birth, while the lowest percentage of unmarried women with births belong to 35 to 50 years age bracket with 0.0% of them unmarried.
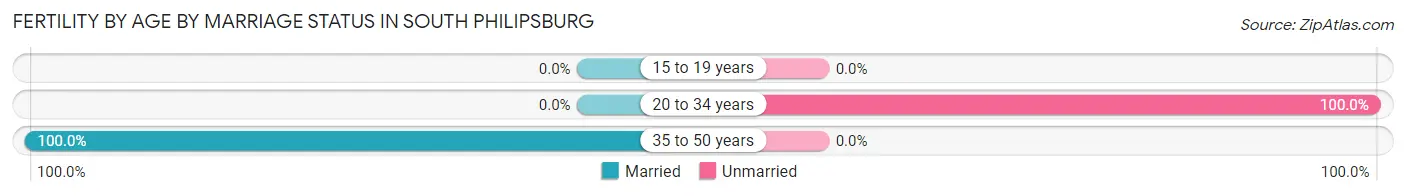
| Age Bracket | Married | Unmarried |
| 15 to 19 years | 0 (0.0%) | 0 (0.0%) |
| 20 to 34 years | 0 (0.0%) | 21 (100.0%) |
| 35 to 50 years | 44 (100.0%) | 0 (0.0%) |
| Total | 44 (67.7%) | 21 (32.3%) |
Fertility by Education in South Philipsburg
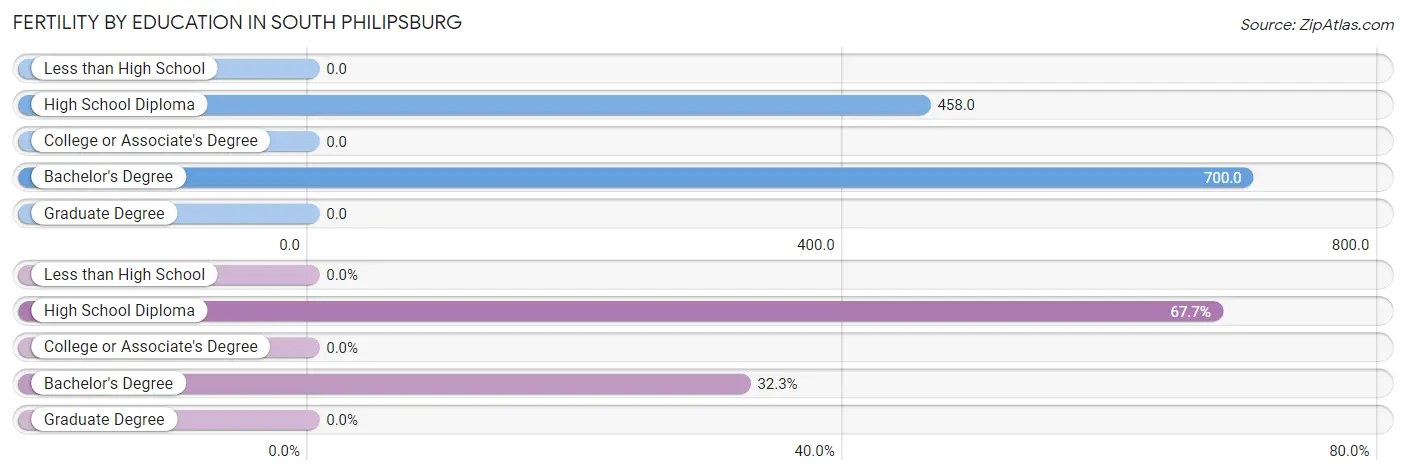
| Educational Attainment | Women with Births | Births / 1,000 Women |
| Less than High School | 0 (0.0%) | 0.0 |
| High School Diploma | 44 (67.7%) | 458.0 |
| College or Associate's Degree | 0 (0.0%) | 0.0 |
| Bachelor's Degree | 21 (32.3%) | 700.0 |
| Graduate Degree | 0 (0.0%) | 0.0 |
| Total | 65 (100.0%) | 461.0 |
Fertility by Education by Marriage Status in South Philipsburg
32.3% of women with births in South Philipsburg are unmarried. Women with the educational attainment of high school diploma are most likely to be married with 100.0% of them married at childbirth, while women with the educational attainment of bachelor's degree are least likely to be married with 100.0% of them unmarried at childbirth.
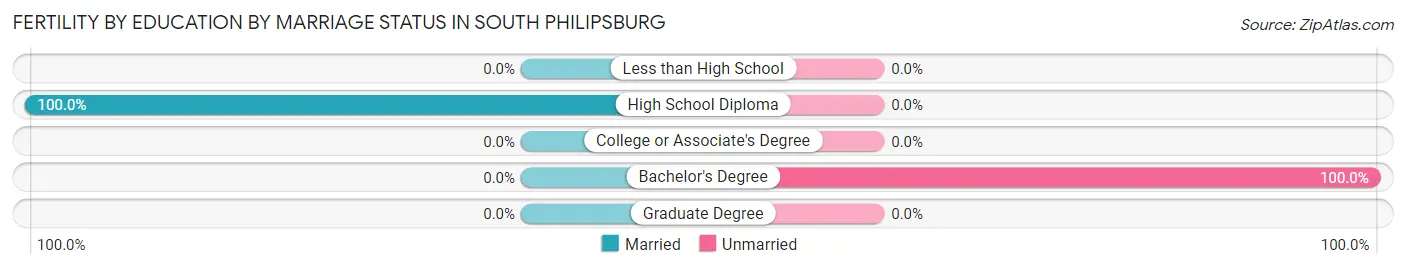
| Educational Attainment | Married | Unmarried |
| Less than High School | 0 (0.0%) | 0 (0.0%) |
| High School Diploma | 44 (100.0%) | 0 (0.0%) |
| College or Associate's Degree | 0 (0.0%) | 0 (0.0%) |
| Bachelor's Degree | 0 (0.0%) | 21 (100.0%) |
| Graduate Degree | 0 (0.0%) | 0 (0.0%) |
| Total | 44 (67.7%) | 21 (32.3%) |
Employment Characteristics in South Philipsburg
Employment by Class of Employer in South Philipsburg
Among the 162 employed individuals in South Philipsburg, private company employees (110 | 67.9%), not-for-profit organizations (34 | 21.0%), and state government employees (18 | 11.1%) make up the most common classes of employment.
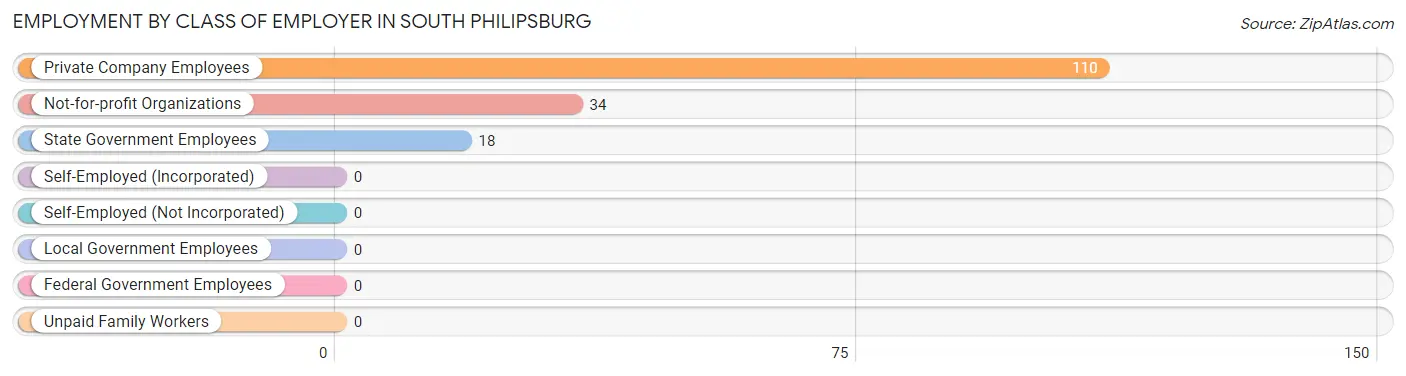
| Employer Class | # Employees | % Employees |
| Private Company Employees | 110 | 67.9% |
| Self-Employed (Incorporated) | 0 | 0.0% |
| Self-Employed (Not Incorporated) | 0 | 0.0% |
| Not-for-profit Organizations | 34 | 21.0% |
| Local Government Employees | 0 | 0.0% |
| State Government Employees | 18 | 11.1% |
| Federal Government Employees | 0 | 0.0% |
| Unpaid Family Workers | 0 | 0.0% |
| Total | 162 | 100.0% |
Employment Status by Age in South Philipsburg
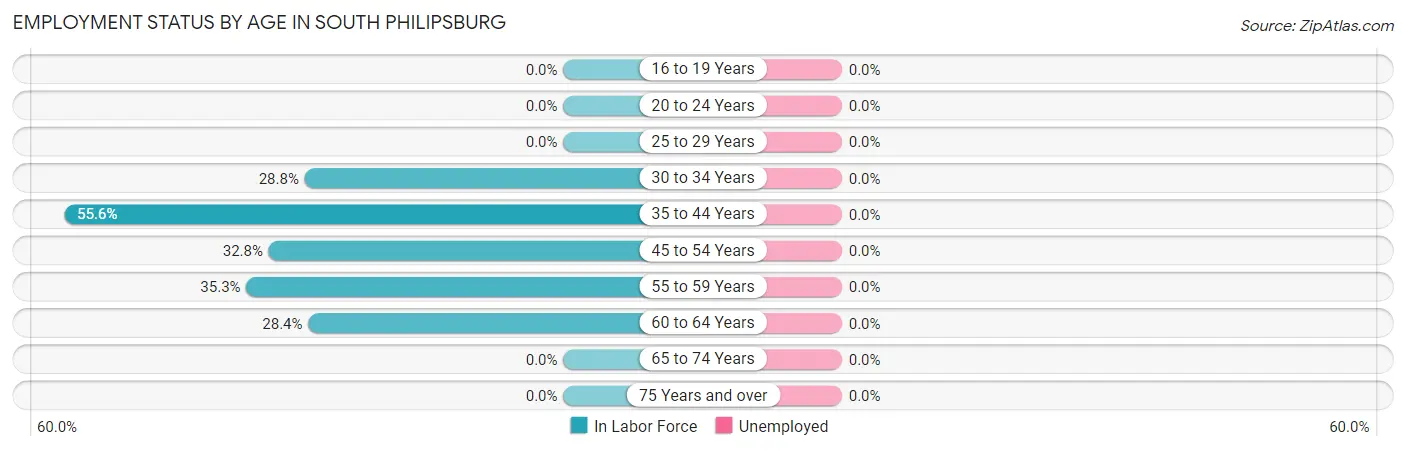
| Age Bracket | In Labor Force | Unemployed |
| 16 to 19 Years | 0 (0.0%) | 0 (0.0%) |
| 20 to 24 Years | 0 (0.0%) | 0 (0.0%) |
| 25 to 29 Years | 0 (0.0%) | 0 (0.0%) |
| 30 to 34 Years | 21 (28.8%) | 0 (0.0%) |
| 35 to 44 Years | 65 (55.6%) | 0 (0.0%) |
| 45 to 54 Years | 41 (32.8%) | 0 (0.0%) |
| 55 to 59 Years | 12 (35.3%) | 0 (0.0%) |
| 60 to 64 Years | 23 (28.4%) | 0 (0.0%) |
| 65 to 74 Years | 0 (0.0%) | 0 (0.0%) |
| 75 Years and over | 0 (0.0%) | 0 (0.0%) |
| Total | 162 (32.6%) | 0 (0.0%) |
Employment Status by Educational Attainment in South Philipsburg
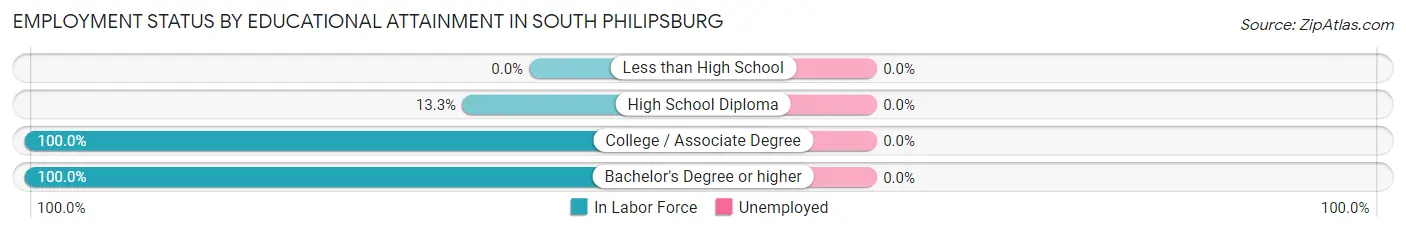
| Educational Attainment | In Labor Force | Unemployed |
| Less than High School | 0 (0.0%) | 0 (0.0%) |
| High School Diploma | 35 (13.3%) | 0 (0.0%) |
| College / Associate Degree | 56 (100.0%) | 0 (0.0%) |
| Bachelor's Degree or higher | 71 (100.0%) | 0 (0.0%) |
| Total | 162 (37.7%) | 0 (0.0%) |
Employment Occupations by Sex in South Philipsburg
Management, Business, Science and Arts Occupations
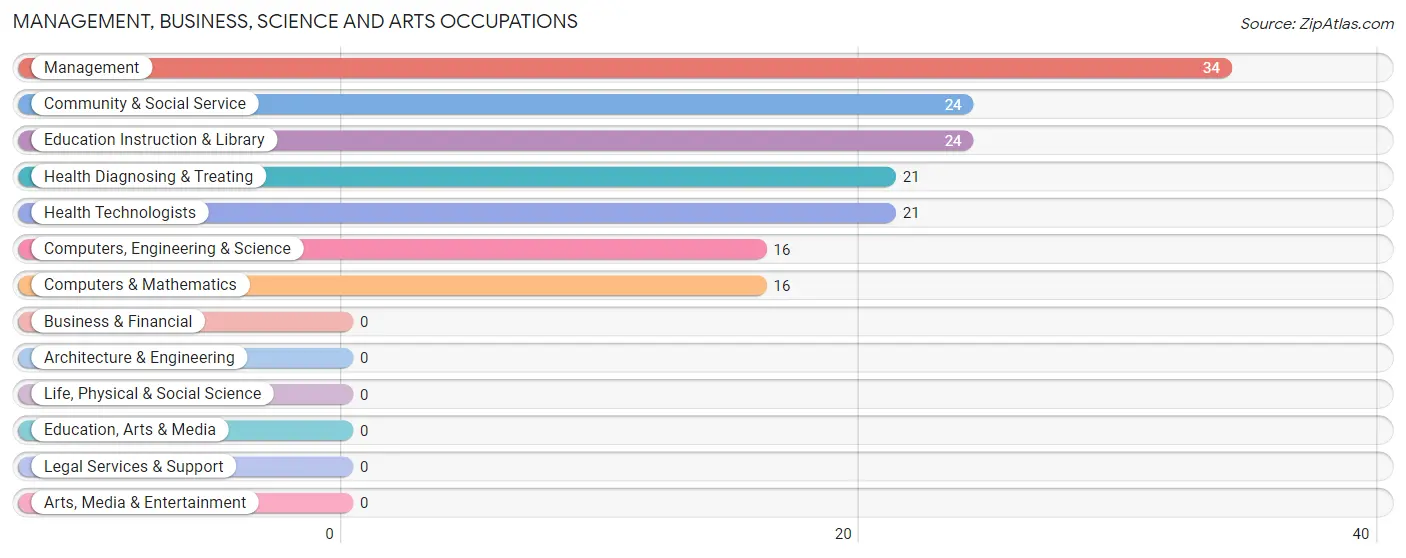
The most common Management, Business, Science and Arts occupations in South Philipsburg are Management (34 | 21.0%), Community & Social Service (24 | 14.8%), Education Instruction & Library (24 | 14.8%), Health Diagnosing & Treating (21 | 13.0%), and Health Technologists (21 | 13.0%).
Management, Business, Science and Arts Occupations by Sex
Within the Management, Business, Science and Arts occupations in South Philipsburg, the most male-oriented occupations are Computers, Engineering & Science (100.0%), and Computers & Mathematics (100.0%), while the most female-oriented occupations are Management (100.0%), Community & Social Service (100.0%), and Education Instruction & Library (100.0%).
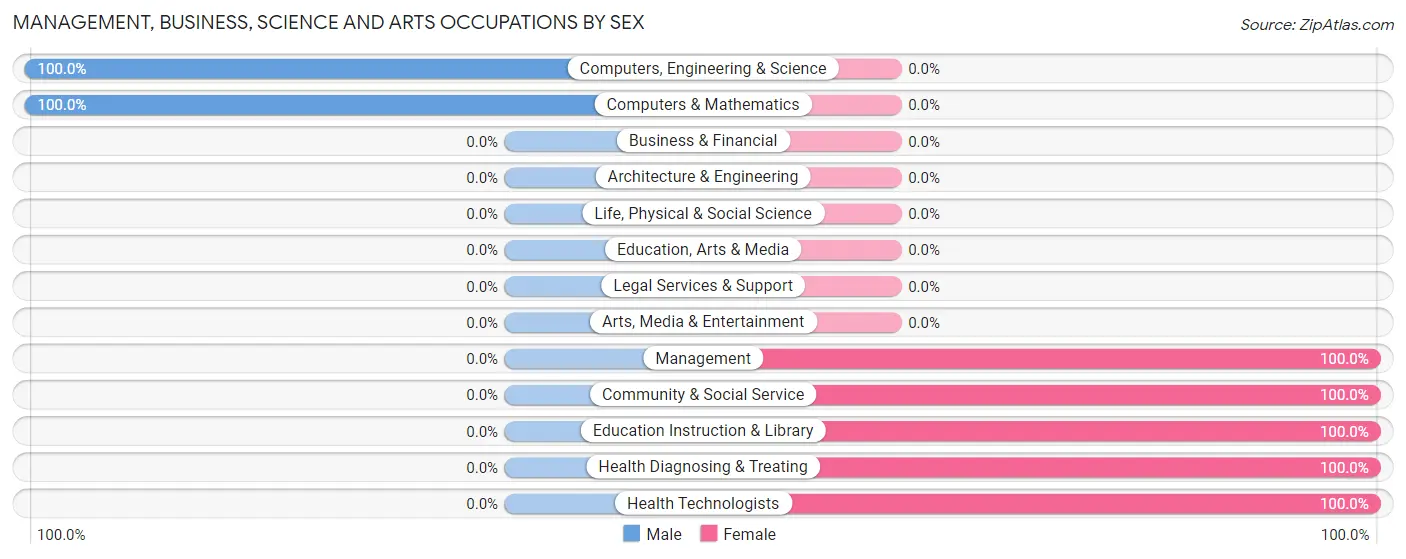
| Occupation | Male | Female |
| Management | 0 (0.0%) | 34 (100.0%) |
| Business & Financial | 0 (0.0%) | 0 (0.0%) |
| Computers, Engineering & Science | 16 (100.0%) | 0 (0.0%) |
| Computers & Mathematics | 16 (100.0%) | 0 (0.0%) |
| Architecture & Engineering | 0 (0.0%) | 0 (0.0%) |
| Life, Physical & Social Science | 0 (0.0%) | 0 (0.0%) |
| Community & Social Service | 0 (0.0%) | 24 (100.0%) |
| Education, Arts & Media | 0 (0.0%) | 0 (0.0%) |
| Legal Services & Support | 0 (0.0%) | 0 (0.0%) |
| Education Instruction & Library | 0 (0.0%) | 24 (100.0%) |
| Arts, Media & Entertainment | 0 (0.0%) | 0 (0.0%) |
| Health Diagnosing & Treating | 0 (0.0%) | 21 (100.0%) |
| Health Technologists | 0 (0.0%) | 21 (100.0%) |
| Total (Category) | 16 (16.8%) | 79 (83.2%) |
| Total (Overall) | 71 (43.8%) | 91 (56.2%) |
Services Occupations
The most common Services occupations in South Philipsburg are , and Healthcare Support (13 | 8.0%).
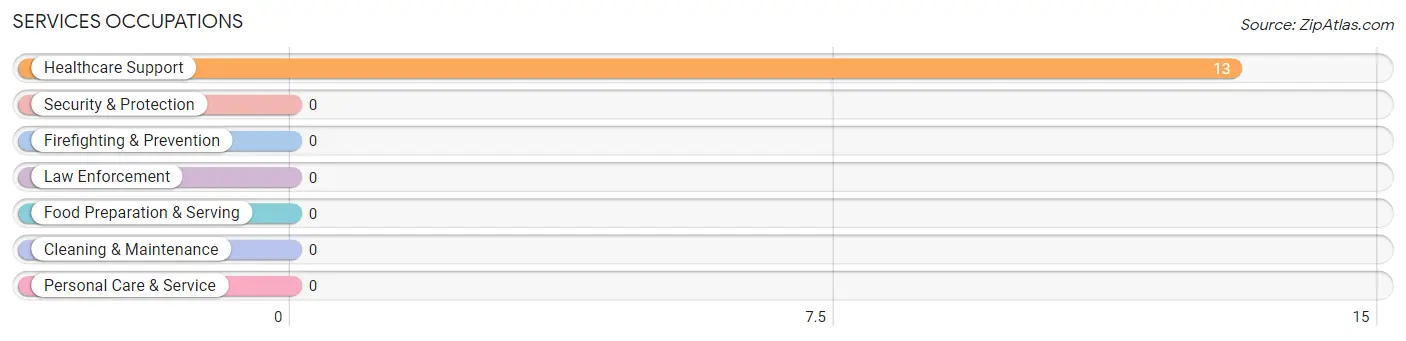
Services Occupations by Sex
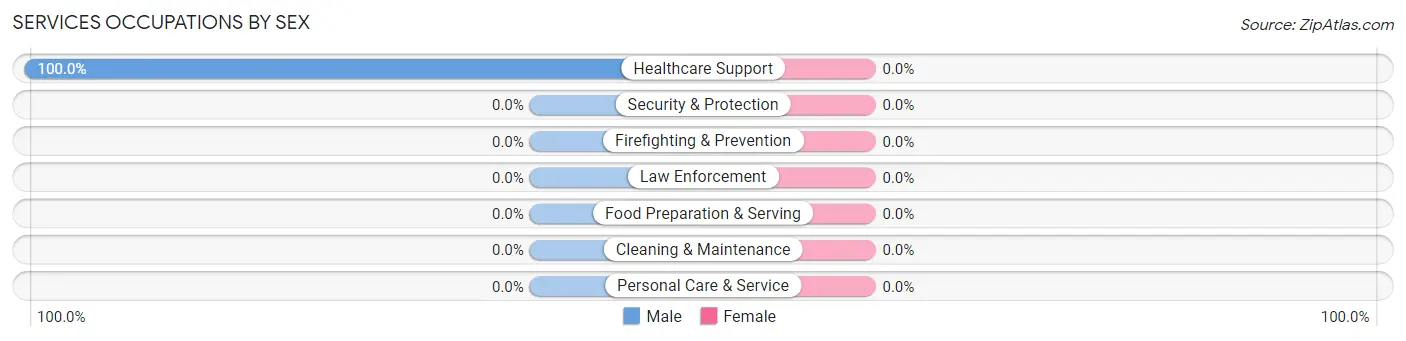
| Occupation | Male | Female |
| Healthcare Support | 13 (100.0%) | 0 (0.0%) |
| Security & Protection | 0 (0.0%) | 0 (0.0%) |
| Firefighting & Prevention | 0 (0.0%) | 0 (0.0%) |
| Law Enforcement | 0 (0.0%) | 0 (0.0%) |
| Food Preparation & Serving | 0 (0.0%) | 0 (0.0%) |
| Cleaning & Maintenance | 0 (0.0%) | 0 (0.0%) |
| Personal Care & Service | 0 (0.0%) | 0 (0.0%) |
| Total (Category) | 13 (100.0%) | 0 (0.0%) |
| Total (Overall) | 71 (43.8%) | 91 (56.2%) |
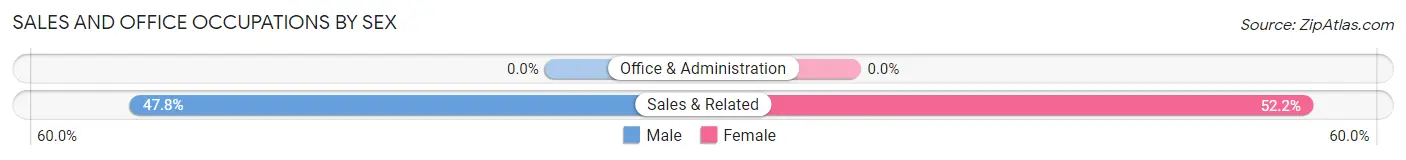
Sales and Office Occupations
The most common Sales and Office occupations in South Philipsburg are , and Sales & Related (23 | 14.2%).
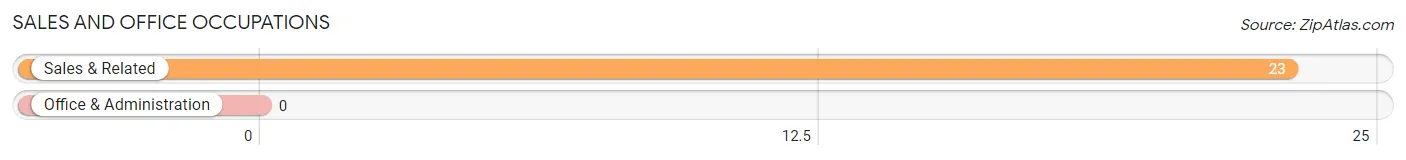
Sales and Office Occupations by Sex
| Occupation | Male | Female |
| Sales & Related | 11 (47.8%) | 12 (52.2%) |
| Office & Administration | 0 (0.0%) | 0 (0.0%) |
| Total (Category) | 11 (47.8%) | 12 (52.2%) |
| Total (Overall) | 71 (43.8%) | 91 (56.2%) |
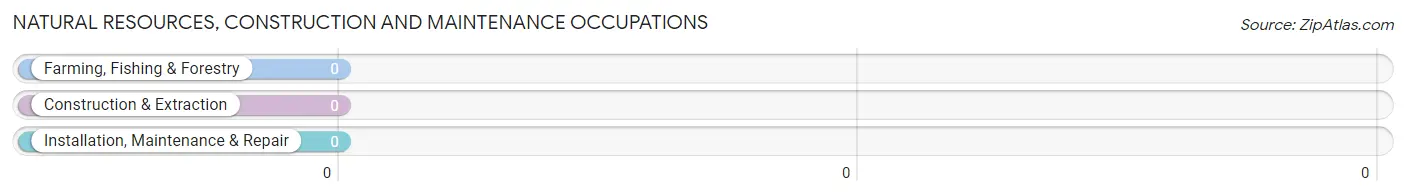
Natural Resources, Construction and Maintenance Occupations
Natural Resources, Construction and Maintenance Occupations by Sex
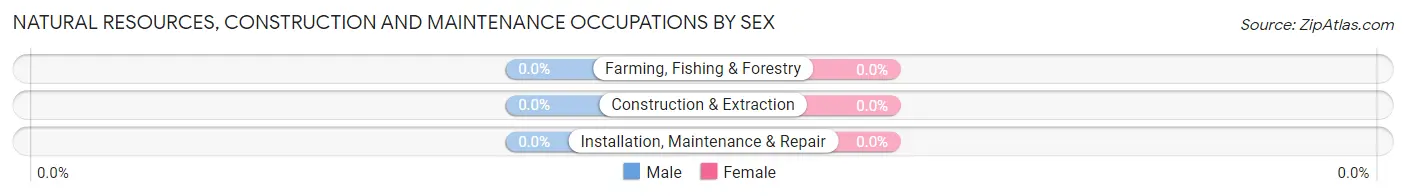
| Occupation | Male | Female |
| Farming, Fishing & Forestry | 0 (0.0%) | 0 (0.0%) |
| Construction & Extraction | 0 (0.0%) | 0 (0.0%) |
| Installation, Maintenance & Repair | 0 (0.0%) | 0 (0.0%) |
| Total (Category) | 0 (0.0%) | 0 (0.0%) |
| Total (Overall) | 71 (43.8%) | 91 (56.2%) |
Production, Transportation and Moving Occupations
The most common Production, Transportation and Moving occupations in South Philipsburg are Transportation (21 | 13.0%), and Material Moving (10 | 6.2%).
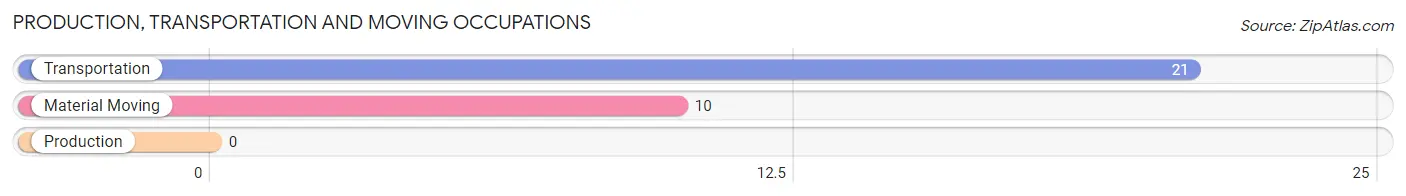
Production, Transportation and Moving Occupations by Sex
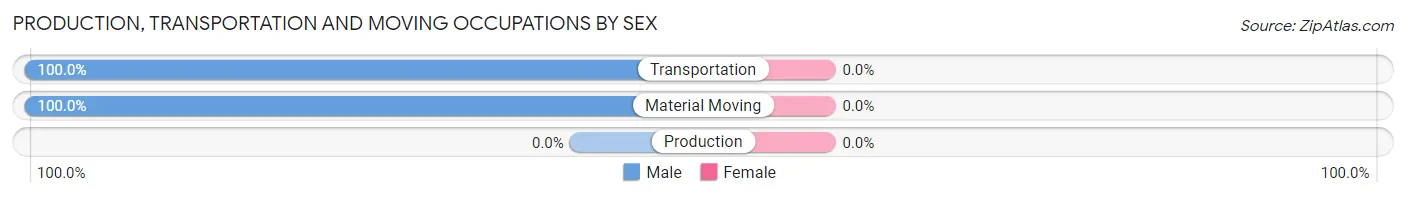
| Occupation | Male | Female |
| Production | 0 (0.0%) | 0 (0.0%) |
| Transportation | 21 (100.0%) | 0 (0.0%) |
| Material Moving | 10 (100.0%) | 0 (0.0%) |
| Total (Category) | 31 (100.0%) | 0 (0.0%) |
| Total (Overall) | 71 (43.8%) | 91 (56.2%) |
Employment Industries by Sex in South Philipsburg
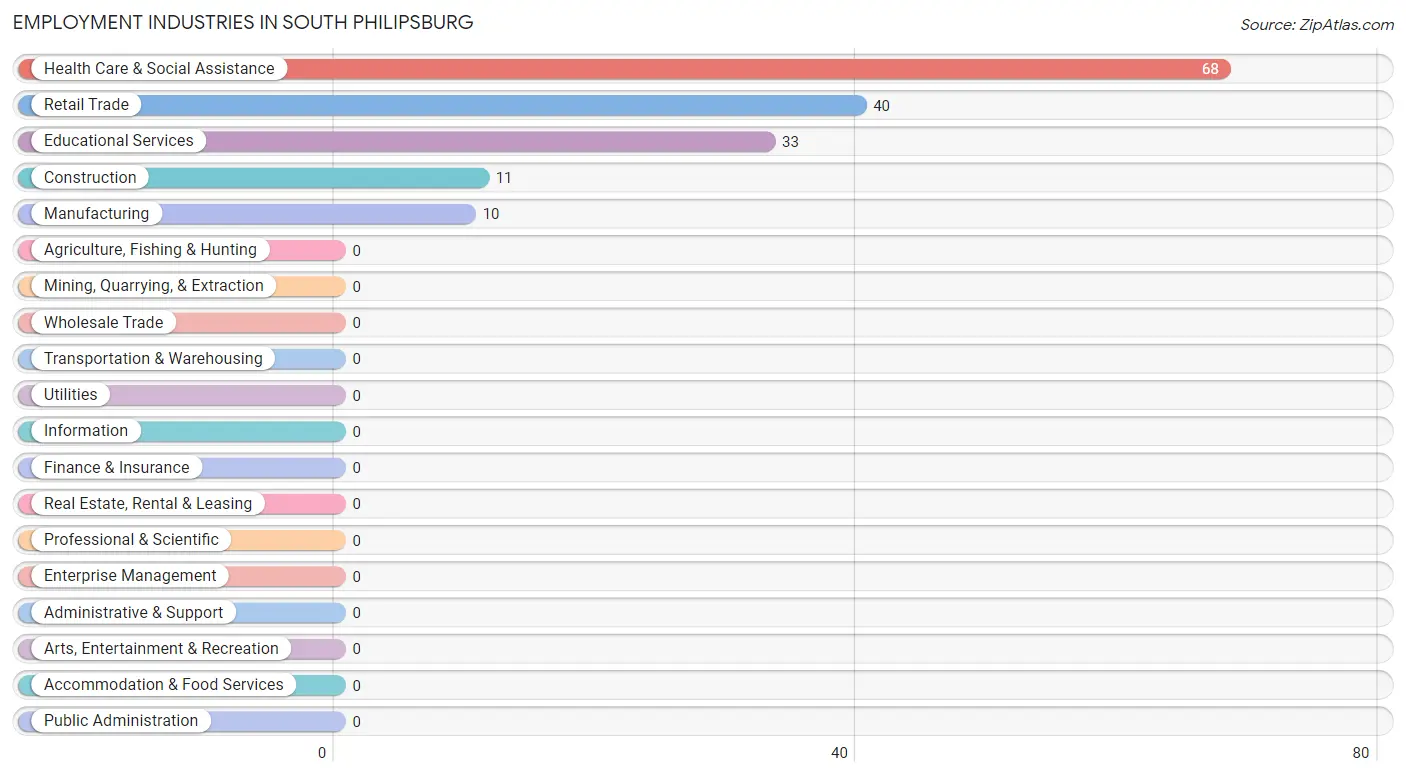
Employment Industries in South Philipsburg
The major employment industries in South Philipsburg include Health Care & Social Assistance (68 | 42.0%), Retail Trade (40 | 24.7%), Educational Services (33 | 20.4%), Construction (11 | 6.8%), and Manufacturing (10 | 6.2%).
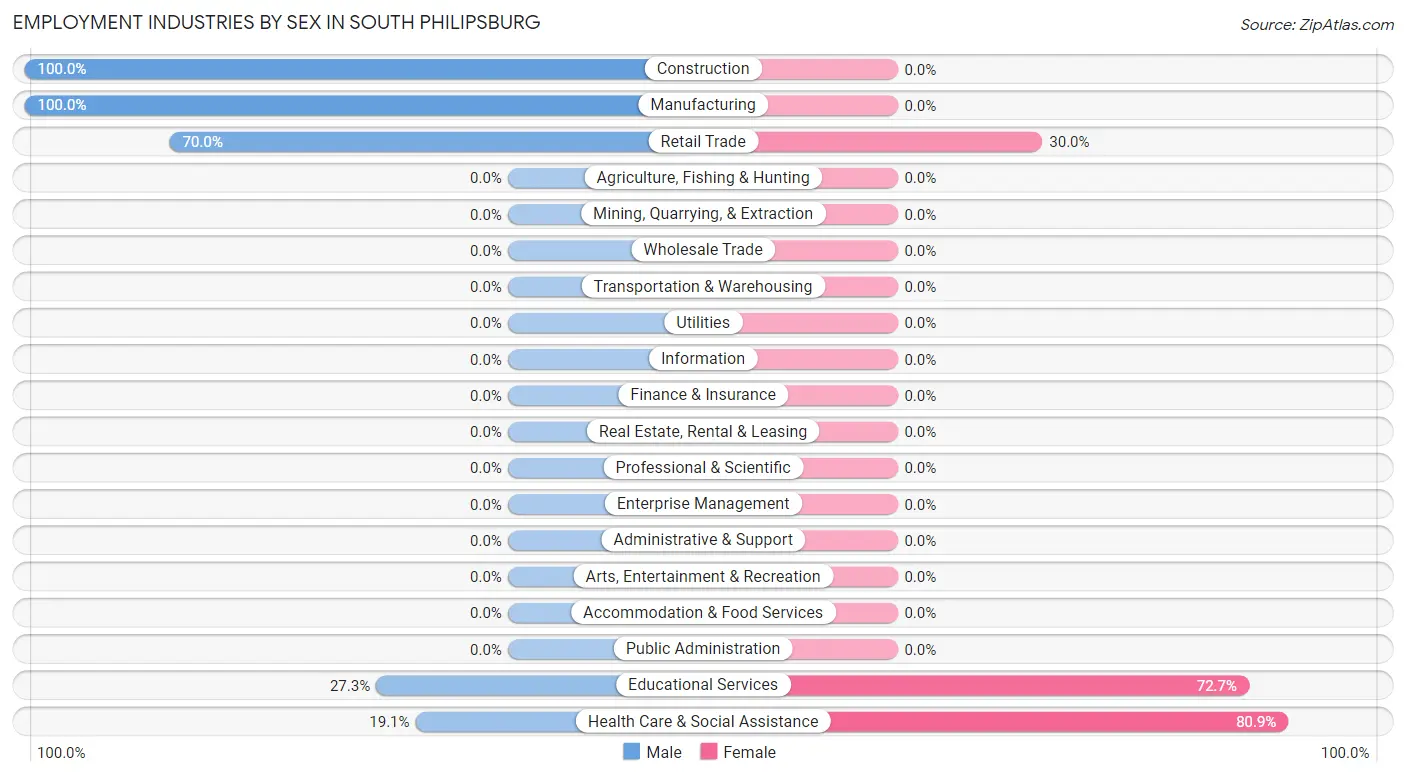
Employment Industries by Sex in South Philipsburg
The South Philipsburg industries that see more men than women are Construction (100.0%), Manufacturing (100.0%), and Retail Trade (70.0%), whereas the industries that tend to have a higher number of women are Health Care & Social Assistance (80.9%), Educational Services (72.7%), and Retail Trade (30.0%).
| Industry | Male | Female |
| Agriculture, Fishing & Hunting | 0 (0.0%) | 0 (0.0%) |
| Mining, Quarrying, & Extraction | 0 (0.0%) | 0 (0.0%) |
| Construction | 11 (100.0%) | 0 (0.0%) |
| Manufacturing | 10 (100.0%) | 0 (0.0%) |
| Wholesale Trade | 0 (0.0%) | 0 (0.0%) |
| Retail Trade | 28 (70.0%) | 12 (30.0%) |
| Transportation & Warehousing | 0 (0.0%) | 0 (0.0%) |
| Utilities | 0 (0.0%) | 0 (0.0%) |
| Information | 0 (0.0%) | 0 (0.0%) |
| Finance & Insurance | 0 (0.0%) | 0 (0.0%) |
| Real Estate, Rental & Leasing | 0 (0.0%) | 0 (0.0%) |
| Professional & Scientific | 0 (0.0%) | 0 (0.0%) |
| Enterprise Management | 0 (0.0%) | 0 (0.0%) |
| Administrative & Support | 0 (0.0%) | 0 (0.0%) |
| Educational Services | 9 (27.3%) | 24 (72.7%) |
| Health Care & Social Assistance | 13 (19.1%) | 55 (80.9%) |
| Arts, Entertainment & Recreation | 0 (0.0%) | 0 (0.0%) |
| Accommodation & Food Services | 0 (0.0%) | 0 (0.0%) |
| Public Administration | 0 (0.0%) | 0 (0.0%) |
| Total | 71 (43.8%) | 91 (56.2%) |
Education in South Philipsburg
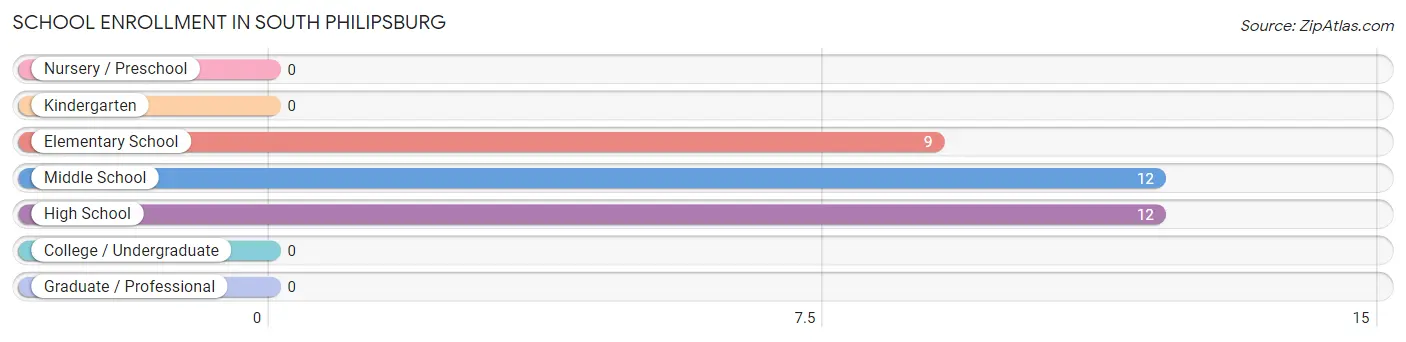
School Enrollment in South Philipsburg
The most common levels of schooling among the 33 students in South Philipsburg are middle school (12 | 36.4%), high school (12 | 36.4%), and elementary school (9 | 27.3%).
| School Level | # Students | % Students |
| Nursery / Preschool | 0 | 0.0% |
| Kindergarten | 0 | 0.0% |
| Elementary School | 9 | 27.3% |
| Middle School | 12 | 36.4% |
| High School | 12 | 36.4% |
| College / Undergraduate | 0 | 0.0% |
| Graduate / Professional | 0 | 0.0% |
| Total | 33 | 100.0% |
School Enrollment by Age by Funding Source in South Philipsburg
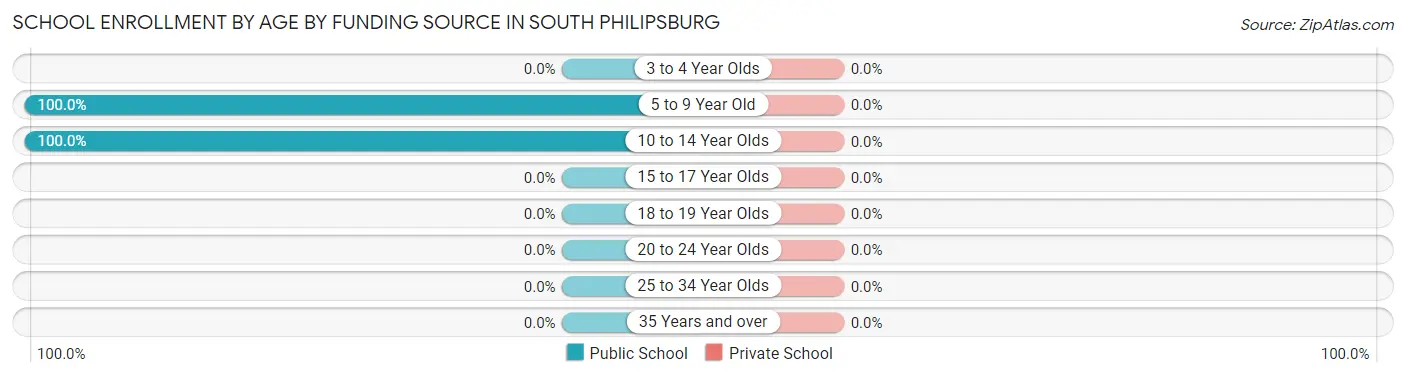
| Age Bracket | Public School | Private School |
| 3 to 4 Year Olds | 0 (0.0%) | 0 (0.0%) |
| 5 to 9 Year Old | 9 (100.0%) | 0 (0.0%) |
| 10 to 14 Year Olds | 24 (100.0%) | 0 (0.0%) |
| 15 to 17 Year Olds | 0 (0.0%) | 0 (0.0%) |
| 18 to 19 Year Olds | 0 (0.0%) | 0 (0.0%) |
| 20 to 24 Year Olds | 0 (0.0%) | 0 (0.0%) |
| 25 to 34 Year Olds | 0 (0.0%) | 0 (0.0%) |
| 35 Years and over | 0 (0.0%) | 0 (0.0%) |
| Total | 33 (100.0%) | 0 (0.0%) |
Educational Attainment by Field of Study in South Philipsburg
Science & technology (55 | 77.5%), visual & performing arts (9 | 12.7%), and business (7 | 9.9%) are the most common fields of study among 71 individuals in South Philipsburg who have obtained a bachelor's degree or higher.
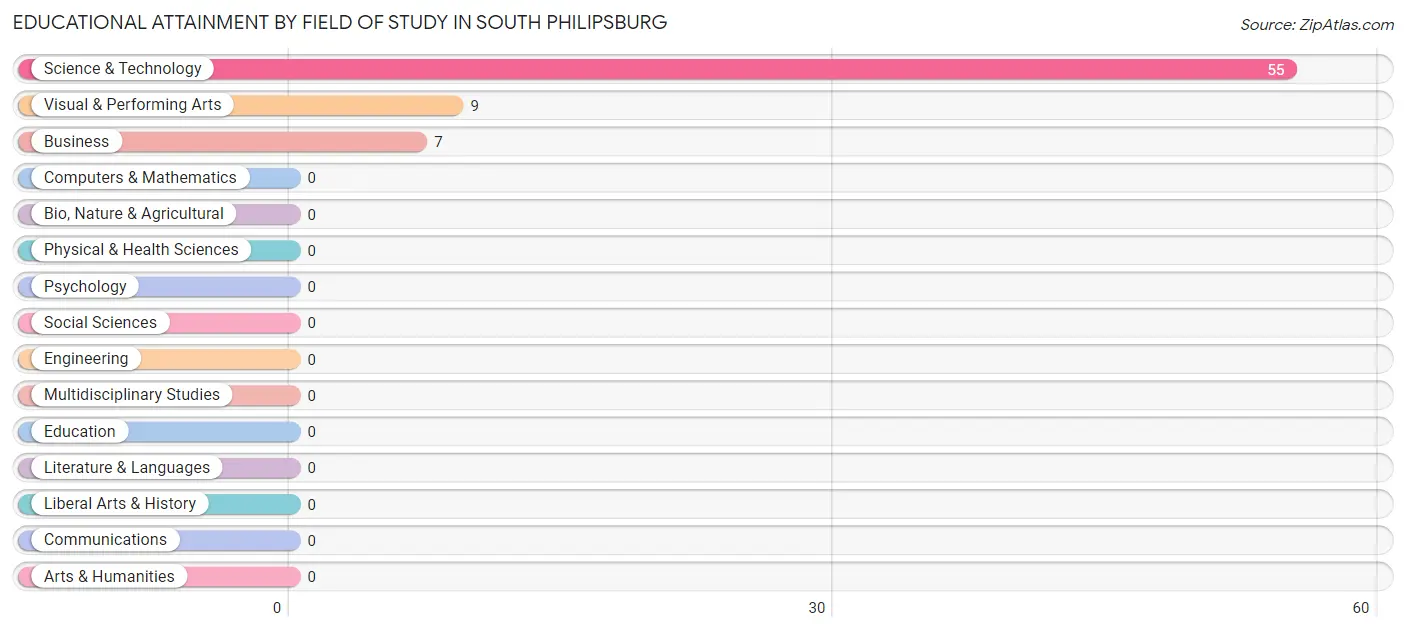
| Field of Study | # Graduates | % Graduates |
| Computers & Mathematics | 0 | 0.0% |
| Bio, Nature & Agricultural | 0 | 0.0% |
| Physical & Health Sciences | 0 | 0.0% |
| Psychology | 0 | 0.0% |
| Social Sciences | 0 | 0.0% |
| Engineering | 0 | 0.0% |
| Multidisciplinary Studies | 0 | 0.0% |
| Science & Technology | 55 | 77.5% |
| Business | 7 | 9.9% |
| Education | 0 | 0.0% |
| Literature & Languages | 0 | 0.0% |
| Liberal Arts & History | 0 | 0.0% |
| Visual & Performing Arts | 9 | 12.7% |
| Communications | 0 | 0.0% |
| Arts & Humanities | 0 | 0.0% |
| Total | 71 | 100.0% |
Transportation & Commute in South Philipsburg
Vehicle Availability by Sex in South Philipsburg
The most prevalent vehicle ownership categories in South Philipsburg are males with 2 vehicles (24, accounting for 33.8%) and females with 2 vehicles (21, making up 26.4%).
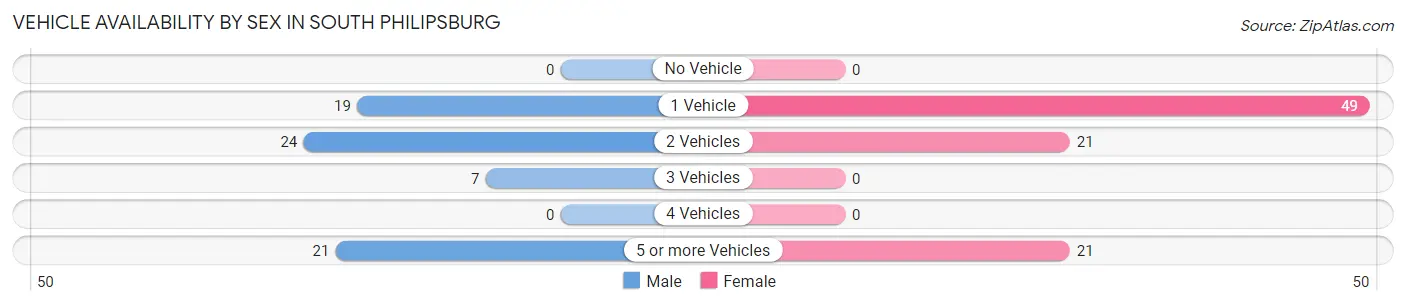
| Vehicles Available | Male | Female |
| No Vehicle | 0 (0.0%) | 0 (0.0%) |
| 1 Vehicle | 19 (26.8%) | 49 (53.8%) |
| 2 Vehicles | 24 (33.8%) | 21 (23.1%) |
| 3 Vehicles | 7 (9.9%) | 0 (0.0%) |
| 4 Vehicles | 0 (0.0%) | 0 (0.0%) |
| 5 or more Vehicles | 21 (29.6%) | 21 (23.1%) |
| Total | 71 (100.0%) | 91 (100.0%) |
Commute Time in South Philipsburg
The most frequently occuring commute durations in South Philipsburg are 30 to 34 minutes (77 commuters, 51.7%), 5 to 9 minutes (34 commuters, 22.8%), and 10 to 14 minutes (21 commuters, 14.1%).
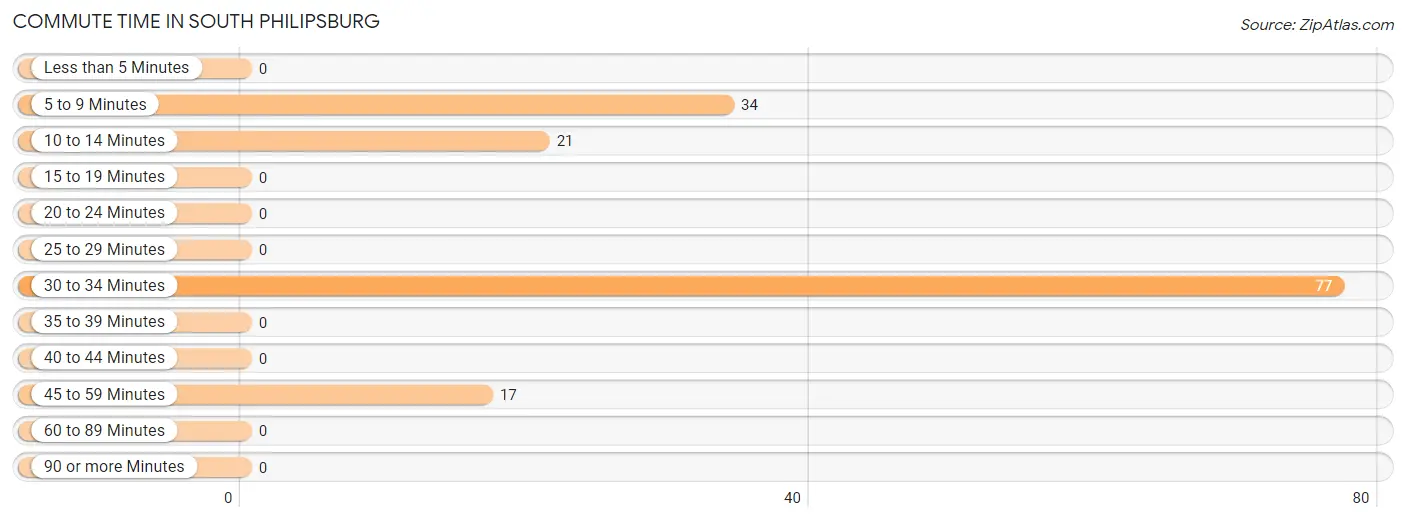
| Commute Time | # Commuters | % Commuters |
| Less than 5 Minutes | 0 | 0.0% |
| 5 to 9 Minutes | 34 | 22.8% |
| 10 to 14 Minutes | 21 | 14.1% |
| 15 to 19 Minutes | 0 | 0.0% |
| 20 to 24 Minutes | 0 | 0.0% |
| 25 to 29 Minutes | 0 | 0.0% |
| 30 to 34 Minutes | 77 | 51.7% |
| 35 to 39 Minutes | 0 | 0.0% |
| 40 to 44 Minutes | 0 | 0.0% |
| 45 to 59 Minutes | 17 | 11.4% |
| 60 to 89 Minutes | 0 | 0.0% |
| 90 or more Minutes | 0 | 0.0% |
Commute Time by Sex in South Philipsburg
The most common commute times in South Philipsburg are 30 to 34 minutes (41 commuters, 70.7%) for males and 30 to 34 minutes (36 commuters, 39.6%) for females.
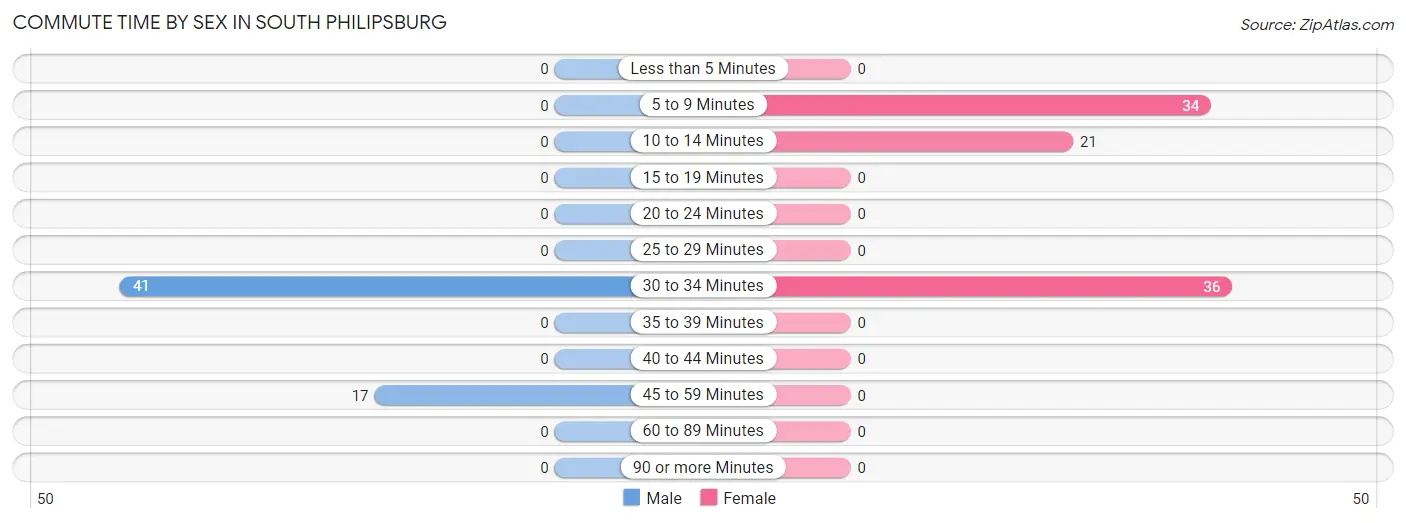
| Commute Time | Male | Female |
| Less than 5 Minutes | 0 (0.0%) | 0 (0.0%) |
| 5 to 9 Minutes | 0 (0.0%) | 34 (37.4%) |
| 10 to 14 Minutes | 0 (0.0%) | 21 (23.1%) |
| 15 to 19 Minutes | 0 (0.0%) | 0 (0.0%) |
| 20 to 24 Minutes | 0 (0.0%) | 0 (0.0%) |
| 25 to 29 Minutes | 0 (0.0%) | 0 (0.0%) |
| 30 to 34 Minutes | 41 (70.7%) | 36 (39.6%) |
| 35 to 39 Minutes | 0 (0.0%) | 0 (0.0%) |
| 40 to 44 Minutes | 0 (0.0%) | 0 (0.0%) |
| 45 to 59 Minutes | 17 (29.3%) | 0 (0.0%) |
| 60 to 89 Minutes | 0 (0.0%) | 0 (0.0%) |
| 90 or more Minutes | 0 (0.0%) | 0 (0.0%) |
Time of Departure to Work by Sex in South Philipsburg
The most frequent times of departure to work in South Philipsburg are 12:00 AM to 4:59 AM (21, 36.2%) for males and 6:30 AM to 6:59 AM (58, 63.7%) for females.
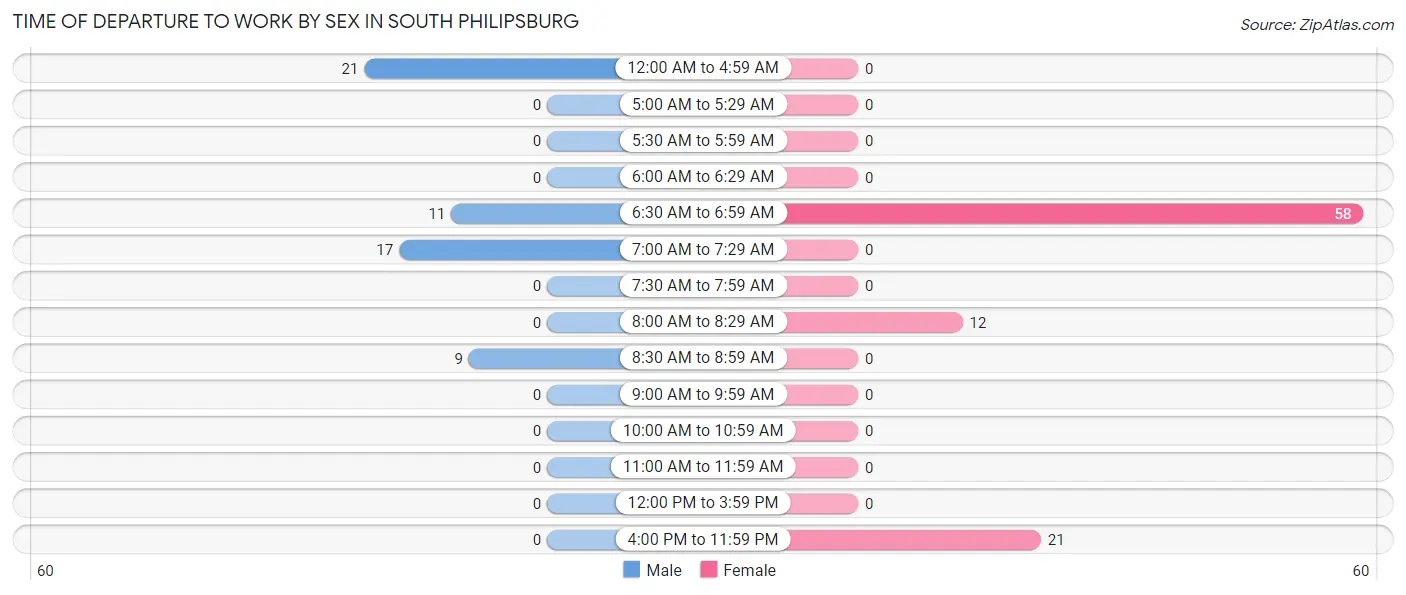
| Time of Departure | Male | Female |
| 12:00 AM to 4:59 AM | 21 (36.2%) | 0 (0.0%) |
| 5:00 AM to 5:29 AM | 0 (0.0%) | 0 (0.0%) |
| 5:30 AM to 5:59 AM | 0 (0.0%) | 0 (0.0%) |
| 6:00 AM to 6:29 AM | 0 (0.0%) | 0 (0.0%) |
| 6:30 AM to 6:59 AM | 11 (19.0%) | 58 (63.7%) |
| 7:00 AM to 7:29 AM | 17 (29.3%) | 0 (0.0%) |
| 7:30 AM to 7:59 AM | 0 (0.0%) | 0 (0.0%) |
| 8:00 AM to 8:29 AM | 0 (0.0%) | 12 (13.2%) |
| 8:30 AM to 8:59 AM | 9 (15.5%) | 0 (0.0%) |
| 9:00 AM to 9:59 AM | 0 (0.0%) | 0 (0.0%) |
| 10:00 AM to 10:59 AM | 0 (0.0%) | 0 (0.0%) |
| 11:00 AM to 11:59 AM | 0 (0.0%) | 0 (0.0%) |
| 12:00 PM to 3:59 PM | 0 (0.0%) | 0 (0.0%) |
| 4:00 PM to 11:59 PM | 0 (0.0%) | 21 (23.1%) |
| Total | 58 (100.0%) | 91 (100.0%) |
Housing Occupancy in South Philipsburg
Occupancy by Ownership in South Philipsburg
Of the total 211 dwellings in South Philipsburg, owner-occupied units account for 187 (88.6%), while renter-occupied units make up 24 (11.4%).
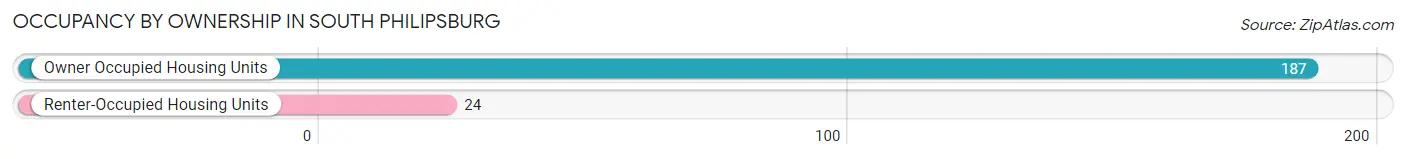
| Occupancy | # Housing Units | % Housing Units |
| Owner Occupied Housing Units | 187 | 88.6% |
| Renter-Occupied Housing Units | 24 | 11.4% |
| Total Occupied Housing Units | 211 | 100.0% |
Occupancy by Household Size in South Philipsburg
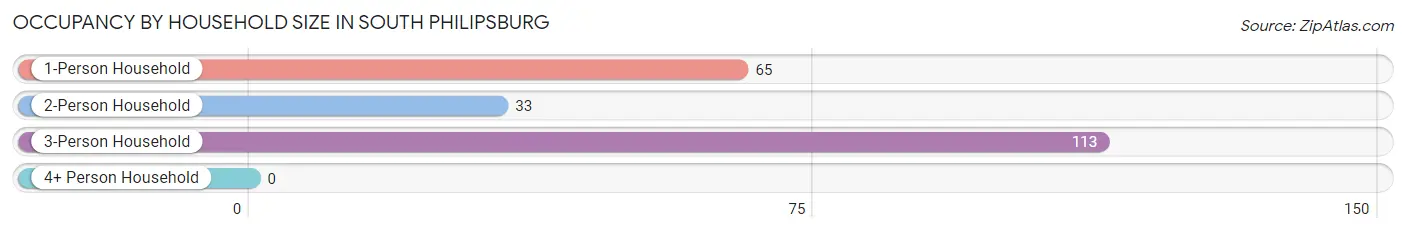
| Household Size | # Housing Units | % Housing Units |
| 1-Person Household | 65 | 30.8% |
| 2-Person Household | 33 | 15.6% |
| 3-Person Household | 113 | 53.5% |
| 4+ Person Household | 0 | 0.0% |
| Total Housing Units | 211 | 100.0% |
Occupancy by Ownership by Household Size in South Philipsburg
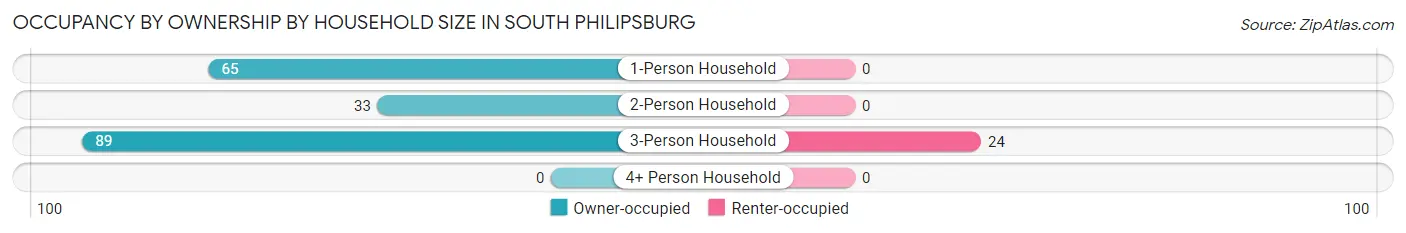
| Household Size | Owner-occupied | Renter-occupied |
| 1-Person Household | 65 (100.0%) | 0 (0.0%) |
| 2-Person Household | 33 (100.0%) | 0 (0.0%) |
| 3-Person Household | 89 (78.8%) | 24 (21.2%) |
| 4+ Person Household | 0 (0.0%) | 0 (0.0%) |
| Total Housing Units | 187 (88.6%) | 24 (11.4%) |
Occupancy by Educational Attainment in South Philipsburg
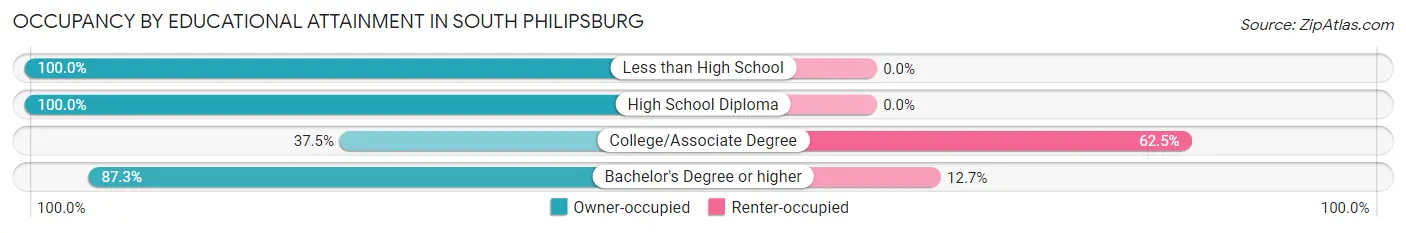
| Household Size | Owner-occupied | Renter-occupied |
| Less than High School | 33 (100.0%) | 0 (0.0%) |
| High School Diploma | 83 (100.0%) | 0 (0.0%) |
| College/Associate Degree | 9 (37.5%) | 15 (62.5%) |
| Bachelor's Degree or higher | 62 (87.3%) | 9 (12.7%) |
Occupancy by Age of Householder in South Philipsburg
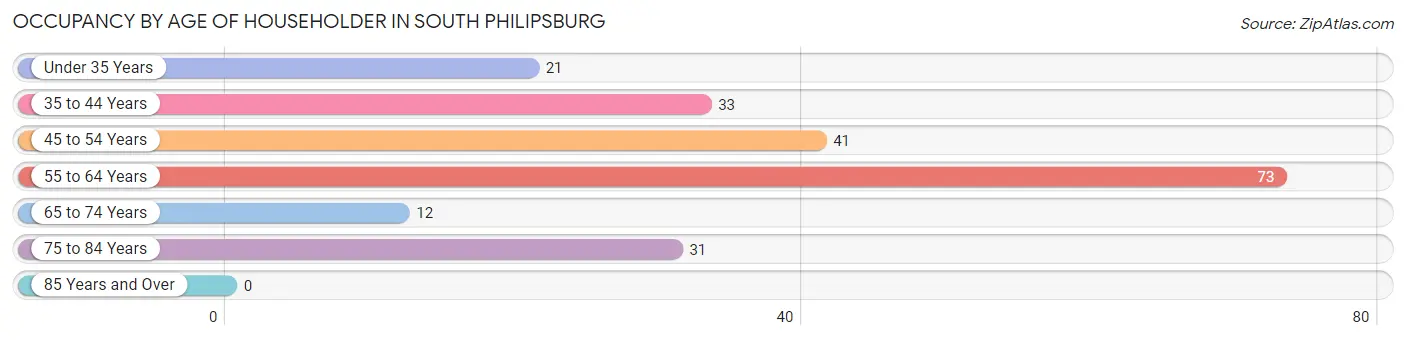
| Age Bracket | # Households | % Households |
| Under 35 Years | 21 | 10.0% |
| 35 to 44 Years | 33 | 15.6% |
| 45 to 54 Years | 41 | 19.4% |
| 55 to 64 Years | 73 | 34.6% |
| 65 to 74 Years | 12 | 5.7% |
| 75 to 84 Years | 31 | 14.7% |
| 85 Years and Over | 0 | 0.0% |
| Total | 211 | 100.0% |
Housing Finances in South Philipsburg
Median Income by Occupancy in South Philipsburg
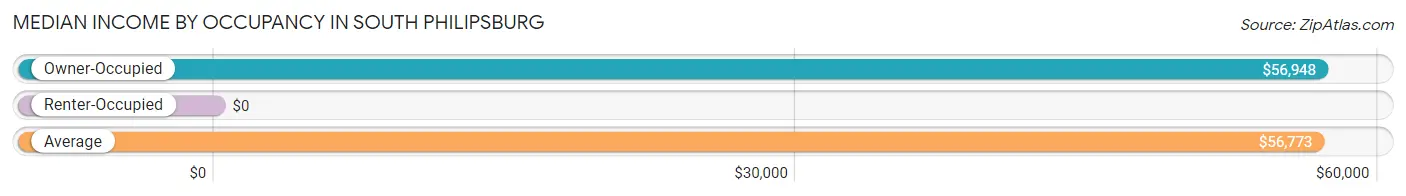
| Occupancy Type | # Households | Median Income |
| Owner-Occupied | 187 (88.6%) | $56,948 |
| Renter-Occupied | 24 (11.4%) | $0 |
| Average | 211 (100.0%) | $56,773 |
Occupancy by Householder Income Bracket in South Philipsburg
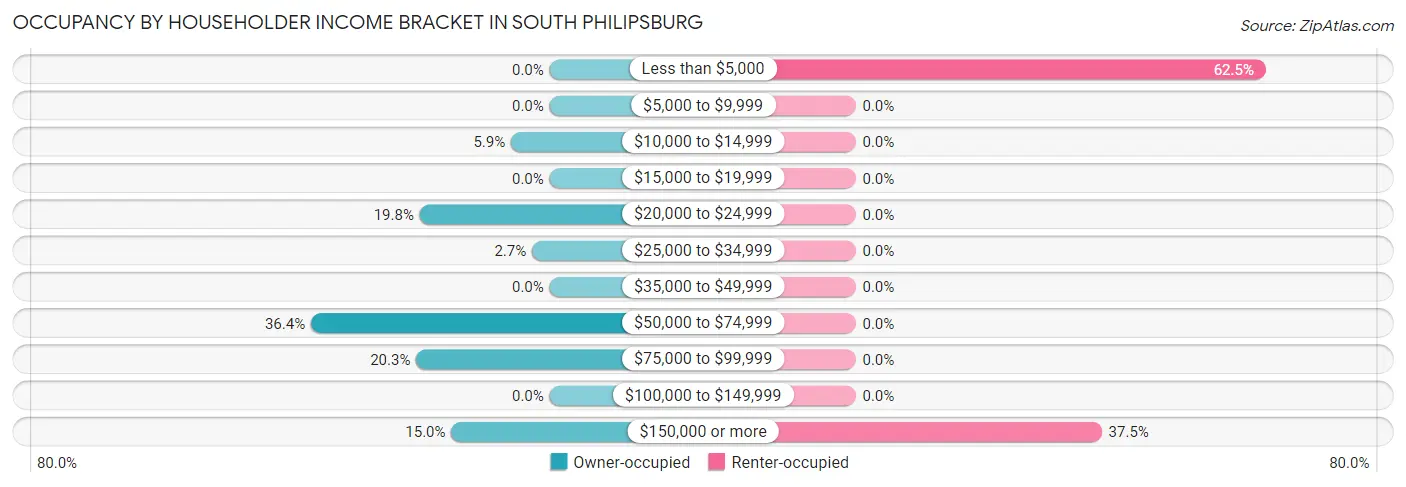
| Income Bracket | Owner-occupied | Renter-occupied |
| Less than $5,000 | 0 (0.0%) | 15 (62.5%) |
| $5,000 to $9,999 | 0 (0.0%) | 0 (0.0%) |
| $10,000 to $14,999 | 11 (5.9%) | 0 (0.0%) |
| $15,000 to $19,999 | 0 (0.0%) | 0 (0.0%) |
| $20,000 to $24,999 | 37 (19.8%) | 0 (0.0%) |
| $25,000 to $34,999 | 5 (2.7%) | 0 (0.0%) |
| $35,000 to $49,999 | 0 (0.0%) | 0 (0.0%) |
| $50,000 to $74,999 | 68 (36.4%) | 0 (0.0%) |
| $75,000 to $99,999 | 38 (20.3%) | 0 (0.0%) |
| $100,000 to $149,999 | 0 (0.0%) | 0 (0.0%) |
| $150,000 or more | 28 (15.0%) | 9 (37.5%) |
| Total | 187 (100.0%) | 24 (100.0%) |
Monthly Housing Cost Tiers in South Philipsburg
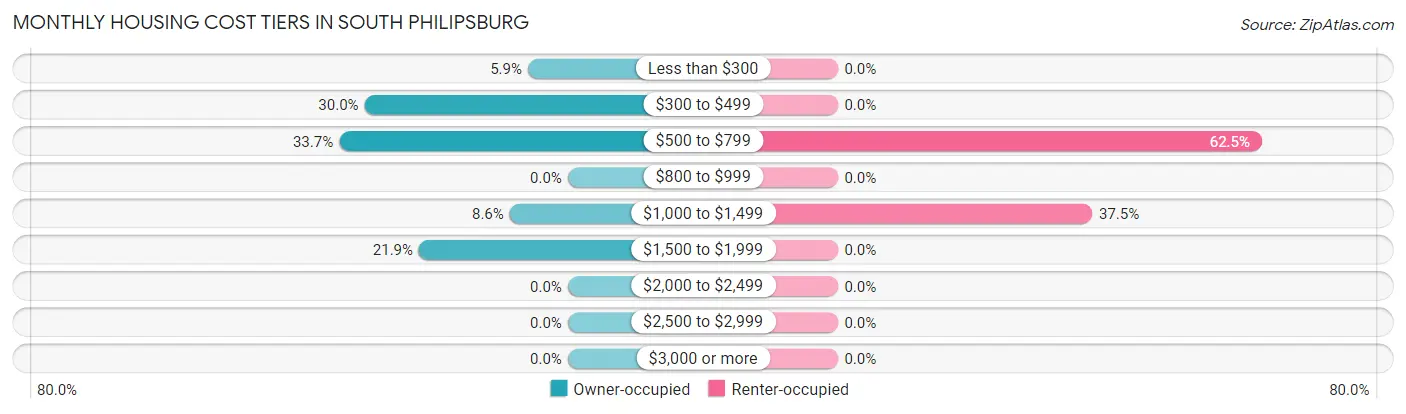
| Monthly Cost | Owner-occupied | Renter-occupied |
| Less than $300 | 11 (5.9%) | 0 (0.0%) |
| $300 to $499 | 56 (29.9%) | 0 (0.0%) |
| $500 to $799 | 63 (33.7%) | 15 (62.5%) |
| $800 to $999 | 0 (0.0%) | 0 (0.0%) |
| $1,000 to $1,499 | 16 (8.6%) | 9 (37.5%) |
| $1,500 to $1,999 | 41 (21.9%) | 0 (0.0%) |
| $2,000 to $2,499 | 0 (0.0%) | 0 (0.0%) |
| $2,500 to $2,999 | 0 (0.0%) | 0 (0.0%) |
| $3,000 or more | 0 (0.0%) | 0 (0.0%) |
| Total | 187 (100.0%) | 24 (100.0%) |
Physical Housing Characteristics in South Philipsburg
Housing Structures in South Philipsburg
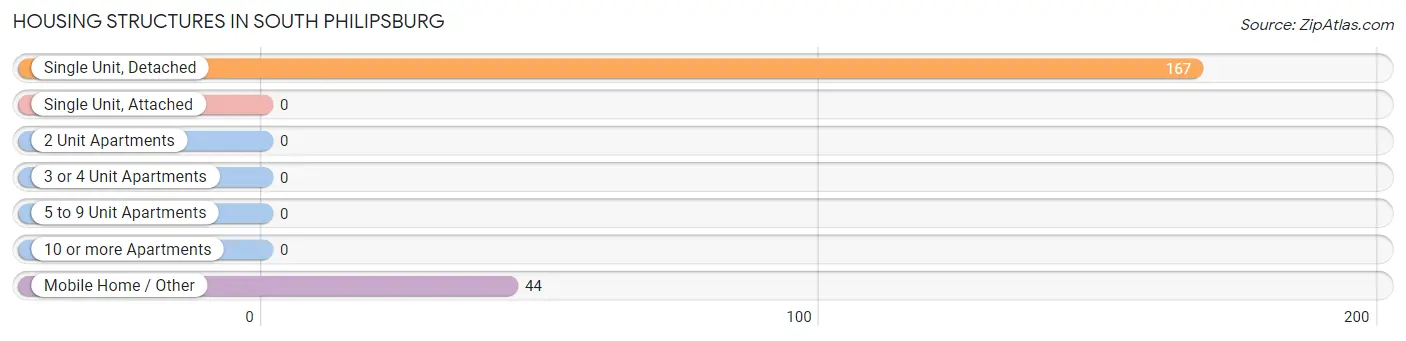
| Structure Type | # Housing Units | % Housing Units |
| Single Unit, Detached | 167 | 79.1% |
| Single Unit, Attached | 0 | 0.0% |
| 2 Unit Apartments | 0 | 0.0% |
| 3 or 4 Unit Apartments | 0 | 0.0% |
| 5 to 9 Unit Apartments | 0 | 0.0% |
| 10 or more Apartments | 0 | 0.0% |
| Mobile Home / Other | 44 | 20.8% |
| Total | 211 | 100.0% |
Housing Structures by Occupancy in South Philipsburg
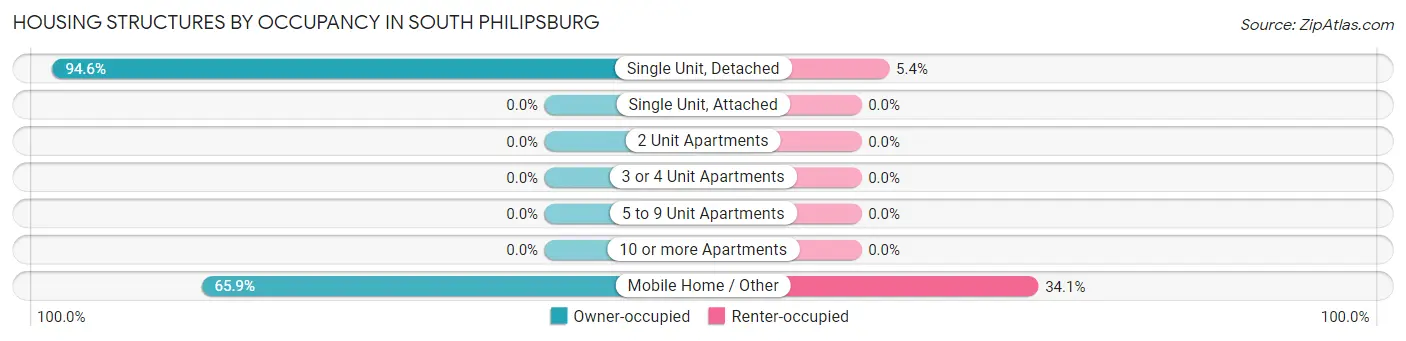
| Structure Type | Owner-occupied | Renter-occupied |
| Single Unit, Detached | 158 (94.6%) | 9 (5.4%) |
| Single Unit, Attached | 0 (0.0%) | 0 (0.0%) |
| 2 Unit Apartments | 0 (0.0%) | 0 (0.0%) |
| 3 or 4 Unit Apartments | 0 (0.0%) | 0 (0.0%) |
| 5 to 9 Unit Apartments | 0 (0.0%) | 0 (0.0%) |
| 10 or more Apartments | 0 (0.0%) | 0 (0.0%) |
| Mobile Home / Other | 29 (65.9%) | 15 (34.1%) |
| Total | 187 (88.6%) | 24 (11.4%) |
Housing Structures by Number of Rooms in South Philipsburg
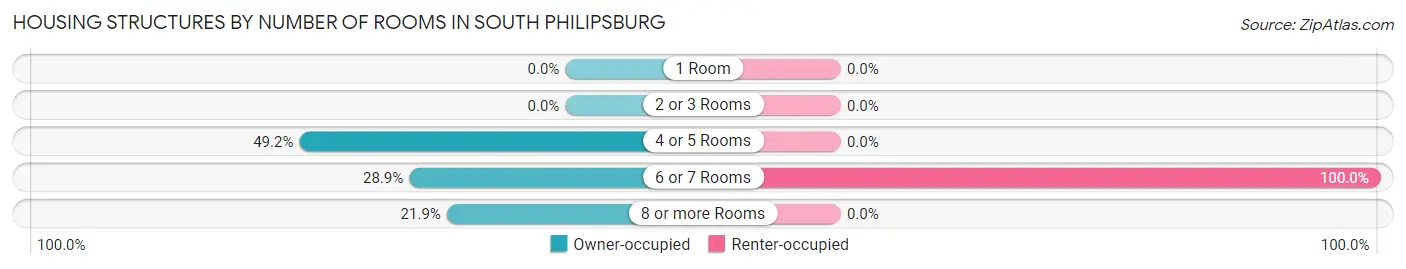
| Number of Rooms | Owner-occupied | Renter-occupied |
| 1 Room | 0 (0.0%) | 0 (0.0%) |
| 2 or 3 Rooms | 0 (0.0%) | 0 (0.0%) |
| 4 or 5 Rooms | 92 (49.2%) | 0 (0.0%) |
| 6 or 7 Rooms | 54 (28.9%) | 24 (100.0%) |
| 8 or more Rooms | 41 (21.9%) | 0 (0.0%) |
| Total | 187 (100.0%) | 24 (100.0%) |
Housing Structure by Heating Type in South Philipsburg
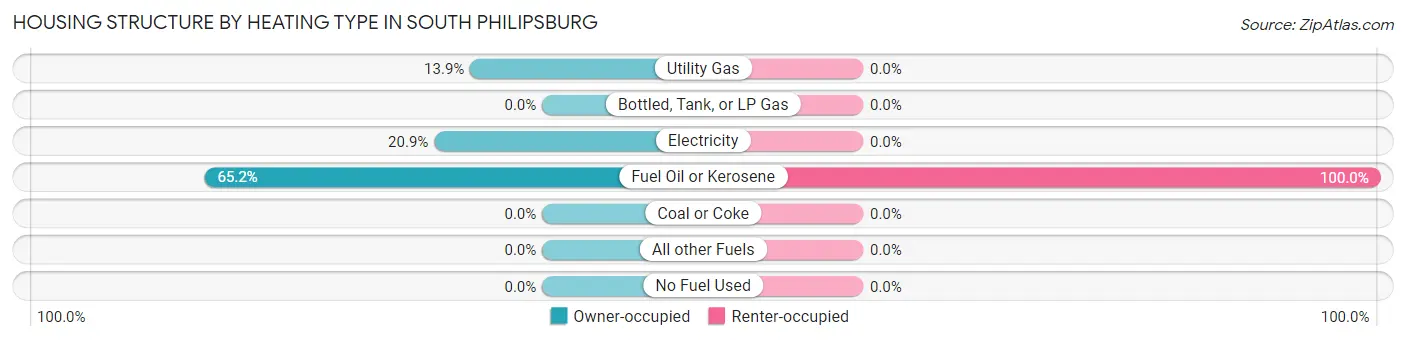
| Heating Type | Owner-occupied | Renter-occupied |
| Utility Gas | 26 (13.9%) | 0 (0.0%) |
| Bottled, Tank, or LP Gas | 0 (0.0%) | 0 (0.0%) |
| Electricity | 39 (20.9%) | 0 (0.0%) |
| Fuel Oil or Kerosene | 122 (65.2%) | 24 (100.0%) |
| Coal or Coke | 0 (0.0%) | 0 (0.0%) |
| All other Fuels | 0 (0.0%) | 0 (0.0%) |
| No Fuel Used | 0 (0.0%) | 0 (0.0%) |
| Total | 187 (100.0%) | 24 (100.0%) |
Household Vehicle Usage in South Philipsburg
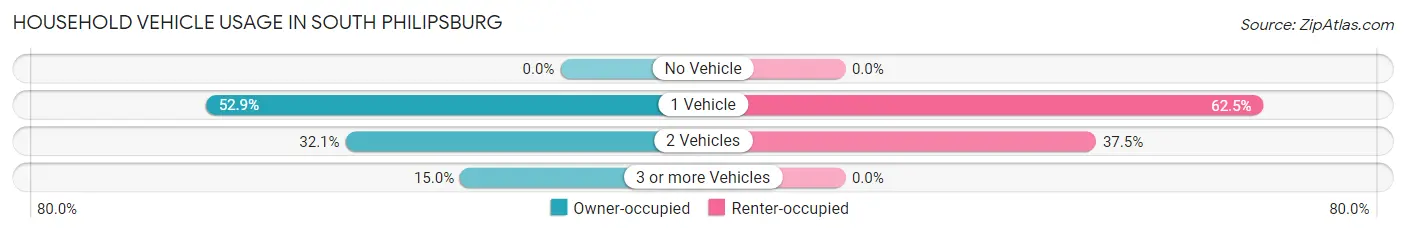
| Vehicles per Household | Owner-occupied | Renter-occupied |
| No Vehicle | 0 (0.0%) | 0 (0.0%) |
| 1 Vehicle | 99 (52.9%) | 15 (62.5%) |
| 2 Vehicles | 60 (32.1%) | 9 (37.5%) |
| 3 or more Vehicles | 28 (15.0%) | 0 (0.0%) |
| Total | 187 (100.0%) | 24 (100.0%) |
Real Estate & Mortgages in South Philipsburg
Real Estate and Mortgage Overview in South Philipsburg
| Characteristic | Without Mortgage | With Mortgage |
| Housing Units | 119 | 68 |
| Median Property Value | $85,000 | $180,100 |
| Median Household Income | $66,635 | $7 |
| Monthly Housing Costs | $478 | $0 |
| Real Estate Taxes | $2,085 | $0 |
Property Value by Mortgage Status in South Philipsburg
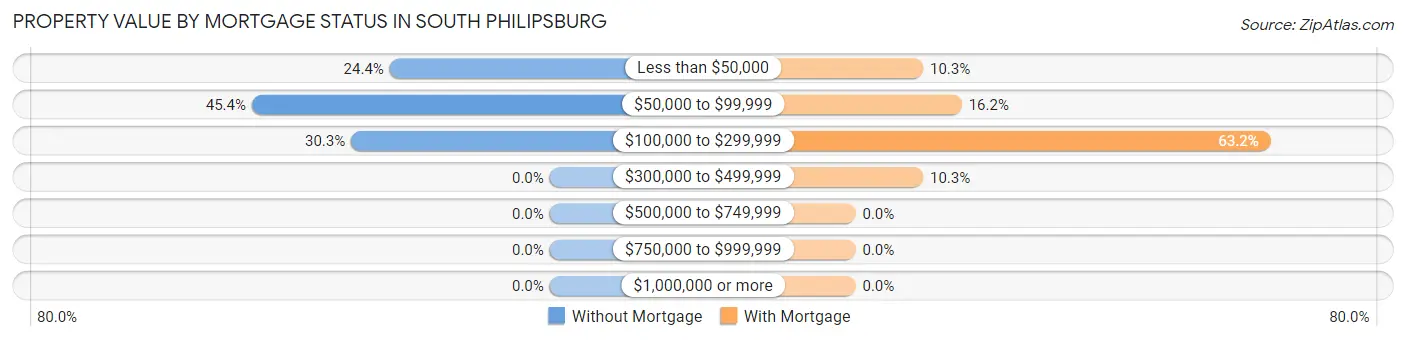
| Property Value | Without Mortgage | With Mortgage |
| Less than $50,000 | 29 (24.4%) | 7 (10.3%) |
| $50,000 to $99,999 | 54 (45.4%) | 11 (16.2%) |
| $100,000 to $299,999 | 36 (30.2%) | 43 (63.2%) |
| $300,000 to $499,999 | 0 (0.0%) | 7 (10.3%) |
| $500,000 to $749,999 | 0 (0.0%) | 0 (0.0%) |
| $750,000 to $999,999 | 0 (0.0%) | 0 (0.0%) |
| $1,000,000 or more | 0 (0.0%) | 0 (0.0%) |
| Total | 119 (100.0%) | 68 (100.0%) |
Household Income by Mortgage Status in South Philipsburg
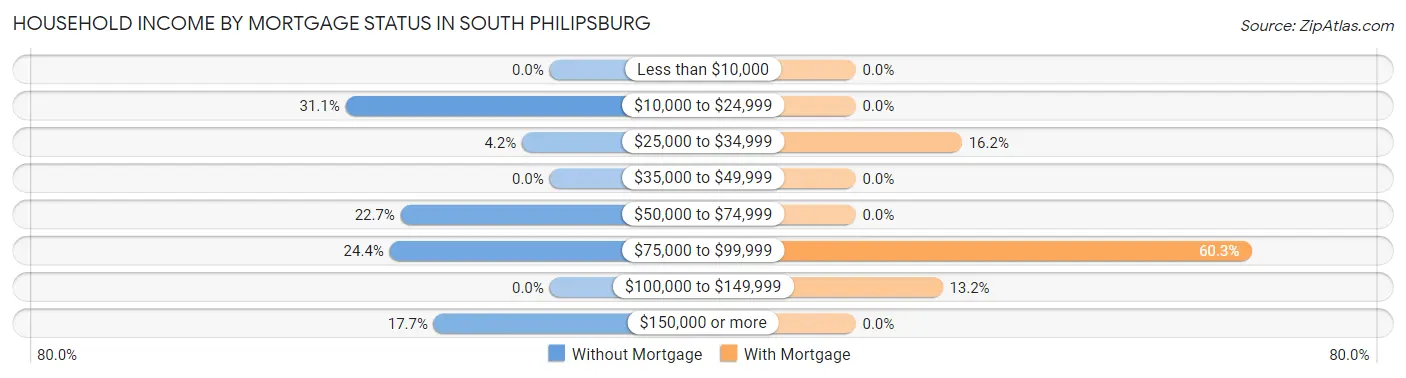
| Household Income | Without Mortgage | With Mortgage |
| Less than $10,000 | 0 (0.0%) | 0 (0.0%) |
| $10,000 to $24,999 | 37 (31.1%) | 0 (0.0%) |
| $25,000 to $34,999 | 5 (4.2%) | 11 (16.2%) |
| $35,000 to $49,999 | 0 (0.0%) | 0 (0.0%) |
| $50,000 to $74,999 | 27 (22.7%) | 0 (0.0%) |
| $75,000 to $99,999 | 29 (24.4%) | 41 (60.3%) |
| $100,000 to $149,999 | 0 (0.0%) | 9 (13.2%) |
| $150,000 or more | 21 (17.6%) | 0 (0.0%) |
| Total | 119 (100.0%) | 68 (100.0%) |
Property Value to Household Income Ratio in South Philipsburg
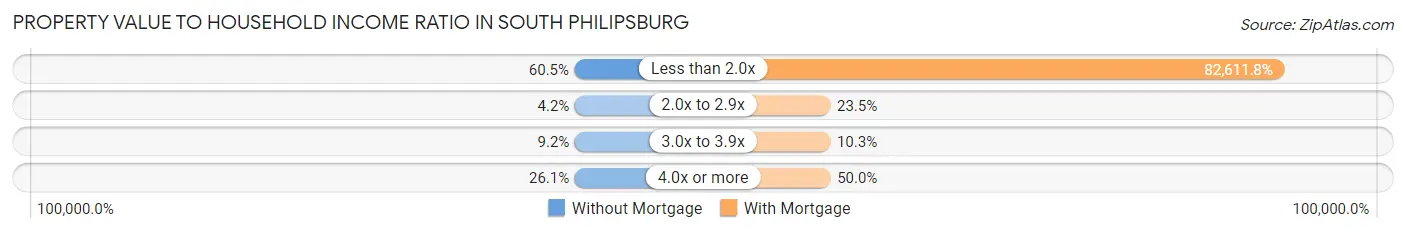
| Value-to-Income Ratio | Without Mortgage | With Mortgage |
| Less than 2.0x | 72 (60.5%) | 56,176 (82,611.8%) |
| 2.0x to 2.9x | 5 (4.2%) | 16 (23.5%) |
| 3.0x to 3.9x | 11 (9.2%) | 7 (10.3%) |
| 4.0x or more | 31 (26.1%) | 34 (50.0%) |
| Total | 119 (100.0%) | 68 (100.0%) |
Real Estate Taxes by Mortgage Status in South Philipsburg
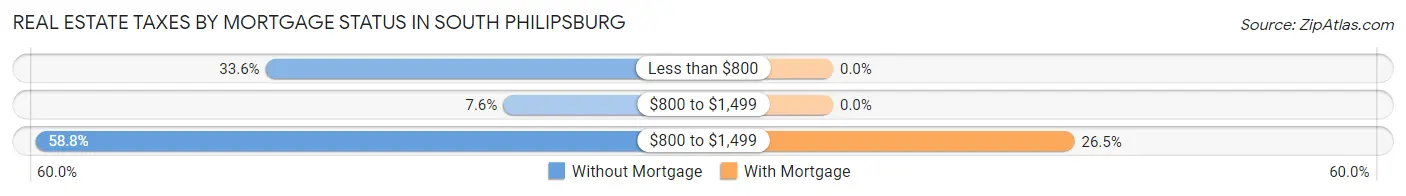
| Property Taxes | Without Mortgage | With Mortgage |
| Less than $800 | 40 (33.6%) | 0 (0.0%) |
| $800 to $1,499 | 9 (7.6%) | 0 (0.0%) |
| $800 to $1,499 | 70 (58.8%) | 18 (26.5%) |
| Total | 119 (100.0%) | 68 (100.0%) |
Health & Disability in South Philipsburg
Health Insurance Coverage by Age in South Philipsburg
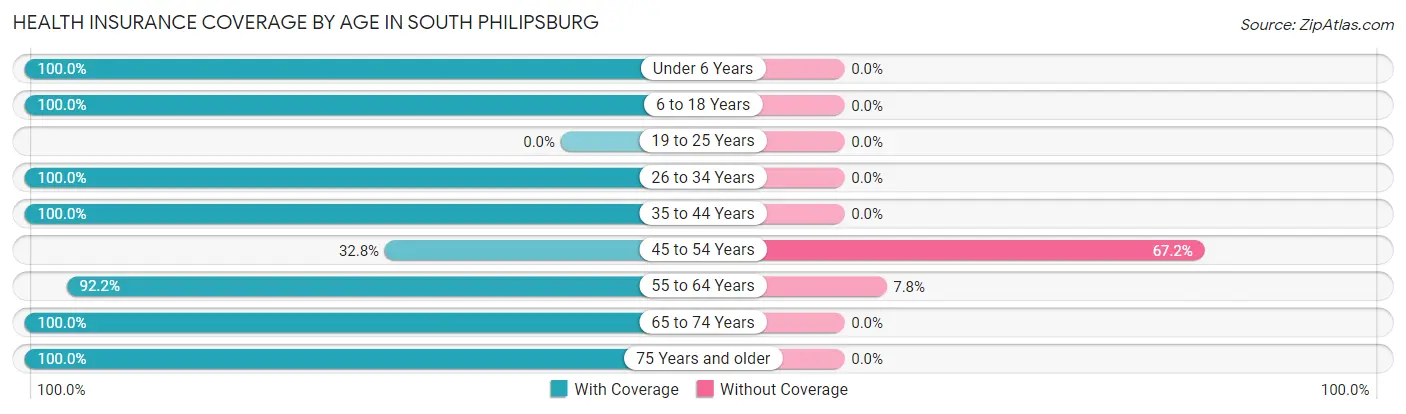
| Age Bracket | With Coverage | Without Coverage |
| Under 6 Years | 15 (100.0%) | 0 (0.0%) |
| 6 to 18 Years | 33 (100.0%) | 0 (0.0%) |
| 19 to 25 Years | 0 (0.0%) | 0 (0.0%) |
| 26 to 34 Years | 73 (100.0%) | 0 (0.0%) |
| 35 to 44 Years | 117 (100.0%) | 0 (0.0%) |
| 45 to 54 Years | 41 (32.8%) | 84 (67.2%) |
| 55 to 64 Years | 106 (92.2%) | 9 (7.8%) |
| 65 to 74 Years | 31 (100.0%) | 0 (0.0%) |
| 75 Years and older | 36 (100.0%) | 0 (0.0%) |
| Total | 452 (82.9%) | 93 (17.1%) |
Health Insurance Coverage by Citizenship Status in South Philipsburg
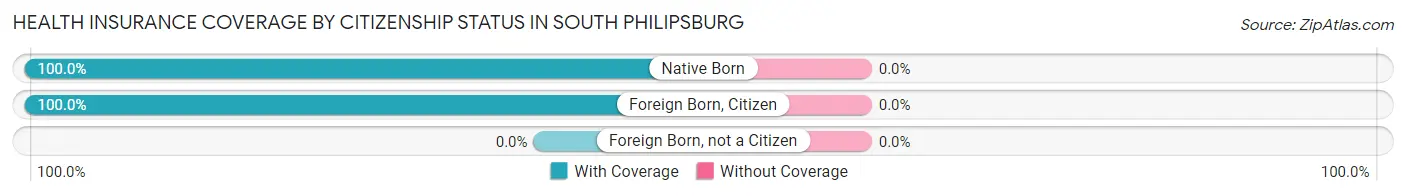
| Citizenship Status | With Coverage | Without Coverage |
| Native Born | 15 (100.0%) | 0 (0.0%) |
| Foreign Born, Citizen | 33 (100.0%) | 0 (0.0%) |
| Foreign Born, not a Citizen | 0 (0.0%) | 0 (0.0%) |
Health Insurance Coverage by Household Income in South Philipsburg
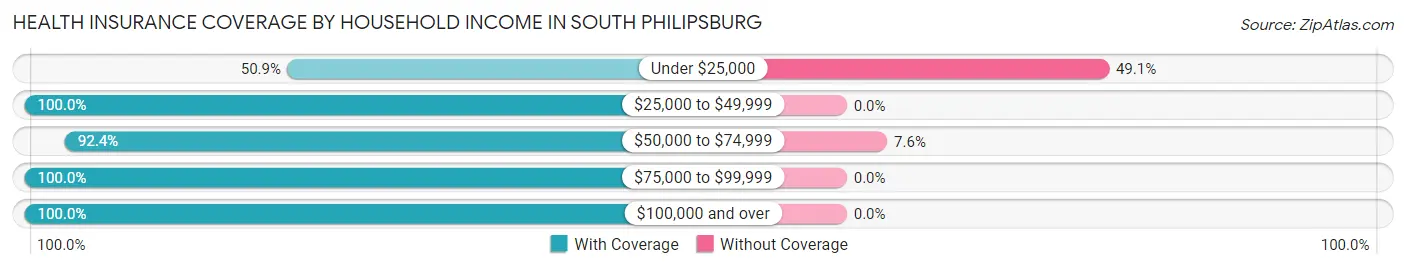
| Household Income | With Coverage | Without Coverage |
| Under $25,000 | 87 (50.9%) | 84 (49.1%) |
| $25,000 to $49,999 | 13 (100.0%) | 0 (0.0%) |
| $50,000 to $74,999 | 110 (92.4%) | 9 (7.6%) |
| $75,000 to $99,999 | 142 (100.0%) | 0 (0.0%) |
| $100,000 and over | 100 (100.0%) | 0 (0.0%) |
Public vs Private Health Insurance Coverage by Age in South Philipsburg
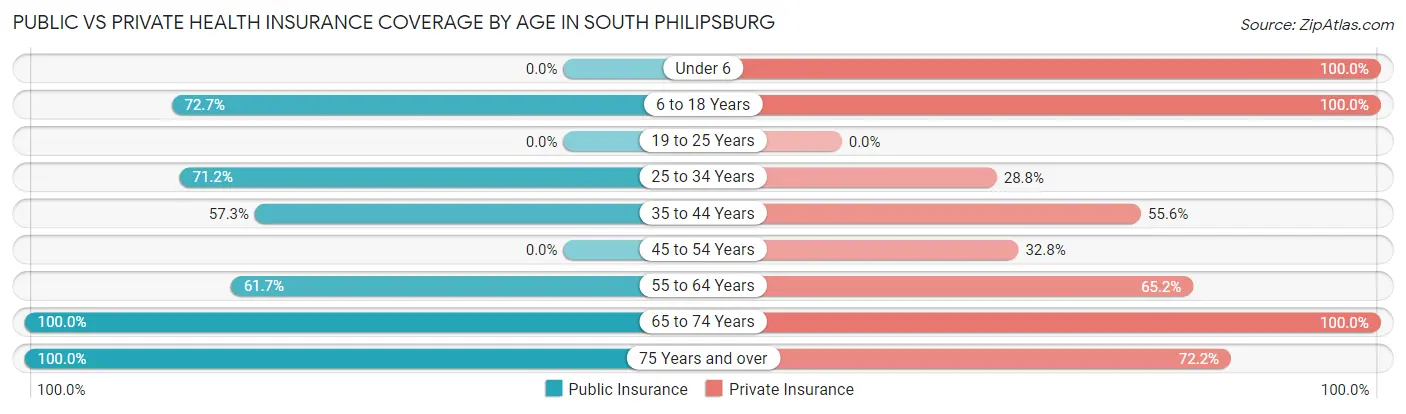
| Age Bracket | Public Insurance | Private Insurance |
| Under 6 | 0 (0.0%) | 15 (100.0%) |
| 6 to 18 Years | 24 (72.7%) | 33 (100.0%) |
| 19 to 25 Years | 0 (0.0%) | 0 (0.0%) |
| 25 to 34 Years | 52 (71.2%) | 21 (28.8%) |
| 35 to 44 Years | 67 (57.3%) | 65 (55.6%) |
| 45 to 54 Years | 0 (0.0%) | 41 (32.8%) |
| 55 to 64 Years | 71 (61.7%) | 75 (65.2%) |
| 65 to 74 Years | 31 (100.0%) | 31 (100.0%) |
| 75 Years and over | 36 (100.0%) | 26 (72.2%) |
| Total | 281 (51.6%) | 307 (56.3%) |
Disability Status by Sex by Age in South Philipsburg
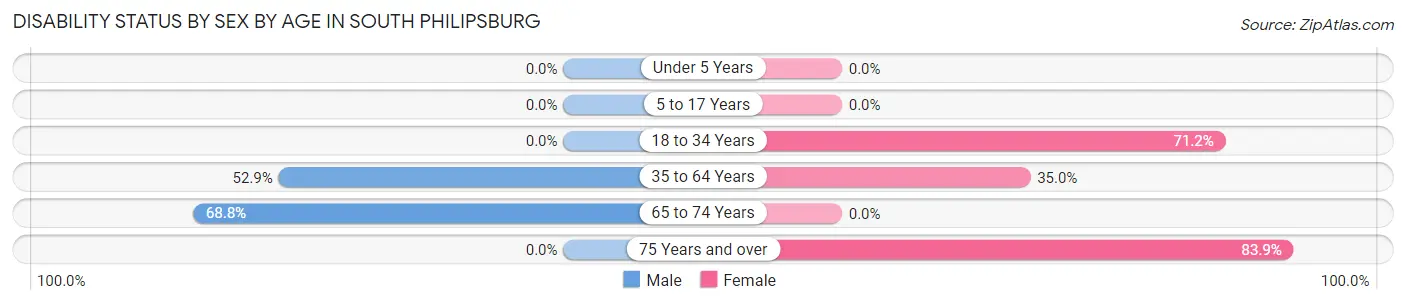
| Age Bracket | Male | Female |
| Under 5 Years | 0 (0.0%) | 0 (0.0%) |
| 5 to 17 Years | 0 (0.0%) | 0 (0.0%) |
| 18 to 34 Years | 0 (0.0%) | 52 (71.2%) |
| 35 to 64 Years | 92 (52.9%) | 64 (35.0%) |
| 65 to 74 Years | 11 (68.8%) | 0 (0.0%) |
| 75 Years and over | 0 (0.0%) | 26 (83.9%) |
Disability Class by Sex by Age in South Philipsburg
Disability Class: Hearing Difficulty
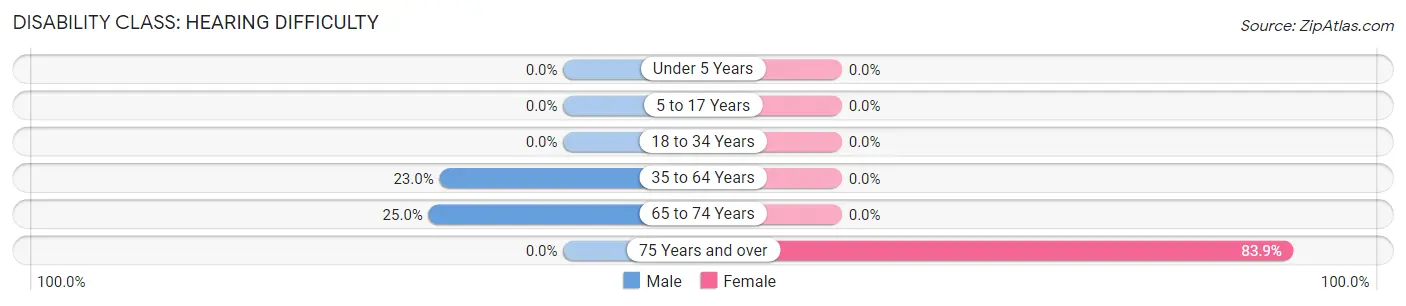
| Age Bracket | Male | Female |
| Under 5 Years | 0 (0.0%) | 0 (0.0%) |
| 5 to 17 Years | 0 (0.0%) | 0 (0.0%) |
| 18 to 34 Years | 0 (0.0%) | 0 (0.0%) |
| 35 to 64 Years | 40 (23.0%) | 0 (0.0%) |
| 65 to 74 Years | 4 (25.0%) | 0 (0.0%) |
| 75 Years and over | 0 (0.0%) | 26 (83.9%) |
Disability Class: Vision Difficulty
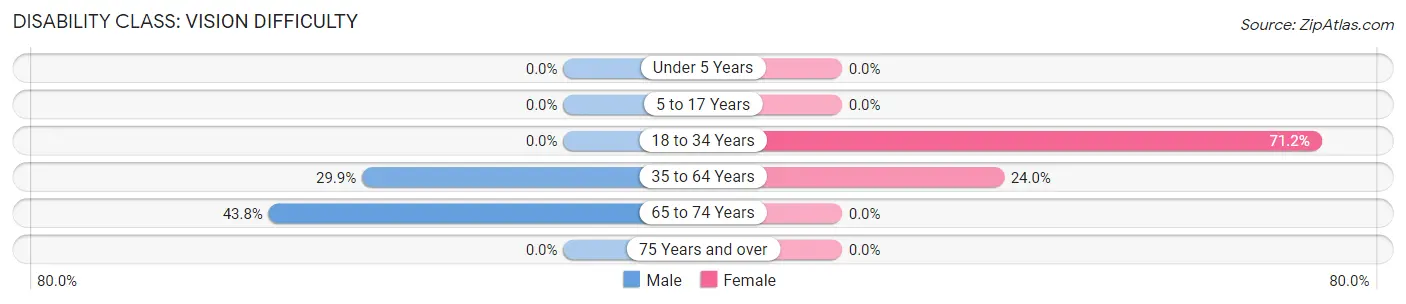
| Age Bracket | Male | Female |
| Under 5 Years | 0 (0.0%) | 0 (0.0%) |
| 5 to 17 Years | 0 (0.0%) | 0 (0.0%) |
| 18 to 34 Years | 0 (0.0%) | 52 (71.2%) |
| 35 to 64 Years | 52 (29.9%) | 44 (24.0%) |
| 65 to 74 Years | 7 (43.8%) | 0 (0.0%) |
| 75 Years and over | 0 (0.0%) | 0 (0.0%) |
Disability Class: Cognitive Difficulty
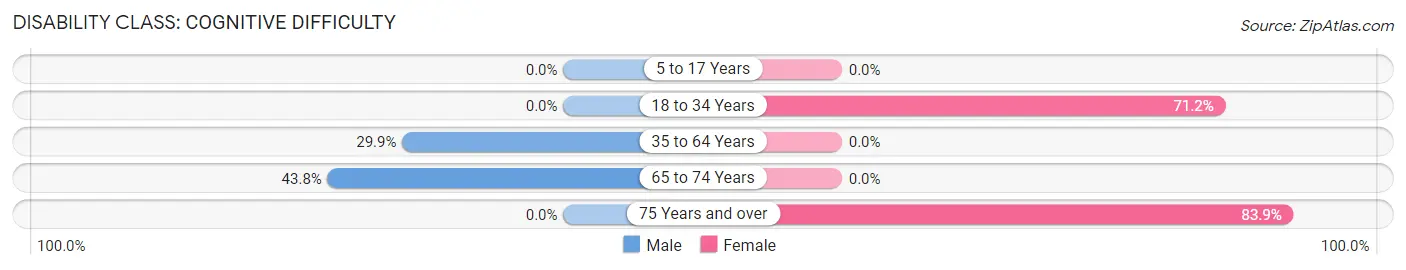
| Age Bracket | Male | Female |
| 5 to 17 Years | 0 (0.0%) | 0 (0.0%) |
| 18 to 34 Years | 0 (0.0%) | 52 (71.2%) |
| 35 to 64 Years | 52 (29.9%) | 0 (0.0%) |
| 65 to 74 Years | 7 (43.8%) | 0 (0.0%) |
| 75 Years and over | 0 (0.0%) | 26 (83.9%) |
Disability Class: Ambulatory Difficulty
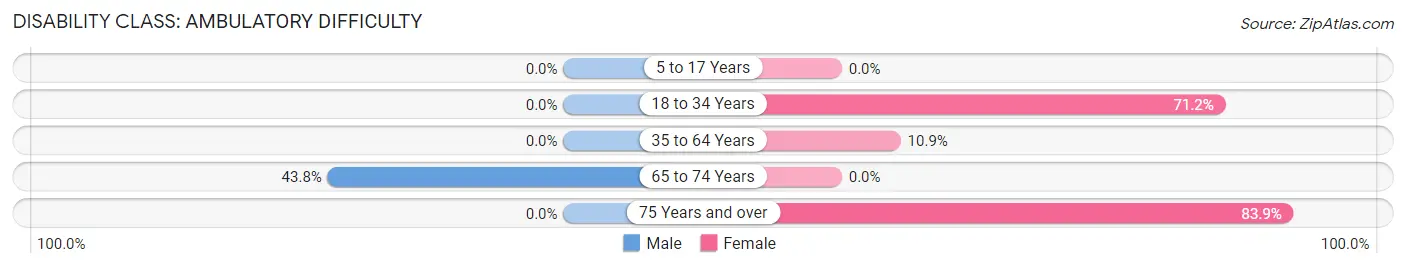
| Age Bracket | Male | Female |
| 5 to 17 Years | 0 (0.0%) | 0 (0.0%) |
| 18 to 34 Years | 0 (0.0%) | 52 (71.2%) |
| 35 to 64 Years | 0 (0.0%) | 20 (10.9%) |
| 65 to 74 Years | 7 (43.8%) | 0 (0.0%) |
| 75 Years and over | 0 (0.0%) | 26 (83.9%) |
Disability Class: Self-Care Difficulty
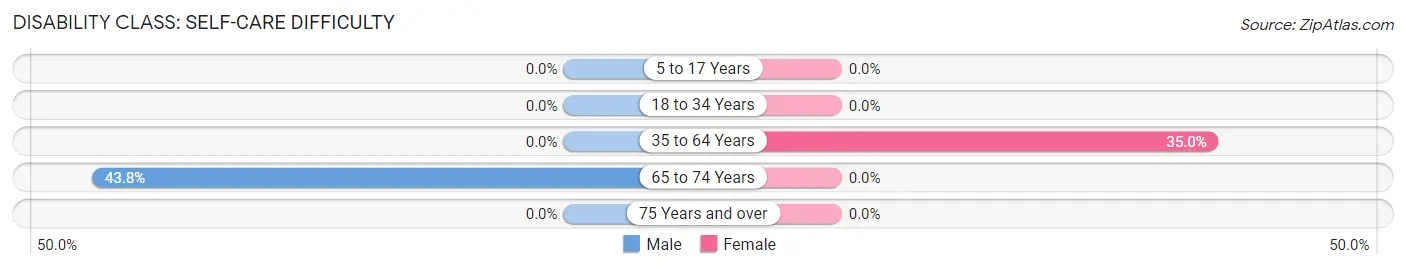
| Age Bracket | Male | Female |
| 5 to 17 Years | 0 (0.0%) | 0 (0.0%) |
| 18 to 34 Years | 0 (0.0%) | 0 (0.0%) |
| 35 to 64 Years | 0 (0.0%) | 64 (35.0%) |
| 65 to 74 Years | 7 (43.8%) | 0 (0.0%) |
| 75 Years and over | 0 (0.0%) | 0 (0.0%) |
Technology Access in South Philipsburg
Computing Device Access in South Philipsburg
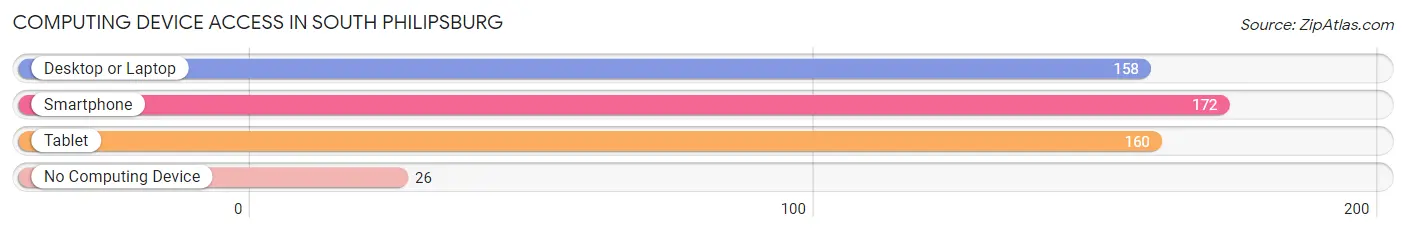
| Device Type | # Households | % Households |
| Desktop or Laptop | 158 | 74.9% |
| Smartphone | 172 | 81.5% |
| Tablet | 160 | 75.8% |
| No Computing Device | 26 | 12.3% |
| Total | 211 | 100.0% |
Internet Access in South Philipsburg
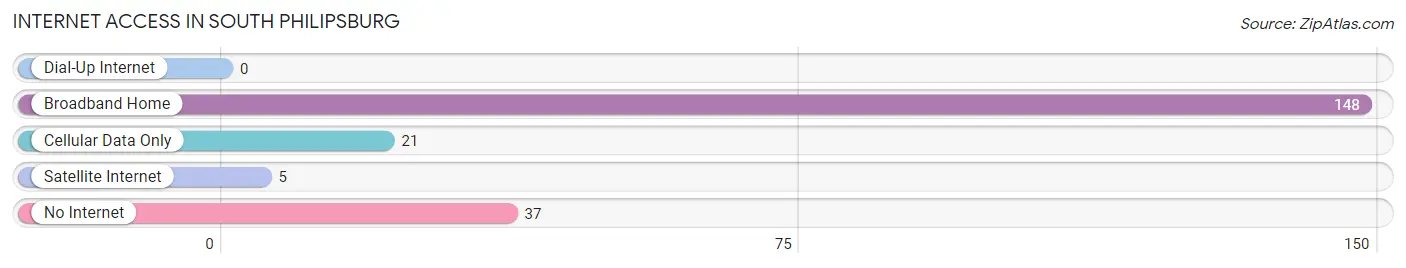
| Internet Type | # Households | % Households |
| Dial-Up Internet | 0 | 0.0% |
| Broadband Home | 148 | 70.1% |
| Cellular Data Only | 21 | 10.0% |
| Satellite Internet | 5 | 2.4% |
| No Internet | 37 | 17.5% |
| Total | 211 | 100.0% |
South Philipsburg Summary
Philipsburg, Pennsylvania is a borough located in Centre County, Pennsylvania. It is situated in the Moshannon Valley, which is part of the Allegheny Plateau. The borough is located approximately 8 miles east of State College and is part of the State College, Pennsylvania Metropolitan Statistical Area. As of the 2010 census, the population of Philipsburg was 2,817.
History
The area that is now Philipsburg was first settled in 1795 by John Philips, a Revolutionary War veteran. Philips built a log cabin and began farming the land. The area was known as Philipsburg until 1831 when the name was changed to South Philipsburg. The name was changed to avoid confusion with Philipsburg, Pennsylvania, which is located in Clearfield County.
In 1832, the first post office was established in South Philipsburg. The first school was built in 1835 and the first church was built in 1837. The first newspaper, the Philipsburg Gazette, was established in 1845.
In 1854, the Philipsburg and Clearfield Railroad was built, connecting South Philipsburg to Clearfield. This allowed for the transportation of coal and other goods to and from the area.
In 1871, the Philipsburg and Clearfield Railroad was extended to State College, allowing for the transportation of passengers and goods to and from the area.
In 1873, the Philipsburg and Clearfield Railroad was extended to Altoona, allowing for the transportation of passengers and goods to and from the area.
In 1876, the Philipsburg and Clearfield Railroad was extended to Tyrone, allowing for the transportation of passengers and goods to and from the area.
In 1877, the Philipsburg and Clearfield Railroad was extended to Bellefonte, allowing for the transportation of passengers and goods to and from the area.
In 1878, the Philipsburg and Clearfield Railroad was extended to Lock Haven, allowing for the transportation of passengers and goods to and from the area.
In 1881, the Philipsburg and Clearfield Railroad was extended to Williamsport, allowing for the transportation of passengers and goods to and from the area.
In 1883, the Philipsburg and Clearfield Railroad was extended to Sunbury, allowing for the transportation of passengers and goods to and from the area.
In 1884, the Philipsburg and Clearfield Railroad was extended to Harrisburg, allowing for the transportation of passengers and goods to and from the area.
In 1885, the Philipsburg and Clearfield Railroad was extended to Philadelphia, allowing for the transportation of passengers and goods to and from the area.
In 1887, the Philipsburg and Clearfield Railroad was extended to New York City, allowing for the transportation of passengers and goods to and from the area.
In 1891, the Philipsburg and Clearfield Railroad was extended to Pittsburgh, allowing for the transportation of passengers and goods to and from the area.
In 1895, the Philipsburg and Clearfield Railroad was extended to Cleveland, allowing for the transportation of passengers and goods to and from the area.
In 1897, the Philipsburg and Clearfield Railroad was extended to Chicago, allowing for the transportation of passengers and goods to and from the area.
In 1900, the Philipsburg and Clearfield Railroad was extended to St. Louis, allowing for the transportation of passengers and goods to and from the area.
In 1901, the Philipsburg and Clearfield Railroad was extended to Kansas City, allowing for the transportation of passengers and goods to and from the area.
In 1902, the Philipsburg and Clearfield Railroad was extended to Omaha, allowing for the transportation of passengers and goods to and from the area.
In 1903, the Philipsburg and Clearfield Railroad was extended to Denver, allowing for the transportation of passengers and goods to and from the area.
In 1904, the Philipsburg and Clearfield Railroad was extended to Salt Lake City, allowing for the transportation of passengers and goods to and from the area.
In 1906, the Philipsburg and Clearfield Railroad was extended to San Francisco, allowing for the transportation of passengers and goods to and from the area.
In 1908, the Philipsburg and Clearfield Railroad was extended to Los Angeles, allowing for the transportation of passengers and goods to and from the area.
In 1910, the Philipsburg and Clearfield Railroad was extended to Seattle, allowing for the transportation of passengers and goods to and from the area.
In 1912, the Philipsburg and Clearfield Railroad was extended to Vancouver, allowing for the transportation of passengers and goods to and from the area.
In 1913, the Philipsburg and Clearfield Railroad was extended to Portland, allowing for the transportation of passengers and goods to and from the area.
In 1915, the Philipsburg and Clearfield Railroad was extended to Spokane, allowing for the transportation of passengers and goods to and from the area.
In 1917, the Philipsburg and Clearfield Railroad was extended to Boise, allowing for the transportation of passengers and goods to and from the area.
In 1919, the Philipsburg and Clearfield Railroad was extended to Salt Lake City, allowing for the transportation of passengers and goods to and from the area.
In 1921, the Philipsburg and Clearfield Railroad was extended to San Francisco, allowing for the transportation of passengers and goods to and from the area.
In 1923, the Philipsburg and Clearfield Railroad was extended to Los Angeles, allowing for the transportation of passengers and goods to and from the area.
In 1925, the Philipsburg and Clearfield Railroad was extended to Seattle, allowing for the transportation of passengers and goods to and from the area.
In 1927, the Philipsburg and Clearfield Railroad was extended to Vancouver, allowing for the transportation of passengers and goods to and from the area.
In 1929, the Philipsburg and Clearfield Railroad was extended to Portland, allowing for the transportation of passengers and goods to and from the area.
In 1931, the Philipsburg and Clearfield Railroad was extended to Spokane, allowing for the transportation of passengers and goods to and from the area.
In 1933, the Philipsburg and Clearfield Railroad was extended to Boise, allowing for the transportation of passengers and goods to and from the area.
In 1935, the Philipsburg and Clearfield Railroad was extended to Salt Lake City, allowing for the transportation of passengers and goods to and from the area.
In 1937, the Philipsburg and Clearfield Railroad was extended to San Francisco, allowing for the transportation of passengers and goods to and from the area.
In 1939, the Philipsburg and Clearfield Railroad was extended to Los Angeles, allowing for the transportation of passengers and goods to and from the area.
In 1941, the Philipsburg and Clearfield Railroad was extended to Seattle, allowing for the transportation of passengers and goods to and from the area.
In 1943, the Philipsburg and Clearfield Railroad was extended to Vancouver, allowing for the transportation of passengers and goods to and from the area.
In 1945, the Philipsburg and Clearfield Railroad was extended to Portland, allowing for the transportation of passengers and goods to and from the area.
In 1947, the Philipsburg and Clearfield Railroad was extended to Spokane, allowing for the transportation of passengers and goods to and from the area.
In 1949, the Philipsburg and Clearfield Railroad was extended to Boise, allowing for the transportation of passengers and goods to and from the area.
In 1951, the Philipsburg and Clearfield Railroad was extended to Salt Lake City, allowing for the transportation of passengers and goods to and from the area.
In 1953, the Philipsburg and Clearfield Railroad was extended to San Francisco, allowing for the transportation of passengers and goods to and from the area.
In 1955, the Philipsburg and Clearfield Railroad was extended to Los Angeles, allowing for the transportation of passengers and goods to and from the area.
In 1957, the Philipsburg and Clearfield Railroad was extended to Seattle, allowing for the transportation of passengers and goods to and from the area.
In 1959, the Philipsburg and Clearfield Railroad was extended to Vancouver, allowing for the transportation of passengers and goods to and from the area.
In 1961, the Philipsburg and Clearfield Railroad was extended to Portland, allowing for the transportation of passengers and goods to and from the area.
In 1963, the Philipsburg and Clearfield Railroad was extended to Spokane, allowing for the transportation of passengers and goods to and from the area.
In 1965, the Philipsburg and Clearfield Railroad was extended to Boise, allowing for the transportation of passengers and goods to and from the area.
In 1967, the Philipsburg and Clearfield Railroad was extended to Salt Lake City, allowing for the transportation of passengers and goods to and from the area.
In 1969, the Philipsburg and Clearfield Railroad was extended to San Francisco, allowing for the transportation of passengers and goods to and from the area.
In 1971, the Philipsburg and Clearfield Railroad was extended to Los Angeles, allowing for the transportation of passengers and goods to and from the area.
In 1973, the Philipsburg and Clearfield Railroad was extended to Seattle, allowing for the transportation of passengers and goods to and from the area.
In 1975, the Philipsburg and Clearfield Railroad was extended to Vancouver, allowing for the transportation of passengers and goods to and from the area.
In 1977, the Philipsburg and Clearfield Railroad was extended to Portland, allowing for the transportation of passengers and goods to and from the area.
In 1979, the Philipsburg and Clearfield Railroad was extended to Spokane, allowing for the transportation of passengers and goods to and from the area.
In 1981, the Philipsburg and Clearfield Railroad was extended to Boise, allowing for the transportation of passengers and goods to and from the area.
In 1983, the Philipsburg and Clearfield Railroad was extended to Salt Lake City, allowing for the transportation of passengers and goods to and from the area.
In 1985, the Philipsburg and Clearfield Railroad was extended to San Francisco, allowing for the transportation of passengers and goods to and from the area.
In 1987, the Philipsburg and Clearfield Railroad was extended to Los Angeles, allowing for the transportation of passengers and goods to and from the area.
In 1989, the Philipsburg and Clearfield Railroad was extended to Seattle, allowing for the transportation of passengers and goods to and from the area.
In 1991, the Philipsburg and Clearfield Railroad was extended to Vancouver, allowing for the transportation of passengers and goods to and from the area.
In 1993, the Philipsburg and Clearfield Railroad was extended to Portland, allowing for the transportation of passengers and goods to and from the area.
In 1995, the Philipsburg and Clearfield Railroad was extended to Spokane, allowing for the transportation of passengers and goods to and from the area.
In 1997, the Philipsburg and Clearfield Railroad was extended to Boise, allowing for the transportation of passengers and goods to and from the area.
In 1999, the Philipsburg and Clearfield Railroad was extended to Salt Lake City, allowing for the transportation of passengers and goods to and from the area.
In 2000, the Philipsburg and Clearfield Railroad was extended to San Francisco, allowing for the transportation of passengers and goods to and from the area.
Geography
Philipsburg is located at 40°51'17" North, 78°2'17" West (40.854722, -78.038333). According to the United States Census Bureau, the borough has a total area of 1.2 square miles (3.1 km2), all of it land.
The borough is located in the Moshannon Valley, which is part of the Allegheny Plateau. The valley is surrounded by mountains, including Bald Eagle Mountain to the east and Nittany Mountain to the west. The Moshannon Creek flows through the valley and is a tributary of the Susquehanna River.
Economy
The economy of Philipsburg is largely based on the service industry. The borough is home to several restaurants, bars, and retail stores. The Philipsburg-Osceola Area School District is the largest employer in the area.
The Philipsburg and Clearfield Railroad, which was built in 1854, is still in operation and is used to transport coal and other goods to and from the area.
Demographics
As of the 2010 census, there were 2,817 people, 1,093 households, and 690 families residing in the borough. The population density was 2,346.7 people per square mile (906.2/km2). There were 1,183 housing units at an average density of 976.7 per square mile (377.3/km2). The racial makeup of the borough was 97.2% White, 0.7% African American, 0.2% Native American, 0.4% Asian, 0.1% Pacific Islander, 0.4% from other races, and 1.0% from two or more races. Hispanic or Latino of any race were 1.2% of the population.
There were 1,093 households, out of which 28.2% had children under the age of 18 living with them, 46.2% were married couples living together, 12.7% had a female householder with no husband present, and 36.2% were non-families. 30.7% of all households were made up of individuals, and 14.2% had someone living alone who was 65 years of age or older. The average household size was 2.41 and the average family size was 3.00.
In the borough, the population was spread out, with 22.7% under the age of 18, 8.2% from 18 to 24, 27.2% from 25 to 44, 24.2% from 45 to 64, and 17.7% who were 65 years of age or older. The median age was 39 years. For every 100 females, there were 91.2 males. For every 100 females age 18 and over, there were 88.2 males.
The median income for a household in the borough was $35,938, and the median income for a family was $45,000. Males had a median income of $31,250 versus $22,500 for females. The per capita income for the borough was $17,845. About 8.2% of families and 11.2% of the population were below the poverty line, including 15.2% of those under age 18 and 8.2% of those age 65 or over.
Common Questions
What is Per Capita Income in South Philipsburg?
Per Capita income in South Philipsburg is $28,530.
What is the Median Family Income in South Philipsburg?
Median Family Income in South Philipsburg is $67,115.
What is the Median Household income in South Philipsburg?
Median Household Income in South Philipsburg is $56,773.
What is Income or Wage Gap in South Philipsburg?
Income or Wage Gap in South Philipsburg is 3.3%.
Women in South Philipsburg earn 96.7 cents for every dollar earned by a man.
What is Inequality or Gini Index in South Philipsburg?
Inequality or Gini Index in South Philipsburg is 0.39.
What is the Total Population of South Philipsburg?
Total Population of South Philipsburg is 545.
What is the Total Male Population of South Philipsburg?
Total Male Population of South Philipsburg is 210.
What is the Total Female Population of South Philipsburg?
Total Female Population of South Philipsburg is 335.
What is the Ratio of Males per 100 Females in South Philipsburg?
There are 62.69 Males per 100 Females in South Philipsburg.
What is the Ratio of Females per 100 Males in South Philipsburg?
There are 159.52 Females per 100 Males in South Philipsburg.
What is the Median Population Age in South Philipsburg?
Median Population Age in South Philipsburg is 45.8 Years.
What is the Average Family Size in South Philipsburg
Average Family Size in South Philipsburg is 3.3 People.
What is the Average Household Size in South Philipsburg
Average Household Size in South Philipsburg is 2.6 People.
How Large is the Labor Force in South Philipsburg?
There are 162 People in the Labor Forcein in South Philipsburg.
What is the Percentage of People in the Labor Force in South Philipsburg?
32.6% of People are in the Labor Force in South Philipsburg.