Johnstown, PA Map & Demographics
Johnstown Map
Johnstown Overview
$21,488
PER CAPITA INCOME
$41,734
AVG FAMILY INCOME
$33,466
AVG HOUSEHOLD INCOME
20.1%
WAGE / INCOME GAP [ % ]
79.9¢/ $1
WAGE / INCOME GAP [ $ ]
$11,445
FAMILY INCOME DEFICIT
0.46
INEQUALITY / GINI INDEX
18,429
TOTAL POPULATION
8,886
MALE POPULATION
9,543
FEMALE POPULATION
93.12
MALES / 100 FEMALES
107.39
FEMALES / 100 MALES
44.0
MEDIAN AGE
3.0
AVG FAMILY SIZE
2.0
AVG HOUSEHOLD SIZE
7,887
LABOR FORCE [ PEOPLE ]
53.3%
PERCENT IN LABOR FORCE
7.1%
UNEMPLOYMENT RATE
Johnstown Area Codes
Income in Johnstown
Income Overview in Johnstown
Per Capita Income in Johnstown is $21,488, while median incomes of families and households are $41,734 and $33,466 respectively.
| Characteristic | Number | Measure |
| Per Capita Income | 18,429 | $21,488 |
| Median Family Income | 4,200 | $41,734 |
| Mean Family Income | 4,200 | $53,966 |
| Median Household Income | 9,061 | $33,466 |
| Mean Household Income | 9,061 | $42,726 |
| Income Deficit | 4,200 | $11,445 |
| Wage / Income Gap (%) | 18,429 | 20.11% |
| Wage / Income Gap ($) | 18,429 | 79.89¢ per $1 |
| Gini / Inequality Index | 18,429 | 0.46 |
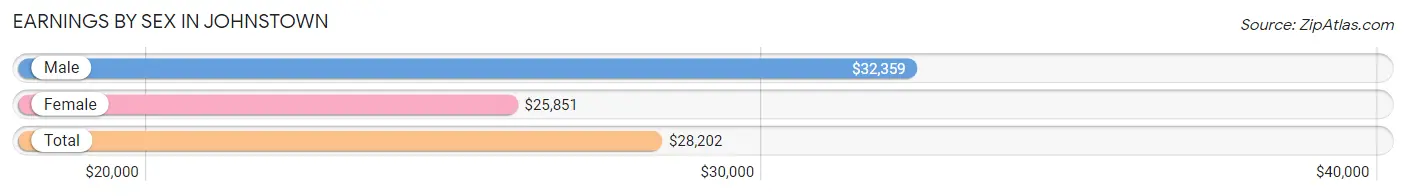
Earnings by Sex in Johnstown
Average Earnings in Johnstown are $28,202, $32,359 for men and $25,851 for women, a difference of 20.1%.
| Sex | Number | Average Earnings |
| Male | 3,903 (47.2%) | $32,359 |
| Female | 4,367 (52.8%) | $25,851 |
| Total | 8,270 (100.0%) | $28,202 |
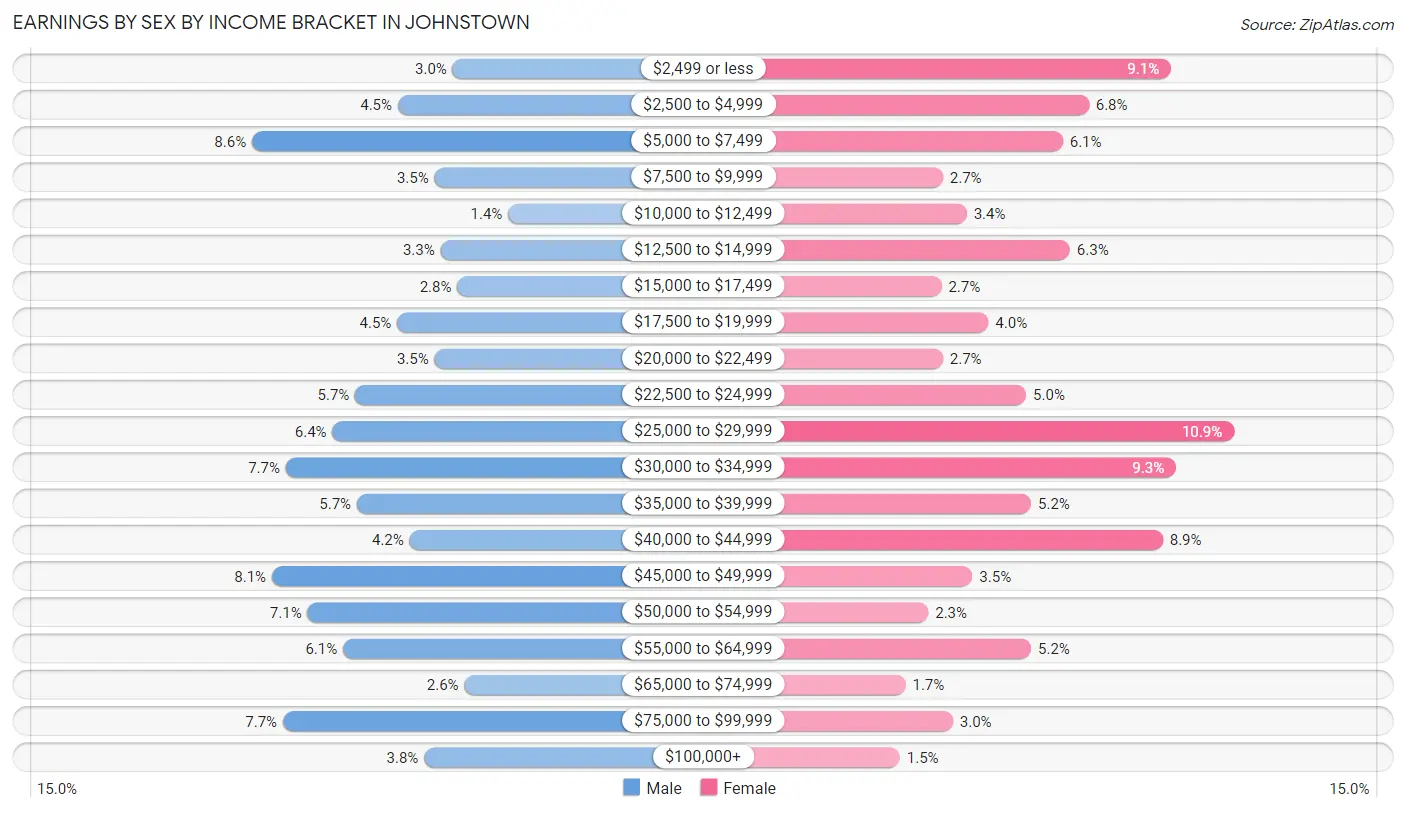
Earnings by Sex by Income Bracket in Johnstown
The most common earnings brackets in Johnstown are $5,000 to $7,499 for men (336 | 8.6%) and $25,000 to $29,999 for women (475 | 10.9%).
| Income | Male | Female |
| $2,499 or less | 116 (3.0%) | 398 (9.1%) |
| $2,500 to $4,999 | 176 (4.5%) | 297 (6.8%) |
| $5,000 to $7,499 | 336 (8.6%) | 265 (6.1%) |
| $7,500 to $9,999 | 136 (3.5%) | 118 (2.7%) |
| $10,000 to $12,499 | 55 (1.4%) | 147 (3.4%) |
| $12,500 to $14,999 | 129 (3.3%) | 274 (6.3%) |
| $15,000 to $17,499 | 111 (2.8%) | 116 (2.7%) |
| $17,500 to $19,999 | 177 (4.5%) | 174 (4.0%) |
| $20,000 to $22,499 | 136 (3.5%) | 118 (2.7%) |
| $22,500 to $24,999 | 223 (5.7%) | 220 (5.0%) |
| $25,000 to $29,999 | 248 (6.4%) | 475 (10.9%) |
| $30,000 to $34,999 | 299 (7.7%) | 404 (9.2%) |
| $35,000 to $39,999 | 221 (5.7%) | 226 (5.2%) |
| $40,000 to $44,999 | 163 (4.2%) | 388 (8.9%) |
| $45,000 to $49,999 | 314 (8.1%) | 154 (3.5%) |
| $50,000 to $54,999 | 275 (7.0%) | 100 (2.3%) |
| $55,000 to $64,999 | 236 (6.0%) | 226 (5.2%) |
| $65,000 to $74,999 | 103 (2.6%) | 72 (1.7%) |
| $75,000 to $99,999 | 302 (7.7%) | 130 (3.0%) |
| $100,000+ | 147 (3.8%) | 65 (1.5%) |
| Total | 3,903 (100.0%) | 4,367 (100.0%) |
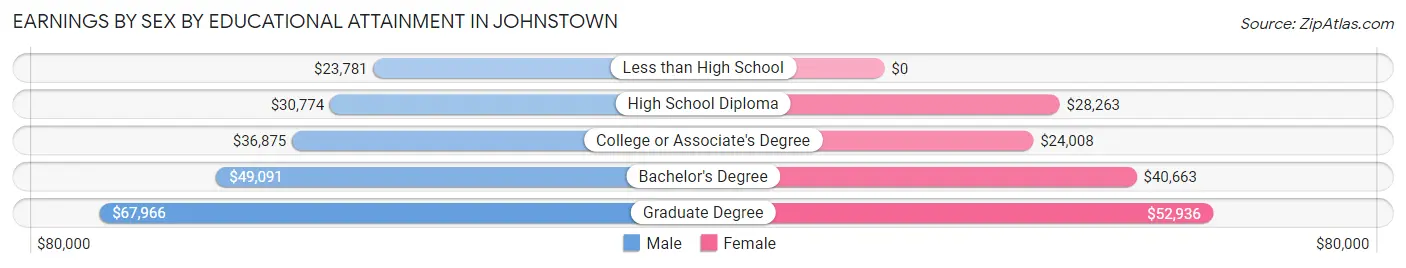
Earnings by Sex by Educational Attainment in Johnstown
Average earnings in Johnstown are $34,503 for men and $28,779 for women, a difference of 16.6%. Men with an educational attainment of graduate degree enjoy the highest average annual earnings of $67,966, while those with less than high school education earn the least with $23,781. Women with an educational attainment of graduate degree earn the most with the average annual earnings of $52,936, while those with college or associate's degree education have the smallest earnings of $24,008.
| Educational Attainment | Male Income | Female Income |
| Less than High School | $23,781 | $0 |
| High School Diploma | $30,774 | $28,263 |
| College or Associate's Degree | $36,875 | $24,008 |
| Bachelor's Degree | $49,091 | $40,663 |
| Graduate Degree | $67,966 | $52,936 |
| Total | $34,503 | $28,779 |
Family Income in Johnstown
Family Income Brackets in Johnstown
According to the Johnstown family income data, there are 798 families falling into the $50,000 to $74,999 income range, which is the most common income bracket and makes up 19.0% of all families. Conversely, the $200,000+ income bracket is the least frequent group with only 42 families (1.0%) belonging to this category.
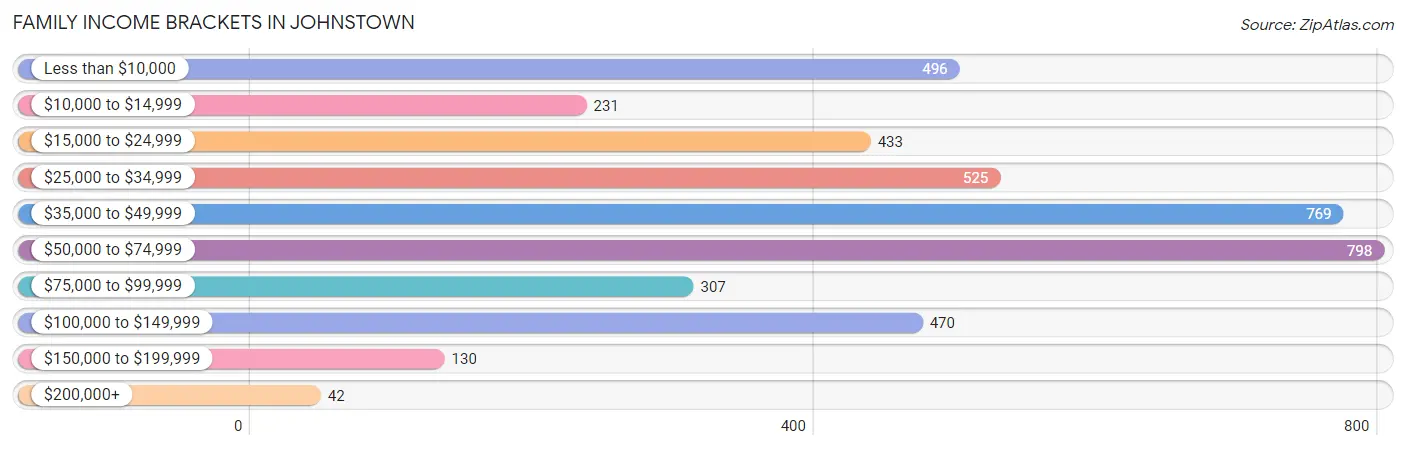
| Income Bracket | # Families | % Families |
| Less than $10,000 | 496 | 11.8% |
| $10,000 to $14,999 | 231 | 5.5% |
| $15,000 to $24,999 | 433 | 10.3% |
| $25,000 to $34,999 | 525 | 12.5% |
| $35,000 to $49,999 | 769 | 18.3% |
| $50,000 to $74,999 | 798 | 19.0% |
| $75,000 to $99,999 | 307 | 7.3% |
| $100,000 to $149,999 | 470 | 11.2% |
| $150,000 to $199,999 | 130 | 3.1% |
| $200,000+ | 42 | 1.0% |
Family Income by Famaliy Size in Johnstown
5-person families (336 | 8.0%) account for the highest median family income in Johnstown with $72,917 per family, while 2-person families (2,328 | 55.4%) have the highest median income of $20,318 per family member.
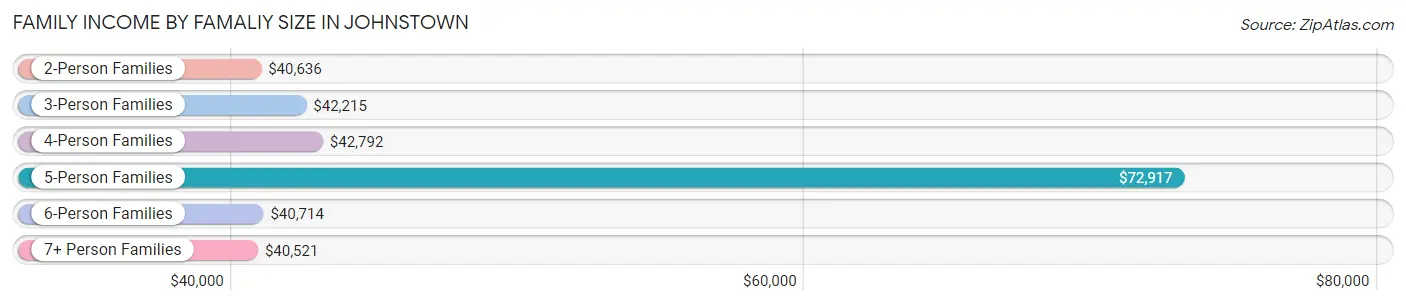
| Income Bracket | # Families | Median Income |
| 2-Person Families | 2,328 (55.4%) | $40,636 |
| 3-Person Families | 946 (22.5%) | $42,215 |
| 4-Person Families | 489 (11.6%) | $42,792 |
| 5-Person Families | 336 (8.0%) | $72,917 |
| 6-Person Families | 18 (0.4%) | $40,714 |
| 7+ Person Families | 83 (2.0%) | $40,521 |
| Total | 4,200 (100.0%) | $41,734 |
Family Income by Number of Earners in Johnstown
The median family income in Johnstown is $41,734, with families comprising 3+ earners (319) having the highest median family income of $94,276, while families with no earners (1,061) have the lowest median family income of $22,198, accounting for 7.6% and 25.3% of families, respectively.
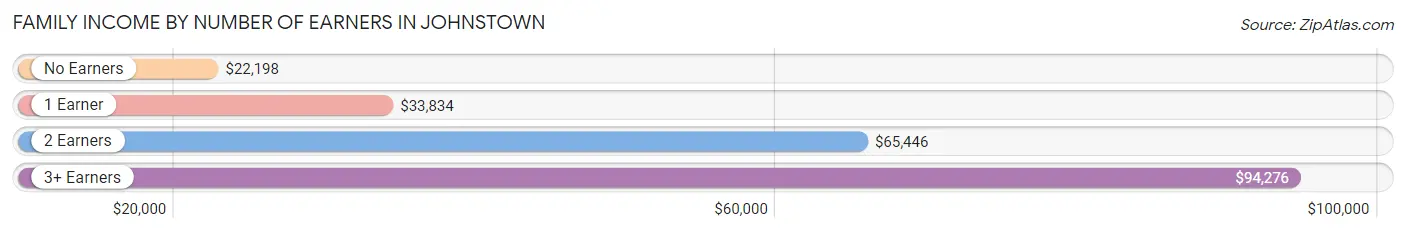
| Number of Earners | # Families | Median Income |
| No Earners | 1,061 (25.3%) | $22,198 |
| 1 Earner | 1,535 (36.5%) | $33,834 |
| 2 Earners | 1,285 (30.6%) | $65,446 |
| 3+ Earners | 319 (7.6%) | $94,276 |
| Total | 4,200 (100.0%) | $41,734 |
Household Income in Johnstown
Household Income Brackets in Johnstown
With 1,767 households falling in the category, the $35,000 to $49,999 income range is the most frequent in Johnstown, accounting for 19.5% of all households. In contrast, only 54 households (0.6%) fall into the $200,000+ income bracket, making it the least populous group.
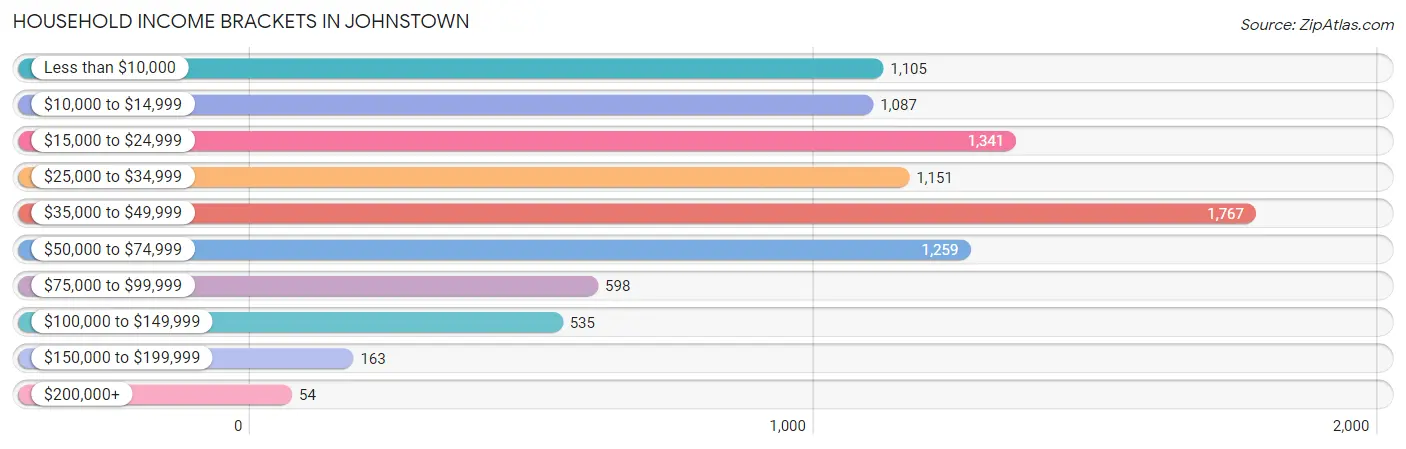
| Income Bracket | # Households | % Households |
| Less than $10,000 | 1,105 | 12.2% |
| $10,000 to $14,999 | 1,087 | 12.0% |
| $15,000 to $24,999 | 1,341 | 14.8% |
| $25,000 to $34,999 | 1,151 | 12.7% |
| $35,000 to $49,999 | 1,767 | 19.5% |
| $50,000 to $74,999 | 1,259 | 13.9% |
| $75,000 to $99,999 | 598 | 6.6% |
| $100,000 to $149,999 | 535 | 5.9% |
| $150,000 to $199,999 | 163 | 1.8% |
| $200,000+ | 54 | 0.6% |
Household Income by Householder Age in Johnstown
The median household income in Johnstown is $33,466, with the highest median household income of $40,054 found in the 45 to 64 years age bracket for the primary householder. A total of 3,828 households (42.2%) fall into this category. Meanwhile, the 15 to 24 years age bracket for the primary householder has the lowest median household income of $0, with 275 households (3.0%) in this group.
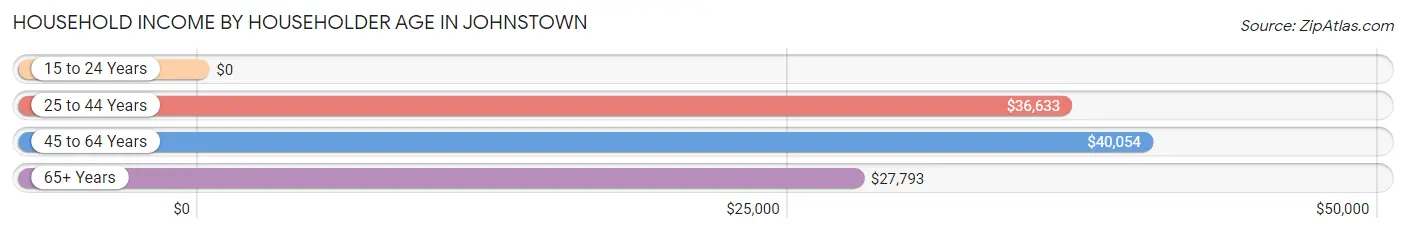
| Income Bracket | # Households | Median Income |
| 15 to 24 Years | 275 (3.0%) | $0 |
| 25 to 44 Years | 2,344 (25.9%) | $36,633 |
| 45 to 64 Years | 3,828 (42.2%) | $40,054 |
| 65+ Years | 2,614 (28.8%) | $27,793 |
| Total | 9,061 (100.0%) | $33,466 |
Poverty in Johnstown
Income Below Poverty by Sex and Age in Johnstown
With 30.8% poverty level for males and 34.8% for females among the residents of Johnstown, 6 to 11 year old males and 12 to 14 year old females are the most vulnerable to poverty, with 609 males (62.6%) and 258 females (72.9%) in their respective age groups living below the poverty level.
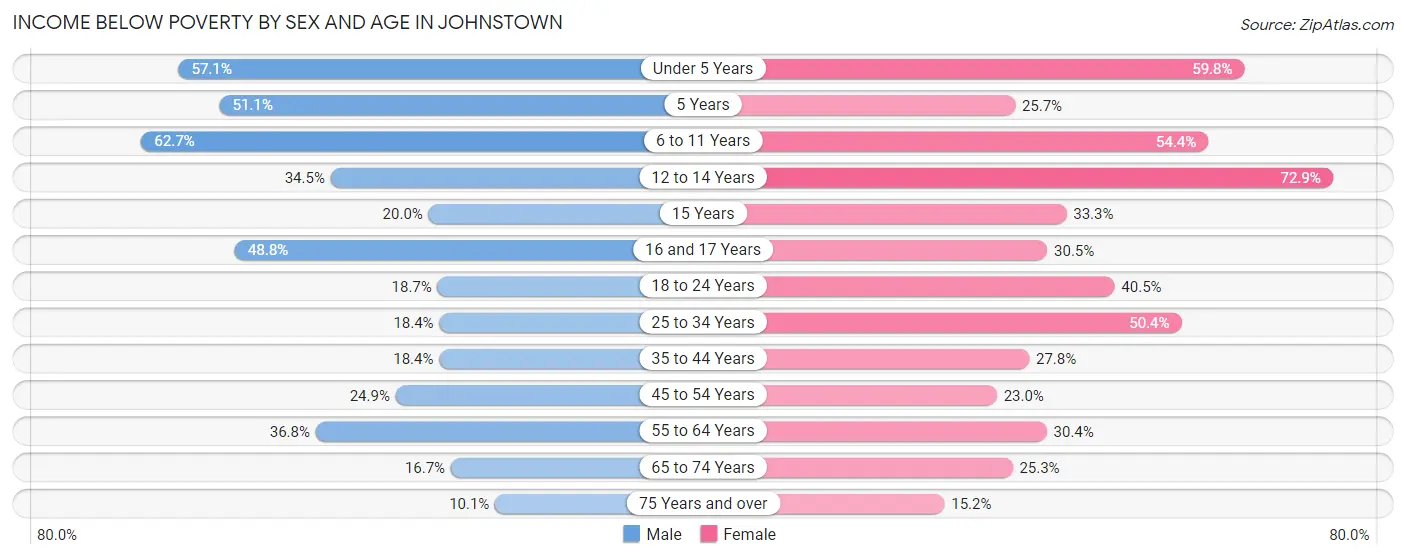
| Age Bracket | Male | Female |
| Under 5 Years | 272 (57.1%) | 254 (59.8%) |
| 5 Years | 97 (51.0%) | 18 (25.7%) |
| 6 to 11 Years | 609 (62.6%) | 378 (54.4%) |
| 12 to 14 Years | 105 (34.5%) | 258 (72.9%) |
| 15 Years | 19 (20.0%) | 6 (33.3%) |
| 16 and 17 Years | 119 (48.8%) | 100 (30.5%) |
| 18 to 24 Years | 76 (18.7%) | 234 (40.5%) |
| 25 to 34 Years | 189 (18.4%) | 607 (50.4%) |
| 35 to 44 Years | 156 (18.4%) | 282 (27.8%) |
| 45 to 54 Years | 329 (24.9%) | 281 (23.0%) |
| 55 to 64 Years | 550 (36.8%) | 450 (30.4%) |
| 65 to 74 Years | 148 (16.7%) | 298 (25.3%) |
| 75 Years and over | 59 (10.1%) | 145 (15.2%) |
| Total | 2,728 (30.8%) | 3,311 (34.8%) |
Income Above Poverty by Sex and Age in Johnstown
According to the poverty statistics in Johnstown, males aged 75 years and over and females aged 75 years and over are the age groups that are most secure financially, with 89.9% of males and 84.8% of females in these age groups living above the poverty line.
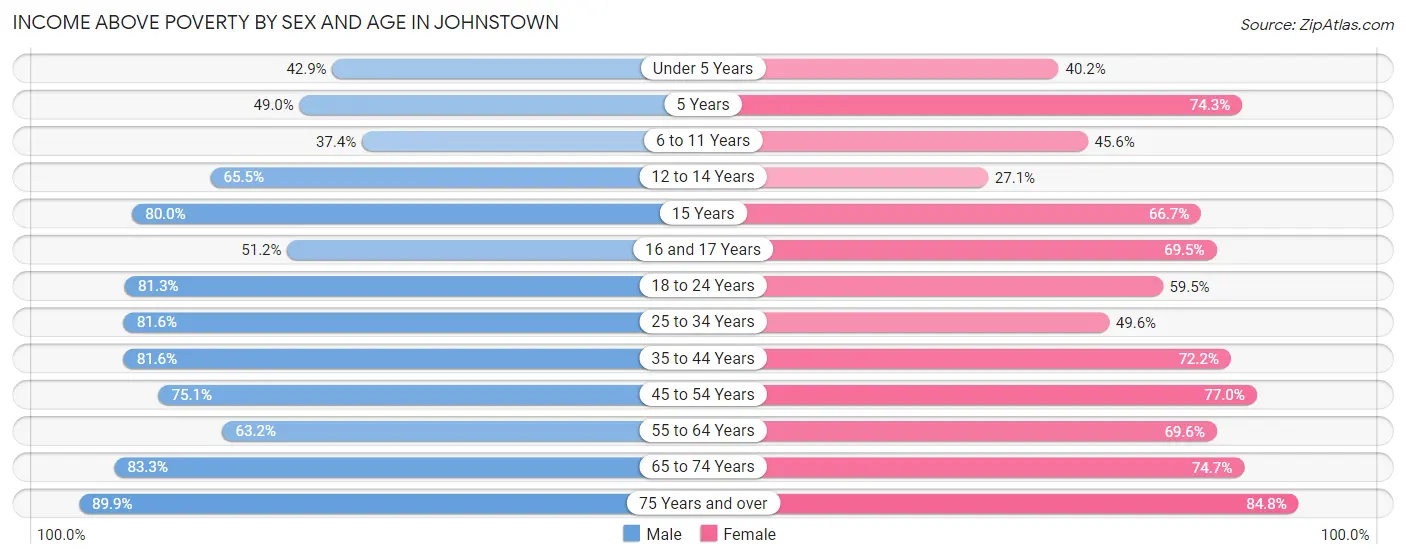
| Age Bracket | Male | Female |
| Under 5 Years | 204 (42.9%) | 171 (40.2%) |
| 5 Years | 93 (48.9%) | 52 (74.3%) |
| 6 to 11 Years | 363 (37.3%) | 317 (45.6%) |
| 12 to 14 Years | 199 (65.5%) | 96 (27.1%) |
| 15 Years | 76 (80.0%) | 12 (66.7%) |
| 16 and 17 Years | 125 (51.2%) | 228 (69.5%) |
| 18 to 24 Years | 331 (81.3%) | 344 (59.5%) |
| 25 to 34 Years | 838 (81.6%) | 597 (49.6%) |
| 35 to 44 Years | 691 (81.6%) | 732 (72.2%) |
| 45 to 54 Years | 993 (75.1%) | 941 (77.0%) |
| 55 to 64 Years | 946 (63.2%) | 1,030 (69.6%) |
| 65 to 74 Years | 739 (83.3%) | 878 (74.7%) |
| 75 Years and over | 524 (89.9%) | 808 (84.8%) |
| Total | 6,122 (69.2%) | 6,206 (65.2%) |
Income Below Poverty Among Married-Couple Families in Johnstown
The poverty statistics for married-couple families in Johnstown show that 10.3% or 217 of the total 2,112 families live below the poverty line. Families with 3 or 4 children have the highest poverty rate of 10.7%, comprising of 16 families. On the other hand, families with 1 or 2 children have the lowest poverty rate of 9.0%, which includes 33 families.
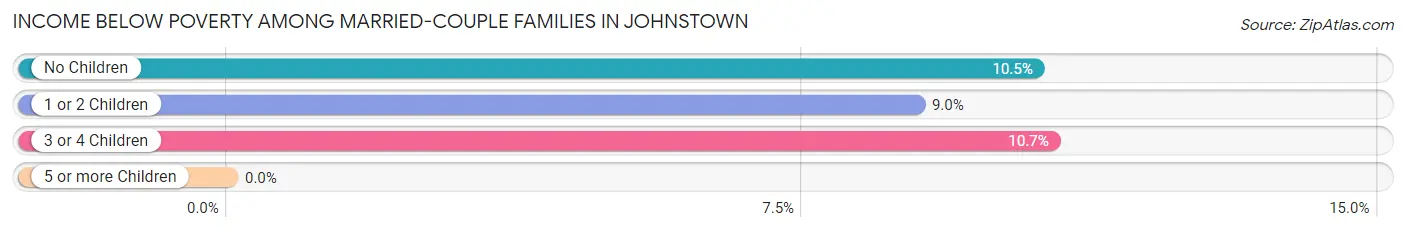
| Children | Above Poverty | Below Poverty |
| No Children | 1,427 (89.5%) | 168 (10.5%) |
| 1 or 2 Children | 335 (91.0%) | 33 (9.0%) |
| 3 or 4 Children | 133 (89.3%) | 16 (10.7%) |
| 5 or more Children | 0 (0.0%) | 0 (0.0%) |
| Total | 1,895 (89.7%) | 217 (10.3%) |
Income Below Poverty Among Single-Parent Households in Johnstown
According to the poverty data in Johnstown, 33.3% or 151 single-father households and 50.6% or 827 single-mother households are living below the poverty line. Among single-father households, those with 3 or 4 children have the highest poverty rate, with 42 households (100.0%) experiencing poverty. Likewise, among single-mother households, those with 5 or more children have the highest poverty rate, with 38 households (100.0%) falling below the poverty line.
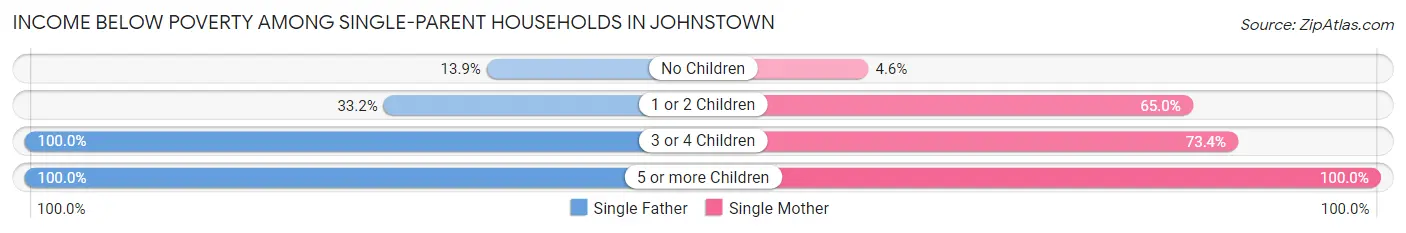
| Children | Single Father | Single Mother |
| No Children | 29 (13.9%) | 21 (4.6%) |
| 1 or 2 Children | 61 (33.2%) | 547 (65.0%) |
| 3 or 4 Children | 42 (100.0%) | 221 (73.4%) |
| 5 or more Children | 19 (100.0%) | 38 (100.0%) |
| Total | 151 (33.3%) | 827 (50.6%) |
Income Below Poverty Among Married-Couple vs Single-Parent Households in Johnstown
The poverty data for Johnstown shows that 217 of the married-couple family households (10.3%) and 978 of the single-parent households (46.8%) are living below the poverty level. Within the married-couple family households, those with 3 or 4 children have the highest poverty rate, with 16 households (10.7%) falling below the poverty line. Among the single-parent households, those with 5 or more children have the highest poverty rate, with 57 household (100.0%) living below poverty.
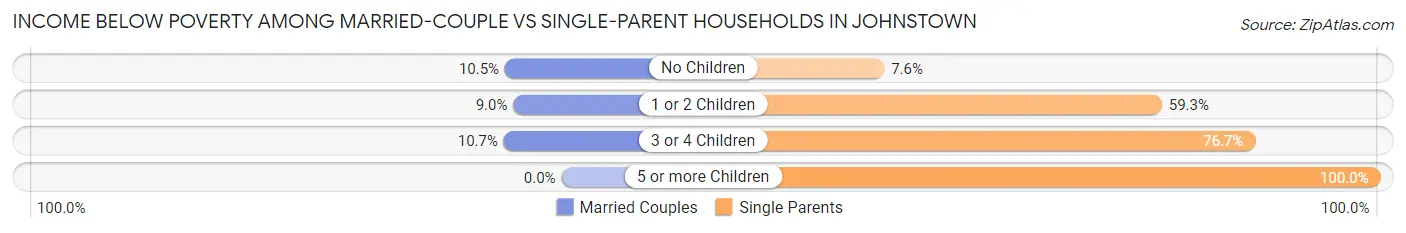
| Children | Married-Couple Families | Single-Parent Households |
| No Children | 168 (10.5%) | 50 (7.5%) |
| 1 or 2 Children | 33 (9.0%) | 608 (59.3%) |
| 3 or 4 Children | 16 (10.7%) | 263 (76.7%) |
| 5 or more Children | 0 (0.0%) | 57 (100.0%) |
| Total | 217 (10.3%) | 978 (46.8%) |
Race in Johnstown
The most populous races in Johnstown are White / Caucasian (13,336 | 72.4%), Black / African American (3,100 | 16.8%), and Two or more Races (1,585 | 8.6%).
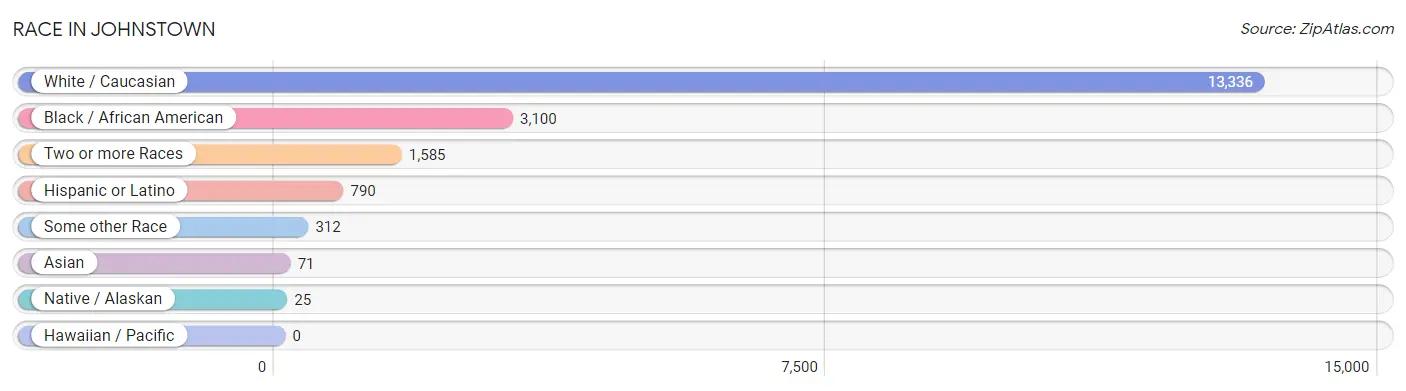
| Race | # Population | % Population |
| Asian | 71 | 0.4% |
| Black / African American | 3,100 | 16.8% |
| Hawaiian / Pacific | 0 | 0.0% |
| Hispanic or Latino | 790 | 4.3% |
| Native / Alaskan | 25 | 0.1% |
| White / Caucasian | 13,336 | 72.4% |
| Two or more Races | 1,585 | 8.6% |
| Some other Race | 312 | 1.7% |
| Total | 18,429 | 100.0% |
Ancestry in Johnstown
The most populous ancestries reported in Johnstown are German (4,087 | 22.2%), Irish (2,342 | 12.7%), Italian (1,797 | 9.8%), Polish (1,656 | 9.0%), and English (1,236 | 6.7%), together accounting for 60.3% of all Johnstown residents.
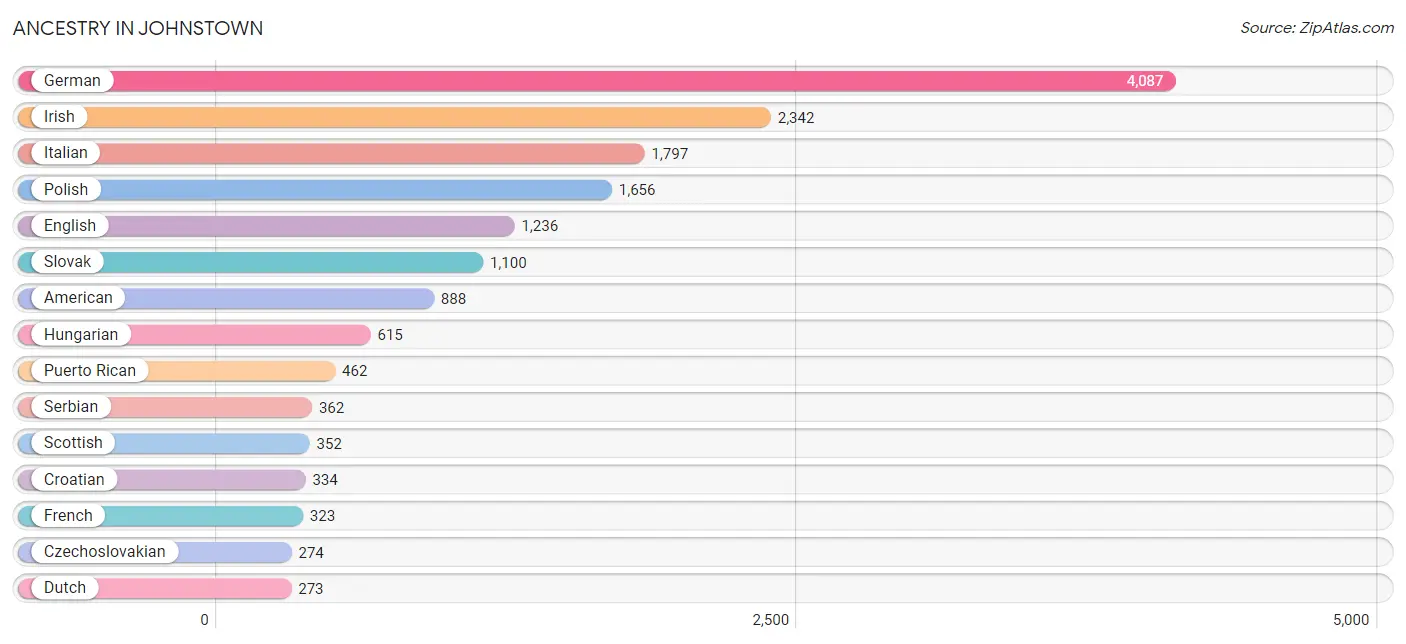
| Ancestry | # Population | % Population |
| African | 47 | 0.3% |
| American | 888 | 4.8% |
| Apache | 5 | 0.0% |
| Arab | 90 | 0.5% |
| Argentinean | 7 | 0.0% |
| Austrian | 40 | 0.2% |
| Bhutanese | 11 | 0.1% |
| Brazilian | 31 | 0.2% |
| British | 41 | 0.2% |
| Burmese | 6 | 0.0% |
| Carpatho Rusyn | 52 | 0.3% |
| Celtic | 29 | 0.2% |
| Cherokee | 166 | 0.9% |
| Chilean | 12 | 0.1% |
| Comanche | 12 | 0.1% |
| Croatian | 334 | 1.8% |
| Cuban | 21 | 0.1% |
| Czech | 78 | 0.4% |
| Czechoslovakian | 274 | 1.5% |
| Dominican | 47 | 0.3% |
| Dutch | 273 | 1.5% |
| Eastern European | 3 | 0.0% |
| English | 1,236 | 6.7% |
| European | 177 | 1.0% |
| French | 323 | 1.8% |
| French Canadian | 74 | 0.4% |
| German | 4,087 | 22.2% |
| Greek | 10 | 0.1% |
| Haitian | 59 | 0.3% |
| Hungarian | 615 | 3.3% |
| Indian (Asian) | 84 | 0.5% |
| Irish | 2,342 | 12.7% |
| Italian | 1,797 | 9.8% |
| Jamaican | 25 | 0.1% |
| Korean | 7 | 0.0% |
| Lebanese | 66 | 0.4% |
| Mexican | 189 | 1.0% |
| Moroccan | 24 | 0.1% |
| Norwegian | 25 | 0.1% |
| Pennsylvania German | 249 | 1.3% |
| Polish | 1,656 | 9.0% |
| Puerto Rican | 462 | 2.5% |
| Romanian | 4 | 0.0% |
| Russian | 123 | 0.7% |
| Scotch-Irish | 249 | 1.3% |
| Scottish | 352 | 1.9% |
| Serbian | 362 | 2.0% |
| Sioux | 12 | 0.1% |
| Slavic | 131 | 0.7% |
| Slovak | 1,100 | 6.0% |
| Slovene | 106 | 0.6% |
| South American | 19 | 0.1% |
| Sri Lankan | 51 | 0.3% |
| Subsaharan African | 47 | 0.3% |
| Swedish | 52 | 0.3% |
| Swiss | 7 | 0.0% |
| Tlingit-Haida | 2 | 0.0% |
| Ukrainian | 64 | 0.4% |
| Welsh | 180 | 1.0% |
| West Indian | 10 | 0.1% |
| Yugoslavian | 15 | 0.1% | View All 61 Rows |
Immigrants in Johnstown
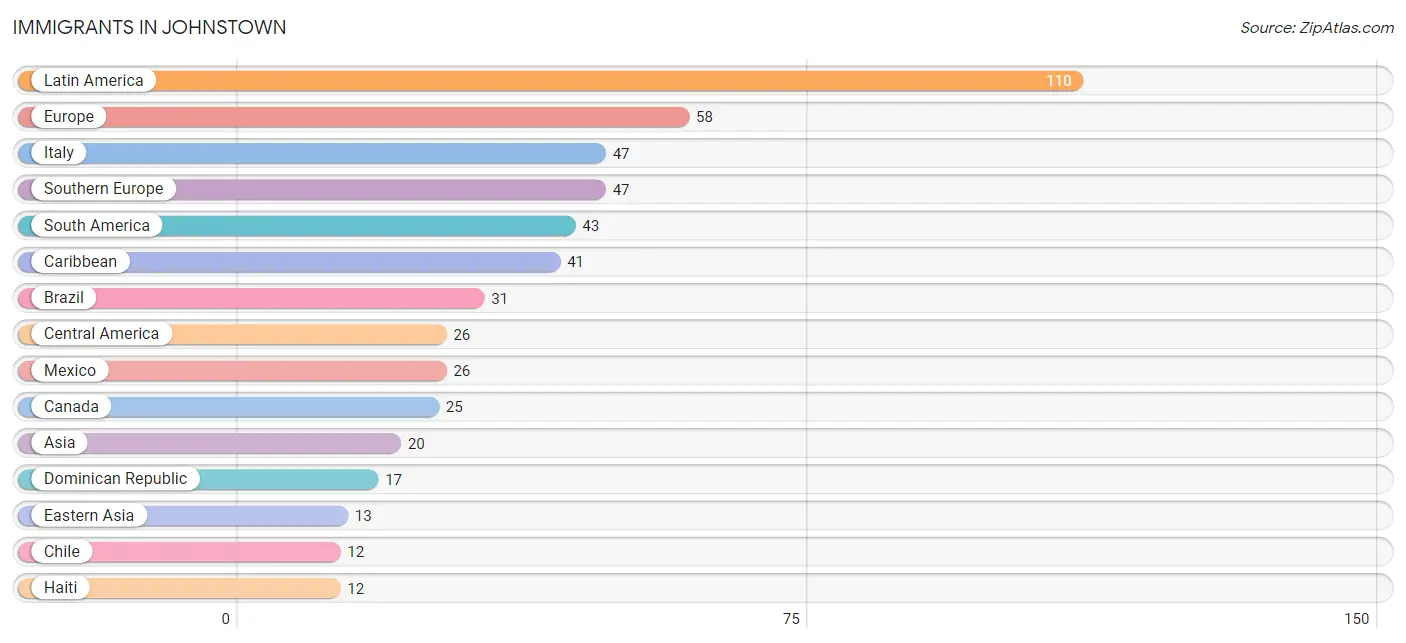
The most numerous immigrant groups reported in Johnstown came from Latin America (110 | 0.6%), Europe (58 | 0.3%), Italy (47 | 0.3%), Southern Europe (47 | 0.3%), and South America (43 | 0.2%), together accounting for 1.7% of all Johnstown residents.
| Immigration Origin | # Population | % Population |
| Africa | 9 | 0.1% |
| Asia | 20 | 0.1% |
| Brazil | 31 | 0.2% |
| Canada | 25 | 0.1% |
| Caribbean | 41 | 0.2% |
| Central America | 26 | 0.1% |
| Chile | 12 | 0.1% |
| China | 7 | 0.0% |
| Dominican Republic | 17 | 0.1% |
| Eastern Asia | 13 | 0.1% |
| Eastern Europe | 11 | 0.1% |
| Europe | 58 | 0.3% |
| Haiti | 12 | 0.1% |
| Hong Kong | 7 | 0.0% |
| Italy | 47 | 0.3% |
| Korea | 6 | 0.0% |
| Latin America | 110 | 0.6% |
| Mexico | 26 | 0.1% |
| Morocco | 9 | 0.1% |
| Northern Africa | 9 | 0.1% |
| Philippines | 7 | 0.0% |
| Poland | 1 | 0.0% |
| South America | 43 | 0.2% |
| South Eastern Asia | 7 | 0.0% |
| Southern Europe | 47 | 0.3% |
| Trinidad and Tobago | 12 | 0.1% | View All 26 Rows |
Sex and Age in Johnstown
Sex and Age in Johnstown
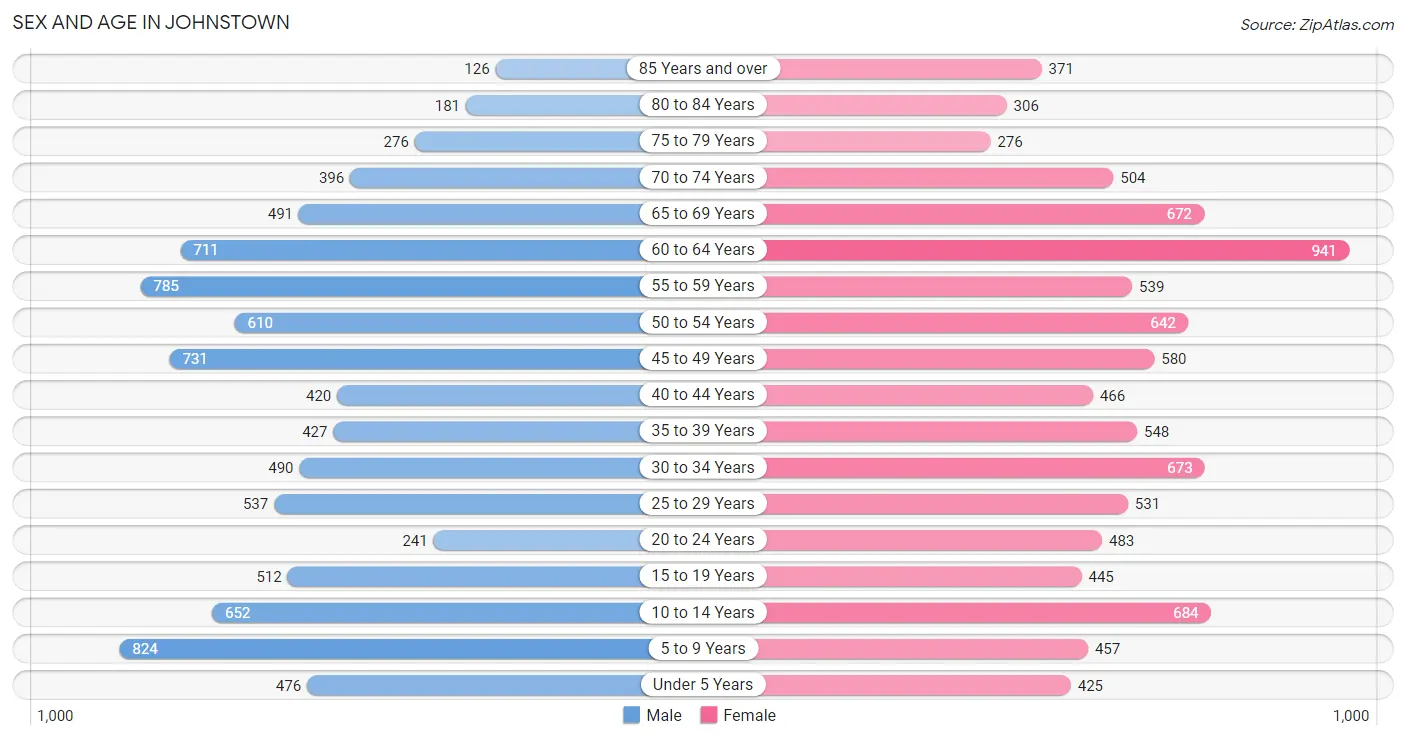
The most populous age groups in Johnstown are 5 to 9 Years (824 | 9.3%) for men and 60 to 64 Years (941 | 9.9%) for women.
| Age Bracket | Male | Female |
| Under 5 Years | 476 (5.4%) | 425 (4.4%) |
| 5 to 9 Years | 824 (9.3%) | 457 (4.8%) |
| 10 to 14 Years | 652 (7.3%) | 684 (7.2%) |
| 15 to 19 Years | 512 (5.8%) | 445 (4.7%) |
| 20 to 24 Years | 241 (2.7%) | 483 (5.1%) |
| 25 to 29 Years | 537 (6.0%) | 531 (5.6%) |
| 30 to 34 Years | 490 (5.5%) | 673 (7.0%) |
| 35 to 39 Years | 427 (4.8%) | 548 (5.7%) |
| 40 to 44 Years | 420 (4.7%) | 466 (4.9%) |
| 45 to 49 Years | 731 (8.2%) | 580 (6.1%) |
| 50 to 54 Years | 610 (6.9%) | 642 (6.7%) |
| 55 to 59 Years | 785 (8.8%) | 539 (5.7%) |
| 60 to 64 Years | 711 (8.0%) | 941 (9.9%) |
| 65 to 69 Years | 491 (5.5%) | 672 (7.0%) |
| 70 to 74 Years | 396 (4.5%) | 504 (5.3%) |
| 75 to 79 Years | 276 (3.1%) | 276 (2.9%) |
| 80 to 84 Years | 181 (2.0%) | 306 (3.2%) |
| 85 Years and over | 126 (1.4%) | 371 (3.9%) |
| Total | 8,886 (100.0%) | 9,543 (100.0%) |
Families and Households in Johnstown
Median Family Size in Johnstown
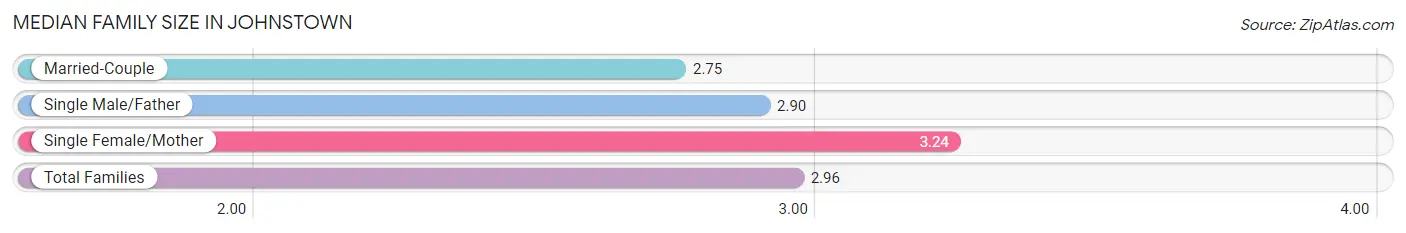
The median family size in Johnstown is 2.96 persons per family, with single female/mother families (1,635 | 38.9%) accounting for the largest median family size of 3.24 persons per family. On the other hand, married-couple families (2,112 | 50.3%) represent the smallest median family size with 2.75 persons per family.
| Family Type | # Families | Family Size |
| Married-Couple | 2,112 (50.3%) | 2.75 |
| Single Male/Father | 453 (10.8%) | 2.90 |
| Single Female/Mother | 1,635 (38.9%) | 3.24 |
| Total Families | 4,200 (100.0%) | 2.96 |
Median Household Size in Johnstown
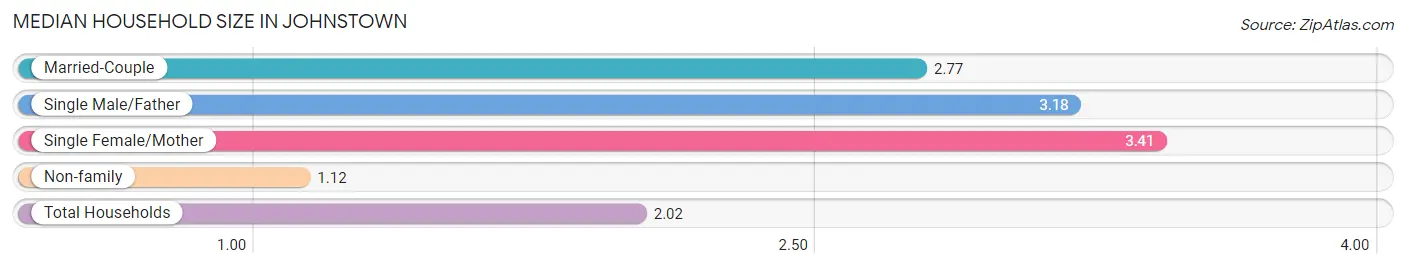
The median household size in Johnstown is 2.02 persons per household, with single female/mother households (1,635 | 18.0%) accounting for the largest median household size of 3.41 persons per household. non-family households (4,861 | 53.6%) represent the smallest median household size with 1.12 persons per household.
| Household Type | # Households | Household Size |
| Married-Couple | 2,112 (23.3%) | 2.77 |
| Single Male/Father | 453 (5.0%) | 3.18 |
| Single Female/Mother | 1,635 (18.0%) | 3.41 |
| Non-family | 4,861 (53.6%) | 1.12 |
| Total Households | 9,061 (100.0%) | 2.02 |
Household Size by Marriage Status in Johnstown
Out of a total of 9,061 households in Johnstown, 4,200 (46.4%) are family households, while 4,861 (53.6%) are nonfamily households. The most numerous type of family households are 2-person households, comprising 2,176, and the most common type of nonfamily households are 1-person households, comprising 4,447.
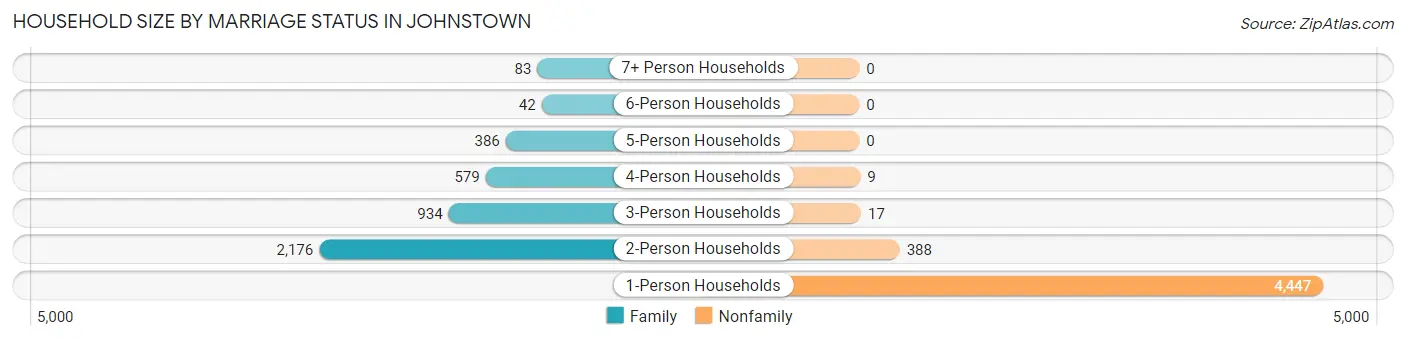
| Household Size | Family Households | Nonfamily Households |
| 1-Person Households | - | 4,447 (49.1%) |
| 2-Person Households | 2,176 (24.0%) | 388 (4.3%) |
| 3-Person Households | 934 (10.3%) | 17 (0.2%) |
| 4-Person Households | 579 (6.4%) | 9 (0.1%) |
| 5-Person Households | 386 (4.3%) | 0 (0.0%) |
| 6-Person Households | 42 (0.5%) | 0 (0.0%) |
| 7+ Person Households | 83 (0.9%) | 0 (0.0%) |
| Total | 4,200 (46.4%) | 4,861 (53.6%) |
Female Fertility in Johnstown
Fertility by Age in Johnstown
Average fertility rate in Johnstown is 61.0 births per 1,000 women. Women in the age bracket of 20 to 34 years have the highest fertility rate with 138.0 births per 1,000 women. Women in the age bracket of 20 to 34 years acount for 96.7% of all women with births.
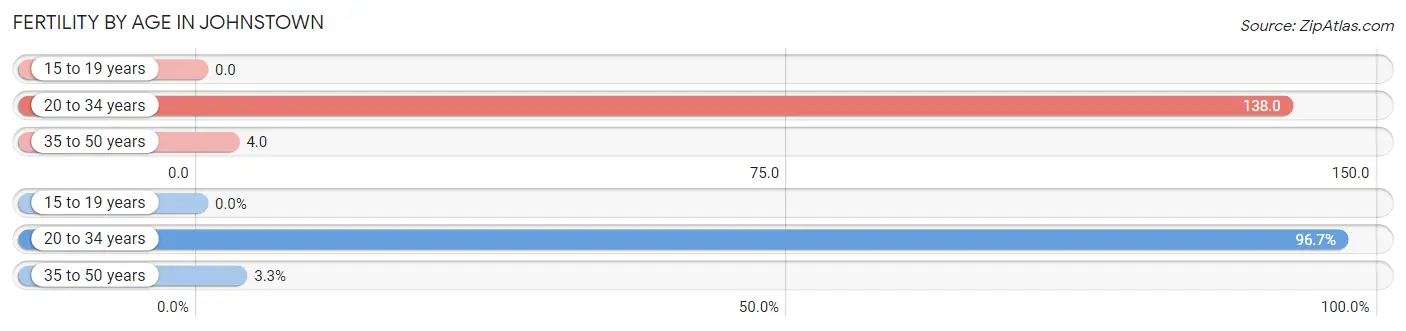
| Age Bracket | Women with Births | Births / 1,000 Women |
| 15 to 19 years | 0 (0.0%) | 0.0 |
| 20 to 34 years | 232 (96.7%) | 138.0 |
| 35 to 50 years | 8 (3.3%) | 4.0 |
| Total | 240 (100.0%) | 61.0 |
Fertility by Age by Marriage Status in Johnstown
42.5% of women with births (240) in Johnstown are married. The highest percentage of unmarried women with births falls into 20 to 34 years age bracket with 59.5% of them unmarried at the time of birth, while the lowest percentage of unmarried women with births belong to 35 to 50 years age bracket with 0.0% of them unmarried.
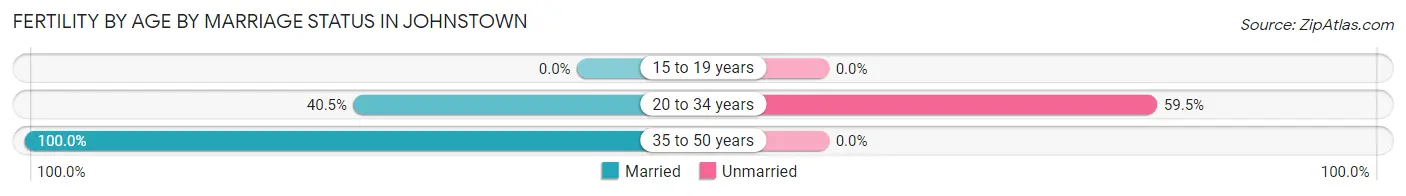
| Age Bracket | Married | Unmarried |
| 15 to 19 years | 0 (0.0%) | 0 (0.0%) |
| 20 to 34 years | 94 (40.5%) | 138 (59.5%) |
| 35 to 50 years | 8 (100.0%) | 0 (0.0%) |
| Total | 102 (42.5%) | 138 (57.5%) |
Fertility by Education in Johnstown
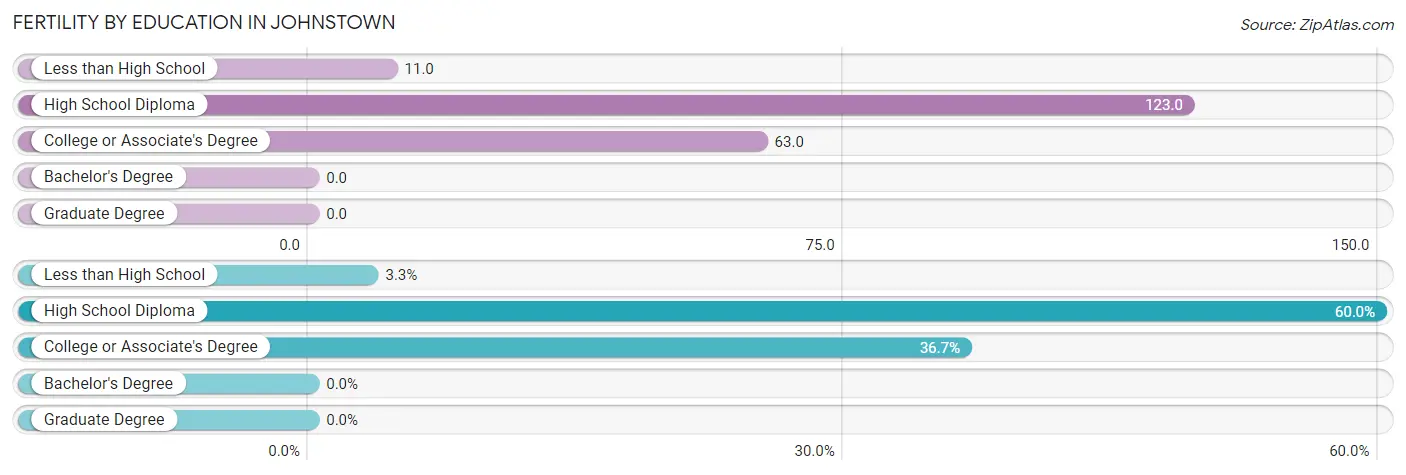
| Educational Attainment | Women with Births | Births / 1,000 Women |
| Less than High School | 8 (3.3%) | 11.0 |
| High School Diploma | 144 (60.0%) | 123.0 |
| College or Associate's Degree | 88 (36.7%) | 63.0 |
| Bachelor's Degree | 0 (0.0%) | 0.0 |
| Graduate Degree | 0 (0.0%) | 0.0 |
| Total | 240 (100.0%) | 61.0 |
Fertility by Education by Marriage Status in Johnstown
57.5% of women with births in Johnstown are unmarried. Women with the educational attainment of less than high school are most likely to be married with 100.0% of them married at childbirth, while women with the educational attainment of high school diploma are least likely to be married with 73.6% of them unmarried at childbirth.
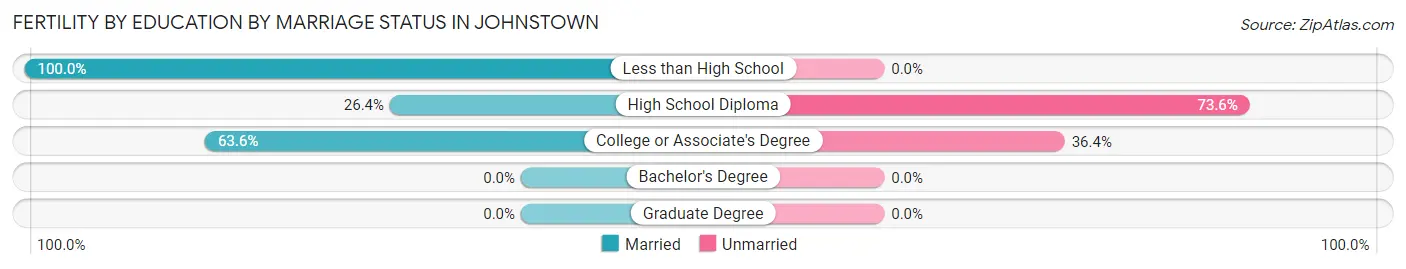
| Educational Attainment | Married | Unmarried |
| Less than High School | 8 (100.0%) | 0 (0.0%) |
| High School Diploma | 38 (26.4%) | 106 (73.6%) |
| College or Associate's Degree | 56 (63.6%) | 32 (36.4%) |
| Bachelor's Degree | 0 (0.0%) | 0 (0.0%) |
| Graduate Degree | 0 (0.0%) | 0 (0.0%) |
| Total | 102 (42.5%) | 138 (57.5%) |
Employment Characteristics in Johnstown
Employment by Class of Employer in Johnstown
Among the 7,149 employed individuals in Johnstown, private company employees (5,322 | 74.4%), not-for-profit organizations (837 | 11.7%), and self-employed (not incorporated) (299 | 4.2%) make up the most common classes of employment.
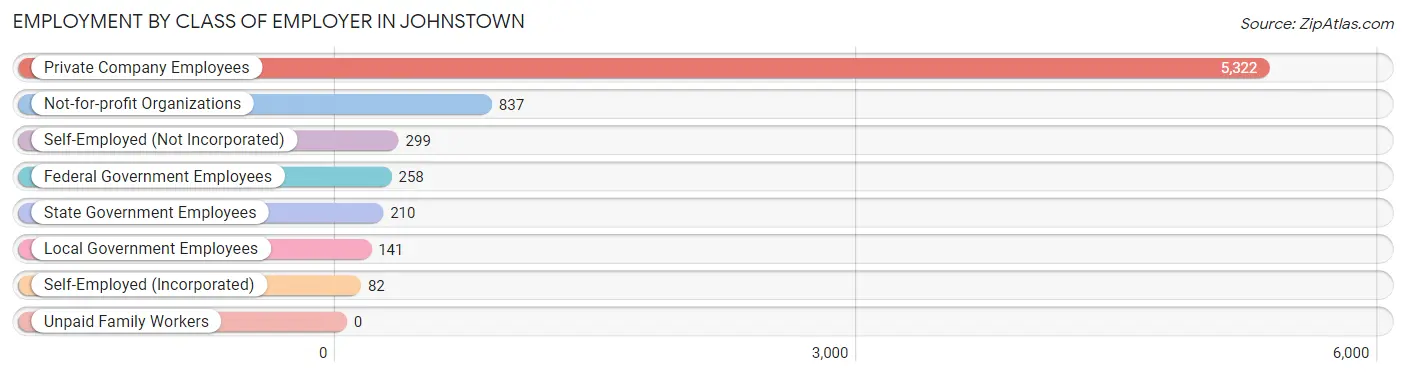
| Employer Class | # Employees | % Employees |
| Private Company Employees | 5,322 | 74.4% |
| Self-Employed (Incorporated) | 82 | 1.1% |
| Self-Employed (Not Incorporated) | 299 | 4.2% |
| Not-for-profit Organizations | 837 | 11.7% |
| Local Government Employees | 141 | 2.0% |
| State Government Employees | 210 | 2.9% |
| Federal Government Employees | 258 | 3.6% |
| Unpaid Family Workers | 0 | 0.0% |
| Total | 7,149 | 100.0% |
Employment Status by Age in Johnstown
According to the labor force statistics for Johnstown, out of the total population over 16 years of age (14,798), 53.3% or 7,887 individuals are in the labor force, with 7.1% or 560 of them unemployed. The age group with the highest labor force participation rate is 25 to 29 years, with 85.3% or 911 individuals in the labor force. Within the labor force, the 30 to 34 years age range has the highest percentage of unemployed individuals, with 14.8% or 132 of them being unemployed.
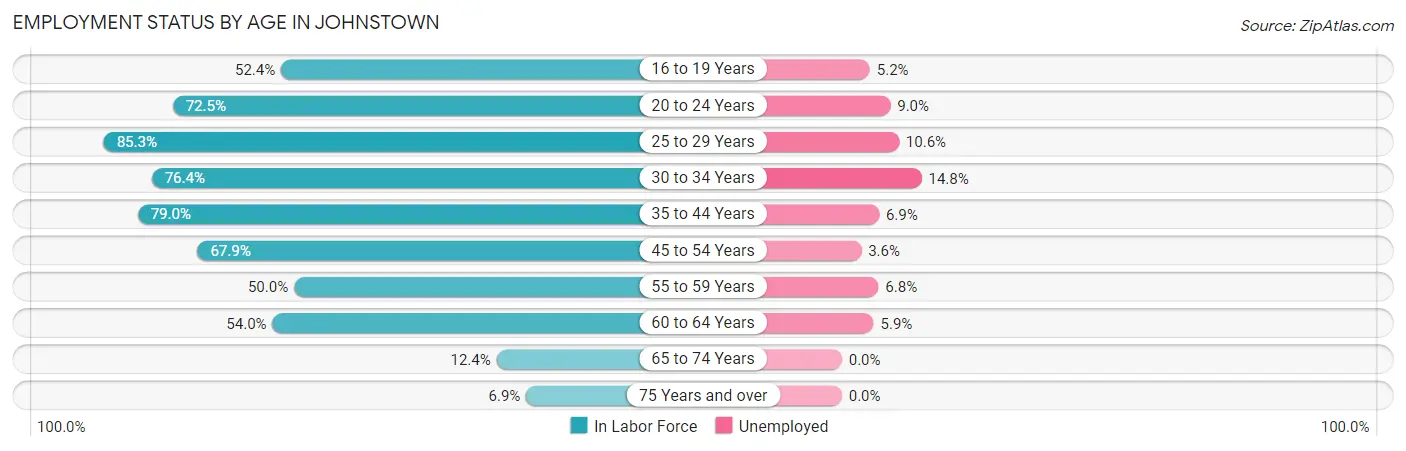
| Age Bracket | In Labor Force | Unemployed |
| 16 to 19 Years | 442 (52.4%) | 23 (5.2%) |
| 20 to 24 Years | 525 (72.5%) | 47 (9.0%) |
| 25 to 29 Years | 911 (85.3%) | 97 (10.6%) |
| 30 to 34 Years | 889 (76.4%) | 132 (14.8%) |
| 35 to 44 Years | 1,470 (79.0%) | 101 (6.9%) |
| 45 to 54 Years | 1,740 (67.9%) | 63 (3.6%) |
| 55 to 59 Years | 662 (50.0%) | 45 (6.8%) |
| 60 to 64 Years | 892 (54.0%) | 53 (5.9%) |
| 65 to 74 Years | 256 (12.4%) | 0 (0.0%) |
| 75 Years and over | 106 (6.9%) | 0 (0.0%) |
| Total | 7,887 (53.3%) | 560 (7.1%) |
Employment Status by Educational Attainment in Johnstown
According to labor force statistics for Johnstown, 68.2% of individuals (6,568) out of the total population between 25 and 64 years of age (9,631) are in the labor force, with 7.5% or 493 of them being unemployed. The group with the highest labor force participation rate are those with the educational attainment of bachelor's degree or higher, with 89.1% or 1,285 individuals in the labor force. Within the labor force, individuals with less than high school education have the highest percentage of unemployment, with 13.2% or 76 of them being unemployed.
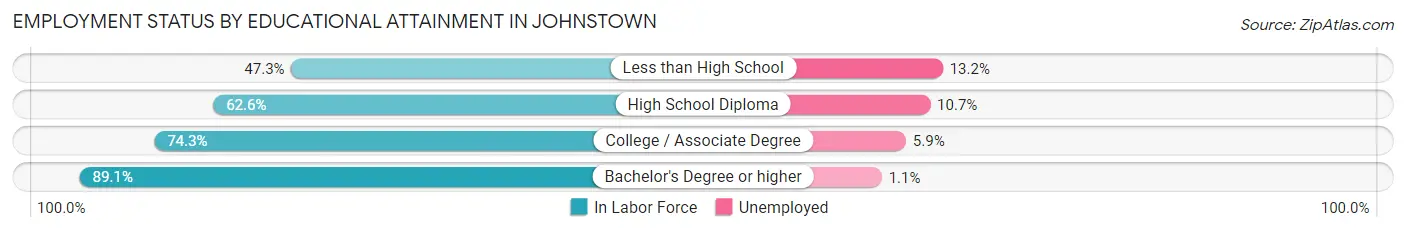
| Educational Attainment | In Labor Force | Unemployed |
| Less than High School | 576 (47.3%) | 161 (13.2%) |
| High School Diploma | 2,545 (62.6%) | 435 (10.7%) |
| College / Associate Degree | 2,159 (74.3%) | 171 (5.9%) |
| Bachelor's Degree or higher | 1,285 (89.1%) | 16 (1.1%) |
| Total | 6,568 (68.2%) | 722 (7.5%) |
Employment Occupations by Sex in Johnstown
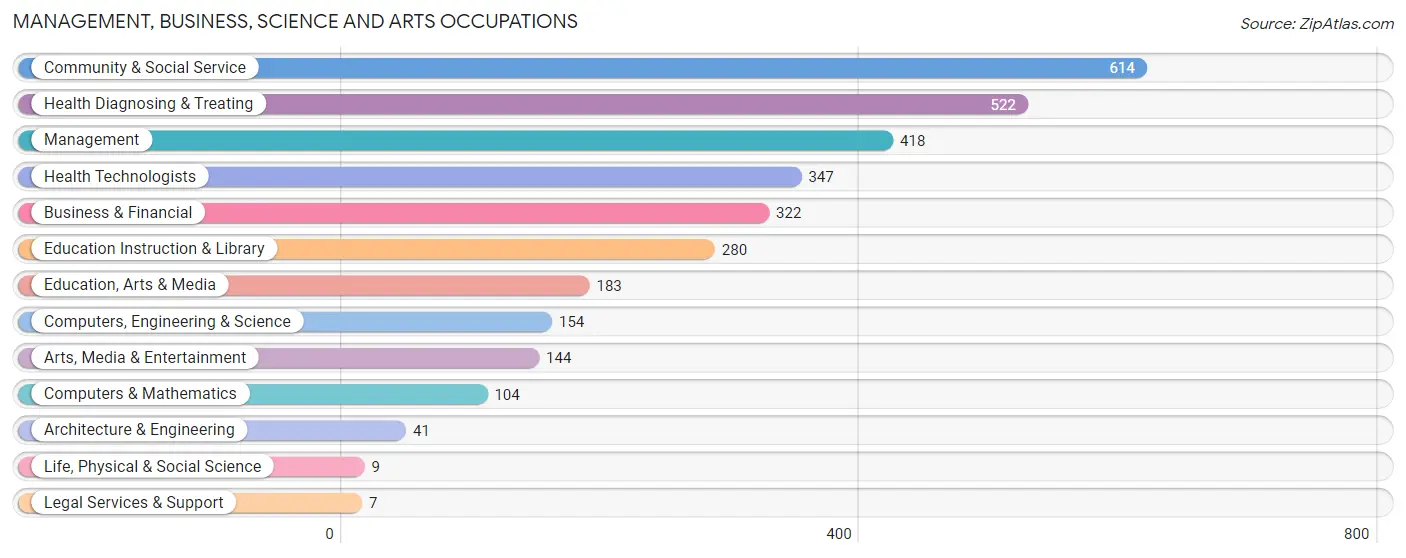
Management, Business, Science and Arts Occupations
The most common Management, Business, Science and Arts occupations in Johnstown are Community & Social Service (614 | 8.4%), Health Diagnosing & Treating (522 | 7.1%), Management (418 | 5.7%), Health Technologists (347 | 4.7%), and Business & Financial (322 | 4.4%).
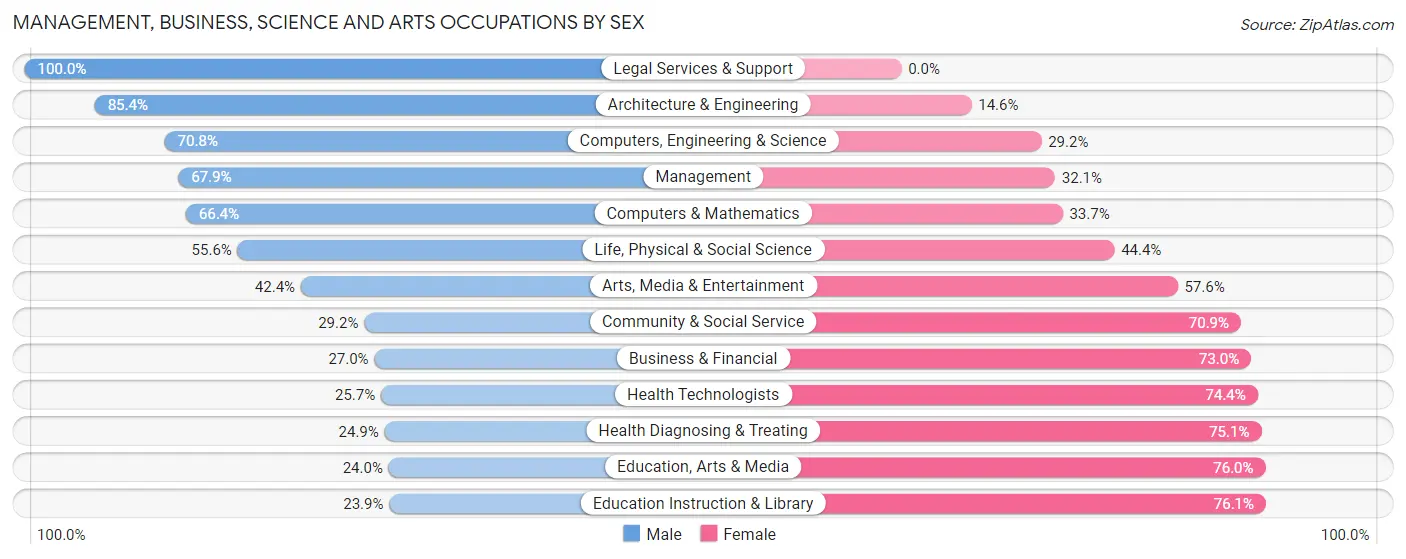
Management, Business, Science and Arts Occupations by Sex
Within the Management, Business, Science and Arts occupations in Johnstown, the most male-oriented occupations are Legal Services & Support (100.0%), Architecture & Engineering (85.4%), and Computers, Engineering & Science (70.8%), while the most female-oriented occupations are Education Instruction & Library (76.1%), Education, Arts & Media (76.0%), and Health Diagnosing & Treating (75.1%).
| Occupation | Male | Female |
| Management | 284 (67.9%) | 134 (32.1%) |
| Business & Financial | 87 (27.0%) | 235 (73.0%) |
| Computers, Engineering & Science | 109 (70.8%) | 45 (29.2%) |
| Computers & Mathematics | 69 (66.3%) | 35 (33.7%) |
| Architecture & Engineering | 35 (85.4%) | 6 (14.6%) |
| Life, Physical & Social Science | 5 (55.6%) | 4 (44.4%) |
| Community & Social Service | 179 (29.1%) | 435 (70.9%) |
| Education, Arts & Media | 44 (24.0%) | 139 (76.0%) |
| Legal Services & Support | 7 (100.0%) | 0 (0.0%) |
| Education Instruction & Library | 67 (23.9%) | 213 (76.1%) |
| Arts, Media & Entertainment | 61 (42.4%) | 83 (57.6%) |
| Health Diagnosing & Treating | 130 (24.9%) | 392 (75.1%) |
| Health Technologists | 89 (25.7%) | 258 (74.4%) |
| Total (Category) | 789 (38.9%) | 1,241 (61.1%) |
| Total (Overall) | 3,365 (46.0%) | 3,956 (54.0%) |
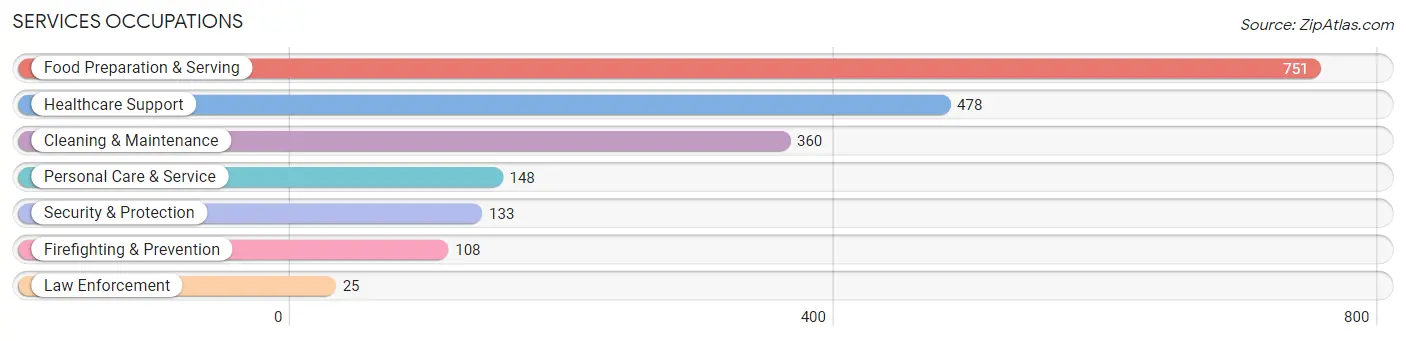
Services Occupations
The most common Services occupations in Johnstown are Food Preparation & Serving (751 | 10.3%), Healthcare Support (478 | 6.5%), Cleaning & Maintenance (360 | 4.9%), Personal Care & Service (148 | 2.0%), and Security & Protection (133 | 1.8%).
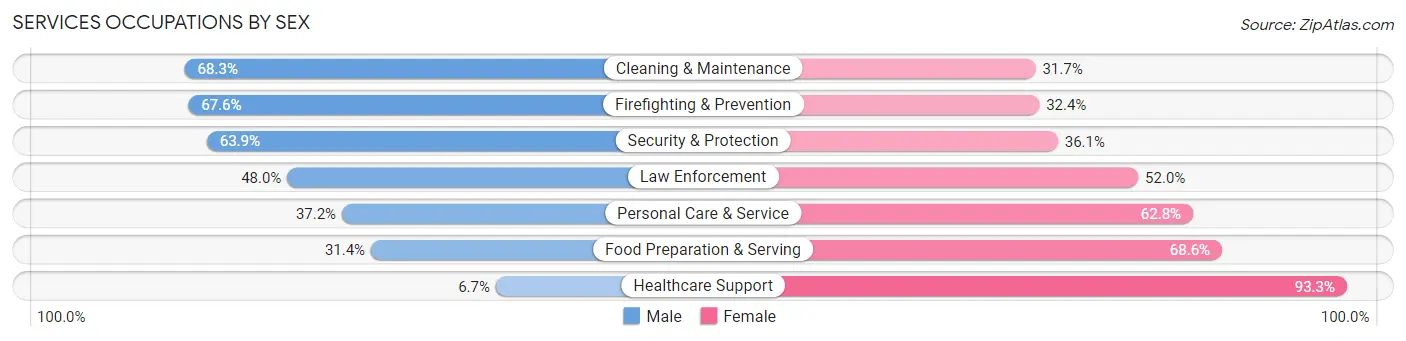
Services Occupations by Sex
Within the Services occupations in Johnstown, the most male-oriented occupations are Cleaning & Maintenance (68.3%), Firefighting & Prevention (67.6%), and Security & Protection (63.9%), while the most female-oriented occupations are Healthcare Support (93.3%), Food Preparation & Serving (68.6%), and Personal Care & Service (62.8%).
| Occupation | Male | Female |
| Healthcare Support | 32 (6.7%) | 446 (93.3%) |
| Security & Protection | 85 (63.9%) | 48 (36.1%) |
| Firefighting & Prevention | 73 (67.6%) | 35 (32.4%) |
| Law Enforcement | 12 (48.0%) | 13 (52.0%) |
| Food Preparation & Serving | 236 (31.4%) | 515 (68.6%) |
| Cleaning & Maintenance | 246 (68.3%) | 114 (31.7%) |
| Personal Care & Service | 55 (37.2%) | 93 (62.8%) |
| Total (Category) | 654 (35.0%) | 1,216 (65.0%) |
| Total (Overall) | 3,365 (46.0%) | 3,956 (54.0%) |
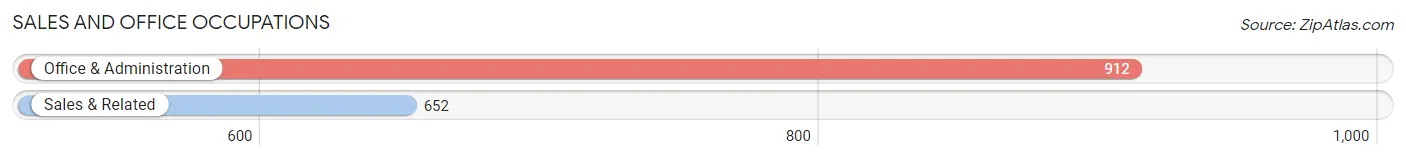
Sales and Office Occupations
The most common Sales and Office occupations in Johnstown are Office & Administration (912 | 12.5%), and Sales & Related (652 | 8.9%).
Sales and Office Occupations by Sex
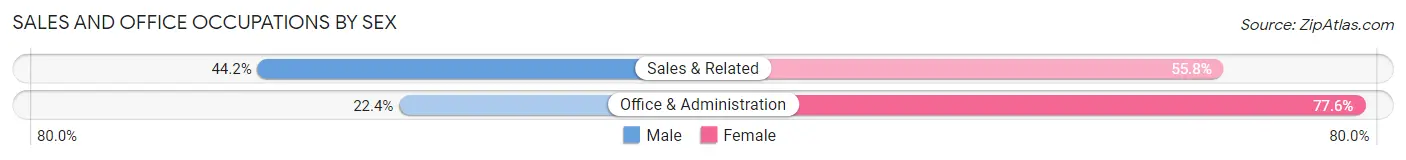
| Occupation | Male | Female |
| Sales & Related | 288 (44.2%) | 364 (55.8%) |
| Office & Administration | 204 (22.4%) | 708 (77.6%) |
| Total (Category) | 492 (31.5%) | 1,072 (68.5%) |
| Total (Overall) | 3,365 (46.0%) | 3,956 (54.0%) |
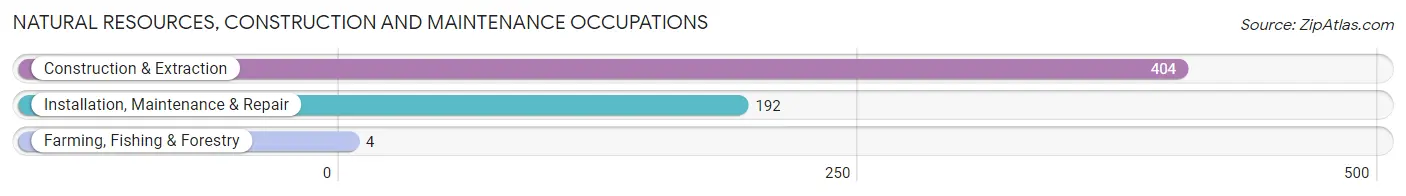
Natural Resources, Construction and Maintenance Occupations
The most common Natural Resources, Construction and Maintenance occupations in Johnstown are Construction & Extraction (404 | 5.5%), Installation, Maintenance & Repair (192 | 2.6%), and Farming, Fishing & Forestry (4 | 0.1%).
Natural Resources, Construction and Maintenance Occupations by Sex
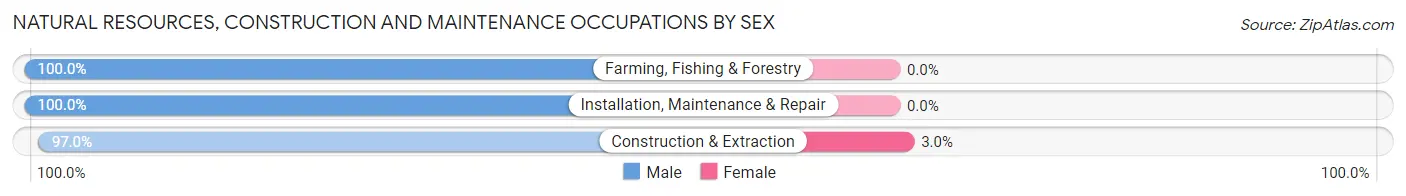
| Occupation | Male | Female |
| Farming, Fishing & Forestry | 4 (100.0%) | 0 (0.0%) |
| Construction & Extraction | 392 (97.0%) | 12 (3.0%) |
| Installation, Maintenance & Repair | 192 (100.0%) | 0 (0.0%) |
| Total (Category) | 588 (98.0%) | 12 (2.0%) |
| Total (Overall) | 3,365 (46.0%) | 3,956 (54.0%) |
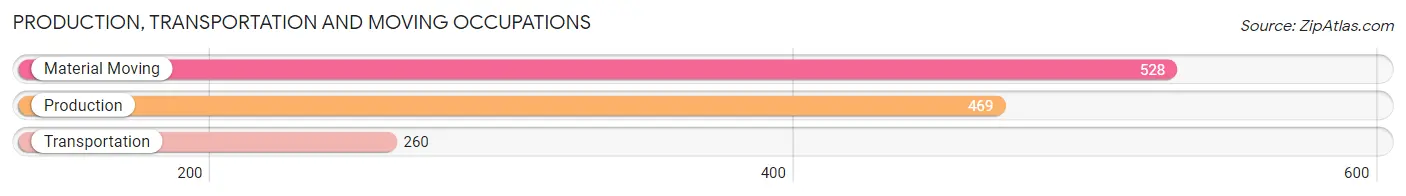
Production, Transportation and Moving Occupations
The most common Production, Transportation and Moving occupations in Johnstown are Material Moving (528 | 7.2%), Production (469 | 6.4%), and Transportation (260 | 3.5%).
Production, Transportation and Moving Occupations by Sex
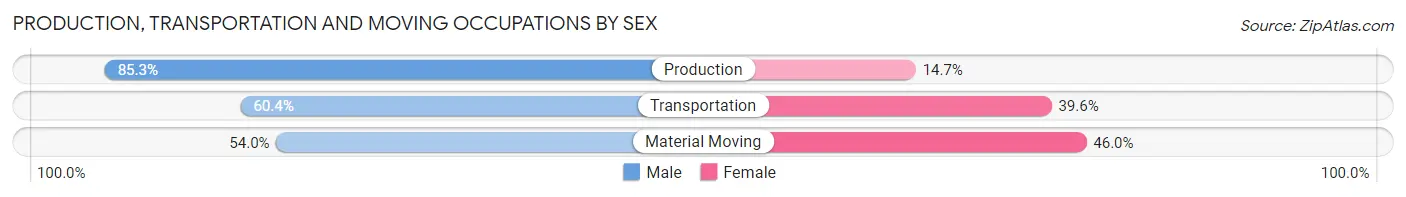
| Occupation | Male | Female |
| Production | 400 (85.3%) | 69 (14.7%) |
| Transportation | 157 (60.4%) | 103 (39.6%) |
| Material Moving | 285 (54.0%) | 243 (46.0%) |
| Total (Category) | 842 (67.0%) | 415 (33.0%) |
| Total (Overall) | 3,365 (46.0%) | 3,956 (54.0%) |
Employment Industries by Sex in Johnstown
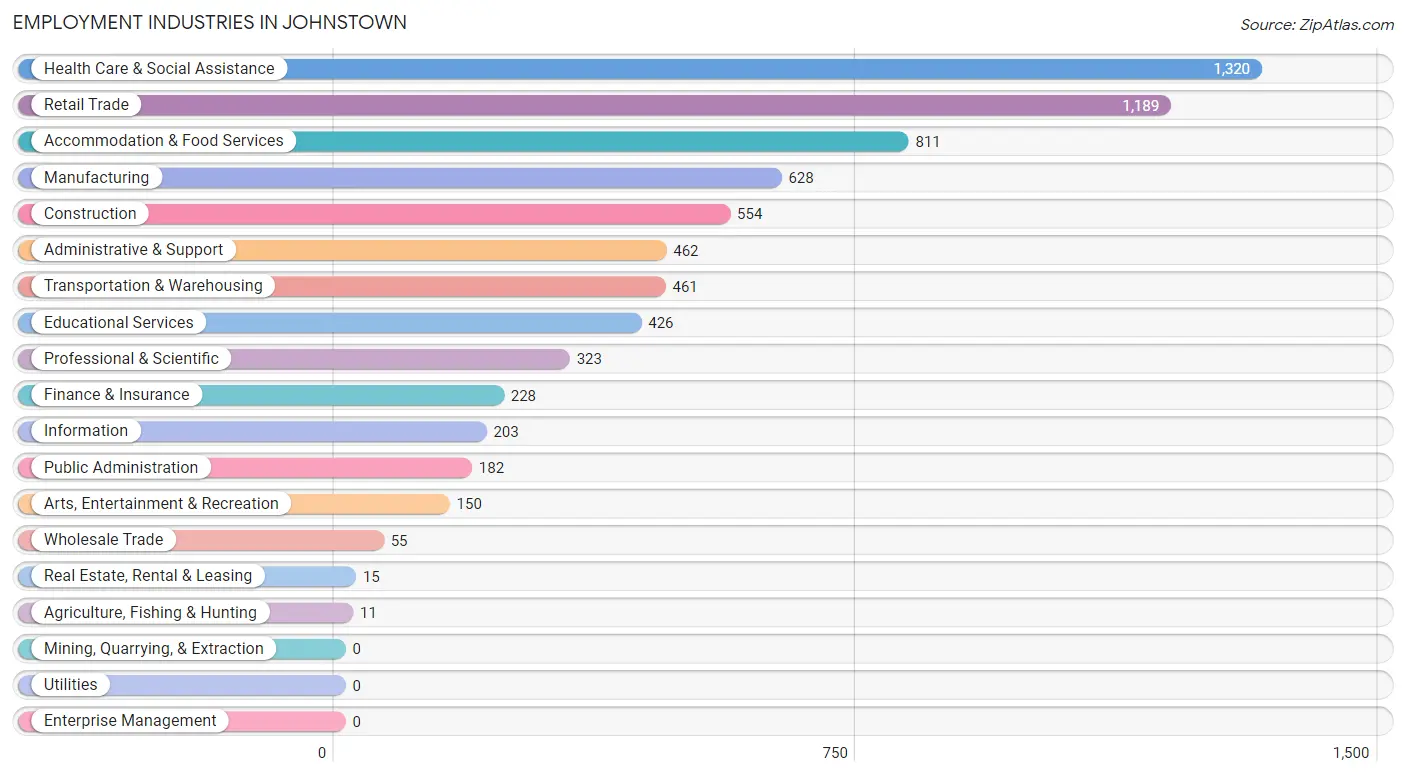
Employment Industries in Johnstown
The major employment industries in Johnstown include Health Care & Social Assistance (1,320 | 18.0%), Retail Trade (1,189 | 16.2%), Accommodation & Food Services (811 | 11.1%), Manufacturing (628 | 8.6%), and Construction (554 | 7.6%).
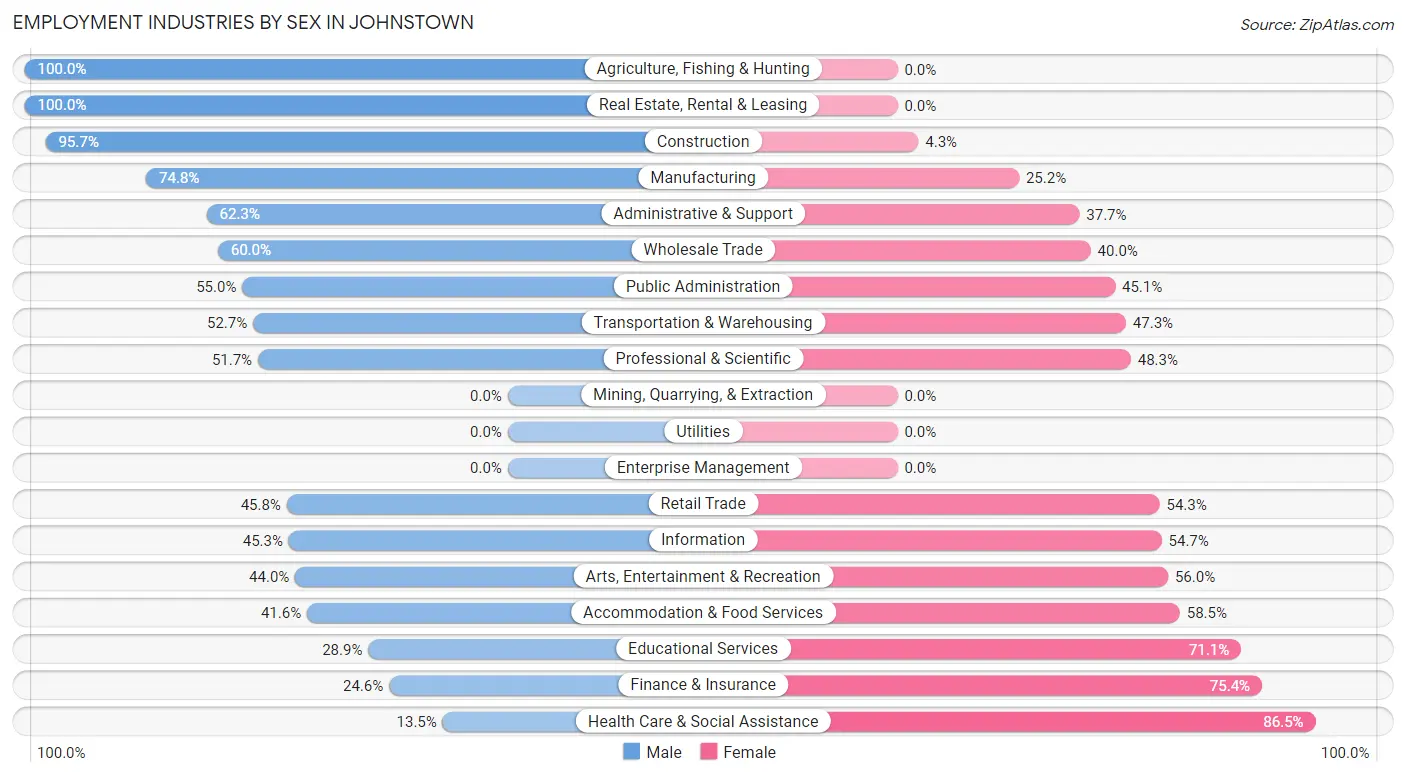
Employment Industries by Sex in Johnstown
The Johnstown industries that see more men than women are Agriculture, Fishing & Hunting (100.0%), Real Estate, Rental & Leasing (100.0%), and Construction (95.7%), whereas the industries that tend to have a higher number of women are Health Care & Social Assistance (86.5%), Finance & Insurance (75.4%), and Educational Services (71.1%).
| Industry | Male | Female |
| Agriculture, Fishing & Hunting | 11 (100.0%) | 0 (0.0%) |
| Mining, Quarrying, & Extraction | 0 (0.0%) | 0 (0.0%) |
| Construction | 530 (95.7%) | 24 (4.3%) |
| Manufacturing | 470 (74.8%) | 158 (25.2%) |
| Wholesale Trade | 33 (60.0%) | 22 (40.0%) |
| Retail Trade | 544 (45.8%) | 645 (54.2%) |
| Transportation & Warehousing | 243 (52.7%) | 218 (47.3%) |
| Utilities | 0 (0.0%) | 0 (0.0%) |
| Information | 92 (45.3%) | 111 (54.7%) |
| Finance & Insurance | 56 (24.6%) | 172 (75.4%) |
| Real Estate, Rental & Leasing | 15 (100.0%) | 0 (0.0%) |
| Professional & Scientific | 167 (51.7%) | 156 (48.3%) |
| Enterprise Management | 0 (0.0%) | 0 (0.0%) |
| Administrative & Support | 288 (62.3%) | 174 (37.7%) |
| Educational Services | 123 (28.9%) | 303 (71.1%) |
| Health Care & Social Assistance | 178 (13.5%) | 1,142 (86.5%) |
| Arts, Entertainment & Recreation | 66 (44.0%) | 84 (56.0%) |
| Accommodation & Food Services | 337 (41.5%) | 474 (58.5%) |
| Public Administration | 100 (54.9%) | 82 (45.1%) |
| Total | 3,365 (46.0%) | 3,956 (54.0%) |
Education in Johnstown
School Enrollment in Johnstown
The most common levels of schooling among the 4,066 students in Johnstown are elementary school (1,053 | 25.9%), high school (967 | 23.8%), and middle school (810 | 19.9%).
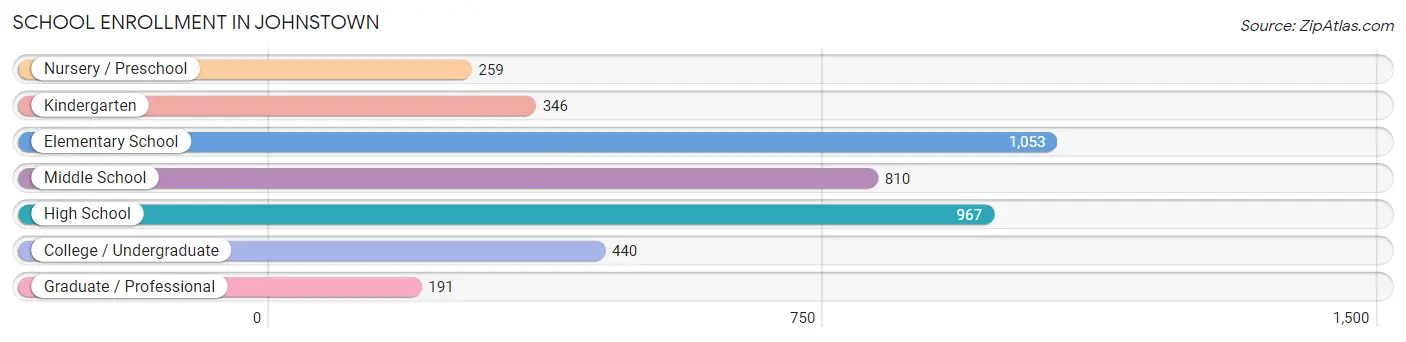
| School Level | # Students | % Students |
| Nursery / Preschool | 259 | 6.4% |
| Kindergarten | 346 | 8.5% |
| Elementary School | 1,053 | 25.9% |
| Middle School | 810 | 19.9% |
| High School | 967 | 23.8% |
| College / Undergraduate | 440 | 10.8% |
| Graduate / Professional | 191 | 4.7% |
| Total | 4,066 | 100.0% |
School Enrollment by Age by Funding Source in Johnstown
Out of a total of 4,066 students who are enrolled in schools in Johnstown, 606 (14.9%) attend a private institution, while the remaining 3,460 (85.1%) are enrolled in public schools. The age group of 18 to 19 year olds has the highest likelihood of being enrolled in private schools, with 126 (70.4% in the age bracket) enrolled. Conversely, the age group of 3 to 4 year olds has the lowest likelihood of being enrolled in a private school, with 102 (100.0% in the age bracket) attending a public institution.
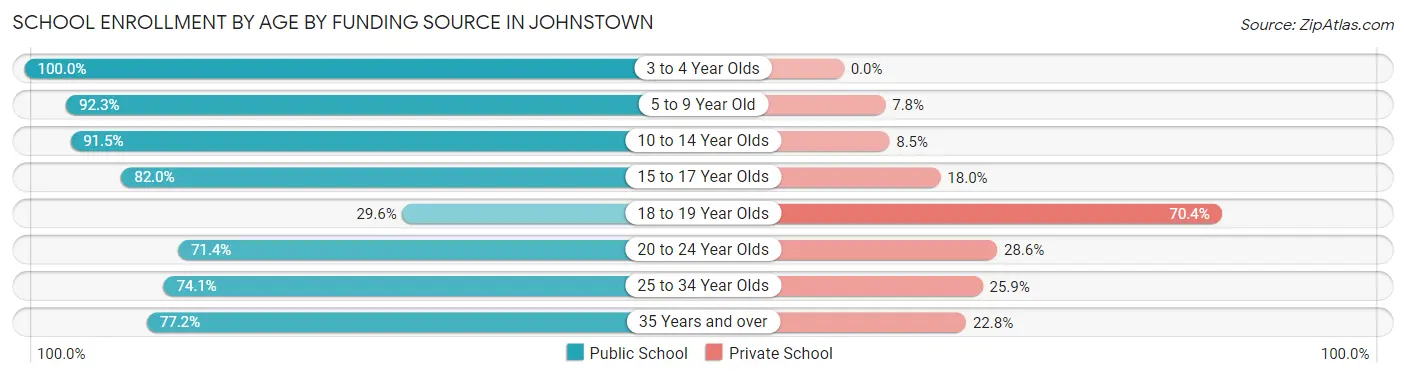
| Age Bracket | Public School | Private School |
| 3 to 4 Year Olds | 102 (100.0%) | 0 (0.0%) |
| 5 to 9 Year Old | 1,119 (92.2%) | 94 (7.7%) |
| 10 to 14 Year Olds | 1,173 (91.5%) | 109 (8.5%) |
| 15 to 17 Year Olds | 555 (82.0%) | 122 (18.0%) |
| 18 to 19 Year Olds | 53 (29.6%) | 126 (70.4%) |
| 20 to 24 Year Olds | 110 (71.4%) | 44 (28.6%) |
| 25 to 34 Year Olds | 106 (74.1%) | 37 (25.9%) |
| 35 Years and over | 244 (77.2%) | 72 (22.8%) |
| Total | 3,460 (85.1%) | 606 (14.9%) |
Educational Attainment by Field of Study in Johnstown
Education (341 | 18.0%), business (254 | 13.4%), science & technology (224 | 11.8%), social sciences (201 | 10.6%), and arts & humanities (156 | 8.3%) are the most common fields of study among 1,892 individuals in Johnstown who have obtained a bachelor's degree or higher.
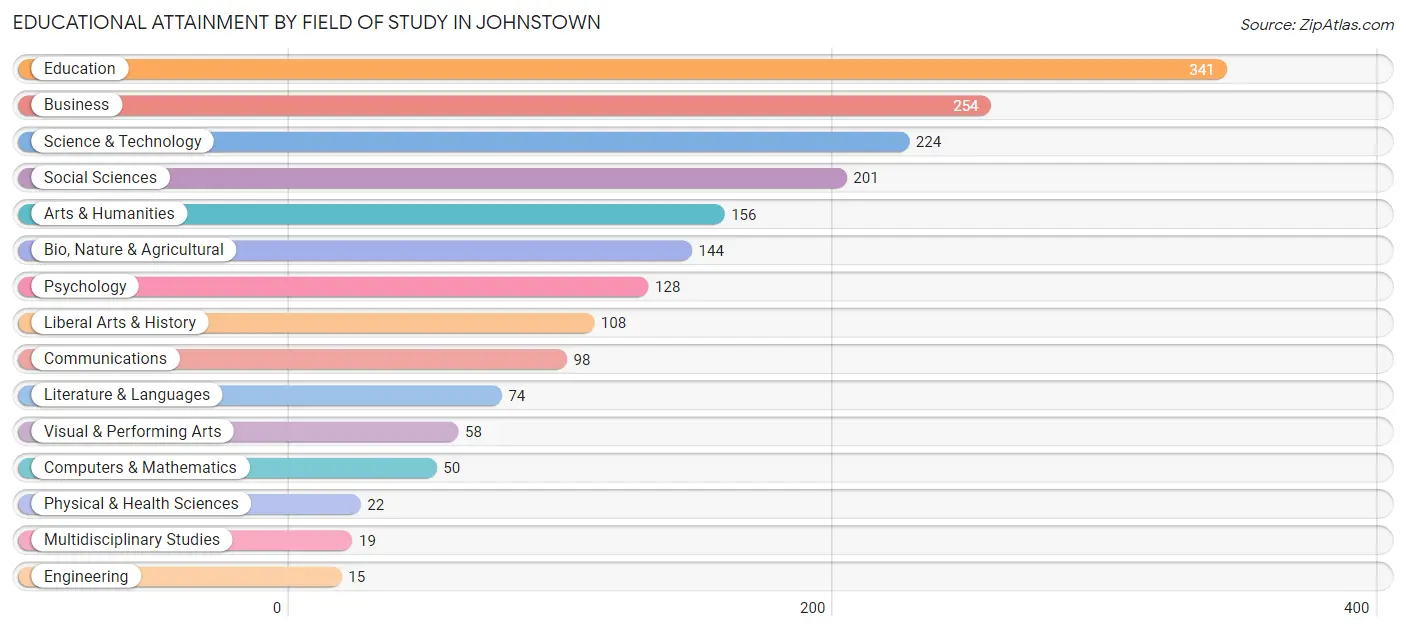
| Field of Study | # Graduates | % Graduates |
| Computers & Mathematics | 50 | 2.6% |
| Bio, Nature & Agricultural | 144 | 7.6% |
| Physical & Health Sciences | 22 | 1.2% |
| Psychology | 128 | 6.8% |
| Social Sciences | 201 | 10.6% |
| Engineering | 15 | 0.8% |
| Multidisciplinary Studies | 19 | 1.0% |
| Science & Technology | 224 | 11.8% |
| Business | 254 | 13.4% |
| Education | 341 | 18.0% |
| Literature & Languages | 74 | 3.9% |
| Liberal Arts & History | 108 | 5.7% |
| Visual & Performing Arts | 58 | 3.1% |
| Communications | 98 | 5.2% |
| Arts & Humanities | 156 | 8.3% |
| Total | 1,892 | 100.0% |
Transportation & Commute in Johnstown
Vehicle Availability by Sex in Johnstown
The most prevalent vehicle ownership categories in Johnstown are males with 2 vehicles (1,459, accounting for 44.5%) and females with 2 vehicles (1,249, making up 38.0%).
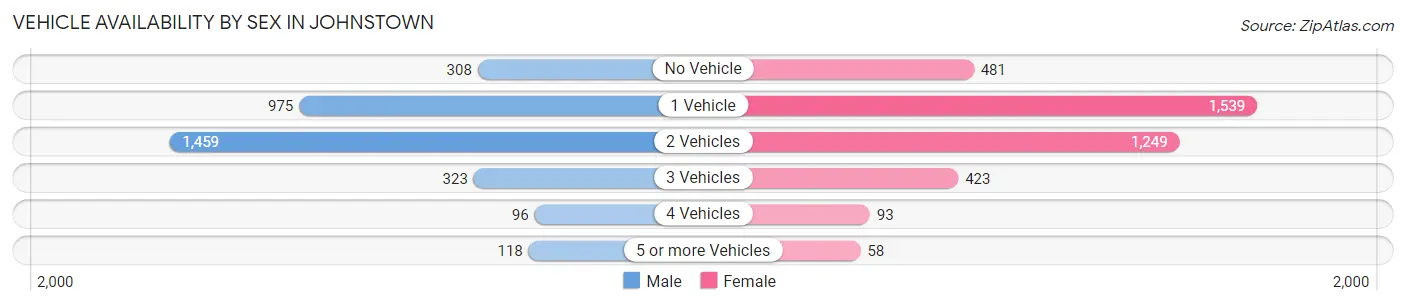
| Vehicles Available | Male | Female |
| No Vehicle | 308 (9.4%) | 481 (12.5%) |
| 1 Vehicle | 975 (29.7%) | 1,539 (40.1%) |
| 2 Vehicles | 1,459 (44.5%) | 1,249 (32.5%) |
| 3 Vehicles | 323 (9.9%) | 423 (11.0%) |
| 4 Vehicles | 96 (2.9%) | 93 (2.4%) |
| 5 or more Vehicles | 118 (3.6%) | 58 (1.5%) |
| Total | 3,279 (100.0%) | 3,843 (100.0%) |
Commute Time in Johnstown
The most frequently occuring commute durations in Johnstown are 10 to 14 minutes (1,470 commuters, 22.5%), 15 to 19 minutes (1,358 commuters, 20.8%), and 5 to 9 minutes (814 commuters, 12.5%).
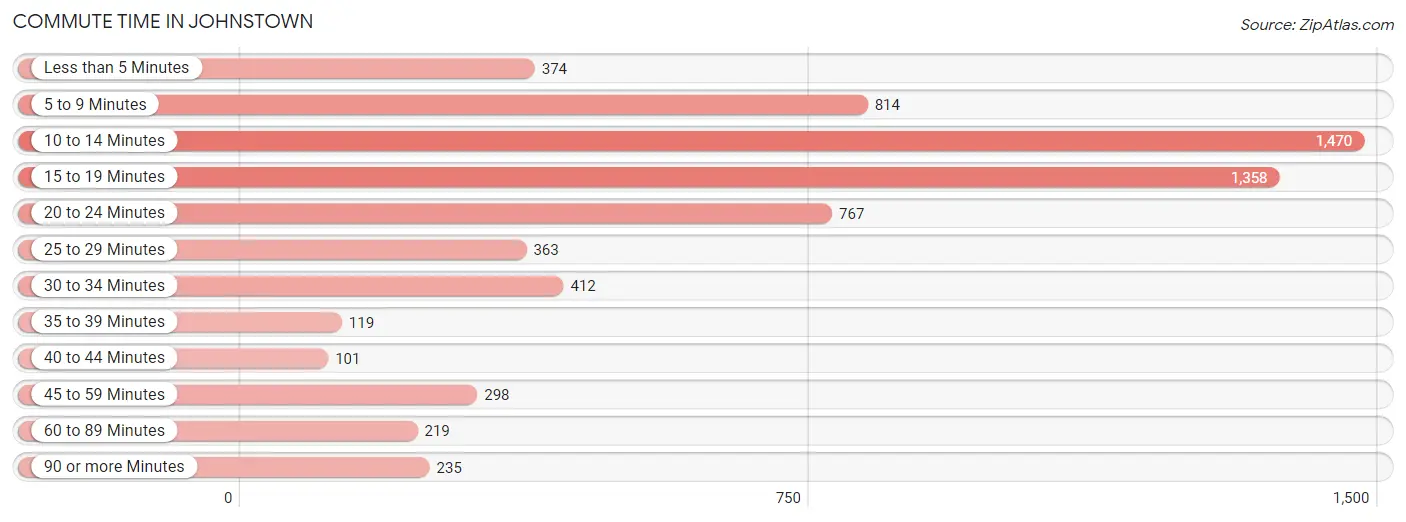
| Commute Time | # Commuters | % Commuters |
| Less than 5 Minutes | 374 | 5.7% |
| 5 to 9 Minutes | 814 | 12.5% |
| 10 to 14 Minutes | 1,470 | 22.5% |
| 15 to 19 Minutes | 1,358 | 20.8% |
| 20 to 24 Minutes | 767 | 11.7% |
| 25 to 29 Minutes | 363 | 5.6% |
| 30 to 34 Minutes | 412 | 6.3% |
| 35 to 39 Minutes | 119 | 1.8% |
| 40 to 44 Minutes | 101 | 1.5% |
| 45 to 59 Minutes | 298 | 4.6% |
| 60 to 89 Minutes | 219 | 3.4% |
| 90 or more Minutes | 235 | 3.6% |
Commute Time by Sex in Johnstown
The most common commute times in Johnstown are 15 to 19 minutes (652 commuters, 21.9%) for males and 10 to 14 minutes (872 commuters, 24.5%) for females.
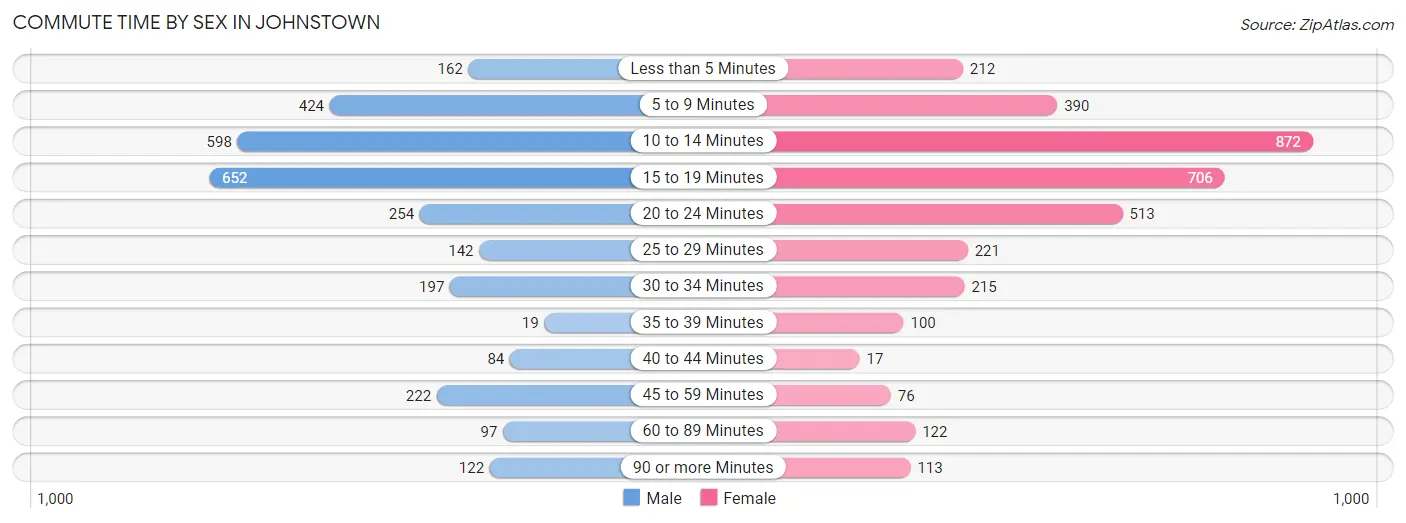
| Commute Time | Male | Female |
| Less than 5 Minutes | 162 (5.4%) | 212 (6.0%) |
| 5 to 9 Minutes | 424 (14.3%) | 390 (11.0%) |
| 10 to 14 Minutes | 598 (20.1%) | 872 (24.5%) |
| 15 to 19 Minutes | 652 (21.9%) | 706 (19.9%) |
| 20 to 24 Minutes | 254 (8.5%) | 513 (14.4%) |
| 25 to 29 Minutes | 142 (4.8%) | 221 (6.2%) |
| 30 to 34 Minutes | 197 (6.6%) | 215 (6.0%) |
| 35 to 39 Minutes | 19 (0.6%) | 100 (2.8%) |
| 40 to 44 Minutes | 84 (2.8%) | 17 (0.5%) |
| 45 to 59 Minutes | 222 (7.5%) | 76 (2.1%) |
| 60 to 89 Minutes | 97 (3.3%) | 122 (3.4%) |
| 90 or more Minutes | 122 (4.1%) | 113 (3.2%) |
Time of Departure to Work by Sex in Johnstown
The most frequent times of departure to work in Johnstown are 6:30 AM to 6:59 AM (567, 19.1%) for males and 12:00 PM to 3:59 PM (540, 15.2%) for females.
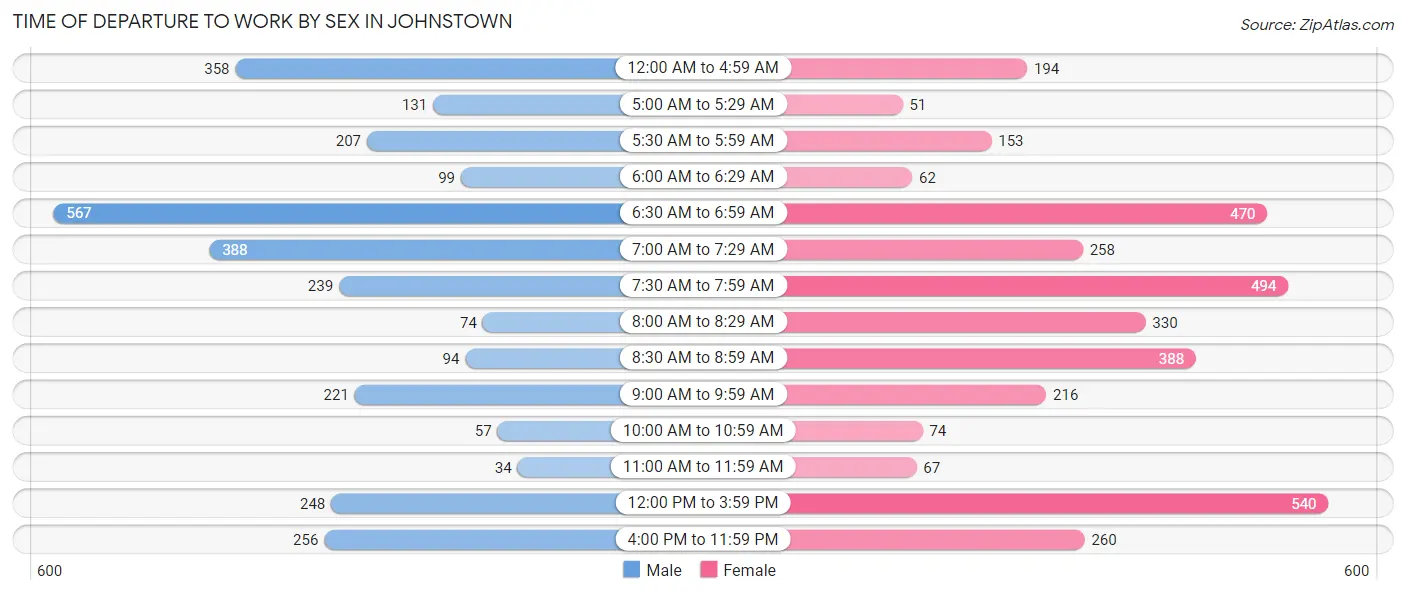
| Time of Departure | Male | Female |
| 12:00 AM to 4:59 AM | 358 (12.0%) | 194 (5.4%) |
| 5:00 AM to 5:29 AM | 131 (4.4%) | 51 (1.4%) |
| 5:30 AM to 5:59 AM | 207 (7.0%) | 153 (4.3%) |
| 6:00 AM to 6:29 AM | 99 (3.3%) | 62 (1.7%) |
| 6:30 AM to 6:59 AM | 567 (19.1%) | 470 (13.2%) |
| 7:00 AM to 7:29 AM | 388 (13.1%) | 258 (7.2%) |
| 7:30 AM to 7:59 AM | 239 (8.0%) | 494 (13.9%) |
| 8:00 AM to 8:29 AM | 74 (2.5%) | 330 (9.3%) |
| 8:30 AM to 8:59 AM | 94 (3.2%) | 388 (10.9%) |
| 9:00 AM to 9:59 AM | 221 (7.4%) | 216 (6.1%) |
| 10:00 AM to 10:59 AM | 57 (1.9%) | 74 (2.1%) |
| 11:00 AM to 11:59 AM | 34 (1.1%) | 67 (1.9%) |
| 12:00 PM to 3:59 PM | 248 (8.3%) | 540 (15.2%) |
| 4:00 PM to 11:59 PM | 256 (8.6%) | 260 (7.3%) |
| Total | 2,973 (100.0%) | 3,557 (100.0%) |
Housing Occupancy in Johnstown
Occupancy by Ownership in Johnstown
Of the total 9,061 dwellings in Johnstown, owner-occupied units account for 4,716 (52.0%), while renter-occupied units make up 4,345 (47.9%).
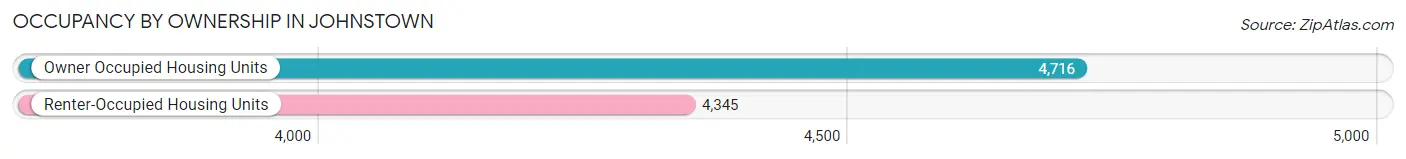
| Occupancy | # Housing Units | % Housing Units |
| Owner Occupied Housing Units | 4,716 | 52.0% |
| Renter-Occupied Housing Units | 4,345 | 47.9% |
| Total Occupied Housing Units | 9,061 | 100.0% |
Occupancy by Household Size in Johnstown
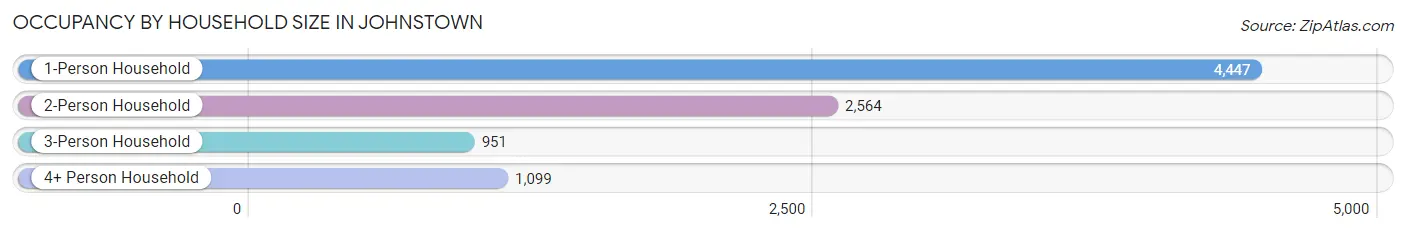
| Household Size | # Housing Units | % Housing Units |
| 1-Person Household | 4,447 | 49.1% |
| 2-Person Household | 2,564 | 28.3% |
| 3-Person Household | 951 | 10.5% |
| 4+ Person Household | 1,099 | 12.1% |
| Total Housing Units | 9,061 | 100.0% |
Occupancy by Ownership by Household Size in Johnstown
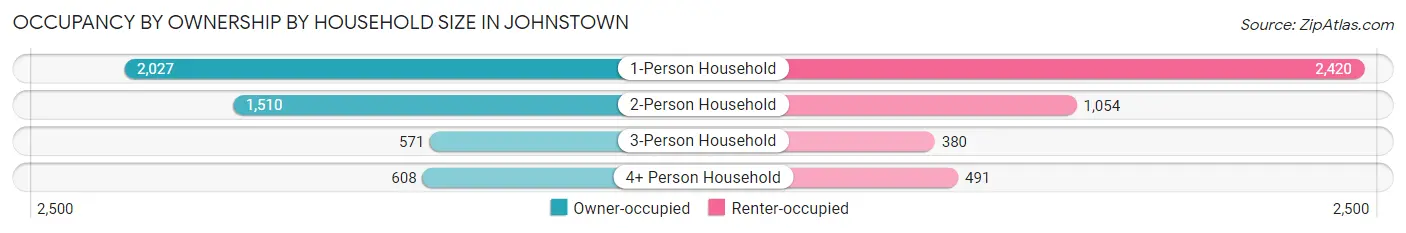
| Household Size | Owner-occupied | Renter-occupied |
| 1-Person Household | 2,027 (45.6%) | 2,420 (54.4%) |
| 2-Person Household | 1,510 (58.9%) | 1,054 (41.1%) |
| 3-Person Household | 571 (60.0%) | 380 (40.0%) |
| 4+ Person Household | 608 (55.3%) | 491 (44.7%) |
| Total Housing Units | 4,716 (52.0%) | 4,345 (47.9%) |
Occupancy by Educational Attainment in Johnstown
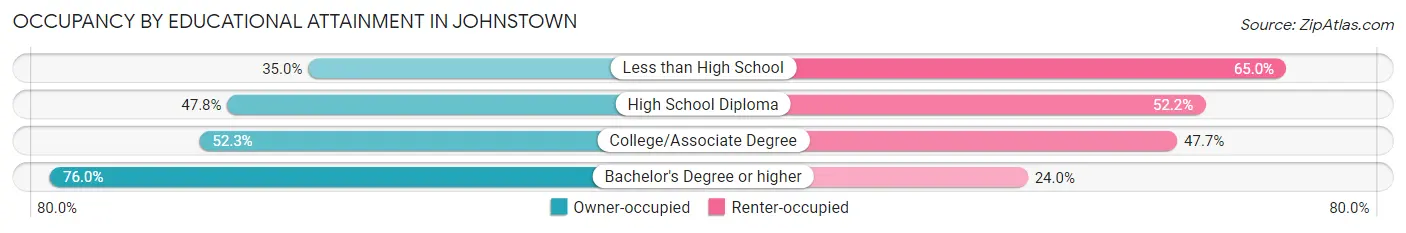
| Household Size | Owner-occupied | Renter-occupied |
| Less than High School | 362 (35.0%) | 672 (65.0%) |
| High School Diploma | 1,814 (47.8%) | 1,978 (52.2%) |
| College/Associate Degree | 1,494 (52.3%) | 1,364 (47.7%) |
| Bachelor's Degree or higher | 1,046 (76.0%) | 331 (24.0%) |
Occupancy by Age of Householder in Johnstown
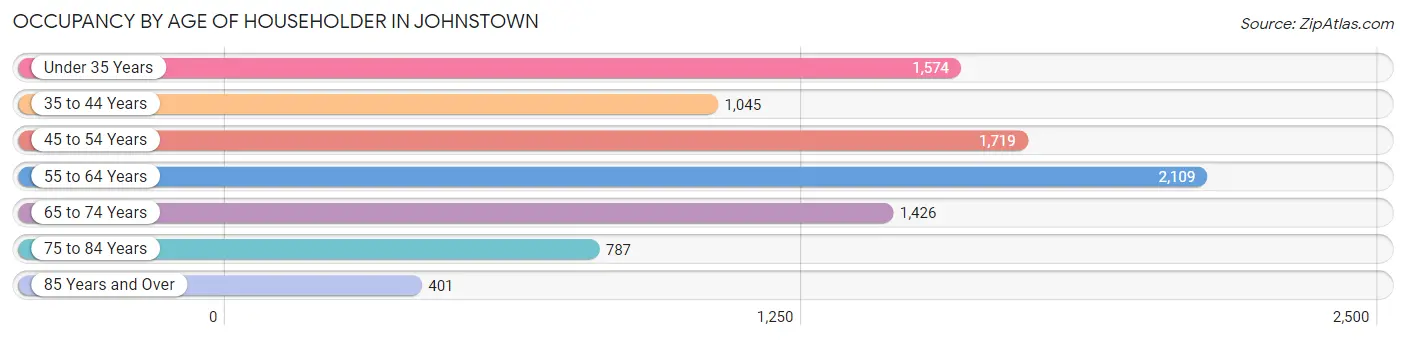
| Age Bracket | # Households | % Households |
| Under 35 Years | 1,574 | 17.4% |
| 35 to 44 Years | 1,045 | 11.5% |
| 45 to 54 Years | 1,719 | 19.0% |
| 55 to 64 Years | 2,109 | 23.3% |
| 65 to 74 Years | 1,426 | 15.7% |
| 75 to 84 Years | 787 | 8.7% |
| 85 Years and Over | 401 | 4.4% |
| Total | 9,061 | 100.0% |
Housing Finances in Johnstown
Median Income by Occupancy in Johnstown
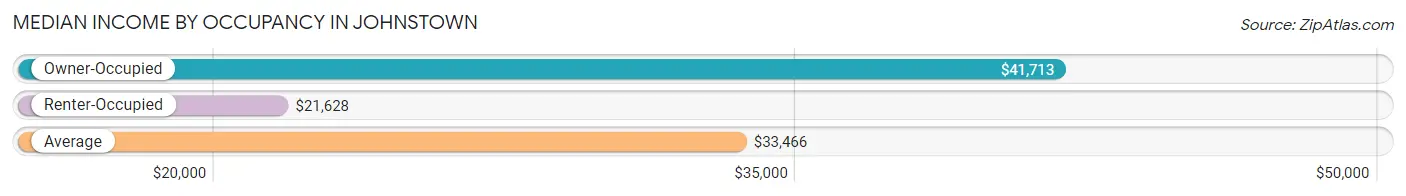
| Occupancy Type | # Households | Median Income |
| Owner-Occupied | 4,716 (52.0%) | $41,713 |
| Renter-Occupied | 4,345 (47.9%) | $21,628 |
| Average | 9,061 (100.0%) | $33,466 |
Occupancy by Householder Income Bracket in Johnstown
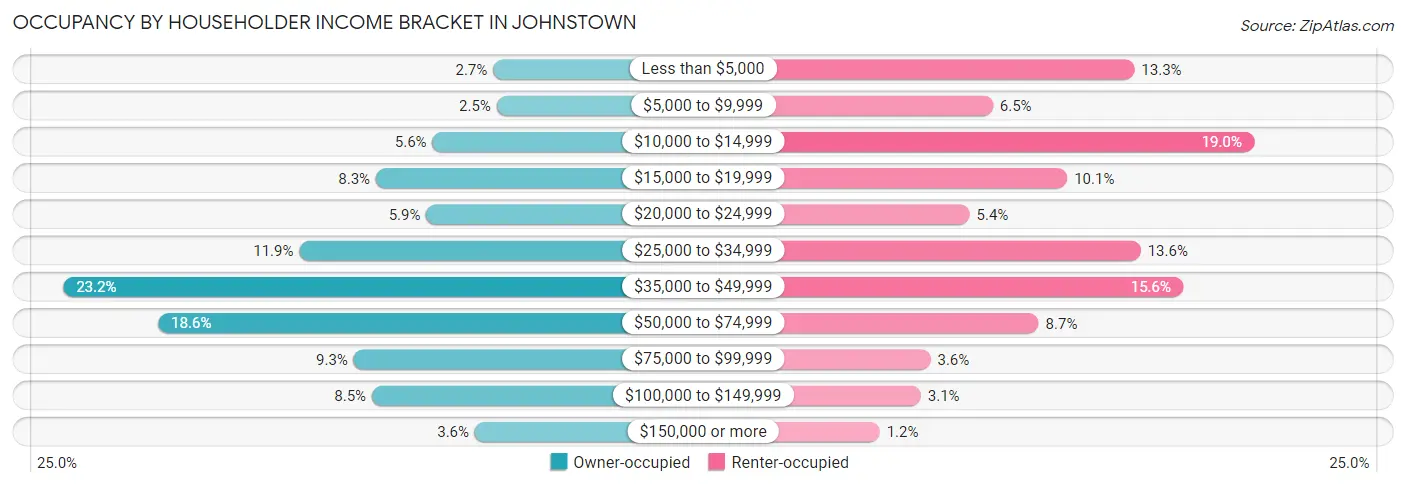
| Income Bracket | Owner-occupied | Renter-occupied |
| Less than $5,000 | 127 (2.7%) | 577 (13.3%) |
| $5,000 to $9,999 | 119 (2.5%) | 284 (6.5%) |
| $10,000 to $14,999 | 263 (5.6%) | 824 (19.0%) |
| $15,000 to $19,999 | 390 (8.3%) | 438 (10.1%) |
| $20,000 to $24,999 | 277 (5.9%) | 236 (5.4%) |
| $25,000 to $34,999 | 562 (11.9%) | 590 (13.6%) |
| $35,000 to $49,999 | 1,092 (23.2%) | 677 (15.6%) |
| $50,000 to $74,999 | 879 (18.6%) | 379 (8.7%) |
| $75,000 to $99,999 | 440 (9.3%) | 155 (3.6%) |
| $100,000 to $149,999 | 399 (8.5%) | 135 (3.1%) |
| $150,000 or more | 168 (3.6%) | 50 (1.1%) |
| Total | 4,716 (100.0%) | 4,345 (100.0%) |
Monthly Housing Cost Tiers in Johnstown
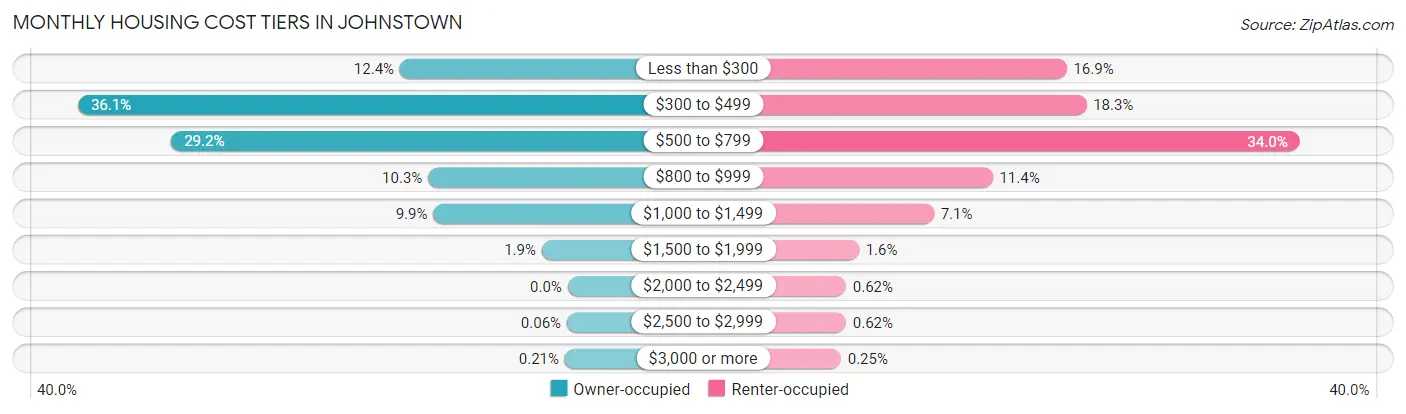
| Monthly Cost | Owner-occupied | Renter-occupied |
| Less than $300 | 583 (12.4%) | 733 (16.9%) |
| $300 to $499 | 1,701 (36.1%) | 796 (18.3%) |
| $500 to $799 | 1,377 (29.2%) | 1,479 (34.0%) |
| $800 to $999 | 485 (10.3%) | 496 (11.4%) |
| $1,000 to $1,499 | 467 (9.9%) | 308 (7.1%) |
| $1,500 to $1,999 | 90 (1.9%) | 68 (1.6%) |
| $2,000 to $2,499 | 0 (0.0%) | 27 (0.6%) |
| $2,500 to $2,999 | 3 (0.1%) | 27 (0.6%) |
| $3,000 or more | 10 (0.2%) | 11 (0.3%) |
| Total | 4,716 (100.0%) | 4,345 (100.0%) |
Physical Housing Characteristics in Johnstown
Housing Structures in Johnstown
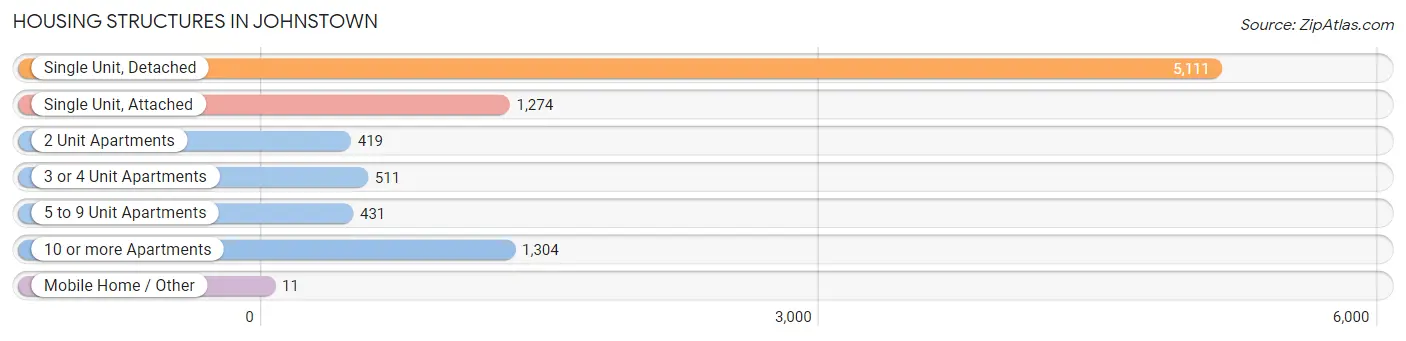
| Structure Type | # Housing Units | % Housing Units |
| Single Unit, Detached | 5,111 | 56.4% |
| Single Unit, Attached | 1,274 | 14.1% |
| 2 Unit Apartments | 419 | 4.6% |
| 3 or 4 Unit Apartments | 511 | 5.6% |
| 5 to 9 Unit Apartments | 431 | 4.8% |
| 10 or more Apartments | 1,304 | 14.4% |
| Mobile Home / Other | 11 | 0.1% |
| Total | 9,061 | 100.0% |
Housing Structures by Occupancy in Johnstown
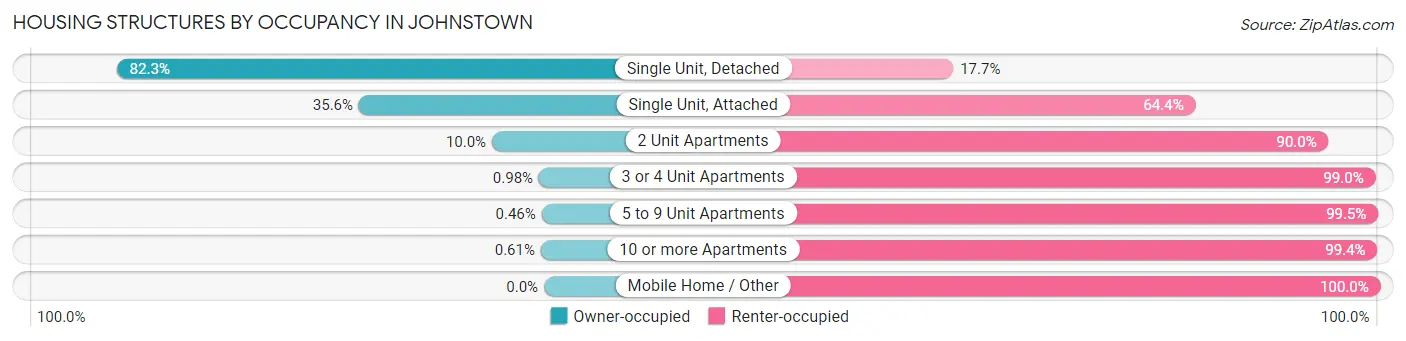
| Structure Type | Owner-occupied | Renter-occupied |
| Single Unit, Detached | 4,205 (82.3%) | 906 (17.7%) |
| Single Unit, Attached | 454 (35.6%) | 820 (64.4%) |
| 2 Unit Apartments | 42 (10.0%) | 377 (90.0%) |
| 3 or 4 Unit Apartments | 5 (1.0%) | 506 (99.0%) |
| 5 to 9 Unit Apartments | 2 (0.5%) | 429 (99.5%) |
| 10 or more Apartments | 8 (0.6%) | 1,296 (99.4%) |
| Mobile Home / Other | 0 (0.0%) | 11 (100.0%) |
| Total | 4,716 (52.0%) | 4,345 (47.9%) |
Housing Structures by Number of Rooms in Johnstown
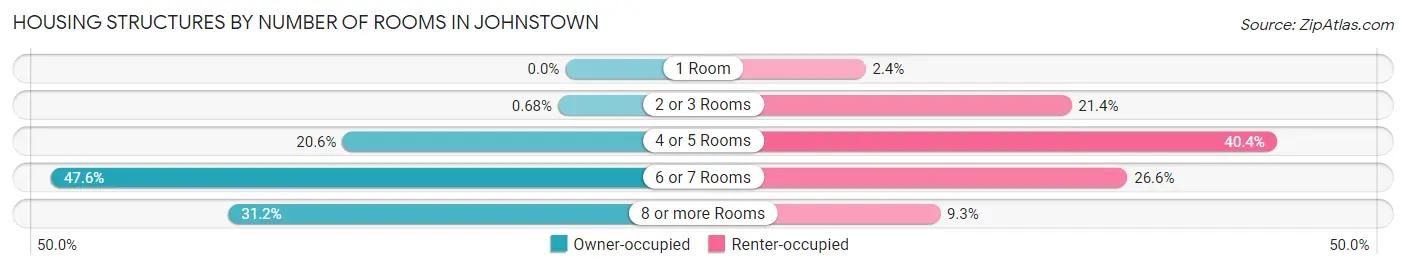
| Number of Rooms | Owner-occupied | Renter-occupied |
| 1 Room | 0 (0.0%) | 103 (2.4%) |
| 2 or 3 Rooms | 32 (0.7%) | 930 (21.4%) |
| 4 or 5 Rooms | 972 (20.6%) | 1,755 (40.4%) |
| 6 or 7 Rooms | 2,243 (47.6%) | 1,155 (26.6%) |
| 8 or more Rooms | 1,469 (31.1%) | 402 (9.2%) |
| Total | 4,716 (100.0%) | 4,345 (100.0%) |
Housing Structure by Heating Type in Johnstown
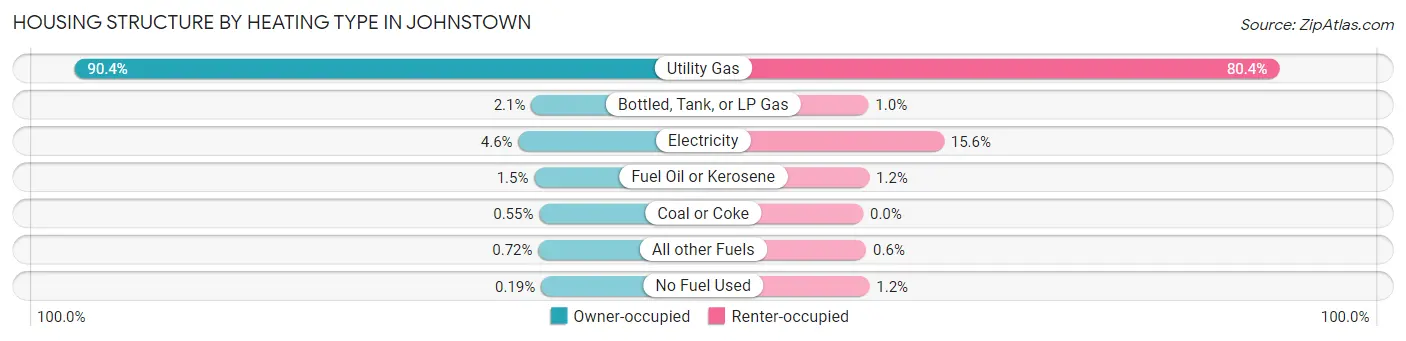
| Heating Type | Owner-occupied | Renter-occupied |
| Utility Gas | 4,262 (90.4%) | 3,492 (80.4%) |
| Bottled, Tank, or LP Gas | 98 (2.1%) | 45 (1.0%) |
| Electricity | 216 (4.6%) | 678 (15.6%) |
| Fuel Oil or Kerosene | 71 (1.5%) | 51 (1.2%) |
| Coal or Coke | 26 (0.5%) | 0 (0.0%) |
| All other Fuels | 34 (0.7%) | 26 (0.6%) |
| No Fuel Used | 9 (0.2%) | 53 (1.2%) |
| Total | 4,716 (100.0%) | 4,345 (100.0%) |
Household Vehicle Usage in Johnstown
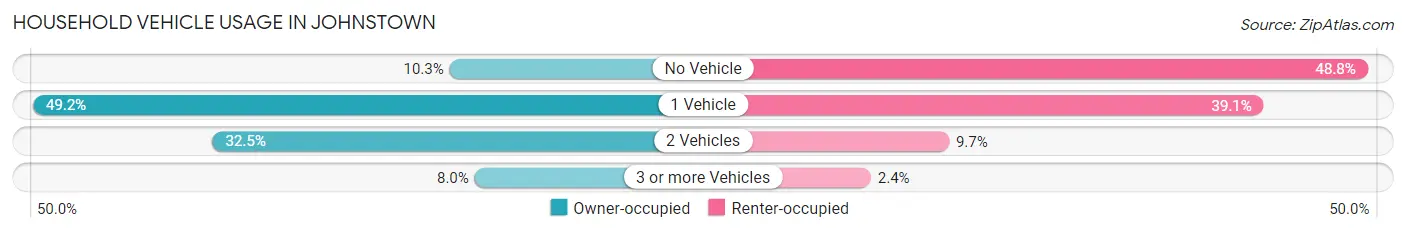
| Vehicles per Household | Owner-occupied | Renter-occupied |
| No Vehicle | 487 (10.3%) | 2,120 (48.8%) |
| 1 Vehicle | 2,321 (49.2%) | 1,698 (39.1%) |
| 2 Vehicles | 1,531 (32.5%) | 422 (9.7%) |
| 3 or more Vehicles | 377 (8.0%) | 105 (2.4%) |
| Total | 4,716 (100.0%) | 4,345 (100.0%) |
Real Estate & Mortgages in Johnstown
Real Estate and Mortgage Overview in Johnstown
| Characteristic | Without Mortgage | With Mortgage |
| Housing Units | 3,292 | 1,424 |
| Median Property Value | $33,100 | $54,000 |
| Median Household Income | $38,387 | $95 |
| Monthly Housing Costs | $428 | $0 |
| Real Estate Taxes | $985 | $24 |
Property Value by Mortgage Status in Johnstown
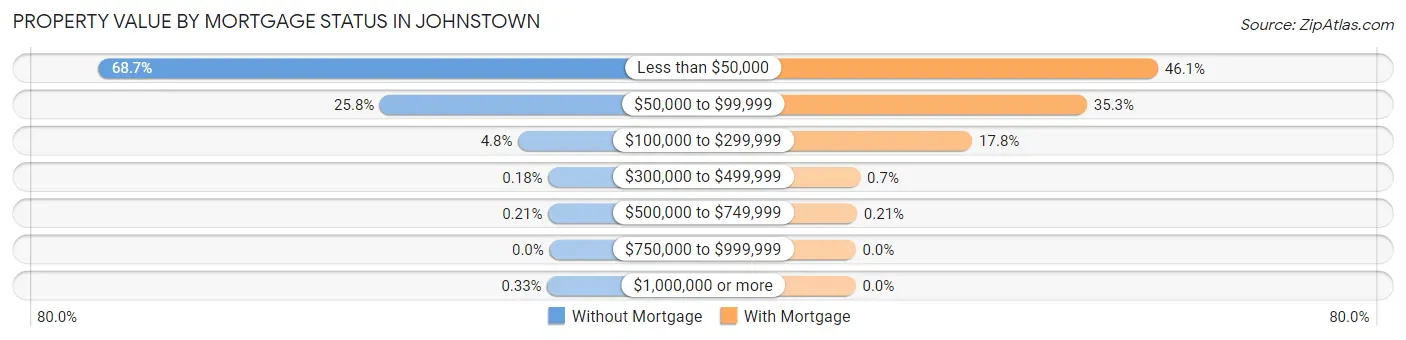
| Property Value | Without Mortgage | With Mortgage |
| Less than $50,000 | 2,261 (68.7%) | 656 (46.1%) |
| $50,000 to $99,999 | 850 (25.8%) | 502 (35.2%) |
| $100,000 to $299,999 | 157 (4.8%) | 253 (17.8%) |
| $300,000 to $499,999 | 6 (0.2%) | 10 (0.7%) |
| $500,000 to $749,999 | 7 (0.2%) | 3 (0.2%) |
| $750,000 to $999,999 | 0 (0.0%) | 0 (0.0%) |
| $1,000,000 or more | 11 (0.3%) | 0 (0.0%) |
| Total | 3,292 (100.0%) | 1,424 (100.0%) |
Household Income by Mortgage Status in Johnstown
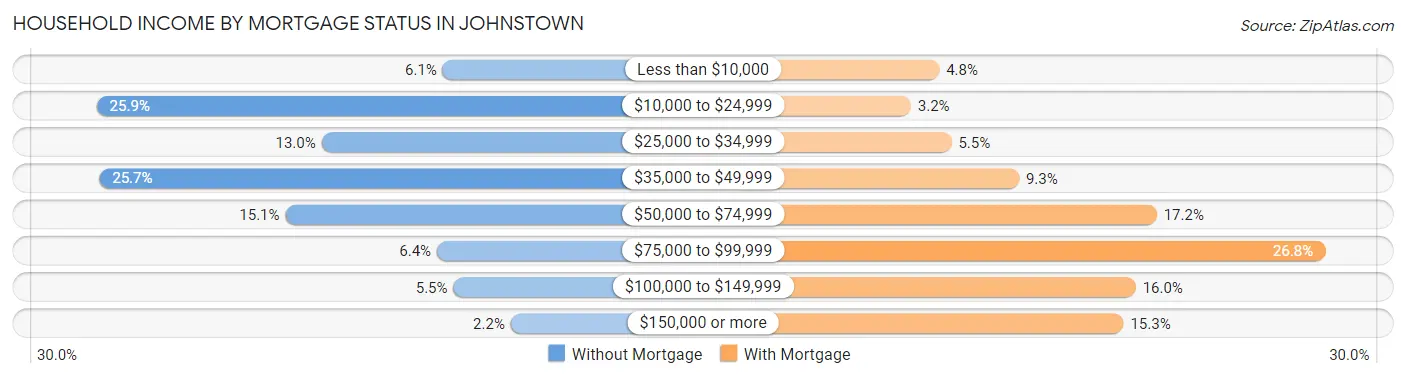
| Household Income | Without Mortgage | With Mortgage |
| Less than $10,000 | 201 (6.1%) | 68 (4.8%) |
| $10,000 to $24,999 | 852 (25.9%) | 45 (3.2%) |
| $25,000 to $34,999 | 429 (13.0%) | 78 (5.5%) |
| $35,000 to $49,999 | 847 (25.7%) | 133 (9.3%) |
| $50,000 to $74,999 | 497 (15.1%) | 245 (17.2%) |
| $75,000 to $99,999 | 212 (6.4%) | 382 (26.8%) |
| $100,000 to $149,999 | 181 (5.5%) | 228 (16.0%) |
| $150,000 or more | 73 (2.2%) | 218 (15.3%) |
| Total | 3,292 (100.0%) | 1,424 (100.0%) |
Property Value to Household Income Ratio in Johnstown
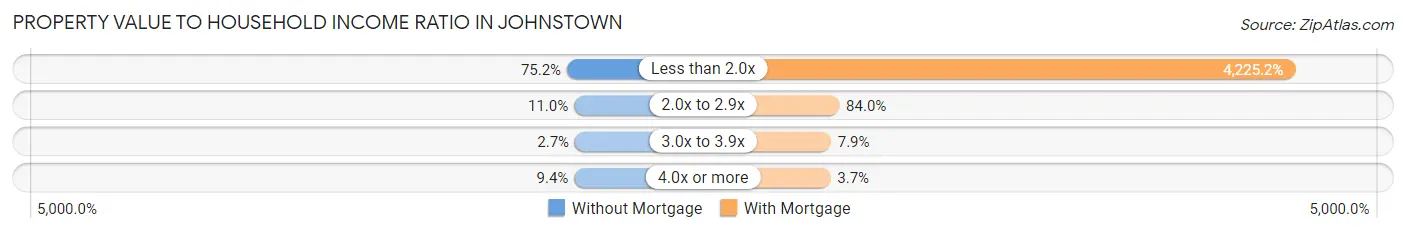
| Value-to-Income Ratio | Without Mortgage | With Mortgage |
| Less than 2.0x | 2,475 (75.2%) | 60,167 (4,225.2%) |
| 2.0x to 2.9x | 361 (11.0%) | 1,196 (84.0%) |
| 3.0x to 3.9x | 90 (2.7%) | 112 (7.9%) |
| 4.0x or more | 308 (9.4%) | 53 (3.7%) |
| Total | 3,292 (100.0%) | 1,424 (100.0%) |
Real Estate Taxes by Mortgage Status in Johnstown
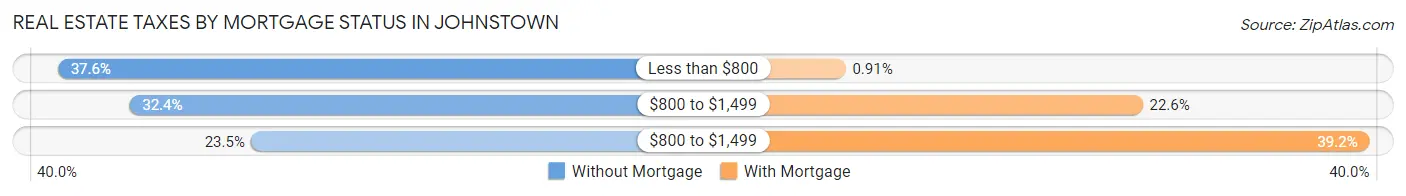
| Property Taxes | Without Mortgage | With Mortgage |
| Less than $800 | 1,237 (37.6%) | 13 (0.9%) |
| $800 to $1,499 | 1,065 (32.4%) | 322 (22.6%) |
| $800 to $1,499 | 773 (23.5%) | 558 (39.2%) |
| Total | 3,292 (100.0%) | 1,424 (100.0%) |
Health & Disability in Johnstown
Health Insurance Coverage by Age in Johnstown
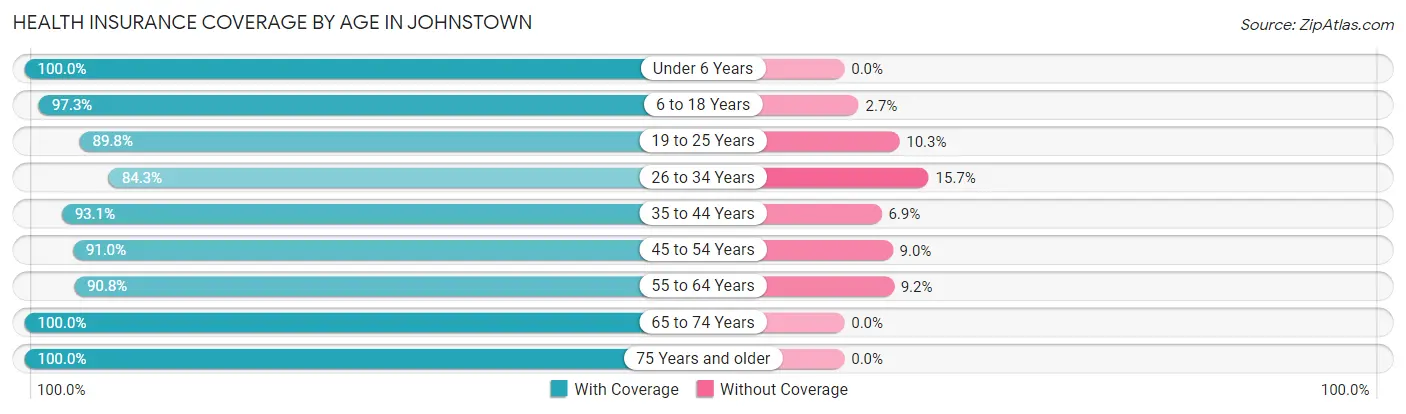
| Age Bracket | With Coverage | Without Coverage |
| Under 6 Years | 1,161 (100.0%) | 0 (0.0%) |
| 6 to 18 Years | 3,135 (97.3%) | 86 (2.7%) |
| 19 to 25 Years | 823 (89.7%) | 94 (10.2%) |
| 26 to 34 Years | 1,775 (84.3%) | 331 (15.7%) |
| 35 to 44 Years | 1,732 (93.1%) | 129 (6.9%) |
| 45 to 54 Years | 2,315 (91.0%) | 229 (9.0%) |
| 55 to 64 Years | 2,702 (90.8%) | 274 (9.2%) |
| 65 to 74 Years | 2,063 (100.0%) | 0 (0.0%) |
| 75 Years and older | 1,536 (100.0%) | 0 (0.0%) |
| Total | 17,242 (93.8%) | 1,143 (6.2%) |
Health Insurance Coverage by Citizenship Status in Johnstown
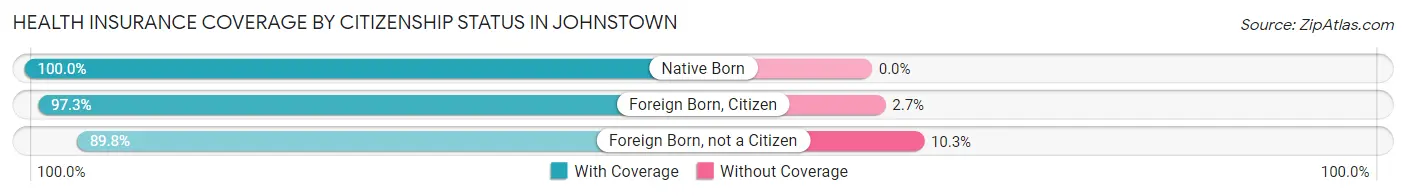
| Citizenship Status | With Coverage | Without Coverage |
| Native Born | 1,161 (100.0%) | 0 (0.0%) |
| Foreign Born, Citizen | 3,135 (97.3%) | 86 (2.7%) |
| Foreign Born, not a Citizen | 823 (89.7%) | 94 (10.2%) |
Health Insurance Coverage by Household Income in Johnstown
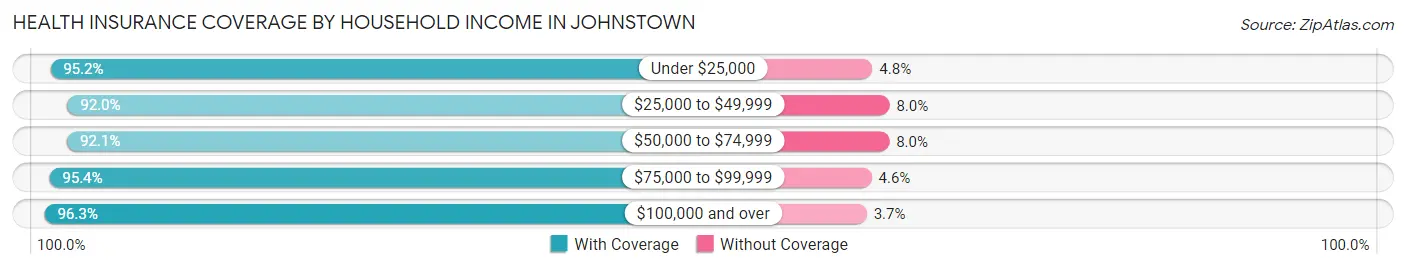
| Household Income | With Coverage | Without Coverage |
| Under $25,000 | 5,470 (95.2%) | 276 (4.8%) |
| $25,000 to $49,999 | 5,510 (92.0%) | 479 (8.0%) |
| $50,000 to $74,999 | 2,592 (92.0%) | 224 (8.0%) |
| $75,000 to $99,999 | 1,274 (95.4%) | 62 (4.6%) |
| $100,000 and over | 2,295 (96.3%) | 89 (3.7%) |
Public vs Private Health Insurance Coverage by Age in Johnstown
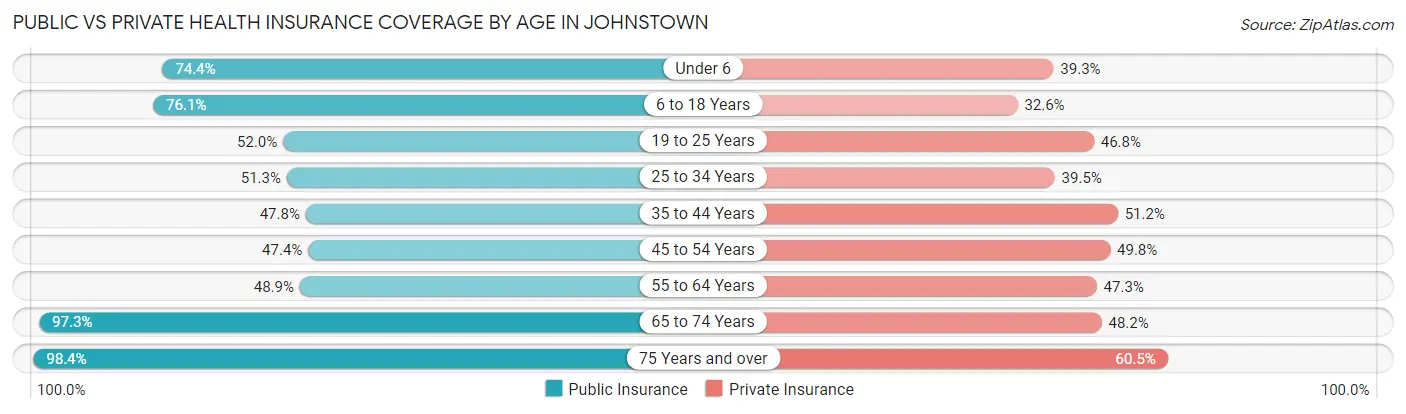
| Age Bracket | Public Insurance | Private Insurance |
| Under 6 | 864 (74.4%) | 456 (39.3%) |
| 6 to 18 Years | 2,452 (76.1%) | 1,050 (32.6%) |
| 19 to 25 Years | 477 (52.0%) | 429 (46.8%) |
| 25 to 34 Years | 1,081 (51.3%) | 832 (39.5%) |
| 35 to 44 Years | 890 (47.8%) | 953 (51.2%) |
| 45 to 54 Years | 1,205 (47.4%) | 1,267 (49.8%) |
| 55 to 64 Years | 1,456 (48.9%) | 1,408 (47.3%) |
| 65 to 74 Years | 2,007 (97.3%) | 995 (48.2%) |
| 75 Years and over | 1,511 (98.4%) | 929 (60.5%) |
| Total | 11,943 (65.0%) | 8,319 (45.3%) |
Disability Status by Sex by Age in Johnstown
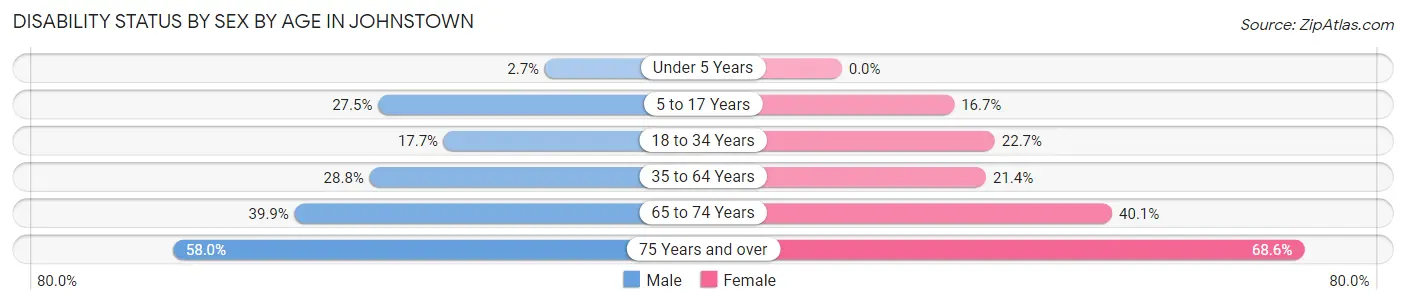
| Age Bracket | Male | Female |
| Under 5 Years | 13 (2.7%) | 0 (0.0%) |
| 5 to 17 Years | 499 (27.5%) | 248 (16.7%) |
| 18 to 34 Years | 252 (17.7%) | 405 (22.7%) |
| 35 to 64 Years | 1,054 (28.8%) | 796 (21.4%) |
| 65 to 74 Years | 354 (39.9%) | 472 (40.1%) |
| 75 Years and over | 338 (58.0%) | 654 (68.6%) |
Disability Class by Sex by Age in Johnstown
Disability Class: Hearing Difficulty
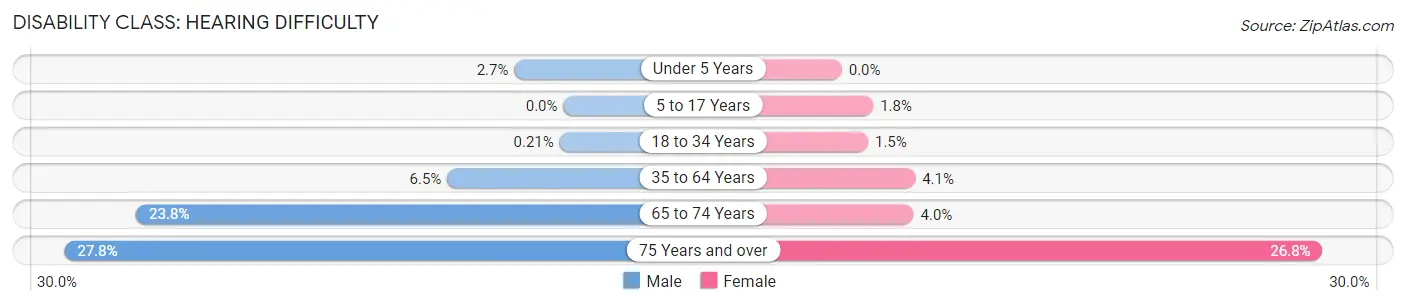
| Age Bracket | Male | Female |
| Under 5 Years | 13 (2.7%) | 0 (0.0%) |
| 5 to 17 Years | 0 (0.0%) | 26 (1.8%) |
| 18 to 34 Years | 3 (0.2%) | 26 (1.5%) |
| 35 to 64 Years | 237 (6.5%) | 152 (4.1%) |
| 65 to 74 Years | 211 (23.8%) | 47 (4.0%) |
| 75 Years and over | 162 (27.8%) | 255 (26.8%) |
Disability Class: Vision Difficulty
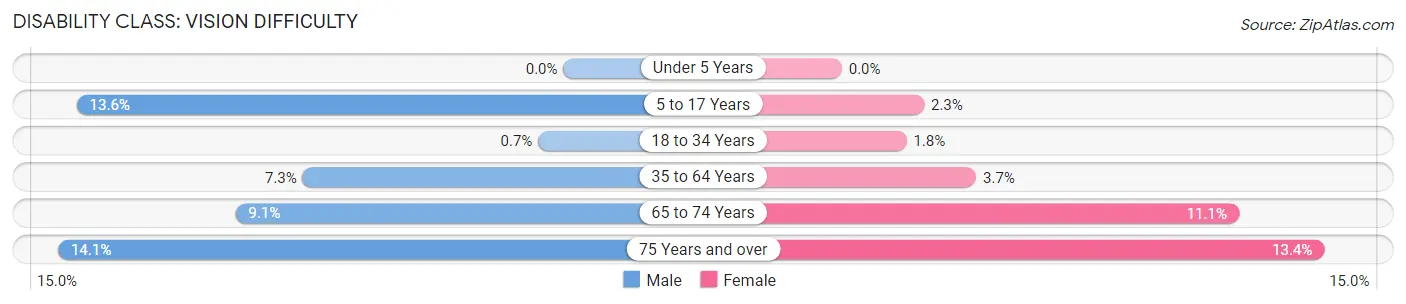
| Age Bracket | Male | Female |
| Under 5 Years | 0 (0.0%) | 0 (0.0%) |
| 5 to 17 Years | 246 (13.6%) | 34 (2.3%) |
| 18 to 34 Years | 10 (0.7%) | 32 (1.8%) |
| 35 to 64 Years | 266 (7.3%) | 139 (3.7%) |
| 65 to 74 Years | 81 (9.1%) | 130 (11.1%) |
| 75 Years and over | 82 (14.1%) | 128 (13.4%) |
Disability Class: Cognitive Difficulty
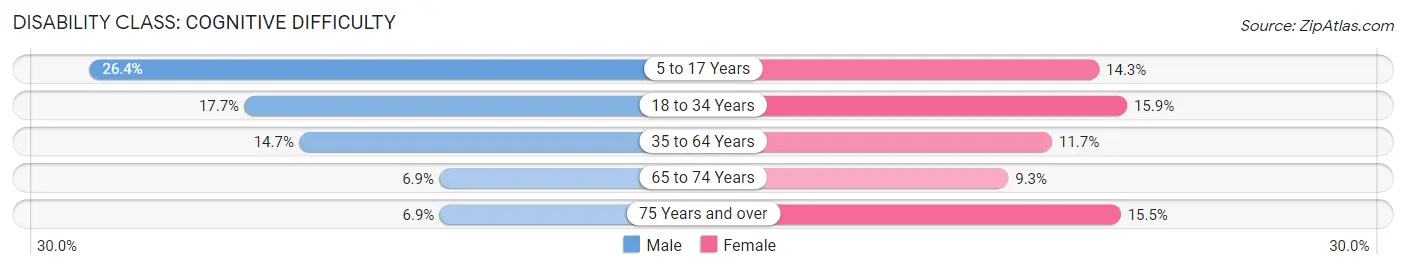
| Age Bracket | Male | Female |
| 5 to 17 Years | 479 (26.4%) | 213 (14.3%) |
| 18 to 34 Years | 252 (17.7%) | 283 (15.9%) |
| 35 to 64 Years | 538 (14.7%) | 435 (11.7%) |
| 65 to 74 Years | 61 (6.9%) | 109 (9.3%) |
| 75 Years and over | 40 (6.9%) | 148 (15.5%) |
Disability Class: Ambulatory Difficulty
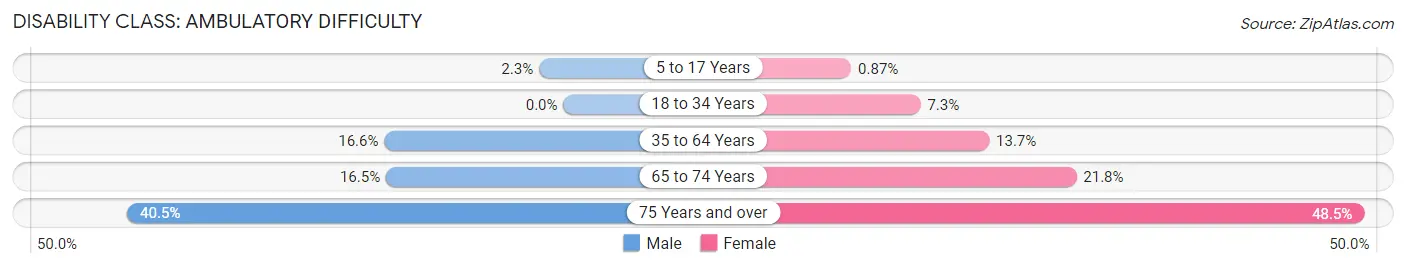
| Age Bracket | Male | Female |
| 5 to 17 Years | 41 (2.3%) | 13 (0.9%) |
| 18 to 34 Years | 0 (0.0%) | 130 (7.3%) |
| 35 to 64 Years | 609 (16.6%) | 508 (13.7%) |
| 65 to 74 Years | 146 (16.5%) | 256 (21.8%) |
| 75 Years and over | 236 (40.5%) | 462 (48.5%) |
Disability Class: Self-Care Difficulty
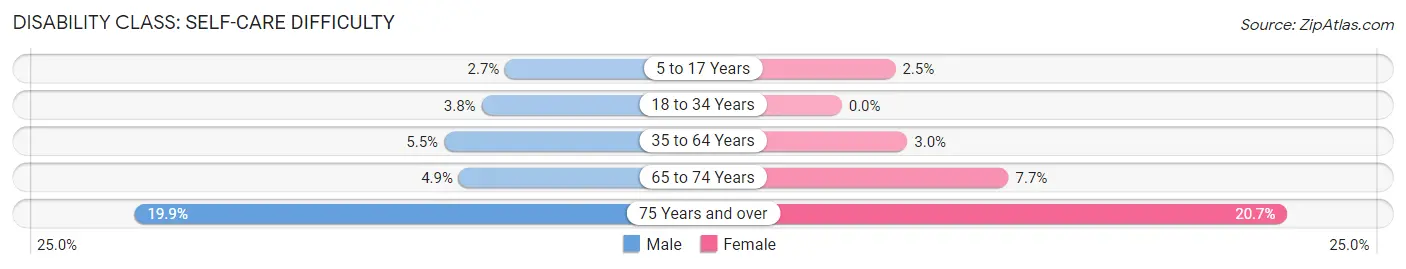
| Age Bracket | Male | Female |
| 5 to 17 Years | 49 (2.7%) | 37 (2.5%) |
| 18 to 34 Years | 54 (3.8%) | 0 (0.0%) |
| 35 to 64 Years | 203 (5.5%) | 113 (3.0%) |
| 65 to 74 Years | 43 (4.9%) | 91 (7.7%) |
| 75 Years and over | 116 (19.9%) | 197 (20.7%) |
Technology Access in Johnstown
Computing Device Access in Johnstown
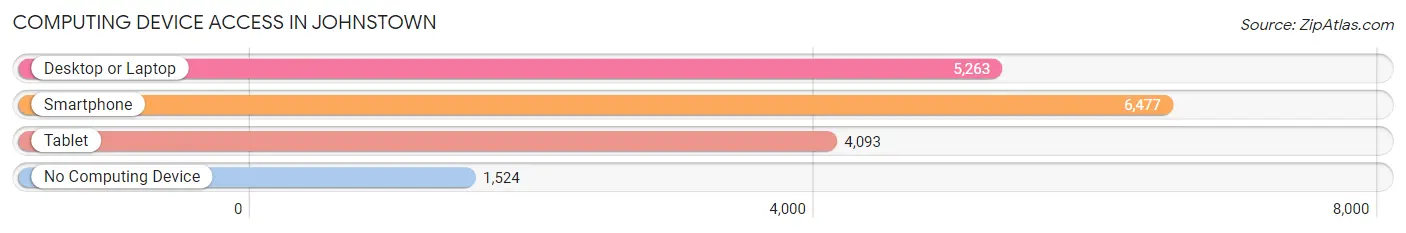
| Device Type | # Households | % Households |
| Desktop or Laptop | 5,263 | 58.1% |
| Smartphone | 6,477 | 71.5% |
| Tablet | 4,093 | 45.2% |
| No Computing Device | 1,524 | 16.8% |
| Total | 9,061 | 100.0% |
Internet Access in Johnstown
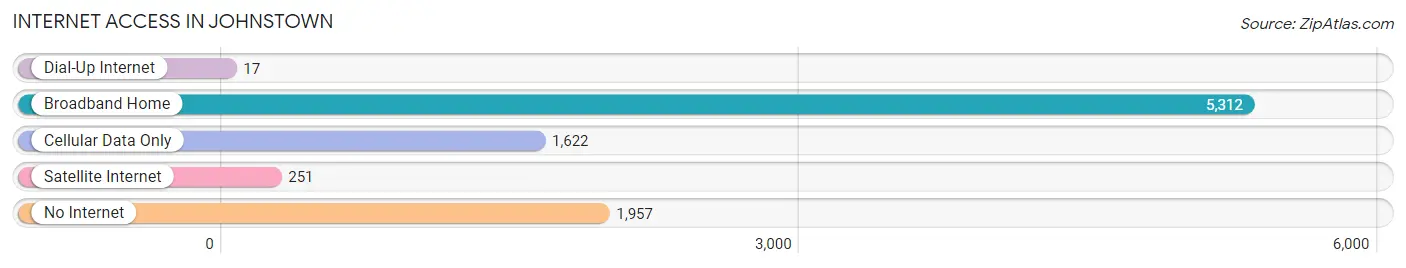
| Internet Type | # Households | % Households |
| Dial-Up Internet | 17 | 0.2% |
| Broadband Home | 5,312 | 58.6% |
| Cellular Data Only | 1,622 | 17.9% |
| Satellite Internet | 251 | 2.8% |
| No Internet | 1,957 | 21.6% |
| Total | 9,061 | 100.0% |
Johnstown Summary
Johnstown, Pennsylvania is a city located in Cambria County, Pennsylvania, United States. It is situated in the foothills of the Allegheny Mountains, approximately 75 miles east of Pittsburgh. The city is situated along the Conemaugh River, which is a tributary of the Allegheny River. The city is the county seat of Cambria County and is the largest city in the county. As of the 2010 census, the city had a population of 20,978.
History
Johnstown was founded in 1794 by William Smith, a settler from Maryland. Smith named the city after his son, John Smith. The city was incorporated in 1831 and was a major industrial center during the 19th and 20th centuries. The city was the site of the infamous Johnstown Flood of 1889, which killed over 2,200 people and destroyed much of the city. The city was rebuilt after the flood and continued to be an important industrial center.
Geography
Johnstown is located in the foothills of the Allegheny Mountains at an elevation of 1,945 feet. The city is situated along the Conemaugh River, which is a tributary of the Allegheny River. The city is located approximately 75 miles east of Pittsburgh. The city has a total area of 8.2 square miles, all of which is land.
Economy
Johnstown has a diversified economy that is based on manufacturing, healthcare, education, and tourism. The city is home to several major employers, including UPMC, Conemaugh Health System, Johnstown Area Regional Industries, and the Johnstown Redevelopment Authority. The city is also home to several educational institutions, including the University of Pittsburgh at Johnstown, Pennsylvania Highlands Community College, and the Cambria County Career and Technical Center.
Tourism is also an important part of the city’s economy. The city is home to several attractions, including the Johnstown Flood National Memorial, the Johnstown Inclined Plane, and the Johnstown Symphony Orchestra.
Demographics
As of the 2010 census, the city had a population of 20,978. The racial makeup of the city was 92.3% White, 4.2% African American, 0.3% Native American, 0.7% Asian, 0.1% Pacific Islander, 0.9% from other races, and 1.5% from two or more races. Hispanic or Latino of any race were 2.2% of the population.
The median income for a household in the city was $30,945, and the median income for a family was $41,945. The per capita income for the city was $17,845. About 16.2% of the population was below the poverty line.
Common Questions
What is Per Capita Income in Johnstown?
Per Capita income in Johnstown is $21,488.
What is the Median Family Income in Johnstown?
Median Family Income in Johnstown is $41,734.
What is the Median Household income in Johnstown?
Median Household Income in Johnstown is $33,466.
What is Income or Wage Gap in Johnstown?
Income or Wage Gap in Johnstown is 20.1%.
Women in Johnstown earn 79.9 cents for every dollar earned by a man.
What is Family Income Deficit in Johnstown?
Family Income Deficit in Johnstown is $11,445.
Families that are below poverty line in Johnstown earn $11,445 less on average than the poverty threshold level.
What is Inequality or Gini Index in Johnstown?
Inequality or Gini Index in Johnstown is 0.46.
What is the Total Population of Johnstown?
Total Population of Johnstown is 18,429.
What is the Total Male Population of Johnstown?
Total Male Population of Johnstown is 8,886.
What is the Total Female Population of Johnstown?
Total Female Population of Johnstown is 9,543.
What is the Ratio of Males per 100 Females in Johnstown?
There are 93.12 Males per 100 Females in Johnstown.
What is the Ratio of Females per 100 Males in Johnstown?
There are 107.39 Females per 100 Males in Johnstown.
What is the Median Population Age in Johnstown?
Median Population Age in Johnstown is 44.0 Years.
What is the Average Family Size in Johnstown
Average Family Size in Johnstown is 3.0 People.
What is the Average Household Size in Johnstown
Average Household Size in Johnstown is 2.0 People.
How Large is the Labor Force in Johnstown?
There are 7,887 People in the Labor Forcein in Johnstown.
What is the Percentage of People in the Labor Force in Johnstown?
53.3% of People are in the Labor Force in Johnstown.
What is the Unemployment Rate in Johnstown?
Unemployment Rate in Johnstown is 7.1%.