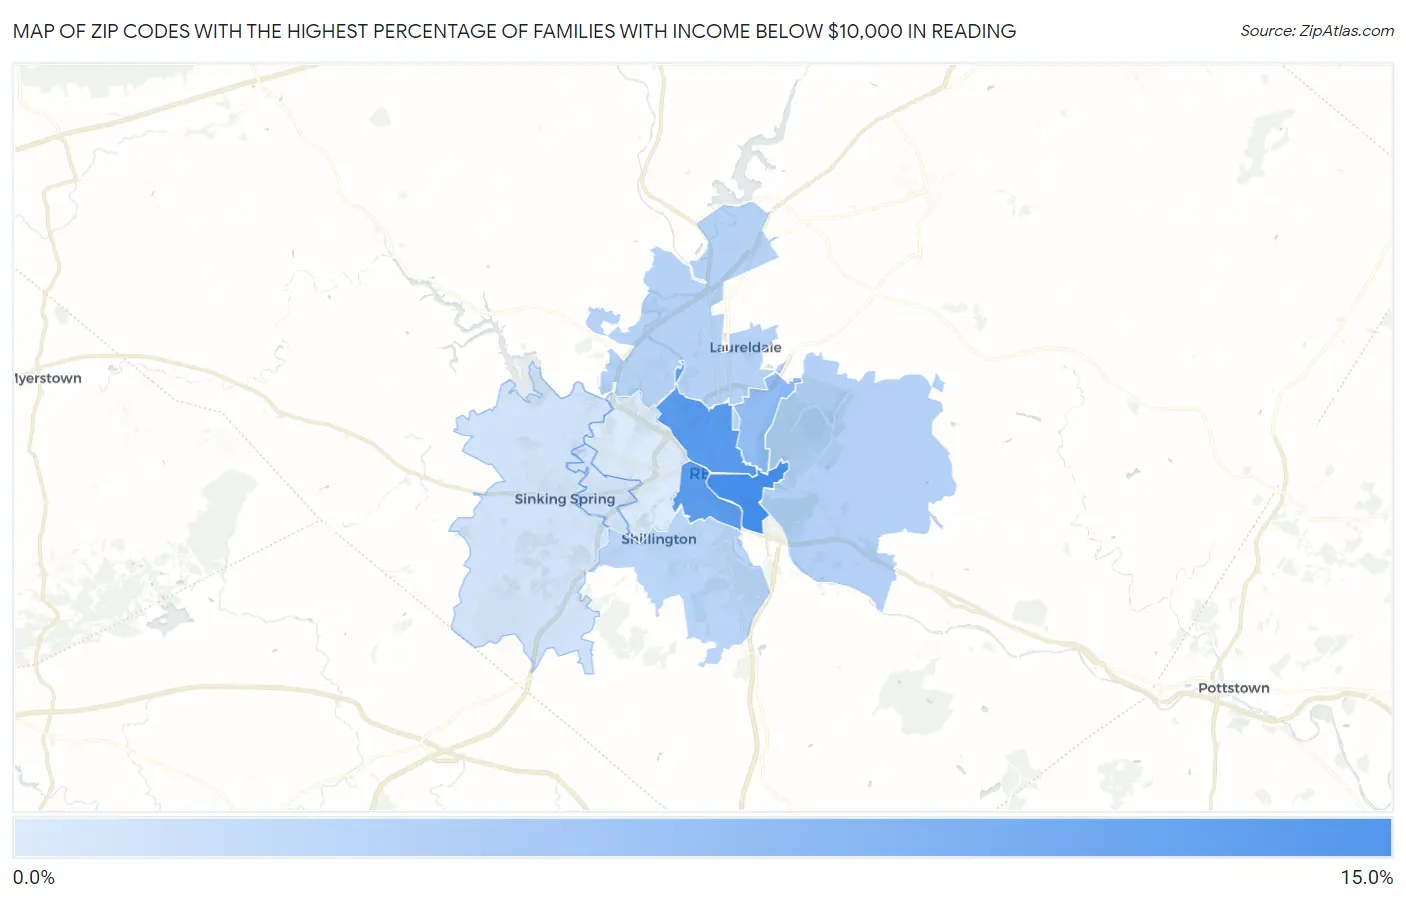
Zip Codes with the Highest Percentage of Families with Income Below $10,000 in Reading, PA
RELATED REPORTS & OPTIONS
Family Income | $0-10k
Reading
Compare Zip Codes
Map of Zip Codes with the Highest Percentage of Families with Income Below $10,000 in Reading
0.50%
12.2%
Zip Codes with the Highest Percentage of Families with Income Below $10,000 in Reading, PA
| Zip Code | Families with Income < $10k | vs State | vs National | |
| 1. | 19602 | 12.2% | 2.9%(+9.30)#43 | 3.1%(+9.10)#1,280 |
| 2. | 19601 | 10.9% | 2.9%(+8.00)#57 | 3.1%(+7.80)#1,608 |
| 3. | 19611 | 10.5% | 2.9%(+7.60)#63 | 3.1%(+7.40)#1,740 |
| 4. | 19604 | 6.3% | 2.9%(+3.40)#160 | 3.1%(+3.20)#4,303 |
| 5. | 19606 | 3.6% | 2.9%(+0.700)#393 | 3.1%(+0.500)#9,236 |
| 6. | 19605 | 3.4% | 2.9%(+0.500)#422 | 3.1%(+0.300)#9,855 |
| 7. | 19607 | 3.0% | 2.9%(+0.100)#486 | 3.1%(-0.100)#11,159 |
| 8. | 19609 | 1.4% | 2.9%(-1.50)#904 | 3.1%(-1.70)#18,379 |
| 9. | 19608 | 1.3% | 2.9%(-1.60)#929 | 3.1%(-1.80)#18,781 |
| 10. | 19610 | 0.50% | 2.9%(-2.40)#1,153 | 3.1%(-2.60)#22,683 |
1
Common Questions
What are the Top 5 Zip Codes with the Highest Percentage of Families with Income Below $10,000 in Reading, PA?
Top 5 Zip Codes with the Highest Percentage of Families with Income Below $10,000 in Reading, PA are:
What zip code has the Highest Percentage of Families with Income Below $10,000 in Reading, PA?
19602 has the Highest Percentage of Families with Income Below $10,000 in Reading, PA with 12.2%.
What is the Percentage of Families with Income Below $10,000 in Reading, PA?
Percentage of Families with Income Below $10,000 in Reading is 10.2%.
What is the Percentage of Families with Income Below $10,000 in Pennsylvania?
Percentage of Families with Income Below $10,000 in Pennsylvania is 2.9%.
What is the Percentage of Families with Income Below $10,000 in the United States?
Percentage of Families with Income Below $10,000 in the United States is 3.1%.