Frizzleburg, PA Map & Demographics
Frizzleburg Map
Frizzleburg Overview
$47,786
PER CAPITA INCOME
$80,227
AVG FAMILY INCOME
$38,188
AVG HOUSEHOLD INCOME
39.4%
WAGE / INCOME GAP [ % ]
60.6¢/ $1
WAGE / INCOME GAP [ $ ]
0.60
INEQUALITY / GINI INDEX
300
TOTAL POPULATION
147
MALE POPULATION
153
FEMALE POPULATION
96.08
MALES / 100 FEMALES
104.08
FEMALES / 100 MALES
55.5
MEDIAN AGE
2.1
AVG FAMILY SIZE
1.7
AVG HOUSEHOLD SIZE
118
LABOR FORCE [ PEOPLE ]
46.6%
PERCENT IN LABOR FORCE
Income in Frizzleburg
Income Overview in Frizzleburg
Per Capita Income in Frizzleburg is $47,786, while median incomes of families and households are $80,227 and $38,188 respectively.
| Characteristic | Number | Measure |
| Per Capita Income | 300 | $47,786 |
| Median Family Income | 100 | $80,227 |
| Mean Family Income | 100 | $121,754 |
| Median Household Income | 173 | $38,188 |
| Mean Household Income | 173 | $83,192 |
| Income Deficit | 100 | $0 |
| Wage / Income Gap (%) | 300 | 39.36% |
| Wage / Income Gap ($) | 300 | 60.64¢ per $1 |
| Gini / Inequality Index | 300 | 0.60 |
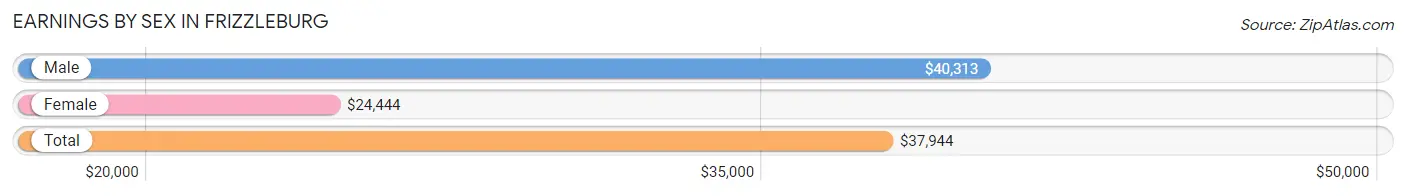
Earnings by Sex in Frizzleburg
Average Earnings in Frizzleburg are $37,944, $40,313 for men and $24,444 for women, a difference of 39.4%.
| Sex | Number | Average Earnings |
| Male | 63 (41.2%) | $40,313 |
| Female | 90 (58.8%) | $24,444 |
| Total | 153 (100.0%) | $37,944 |
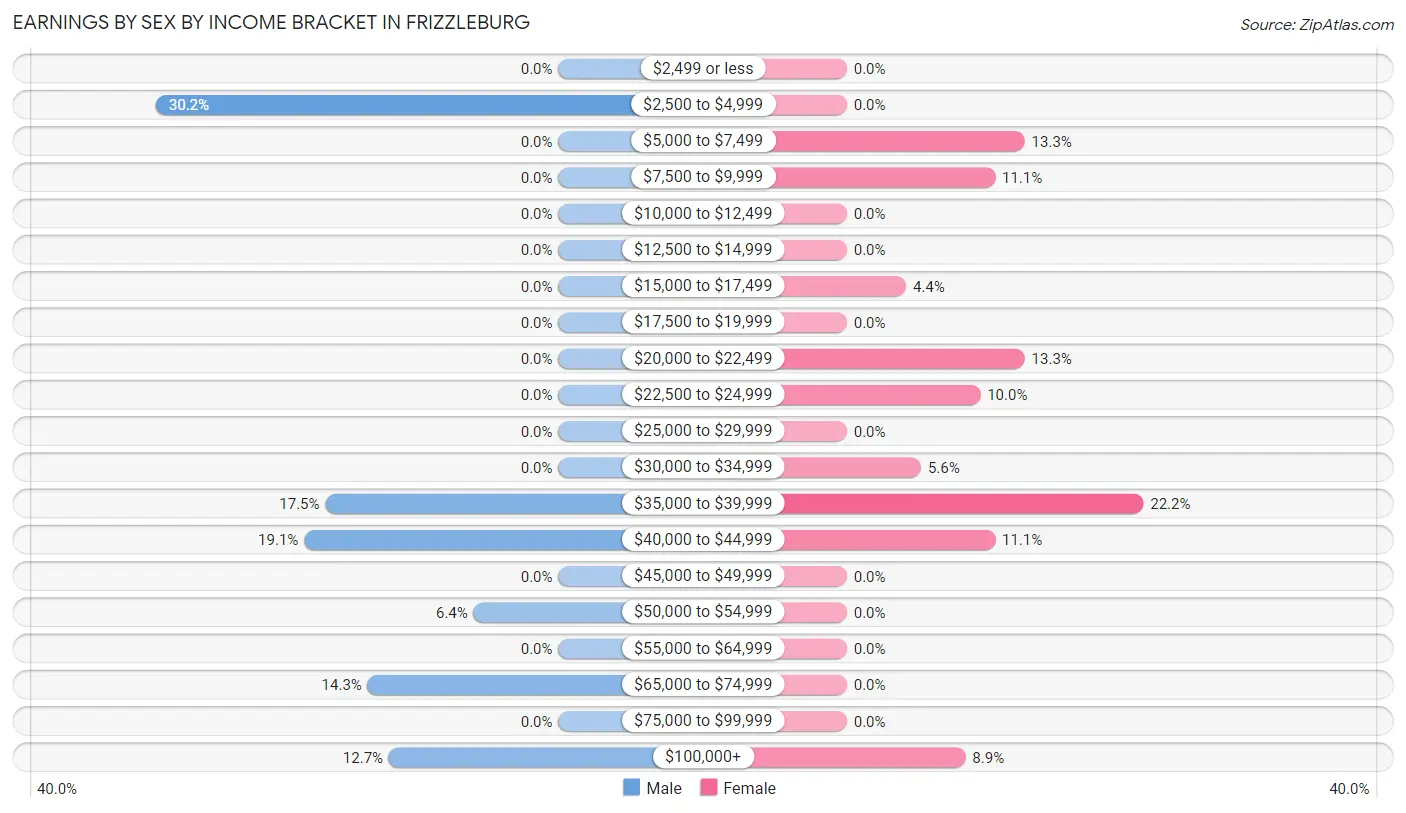
Earnings by Sex by Income Bracket in Frizzleburg
The most common earnings brackets in Frizzleburg are $2,500 to $4,999 for men (19 | 30.2%) and $35,000 to $39,999 for women (20 | 22.2%).
| Income | Male | Female |
| $2,499 or less | 0 (0.0%) | 0 (0.0%) |
| $2,500 to $4,999 | 19 (30.2%) | 0 (0.0%) |
| $5,000 to $7,499 | 0 (0.0%) | 12 (13.3%) |
| $7,500 to $9,999 | 0 (0.0%) | 10 (11.1%) |
| $10,000 to $12,499 | 0 (0.0%) | 0 (0.0%) |
| $12,500 to $14,999 | 0 (0.0%) | 0 (0.0%) |
| $15,000 to $17,499 | 0 (0.0%) | 4 (4.4%) |
| $17,500 to $19,999 | 0 (0.0%) | 0 (0.0%) |
| $20,000 to $22,499 | 0 (0.0%) | 12 (13.3%) |
| $22,500 to $24,999 | 0 (0.0%) | 9 (10.0%) |
| $25,000 to $29,999 | 0 (0.0%) | 0 (0.0%) |
| $30,000 to $34,999 | 0 (0.0%) | 5 (5.6%) |
| $35,000 to $39,999 | 11 (17.5%) | 20 (22.2%) |
| $40,000 to $44,999 | 12 (19.1%) | 10 (11.1%) |
| $45,000 to $49,999 | 0 (0.0%) | 0 (0.0%) |
| $50,000 to $54,999 | 4 (6.4%) | 0 (0.0%) |
| $55,000 to $64,999 | 0 (0.0%) | 0 (0.0%) |
| $65,000 to $74,999 | 9 (14.3%) | 0 (0.0%) |
| $75,000 to $99,999 | 0 (0.0%) | 0 (0.0%) |
| $100,000+ | 8 (12.7%) | 8 (8.9%) |
| Total | 63 (100.0%) | 90 (100.0%) |
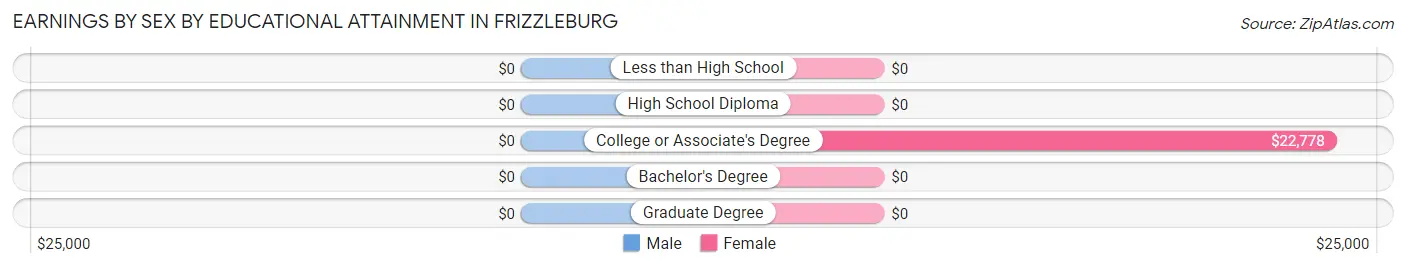
Earnings by Sex by Educational Attainment in Frizzleburg
| Educational Attainment | Male Income | Female Income |
| Less than High School | - | - |
| High School Diploma | - | - |
| College or Associate's Degree | - | - |
| Bachelor's Degree | - | - |
| Graduate Degree | - | - |
| Total | $40,313 | $34,500 |
Family Income in Frizzleburg
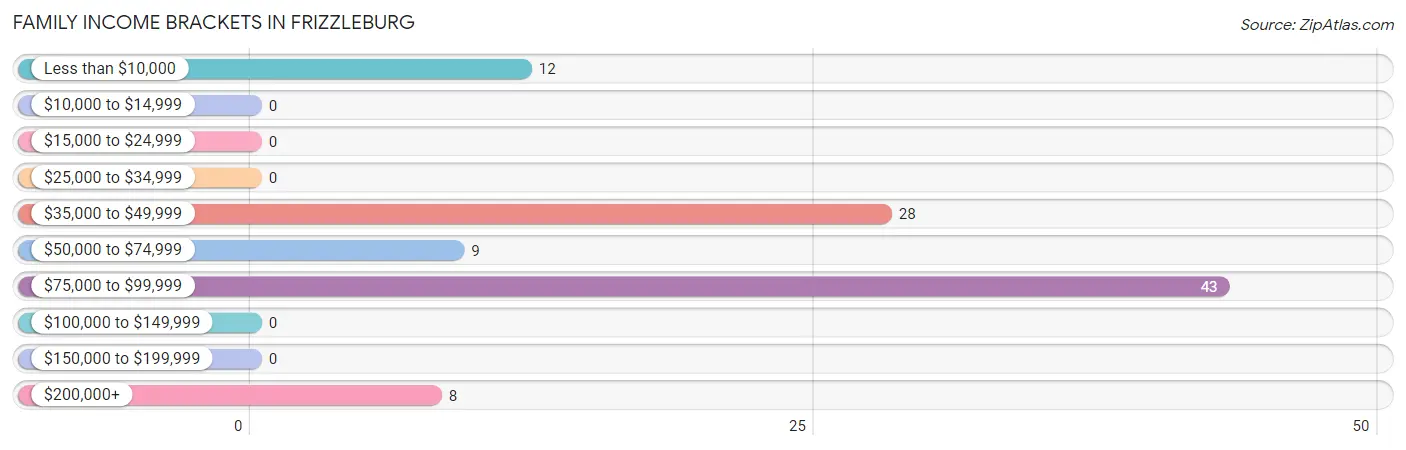
Family Income Brackets in Frizzleburg
According to the Frizzleburg family income data, there are 43 families falling into the $75,000 to $99,999 income range, which is the most common income bracket and makes up 43.0% of all families.
| Income Bracket | # Families | % Families |
| Less than $10,000 | 12 | 12.0% |
| $10,000 to $14,999 | 0 | 0.0% |
| $15,000 to $24,999 | 0 | 0.0% |
| $25,000 to $34,999 | 0 | 0.0% |
| $35,000 to $49,999 | 28 | 28.0% |
| $50,000 to $74,999 | 9 | 9.0% |
| $75,000 to $99,999 | 43 | 43.0% |
| $100,000 to $149,999 | 0 | 0.0% |
| $150,000 to $199,999 | 0 | 0.0% |
| $200,000+ | 8 | 8.0% |
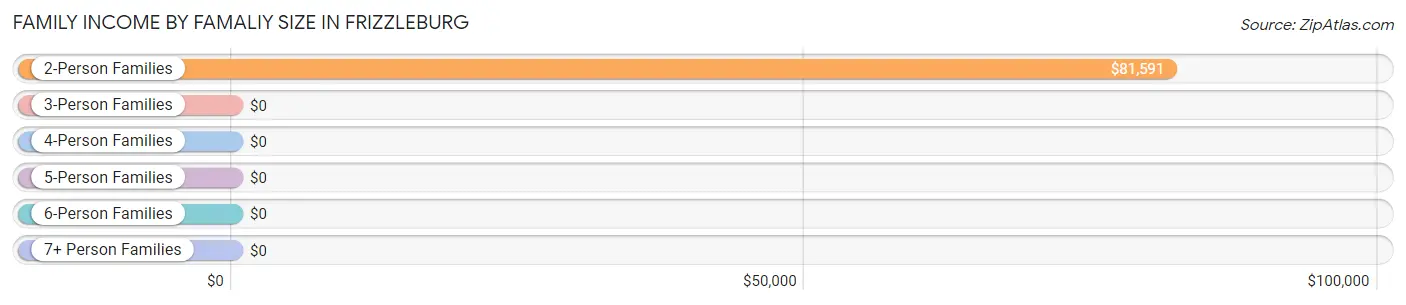
Family Income by Famaliy Size in Frizzleburg
2-person families (88 | 88.0%) account for the highest median family income in Frizzleburg with $81,591 per family, while 2-person families (88 | 88.0%) have the highest median income of $40,796 per family member.
| Income Bracket | # Families | Median Income |
| 2-Person Families | 88 (88.0%) | $81,591 |
| 3-Person Families | 12 (12.0%) | $0 |
| 4-Person Families | 0 (0.0%) | $0 |
| 5-Person Families | 0 (0.0%) | $0 |
| 6-Person Families | 0 (0.0%) | $0 |
| 7+ Person Families | 0 (0.0%) | $0 |
| Total | 100 (100.0%) | $80,227 |
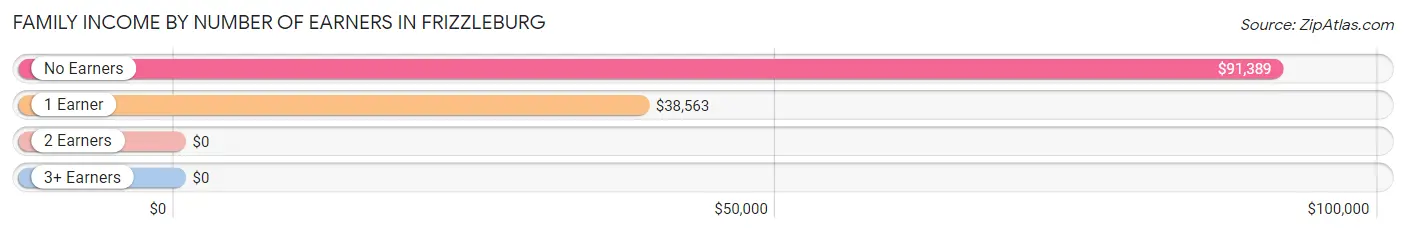
Family Income by Number of Earners in Frizzleburg
| Number of Earners | # Families | Median Income |
| No Earners | 26 (26.0%) | $91,389 |
| 1 Earner | 41 (41.0%) | $38,563 |
| 2 Earners | 33 (33.0%) | $0 |
| 3+ Earners | 0 (0.0%) | $0 |
| Total | 100 (100.0%) | $80,227 |
Household Income in Frizzleburg
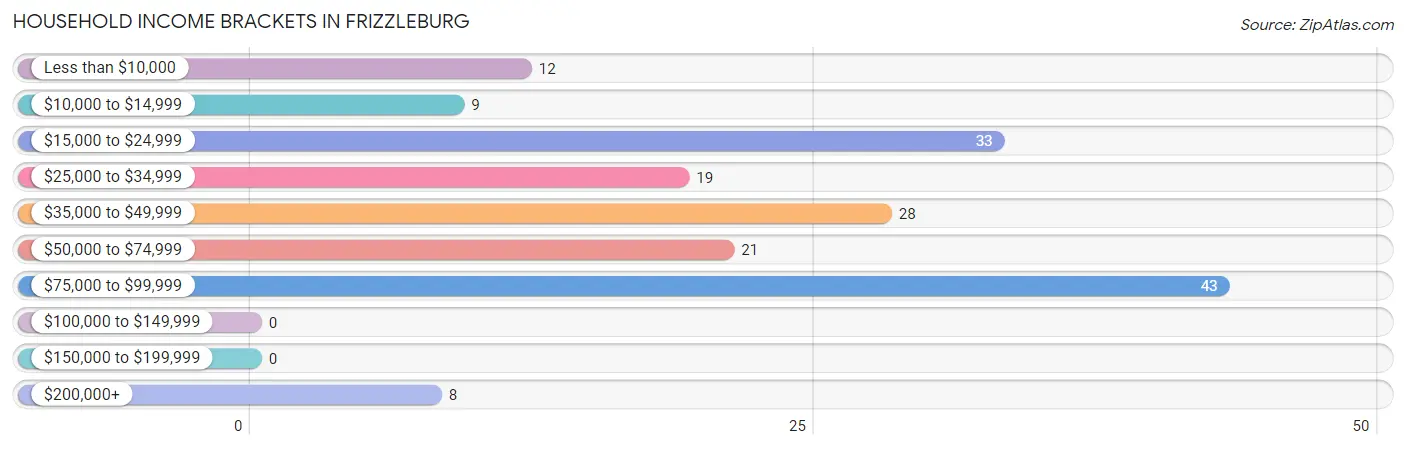
Household Income Brackets in Frizzleburg
With 43 households falling in the category, the $75,000 to $99,999 income range is the most frequent in Frizzleburg, accounting for 24.9% of all households.
| Income Bracket | # Households | % Households |
| Less than $10,000 | 12 | 6.9% |
| $10,000 to $14,999 | 9 | 5.2% |
| $15,000 to $24,999 | 33 | 19.1% |
| $25,000 to $34,999 | 19 | 11.0% |
| $35,000 to $49,999 | 28 | 16.2% |
| $50,000 to $74,999 | 21 | 12.1% |
| $75,000 to $99,999 | 43 | 24.9% |
| $100,000 to $149,999 | 0 | 0.0% |
| $150,000 to $199,999 | 0 | 0.0% |
| $200,000+ | 8 | 4.6% |
Household Income by Householder Age in Frizzleburg
The median household income in Frizzleburg is $38,188, with the highest median household income of $38,563 found in the 25 to 44 years age bracket for the primary householder. A total of 55 households (31.8%) fall into this category. Meanwhile, the 15 to 24 years age bracket for the primary householder has the lowest median household income of $0, with 12 households (6.9%) in this group.
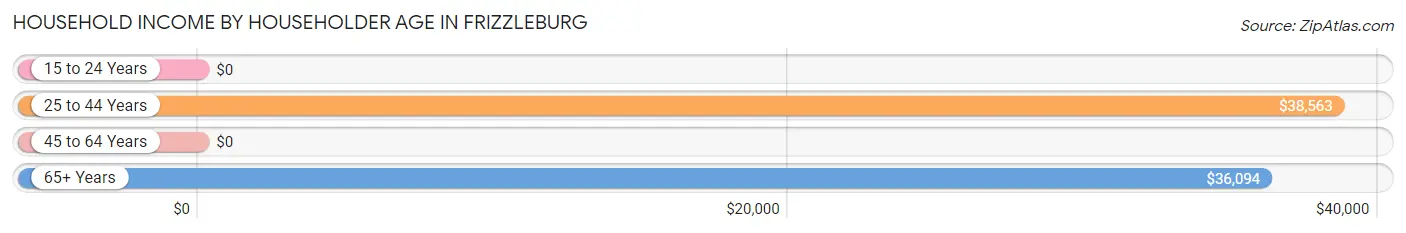
| Income Bracket | # Households | Median Income |
| 15 to 24 Years | 12 (6.9%) | $0 |
| 25 to 44 Years | 55 (31.8%) | $38,563 |
| 45 to 64 Years | 43 (24.9%) | $0 |
| 65+ Years | 63 (36.4%) | $36,094 |
| Total | 173 (100.0%) | $38,188 |
Poverty in Frizzleburg
Income Below Poverty by Sex and Age in Frizzleburg
With 16.3% poverty level for males and 13.7% for females among the residents of Frizzleburg, under 5 year old males and 18 to 24 year old females are the most vulnerable to poverty, with 24 males (100.0%) and 12 females (100.0%) in their respective age groups living below the poverty level.
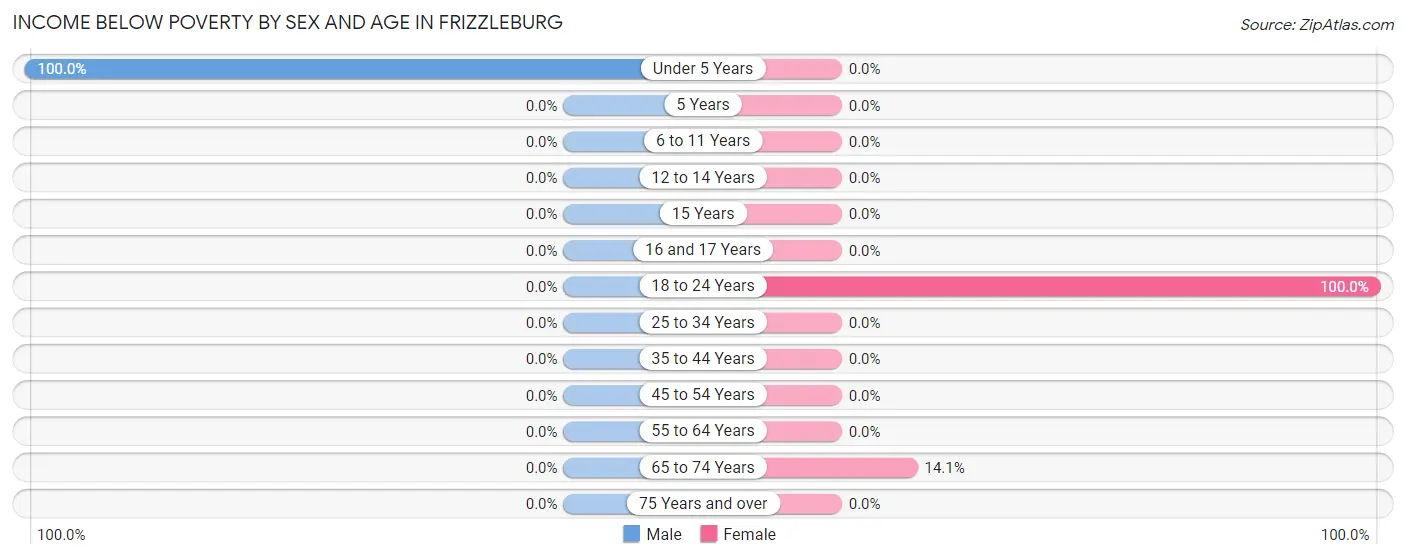
| Age Bracket | Male | Female |
| Under 5 Years | 24 (100.0%) | 0 (0.0%) |
| 5 Years | 0 (0.0%) | 0 (0.0%) |
| 6 to 11 Years | 0 (0.0%) | 0 (0.0%) |
| 12 to 14 Years | 0 (0.0%) | 0 (0.0%) |
| 15 Years | 0 (0.0%) | 0 (0.0%) |
| 16 and 17 Years | 0 (0.0%) | 0 (0.0%) |
| 18 to 24 Years | 0 (0.0%) | 12 (100.0%) |
| 25 to 34 Years | 0 (0.0%) | 0 (0.0%) |
| 35 to 44 Years | 0 (0.0%) | 0 (0.0%) |
| 45 to 54 Years | 0 (0.0%) | 0 (0.0%) |
| 55 to 64 Years | 0 (0.0%) | 0 (0.0%) |
| 65 to 74 Years | 0 (0.0%) | 9 (14.1%) |
| 75 Years and over | 0 (0.0%) | 0 (0.0%) |
| Total | 24 (16.3%) | 21 (13.7%) |
Income Above Poverty by Sex and Age in Frizzleburg
According to the poverty statistics in Frizzleburg, males aged 15 years and females aged 25 to 34 years are the age groups that are most secure financially, with 100.0% of males and 100.0% of females in these age groups living above the poverty line.
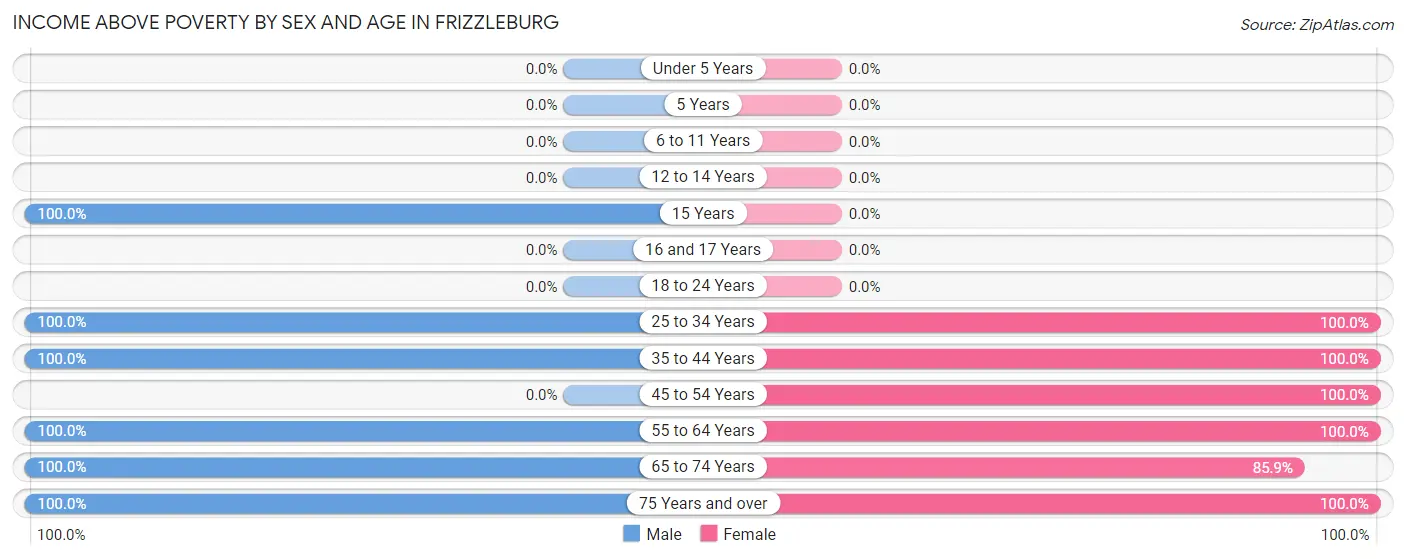
| Age Bracket | Male | Female |
| Under 5 Years | 0 (0.0%) | 0 (0.0%) |
| 5 Years | 0 (0.0%) | 0 (0.0%) |
| 6 to 11 Years | 0 (0.0%) | 0 (0.0%) |
| 12 to 14 Years | 0 (0.0%) | 0 (0.0%) |
| 15 Years | 23 (100.0%) | 0 (0.0%) |
| 16 and 17 Years | 0 (0.0%) | 0 (0.0%) |
| 18 to 24 Years | 0 (0.0%) | 0 (0.0%) |
| 25 to 34 Years | 15 (100.0%) | 15 (100.0%) |
| 35 to 44 Years | 19 (100.0%) | 20 (100.0%) |
| 45 to 54 Years | 0 (0.0%) | 12 (100.0%) |
| 55 to 64 Years | 39 (100.0%) | 21 (100.0%) |
| 65 to 74 Years | 9 (100.0%) | 55 (85.9%) |
| 75 Years and over | 18 (100.0%) | 9 (100.0%) |
| Total | 123 (83.7%) | 132 (86.3%) |
Income Below Poverty Among Married-Couple Families in Frizzleburg
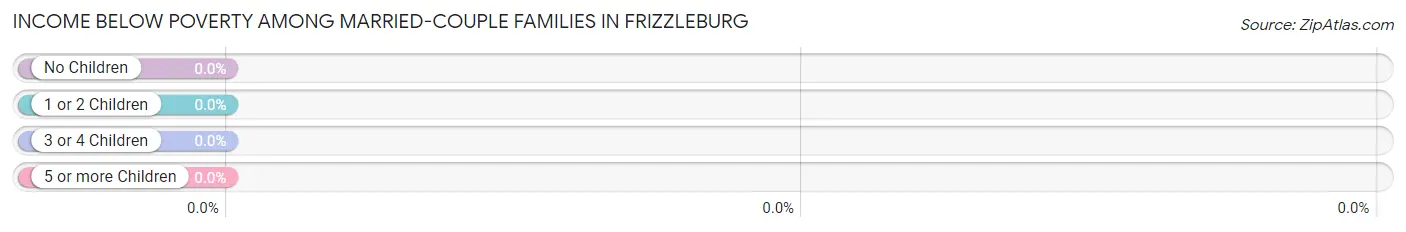
| Children | Above Poverty | Below Poverty |
| No Children | 60 (100.0%) | 0 (0.0%) |
| 1 or 2 Children | 0 (0.0%) | 0 (0.0%) |
| 3 or 4 Children | 0 (0.0%) | 0 (0.0%) |
| 5 or more Children | 0 (0.0%) | 0 (0.0%) |
| Total | 60 (100.0%) | 0 (0.0%) |
Income Below Poverty Among Single-Parent Households in Frizzleburg
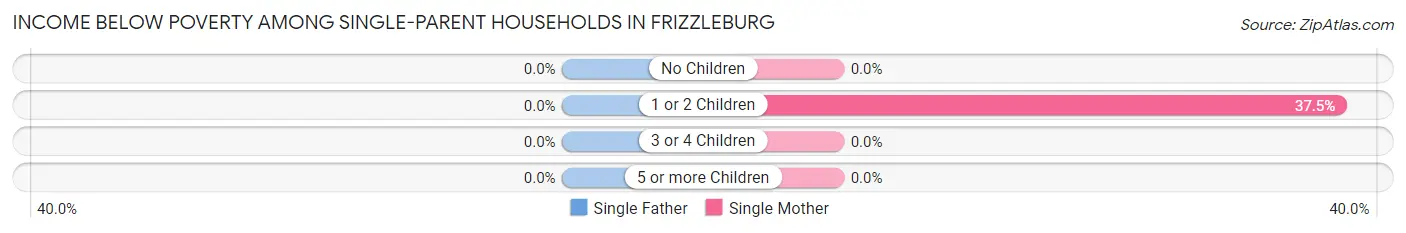
| Children | Single Father | Single Mother |
| No Children | 0 (0.0%) | 0 (0.0%) |
| 1 or 2 Children | 0 (0.0%) | 12 (37.5%) |
| 3 or 4 Children | 0 (0.0%) | 0 (0.0%) |
| 5 or more Children | 0 (0.0%) | 0 (0.0%) |
| Total | 0 (0.0%) | 12 (30.0%) |
Income Below Poverty Among Married-Couple vs Single-Parent Households in Frizzleburg
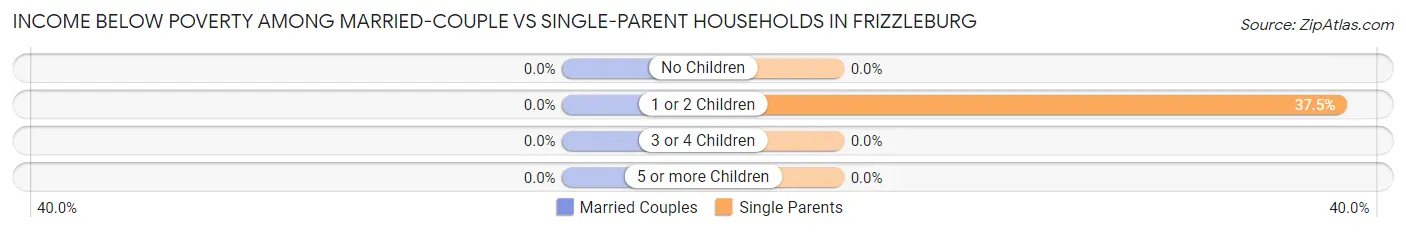
| Children | Married-Couple Families | Single-Parent Households |
| No Children | 0 (0.0%) | 0 (0.0%) |
| 1 or 2 Children | 0 (0.0%) | 12 (37.5%) |
| 3 or 4 Children | 0 (0.0%) | 0 (0.0%) |
| 5 or more Children | 0 (0.0%) | 0 (0.0%) |
| Total | 0 (0.0%) | 12 (30.0%) |
Race in Frizzleburg
The most populous races in Frizzleburg are White / Caucasian (290 | 96.7%), and Asian (10 | 3.3%).
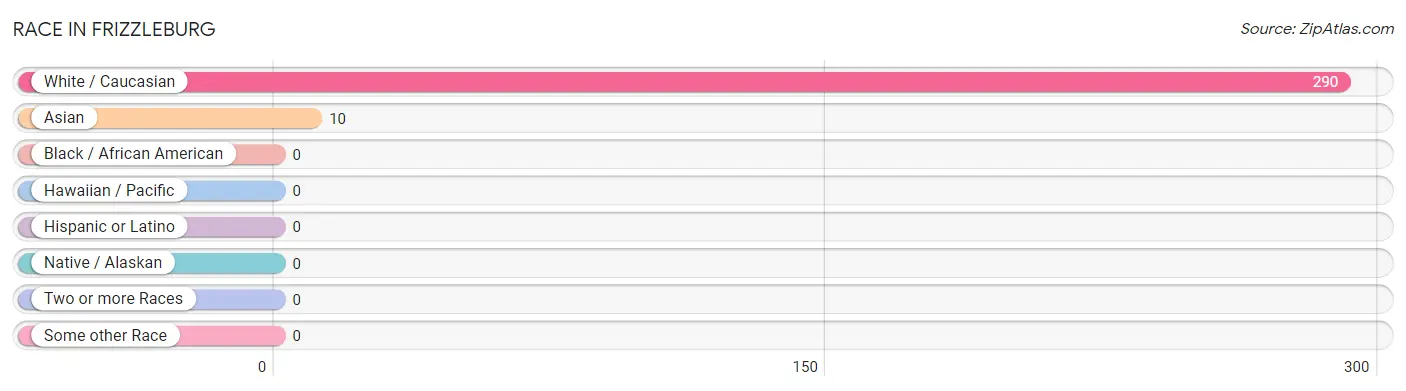
| Race | # Population | % Population |
| Asian | 10 | 3.3% |
| Black / African American | 0 | 0.0% |
| Hawaiian / Pacific | 0 | 0.0% |
| Hispanic or Latino | 0 | 0.0% |
| Native / Alaskan | 0 | 0.0% |
| White / Caucasian | 290 | 96.7% |
| Two or more Races | 0 | 0.0% |
| Some other Race | 0 | 0.0% |
| Total | 300 | 100.0% |
Ancestry in Frizzleburg
The most populous ancestries reported in Frizzleburg are German (57 | 19.0%), Irish (55 | 18.3%), Italian (37 | 12.3%), Polish (28 | 9.3%), and American (17 | 5.7%), together accounting for 64.7% of all Frizzleburg residents.
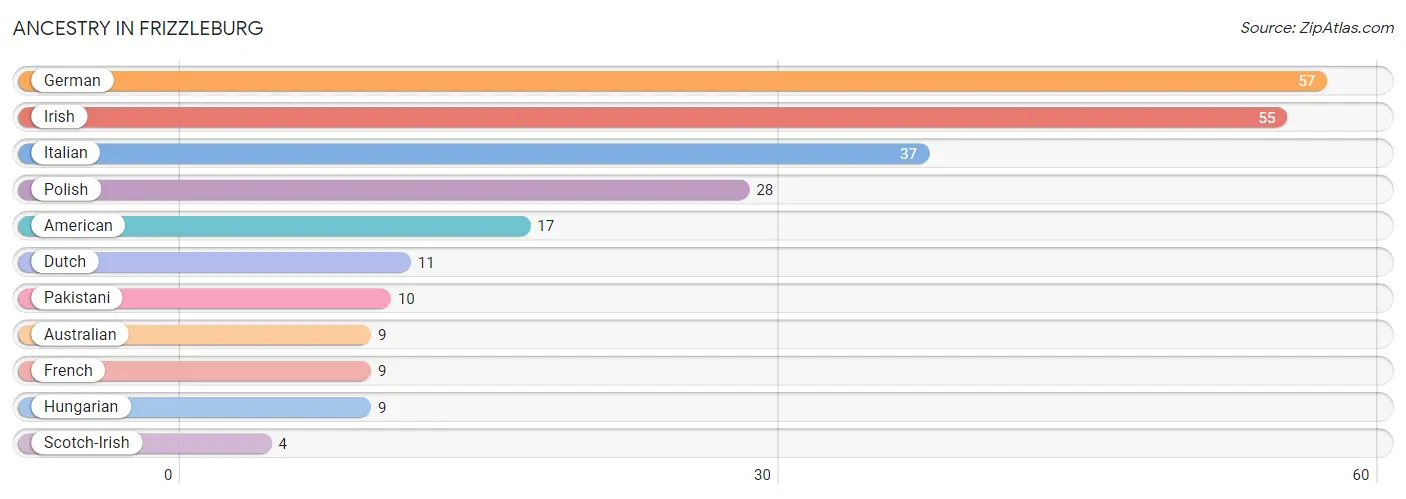
| Ancestry | # Population | % Population |
| American | 17 | 5.7% |
| Australian | 9 | 3.0% |
| Dutch | 11 | 3.7% |
| French | 9 | 3.0% |
| German | 57 | 19.0% |
| Hungarian | 9 | 3.0% |
| Irish | 55 | 18.3% |
| Italian | 37 | 12.3% |
| Pakistani | 10 | 3.3% |
| Polish | 28 | 9.3% |
| Scotch-Irish | 4 | 1.3% | View All 11 Rows |
Immigrants in Frizzleburg
The most numerous immigrant groups reported in Frizzleburg came from Asia (10 | 3.3%), South Eastern Asia (10 | 3.3%), and Thailand (10 | 3.3%), together accounting for 10.0% of all Frizzleburg residents.
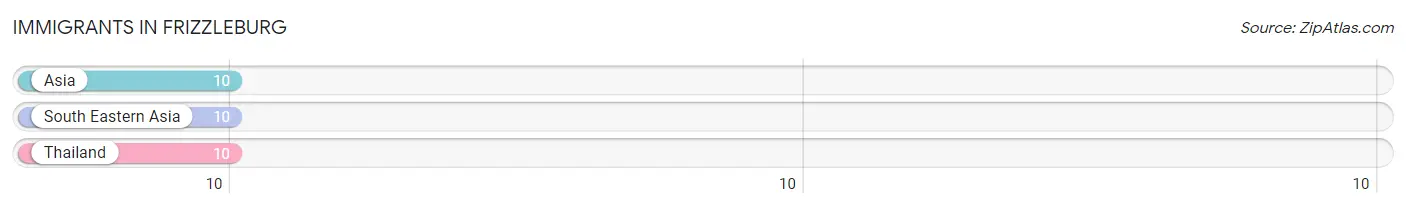
| Immigration Origin | # Population | % Population |
| Asia | 10 | 3.3% |
| South Eastern Asia | 10 | 3.3% |
| Thailand | 10 | 3.3% | View All 3 Rows |
Sex and Age in Frizzleburg
Sex and Age in Frizzleburg
The most populous age groups in Frizzleburg are 55 to 59 Years (39 | 26.5%) for men and 65 to 69 Years (38 | 24.8%) for women.
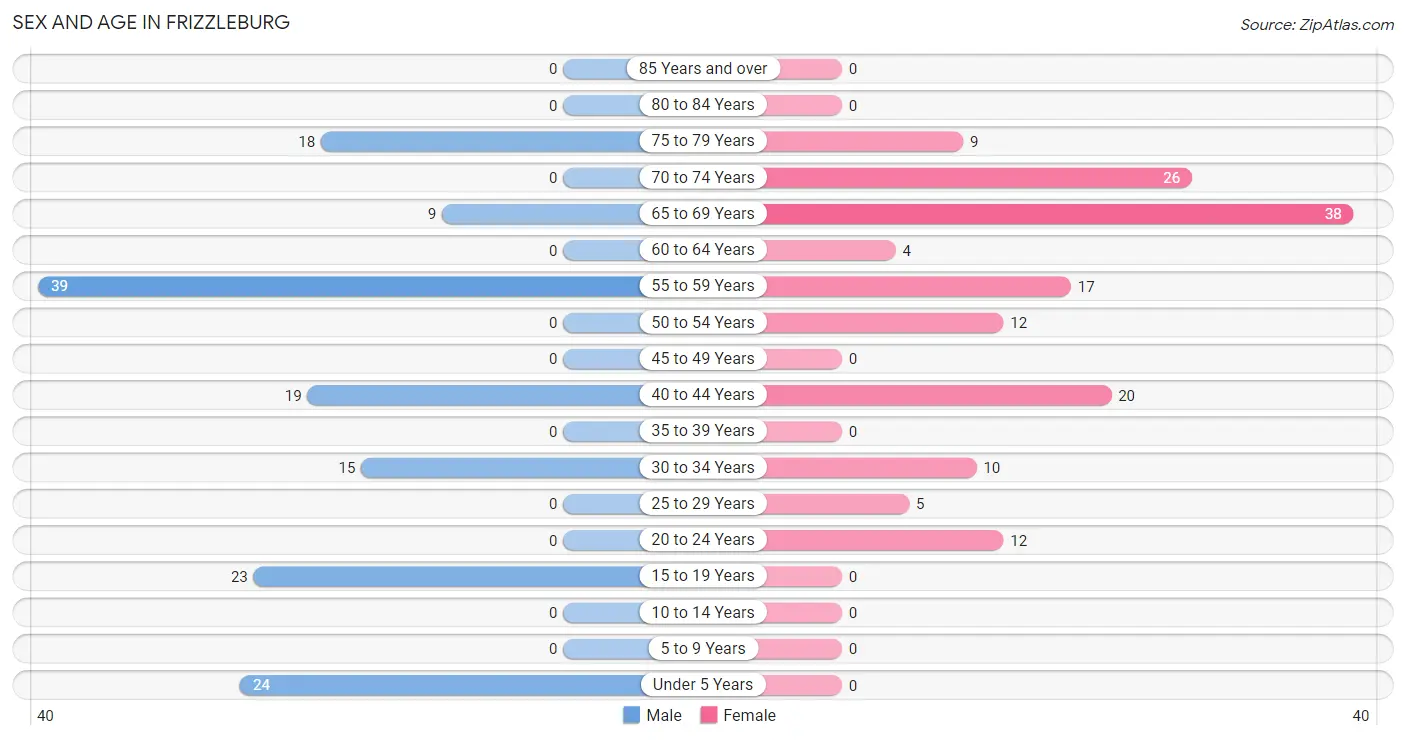
| Age Bracket | Male | Female |
| Under 5 Years | 24 (16.3%) | 0 (0.0%) |
| 5 to 9 Years | 0 (0.0%) | 0 (0.0%) |
| 10 to 14 Years | 0 (0.0%) | 0 (0.0%) |
| 15 to 19 Years | 23 (15.7%) | 0 (0.0%) |
| 20 to 24 Years | 0 (0.0%) | 12 (7.8%) |
| 25 to 29 Years | 0 (0.0%) | 5 (3.3%) |
| 30 to 34 Years | 15 (10.2%) | 10 (6.5%) |
| 35 to 39 Years | 0 (0.0%) | 0 (0.0%) |
| 40 to 44 Years | 19 (12.9%) | 20 (13.1%) |
| 45 to 49 Years | 0 (0.0%) | 0 (0.0%) |
| 50 to 54 Years | 0 (0.0%) | 12 (7.8%) |
| 55 to 59 Years | 39 (26.5%) | 17 (11.1%) |
| 60 to 64 Years | 0 (0.0%) | 4 (2.6%) |
| 65 to 69 Years | 9 (6.1%) | 38 (24.8%) |
| 70 to 74 Years | 0 (0.0%) | 26 (17.0%) |
| 75 to 79 Years | 18 (12.2%) | 9 (5.9%) |
| 80 to 84 Years | 0 (0.0%) | 0 (0.0%) |
| 85 Years and over | 0 (0.0%) | 0 (0.0%) |
| Total | 147 (100.0%) | 153 (100.0%) |
Families and Households in Frizzleburg
Median Family Size in Frizzleburg
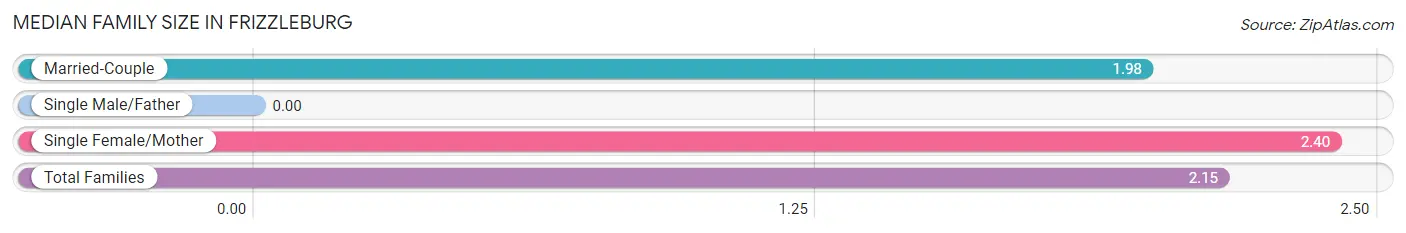
| Family Type | # Families | Family Size |
| Married-Couple | 60 (60.0%) | 1.98 |
| Single Male/Father | 0 (0.0%) | - |
| Single Female/Mother | 40 (40.0%) | 2.40 |
| Total Families | 100 (100.0%) | 2.15 |
Median Household Size in Frizzleburg
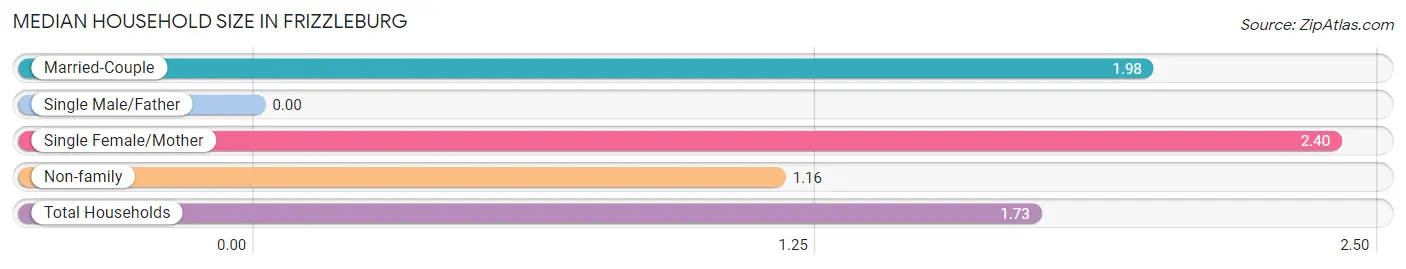
| Household Type | # Households | Household Size |
| Married-Couple | 60 (34.7%) | 1.98 |
| Single Male/Father | 0 (0.0%) | - |
| Single Female/Mother | 40 (23.1%) | 2.40 |
| Non-family | 73 (42.2%) | 1.16 |
| Total Households | 173 (100.0%) | 1.73 |
Household Size by Marriage Status in Frizzleburg
Out of a total of 173 households in Frizzleburg, 100 (57.8%) are family households, while 73 (42.2%) are nonfamily households. The most numerous type of family households are 2-person households, comprising 88, and the most common type of nonfamily households are 1-person households, comprising 61.
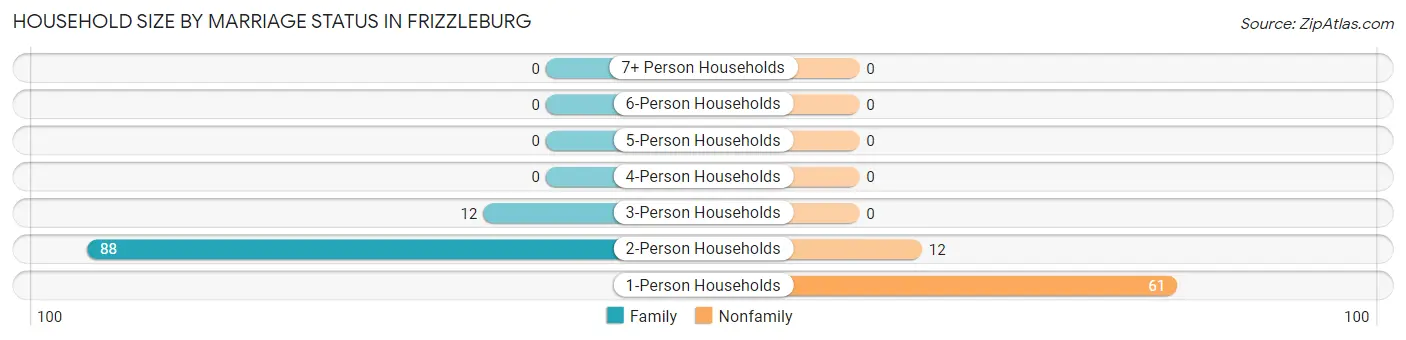
| Household Size | Family Households | Nonfamily Households |
| 1-Person Households | - | 61 (35.3%) |
| 2-Person Households | 88 (50.9%) | 12 (6.9%) |
| 3-Person Households | 12 (6.9%) | 0 (0.0%) |
| 4-Person Households | 0 (0.0%) | 0 (0.0%) |
| 5-Person Households | 0 (0.0%) | 0 (0.0%) |
| 6-Person Households | 0 (0.0%) | 0 (0.0%) |
| 7+ Person Households | 0 (0.0%) | 0 (0.0%) |
| Total | 100 (57.8%) | 73 (42.2%) |
Female Fertility in Frizzleburg
Fertility by Age in Frizzleburg
| Age Bracket | Women with Births | Births / 1,000 Women |
| 15 to 19 years | 0 (0.0%) | 0.0 |
| 20 to 34 years | 0 (0.0%) | 0.0 |
| 35 to 50 years | 0 (0.0%) | 0.0 |
| Total | 0 (0.0%) | 0.0 |
Fertility by Age by Marriage Status in Frizzleburg
| Age Bracket | Married | Unmarried |
| 15 to 19 years | 0 (0.0%) | 0 (0.0%) |
| 20 to 34 years | 0 (0.0%) | 0 (0.0%) |
| 35 to 50 years | 0 (0.0%) | 0 (0.0%) |
| Total | 0 (0.0%) | 0 (0.0%) |
Fertility by Education in Frizzleburg
| Educational Attainment | Women with Births | Births / 1,000 Women |
| Less than High School | 0 (0.0%) | 0.0 |
| High School Diploma | 0 (0.0%) | 0.0 |
| College or Associate's Degree | 0 (0.0%) | 0.0 |
| Bachelor's Degree | 0 (0.0%) | 0.0 |
| Graduate Degree | 0 (0.0%) | 0.0 |
| Total | 0 (0.0%) | 0.0 |
Fertility by Education by Marriage Status in Frizzleburg
| Educational Attainment | Married | Unmarried |
| Less than High School | 0 (0.0%) | 0 (0.0%) |
| High School Diploma | 0 (0.0%) | 0 (0.0%) |
| College or Associate's Degree | 0 (0.0%) | 0 (0.0%) |
| Bachelor's Degree | 0 (0.0%) | 0 (0.0%) |
| Graduate Degree | 0 (0.0%) | 0 (0.0%) |
| Total | 0 (0.0%) | 0 (0.0%) |
Employment Characteristics in Frizzleburg
Employment by Class of Employer in Frizzleburg
Among the 118 employed individuals in Frizzleburg, private company employees (113 | 95.8%), and not-for-profit organizations (5 | 4.2%) make up the most common classes of employment.
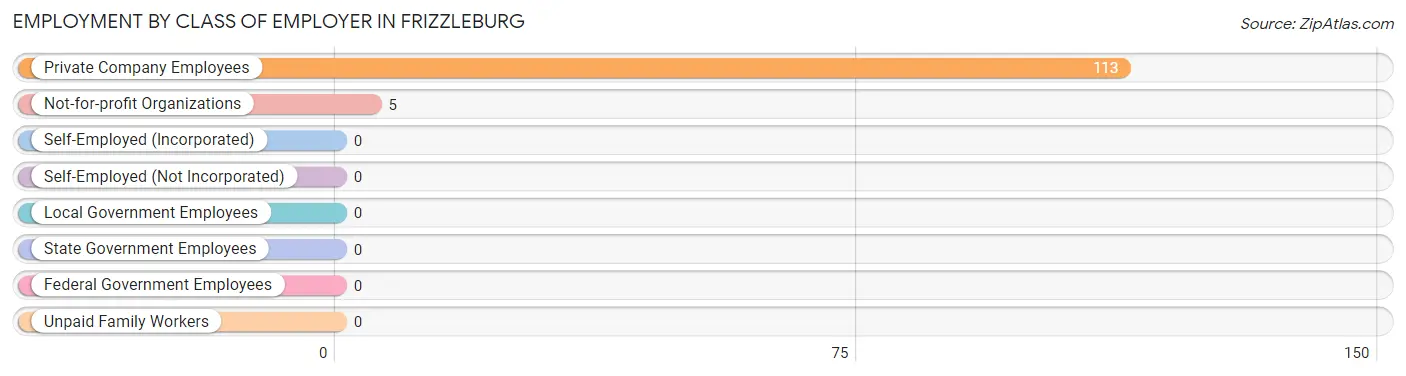
| Employer Class | # Employees | % Employees |
| Private Company Employees | 113 | 95.8% |
| Self-Employed (Incorporated) | 0 | 0.0% |
| Self-Employed (Not Incorporated) | 0 | 0.0% |
| Not-for-profit Organizations | 5 | 4.2% |
| Local Government Employees | 0 | 0.0% |
| State Government Employees | 0 | 0.0% |
| Federal Government Employees | 0 | 0.0% |
| Unpaid Family Workers | 0 | 0.0% |
| Total | 118 | 100.0% |
Employment Status by Age in Frizzleburg
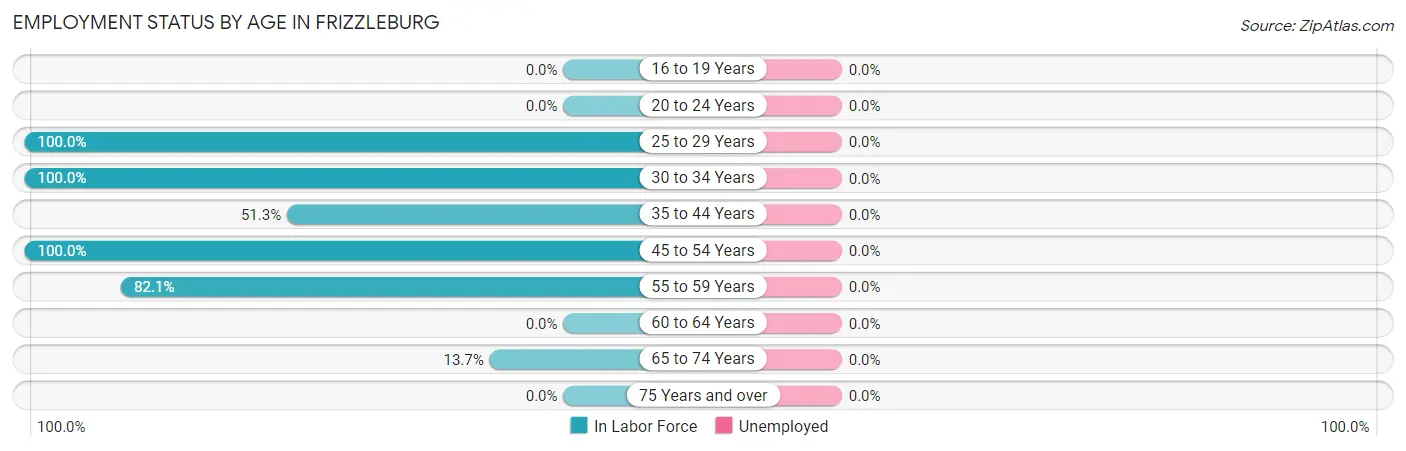
| Age Bracket | In Labor Force | Unemployed |
| 16 to 19 Years | 0 (0.0%) | 0 (0.0%) |
| 20 to 24 Years | 0 (0.0%) | 0 (0.0%) |
| 25 to 29 Years | 5 (100.0%) | 0 (0.0%) |
| 30 to 34 Years | 25 (100.0%) | 0 (0.0%) |
| 35 to 44 Years | 20 (51.3%) | 0 (0.0%) |
| 45 to 54 Years | 12 (100.0%) | 0 (0.0%) |
| 55 to 59 Years | 46 (82.1%) | 0 (0.0%) |
| 60 to 64 Years | 0 (0.0%) | 0 (0.0%) |
| 65 to 74 Years | 10 (13.7%) | 0 (0.0%) |
| 75 Years and over | 0 (0.0%) | 0 (0.0%) |
| Total | 118 (46.6%) | 0 (0.0%) |
Employment Status by Educational Attainment in Frizzleburg
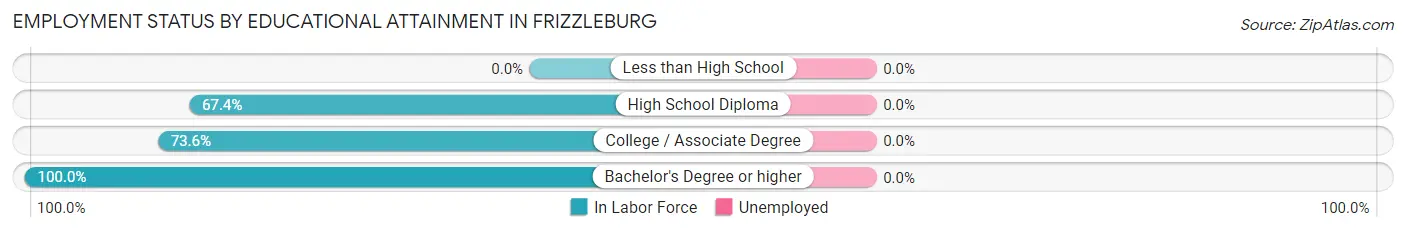
| Educational Attainment | In Labor Force | Unemployed |
| Less than High School | 0 (0.0%) | 0 (0.0%) |
| High School Diploma | 29 (67.4%) | 0 (0.0%) |
| College / Associate Degree | 53 (73.6%) | 0 (0.0%) |
| Bachelor's Degree or higher | 26 (100.0%) | 0 (0.0%) |
| Total | 108 (76.6%) | 0 (0.0%) |
Employment Occupations by Sex in Frizzleburg
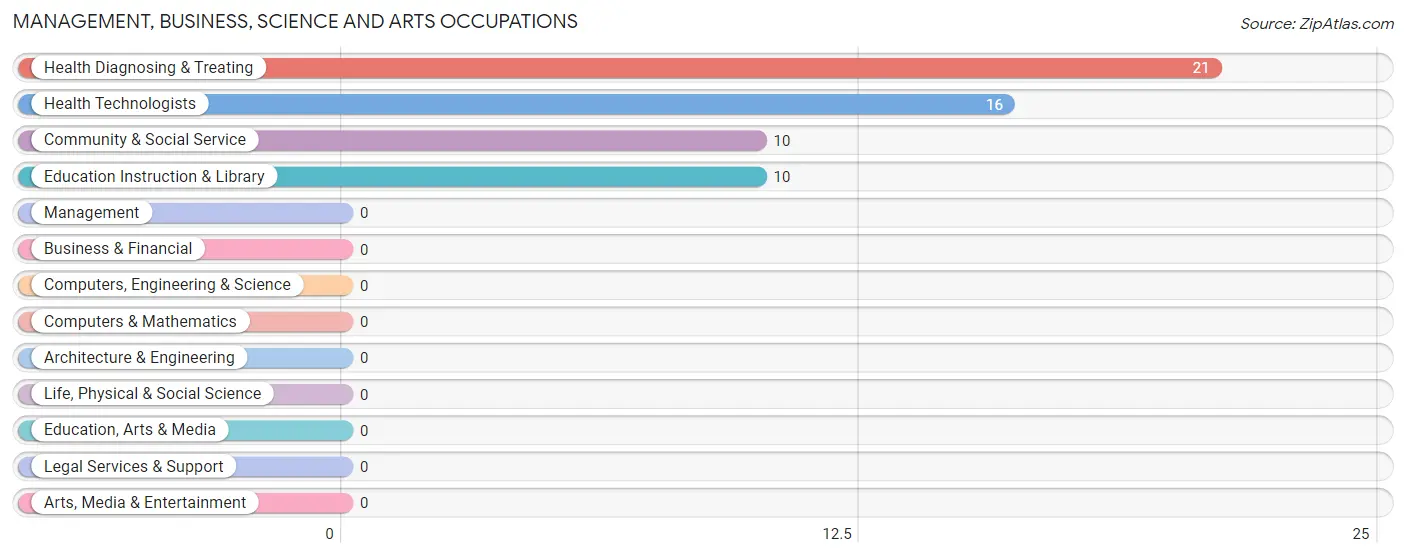
Management, Business, Science and Arts Occupations
The most common Management, Business, Science and Arts occupations in Frizzleburg are Health Diagnosing & Treating (21 | 17.8%), Health Technologists (16 | 13.6%), Community & Social Service (10 | 8.5%), and Education Instruction & Library (10 | 8.5%).
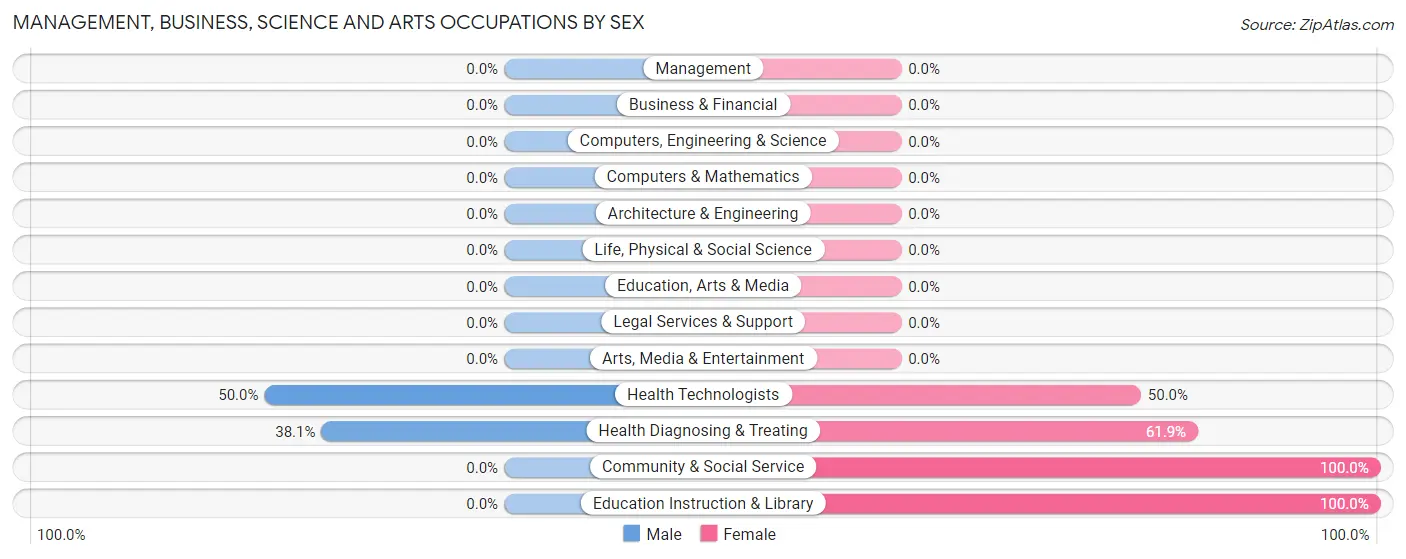
Management, Business, Science and Arts Occupations by Sex
Within the Management, Business, Science and Arts occupations in Frizzleburg, the most male-oriented occupations are Health Technologists (50.0%), and Health Diagnosing & Treating (38.1%), while the most female-oriented occupations are Community & Social Service (100.0%), Education Instruction & Library (100.0%), and Health Diagnosing & Treating (61.9%).
| Occupation | Male | Female |
| Management | 0 (0.0%) | 0 (0.0%) |
| Business & Financial | 0 (0.0%) | 0 (0.0%) |
| Computers, Engineering & Science | 0 (0.0%) | 0 (0.0%) |
| Computers & Mathematics | 0 (0.0%) | 0 (0.0%) |
| Architecture & Engineering | 0 (0.0%) | 0 (0.0%) |
| Life, Physical & Social Science | 0 (0.0%) | 0 (0.0%) |
| Community & Social Service | 0 (0.0%) | 10 (100.0%) |
| Education, Arts & Media | 0 (0.0%) | 0 (0.0%) |
| Legal Services & Support | 0 (0.0%) | 0 (0.0%) |
| Education Instruction & Library | 0 (0.0%) | 10 (100.0%) |
| Arts, Media & Entertainment | 0 (0.0%) | 0 (0.0%) |
| Health Diagnosing & Treating | 8 (38.1%) | 13 (61.9%) |
| Health Technologists | 8 (50.0%) | 8 (50.0%) |
| Total (Category) | 8 (25.8%) | 23 (74.2%) |
| Total (Overall) | 44 (37.3%) | 74 (62.7%) |
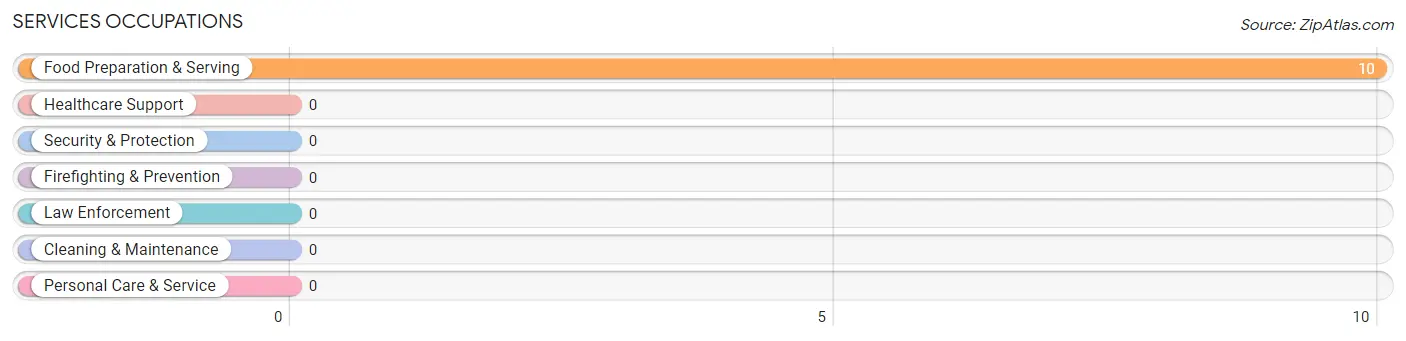
Services Occupations
The most common Services occupations in Frizzleburg are , and Food Preparation & Serving (10 | 8.5%).
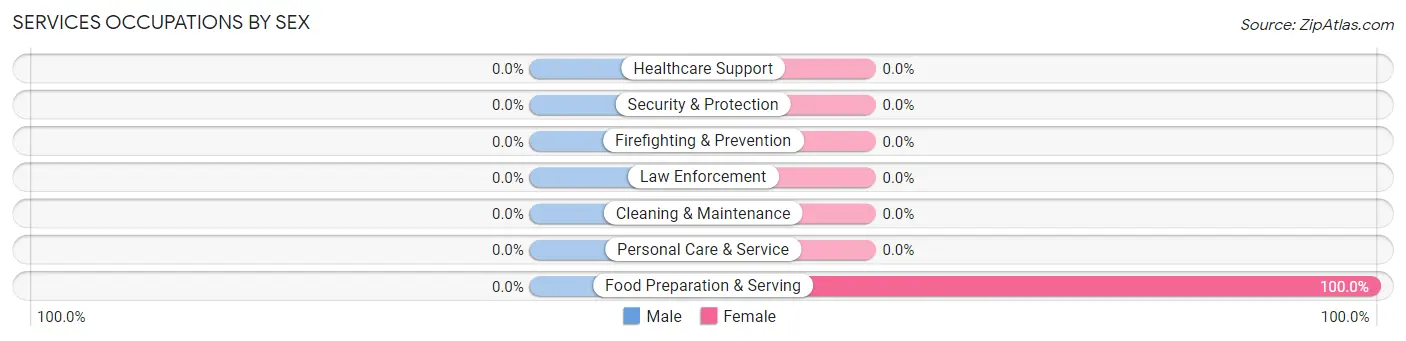
Services Occupations by Sex
| Occupation | Male | Female |
| Healthcare Support | 0 (0.0%) | 0 (0.0%) |
| Security & Protection | 0 (0.0%) | 0 (0.0%) |
| Firefighting & Prevention | 0 (0.0%) | 0 (0.0%) |
| Law Enforcement | 0 (0.0%) | 0 (0.0%) |
| Food Preparation & Serving | 0 (0.0%) | 10 (100.0%) |
| Cleaning & Maintenance | 0 (0.0%) | 0 (0.0%) |
| Personal Care & Service | 0 (0.0%) | 0 (0.0%) |
| Total (Category) | 0 (0.0%) | 10 (100.0%) |
| Total (Overall) | 44 (37.3%) | 74 (62.7%) |
Sales and Office Occupations
The most common Sales and Office occupations in Frizzleburg are , and Office & Administration (21 | 17.8%).
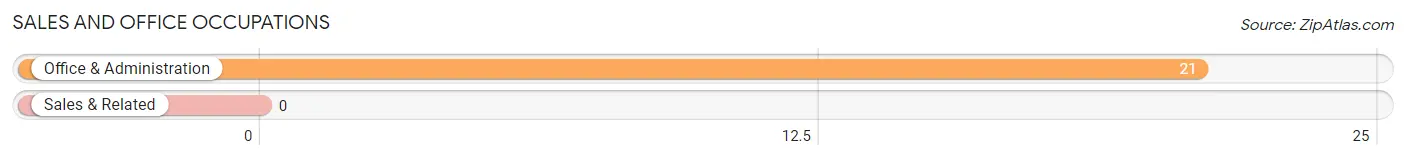
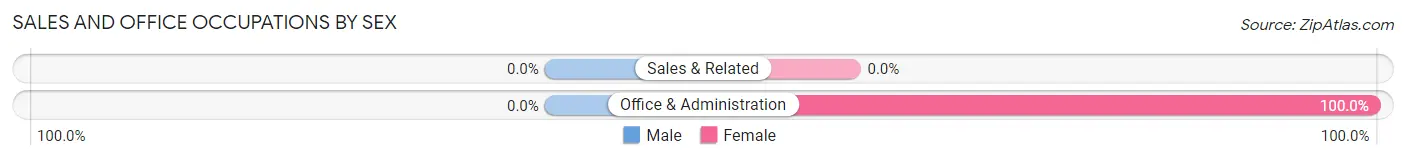
Sales and Office Occupations by Sex
| Occupation | Male | Female |
| Sales & Related | 0 (0.0%) | 0 (0.0%) |
| Office & Administration | 0 (0.0%) | 21 (100.0%) |
| Total (Category) | 0 (0.0%) | 21 (100.0%) |
| Total (Overall) | 44 (37.3%) | 74 (62.7%) |
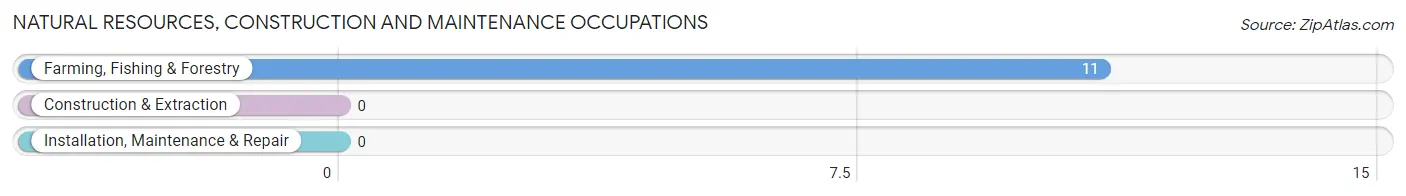
Natural Resources, Construction and Maintenance Occupations
The most common Natural Resources, Construction and Maintenance occupations in Frizzleburg are , and Farming, Fishing & Forestry (11 | 9.3%).
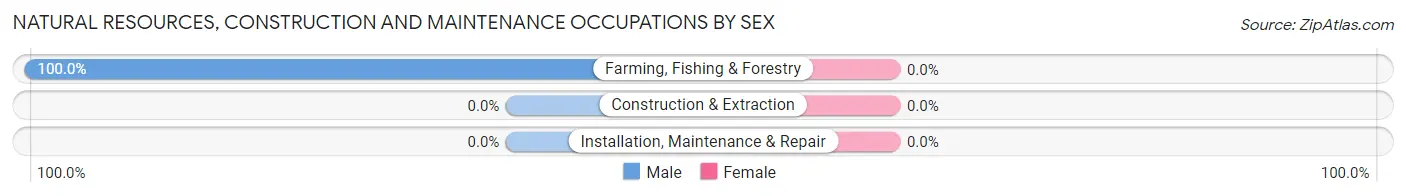
Natural Resources, Construction and Maintenance Occupations by Sex
| Occupation | Male | Female |
| Farming, Fishing & Forestry | 11 (100.0%) | 0 (0.0%) |
| Construction & Extraction | 0 (0.0%) | 0 (0.0%) |
| Installation, Maintenance & Repair | 0 (0.0%) | 0 (0.0%) |
| Total (Category) | 11 (100.0%) | 0 (0.0%) |
| Total (Overall) | 44 (37.3%) | 74 (62.7%) |
Production, Transportation and Moving Occupations
The most common Production, Transportation and Moving occupations in Frizzleburg are Transportation (36 | 30.5%), and Production (9 | 7.6%).
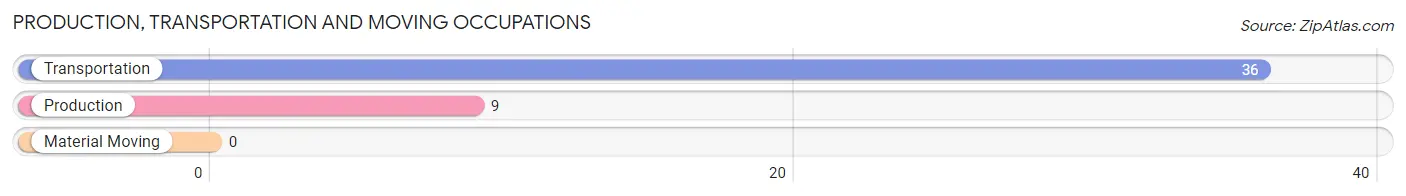
Production, Transportation and Moving Occupations by Sex
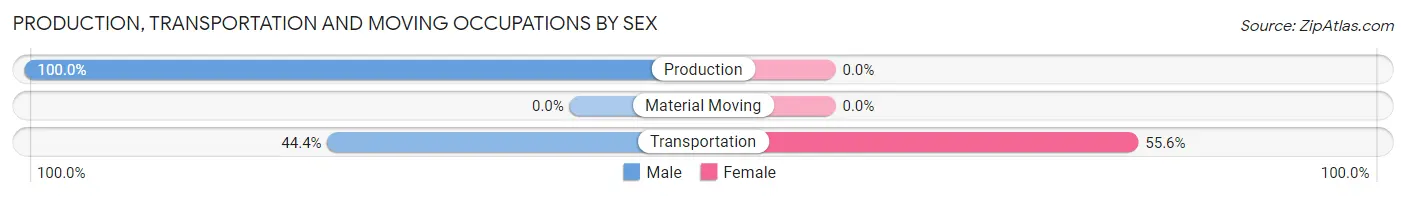
| Occupation | Male | Female |
| Production | 9 (100.0%) | 0 (0.0%) |
| Transportation | 16 (44.4%) | 20 (55.6%) |
| Material Moving | 0 (0.0%) | 0 (0.0%) |
| Total (Category) | 25 (55.6%) | 20 (44.4%) |
| Total (Overall) | 44 (37.3%) | 74 (62.7%) |
Employment Industries by Sex in Frizzleburg
Employment Industries in Frizzleburg
The major employment industries in Frizzleburg include Health Care & Social Assistance (33 | 28.0%), Transportation & Warehousing (24 | 20.3%), Construction (21 | 17.8%), Educational Services (19 | 16.1%), and Agriculture, Fishing & Hunting (11 | 9.3%).

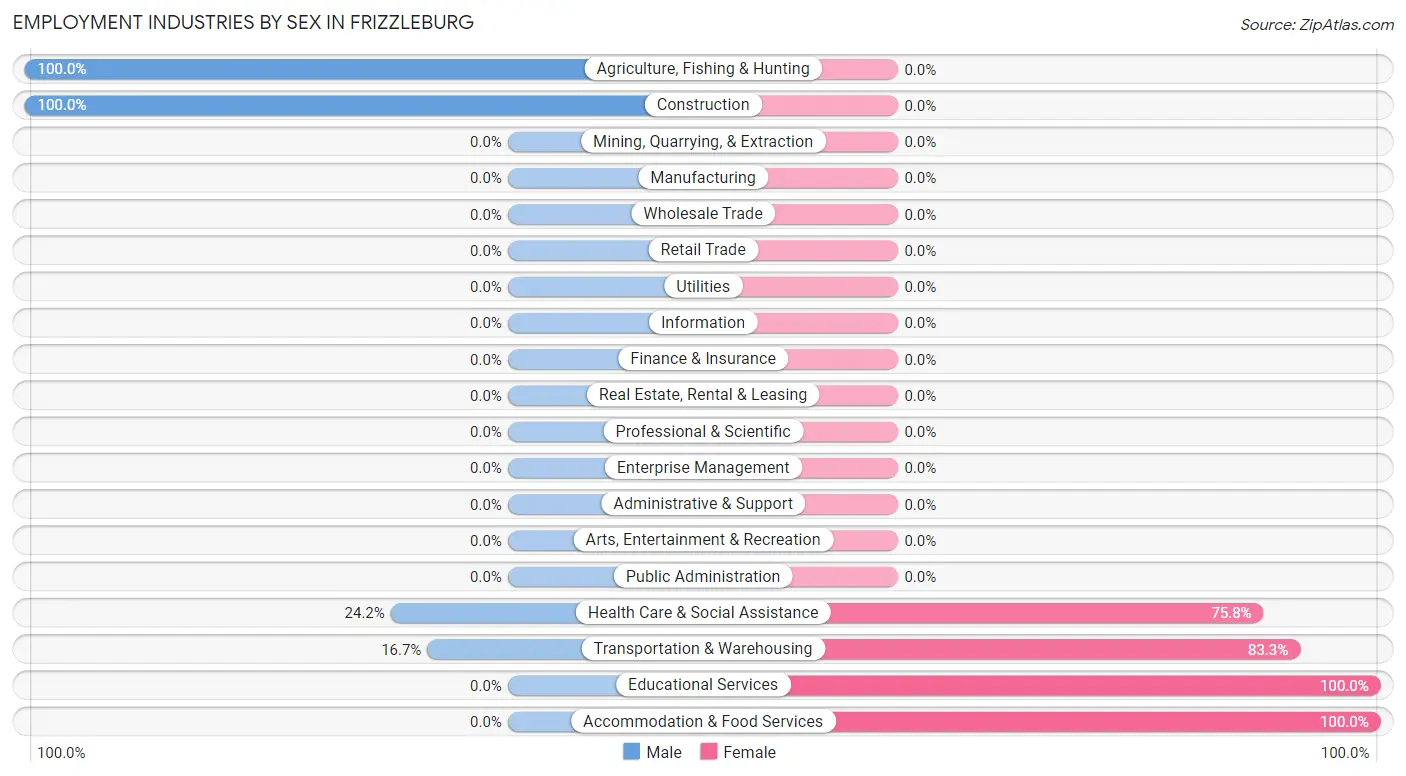
Employment Industries by Sex in Frizzleburg
The Frizzleburg industries that see more men than women are Agriculture, Fishing & Hunting (100.0%), Construction (100.0%), and Health Care & Social Assistance (24.2%), whereas the industries that tend to have a higher number of women are Educational Services (100.0%), Accommodation & Food Services (100.0%), and Transportation & Warehousing (83.3%).
| Industry | Male | Female |
| Agriculture, Fishing & Hunting | 11 (100.0%) | 0 (0.0%) |
| Mining, Quarrying, & Extraction | 0 (0.0%) | 0 (0.0%) |
| Construction | 21 (100.0%) | 0 (0.0%) |
| Manufacturing | 0 (0.0%) | 0 (0.0%) |
| Wholesale Trade | 0 (0.0%) | 0 (0.0%) |
| Retail Trade | 0 (0.0%) | 0 (0.0%) |
| Transportation & Warehousing | 4 (16.7%) | 20 (83.3%) |
| Utilities | 0 (0.0%) | 0 (0.0%) |
| Information | 0 (0.0%) | 0 (0.0%) |
| Finance & Insurance | 0 (0.0%) | 0 (0.0%) |
| Real Estate, Rental & Leasing | 0 (0.0%) | 0 (0.0%) |
| Professional & Scientific | 0 (0.0%) | 0 (0.0%) |
| Enterprise Management | 0 (0.0%) | 0 (0.0%) |
| Administrative & Support | 0 (0.0%) | 0 (0.0%) |
| Educational Services | 0 (0.0%) | 19 (100.0%) |
| Health Care & Social Assistance | 8 (24.2%) | 25 (75.8%) |
| Arts, Entertainment & Recreation | 0 (0.0%) | 0 (0.0%) |
| Accommodation & Food Services | 0 (0.0%) | 10 (100.0%) |
| Public Administration | 0 (0.0%) | 0 (0.0%) |
| Total | 44 (37.3%) | 74 (62.7%) |
Education in Frizzleburg
School Enrollment in Frizzleburg
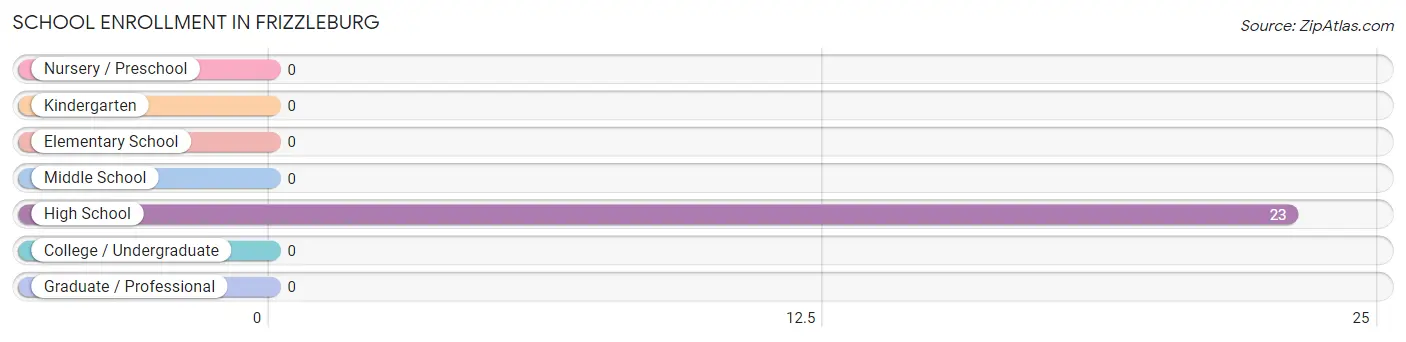
| School Level | # Students | % Students |
| Nursery / Preschool | 0 | 0.0% |
| Kindergarten | 0 | 0.0% |
| Elementary School | 0 | 0.0% |
| Middle School | 0 | 0.0% |
| High School | 23 | 100.0% |
| College / Undergraduate | 0 | 0.0% |
| Graduate / Professional | 0 | 0.0% |
| Total | 23 | 100.0% |
School Enrollment by Age by Funding Source in Frizzleburg
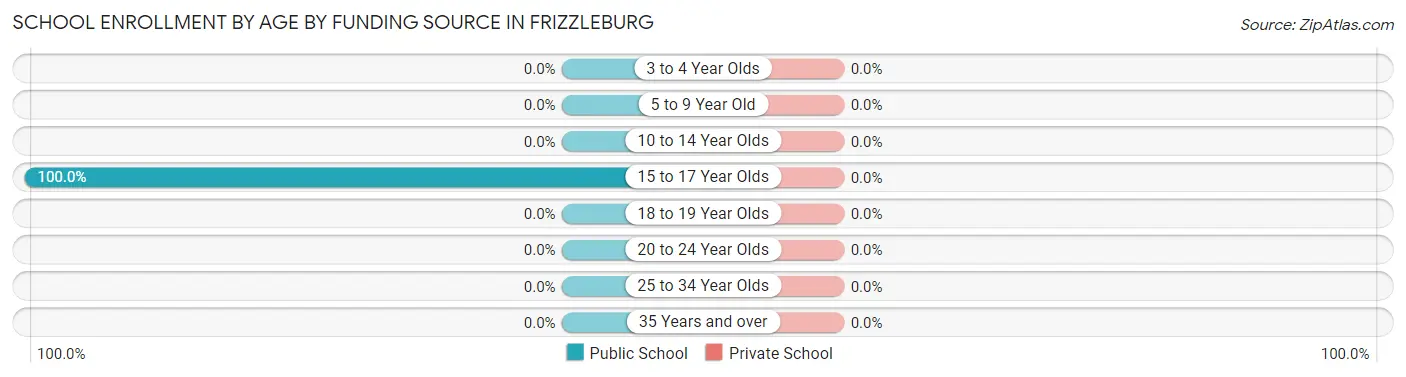
| Age Bracket | Public School | Private School |
| 3 to 4 Year Olds | 0 (0.0%) | 0 (0.0%) |
| 5 to 9 Year Old | 0 (0.0%) | 0 (0.0%) |
| 10 to 14 Year Olds | 0 (0.0%) | 0 (0.0%) |
| 15 to 17 Year Olds | 23 (100.0%) | 0 (0.0%) |
| 18 to 19 Year Olds | 0 (0.0%) | 0 (0.0%) |
| 20 to 24 Year Olds | 0 (0.0%) | 0 (0.0%) |
| 25 to 34 Year Olds | 0 (0.0%) | 0 (0.0%) |
| 35 Years and over | 0 (0.0%) | 0 (0.0%) |
| Total | 23 (100.0%) | 0 (0.0%) |
Educational Attainment by Field of Study in Frizzleburg
Bio, nature & agricultural (16 | 61.5%), and education (10 | 38.5%) are the most common fields of study among 26 individuals in Frizzleburg who have obtained a bachelor's degree or higher.
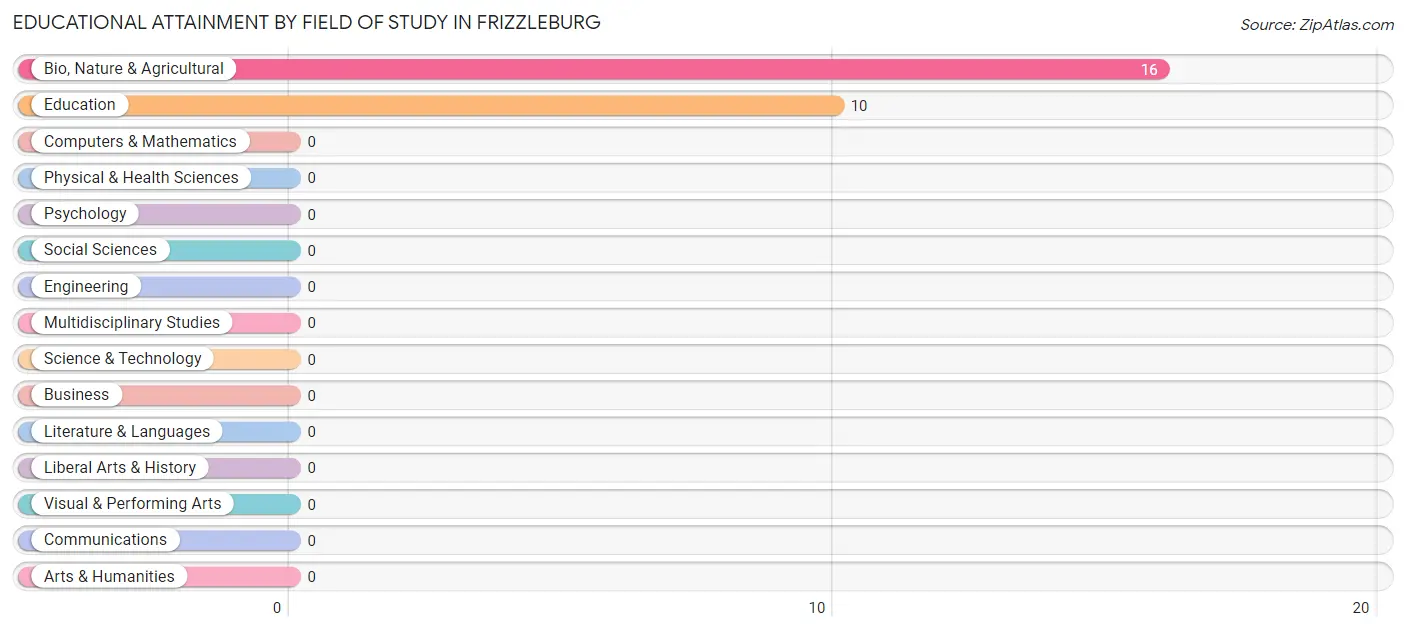
| Field of Study | # Graduates | % Graduates |
| Computers & Mathematics | 0 | 0.0% |
| Bio, Nature & Agricultural | 16 | 61.5% |
| Physical & Health Sciences | 0 | 0.0% |
| Psychology | 0 | 0.0% |
| Social Sciences | 0 | 0.0% |
| Engineering | 0 | 0.0% |
| Multidisciplinary Studies | 0 | 0.0% |
| Science & Technology | 0 | 0.0% |
| Business | 0 | 0.0% |
| Education | 10 | 38.5% |
| Literature & Languages | 0 | 0.0% |
| Liberal Arts & History | 0 | 0.0% |
| Visual & Performing Arts | 0 | 0.0% |
| Communications | 0 | 0.0% |
| Arts & Humanities | 0 | 0.0% |
| Total | 26 | 100.0% |
Transportation & Commute in Frizzleburg
Vehicle Availability by Sex in Frizzleburg
The most prevalent vehicle ownership categories in Frizzleburg are males with 2 vehicles (24, accounting for 54.5%) and females with 2 vehicles (35, making up 32.4%).
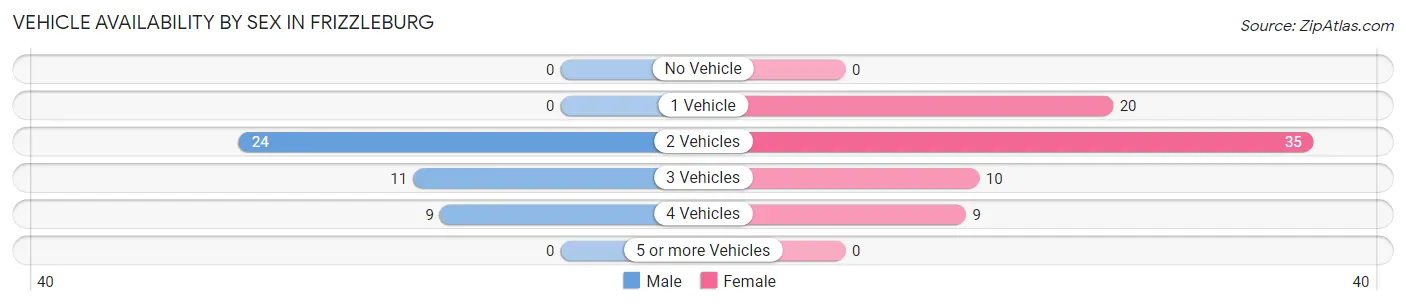
| Vehicles Available | Male | Female |
| No Vehicle | 0 (0.0%) | 0 (0.0%) |
| 1 Vehicle | 0 (0.0%) | 20 (27.0%) |
| 2 Vehicles | 24 (54.5%) | 35 (47.3%) |
| 3 Vehicles | 11 (25.0%) | 10 (13.5%) |
| 4 Vehicles | 9 (20.4%) | 9 (12.2%) |
| 5 or more Vehicles | 0 (0.0%) | 0 (0.0%) |
| Total | 44 (100.0%) | 74 (100.0%) |
Commute Time in Frizzleburg
The most frequently occuring commute durations in Frizzleburg are 15 to 19 minutes (52 commuters, 44.1%), 30 to 34 minutes (20 commuters, 17.0%), and 20 to 24 minutes (14 commuters, 11.9%).
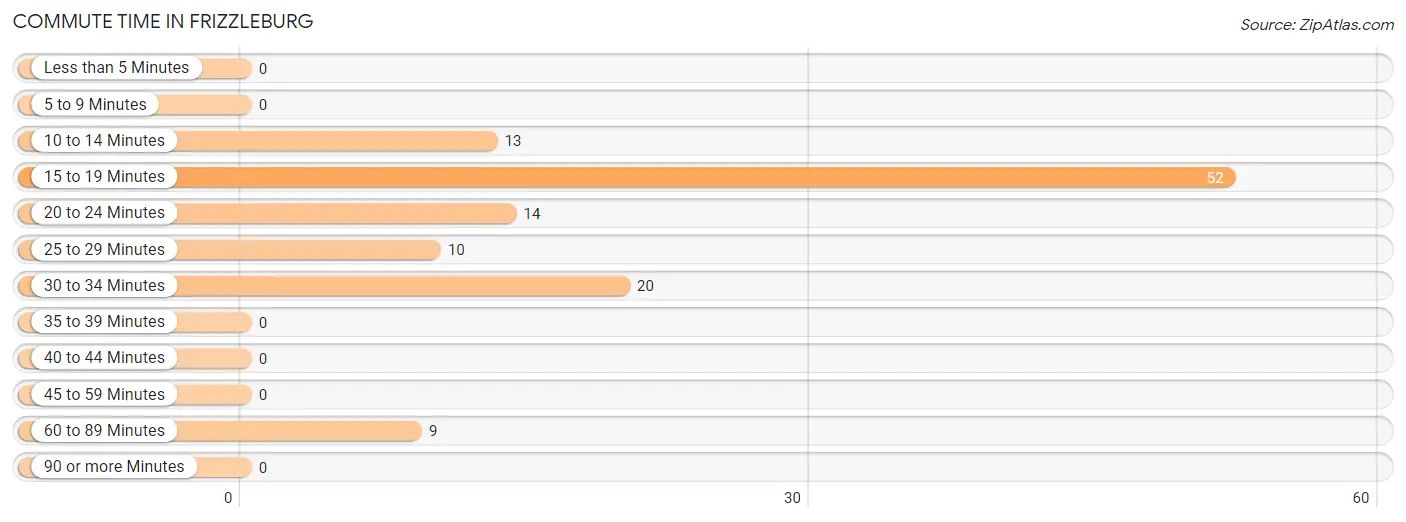
| Commute Time | # Commuters | % Commuters |
| Less than 5 Minutes | 0 | 0.0% |
| 5 to 9 Minutes | 0 | 0.0% |
| 10 to 14 Minutes | 13 | 11.0% |
| 15 to 19 Minutes | 52 | 44.1% |
| 20 to 24 Minutes | 14 | 11.9% |
| 25 to 29 Minutes | 10 | 8.5% |
| 30 to 34 Minutes | 20 | 17.0% |
| 35 to 39 Minutes | 0 | 0.0% |
| 40 to 44 Minutes | 0 | 0.0% |
| 45 to 59 Minutes | 0 | 0.0% |
| 60 to 89 Minutes | 9 | 7.6% |
| 90 or more Minutes | 0 | 0.0% |
Commute Time by Sex in Frizzleburg
The most common commute times in Frizzleburg are 15 to 19 minutes (23 commuters, 52.3%) for males and 15 to 19 minutes (29 commuters, 39.2%) for females.
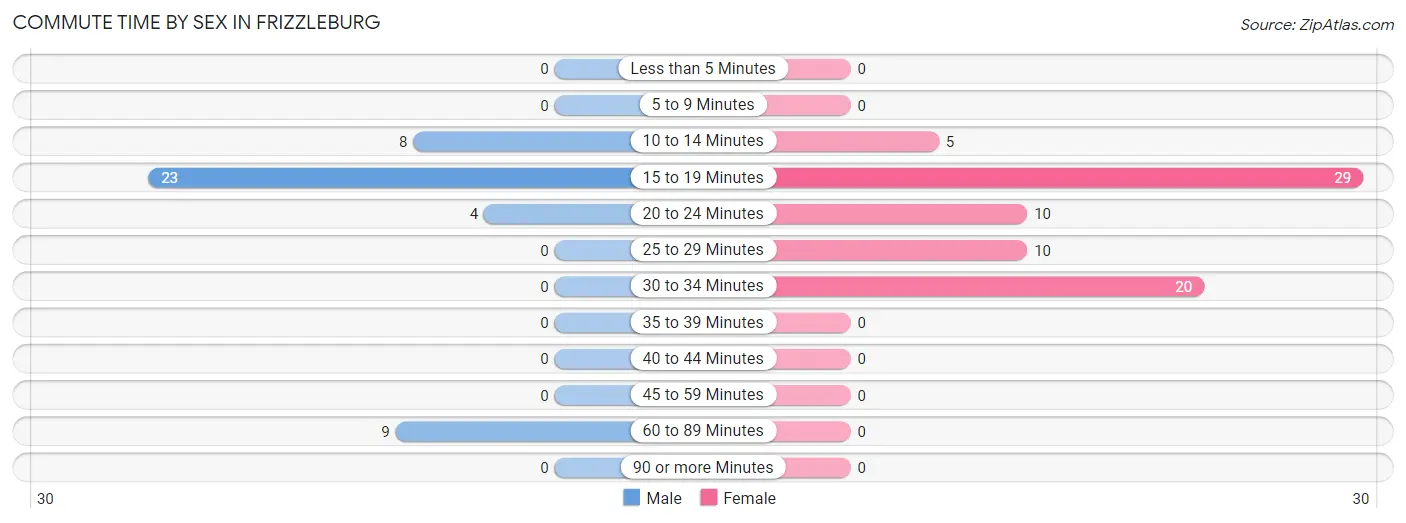
| Commute Time | Male | Female |
| Less than 5 Minutes | 0 (0.0%) | 0 (0.0%) |
| 5 to 9 Minutes | 0 (0.0%) | 0 (0.0%) |
| 10 to 14 Minutes | 8 (18.2%) | 5 (6.8%) |
| 15 to 19 Minutes | 23 (52.3%) | 29 (39.2%) |
| 20 to 24 Minutes | 4 (9.1%) | 10 (13.5%) |
| 25 to 29 Minutes | 0 (0.0%) | 10 (13.5%) |
| 30 to 34 Minutes | 0 (0.0%) | 20 (27.0%) |
| 35 to 39 Minutes | 0 (0.0%) | 0 (0.0%) |
| 40 to 44 Minutes | 0 (0.0%) | 0 (0.0%) |
| 45 to 59 Minutes | 0 (0.0%) | 0 (0.0%) |
| 60 to 89 Minutes | 9 (20.4%) | 0 (0.0%) |
| 90 or more Minutes | 0 (0.0%) | 0 (0.0%) |
Time of Departure to Work by Sex in Frizzleburg
The most frequent times of departure to work in Frizzleburg are 12:00 AM to 4:59 AM (23, 52.3%) for males and 6:30 AM to 6:59 AM (30, 40.5%) for females.
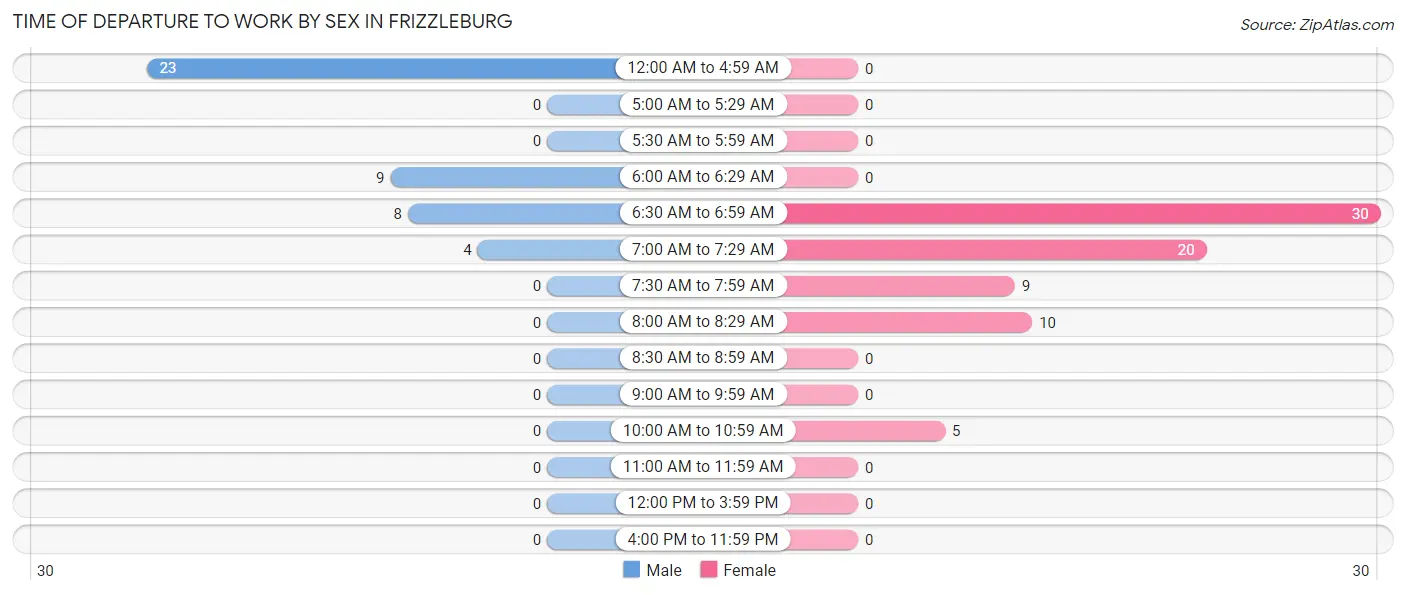
| Time of Departure | Male | Female |
| 12:00 AM to 4:59 AM | 23 (52.3%) | 0 (0.0%) |
| 5:00 AM to 5:29 AM | 0 (0.0%) | 0 (0.0%) |
| 5:30 AM to 5:59 AM | 0 (0.0%) | 0 (0.0%) |
| 6:00 AM to 6:29 AM | 9 (20.4%) | 0 (0.0%) |
| 6:30 AM to 6:59 AM | 8 (18.2%) | 30 (40.5%) |
| 7:00 AM to 7:29 AM | 4 (9.1%) | 20 (27.0%) |
| 7:30 AM to 7:59 AM | 0 (0.0%) | 9 (12.2%) |
| 8:00 AM to 8:29 AM | 0 (0.0%) | 10 (13.5%) |
| 8:30 AM to 8:59 AM | 0 (0.0%) | 0 (0.0%) |
| 9:00 AM to 9:59 AM | 0 (0.0%) | 0 (0.0%) |
| 10:00 AM to 10:59 AM | 0 (0.0%) | 5 (6.8%) |
| 11:00 AM to 11:59 AM | 0 (0.0%) | 0 (0.0%) |
| 12:00 PM to 3:59 PM | 0 (0.0%) | 0 (0.0%) |
| 4:00 PM to 11:59 PM | 0 (0.0%) | 0 (0.0%) |
| Total | 44 (100.0%) | 74 (100.0%) |
Housing Occupancy in Frizzleburg
Occupancy by Ownership in Frizzleburg
Of the total 173 dwellings in Frizzleburg, owner-occupied units account for 132 (76.3%), while renter-occupied units make up 41 (23.7%).
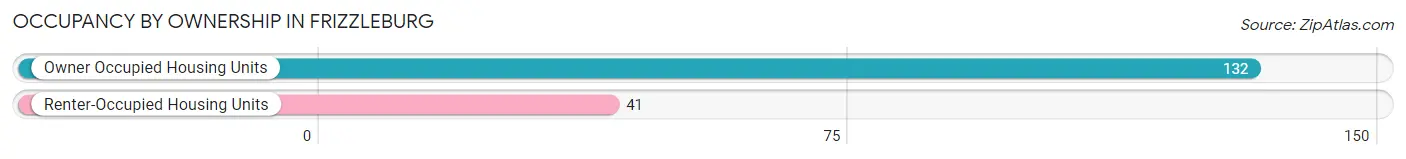
| Occupancy | # Housing Units | % Housing Units |
| Owner Occupied Housing Units | 132 | 76.3% |
| Renter-Occupied Housing Units | 41 | 23.7% |
| Total Occupied Housing Units | 173 | 100.0% |
Occupancy by Household Size in Frizzleburg
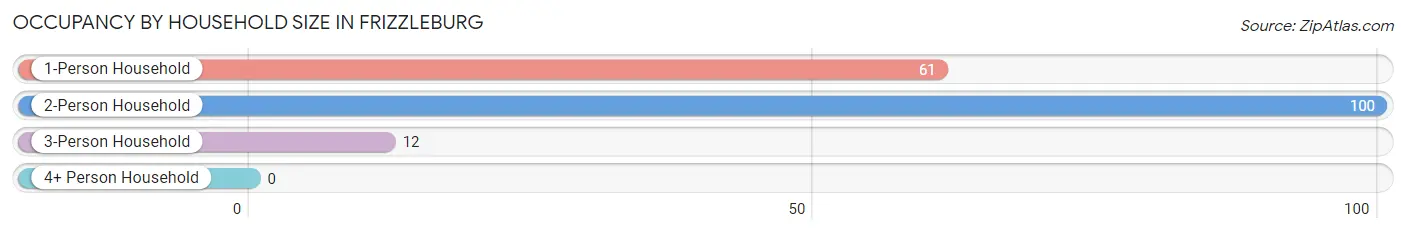
| Household Size | # Housing Units | % Housing Units |
| 1-Person Household | 61 | 35.3% |
| 2-Person Household | 100 | 57.8% |
| 3-Person Household | 12 | 6.9% |
| 4+ Person Household | 0 | 0.0% |
| Total Housing Units | 173 | 100.0% |
Occupancy by Ownership by Household Size in Frizzleburg
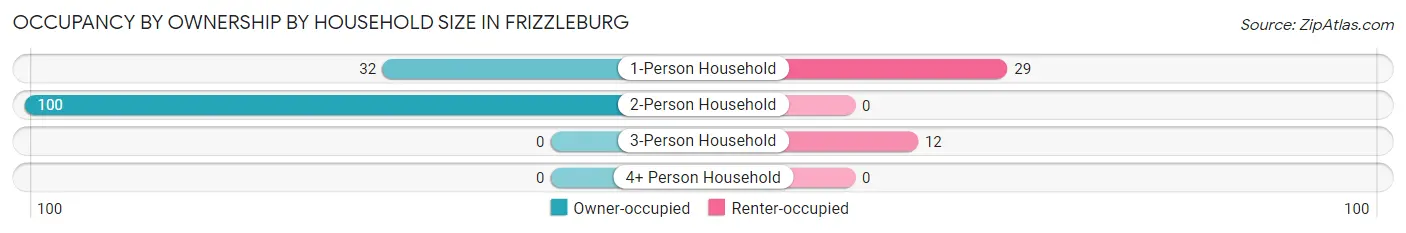
| Household Size | Owner-occupied | Renter-occupied |
| 1-Person Household | 32 (52.5%) | 29 (47.5%) |
| 2-Person Household | 100 (100.0%) | 0 (0.0%) |
| 3-Person Household | 0 (0.0%) | 12 (100.0%) |
| 4+ Person Household | 0 (0.0%) | 0 (0.0%) |
| Total Housing Units | 132 (76.3%) | 41 (23.7%) |
Occupancy by Educational Attainment in Frizzleburg
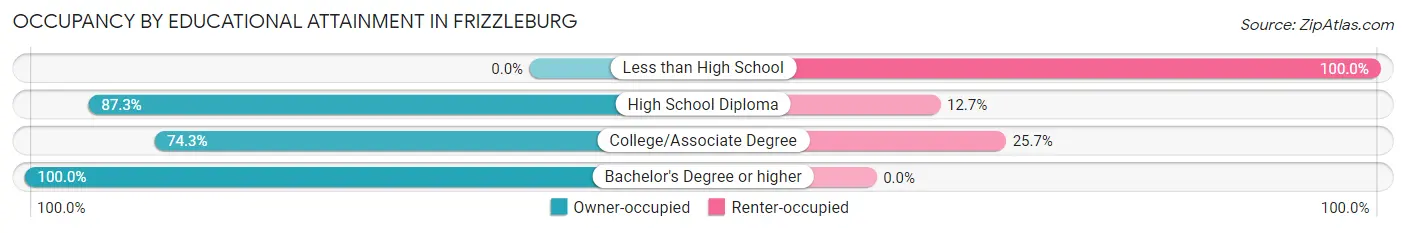
| Household Size | Owner-occupied | Renter-occupied |
| Less than High School | 0 (0.0%) | 12 (100.0%) |
| High School Diploma | 69 (87.3%) | 10 (12.7%) |
| College/Associate Degree | 55 (74.3%) | 19 (25.7%) |
| Bachelor's Degree or higher | 8 (100.0%) | 0 (0.0%) |
Occupancy by Age of Householder in Frizzleburg
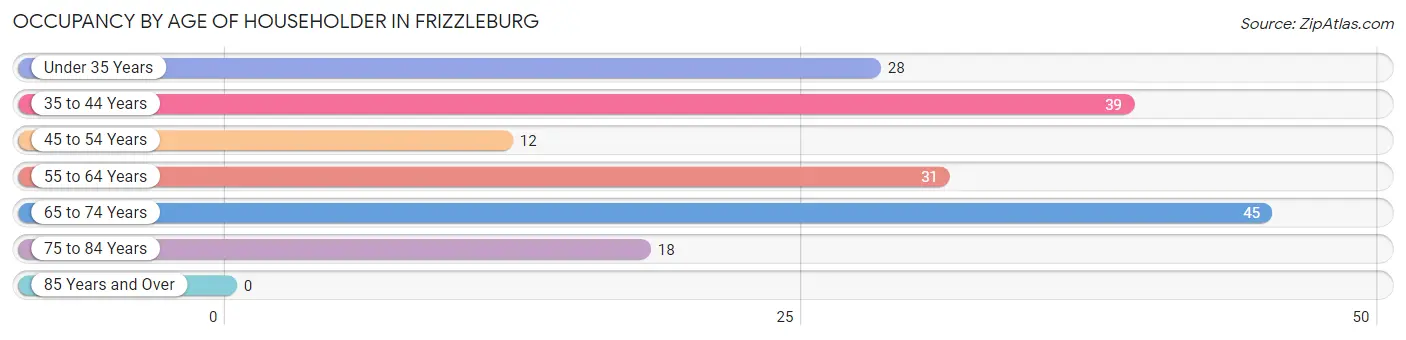
| Age Bracket | # Households | % Households |
| Under 35 Years | 28 | 16.2% |
| 35 to 44 Years | 39 | 22.5% |
| 45 to 54 Years | 12 | 6.9% |
| 55 to 64 Years | 31 | 17.9% |
| 65 to 74 Years | 45 | 26.0% |
| 75 to 84 Years | 18 | 10.4% |
| 85 Years and Over | 0 | 0.0% |
| Total | 173 | 100.0% |
Housing Finances in Frizzleburg
Median Income by Occupancy in Frizzleburg
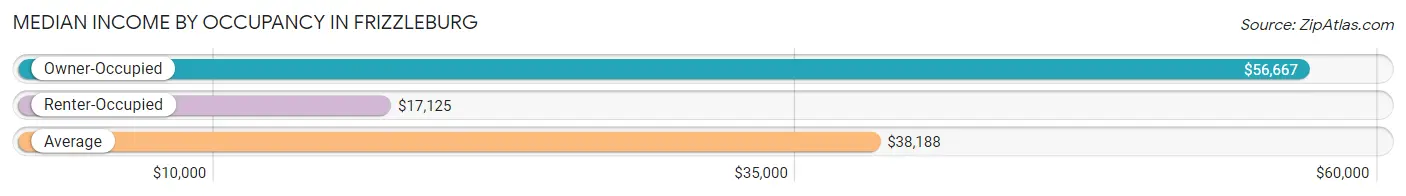
| Occupancy Type | # Households | Median Income |
| Owner-Occupied | 132 (76.3%) | $56,667 |
| Renter-Occupied | 41 (23.7%) | $17,125 |
| Average | 173 (100.0%) | $38,188 |
Occupancy by Householder Income Bracket in Frizzleburg
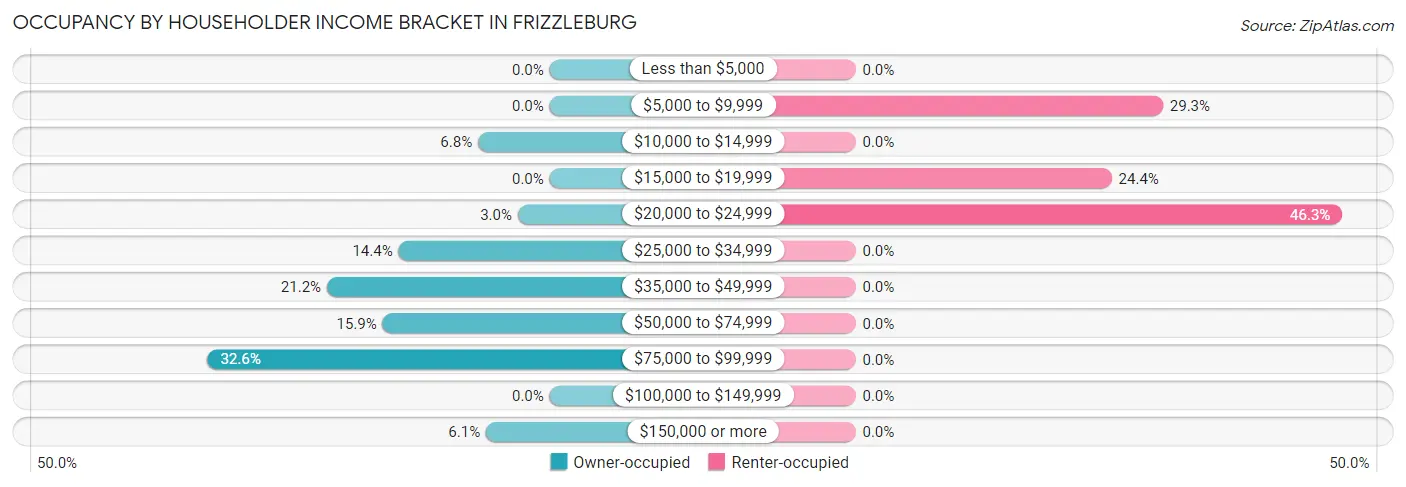
| Income Bracket | Owner-occupied | Renter-occupied |
| Less than $5,000 | 0 (0.0%) | 0 (0.0%) |
| $5,000 to $9,999 | 0 (0.0%) | 12 (29.3%) |
| $10,000 to $14,999 | 9 (6.8%) | 0 (0.0%) |
| $15,000 to $19,999 | 0 (0.0%) | 10 (24.4%) |
| $20,000 to $24,999 | 4 (3.0%) | 19 (46.3%) |
| $25,000 to $34,999 | 19 (14.4%) | 0 (0.0%) |
| $35,000 to $49,999 | 28 (21.2%) | 0 (0.0%) |
| $50,000 to $74,999 | 21 (15.9%) | 0 (0.0%) |
| $75,000 to $99,999 | 43 (32.6%) | 0 (0.0%) |
| $100,000 to $149,999 | 0 (0.0%) | 0 (0.0%) |
| $150,000 or more | 8 (6.1%) | 0 (0.0%) |
| Total | 132 (100.0%) | 41 (100.0%) |
Monthly Housing Cost Tiers in Frizzleburg
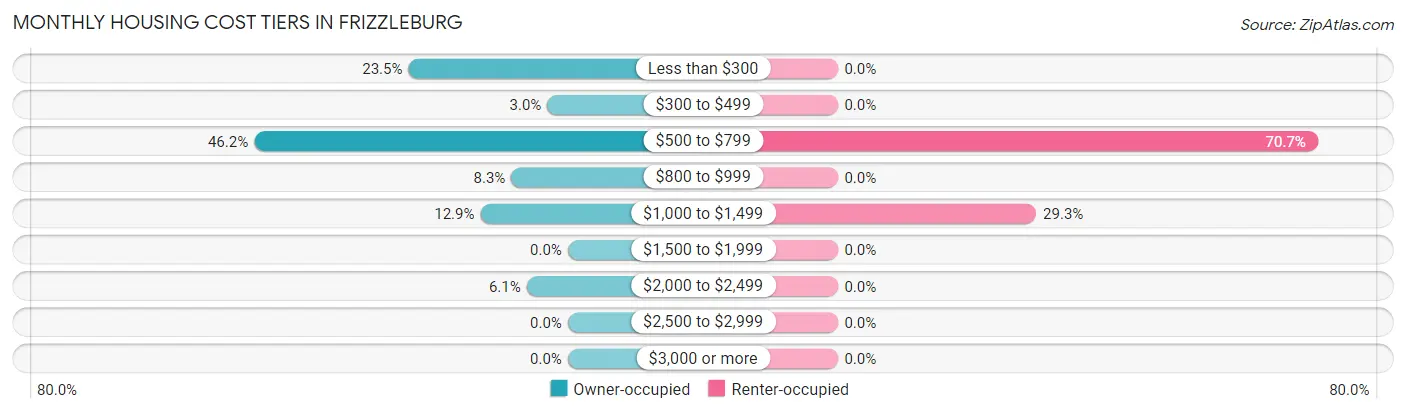
| Monthly Cost | Owner-occupied | Renter-occupied |
| Less than $300 | 31 (23.5%) | 0 (0.0%) |
| $300 to $499 | 4 (3.0%) | 0 (0.0%) |
| $500 to $799 | 61 (46.2%) | 29 (70.7%) |
| $800 to $999 | 11 (8.3%) | 0 (0.0%) |
| $1,000 to $1,499 | 17 (12.9%) | 12 (29.3%) |
| $1,500 to $1,999 | 0 (0.0%) | 0 (0.0%) |
| $2,000 to $2,499 | 8 (6.1%) | 0 (0.0%) |
| $2,500 to $2,999 | 0 (0.0%) | 0 (0.0%) |
| $3,000 or more | 0 (0.0%) | 0 (0.0%) |
| Total | 132 (100.0%) | 41 (100.0%) |
Physical Housing Characteristics in Frizzleburg
Housing Structures in Frizzleburg
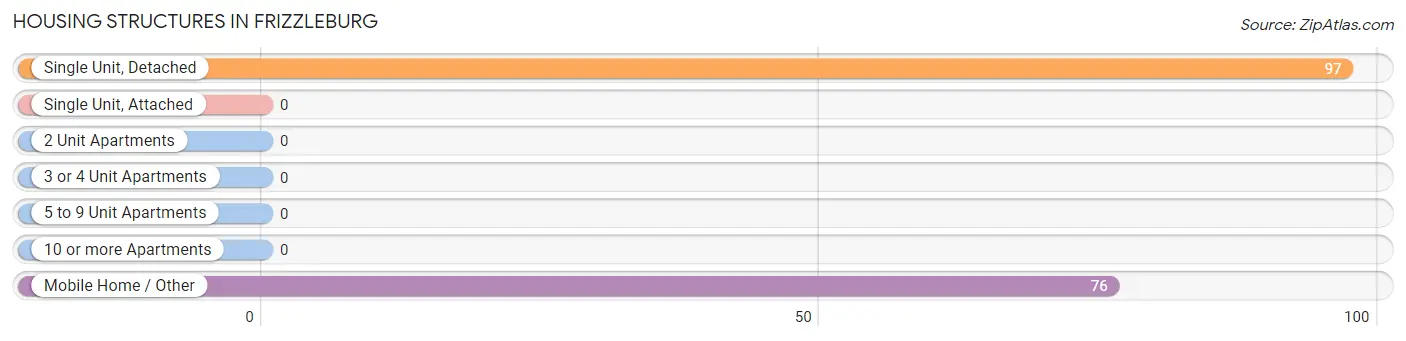
| Structure Type | # Housing Units | % Housing Units |
| Single Unit, Detached | 97 | 56.1% |
| Single Unit, Attached | 0 | 0.0% |
| 2 Unit Apartments | 0 | 0.0% |
| 3 or 4 Unit Apartments | 0 | 0.0% |
| 5 to 9 Unit Apartments | 0 | 0.0% |
| 10 or more Apartments | 0 | 0.0% |
| Mobile Home / Other | 76 | 43.9% |
| Total | 173 | 100.0% |
Housing Structures by Occupancy in Frizzleburg
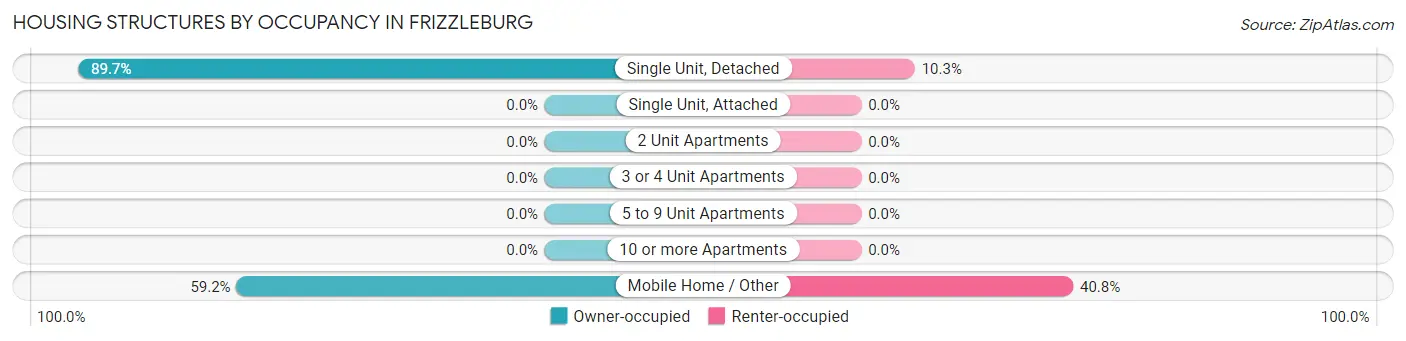
| Structure Type | Owner-occupied | Renter-occupied |
| Single Unit, Detached | 87 (89.7%) | 10 (10.3%) |
| Single Unit, Attached | 0 (0.0%) | 0 (0.0%) |
| 2 Unit Apartments | 0 (0.0%) | 0 (0.0%) |
| 3 or 4 Unit Apartments | 0 (0.0%) | 0 (0.0%) |
| 5 to 9 Unit Apartments | 0 (0.0%) | 0 (0.0%) |
| 10 or more Apartments | 0 (0.0%) | 0 (0.0%) |
| Mobile Home / Other | 45 (59.2%) | 31 (40.8%) |
| Total | 132 (76.3%) | 41 (23.7%) |
Housing Structures by Number of Rooms in Frizzleburg
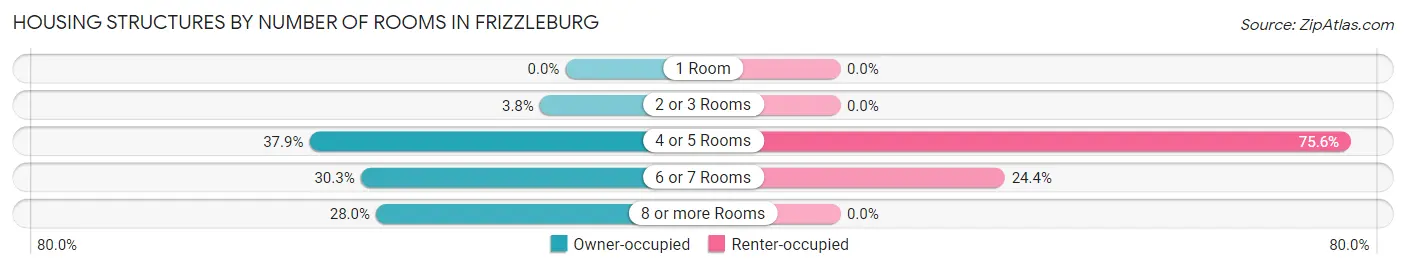
| Number of Rooms | Owner-occupied | Renter-occupied |
| 1 Room | 0 (0.0%) | 0 (0.0%) |
| 2 or 3 Rooms | 5 (3.8%) | 0 (0.0%) |
| 4 or 5 Rooms | 50 (37.9%) | 31 (75.6%) |
| 6 or 7 Rooms | 40 (30.3%) | 10 (24.4%) |
| 8 or more Rooms | 37 (28.0%) | 0 (0.0%) |
| Total | 132 (100.0%) | 41 (100.0%) |
Housing Structure by Heating Type in Frizzleburg
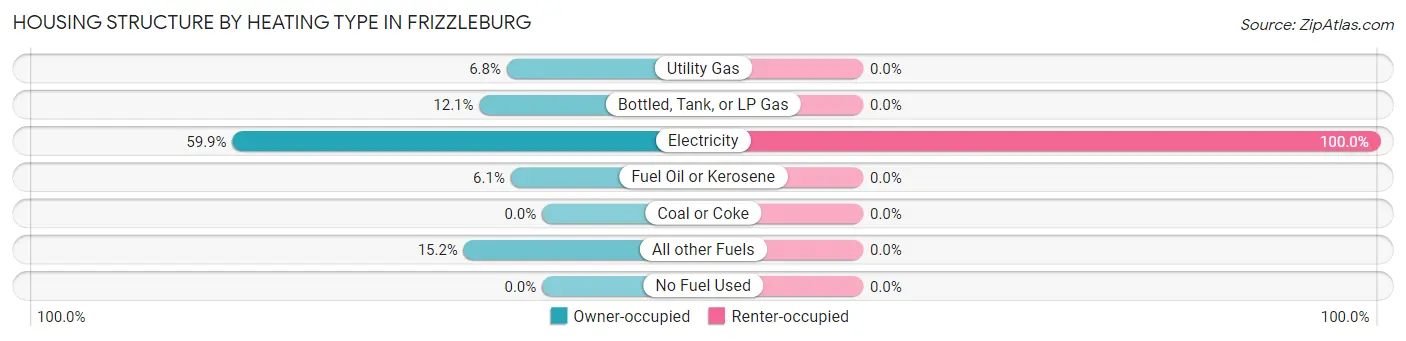
| Heating Type | Owner-occupied | Renter-occupied |
| Utility Gas | 9 (6.8%) | 0 (0.0%) |
| Bottled, Tank, or LP Gas | 16 (12.1%) | 0 (0.0%) |
| Electricity | 79 (59.9%) | 41 (100.0%) |
| Fuel Oil or Kerosene | 8 (6.1%) | 0 (0.0%) |
| Coal or Coke | 0 (0.0%) | 0 (0.0%) |
| All other Fuels | 20 (15.1%) | 0 (0.0%) |
| No Fuel Used | 0 (0.0%) | 0 (0.0%) |
| Total | 132 (100.0%) | 41 (100.0%) |
Household Vehicle Usage in Frizzleburg
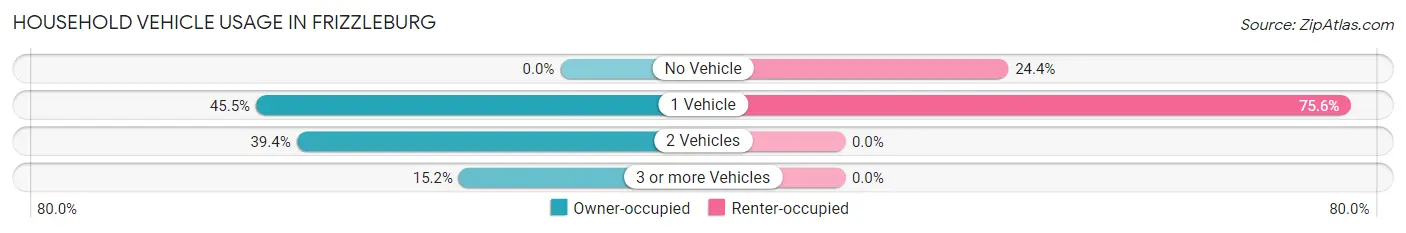
| Vehicles per Household | Owner-occupied | Renter-occupied |
| No Vehicle | 0 (0.0%) | 10 (24.4%) |
| 1 Vehicle | 60 (45.5%) | 31 (75.6%) |
| 2 Vehicles | 52 (39.4%) | 0 (0.0%) |
| 3 or more Vehicles | 20 (15.1%) | 0 (0.0%) |
| Total | 132 (100.0%) | 41 (100.0%) |
Real Estate & Mortgages in Frizzleburg
Real Estate and Mortgage Overview in Frizzleburg
| Characteristic | Without Mortgage | With Mortgage |
| Housing Units | 99 | 33 |
| Median Property Value | - | - |
| Median Household Income | $56,806 | $0 |
| Monthly Housing Costs | $531 | $0 |
| Real Estate Taxes | $647 | $0 |
Property Value by Mortgage Status in Frizzleburg
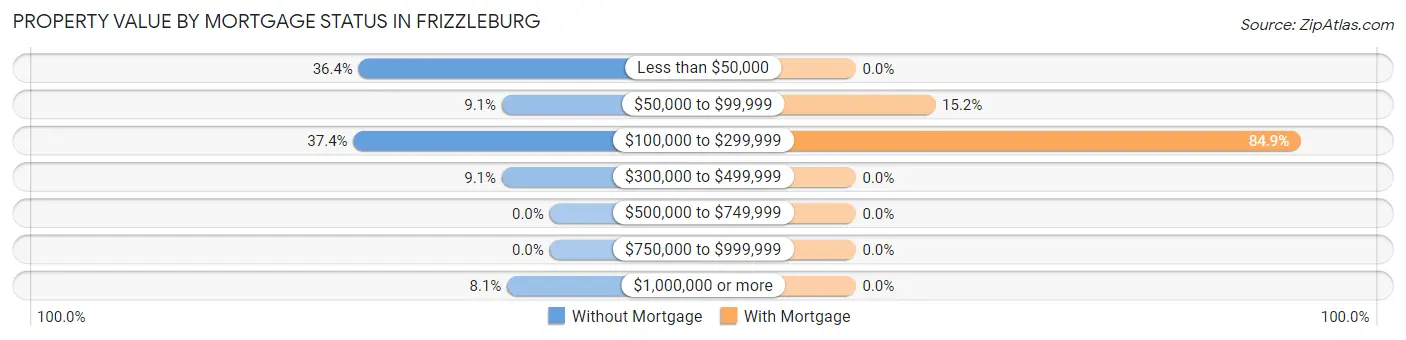
| Property Value | Without Mortgage | With Mortgage |
| Less than $50,000 | 36 (36.4%) | 0 (0.0%) |
| $50,000 to $99,999 | 9 (9.1%) | 5 (15.1%) |
| $100,000 to $299,999 | 37 (37.4%) | 28 (84.9%) |
| $300,000 to $499,999 | 9 (9.1%) | 0 (0.0%) |
| $500,000 to $749,999 | 0 (0.0%) | 0 (0.0%) |
| $750,000 to $999,999 | 0 (0.0%) | 0 (0.0%) |
| $1,000,000 or more | 8 (8.1%) | 0 (0.0%) |
| Total | 99 (100.0%) | 33 (100.0%) |
Household Income by Mortgage Status in Frizzleburg
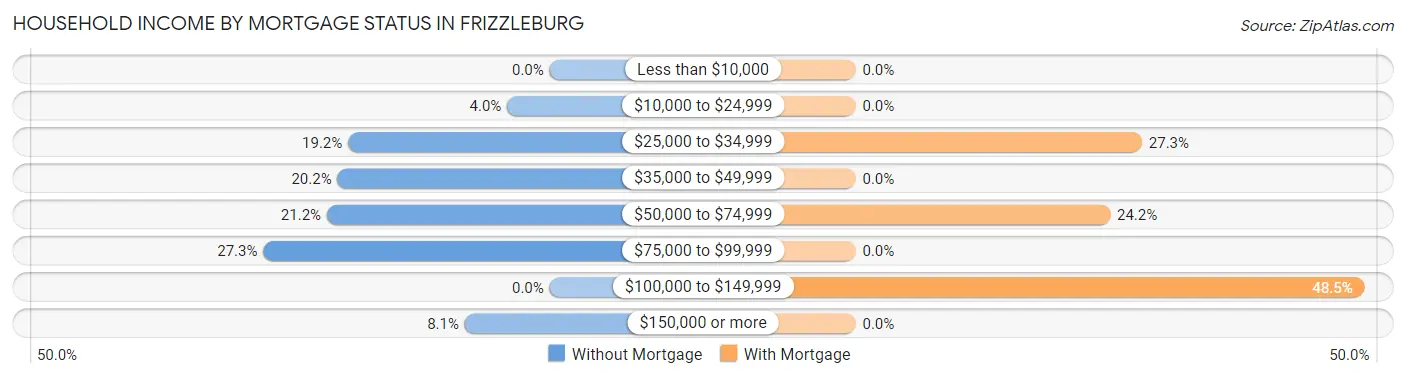
| Household Income | Without Mortgage | With Mortgage |
| Less than $10,000 | 0 (0.0%) | 0 (0.0%) |
| $10,000 to $24,999 | 4 (4.0%) | 0 (0.0%) |
| $25,000 to $34,999 | 19 (19.2%) | 9 (27.3%) |
| $35,000 to $49,999 | 20 (20.2%) | 0 (0.0%) |
| $50,000 to $74,999 | 21 (21.2%) | 8 (24.2%) |
| $75,000 to $99,999 | 27 (27.3%) | 0 (0.0%) |
| $100,000 to $149,999 | 0 (0.0%) | 16 (48.5%) |
| $150,000 or more | 8 (8.1%) | 0 (0.0%) |
| Total | 99 (100.0%) | 33 (100.0%) |
Property Value to Household Income Ratio in Frizzleburg
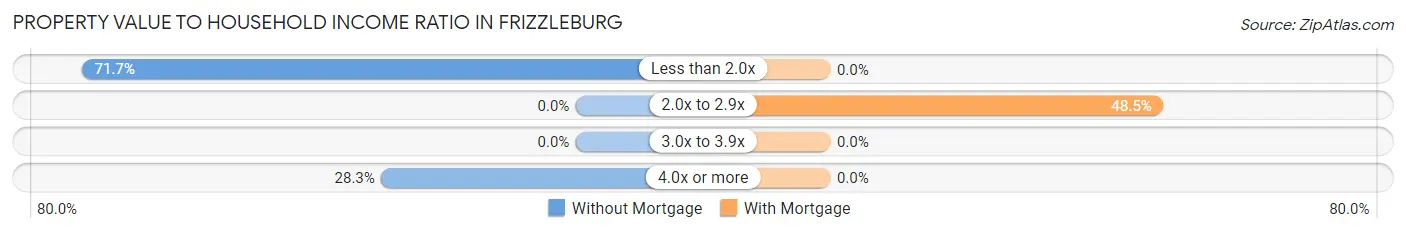
| Value-to-Income Ratio | Without Mortgage | With Mortgage |
| Less than 2.0x | 71 (71.7%) | 0 (0.0%) |
| 2.0x to 2.9x | 0 (0.0%) | 16 (48.5%) |
| 3.0x to 3.9x | 0 (0.0%) | 0 (0.0%) |
| 4.0x or more | 28 (28.3%) | 0 (0.0%) |
| Total | 99 (100.0%) | 33 (100.0%) |
Real Estate Taxes by Mortgage Status in Frizzleburg
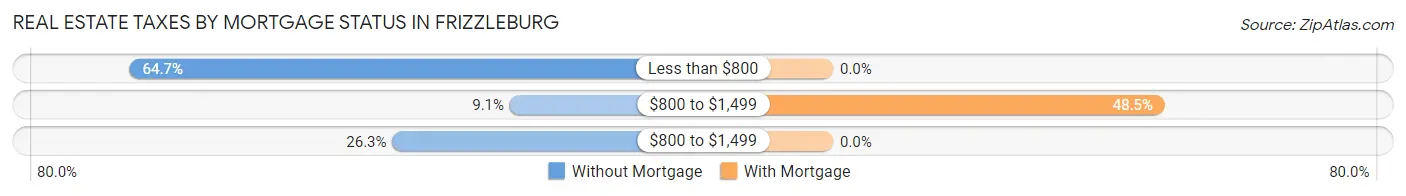
| Property Taxes | Without Mortgage | With Mortgage |
| Less than $800 | 64 (64.6%) | 0 (0.0%) |
| $800 to $1,499 | 9 (9.1%) | 16 (48.5%) |
| $800 to $1,499 | 26 (26.3%) | 0 (0.0%) |
| Total | 99 (100.0%) | 33 (100.0%) |
Health & Disability in Frizzleburg
Health Insurance Coverage by Age in Frizzleburg
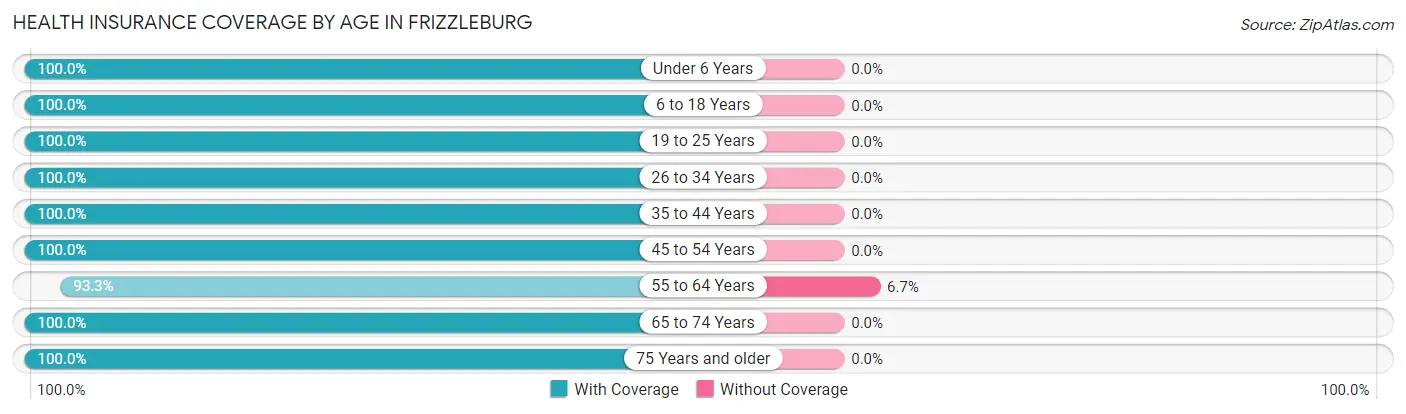
| Age Bracket | With Coverage | Without Coverage |
| Under 6 Years | 24 (100.0%) | 0 (0.0%) |
| 6 to 18 Years | 23 (100.0%) | 0 (0.0%) |
| 19 to 25 Years | 12 (100.0%) | 0 (0.0%) |
| 26 to 34 Years | 30 (100.0%) | 0 (0.0%) |
| 35 to 44 Years | 39 (100.0%) | 0 (0.0%) |
| 45 to 54 Years | 12 (100.0%) | 0 (0.0%) |
| 55 to 64 Years | 56 (93.3%) | 4 (6.7%) |
| 65 to 74 Years | 73 (100.0%) | 0 (0.0%) |
| 75 Years and older | 27 (100.0%) | 0 (0.0%) |
| Total | 296 (98.7%) | 4 (1.3%) |
Health Insurance Coverage by Citizenship Status in Frizzleburg
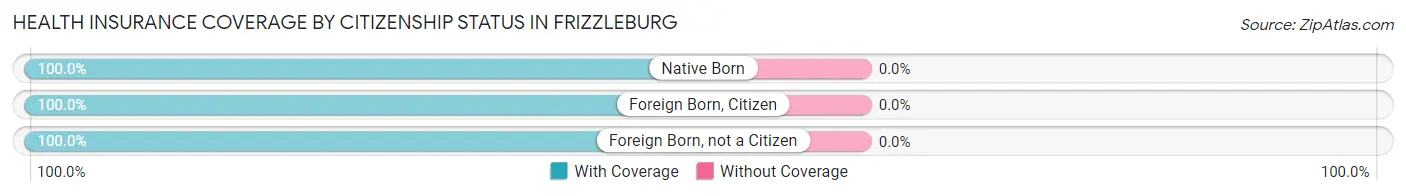
| Citizenship Status | With Coverage | Without Coverage |
| Native Born | 24 (100.0%) | 0 (0.0%) |
| Foreign Born, Citizen | 23 (100.0%) | 0 (0.0%) |
| Foreign Born, not a Citizen | 12 (100.0%) | 0 (0.0%) |
Health Insurance Coverage by Household Income in Frizzleburg
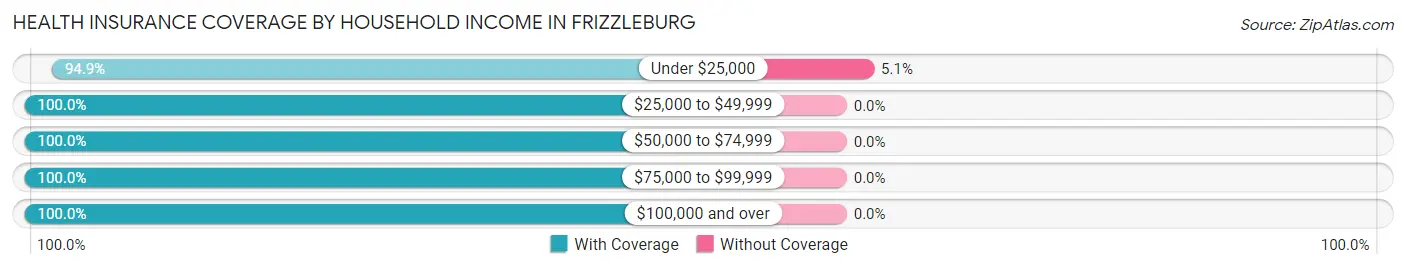
| Household Income | With Coverage | Without Coverage |
| Under $25,000 | 74 (94.9%) | 4 (5.1%) |
| $25,000 to $49,999 | 79 (100.0%) | 0 (0.0%) |
| $50,000 to $74,999 | 43 (100.0%) | 0 (0.0%) |
| $75,000 to $99,999 | 84 (100.0%) | 0 (0.0%) |
| $100,000 and over | 16 (100.0%) | 0 (0.0%) |
Public vs Private Health Insurance Coverage by Age in Frizzleburg
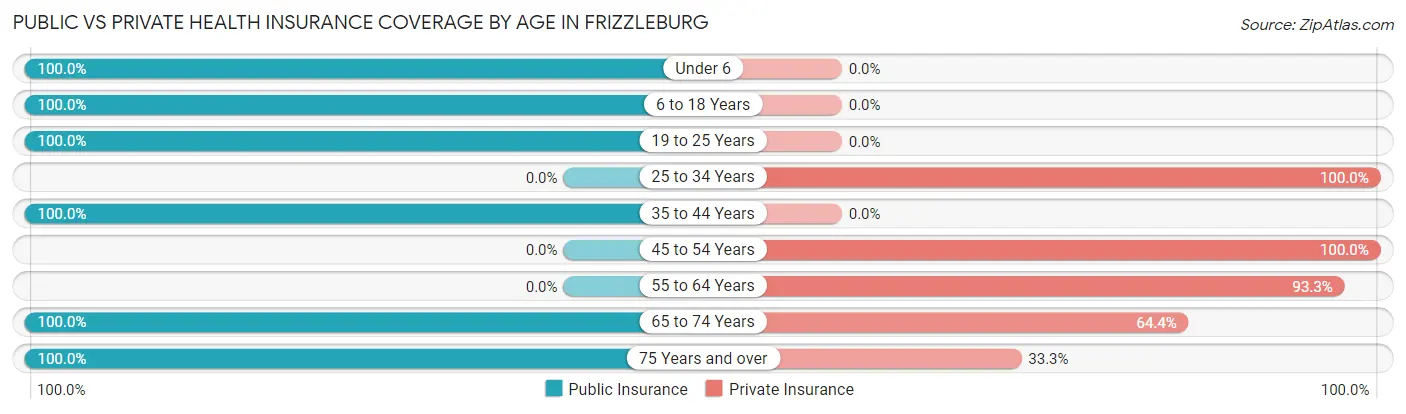
| Age Bracket | Public Insurance | Private Insurance |
| Under 6 | 24 (100.0%) | 0 (0.0%) |
| 6 to 18 Years | 23 (100.0%) | 0 (0.0%) |
| 19 to 25 Years | 12 (100.0%) | 0 (0.0%) |
| 25 to 34 Years | 0 (0.0%) | 30 (100.0%) |
| 35 to 44 Years | 39 (100.0%) | 0 (0.0%) |
| 45 to 54 Years | 0 (0.0%) | 12 (100.0%) |
| 55 to 64 Years | 0 (0.0%) | 56 (93.3%) |
| 65 to 74 Years | 73 (100.0%) | 47 (64.4%) |
| 75 Years and over | 27 (100.0%) | 9 (33.3%) |
| Total | 198 (66.0%) | 154 (51.3%) |
Disability Status by Sex by Age in Frizzleburg
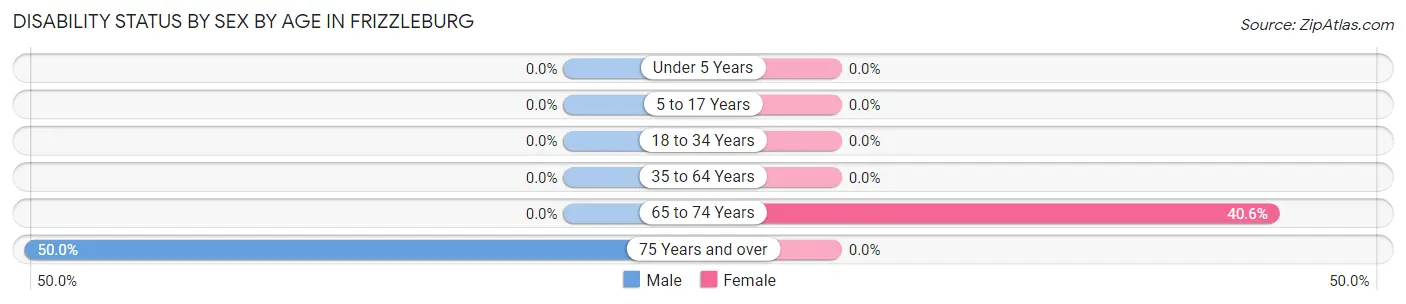
| Age Bracket | Male | Female |
| Under 5 Years | 0 (0.0%) | 0 (0.0%) |
| 5 to 17 Years | 0 (0.0%) | 0 (0.0%) |
| 18 to 34 Years | 0 (0.0%) | 0 (0.0%) |
| 35 to 64 Years | 0 (0.0%) | 0 (0.0%) |
| 65 to 74 Years | 0 (0.0%) | 26 (40.6%) |
| 75 Years and over | 9 (50.0%) | 0 (0.0%) |
Disability Class by Sex by Age in Frizzleburg
Disability Class: Hearing Difficulty
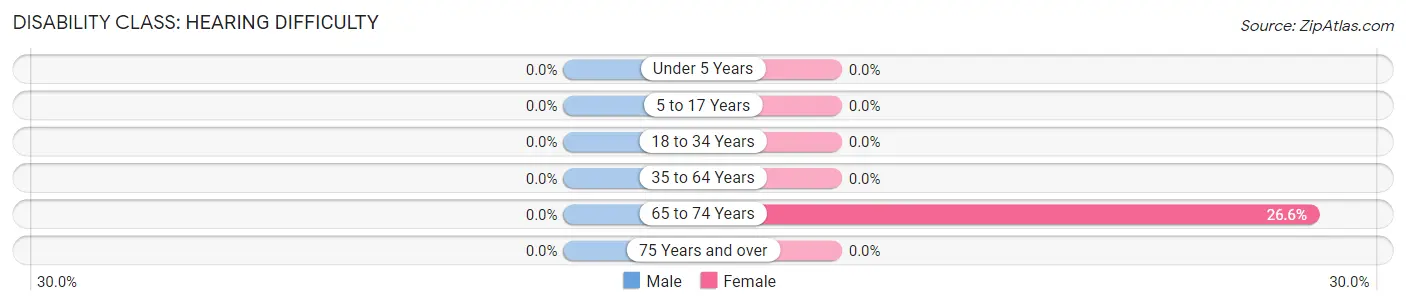
| Age Bracket | Male | Female |
| Under 5 Years | 0 (0.0%) | 0 (0.0%) |
| 5 to 17 Years | 0 (0.0%) | 0 (0.0%) |
| 18 to 34 Years | 0 (0.0%) | 0 (0.0%) |
| 35 to 64 Years | 0 (0.0%) | 0 (0.0%) |
| 65 to 74 Years | 0 (0.0%) | 17 (26.6%) |
| 75 Years and over | 0 (0.0%) | 0 (0.0%) |
Disability Class: Vision Difficulty
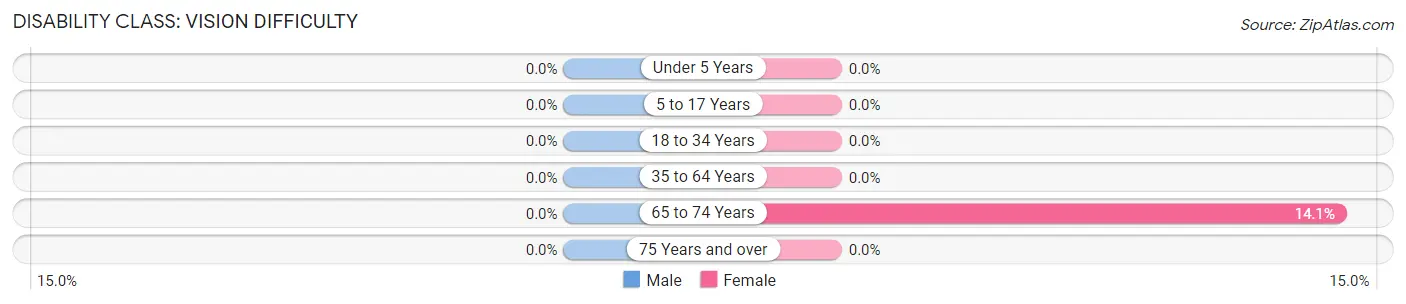
| Age Bracket | Male | Female |
| Under 5 Years | 0 (0.0%) | 0 (0.0%) |
| 5 to 17 Years | 0 (0.0%) | 0 (0.0%) |
| 18 to 34 Years | 0 (0.0%) | 0 (0.0%) |
| 35 to 64 Years | 0 (0.0%) | 0 (0.0%) |
| 65 to 74 Years | 0 (0.0%) | 9 (14.1%) |
| 75 Years and over | 0 (0.0%) | 0 (0.0%) |
Disability Class: Cognitive Difficulty
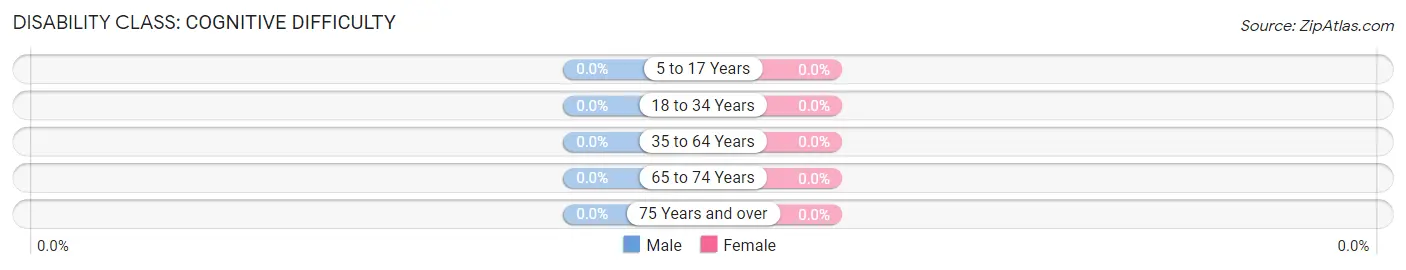
| Age Bracket | Male | Female |
| 5 to 17 Years | 0 (0.0%) | 0 (0.0%) |
| 18 to 34 Years | 0 (0.0%) | 0 (0.0%) |
| 35 to 64 Years | 0 (0.0%) | 0 (0.0%) |
| 65 to 74 Years | 0 (0.0%) | 0 (0.0%) |
| 75 Years and over | 0 (0.0%) | 0 (0.0%) |
Disability Class: Ambulatory Difficulty
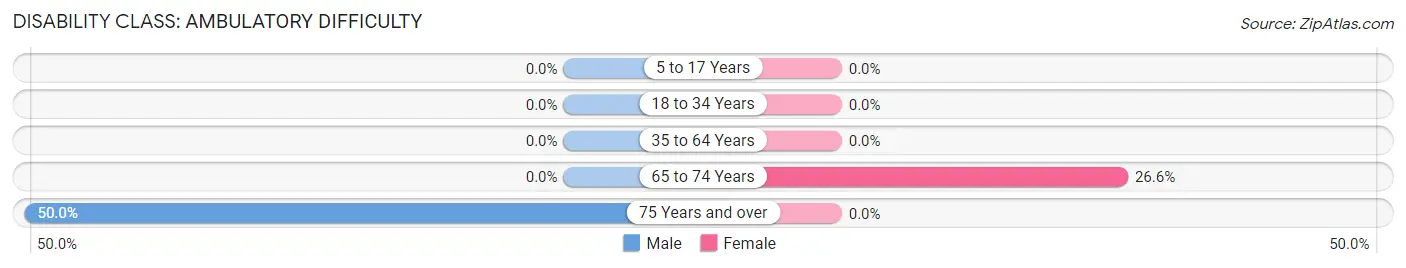
| Age Bracket | Male | Female |
| 5 to 17 Years | 0 (0.0%) | 0 (0.0%) |
| 18 to 34 Years | 0 (0.0%) | 0 (0.0%) |
| 35 to 64 Years | 0 (0.0%) | 0 (0.0%) |
| 65 to 74 Years | 0 (0.0%) | 17 (26.6%) |
| 75 Years and over | 9 (50.0%) | 0 (0.0%) |
Disability Class: Self-Care Difficulty
| Age Bracket | Male | Female |
| 5 to 17 Years | 0 (0.0%) | 0 (0.0%) |
| 18 to 34 Years | 0 (0.0%) | 0 (0.0%) |
| 35 to 64 Years | 0 (0.0%) | 0 (0.0%) |
| 65 to 74 Years | 0 (0.0%) | 0 (0.0%) |
| 75 Years and over | 0 (0.0%) | 0 (0.0%) |
Technology Access in Frizzleburg
Computing Device Access in Frizzleburg
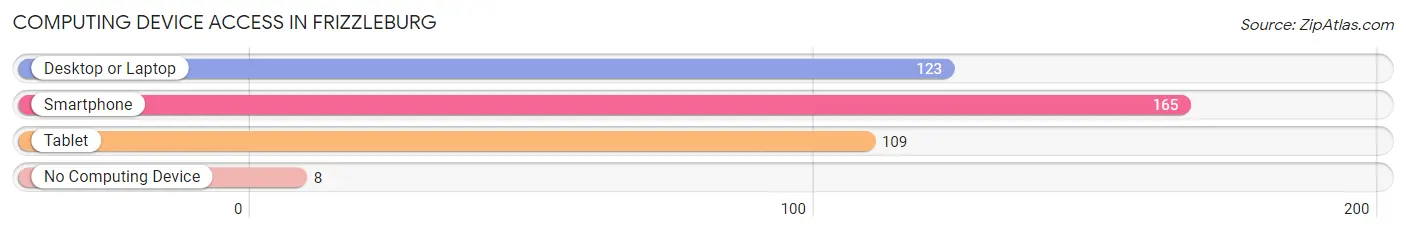
| Device Type | # Households | % Households |
| Desktop or Laptop | 123 | 71.1% |
| Smartphone | 165 | 95.4% |
| Tablet | 109 | 63.0% |
| No Computing Device | 8 | 4.6% |
| Total | 173 | 100.0% |
Internet Access in Frizzleburg
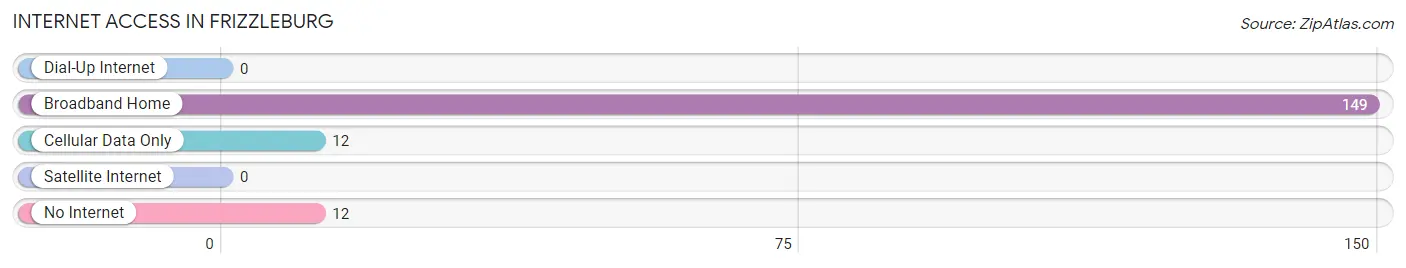
| Internet Type | # Households | % Households |
| Dial-Up Internet | 0 | 0.0% |
| Broadband Home | 149 | 86.1% |
| Cellular Data Only | 12 | 6.9% |
| Satellite Internet | 0 | 0.0% |
| No Internet | 12 | 6.9% |
| Total | 173 | 100.0% |
Frizzleburg Summary
History
The history of Frizzleburg, Pennsylvania dates back to the late 1700s when the area was first settled by German immigrants. The town was originally known as “Fritz’s Town” after the first settler, John Fritz. The town was officially incorporated in 1819 and was named Frizzleburg in honor of the original settler.
The town grew slowly but steadily over the years, and by the mid-1800s, it had become a thriving agricultural community. The town was home to several mills, a tannery, and a variety of other businesses. The town also had a railroad station, which allowed for the transportation of goods and people to and from the area.
In the early 1900s, Frizzleburg experienced a period of rapid growth. The town was home to several factories, including a steel mill, a paper mill, and a brickyard. The town also had a variety of stores, restaurants, and other businesses.
The town continued to grow throughout the 20th century, and by the year 2000, it had a population of over 5,000 people. The town is still largely agricultural, but it also has a variety of other businesses, including a hospital, a college, and a variety of retail stores.
Geography
Frizzleburg is located in the southeastern corner of Pennsylvania, in the Susquehanna Valley. The town is situated on the banks of the Susquehanna River, and is surrounded by rolling hills and farmland. The town is located approximately 30 miles from the state capital of Harrisburg.
The town is located in a temperate climate, with hot summers and cold winters. The average temperature in the summer is around 75 degrees Fahrenheit, and the average temperature in the winter is around 30 degrees Fahrenheit.
Economy
The economy of Frizzleburg is largely based on agriculture. The town is home to several farms, which produce a variety of crops, including corn, soybeans, and wheat. The town also has a variety of other businesses, including a hospital, a college, and a variety of retail stores.
The town is also home to a variety of manufacturing businesses, including a steel mill, a paper mill, and a brickyard. These businesses provide employment for many of the town’s residents.
Demographics
As of the year 2000, the population of Frizzleburg was 5,072. The town is predominantly white, with a small African American population. The town also has a small Hispanic population. The median household income in the town is $41,000, and the median home value is $90,000. The town has a low unemployment rate, and the majority of the town’s residents are employed in either agriculture or manufacturing.
Common Questions
What is Per Capita Income in Frizzleburg?
Per Capita income in Frizzleburg is $47,786.
What is the Median Family Income in Frizzleburg?
Median Family Income in Frizzleburg is $80,227.
What is the Median Household income in Frizzleburg?
Median Household Income in Frizzleburg is $38,188.
What is Income or Wage Gap in Frizzleburg?
Income or Wage Gap in Frizzleburg is 39.4%.
Women in Frizzleburg earn 60.6 cents for every dollar earned by a man.
What is Inequality or Gini Index in Frizzleburg?
Inequality or Gini Index in Frizzleburg is 0.60.
What is the Total Population of Frizzleburg?
Total Population of Frizzleburg is 300.
What is the Total Male Population of Frizzleburg?
Total Male Population of Frizzleburg is 147.
What is the Total Female Population of Frizzleburg?
Total Female Population of Frizzleburg is 153.
What is the Ratio of Males per 100 Females in Frizzleburg?
There are 96.08 Males per 100 Females in Frizzleburg.
What is the Ratio of Females per 100 Males in Frizzleburg?
There are 104.08 Females per 100 Males in Frizzleburg.
What is the Median Population Age in Frizzleburg?
Median Population Age in Frizzleburg is 55.5 Years.
What is the Average Family Size in Frizzleburg
Average Family Size in Frizzleburg is 2.1 People.
What is the Average Household Size in Frizzleburg
Average Household Size in Frizzleburg is 1.7 People.
How Large is the Labor Force in Frizzleburg?
There are 118 People in the Labor Forcein in Frizzleburg.
What is the Percentage of People in the Labor Force in Frizzleburg?
46.6% of People are in the Labor Force in Frizzleburg.