Pittston, PA Map & Demographics
Pittston Map
Pittston Overview
$27,642
PER CAPITA INCOME
$60,609
AVG FAMILY INCOME
$44,863
AVG HOUSEHOLD INCOME
31.7%
WAGE / INCOME GAP [ % ]
68.3¢/ $1
WAGE / INCOME GAP [ $ ]
0.44
INEQUALITY / GINI INDEX
7,601
TOTAL POPULATION
3,379
MALE POPULATION
4,222
FEMALE POPULATION
80.03
MALES / 100 FEMALES
124.95
FEMALES / 100 MALES
36.0
MEDIAN AGE
3.1
AVG FAMILY SIZE
2.2
AVG HOUSEHOLD SIZE
3,721
LABOR FORCE [ PEOPLE ]
61.5%
PERCENT IN LABOR FORCE
6.8%
UNEMPLOYMENT RATE
Pittston Area Codes
Income in Pittston
Income Overview in Pittston
Per Capita Income in Pittston is $27,642, while median incomes of families and households are $60,609 and $44,863 respectively.
| Characteristic | Number | Measure |
| Per Capita Income | 7,601 | $27,642 |
| Median Family Income | 1,627 | $60,609 |
| Mean Family Income | 1,627 | $67,095 |
| Median Household Income | 3,399 | $44,863 |
| Mean Household Income | 3,399 | $60,412 |
| Income Deficit | 1,627 | $0 |
| Wage / Income Gap (%) | 7,601 | 31.69% |
| Wage / Income Gap ($) | 7,601 | 68.31¢ per $1 |
| Gini / Inequality Index | 7,601 | 0.44 |
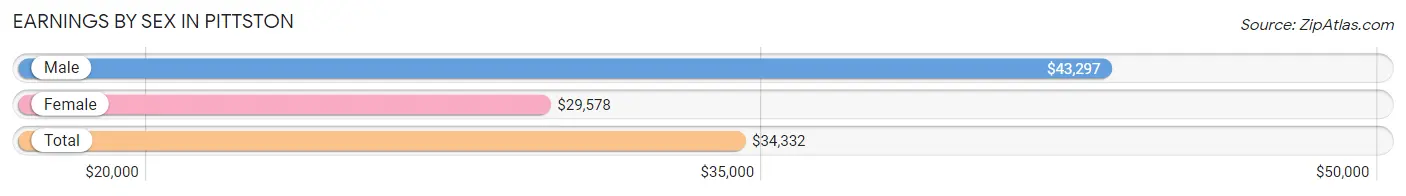
Earnings by Sex in Pittston
Average Earnings in Pittston are $34,332, $43,297 for men and $29,578 for women, a difference of 31.7%.
| Sex | Number | Average Earnings |
| Male | 1,856 (49.5%) | $43,297 |
| Female | 1,892 (50.5%) | $29,578 |
| Total | 3,748 (100.0%) | $34,332 |
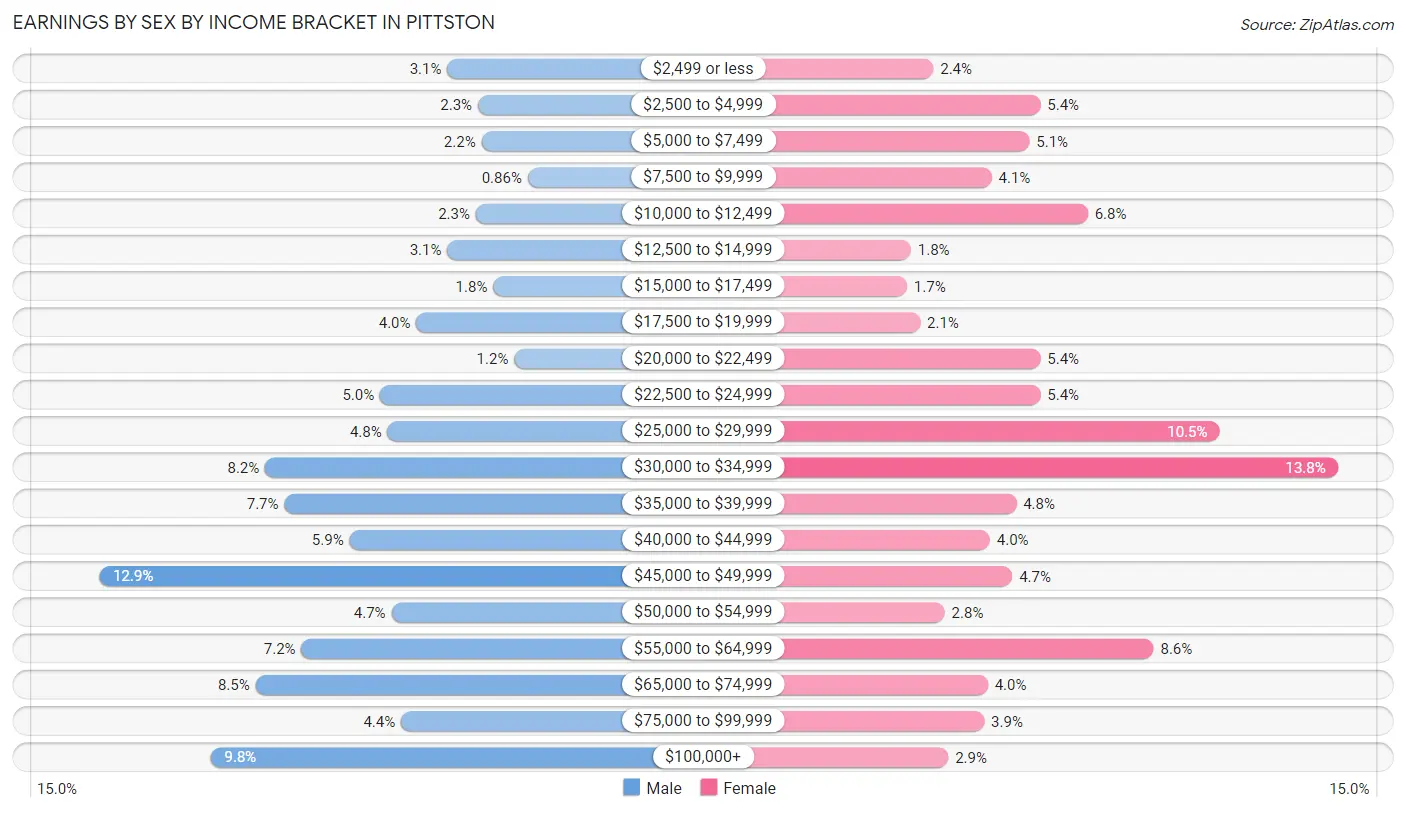
Earnings by Sex by Income Bracket in Pittston
The most common earnings brackets in Pittston are $45,000 to $49,999 for men (239 | 12.9%) and $30,000 to $34,999 for women (261 | 13.8%).
| Income | Male | Female |
| $2,499 or less | 58 (3.1%) | 46 (2.4%) |
| $2,500 to $4,999 | 42 (2.3%) | 103 (5.4%) |
| $5,000 to $7,499 | 40 (2.2%) | 97 (5.1%) |
| $7,500 to $9,999 | 16 (0.9%) | 77 (4.1%) |
| $10,000 to $12,499 | 43 (2.3%) | 128 (6.8%) |
| $12,500 to $14,999 | 58 (3.1%) | 34 (1.8%) |
| $15,000 to $17,499 | 34 (1.8%) | 32 (1.7%) |
| $17,500 to $19,999 | 74 (4.0%) | 39 (2.1%) |
| $20,000 to $22,499 | 23 (1.2%) | 103 (5.4%) |
| $22,500 to $24,999 | 93 (5.0%) | 103 (5.4%) |
| $25,000 to $29,999 | 89 (4.8%) | 198 (10.5%) |
| $30,000 to $34,999 | 153 (8.2%) | 261 (13.8%) |
| $35,000 to $39,999 | 143 (7.7%) | 90 (4.8%) |
| $40,000 to $44,999 | 109 (5.9%) | 76 (4.0%) |
| $45,000 to $49,999 | 239 (12.9%) | 88 (4.6%) |
| $50,000 to $54,999 | 87 (4.7%) | 52 (2.8%) |
| $55,000 to $64,999 | 134 (7.2%) | 163 (8.6%) |
| $65,000 to $74,999 | 158 (8.5%) | 75 (4.0%) |
| $75,000 to $99,999 | 82 (4.4%) | 73 (3.9%) |
| $100,000+ | 181 (9.8%) | 54 (2.9%) |
| Total | 1,856 (100.0%) | 1,892 (100.0%) |
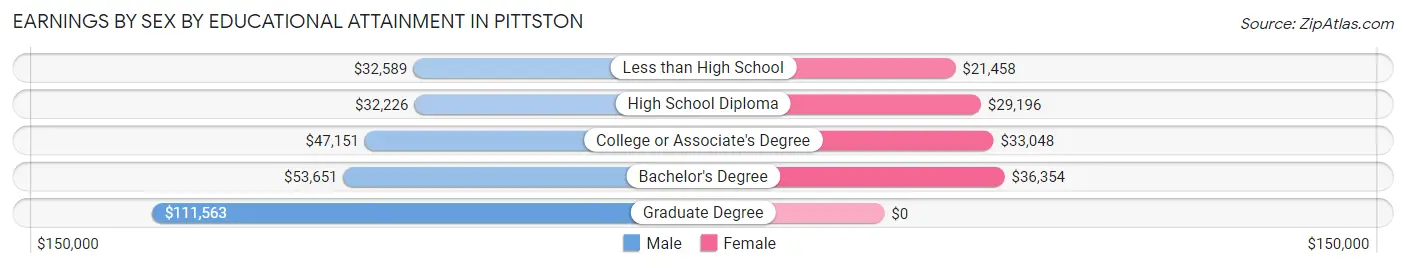
Earnings by Sex by Educational Attainment in Pittston
Average earnings in Pittston are $45,765 for men and $30,997 for women, a difference of 32.3%. Men with an educational attainment of graduate degree enjoy the highest average annual earnings of $111,563, while those with high school diploma education earn the least with $32,226. Women with an educational attainment of bachelor's degree earn the most with the average annual earnings of $36,354, while those with less than high school education have the smallest earnings of $21,458.
| Educational Attainment | Male Income | Female Income |
| Less than High School | $32,589 | $21,458 |
| High School Diploma | $32,226 | $29,196 |
| College or Associate's Degree | $47,151 | $33,048 |
| Bachelor's Degree | $53,651 | $36,354 |
| Graduate Degree | $111,563 | $0 |
| Total | $45,765 | $30,997 |
Family Income in Pittston
Family Income Brackets in Pittston
According to the Pittston family income data, there are 259 families falling into the $75,000 to $99,999 income range, which is the most common income bracket and makes up 15.9% of all families. Conversely, the $200,000+ income bracket is the least frequent group with only 33 families (2.0%) belonging to this category.
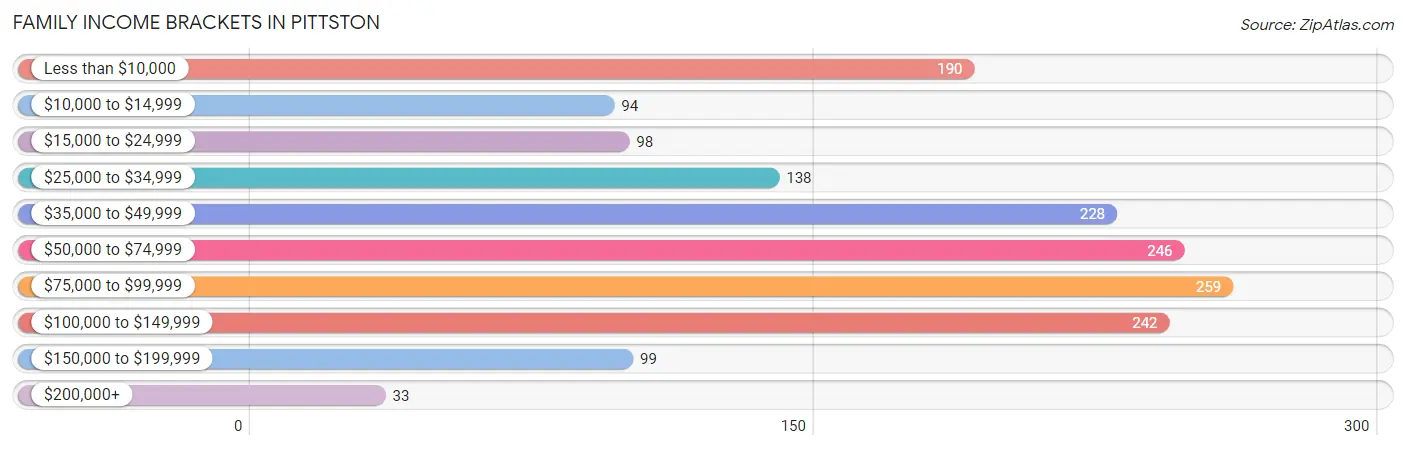
| Income Bracket | # Families | % Families |
| Less than $10,000 | 190 | 11.7% |
| $10,000 to $14,999 | 94 | 5.8% |
| $15,000 to $24,999 | 98 | 6.0% |
| $25,000 to $34,999 | 138 | 8.5% |
| $35,000 to $49,999 | 228 | 14.0% |
| $50,000 to $74,999 | 246 | 15.1% |
| $75,000 to $99,999 | 259 | 15.9% |
| $100,000 to $149,999 | 242 | 14.9% |
| $150,000 to $199,999 | 99 | 6.1% |
| $200,000+ | 33 | 2.0% |
Family Income by Famaliy Size in Pittston
3-person families (407 | 25.0%) account for the highest median family income in Pittston with $72,202 per family, while 2-person families (855 | 52.5%) have the highest median income of $24,919 per family member.
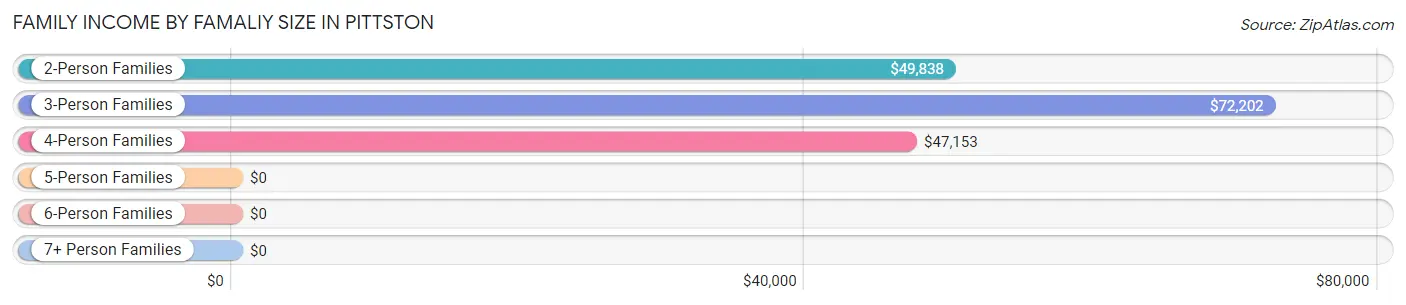
| Income Bracket | # Families | Median Income |
| 2-Person Families | 855 (52.5%) | $49,838 |
| 3-Person Families | 407 (25.0%) | $72,202 |
| 4-Person Families | 199 (12.2%) | $47,153 |
| 5-Person Families | 86 (5.3%) | $0 |
| 6-Person Families | 31 (1.9%) | $0 |
| 7+ Person Families | 49 (3.0%) | $0 |
| Total | 1,627 (100.0%) | $60,609 |
Family Income by Number of Earners in Pittston
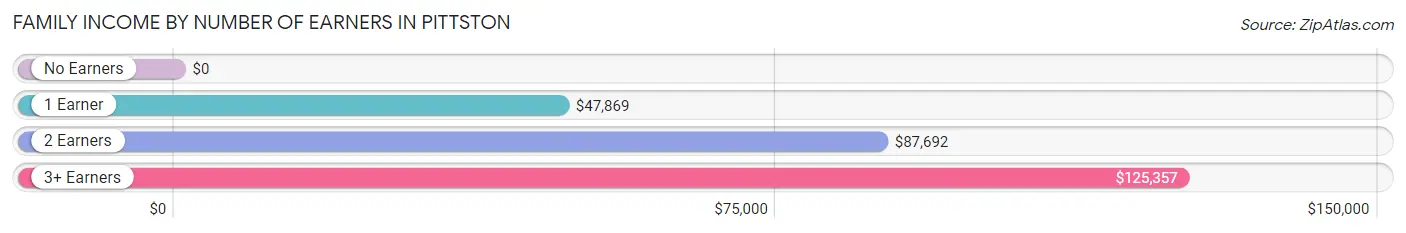
| Number of Earners | # Families | Median Income |
| No Earners | 327 (20.1%) | $0 |
| 1 Earner | 714 (43.9%) | $47,869 |
| 2 Earners | 446 (27.4%) | $87,692 |
| 3+ Earners | 140 (8.6%) | $125,357 |
| Total | 1,627 (100.0%) | $60,609 |
Household Income in Pittston
Household Income Brackets in Pittston
With 513 households falling in the category, the $25,000 to $34,999 income range is the most frequent in Pittston, accounting for 15.1% of all households. In contrast, only 88 households (2.6%) fall into the $200,000+ income bracket, making it the least populous group.
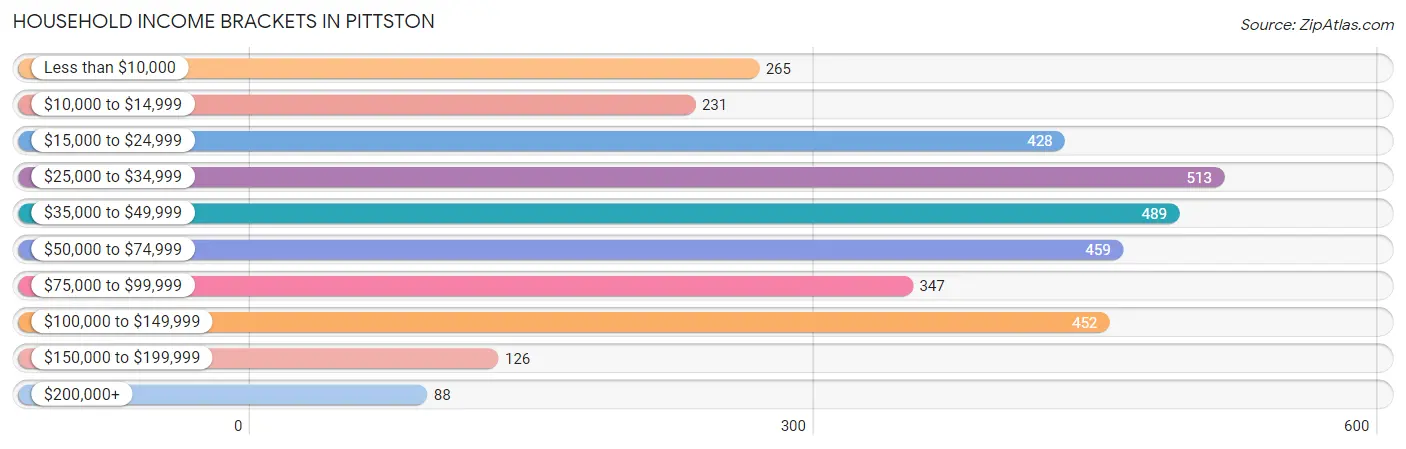
| Income Bracket | # Households | % Households |
| Less than $10,000 | 265 | 7.8% |
| $10,000 to $14,999 | 231 | 6.8% |
| $15,000 to $24,999 | 428 | 12.6% |
| $25,000 to $34,999 | 513 | 15.1% |
| $35,000 to $49,999 | 489 | 14.4% |
| $50,000 to $74,999 | 459 | 13.5% |
| $75,000 to $99,999 | 347 | 10.2% |
| $100,000 to $149,999 | 452 | 13.3% |
| $150,000 to $199,999 | 126 | 3.7% |
| $200,000+ | 88 | 2.6% |
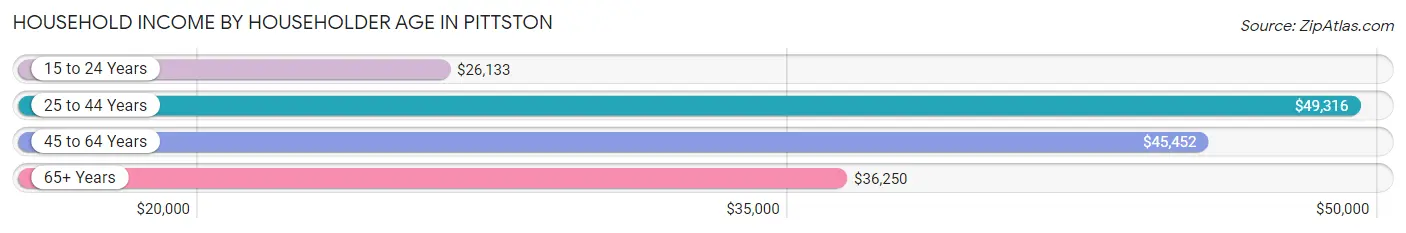
Household Income by Householder Age in Pittston
The median household income in Pittston is $44,863, with the highest median household income of $49,316 found in the 25 to 44 years age bracket for the primary householder. A total of 1,182 households (34.8%) fall into this category. Meanwhile, the 15 to 24 years age bracket for the primary householder has the lowest median household income of $26,133, with 55 households (1.6%) in this group.
| Income Bracket | # Households | Median Income |
| 15 to 24 Years | 55 (1.6%) | $26,133 |
| 25 to 44 Years | 1,182 (34.8%) | $49,316 |
| 45 to 64 Years | 1,215 (35.7%) | $45,452 |
| 65+ Years | 947 (27.9%) | $36,250 |
| Total | 3,399 (100.0%) | $44,863 |
Poverty in Pittston
Income Below Poverty by Sex and Age in Pittston
With 21.0% poverty level for males and 32.9% for females among the residents of Pittston, 12 to 14 year old males and under 5 year old females are the most vulnerable to poverty, with 118 males (85.5%) and 220 females (77.5%) in their respective age groups living below the poverty level.
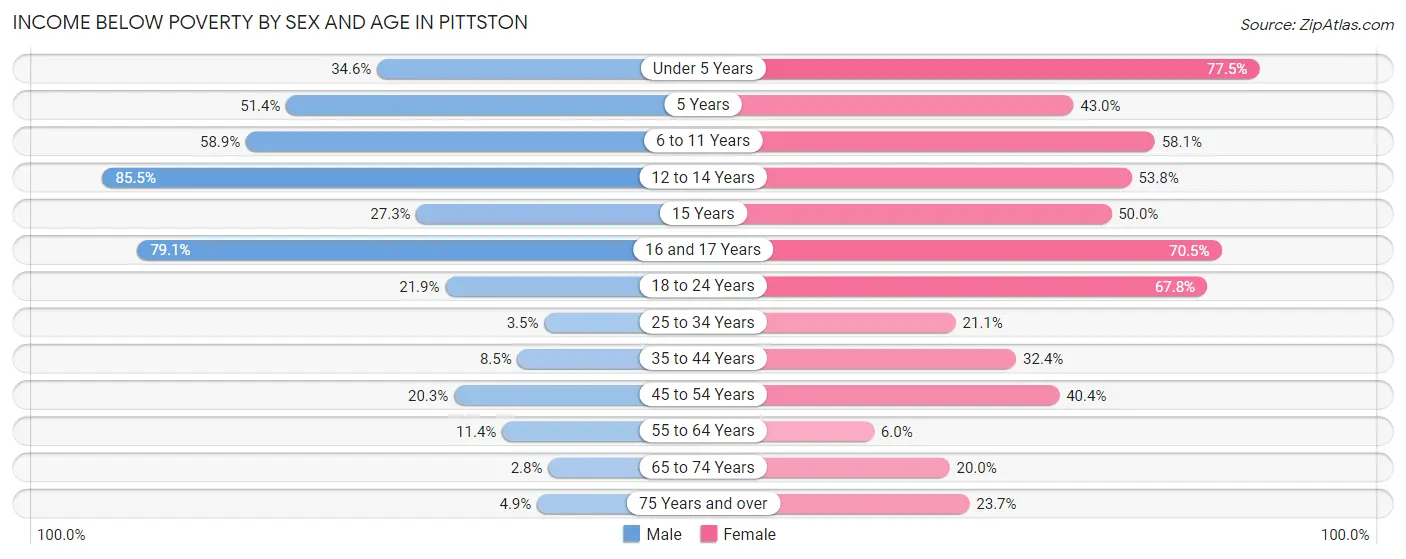
| Age Bracket | Male | Female |
| Under 5 Years | 57 (34.5%) | 220 (77.5%) |
| 5 Years | 18 (51.4%) | 52 (43.0%) |
| 6 to 11 Years | 139 (58.9%) | 201 (58.1%) |
| 12 to 14 Years | 118 (85.5%) | 57 (53.8%) |
| 15 Years | 9 (27.3%) | 9 (50.0%) |
| 16 and 17 Years | 87 (79.1%) | 31 (70.5%) |
| 18 to 24 Years | 71 (21.9%) | 164 (67.8%) |
| 25 to 34 Years | 21 (3.5%) | 187 (21.1%) |
| 35 to 44 Years | 21 (8.5%) | 144 (32.4%) |
| 45 to 54 Years | 84 (20.3%) | 113 (40.4%) |
| 55 to 64 Years | 50 (11.4%) | 39 (6.0%) |
| 65 to 74 Years | 10 (2.8%) | 86 (20.0%) |
| 75 Years and over | 11 (4.9%) | 85 (23.7%) |
| Total | 696 (21.0%) | 1,388 (32.9%) |
Income Above Poverty by Sex and Age in Pittston
According to the poverty statistics in Pittston, males aged 65 to 74 years and females aged 55 to 64 years are the age groups that are most secure financially, with 97.2% of males and 94.0% of females in these age groups living above the poverty line.
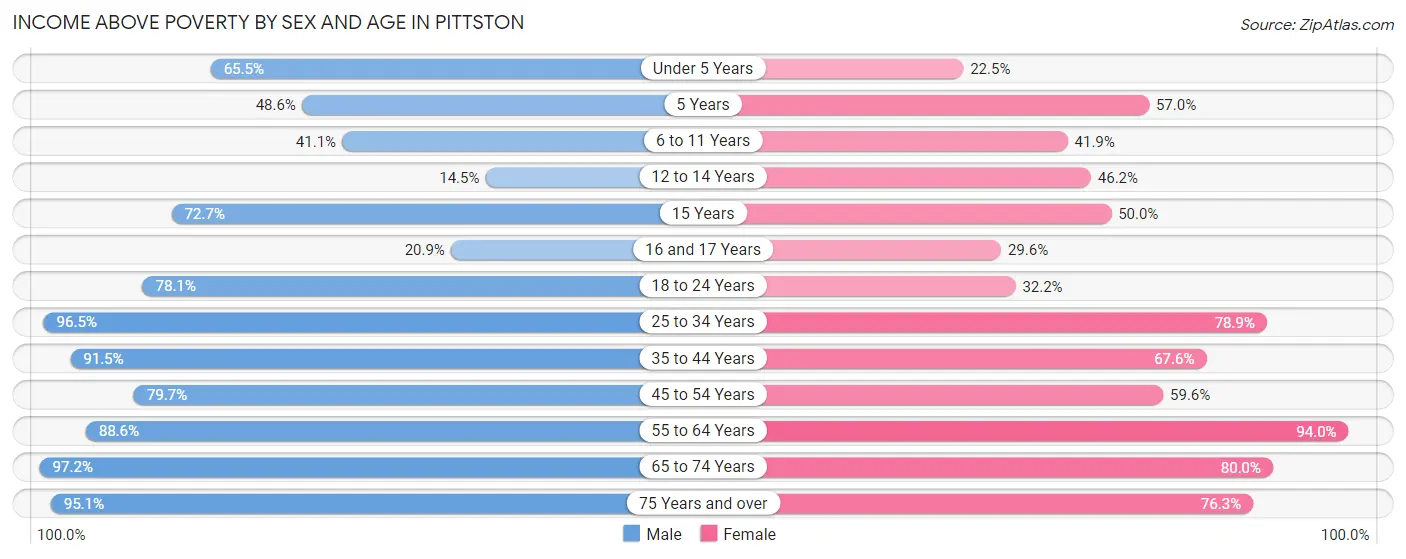
| Age Bracket | Male | Female |
| Under 5 Years | 108 (65.4%) | 64 (22.5%) |
| 5 Years | 17 (48.6%) | 69 (57.0%) |
| 6 to 11 Years | 97 (41.1%) | 145 (41.9%) |
| 12 to 14 Years | 20 (14.5%) | 49 (46.2%) |
| 15 Years | 24 (72.7%) | 9 (50.0%) |
| 16 and 17 Years | 23 (20.9%) | 13 (29.5%) |
| 18 to 24 Years | 253 (78.1%) | 78 (32.2%) |
| 25 to 34 Years | 573 (96.5%) | 698 (78.9%) |
| 35 to 44 Years | 226 (91.5%) | 301 (67.6%) |
| 45 to 54 Years | 330 (79.7%) | 167 (59.6%) |
| 55 to 64 Years | 390 (88.6%) | 615 (94.0%) |
| 65 to 74 Years | 347 (97.2%) | 344 (80.0%) |
| 75 Years and over | 215 (95.1%) | 274 (76.3%) |
| Total | 2,623 (79.0%) | 2,826 (67.1%) |
Income Below Poverty Among Married-Couple Families in Pittston
The poverty statistics for married-couple families in Pittston show that 6.6% or 53 of the total 807 families live below the poverty line. Families with 1 or 2 children have the highest poverty rate of 7.4%, comprising of 18 families. On the other hand, families with 3 or 4 children have the lowest poverty rate of 0.0%, which includes 0 families.
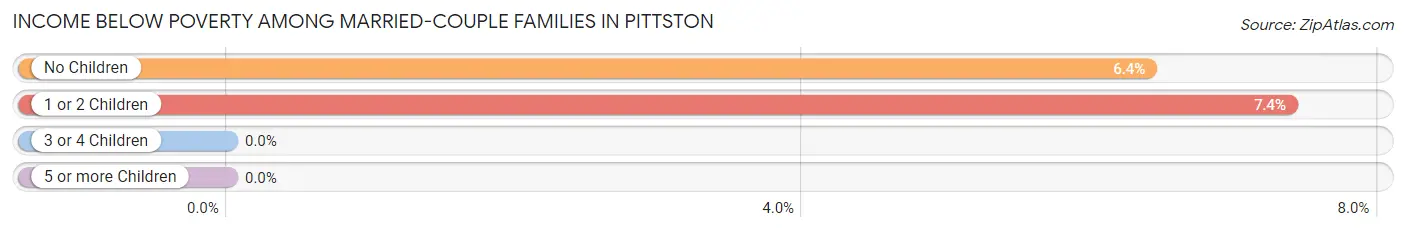
| Children | Above Poverty | Below Poverty |
| No Children | 512 (93.6%) | 35 (6.4%) |
| 1 or 2 Children | 226 (92.6%) | 18 (7.4%) |
| 3 or 4 Children | 6 (100.0%) | 0 (0.0%) |
| 5 or more Children | 10 (100.0%) | 0 (0.0%) |
| Total | 754 (93.4%) | 53 (6.6%) |
Income Below Poverty Among Single-Parent Households in Pittston
According to the poverty data in Pittston, 9.7% or 20 single-father households and 57.1% or 350 single-mother households are living below the poverty line. Among single-father households, those with 1 or 2 children have the highest poverty rate, with 20 households (27.4%) experiencing poverty. Likewise, among single-mother households, those with 3 or 4 children have the highest poverty rate, with 58 households (100.0%) falling below the poverty line.
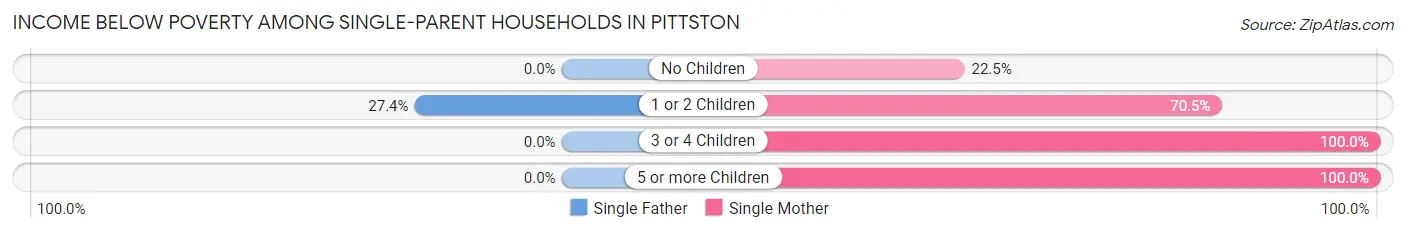
| Children | Single Father | Single Mother |
| No Children | 0 (0.0%) | 52 (22.5%) |
| 1 or 2 Children | 20 (27.4%) | 201 (70.5%) |
| 3 or 4 Children | 0 (0.0%) | 58 (100.0%) |
| 5 or more Children | 0 (0.0%) | 39 (100.0%) |
| Total | 20 (9.7%) | 350 (57.1%) |
Income Below Poverty Among Married-Couple vs Single-Parent Households in Pittston
The poverty data for Pittston shows that 53 of the married-couple family households (6.6%) and 370 of the single-parent households (45.1%) are living below the poverty level. Within the married-couple family households, those with 1 or 2 children have the highest poverty rate, with 18 households (7.4%) falling below the poverty line. Among the single-parent households, those with 5 or more children have the highest poverty rate, with 39 household (100.0%) living below poverty.
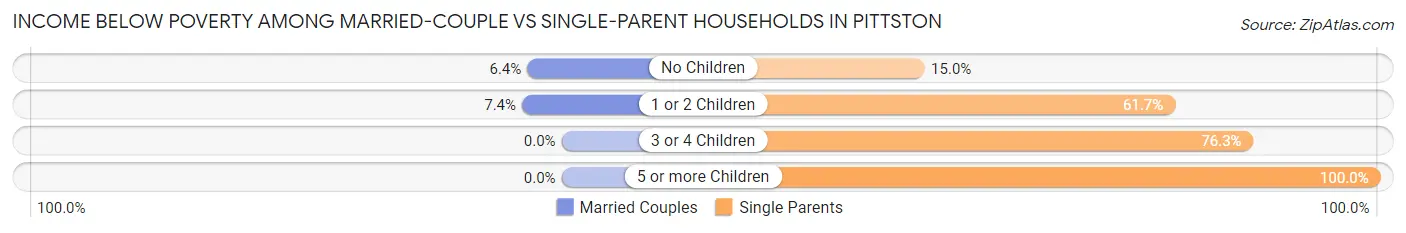
| Children | Married-Couple Families | Single-Parent Households |
| No Children | 35 (6.4%) | 52 (15.0%) |
| 1 or 2 Children | 18 (7.4%) | 221 (61.7%) |
| 3 or 4 Children | 0 (0.0%) | 58 (76.3%) |
| 5 or more Children | 0 (0.0%) | 39 (100.0%) |
| Total | 53 (6.6%) | 370 (45.1%) |
Race in Pittston
The most populous races in Pittston are White / Caucasian (6,533 | 86.0%), Hispanic or Latino (478 | 6.3%), and Black / African American (474 | 6.2%).
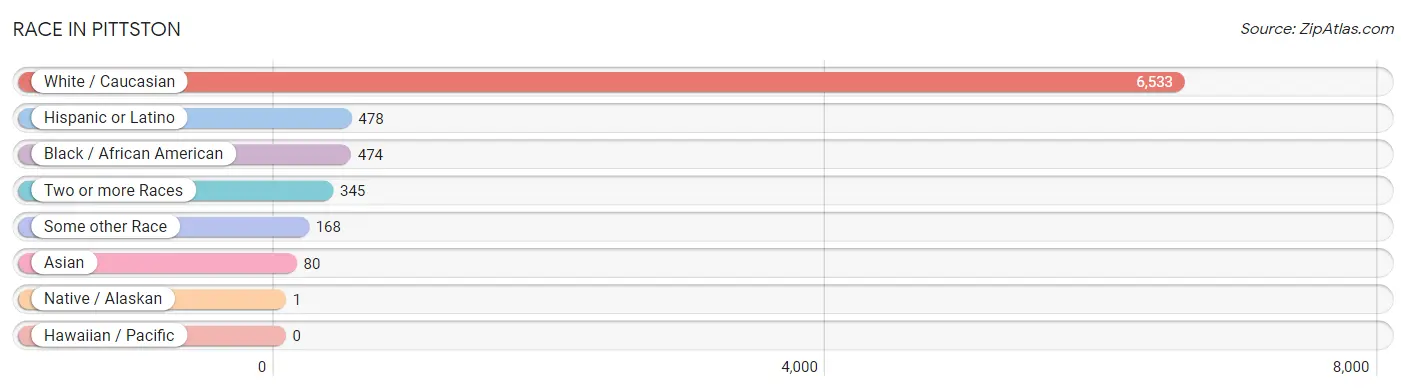
| Race | # Population | % Population |
| Asian | 80 | 1.1% |
| Black / African American | 474 | 6.2% |
| Hawaiian / Pacific | 0 | 0.0% |
| Hispanic or Latino | 478 | 6.3% |
| Native / Alaskan | 1 | 0.0% |
| White / Caucasian | 6,533 | 86.0% |
| Two or more Races | 345 | 4.5% |
| Some other Race | 168 | 2.2% |
| Total | 7,601 | 100.0% |
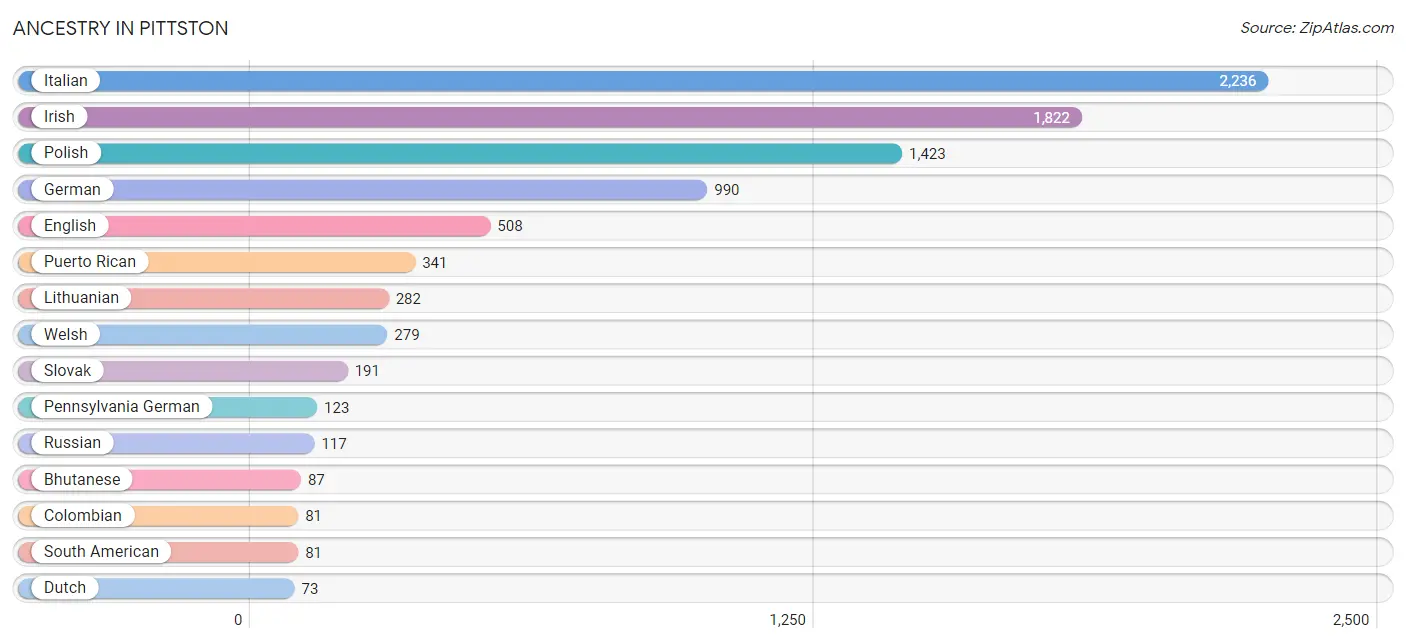
Ancestry in Pittston
The most populous ancestries reported in Pittston are Italian (2,236 | 29.4%), Irish (1,822 | 24.0%), Polish (1,423 | 18.7%), German (990 | 13.0%), and English (508 | 6.7%), together accounting for 91.8% of all Pittston residents.
| Ancestry | # Population | % Population |
| African | 26 | 0.3% |
| American | 56 | 0.7% |
| Arab | 30 | 0.4% |
| Austrian | 12 | 0.2% |
| Belgian | 4 | 0.1% |
| Bhutanese | 87 | 1.1% |
| British | 6 | 0.1% |
| Burmese | 45 | 0.6% |
| Canadian | 6 | 0.1% |
| Carpatho Rusyn | 6 | 0.1% |
| Central American | 14 | 0.2% |
| Cherokee | 4 | 0.1% |
| Colombian | 81 | 1.1% |
| Creek | 1 | 0.0% |
| Croatian | 7 | 0.1% |
| Czech | 50 | 0.7% |
| Danish | 7 | 0.1% |
| Dominican | 12 | 0.2% |
| Dutch | 73 | 1.0% |
| Eastern European | 9 | 0.1% |
| English | 508 | 6.7% |
| European | 17 | 0.2% |
| French | 58 | 0.8% |
| French Canadian | 27 | 0.4% |
| German | 990 | 13.0% |
| Greek | 28 | 0.4% |
| Hungarian | 43 | 0.6% |
| Indian (Asian) | 30 | 0.4% |
| Irish | 1,822 | 24.0% |
| Italian | 2,236 | 29.4% |
| Jamaican | 40 | 0.5% |
| Lebanese | 10 | 0.1% |
| Lithuanian | 282 | 3.7% |
| Mexican | 13 | 0.2% |
| Northern European | 12 | 0.2% |
| Panamanian | 14 | 0.2% |
| Pennsylvania German | 123 | 1.6% |
| Polish | 1,423 | 18.7% |
| Portuguese | 5 | 0.1% |
| Puerto Rican | 341 | 4.5% |
| Russian | 117 | 1.5% |
| Samoan | 37 | 0.5% |
| Scotch-Irish | 5 | 0.1% |
| Scottish | 68 | 0.9% |
| Slovak | 191 | 2.5% |
| South American | 81 | 1.1% |
| Spanish | 16 | 0.2% |
| Sri Lankan | 5 | 0.1% |
| Subsaharan African | 26 | 0.3% |
| Swedish | 18 | 0.2% |
| Syrian | 20 | 0.3% |
| Ukrainian | 68 | 0.9% |
| Welsh | 279 | 3.7% |
| West Indian | 54 | 0.7% | View All 54 Rows |
Immigrants in Pittston
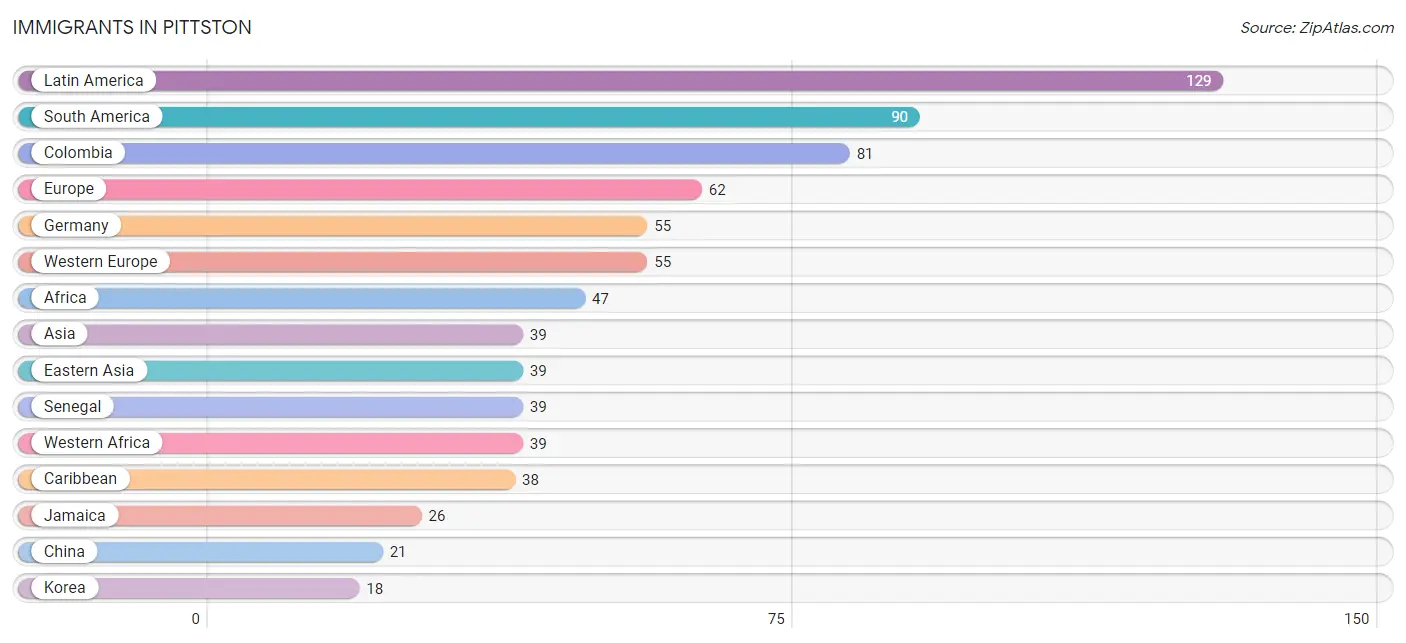
The most numerous immigrant groups reported in Pittston came from Latin America (129 | 1.7%), South America (90 | 1.2%), Colombia (81 | 1.1%), Europe (62 | 0.8%), and Germany (55 | 0.7%), together accounting for 5.5% of all Pittston residents.
| Immigration Origin | # Population | % Population |
| Africa | 47 | 0.6% |
| Asia | 39 | 0.5% |
| Brazil | 9 | 0.1% |
| Caribbean | 38 | 0.5% |
| Central America | 1 | 0.0% |
| China | 21 | 0.3% |
| Colombia | 81 | 1.1% |
| Dominican Republic | 12 | 0.2% |
| Eastern Asia | 39 | 0.5% |
| Europe | 62 | 0.8% |
| Germany | 55 | 0.7% |
| Italy | 7 | 0.1% |
| Jamaica | 26 | 0.3% |
| Korea | 18 | 0.2% |
| Latin America | 129 | 1.7% |
| Mexico | 1 | 0.0% |
| Northern Africa | 8 | 0.1% |
| Senegal | 39 | 0.5% |
| South America | 90 | 1.2% |
| Southern Europe | 7 | 0.1% |
| Western Africa | 39 | 0.5% |
| Western Europe | 55 | 0.7% | View All 22 Rows |
Sex and Age in Pittston
Sex and Age in Pittston
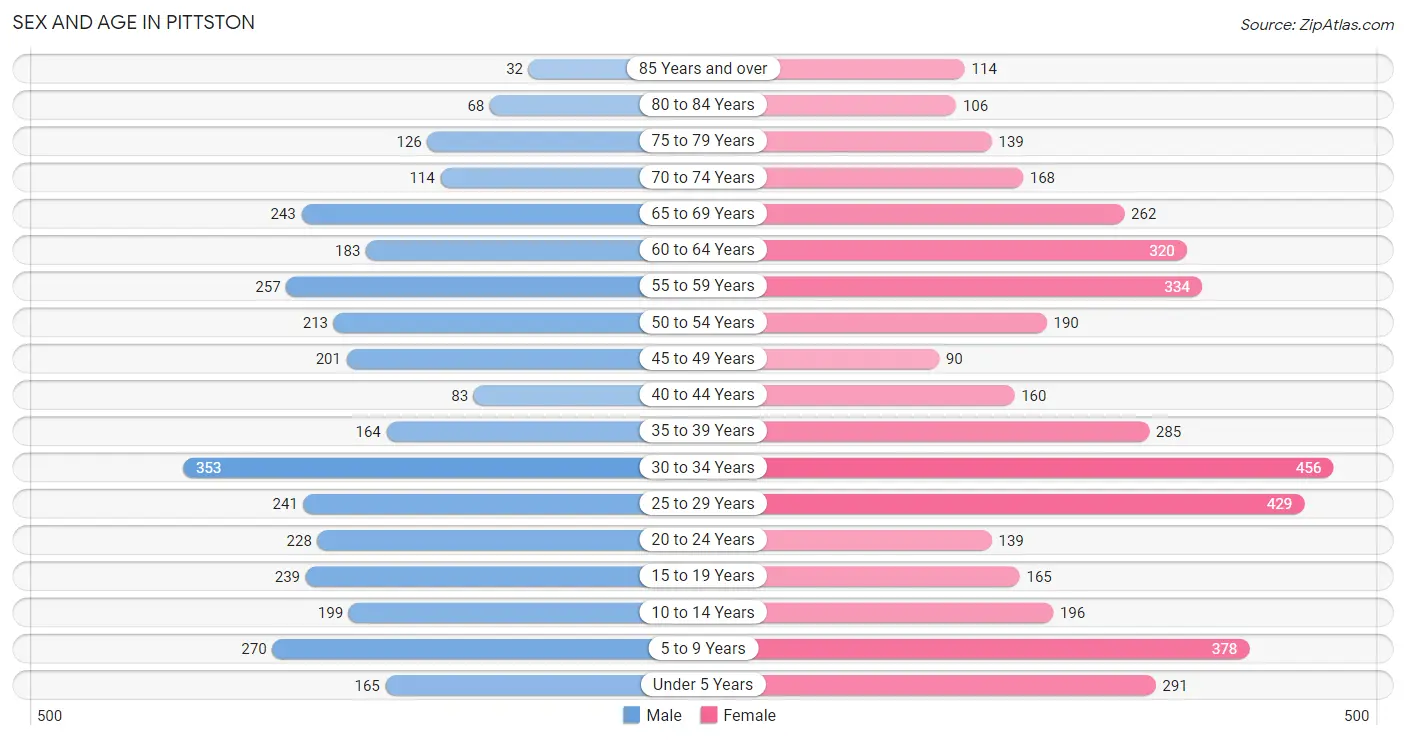
The most populous age groups in Pittston are 30 to 34 Years (353 | 10.4%) for men and 30 to 34 Years (456 | 10.8%) for women.
| Age Bracket | Male | Female |
| Under 5 Years | 165 (4.9%) | 291 (6.9%) |
| 5 to 9 Years | 270 (8.0%) | 378 (8.9%) |
| 10 to 14 Years | 199 (5.9%) | 196 (4.6%) |
| 15 to 19 Years | 239 (7.1%) | 165 (3.9%) |
| 20 to 24 Years | 228 (6.8%) | 139 (3.3%) |
| 25 to 29 Years | 241 (7.1%) | 429 (10.2%) |
| 30 to 34 Years | 353 (10.4%) | 456 (10.8%) |
| 35 to 39 Years | 164 (4.9%) | 285 (6.8%) |
| 40 to 44 Years | 83 (2.5%) | 160 (3.8%) |
| 45 to 49 Years | 201 (5.9%) | 90 (2.1%) |
| 50 to 54 Years | 213 (6.3%) | 190 (4.5%) |
| 55 to 59 Years | 257 (7.6%) | 334 (7.9%) |
| 60 to 64 Years | 183 (5.4%) | 320 (7.6%) |
| 65 to 69 Years | 243 (7.2%) | 262 (6.2%) |
| 70 to 74 Years | 114 (3.4%) | 168 (4.0%) |
| 75 to 79 Years | 126 (3.7%) | 139 (3.3%) |
| 80 to 84 Years | 68 (2.0%) | 106 (2.5%) |
| 85 Years and over | 32 (0.9%) | 114 (2.7%) |
| Total | 3,379 (100.0%) | 4,222 (100.0%) |
Families and Households in Pittston
Median Family Size in Pittston
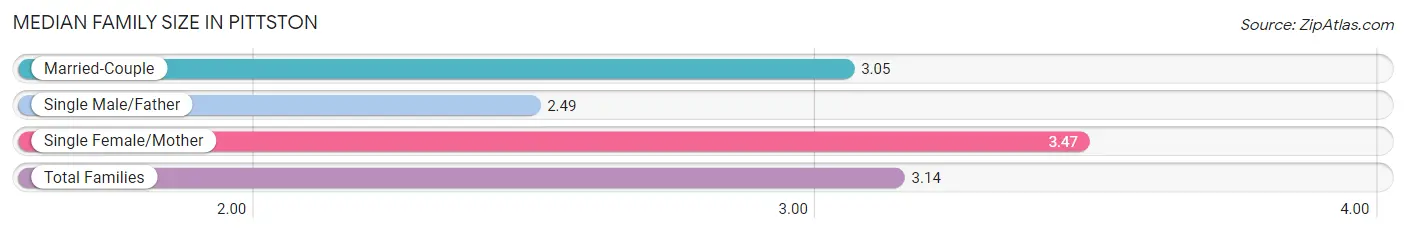
The median family size in Pittston is 3.14 persons per family, with single female/mother families (613 | 37.7%) accounting for the largest median family size of 3.47 persons per family. On the other hand, single male/father families (207 | 12.7%) represent the smallest median family size with 2.49 persons per family.
| Family Type | # Families | Family Size |
| Married-Couple | 807 (49.6%) | 3.05 |
| Single Male/Father | 207 (12.7%) | 2.49 |
| Single Female/Mother | 613 (37.7%) | 3.47 |
| Total Families | 1,627 (100.0%) | 3.14 |
Median Household Size in Pittston
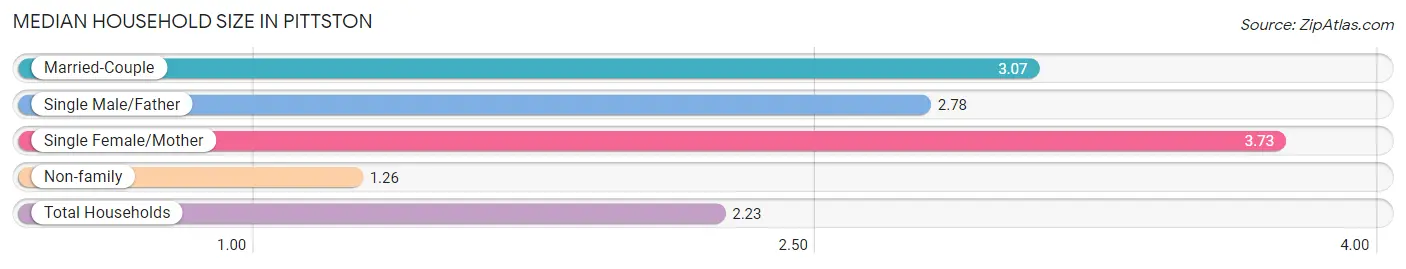
The median household size in Pittston is 2.23 persons per household, with single female/mother households (613 | 18.0%) accounting for the largest median household size of 3.73 persons per household. non-family households (1,772 | 52.1%) represent the smallest median household size with 1.26 persons per household.
| Household Type | # Households | Household Size |
| Married-Couple | 807 (23.7%) | 3.07 |
| Single Male/Father | 207 (6.1%) | 2.78 |
| Single Female/Mother | 613 (18.0%) | 3.73 |
| Non-family | 1,772 (52.1%) | 1.26 |
| Total Households | 3,399 (100.0%) | 2.23 |
Household Size by Marriage Status in Pittston
Out of a total of 3,399 households in Pittston, 1,627 (47.9%) are family households, while 1,772 (52.1%) are nonfamily households. The most numerous type of family households are 2-person households, comprising 773, and the most common type of nonfamily households are 1-person households, comprising 1,346.
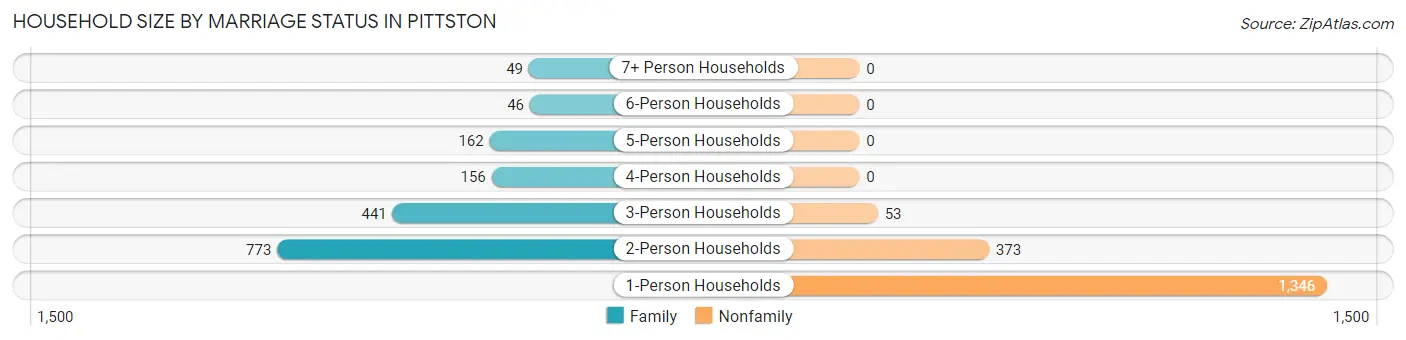
| Household Size | Family Households | Nonfamily Households |
| 1-Person Households | - | 1,346 (39.6%) |
| 2-Person Households | 773 (22.7%) | 373 (11.0%) |
| 3-Person Households | 441 (13.0%) | 53 (1.6%) |
| 4-Person Households | 156 (4.6%) | 0 (0.0%) |
| 5-Person Households | 162 (4.8%) | 0 (0.0%) |
| 6-Person Households | 46 (1.3%) | 0 (0.0%) |
| 7+ Person Households | 49 (1.4%) | 0 (0.0%) |
| Total | 1,627 (47.9%) | 1,772 (52.1%) |
Female Fertility in Pittston
Fertility by Age in Pittston
Average fertility rate in Pittston is 33.0 births per 1,000 women. Women in the age bracket of 20 to 34 years have the highest fertility rate with 40.0 births per 1,000 women. Women in the age bracket of 20 to 34 years acount for 69.5% of all women with births.
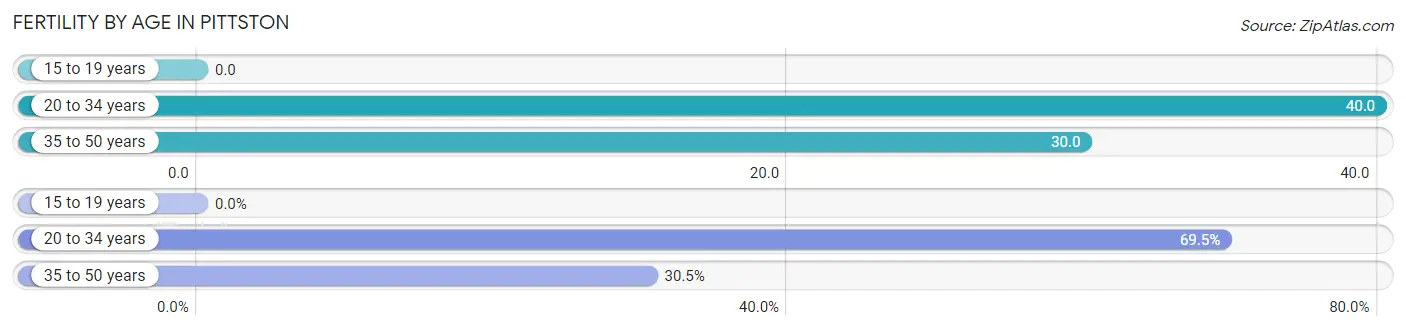
| Age Bracket | Women with Births | Births / 1,000 Women |
| 15 to 19 years | 0 (0.0%) | 0.0 |
| 20 to 34 years | 41 (69.5%) | 40.0 |
| 35 to 50 years | 18 (30.5%) | 30.0 |
| Total | 59 (100.0%) | 33.0 |
Fertility by Age by Marriage Status in Pittston
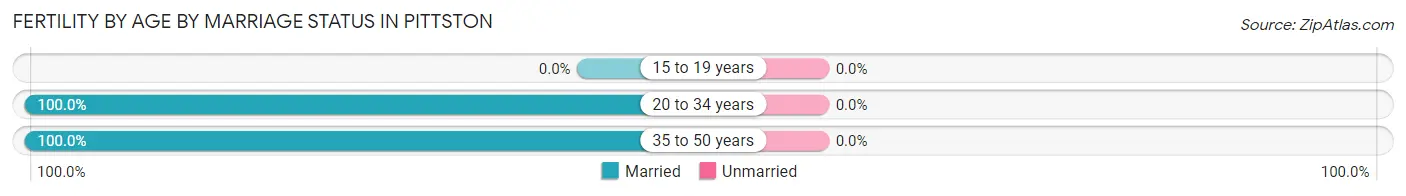
| Age Bracket | Married | Unmarried |
| 15 to 19 years | 0 (0.0%) | 0 (0.0%) |
| 20 to 34 years | 41 (100.0%) | 0 (0.0%) |
| 35 to 50 years | 18 (100.0%) | 0 (0.0%) |
| Total | 59 (100.0%) | 0 (0.0%) |
Fertility by Education in Pittston
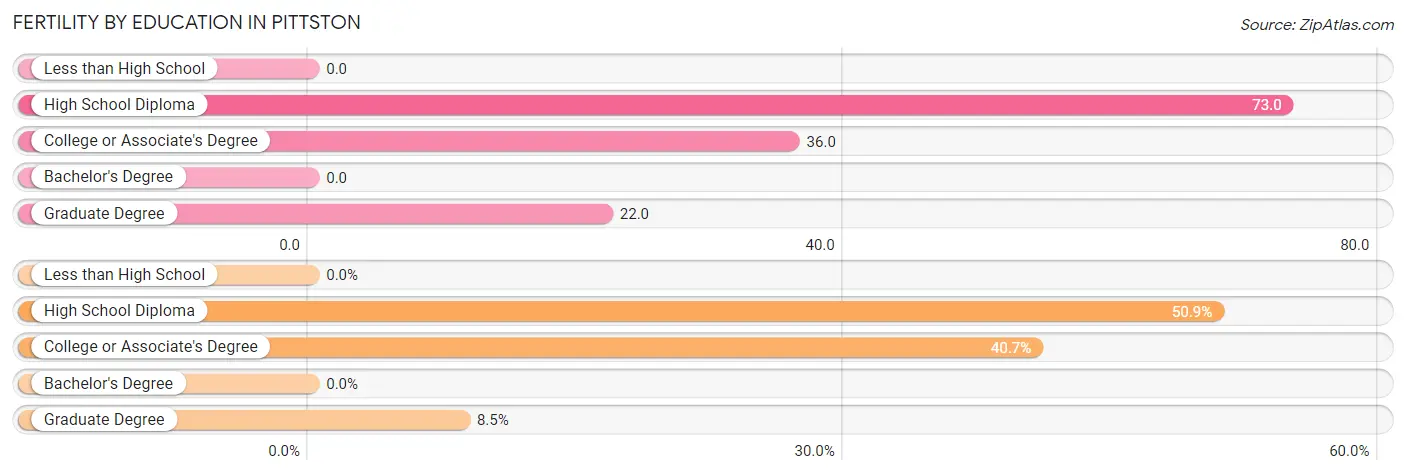
| Educational Attainment | Women with Births | Births / 1,000 Women |
| Less than High School | 0 (0.0%) | 0.0 |
| High School Diploma | 30 (50.8%) | 73.0 |
| College or Associate's Degree | 24 (40.7%) | 36.0 |
| Bachelor's Degree | 0 (0.0%) | 0.0 |
| Graduate Degree | 5 (8.5%) | 22.0 |
| Total | 59 (100.0%) | 33.0 |
Fertility by Education by Marriage Status in Pittston
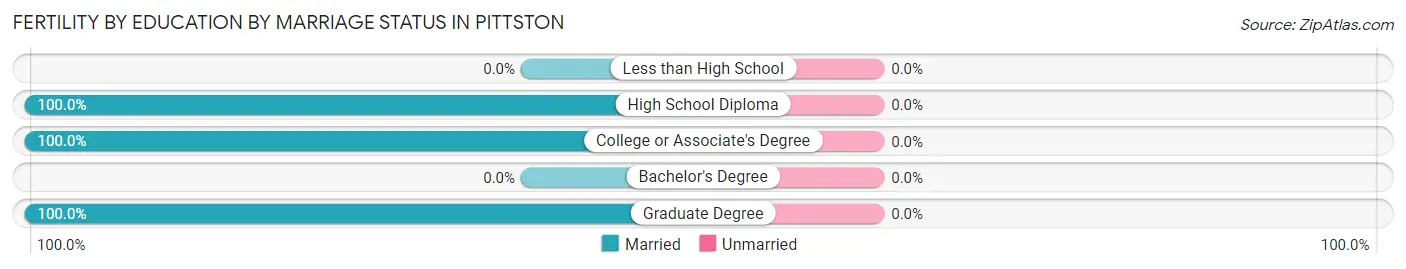
| Educational Attainment | Married | Unmarried |
| Less than High School | 0 (0.0%) | 0 (0.0%) |
| High School Diploma | 30 (100.0%) | 0 (0.0%) |
| College or Associate's Degree | 24 (100.0%) | 0 (0.0%) |
| Bachelor's Degree | 0 (0.0%) | 0 (0.0%) |
| Graduate Degree | 5 (100.0%) | 0 (0.0%) |
| Total | 59 (100.0%) | 0 (0.0%) |
Employment Characteristics in Pittston
Employment by Class of Employer in Pittston
Among the 3,332 employed individuals in Pittston, private company employees (2,437 | 73.1%), not-for-profit organizations (278 | 8.3%), and state government employees (256 | 7.7%) make up the most common classes of employment.
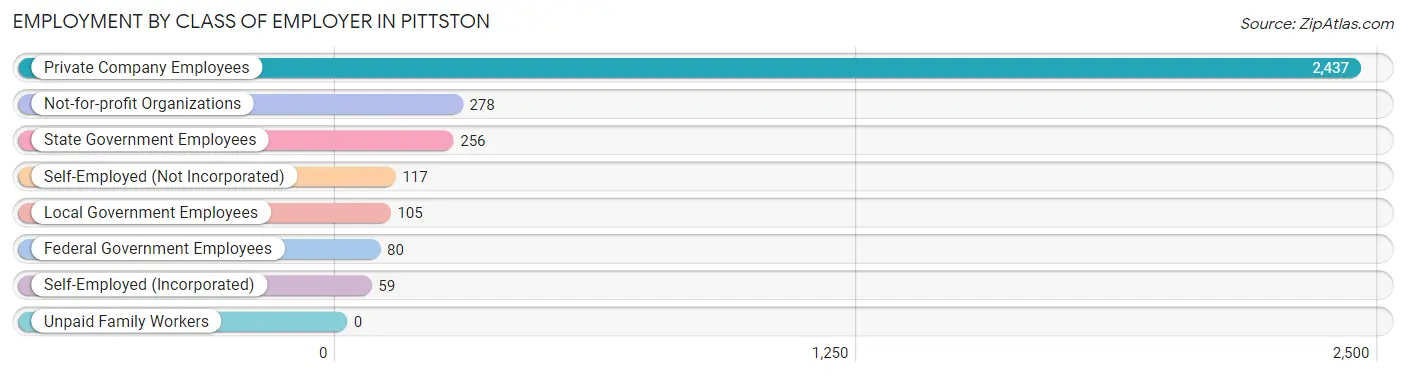
| Employer Class | # Employees | % Employees |
| Private Company Employees | 2,437 | 73.1% |
| Self-Employed (Incorporated) | 59 | 1.8% |
| Self-Employed (Not Incorporated) | 117 | 3.5% |
| Not-for-profit Organizations | 278 | 8.3% |
| Local Government Employees | 105 | 3.2% |
| State Government Employees | 256 | 7.7% |
| Federal Government Employees | 80 | 2.4% |
| Unpaid Family Workers | 0 | 0.0% |
| Total | 3,332 | 100.0% |
Employment Status by Age in Pittston
According to the labor force statistics for Pittston, out of the total population over 16 years of age (6,051), 61.5% or 3,721 individuals are in the labor force, with 6.8% or 253 of them unemployed. The age group with the highest labor force participation rate is 25 to 29 years, with 93.9% or 629 individuals in the labor force. Within the labor force, the 16 to 19 years age range has the highest percentage of unemployed individuals, with 36.8% or 64 of them being unemployed.
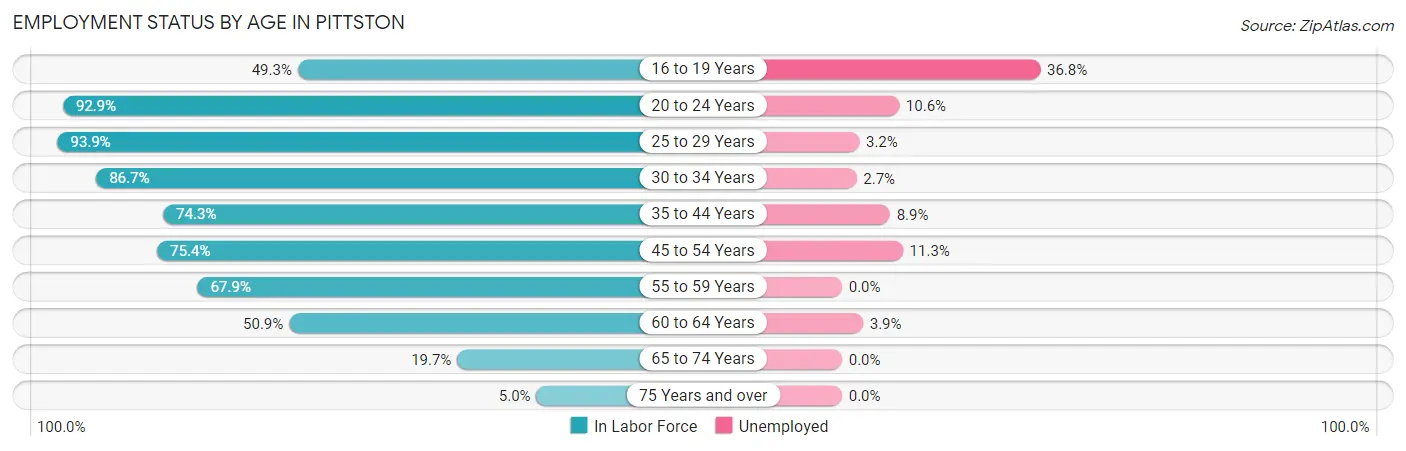
| Age Bracket | In Labor Force | Unemployed |
| 16 to 19 Years | 174 (49.3%) | 64 (36.8%) |
| 20 to 24 Years | 341 (92.9%) | 36 (10.6%) |
| 25 to 29 Years | 629 (93.9%) | 20 (3.2%) |
| 30 to 34 Years | 701 (86.7%) | 19 (2.7%) |
| 35 to 44 Years | 514 (74.3%) | 46 (8.9%) |
| 45 to 54 Years | 523 (75.4%) | 59 (11.3%) |
| 55 to 59 Years | 401 (67.9%) | 0 (0.0%) |
| 60 to 64 Years | 256 (50.9%) | 10 (3.9%) |
| 65 to 74 Years | 155 (19.7%) | 0 (0.0%) |
| 75 Years and over | 29 (5.0%) | 0 (0.0%) |
| Total | 3,721 (61.5%) | 253 (6.8%) |
Employment Status by Educational Attainment in Pittston
According to labor force statistics for Pittston, 76.4% of individuals (3,025) out of the total population between 25 and 64 years of age (3,959) are in the labor force, with 5.1% or 154 of them being unemployed. The group with the highest labor force participation rate are those with the educational attainment of bachelor's degree or higher, with 93.9% or 803 individuals in the labor force. Within the labor force, individuals with college / associate degree education have the highest percentage of unemployment, with 12.0% or 139 of them being unemployed.
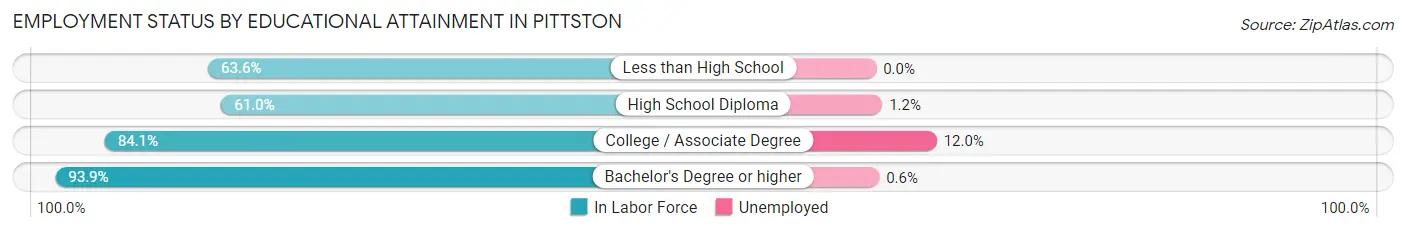
| Educational Attainment | In Labor Force | Unemployed |
| Less than High School | 222 (63.6%) | 0 (0.0%) |
| High School Diploma | 839 (61.0%) | 16 (1.2%) |
| College / Associate Degree | 1,161 (84.1%) | 166 (12.0%) |
| Bachelor's Degree or higher | 803 (93.9%) | 5 (0.6%) |
| Total | 3,025 (76.4%) | 202 (5.1%) |
Employment Occupations by Sex in Pittston
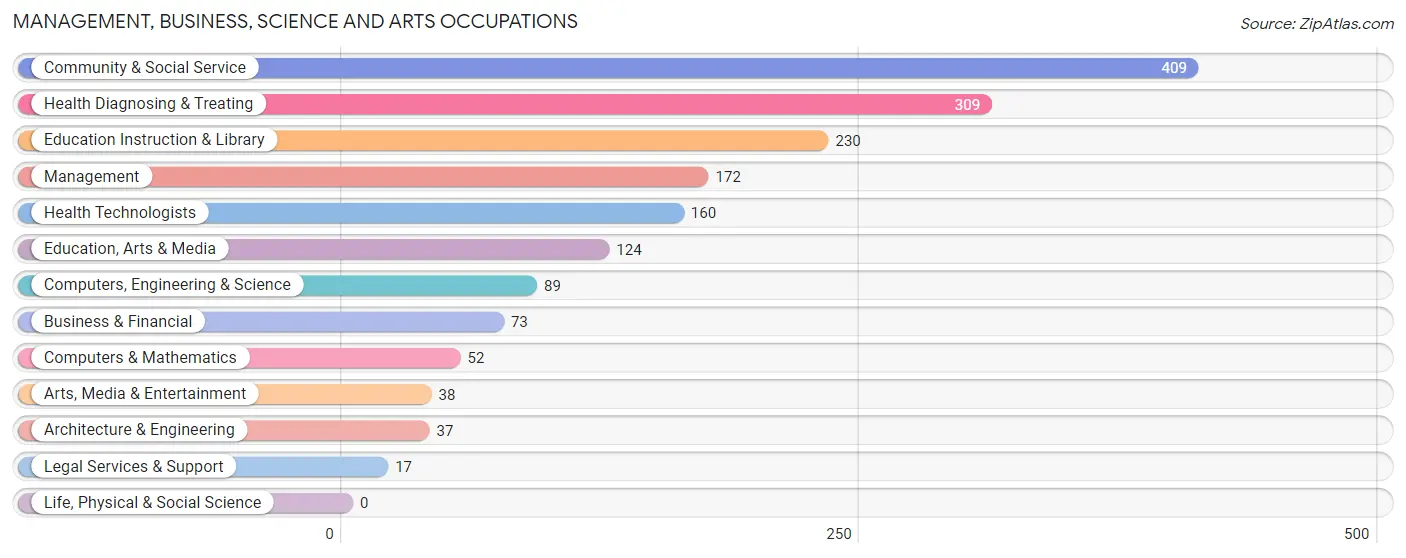
Management, Business, Science and Arts Occupations
The most common Management, Business, Science and Arts occupations in Pittston are Community & Social Service (409 | 11.8%), Health Diagnosing & Treating (309 | 8.9%), Education Instruction & Library (230 | 6.6%), Management (172 | 5.0%), and Health Technologists (160 | 4.6%).
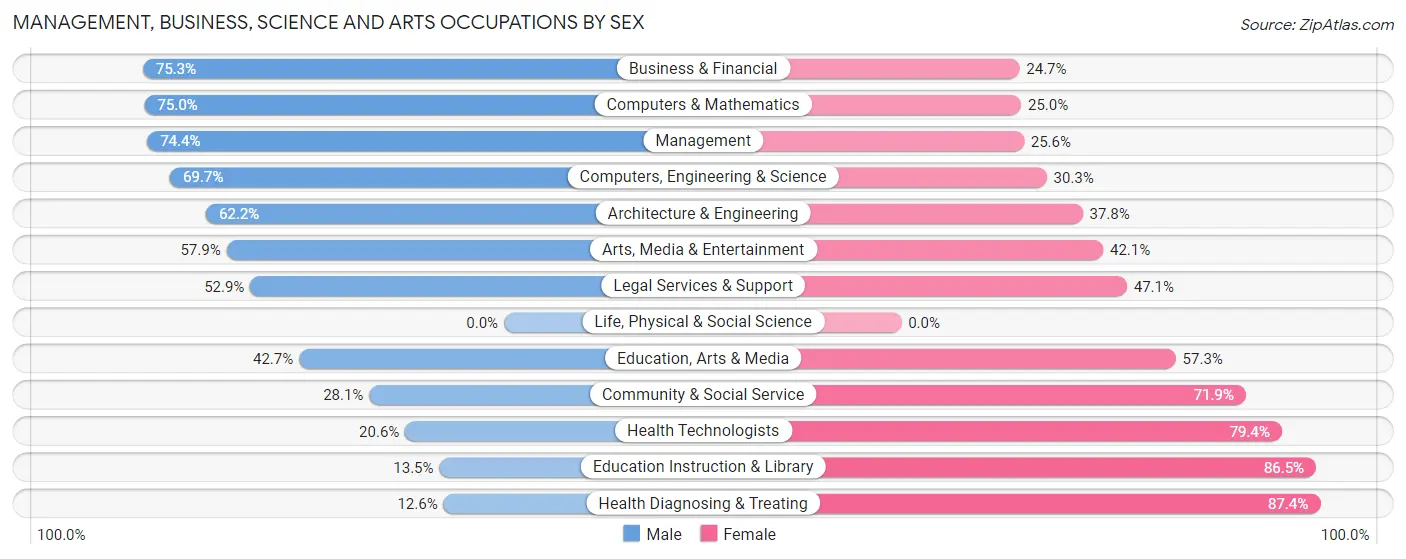
Management, Business, Science and Arts Occupations by Sex
Within the Management, Business, Science and Arts occupations in Pittston, the most male-oriented occupations are Business & Financial (75.3%), Computers & Mathematics (75.0%), and Management (74.4%), while the most female-oriented occupations are Health Diagnosing & Treating (87.4%), Education Instruction & Library (86.5%), and Health Technologists (79.4%).
| Occupation | Male | Female |
| Management | 128 (74.4%) | 44 (25.6%) |
| Business & Financial | 55 (75.3%) | 18 (24.7%) |
| Computers, Engineering & Science | 62 (69.7%) | 27 (30.3%) |
| Computers & Mathematics | 39 (75.0%) | 13 (25.0%) |
| Architecture & Engineering | 23 (62.2%) | 14 (37.8%) |
| Life, Physical & Social Science | 0 (0.0%) | 0 (0.0%) |
| Community & Social Service | 115 (28.1%) | 294 (71.9%) |
| Education, Arts & Media | 53 (42.7%) | 71 (57.3%) |
| Legal Services & Support | 9 (52.9%) | 8 (47.1%) |
| Education Instruction & Library | 31 (13.5%) | 199 (86.5%) |
| Arts, Media & Entertainment | 22 (57.9%) | 16 (42.1%) |
| Health Diagnosing & Treating | 39 (12.6%) | 270 (87.4%) |
| Health Technologists | 33 (20.6%) | 127 (79.4%) |
| Total (Category) | 399 (37.9%) | 653 (62.1%) |
| Total (Overall) | 1,748 (50.4%) | 1,721 (49.6%) |
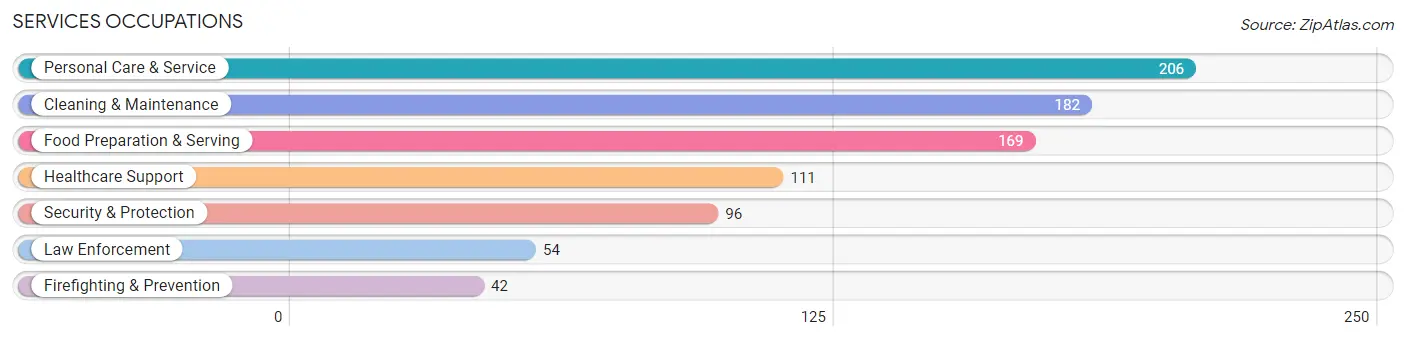
Services Occupations
The most common Services occupations in Pittston are Personal Care & Service (206 | 5.9%), Cleaning & Maintenance (182 | 5.2%), Food Preparation & Serving (169 | 4.9%), Healthcare Support (111 | 3.2%), and Security & Protection (96 | 2.8%).
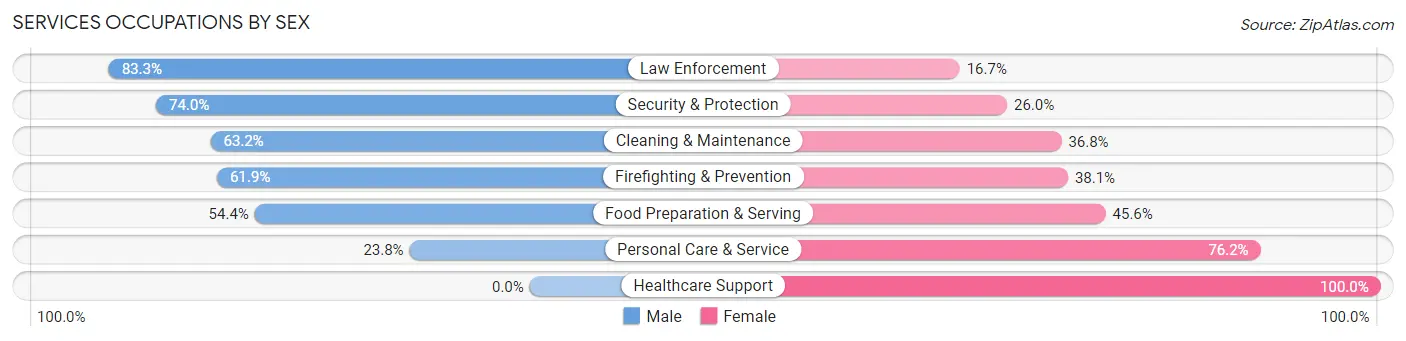
Services Occupations by Sex
Within the Services occupations in Pittston, the most male-oriented occupations are Law Enforcement (83.3%), Security & Protection (74.0%), and Cleaning & Maintenance (63.2%), while the most female-oriented occupations are Healthcare Support (100.0%), Personal Care & Service (76.2%), and Food Preparation & Serving (45.6%).
| Occupation | Male | Female |
| Healthcare Support | 0 (0.0%) | 111 (100.0%) |
| Security & Protection | 71 (74.0%) | 25 (26.0%) |
| Firefighting & Prevention | 26 (61.9%) | 16 (38.1%) |
| Law Enforcement | 45 (83.3%) | 9 (16.7%) |
| Food Preparation & Serving | 92 (54.4%) | 77 (45.6%) |
| Cleaning & Maintenance | 115 (63.2%) | 67 (36.8%) |
| Personal Care & Service | 49 (23.8%) | 157 (76.2%) |
| Total (Category) | 327 (42.8%) | 437 (57.2%) |
| Total (Overall) | 1,748 (50.4%) | 1,721 (49.6%) |
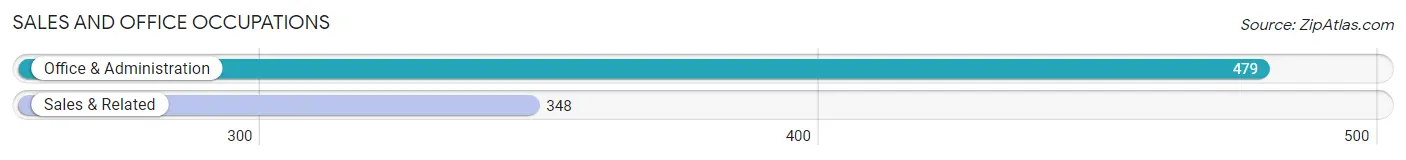
Sales and Office Occupations
The most common Sales and Office occupations in Pittston are Office & Administration (479 | 13.8%), and Sales & Related (348 | 10.0%).
Sales and Office Occupations by Sex
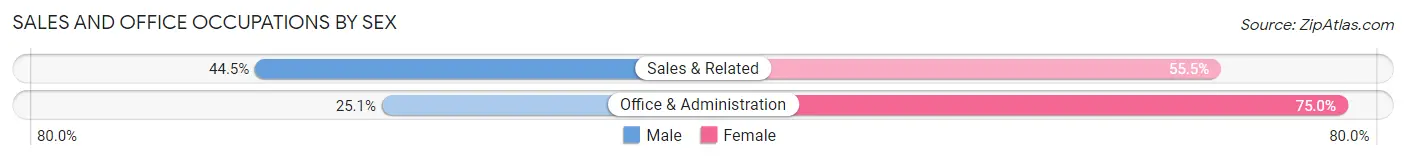
| Occupation | Male | Female |
| Sales & Related | 155 (44.5%) | 193 (55.5%) |
| Office & Administration | 120 (25.1%) | 359 (75.0%) |
| Total (Category) | 275 (33.3%) | 552 (66.7%) |
| Total (Overall) | 1,748 (50.4%) | 1,721 (49.6%) |
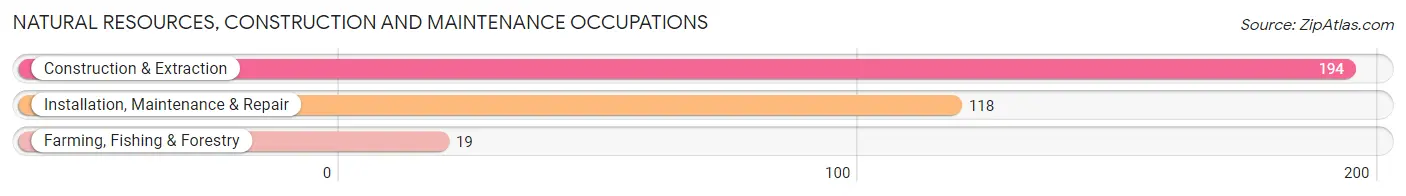
Natural Resources, Construction and Maintenance Occupations
The most common Natural Resources, Construction and Maintenance occupations in Pittston are Construction & Extraction (194 | 5.6%), Installation, Maintenance & Repair (118 | 3.4%), and Farming, Fishing & Forestry (19 | 0.5%).
Natural Resources, Construction and Maintenance Occupations by Sex
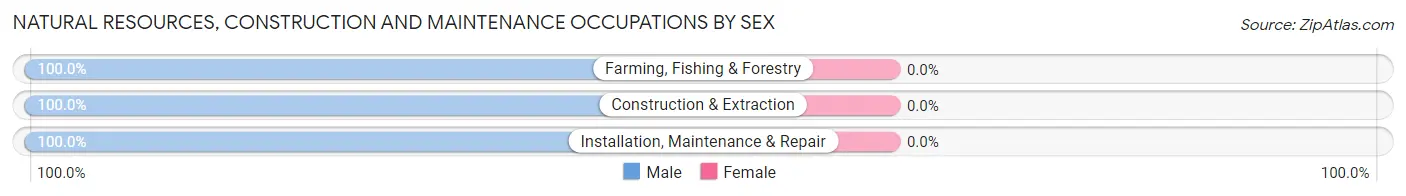
| Occupation | Male | Female |
| Farming, Fishing & Forestry | 19 (100.0%) | 0 (0.0%) |
| Construction & Extraction | 194 (100.0%) | 0 (0.0%) |
| Installation, Maintenance & Repair | 118 (100.0%) | 0 (0.0%) |
| Total (Category) | 331 (100.0%) | 0 (0.0%) |
| Total (Overall) | 1,748 (50.4%) | 1,721 (49.6%) |
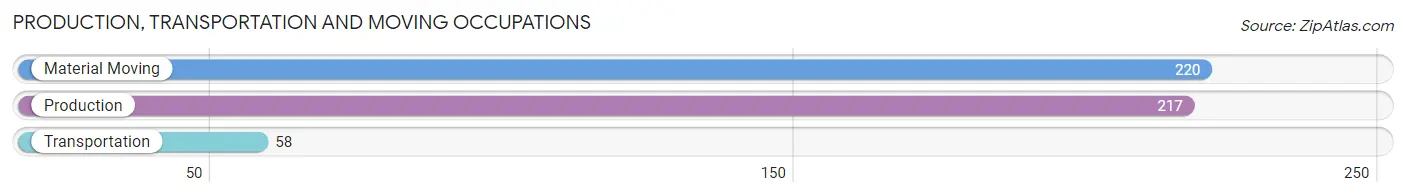
Production, Transportation and Moving Occupations
The most common Production, Transportation and Moving occupations in Pittston are Material Moving (220 | 6.3%), Production (217 | 6.3%), and Transportation (58 | 1.7%).
Production, Transportation and Moving Occupations by Sex
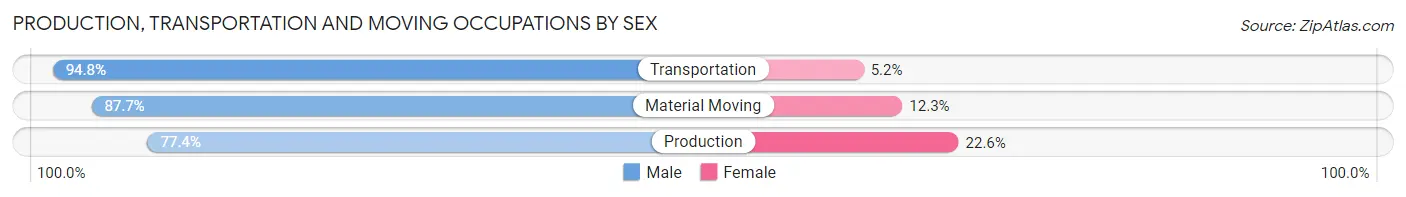
| Occupation | Male | Female |
| Production | 168 (77.4%) | 49 (22.6%) |
| Transportation | 55 (94.8%) | 3 (5.2%) |
| Material Moving | 193 (87.7%) | 27 (12.3%) |
| Total (Category) | 416 (84.0%) | 79 (16.0%) |
| Total (Overall) | 1,748 (50.4%) | 1,721 (49.6%) |
Employment Industries by Sex in Pittston
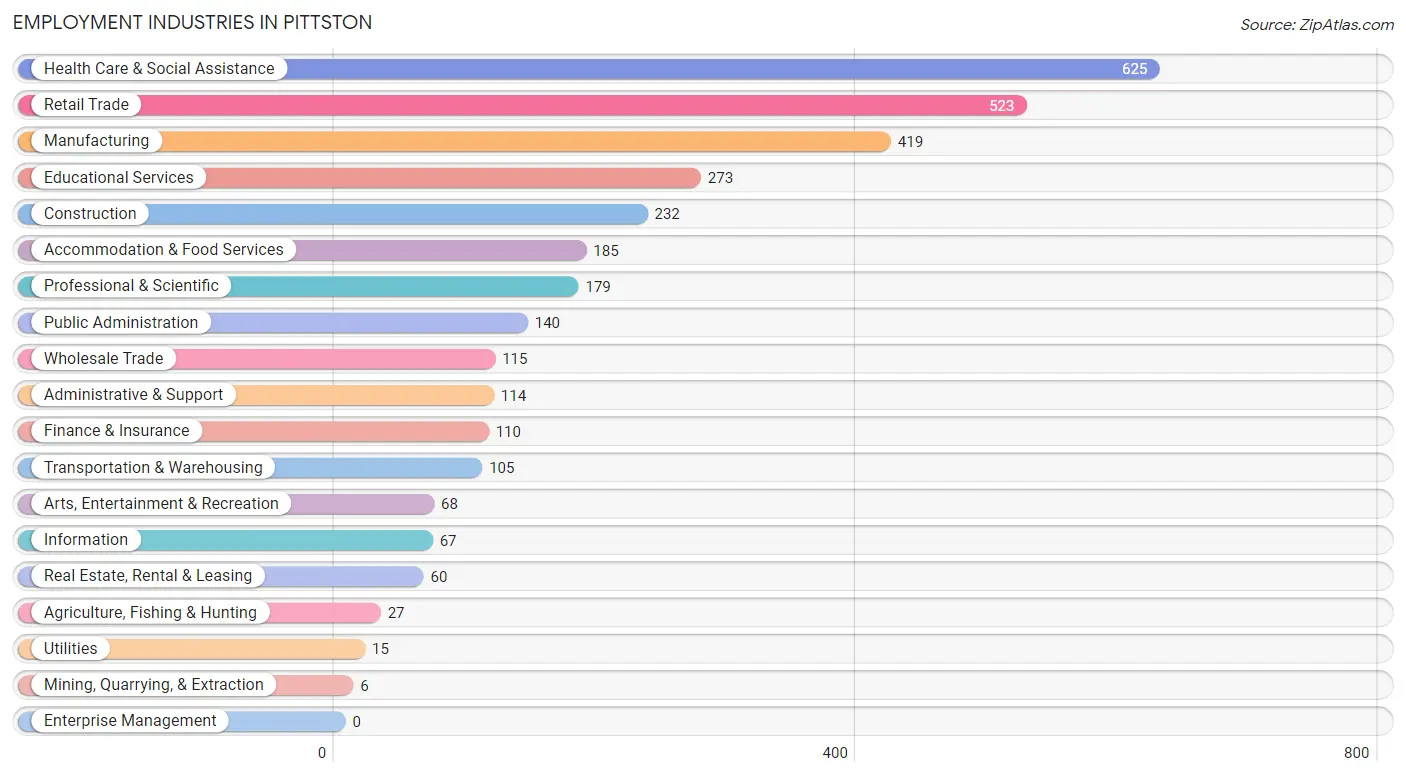
Employment Industries in Pittston
The major employment industries in Pittston include Health Care & Social Assistance (625 | 18.0%), Retail Trade (523 | 15.1%), Manufacturing (419 | 12.1%), Educational Services (273 | 7.9%), and Construction (232 | 6.7%).
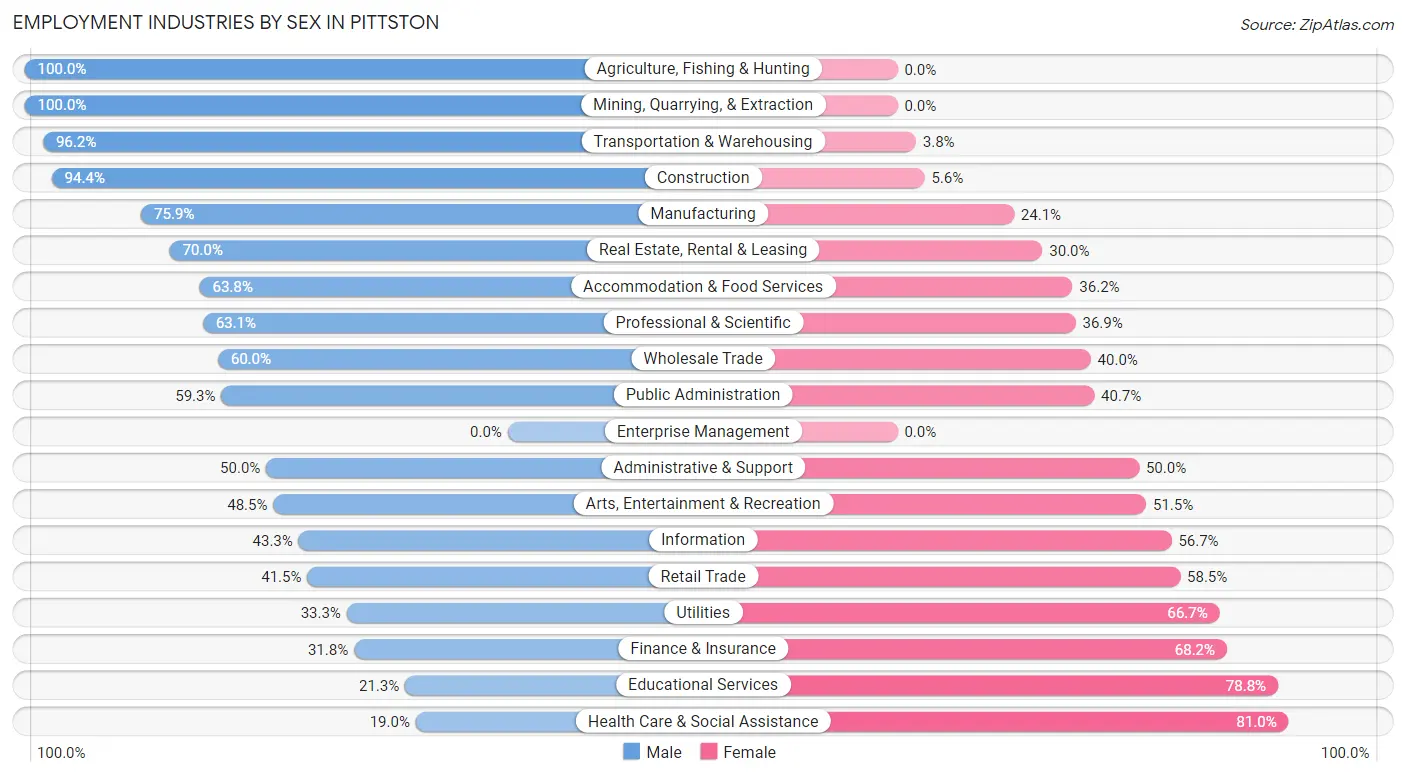
Employment Industries by Sex in Pittston
The Pittston industries that see more men than women are Agriculture, Fishing & Hunting (100.0%), Mining, Quarrying, & Extraction (100.0%), and Transportation & Warehousing (96.2%), whereas the industries that tend to have a higher number of women are Health Care & Social Assistance (81.0%), Educational Services (78.7%), and Finance & Insurance (68.2%).
| Industry | Male | Female |
| Agriculture, Fishing & Hunting | 27 (100.0%) | 0 (0.0%) |
| Mining, Quarrying, & Extraction | 6 (100.0%) | 0 (0.0%) |
| Construction | 219 (94.4%) | 13 (5.6%) |
| Manufacturing | 318 (75.9%) | 101 (24.1%) |
| Wholesale Trade | 69 (60.0%) | 46 (40.0%) |
| Retail Trade | 217 (41.5%) | 306 (58.5%) |
| Transportation & Warehousing | 101 (96.2%) | 4 (3.8%) |
| Utilities | 5 (33.3%) | 10 (66.7%) |
| Information | 29 (43.3%) | 38 (56.7%) |
| Finance & Insurance | 35 (31.8%) | 75 (68.2%) |
| Real Estate, Rental & Leasing | 42 (70.0%) | 18 (30.0%) |
| Professional & Scientific | 113 (63.1%) | 66 (36.9%) |
| Enterprise Management | 0 (0.0%) | 0 (0.0%) |
| Administrative & Support | 57 (50.0%) | 57 (50.0%) |
| Educational Services | 58 (21.2%) | 215 (78.7%) |
| Health Care & Social Assistance | 119 (19.0%) | 506 (81.0%) |
| Arts, Entertainment & Recreation | 33 (48.5%) | 35 (51.5%) |
| Accommodation & Food Services | 118 (63.8%) | 67 (36.2%) |
| Public Administration | 83 (59.3%) | 57 (40.7%) |
| Total | 1,748 (50.4%) | 1,721 (49.6%) |
Education in Pittston
School Enrollment in Pittston
The most common levels of schooling among the 1,766 students in Pittston are elementary school (503 | 28.5%), high school (344 | 19.5%), and college / undergraduate (282 | 16.0%).
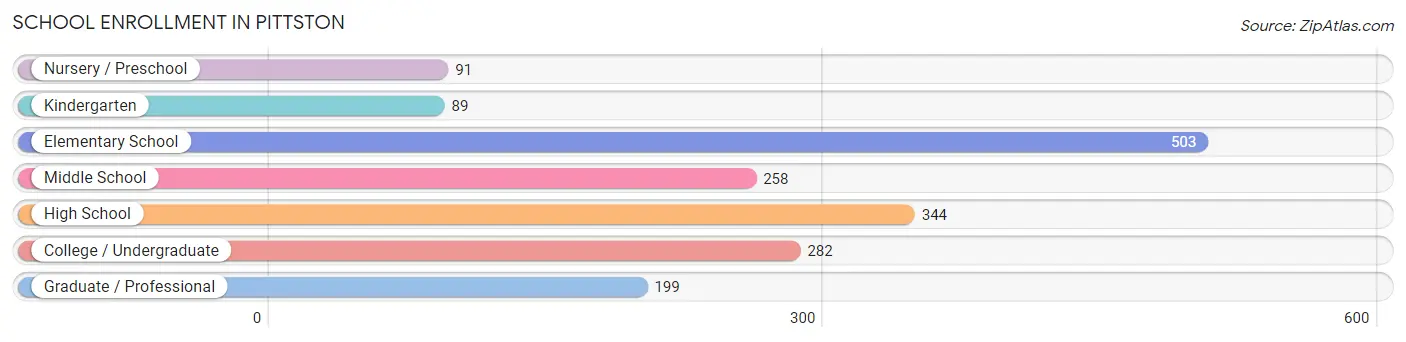
| School Level | # Students | % Students |
| Nursery / Preschool | 91 | 5.1% |
| Kindergarten | 89 | 5.0% |
| Elementary School | 503 | 28.5% |
| Middle School | 258 | 14.6% |
| High School | 344 | 19.5% |
| College / Undergraduate | 282 | 16.0% |
| Graduate / Professional | 199 | 11.3% |
| Total | 1,766 | 100.0% |
School Enrollment by Age by Funding Source in Pittston
Out of a total of 1,766 students who are enrolled in schools in Pittston, 228 (12.9%) attend a private institution, while the remaining 1,538 (87.1%) are enrolled in public schools. The age group of 35 years and over has the highest likelihood of being enrolled in private schools, with 7 (58.3% in the age bracket) enrolled. Conversely, the age group of 3 to 4 year olds has the lowest likelihood of being enrolled in a private school, with 43 (100.0% in the age bracket) attending a public institution.
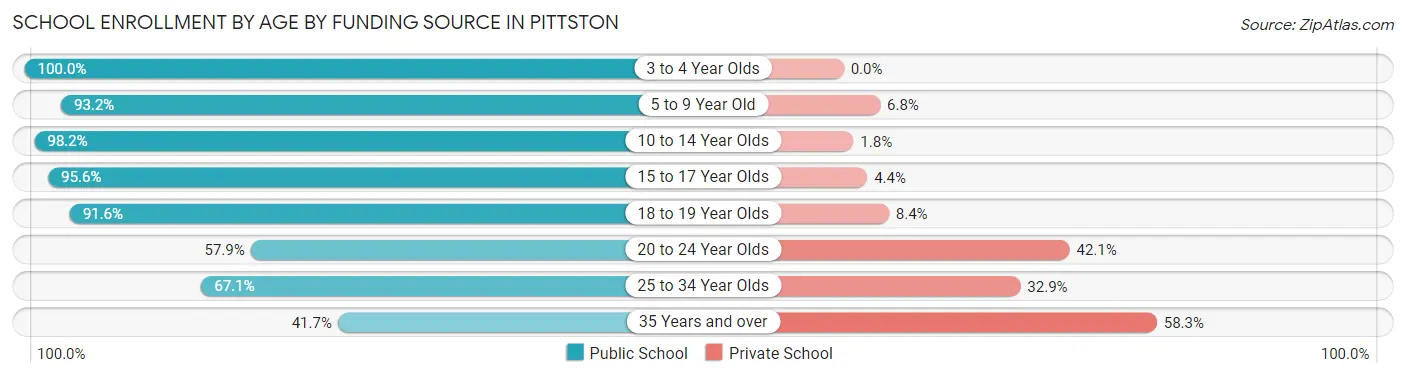
| Age Bracket | Public School | Private School |
| 3 to 4 Year Olds | 43 (100.0%) | 0 (0.0%) |
| 5 to 9 Year Old | 550 (93.2%) | 40 (6.8%) |
| 10 to 14 Year Olds | 379 (98.2%) | 7 (1.8%) |
| 15 to 17 Year Olds | 196 (95.6%) | 9 (4.4%) |
| 18 to 19 Year Olds | 98 (91.6%) | 9 (8.4%) |
| 20 to 24 Year Olds | 106 (57.9%) | 77 (42.1%) |
| 25 to 34 Year Olds | 161 (67.1%) | 79 (32.9%) |
| 35 Years and over | 5 (41.7%) | 7 (58.3%) |
| Total | 1,538 (87.1%) | 228 (12.9%) |
Educational Attainment by Field of Study in Pittston
Business (240 | 21.2%), education (219 | 19.3%), science & technology (198 | 17.5%), engineering (108 | 9.5%), and arts & humanities (91 | 8.0%) are the most common fields of study among 1,134 individuals in Pittston who have obtained a bachelor's degree or higher.
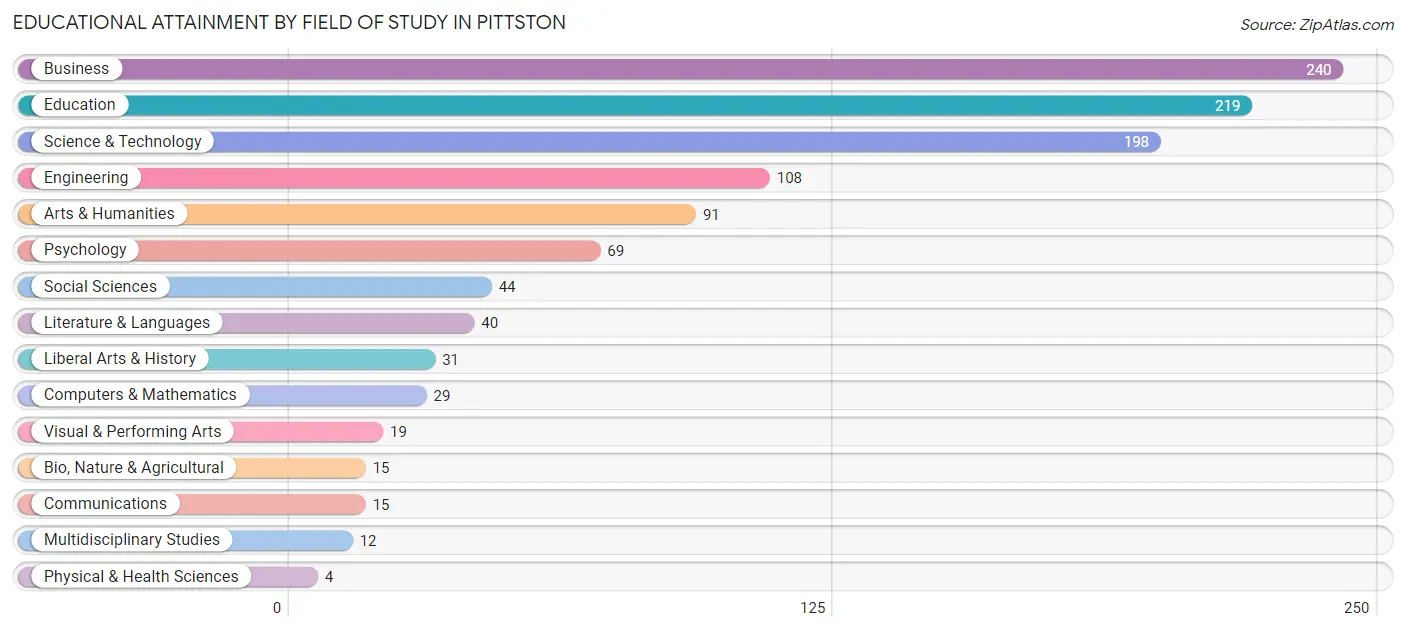
| Field of Study | # Graduates | % Graduates |
| Computers & Mathematics | 29 | 2.6% |
| Bio, Nature & Agricultural | 15 | 1.3% |
| Physical & Health Sciences | 4 | 0.4% |
| Psychology | 69 | 6.1% |
| Social Sciences | 44 | 3.9% |
| Engineering | 108 | 9.5% |
| Multidisciplinary Studies | 12 | 1.1% |
| Science & Technology | 198 | 17.5% |
| Business | 240 | 21.2% |
| Education | 219 | 19.3% |
| Literature & Languages | 40 | 3.5% |
| Liberal Arts & History | 31 | 2.7% |
| Visual & Performing Arts | 19 | 1.7% |
| Communications | 15 | 1.3% |
| Arts & Humanities | 91 | 8.0% |
| Total | 1,134 | 100.0% |
Transportation & Commute in Pittston
Vehicle Availability by Sex in Pittston
The most prevalent vehicle ownership categories in Pittston are males with 2 vehicles (570, accounting for 34.1%) and females with 2 vehicles (491, making up 34.5%).
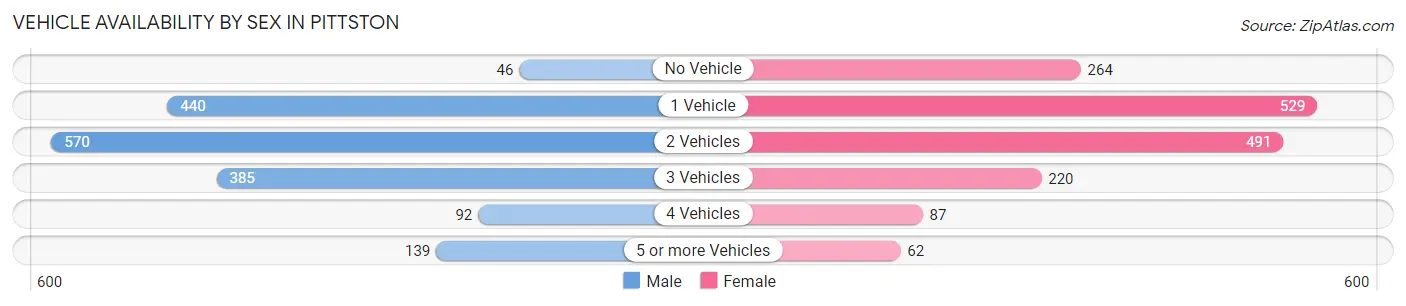
| Vehicles Available | Male | Female |
| No Vehicle | 46 (2.8%) | 264 (16.0%) |
| 1 Vehicle | 440 (26.3%) | 529 (32.0%) |
| 2 Vehicles | 570 (34.1%) | 491 (29.7%) |
| 3 Vehicles | 385 (23.0%) | 220 (13.3%) |
| 4 Vehicles | 92 (5.5%) | 87 (5.3%) |
| 5 or more Vehicles | 139 (8.3%) | 62 (3.7%) |
| Total | 1,672 (100.0%) | 1,653 (100.0%) |
Commute Time in Pittston
The most frequently occuring commute durations in Pittston are 10 to 14 minutes (554 commuters, 17.7%), 20 to 24 minutes (529 commuters, 16.9%), and 15 to 19 minutes (495 commuters, 15.8%).
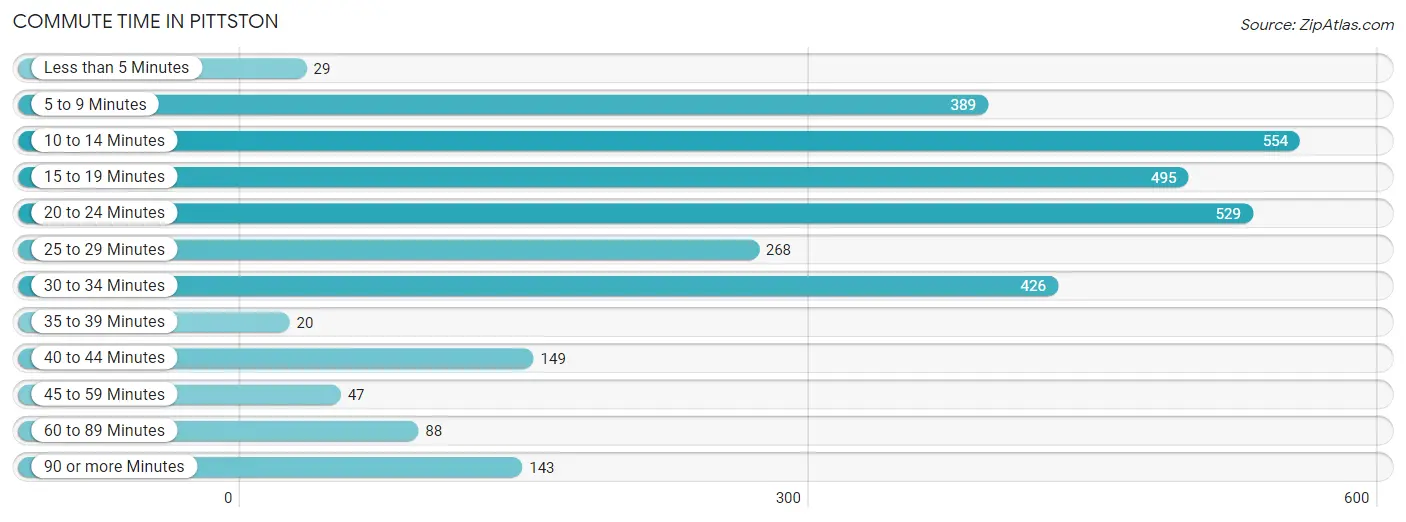
| Commute Time | # Commuters | % Commuters |
| Less than 5 Minutes | 29 | 0.9% |
| 5 to 9 Minutes | 389 | 12.4% |
| 10 to 14 Minutes | 554 | 17.7% |
| 15 to 19 Minutes | 495 | 15.8% |
| 20 to 24 Minutes | 529 | 16.9% |
| 25 to 29 Minutes | 268 | 8.5% |
| 30 to 34 Minutes | 426 | 13.6% |
| 35 to 39 Minutes | 20 | 0.6% |
| 40 to 44 Minutes | 149 | 4.8% |
| 45 to 59 Minutes | 47 | 1.5% |
| 60 to 89 Minutes | 88 | 2.8% |
| 90 or more Minutes | 143 | 4.6% |
Commute Time by Sex in Pittston
The most common commute times in Pittston are 10 to 14 minutes (241 commuters, 15.7%) for males and 20 to 24 minutes (346 commuters, 21.6%) for females.
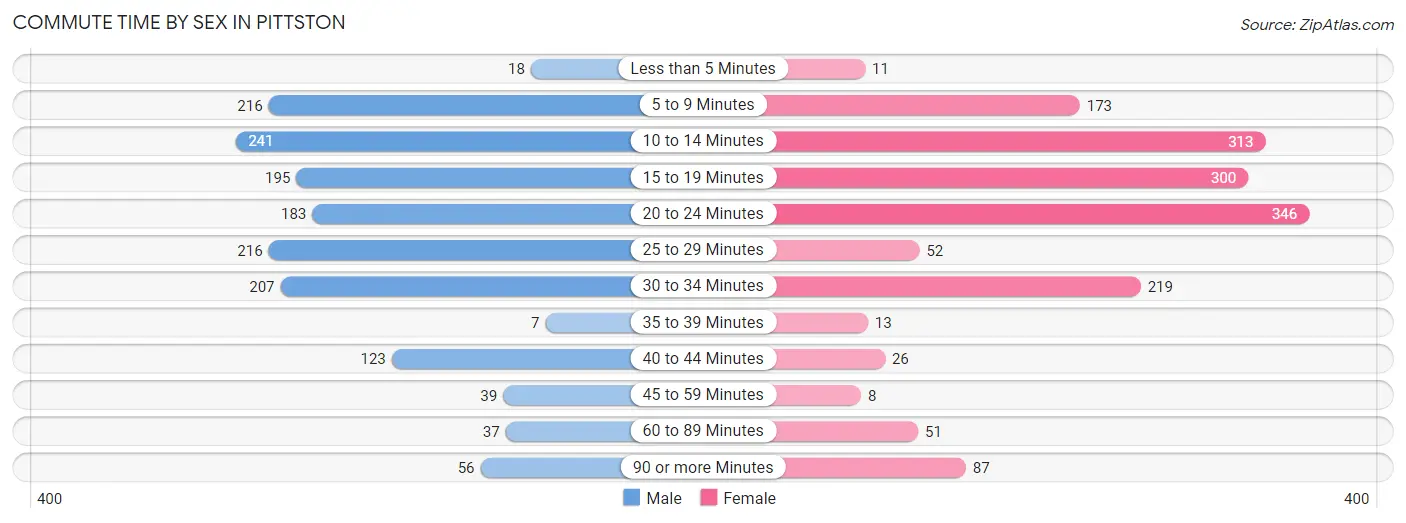
| Commute Time | Male | Female |
| Less than 5 Minutes | 18 (1.2%) | 11 (0.7%) |
| 5 to 9 Minutes | 216 (14.0%) | 173 (10.8%) |
| 10 to 14 Minutes | 241 (15.7%) | 313 (19.6%) |
| 15 to 19 Minutes | 195 (12.7%) | 300 (18.8%) |
| 20 to 24 Minutes | 183 (11.9%) | 346 (21.6%) |
| 25 to 29 Minutes | 216 (14.0%) | 52 (3.3%) |
| 30 to 34 Minutes | 207 (13.5%) | 219 (13.7%) |
| 35 to 39 Minutes | 7 (0.5%) | 13 (0.8%) |
| 40 to 44 Minutes | 123 (8.0%) | 26 (1.6%) |
| 45 to 59 Minutes | 39 (2.5%) | 8 (0.5%) |
| 60 to 89 Minutes | 37 (2.4%) | 51 (3.2%) |
| 90 or more Minutes | 56 (3.6%) | 87 (5.4%) |
Time of Departure to Work by Sex in Pittston
The most frequent times of departure to work in Pittston are 7:30 AM to 7:59 AM (217, 14.1%) for males and 6:30 AM to 6:59 AM (243, 15.2%) for females.
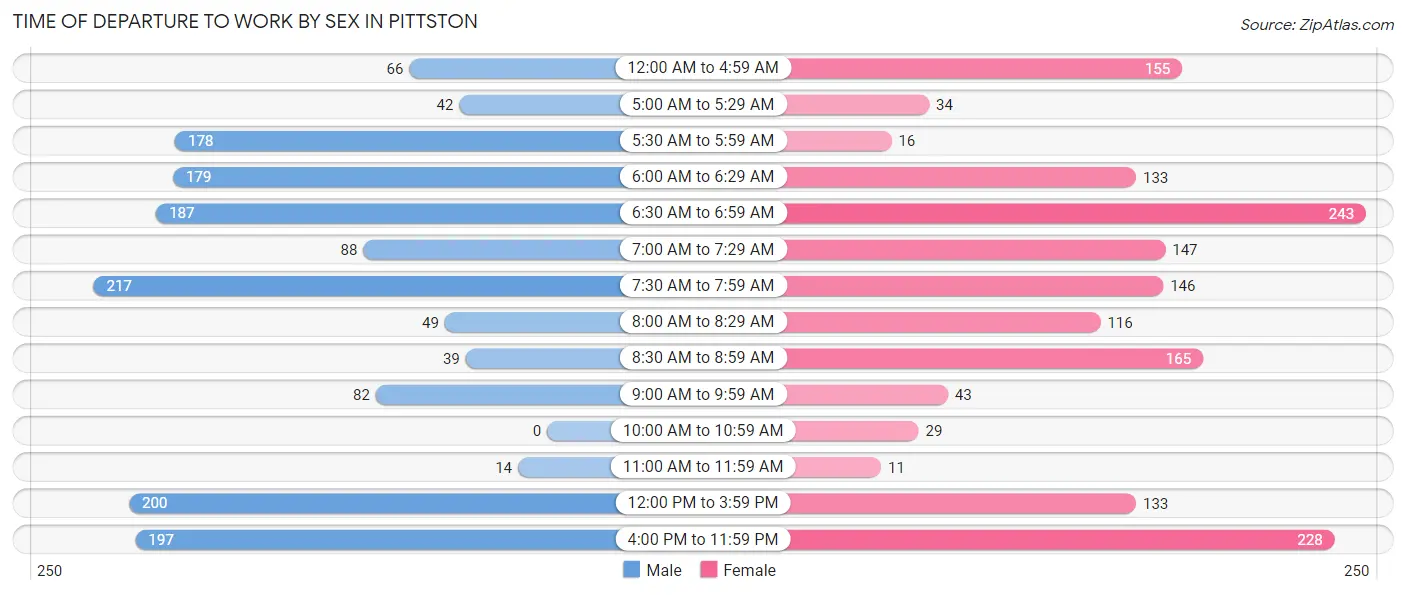
| Time of Departure | Male | Female |
| 12:00 AM to 4:59 AM | 66 (4.3%) | 155 (9.7%) |
| 5:00 AM to 5:29 AM | 42 (2.7%) | 34 (2.1%) |
| 5:30 AM to 5:59 AM | 178 (11.6%) | 16 (1.0%) |
| 6:00 AM to 6:29 AM | 179 (11.6%) | 133 (8.3%) |
| 6:30 AM to 6:59 AM | 187 (12.2%) | 243 (15.2%) |
| 7:00 AM to 7:29 AM | 88 (5.7%) | 147 (9.2%) |
| 7:30 AM to 7:59 AM | 217 (14.1%) | 146 (9.1%) |
| 8:00 AM to 8:29 AM | 49 (3.2%) | 116 (7.2%) |
| 8:30 AM to 8:59 AM | 39 (2.5%) | 165 (10.3%) |
| 9:00 AM to 9:59 AM | 82 (5.3%) | 43 (2.7%) |
| 10:00 AM to 10:59 AM | 0 (0.0%) | 29 (1.8%) |
| 11:00 AM to 11:59 AM | 14 (0.9%) | 11 (0.7%) |
| 12:00 PM to 3:59 PM | 200 (13.0%) | 133 (8.3%) |
| 4:00 PM to 11:59 PM | 197 (12.8%) | 228 (14.3%) |
| Total | 1,538 (100.0%) | 1,599 (100.0%) |
Housing Occupancy in Pittston
Occupancy by Ownership in Pittston
Of the total 3,399 dwellings in Pittston, owner-occupied units account for 1,662 (48.9%), while renter-occupied units make up 1,737 (51.1%).
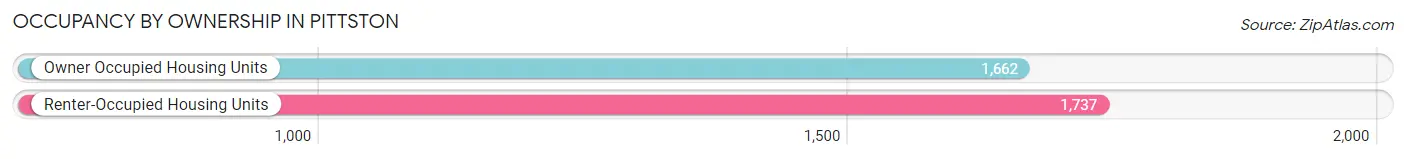
| Occupancy | # Housing Units | % Housing Units |
| Owner Occupied Housing Units | 1,662 | 48.9% |
| Renter-Occupied Housing Units | 1,737 | 51.1% |
| Total Occupied Housing Units | 3,399 | 100.0% |
Occupancy by Household Size in Pittston
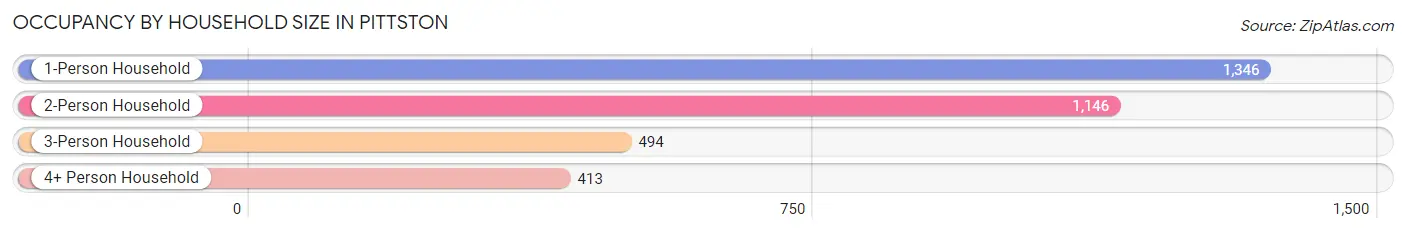
| Household Size | # Housing Units | % Housing Units |
| 1-Person Household | 1,346 | 39.6% |
| 2-Person Household | 1,146 | 33.7% |
| 3-Person Household | 494 | 14.5% |
| 4+ Person Household | 413 | 12.1% |
| Total Housing Units | 3,399 | 100.0% |
Occupancy by Ownership by Household Size in Pittston
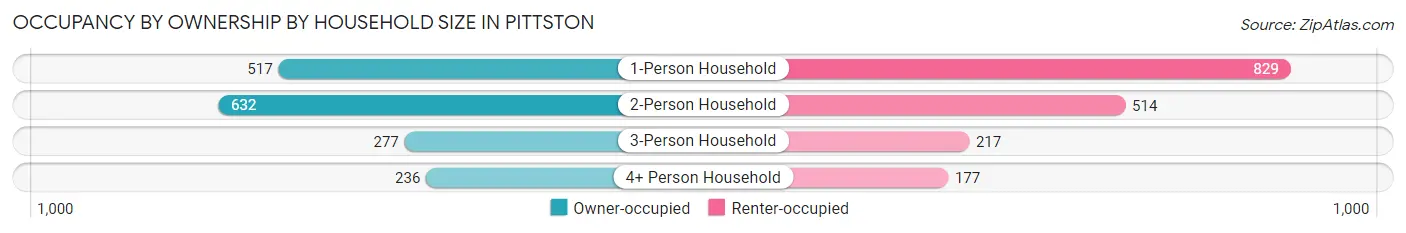
| Household Size | Owner-occupied | Renter-occupied |
| 1-Person Household | 517 (38.4%) | 829 (61.6%) |
| 2-Person Household | 632 (55.1%) | 514 (44.9%) |
| 3-Person Household | 277 (56.1%) | 217 (43.9%) |
| 4+ Person Household | 236 (57.1%) | 177 (42.9%) |
| Total Housing Units | 1,662 (48.9%) | 1,737 (51.1%) |
Occupancy by Educational Attainment in Pittston
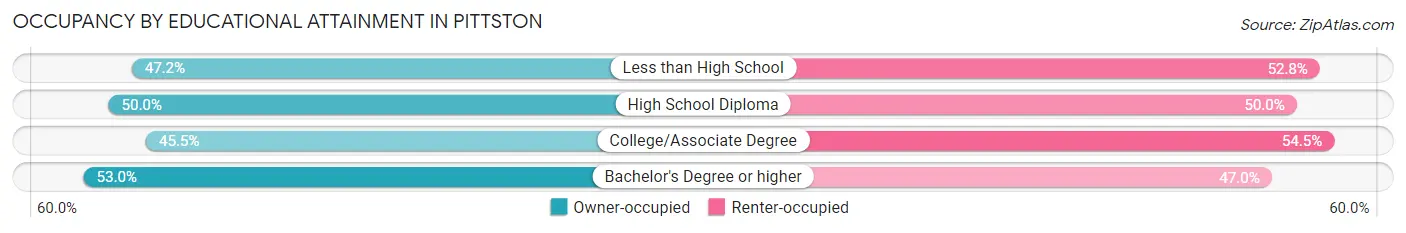
| Household Size | Owner-occupied | Renter-occupied |
| Less than High School | 94 (47.2%) | 105 (52.8%) |
| High School Diploma | 652 (50.0%) | 652 (50.0%) |
| College/Associate Degree | 541 (45.5%) | 647 (54.5%) |
| Bachelor's Degree or higher | 375 (53.0%) | 333 (47.0%) |
Occupancy by Age of Householder in Pittston
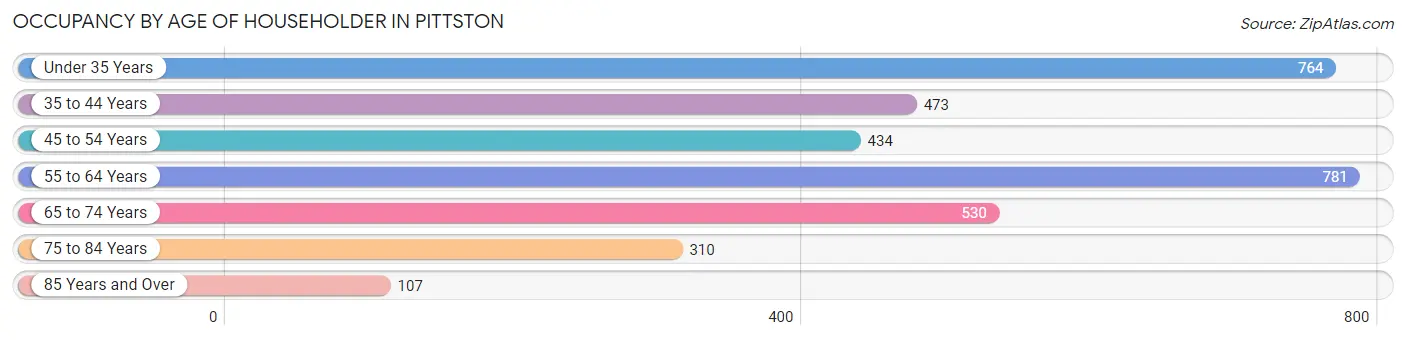
| Age Bracket | # Households | % Households |
| Under 35 Years | 764 | 22.5% |
| 35 to 44 Years | 473 | 13.9% |
| 45 to 54 Years | 434 | 12.8% |
| 55 to 64 Years | 781 | 23.0% |
| 65 to 74 Years | 530 | 15.6% |
| 75 to 84 Years | 310 | 9.1% |
| 85 Years and Over | 107 | 3.2% |
| Total | 3,399 | 100.0% |
Housing Finances in Pittston
Median Income by Occupancy in Pittston
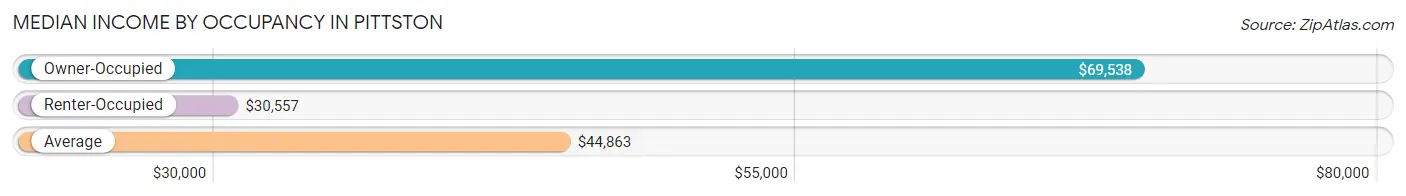
| Occupancy Type | # Households | Median Income |
| Owner-Occupied | 1,662 (48.9%) | $69,538 |
| Renter-Occupied | 1,737 (51.1%) | $30,557 |
| Average | 3,399 (100.0%) | $44,863 |
Occupancy by Householder Income Bracket in Pittston
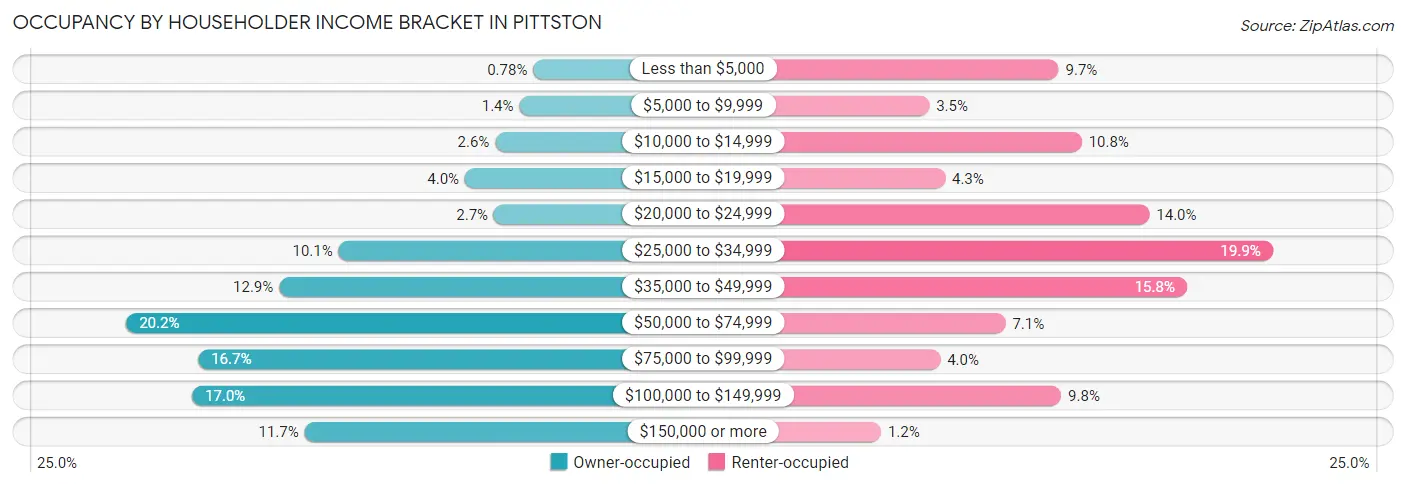
| Income Bracket | Owner-occupied | Renter-occupied |
| Less than $5,000 | 13 (0.8%) | 168 (9.7%) |
| $5,000 to $9,999 | 24 (1.4%) | 61 (3.5%) |
| $10,000 to $14,999 | 43 (2.6%) | 187 (10.8%) |
| $15,000 to $19,999 | 67 (4.0%) | 74 (4.3%) |
| $20,000 to $24,999 | 44 (2.6%) | 243 (14.0%) |
| $25,000 to $34,999 | 167 (10.1%) | 345 (19.9%) |
| $35,000 to $49,999 | 214 (12.9%) | 274 (15.8%) |
| $50,000 to $74,999 | 335 (20.2%) | 124 (7.1%) |
| $75,000 to $99,999 | 278 (16.7%) | 70 (4.0%) |
| $100,000 to $149,999 | 283 (17.0%) | 170 (9.8%) |
| $150,000 or more | 194 (11.7%) | 21 (1.2%) |
| Total | 1,662 (100.0%) | 1,737 (100.0%) |
Monthly Housing Cost Tiers in Pittston
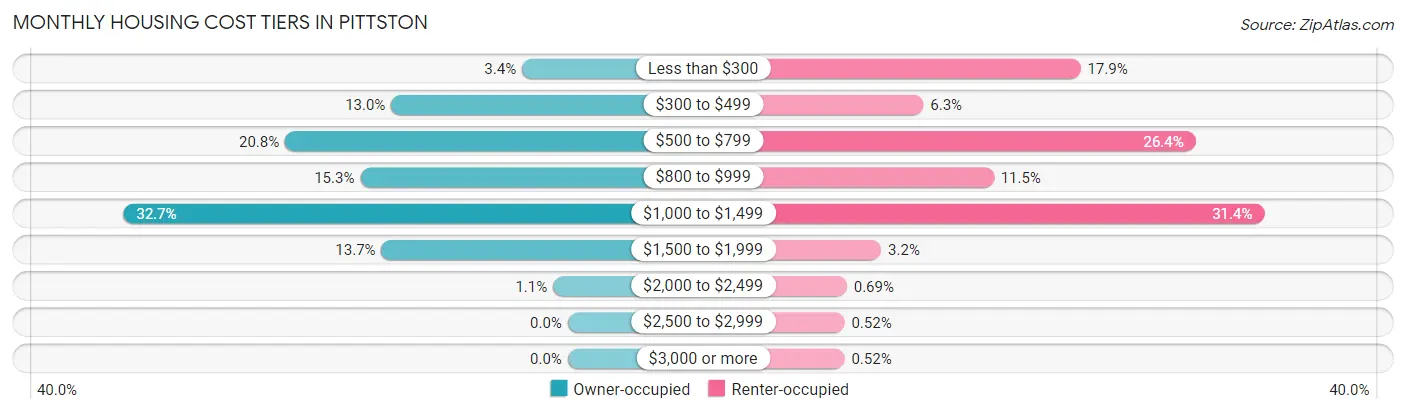
| Monthly Cost | Owner-occupied | Renter-occupied |
| Less than $300 | 56 (3.4%) | 311 (17.9%) |
| $300 to $499 | 216 (13.0%) | 110 (6.3%) |
| $500 to $799 | 346 (20.8%) | 458 (26.4%) |
| $800 to $999 | 254 (15.3%) | 200 (11.5%) |
| $1,000 to $1,499 | 544 (32.7%) | 546 (31.4%) |
| $1,500 to $1,999 | 228 (13.7%) | 56 (3.2%) |
| $2,000 to $2,499 | 18 (1.1%) | 12 (0.7%) |
| $2,500 to $2,999 | 0 (0.0%) | 9 (0.5%) |
| $3,000 or more | 0 (0.0%) | 9 (0.5%) |
| Total | 1,662 (100.0%) | 1,737 (100.0%) |
Physical Housing Characteristics in Pittston
Housing Structures in Pittston
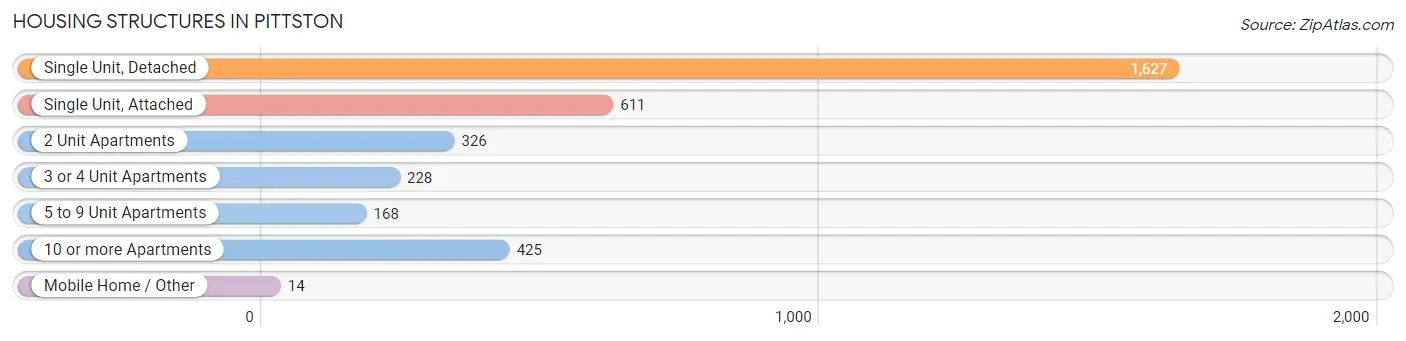
| Structure Type | # Housing Units | % Housing Units |
| Single Unit, Detached | 1,627 | 47.9% |
| Single Unit, Attached | 611 | 18.0% |
| 2 Unit Apartments | 326 | 9.6% |
| 3 or 4 Unit Apartments | 228 | 6.7% |
| 5 to 9 Unit Apartments | 168 | 4.9% |
| 10 or more Apartments | 425 | 12.5% |
| Mobile Home / Other | 14 | 0.4% |
| Total | 3,399 | 100.0% |
Housing Structures by Occupancy in Pittston
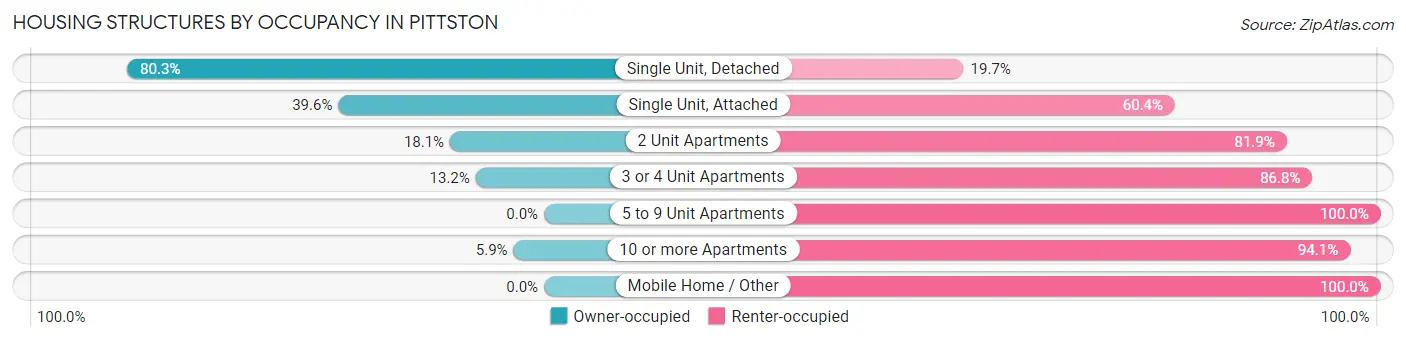
| Structure Type | Owner-occupied | Renter-occupied |
| Single Unit, Detached | 1,306 (80.3%) | 321 (19.7%) |
| Single Unit, Attached | 242 (39.6%) | 369 (60.4%) |
| 2 Unit Apartments | 59 (18.1%) | 267 (81.9%) |
| 3 or 4 Unit Apartments | 30 (13.2%) | 198 (86.8%) |
| 5 to 9 Unit Apartments | 0 (0.0%) | 168 (100.0%) |
| 10 or more Apartments | 25 (5.9%) | 400 (94.1%) |
| Mobile Home / Other | 0 (0.0%) | 14 (100.0%) |
| Total | 1,662 (48.9%) | 1,737 (51.1%) |
Housing Structures by Number of Rooms in Pittston
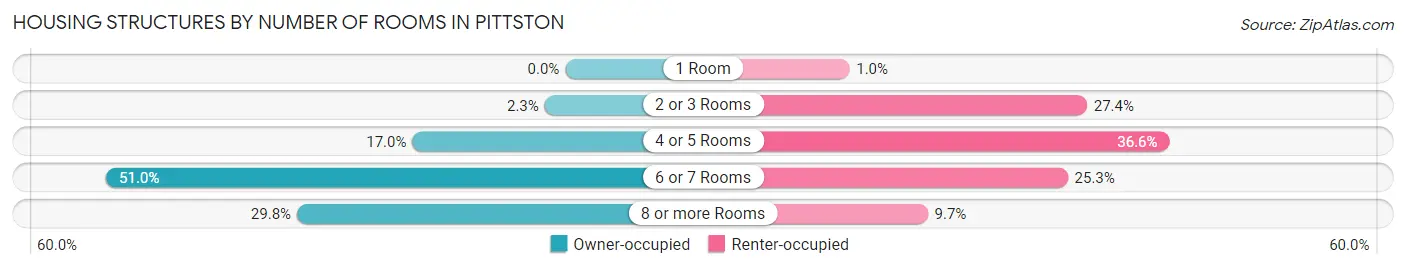
| Number of Rooms | Owner-occupied | Renter-occupied |
| 1 Room | 0 (0.0%) | 18 (1.0%) |
| 2 or 3 Rooms | 38 (2.3%) | 476 (27.4%) |
| 4 or 5 Rooms | 282 (17.0%) | 635 (36.6%) |
| 6 or 7 Rooms | 847 (51.0%) | 439 (25.3%) |
| 8 or more Rooms | 495 (29.8%) | 169 (9.7%) |
| Total | 1,662 (100.0%) | 1,737 (100.0%) |
Housing Structure by Heating Type in Pittston
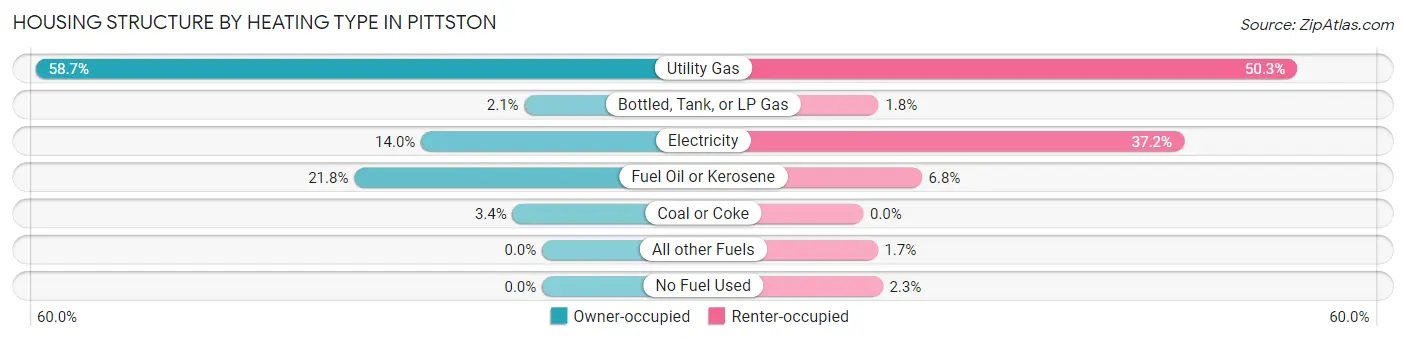
| Heating Type | Owner-occupied | Renter-occupied |
| Utility Gas | 976 (58.7%) | 874 (50.3%) |
| Bottled, Tank, or LP Gas | 34 (2.1%) | 31 (1.8%) |
| Electricity | 233 (14.0%) | 646 (37.2%) |
| Fuel Oil or Kerosene | 362 (21.8%) | 118 (6.8%) |
| Coal or Coke | 57 (3.4%) | 0 (0.0%) |
| All other Fuels | 0 (0.0%) | 29 (1.7%) |
| No Fuel Used | 0 (0.0%) | 39 (2.2%) |
| Total | 1,662 (100.0%) | 1,737 (100.0%) |
Household Vehicle Usage in Pittston
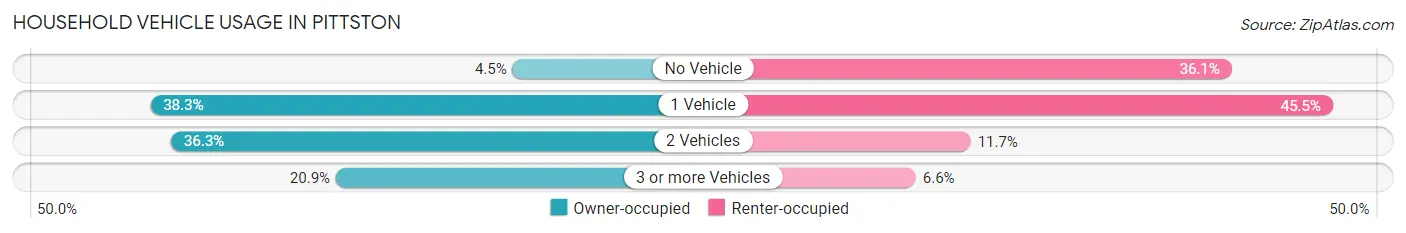
| Vehicles per Household | Owner-occupied | Renter-occupied |
| No Vehicle | 74 (4.4%) | 627 (36.1%) |
| 1 Vehicle | 636 (38.3%) | 791 (45.5%) |
| 2 Vehicles | 604 (36.3%) | 204 (11.7%) |
| 3 or more Vehicles | 348 (20.9%) | 115 (6.6%) |
| Total | 1,662 (100.0%) | 1,737 (100.0%) |
Real Estate & Mortgages in Pittston
Real Estate and Mortgage Overview in Pittston
| Characteristic | Without Mortgage | With Mortgage |
| Housing Units | 714 | 948 |
| Median Property Value | $92,000 | $118,200 |
| Median Household Income | $56,900 | $123 |
| Monthly Housing Costs | $597 | $0 |
| Real Estate Taxes | $1,995 | $18 |
Property Value by Mortgage Status in Pittston
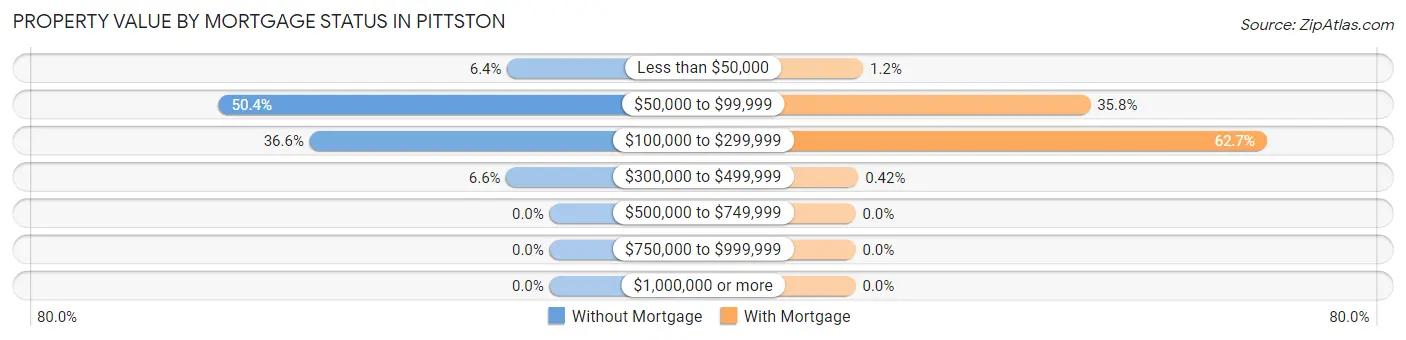
| Property Value | Without Mortgage | With Mortgage |
| Less than $50,000 | 46 (6.4%) | 11 (1.2%) |
| $50,000 to $99,999 | 360 (50.4%) | 339 (35.8%) |
| $100,000 to $299,999 | 261 (36.5%) | 594 (62.7%) |
| $300,000 to $499,999 | 47 (6.6%) | 4 (0.4%) |
| $500,000 to $749,999 | 0 (0.0%) | 0 (0.0%) |
| $750,000 to $999,999 | 0 (0.0%) | 0 (0.0%) |
| $1,000,000 or more | 0 (0.0%) | 0 (0.0%) |
| Total | 714 (100.0%) | 948 (100.0%) |
Household Income by Mortgage Status in Pittston
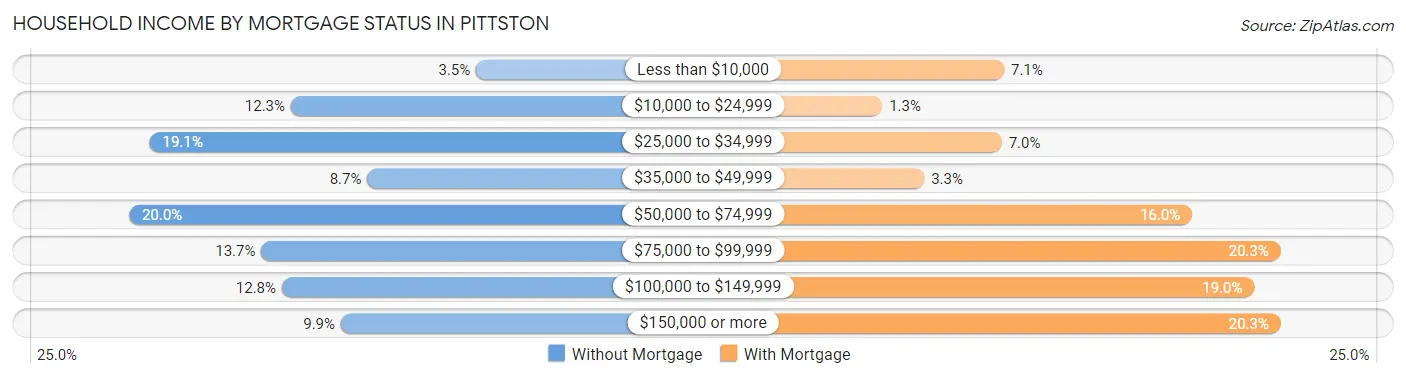
| Household Income | Without Mortgage | With Mortgage |
| Less than $10,000 | 25 (3.5%) | 67 (7.1%) |
| $10,000 to $24,999 | 88 (12.3%) | 12 (1.3%) |
| $25,000 to $34,999 | 136 (19.1%) | 66 (7.0%) |
| $35,000 to $49,999 | 62 (8.7%) | 31 (3.3%) |
| $50,000 to $74,999 | 143 (20.0%) | 152 (16.0%) |
| $75,000 to $99,999 | 98 (13.7%) | 192 (20.3%) |
| $100,000 to $149,999 | 91 (12.8%) | 180 (19.0%) |
| $150,000 or more | 71 (9.9%) | 192 (20.3%) |
| Total | 714 (100.0%) | 948 (100.0%) |
Property Value to Household Income Ratio in Pittston
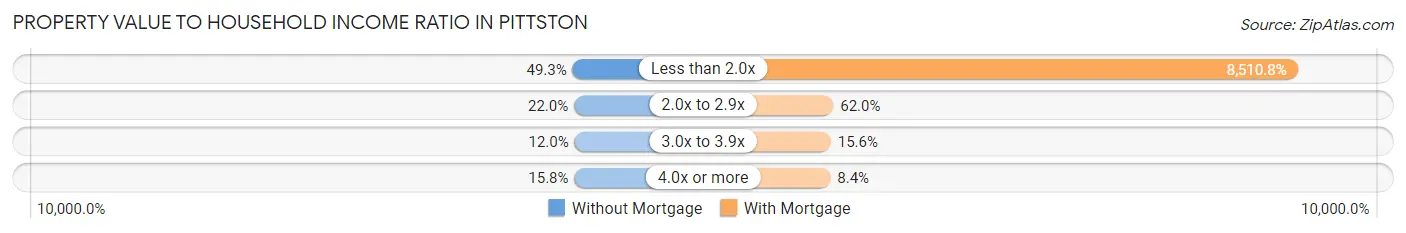
| Value-to-Income Ratio | Without Mortgage | With Mortgage |
| Less than 2.0x | 352 (49.3%) | 80,682 (8,510.8%) |
| 2.0x to 2.9x | 157 (22.0%) | 588 (62.0%) |
| 3.0x to 3.9x | 86 (12.0%) | 148 (15.6%) |
| 4.0x or more | 113 (15.8%) | 80 (8.4%) |
| Total | 714 (100.0%) | 948 (100.0%) |
Real Estate Taxes by Mortgage Status in Pittston
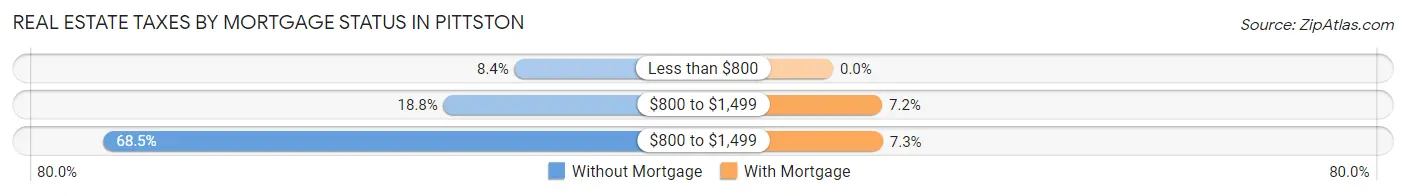
| Property Taxes | Without Mortgage | With Mortgage |
| Less than $800 | 60 (8.4%) | 0 (0.0%) |
| $800 to $1,499 | 134 (18.8%) | 68 (7.2%) |
| $800 to $1,499 | 489 (68.5%) | 69 (7.3%) |
| Total | 714 (100.0%) | 948 (100.0%) |
Health & Disability in Pittston
Health Insurance Coverage by Age in Pittston
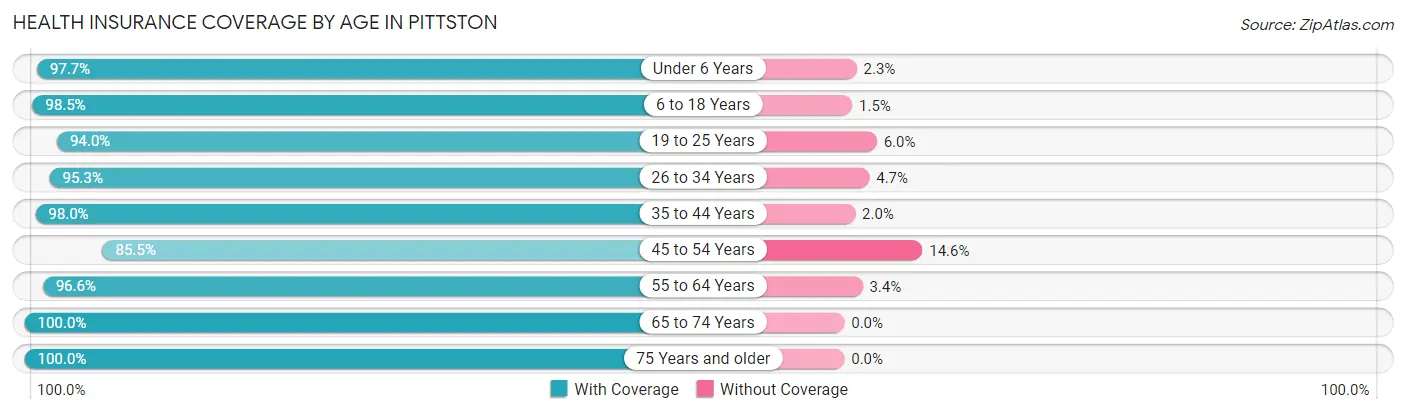
| Age Bracket | With Coverage | Without Coverage |
| Under 6 Years | 598 (97.7%) | 14 (2.3%) |
| 6 to 18 Years | 1,218 (98.5%) | 18 (1.5%) |
| 19 to 25 Years | 638 (94.0%) | 41 (6.0%) |
| 26 to 34 Years | 1,165 (95.3%) | 57 (4.7%) |
| 35 to 44 Years | 678 (98.0%) | 14 (2.0%) |
| 45 to 54 Years | 593 (85.5%) | 101 (14.5%) |
| 55 to 64 Years | 1,057 (96.6%) | 37 (3.4%) |
| 65 to 74 Years | 787 (100.0%) | 0 (0.0%) |
| 75 Years and older | 585 (100.0%) | 0 (0.0%) |
| Total | 7,319 (96.3%) | 282 (3.7%) |
Health Insurance Coverage by Citizenship Status in Pittston
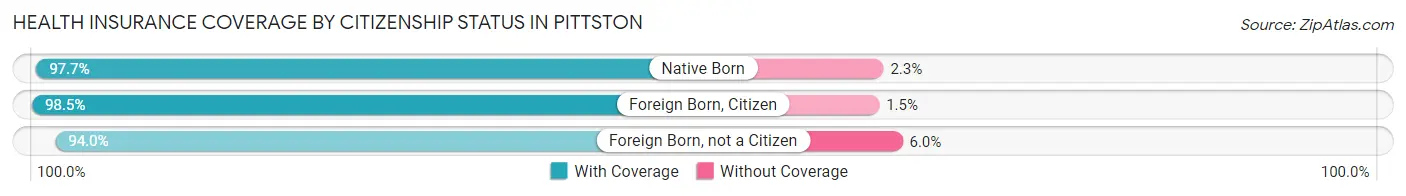
| Citizenship Status | With Coverage | Without Coverage |
| Native Born | 598 (97.7%) | 14 (2.3%) |
| Foreign Born, Citizen | 1,218 (98.5%) | 18 (1.5%) |
| Foreign Born, not a Citizen | 638 (94.0%) | 41 (6.0%) |
Health Insurance Coverage by Household Income in Pittston
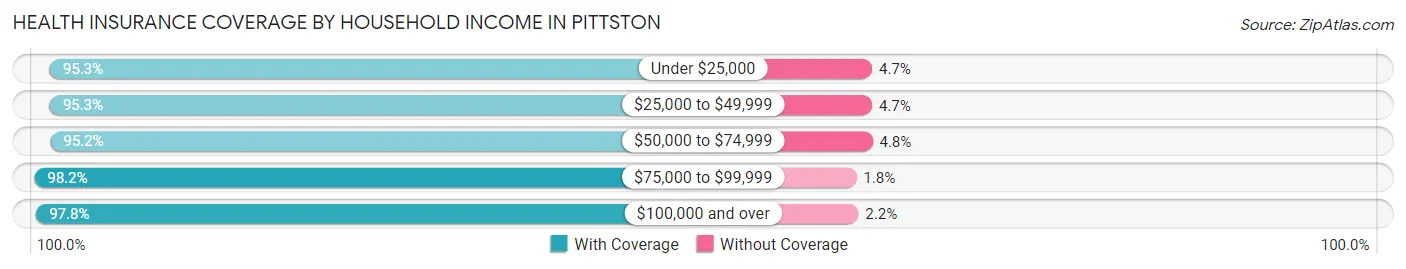
| Household Income | With Coverage | Without Coverage |
| Under $25,000 | 1,627 (95.3%) | 81 (4.7%) |
| $25,000 to $49,999 | 1,918 (95.3%) | 95 (4.7%) |
| $50,000 to $74,999 | 888 (95.2%) | 45 (4.8%) |
| $75,000 to $99,999 | 969 (98.2%) | 18 (1.8%) |
| $100,000 and over | 1,886 (97.8%) | 42 (2.2%) |
Public vs Private Health Insurance Coverage by Age in Pittston
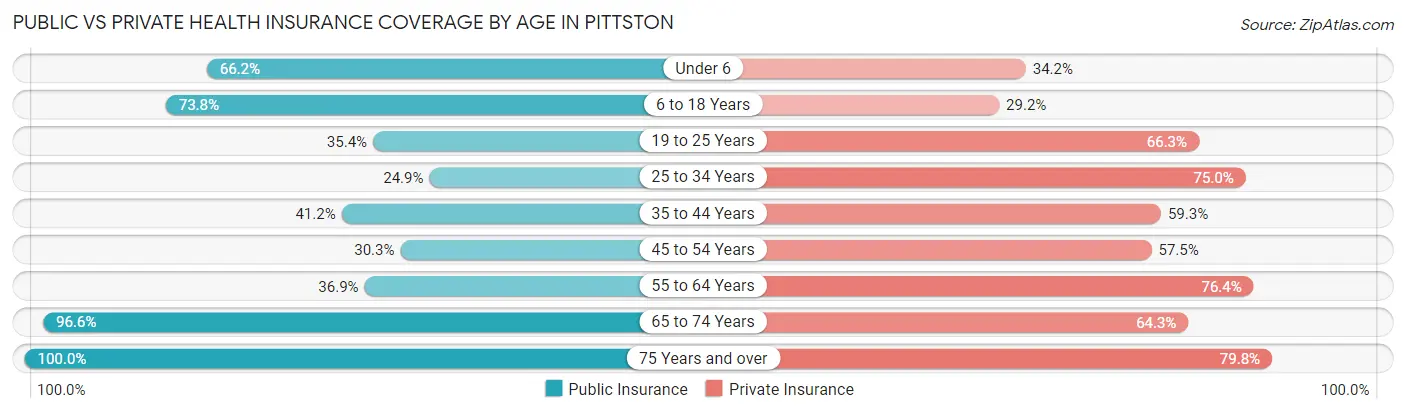
| Age Bracket | Public Insurance | Private Insurance |
| Under 6 | 405 (66.2%) | 209 (34.2%) |
| 6 to 18 Years | 912 (73.8%) | 361 (29.2%) |
| 19 to 25 Years | 240 (35.3%) | 450 (66.3%) |
| 25 to 34 Years | 304 (24.9%) | 916 (75.0%) |
| 35 to 44 Years | 285 (41.2%) | 410 (59.3%) |
| 45 to 54 Years | 210 (30.3%) | 399 (57.5%) |
| 55 to 64 Years | 404 (36.9%) | 836 (76.4%) |
| 65 to 74 Years | 760 (96.6%) | 506 (64.3%) |
| 75 Years and over | 585 (100.0%) | 467 (79.8%) |
| Total | 4,105 (54.0%) | 4,554 (59.9%) |
Disability Status by Sex by Age in Pittston
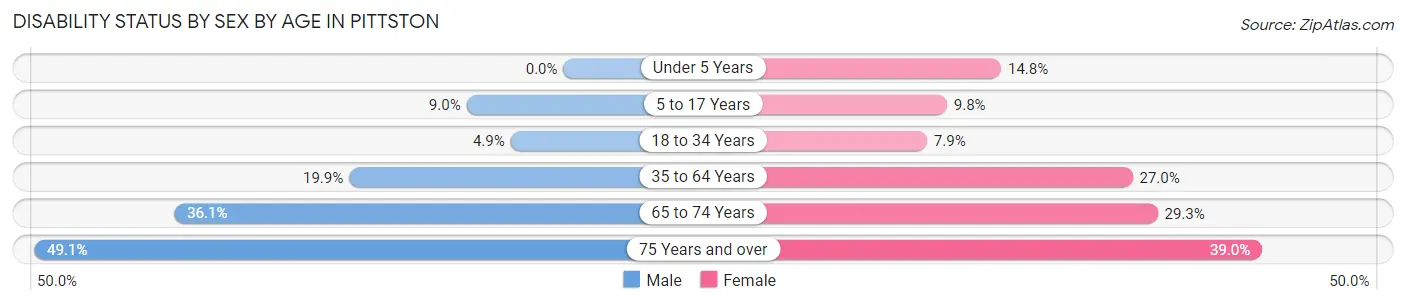
| Age Bracket | Male | Female |
| Under 5 Years | 0 (0.0%) | 43 (14.8%) |
| 5 to 17 Years | 55 (9.0%) | 62 (9.8%) |
| 18 to 34 Years | 45 (4.9%) | 89 (7.9%) |
| 35 to 64 Years | 219 (19.9%) | 372 (27.0%) |
| 65 to 74 Years | 129 (36.1%) | 126 (29.3%) |
| 75 Years and over | 111 (49.1%) | 140 (39.0%) |
Disability Class by Sex by Age in Pittston
Disability Class: Hearing Difficulty
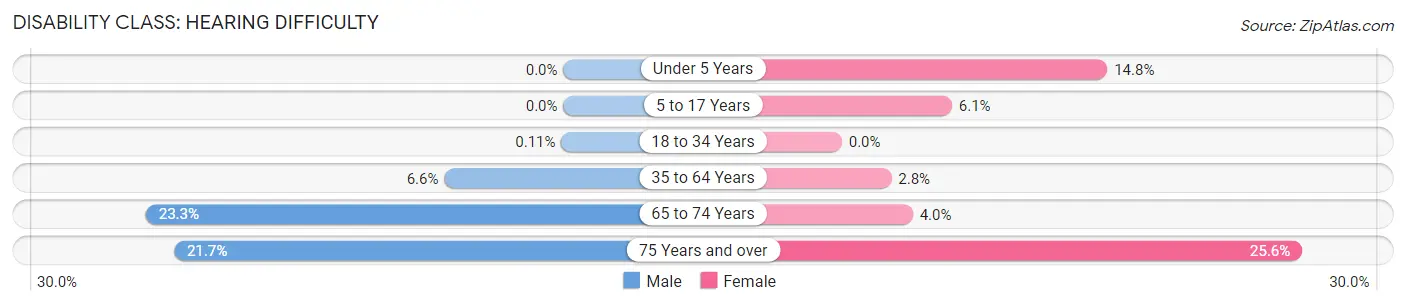
| Age Bracket | Male | Female |
| Under 5 Years | 0 (0.0%) | 43 (14.8%) |
| 5 to 17 Years | 0 (0.0%) | 39 (6.1%) |
| 18 to 34 Years | 1 (0.1%) | 0 (0.0%) |
| 35 to 64 Years | 73 (6.6%) | 38 (2.8%) |
| 65 to 74 Years | 83 (23.3%) | 17 (4.0%) |
| 75 Years and over | 49 (21.7%) | 92 (25.6%) |
Disability Class: Vision Difficulty
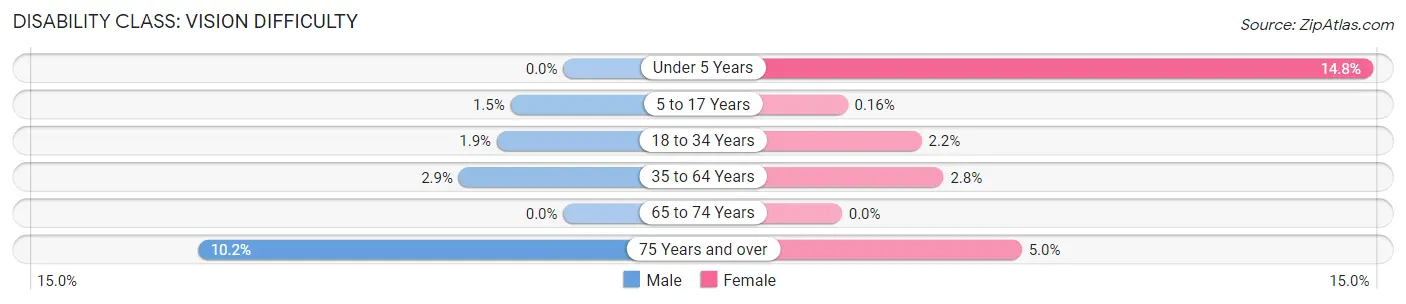
| Age Bracket | Male | Female |
| Under 5 Years | 0 (0.0%) | 43 (14.8%) |
| 5 to 17 Years | 9 (1.5%) | 1 (0.2%) |
| 18 to 34 Years | 17 (1.8%) | 25 (2.2%) |
| 35 to 64 Years | 32 (2.9%) | 39 (2.8%) |
| 65 to 74 Years | 0 (0.0%) | 0 (0.0%) |
| 75 Years and over | 23 (10.2%) | 18 (5.0%) |
Disability Class: Cognitive Difficulty
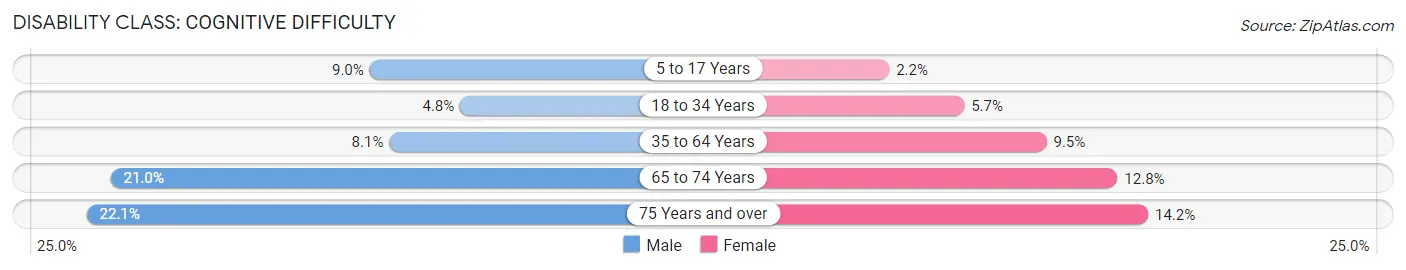
| Age Bracket | Male | Female |
| 5 to 17 Years | 55 (9.0%) | 14 (2.2%) |
| 18 to 34 Years | 44 (4.8%) | 64 (5.7%) |
| 35 to 64 Years | 89 (8.1%) | 131 (9.5%) |
| 65 to 74 Years | 75 (21.0%) | 55 (12.8%) |
| 75 Years and over | 50 (22.1%) | 51 (14.2%) |
Disability Class: Ambulatory Difficulty
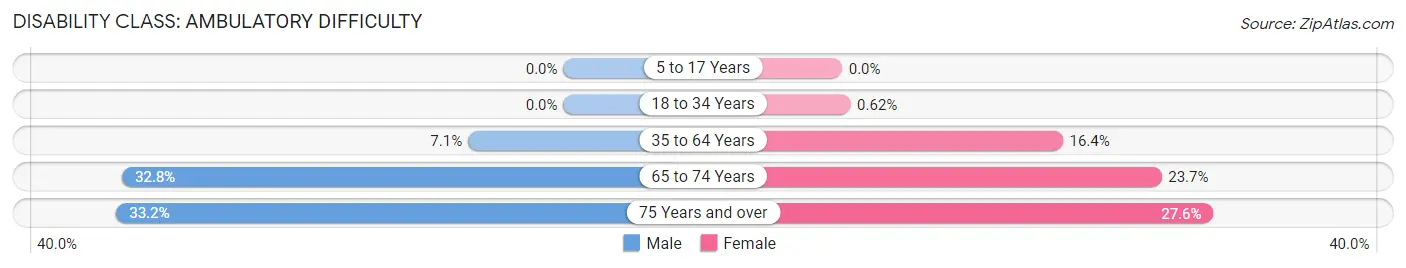
| Age Bracket | Male | Female |
| 5 to 17 Years | 0 (0.0%) | 0 (0.0%) |
| 18 to 34 Years | 0 (0.0%) | 7 (0.6%) |
| 35 to 64 Years | 78 (7.1%) | 226 (16.4%) |
| 65 to 74 Years | 117 (32.8%) | 102 (23.7%) |
| 75 Years and over | 75 (33.2%) | 99 (27.6%) |
Disability Class: Self-Care Difficulty
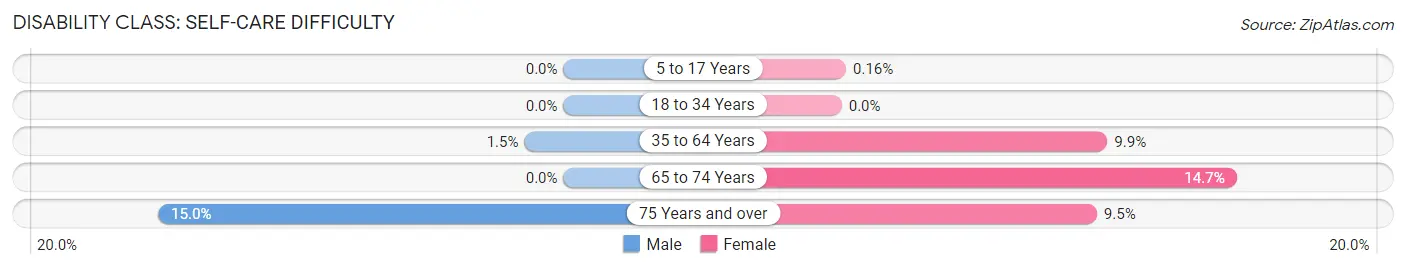
| Age Bracket | Male | Female |
| 5 to 17 Years | 0 (0.0%) | 1 (0.2%) |
| 18 to 34 Years | 0 (0.0%) | 0 (0.0%) |
| 35 to 64 Years | 16 (1.5%) | 136 (9.9%) |
| 65 to 74 Years | 0 (0.0%) | 63 (14.6%) |
| 75 Years and over | 34 (15.0%) | 34 (9.5%) |
Technology Access in Pittston
Computing Device Access in Pittston
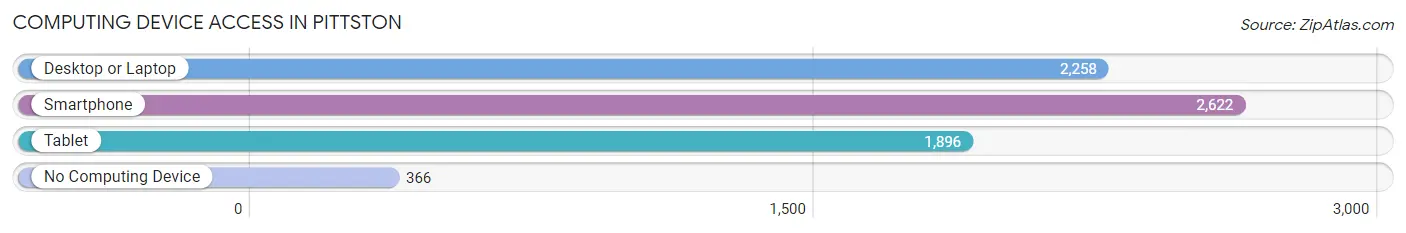
| Device Type | # Households | % Households |
| Desktop or Laptop | 2,258 | 66.4% |
| Smartphone | 2,622 | 77.1% |
| Tablet | 1,896 | 55.8% |
| No Computing Device | 366 | 10.8% |
| Total | 3,399 | 100.0% |
Internet Access in Pittston
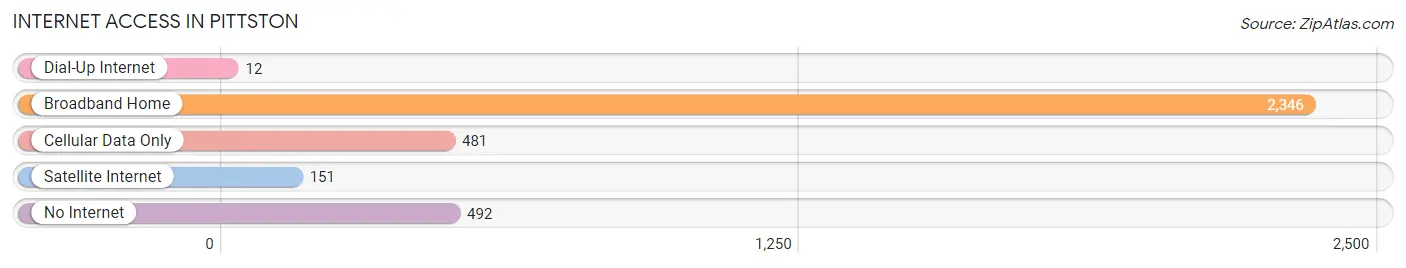
| Internet Type | # Households | % Households |
| Dial-Up Internet | 12 | 0.4% |
| Broadband Home | 2,346 | 69.0% |
| Cellular Data Only | 481 | 14.1% |
| Satellite Internet | 151 | 4.4% |
| No Internet | 492 | 14.5% |
| Total | 3,399 | 100.0% |
Pittston Summary
Pittston, Pennsylvania is a small city located in Luzerne County in the northeastern part of the state. It is situated on the banks of the Susquehanna River, about 25 miles northwest of Wilkes-Barre. The city has a population of approximately 7,739 people, according to the 2010 census.
History
Pittston was founded in 1770 by William Pitt, a British statesman and the first Earl of Chatham. The city was originally known as Pittstown, but the name was changed to Pittston in 1853. The city was incorporated in 1854.
Pittston was an important center of the coal mining industry in the 19th and 20th centuries. The city was also home to several large manufacturing companies, including the Pittston Stove Company, the Pittston Iron Works, and the Pittston Woolen Mills.
Geography
Pittston is located in the Wyoming Valley of northeastern Pennsylvania. The city is situated on the banks of the Susquehanna River, about 25 miles northwest of Wilkes-Barre. The city has a total area of 1.7 square miles, all of which is land.
Economy
Pittston’s economy is largely based on manufacturing and services. The city is home to several large manufacturing companies, including the Pittston Stove Company, the Pittston Iron Works, and the Pittston Woolen Mills. The city is also home to several service-based businesses, including banks, insurance companies, and medical centers.
Demographics
According to the 2010 census, Pittston has a population of 7,739 people. The city has a median household income of $37,945 and a median family income of $45,945. The city’s population is largely white (90.2%), with small percentages of African American (4.2%), Asian (2.2%), and Hispanic (2.2%) residents. The city’s population is also largely Catholic (62.2%), with small percentages of Protestant (19.2%), Jewish (2.2%), and other (16.4%) residents.
Conclusion
Pittston, Pennsylvania is a small city located in Luzerne County in the northeastern part of the state. It is situated on the banks of the Susquehanna River, about 25 miles northwest of Wilkes-Barre. The city has a population of approximately 7,739 people, according to the 2010 census. Pittston’s economy is largely based on manufacturing and services, and the city is home to several large manufacturing companies and service-based businesses. The city’s population is largely white, with small percentages of African American, Asian, and Hispanic residents. The city’s population is also largely Catholic, with small percentages of Protestant, Jewish, and other residents.
Common Questions
What is Per Capita Income in Pittston?
Per Capita income in Pittston is $27,642.
What is the Median Family Income in Pittston?
Median Family Income in Pittston is $60,609.
What is the Median Household income in Pittston?
Median Household Income in Pittston is $44,863.
What is Income or Wage Gap in Pittston?
Income or Wage Gap in Pittston is 31.7%.
Women in Pittston earn 68.3 cents for every dollar earned by a man.
What is Inequality or Gini Index in Pittston?
Inequality or Gini Index in Pittston is 0.44.
What is the Total Population of Pittston?
Total Population of Pittston is 7,601.
What is the Total Male Population of Pittston?
Total Male Population of Pittston is 3,379.
What is the Total Female Population of Pittston?
Total Female Population of Pittston is 4,222.
What is the Ratio of Males per 100 Females in Pittston?
There are 80.03 Males per 100 Females in Pittston.
What is the Ratio of Females per 100 Males in Pittston?
There are 124.95 Females per 100 Males in Pittston.
What is the Median Population Age in Pittston?
Median Population Age in Pittston is 36.0 Years.
What is the Average Family Size in Pittston
Average Family Size in Pittston is 3.1 People.
What is the Average Household Size in Pittston
Average Household Size in Pittston is 2.2 People.
How Large is the Labor Force in Pittston?
There are 3,721 People in the Labor Forcein in Pittston.
What is the Percentage of People in the Labor Force in Pittston?
61.5% of People are in the Labor Force in Pittston.
What is the Unemployment Rate in Pittston?
Unemployment Rate in Pittston is 6.8%.