Irwin borough, PA Map & Demographics
Irwin borough Overview
$36,884
PER CAPITA INCOME
$76,321
AVG FAMILY INCOME
$52,989
AVG HOUSEHOLD INCOME
9.8%
WAGE / INCOME GAP [ % ]
90.2¢/ $1
WAGE / INCOME GAP [ $ ]
0.45
INEQUALITY / GINI INDEX
3,878
TOTAL POPULATION
1,673
MALE POPULATION
2,205
FEMALE POPULATION
75.87
MALES / 100 FEMALES
131.80
FEMALES / 100 MALES
40.9
MEDIAN AGE
2.7
AVG FAMILY SIZE
1.9
AVG HOUSEHOLD SIZE
2,275
LABOR FORCE [ PEOPLE ]
69.9%
PERCENT IN LABOR FORCE
4.7%
UNEMPLOYMENT RATE
Income in Irwin borough
Income Overview in Irwin borough
Per Capita Income in Irwin borough is $36,884, while median incomes of families and households are $76,321 and $52,989 respectively.
| Characteristic | Number | Measure |
| Per Capita Income | 3,878 | $36,884 |
| Median Family Income | 885 | $76,321 |
| Mean Family Income | 885 | $90,824 |
| Median Household Income | 2,046 | $52,989 |
| Mean Household Income | 2,046 | $69,311 |
| Income Deficit | 885 | $0 |
| Wage / Income Gap (%) | 3,878 | 9.77% |
| Wage / Income Gap ($) | 3,878 | 90.23¢ per $1 |
| Gini / Inequality Index | 3,878 | 0.45 |
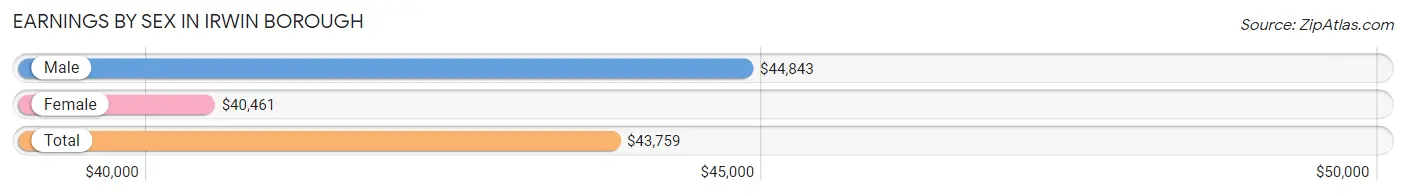
Earnings by Sex in Irwin borough
Average Earnings in Irwin borough are $43,759, $44,843 for men and $40,461 for women, a difference of 9.8%.
| Sex | Number | Average Earnings |
| Male | 996 (43.9%) | $44,843 |
| Female | 1,275 (56.1%) | $40,461 |
| Total | 2,271 (100.0%) | $43,759 |
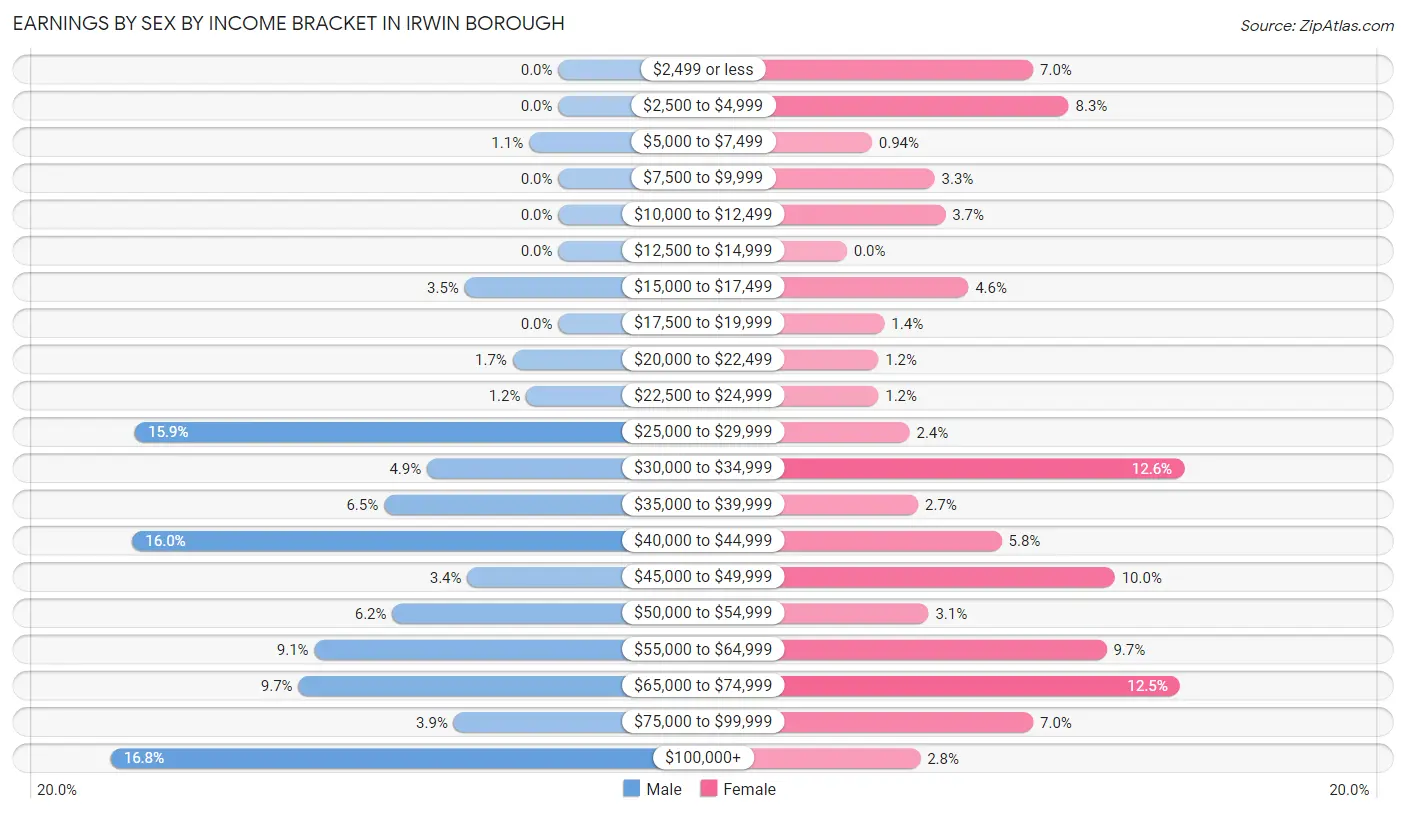
Earnings by Sex by Income Bracket in Irwin borough
The most common earnings brackets in Irwin borough are $100,000+ for men (167 | 16.8%) and $30,000 to $34,999 for women (161 | 12.6%).
| Income | Male | Female |
| $2,499 or less | 0 (0.0%) | 89 (7.0%) |
| $2,500 to $4,999 | 0 (0.0%) | 106 (8.3%) |
| $5,000 to $7,499 | 11 (1.1%) | 12 (0.9%) |
| $7,500 to $9,999 | 0 (0.0%) | 42 (3.3%) |
| $10,000 to $12,499 | 0 (0.0%) | 47 (3.7%) |
| $12,500 to $14,999 | 0 (0.0%) | 0 (0.0%) |
| $15,000 to $17,499 | 35 (3.5%) | 58 (4.5%) |
| $17,500 to $19,999 | 0 (0.0%) | 18 (1.4%) |
| $20,000 to $22,499 | 17 (1.7%) | 15 (1.2%) |
| $22,500 to $24,999 | 12 (1.2%) | 15 (1.2%) |
| $25,000 to $29,999 | 158 (15.9%) | 30 (2.4%) |
| $30,000 to $34,999 | 49 (4.9%) | 161 (12.6%) |
| $35,000 to $39,999 | 65 (6.5%) | 34 (2.7%) |
| $40,000 to $44,999 | 159 (16.0%) | 74 (5.8%) |
| $45,000 to $49,999 | 34 (3.4%) | 128 (10.0%) |
| $50,000 to $54,999 | 62 (6.2%) | 39 (3.1%) |
| $55,000 to $64,999 | 91 (9.1%) | 124 (9.7%) |
| $65,000 to $74,999 | 97 (9.7%) | 159 (12.5%) |
| $75,000 to $99,999 | 39 (3.9%) | 89 (7.0%) |
| $100,000+ | 167 (16.8%) | 35 (2.8%) |
| Total | 996 (100.0%) | 1,275 (100.0%) |
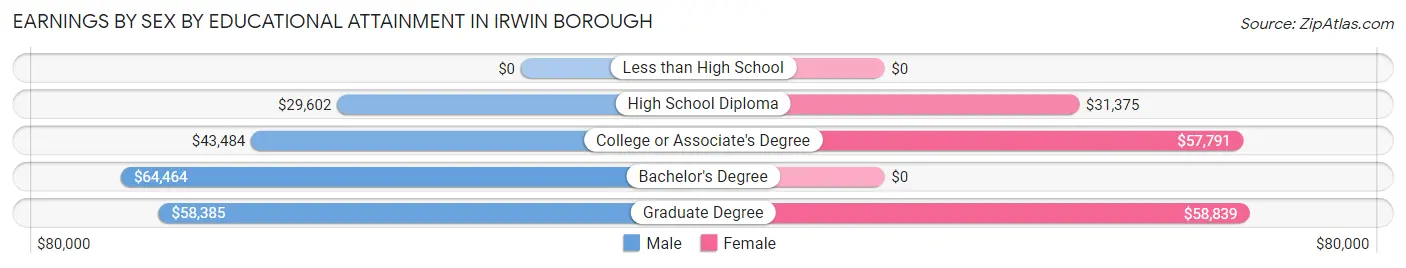
Earnings by Sex by Educational Attainment in Irwin borough
Average earnings in Irwin borough are $44,803 for men and $41,952 for women, a difference of 6.4%. Men with an educational attainment of bachelor's degree enjoy the highest average annual earnings of $64,464, while those with high school diploma education earn the least with $29,602. Women with an educational attainment of graduate degree earn the most with the average annual earnings of $58,839, while those with high school diploma education have the smallest earnings of $31,375.
| Educational Attainment | Male Income | Female Income |
| Less than High School | - | - |
| High School Diploma | $29,602 | $31,375 |
| College or Associate's Degree | $43,484 | $57,791 |
| Bachelor's Degree | $64,464 | $0 |
| Graduate Degree | $58,385 | $58,839 |
| Total | $44,803 | $41,952 |
Family Income in Irwin borough
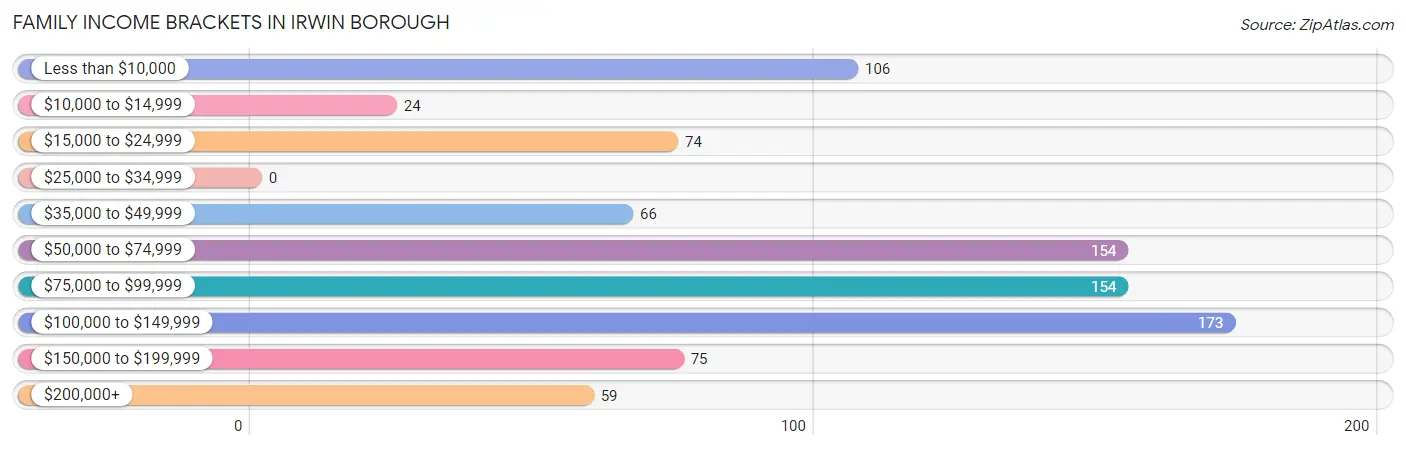
Family Income Brackets in Irwin borough
According to the Irwin borough family income data, there are 173 families falling into the $100,000 to $149,999 income range, which is the most common income bracket and makes up 19.6% of all families.
| Income Bracket | # Families | % Families |
| Less than $10,000 | 106 | 12.0% |
| $10,000 to $14,999 | 24 | 2.7% |
| $15,000 to $24,999 | 74 | 8.4% |
| $25,000 to $34,999 | 0 | 0.0% |
| $35,000 to $49,999 | 66 | 7.5% |
| $50,000 to $74,999 | 154 | 17.4% |
| $75,000 to $99,999 | 154 | 17.4% |
| $100,000 to $149,999 | 173 | 19.5% |
| $150,000 to $199,999 | 75 | 8.5% |
| $200,000+ | 59 | 6.7% |
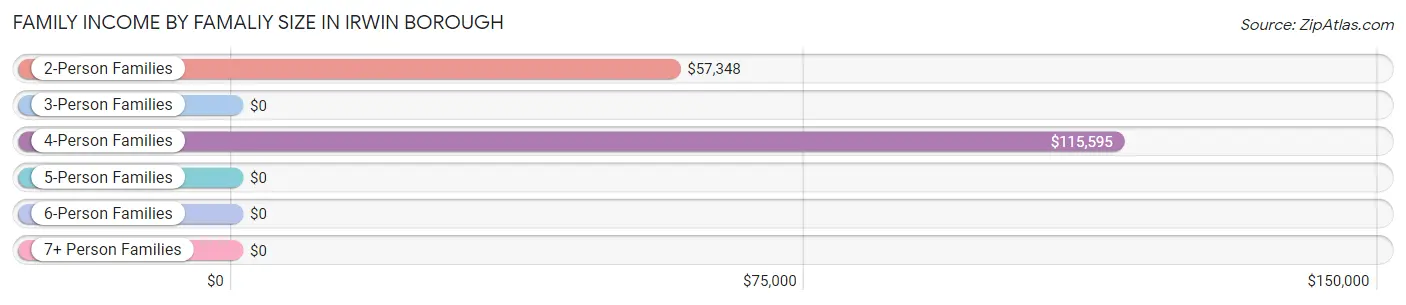
Family Income by Famaliy Size in Irwin borough
4-person families (138 | 15.6%) account for the highest median family income in Irwin borough with $115,595 per family, while 4-person families (138 | 15.6%) have the highest median income of $28,899 per family member.
| Income Bracket | # Families | Median Income |
| 2-Person Families | 486 (54.9%) | $57,348 |
| 3-Person Families | 233 (26.3%) | $0 |
| 4-Person Families | 138 (15.6%) | $115,595 |
| 5-Person Families | 15 (1.7%) | $0 |
| 6-Person Families | 13 (1.5%) | $0 |
| 7+ Person Families | 0 (0.0%) | $0 |
| Total | 885 (100.0%) | $76,321 |
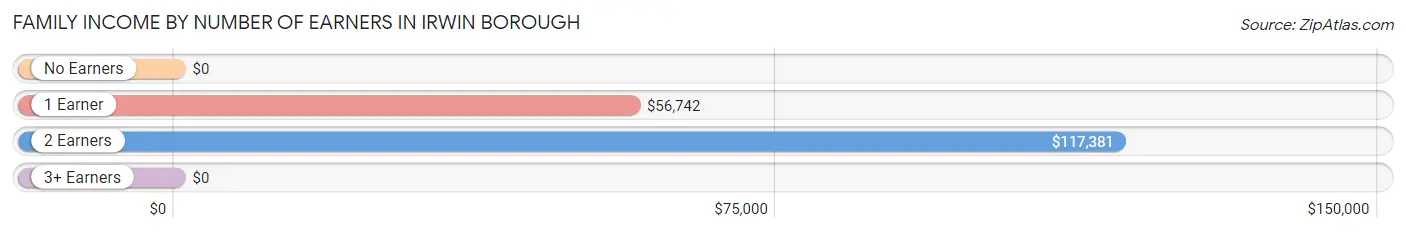
Family Income by Number of Earners in Irwin borough
| Number of Earners | # Families | Median Income |
| No Earners | 210 (23.7%) | $0 |
| 1 Earner | 310 (35.0%) | $56,742 |
| 2 Earners | 290 (32.8%) | $117,381 |
| 3+ Earners | 75 (8.5%) | $0 |
| Total | 885 (100.0%) | $76,321 |
Household Income in Irwin borough
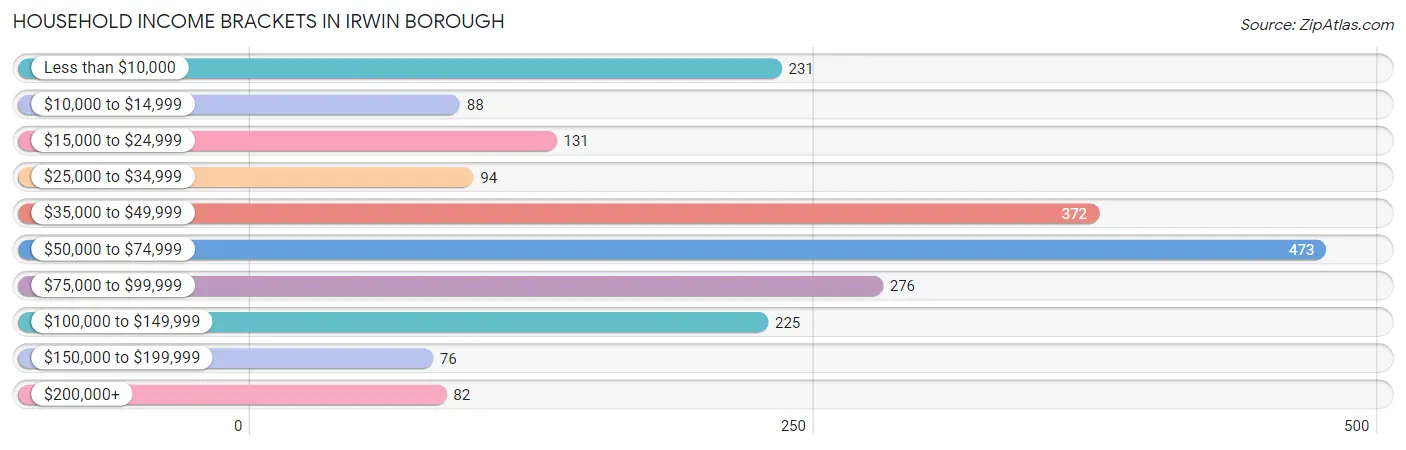
Household Income Brackets in Irwin borough
With 473 households falling in the category, the $50,000 to $74,999 income range is the most frequent in Irwin borough, accounting for 23.1% of all households. In contrast, only 76 households (3.7%) fall into the $150,000 to $199,999 income bracket, making it the least populous group.
| Income Bracket | # Households | % Households |
| Less than $10,000 | 231 | 11.3% |
| $10,000 to $14,999 | 88 | 4.3% |
| $15,000 to $24,999 | 131 | 6.4% |
| $25,000 to $34,999 | 94 | 4.6% |
| $35,000 to $49,999 | 372 | 18.2% |
| $50,000 to $74,999 | 473 | 23.1% |
| $75,000 to $99,999 | 276 | 13.5% |
| $100,000 to $149,999 | 225 | 11.0% |
| $150,000 to $199,999 | 76 | 3.7% |
| $200,000+ | 82 | 4.0% |
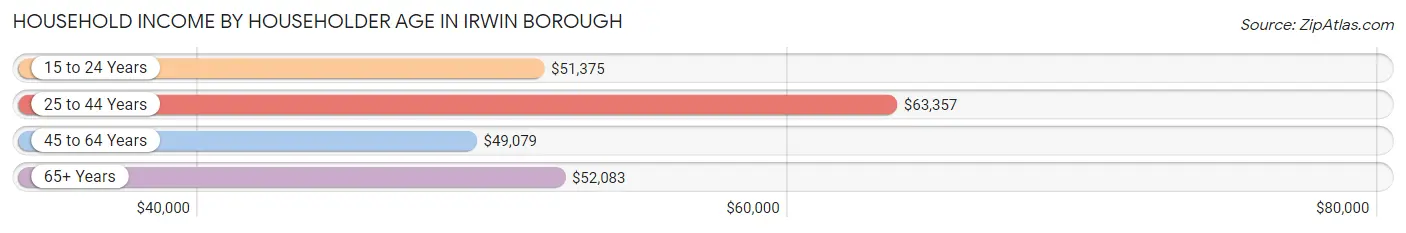
Household Income by Householder Age in Irwin borough
The median household income in Irwin borough is $52,989, with the highest median household income of $63,357 found in the 25 to 44 years age bracket for the primary householder. A total of 710 households (34.7%) fall into this category. Meanwhile, the 45 to 64 years age bracket for the primary householder has the lowest median household income of $49,079, with 758 households (37.0%) in this group.
| Income Bracket | # Households | Median Income |
| 15 to 24 Years | 119 (5.8%) | $51,375 |
| 25 to 44 Years | 710 (34.7%) | $63,357 |
| 45 to 64 Years | 758 (37.0%) | $49,079 |
| 65+ Years | 459 (22.4%) | $52,083 |
| Total | 2,046 (100.0%) | $52,989 |
Poverty in Irwin borough
Income Below Poverty by Sex and Age in Irwin borough
With 9.1% poverty level for males and 29.4% for females among the residents of Irwin borough, under 5 year old males and under 5 year old females are the most vulnerable to poverty, with 59 males (60.8%) and 86 females (61.0%) in their respective age groups living below the poverty level.
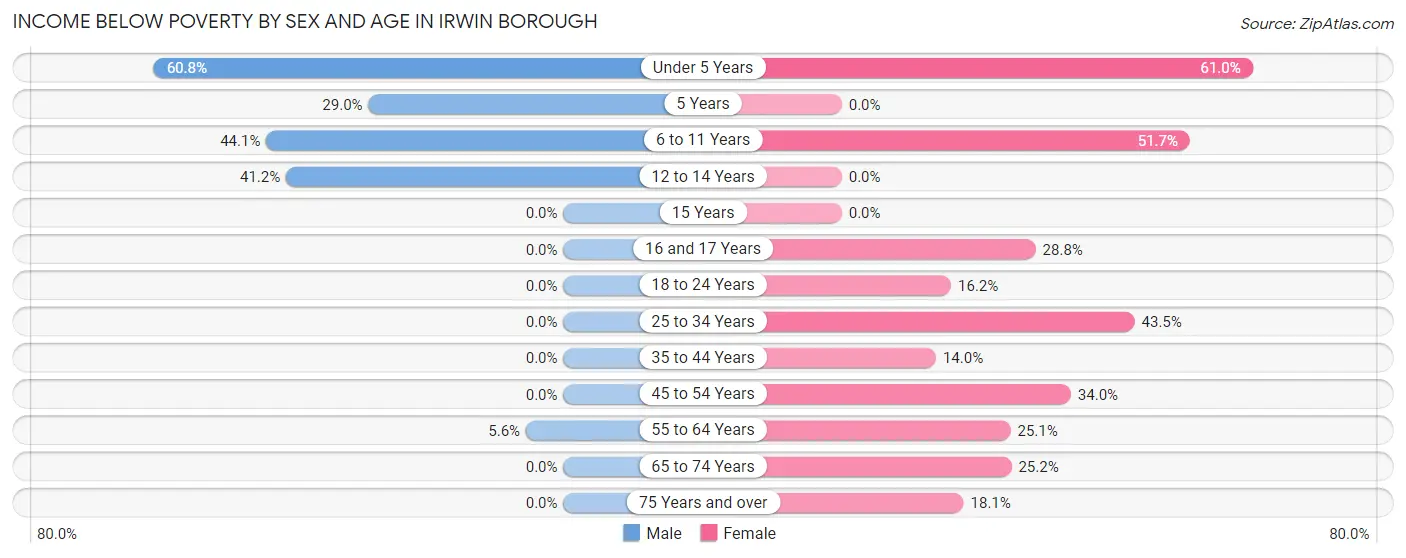
| Age Bracket | Male | Female |
| Under 5 Years | 59 (60.8%) | 86 (61.0%) |
| 5 Years | 11 (28.9%) | 0 (0.0%) |
| 6 to 11 Years | 45 (44.1%) | 62 (51.7%) |
| 12 to 14 Years | 14 (41.2%) | 0 (0.0%) |
| 15 Years | 0 (0.0%) | 0 (0.0%) |
| 16 and 17 Years | 0 (0.0%) | 19 (28.8%) |
| 18 to 24 Years | 0 (0.0%) | 25 (16.2%) |
| 25 to 34 Years | 0 (0.0%) | 130 (43.5%) |
| 35 to 44 Years | 0 (0.0%) | 40 (14.0%) |
| 45 to 54 Years | 0 (0.0%) | 83 (34.0%) |
| 55 to 64 Years | 21 (5.6%) | 99 (25.1%) |
| 65 to 74 Years | 0 (0.0%) | 63 (25.2%) |
| 75 Years and over | 0 (0.0%) | 36 (18.1%) |
| Total | 150 (9.1%) | 643 (29.4%) |
Income Above Poverty by Sex and Age in Irwin borough
According to the poverty statistics in Irwin borough, males aged 15 years and females aged 12 to 14 years are the age groups that are most secure financially, with 100.0% of males and 100.0% of females in these age groups living above the poverty line.
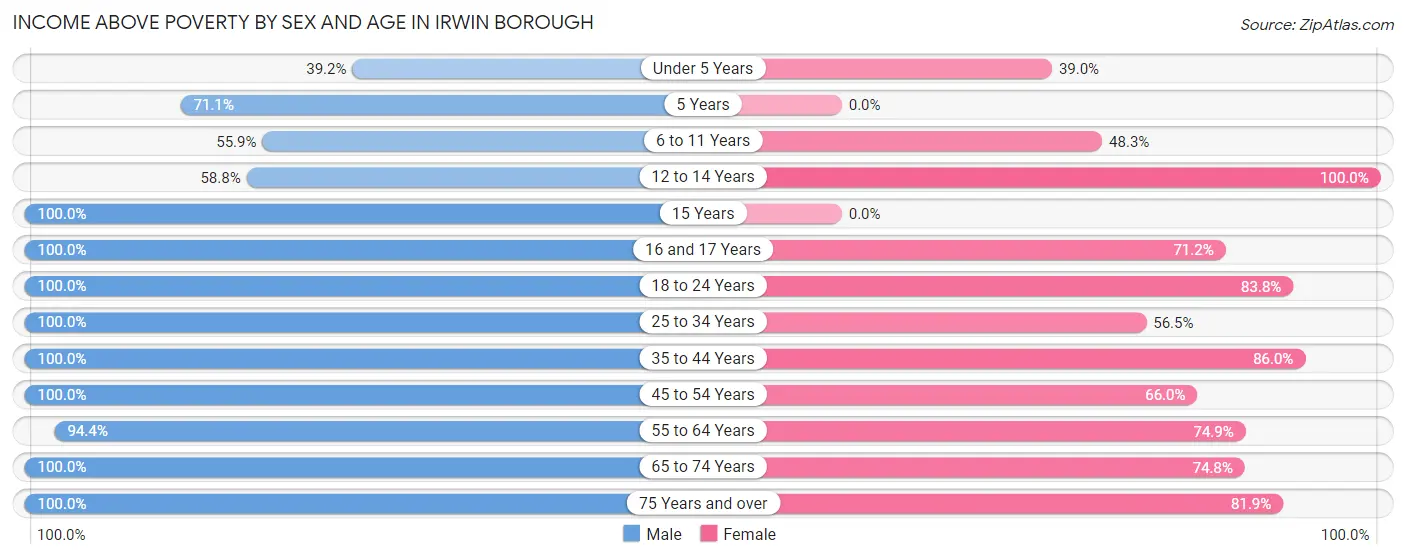
| Age Bracket | Male | Female |
| Under 5 Years | 38 (39.2%) | 55 (39.0%) |
| 5 Years | 27 (71.1%) | 0 (0.0%) |
| 6 to 11 Years | 57 (55.9%) | 58 (48.3%) |
| 12 to 14 Years | 20 (58.8%) | 30 (100.0%) |
| 15 Years | 42 (100.0%) | 0 (0.0%) |
| 16 and 17 Years | 40 (100.0%) | 47 (71.2%) |
| 18 to 24 Years | 18 (100.0%) | 129 (83.8%) |
| 25 to 34 Years | 341 (100.0%) | 169 (56.5%) |
| 35 to 44 Years | 267 (100.0%) | 246 (86.0%) |
| 45 to 54 Years | 106 (100.0%) | 161 (66.0%) |
| 55 to 64 Years | 357 (94.4%) | 296 (74.9%) |
| 65 to 74 Years | 92 (100.0%) | 187 (74.8%) |
| 75 Years and over | 98 (100.0%) | 163 (81.9%) |
| Total | 1,503 (90.9%) | 1,541 (70.6%) |
Income Below Poverty Among Married-Couple Families in Irwin borough
The poverty statistics for married-couple families in Irwin borough show that 3.5% or 21 of the total 593 families live below the poverty line. Families with no children have the highest poverty rate of 4.9%, comprising of 21 families. On the other hand, families with 1 or 2 children have the lowest poverty rate of 0.0%, which includes 0 families.
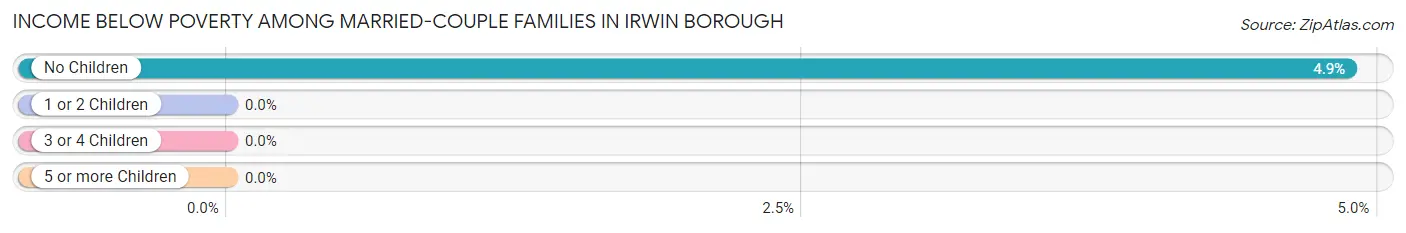
| Children | Above Poverty | Below Poverty |
| No Children | 410 (95.1%) | 21 (4.9%) |
| 1 or 2 Children | 134 (100.0%) | 0 (0.0%) |
| 3 or 4 Children | 28 (100.0%) | 0 (0.0%) |
| 5 or more Children | 0 (0.0%) | 0 (0.0%) |
| Total | 572 (96.5%) | 21 (3.5%) |
Income Below Poverty Among Single-Parent Households in Irwin borough
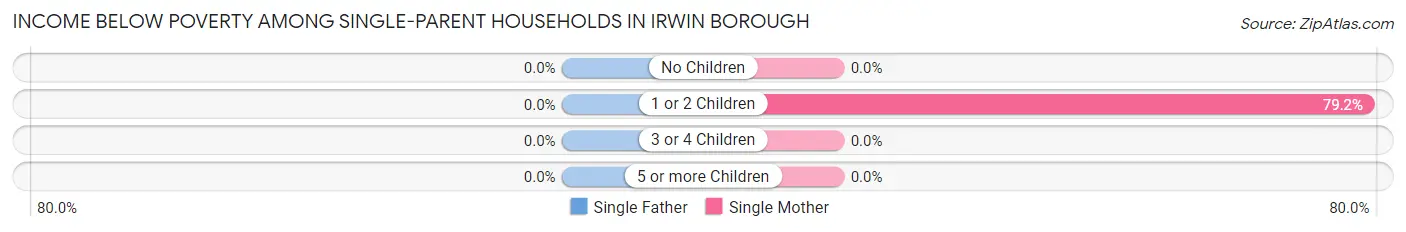
| Children | Single Father | Single Mother |
| No Children | 0 (0.0%) | 0 (0.0%) |
| 1 or 2 Children | 0 (0.0%) | 167 (79.1%) |
| 3 or 4 Children | 0 (0.0%) | 0 (0.0%) |
| 5 or more Children | 0 (0.0%) | 0 (0.0%) |
| Total | 0 (0.0%) | 167 (60.5%) |
Income Below Poverty Among Married-Couple vs Single-Parent Households in Irwin borough
The poverty data for Irwin borough shows that 21 of the married-couple family households (3.5%) and 167 of the single-parent households (57.2%) are living below the poverty level. Within the married-couple family households, those with no children have the highest poverty rate, with 21 households (4.9%) falling below the poverty line. Among the single-parent households, those with 1 or 2 children have the highest poverty rate, with 167 household (79.1%) living below poverty.
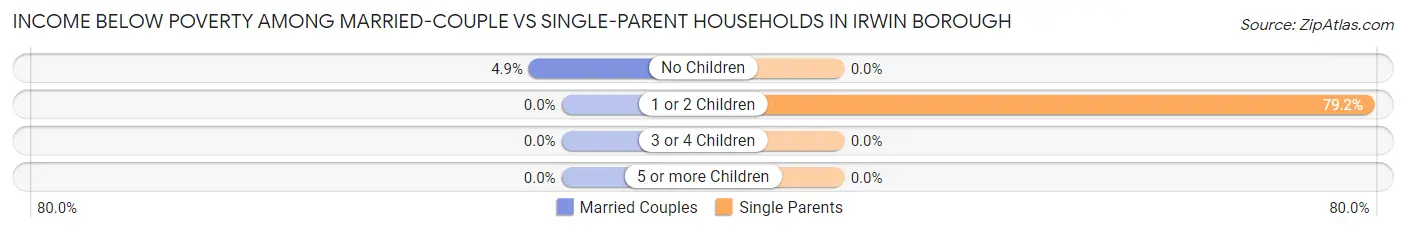
| Children | Married-Couple Families | Single-Parent Households |
| No Children | 21 (4.9%) | 0 (0.0%) |
| 1 or 2 Children | 0 (0.0%) | 167 (79.1%) |
| 3 or 4 Children | 0 (0.0%) | 0 (0.0%) |
| 5 or more Children | 0 (0.0%) | 0 (0.0%) |
| Total | 21 (3.5%) | 167 (57.2%) |
Race in Irwin borough
The most populous races in Irwin borough are White / Caucasian (3,569 | 92.0%), Two or more Races (160 | 4.1%), and Some other Race (86 | 2.2%).
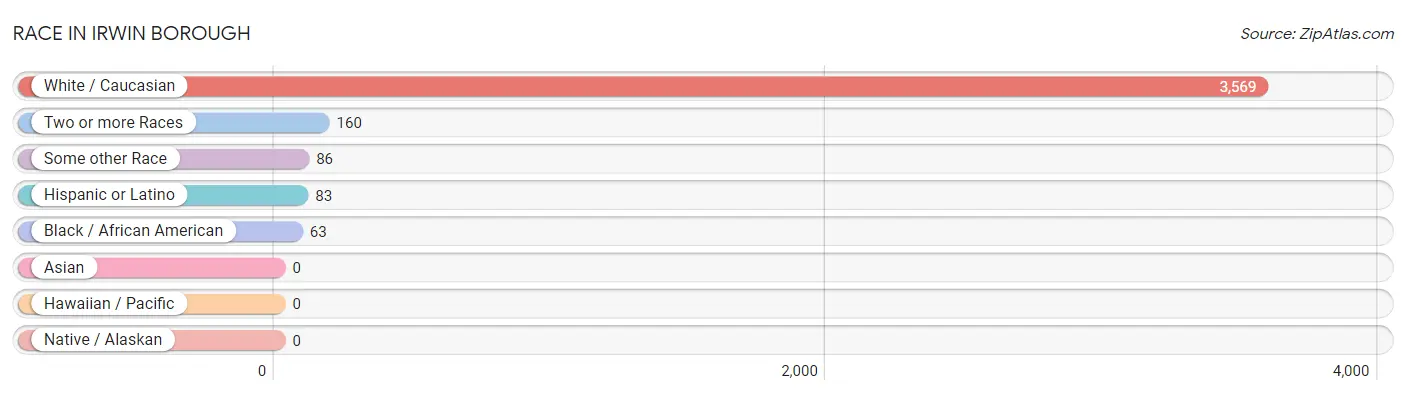
| Race | # Population | % Population |
| Asian | 0 | 0.0% |
| Black / African American | 63 | 1.6% |
| Hawaiian / Pacific | 0 | 0.0% |
| Hispanic or Latino | 83 | 2.1% |
| Native / Alaskan | 0 | 0.0% |
| White / Caucasian | 3,569 | 92.0% |
| Two or more Races | 160 | 4.1% |
| Some other Race | 86 | 2.2% |
| Total | 3,878 | 100.0% |
Ancestry in Irwin borough
The most populous ancestries reported in Irwin borough are German (759 | 19.6%), Italian (642 | 16.6%), Irish (473 | 12.2%), Polish (351 | 9.0%), and English (316 | 8.2%), together accounting for 65.5% of all Irwin borough residents.
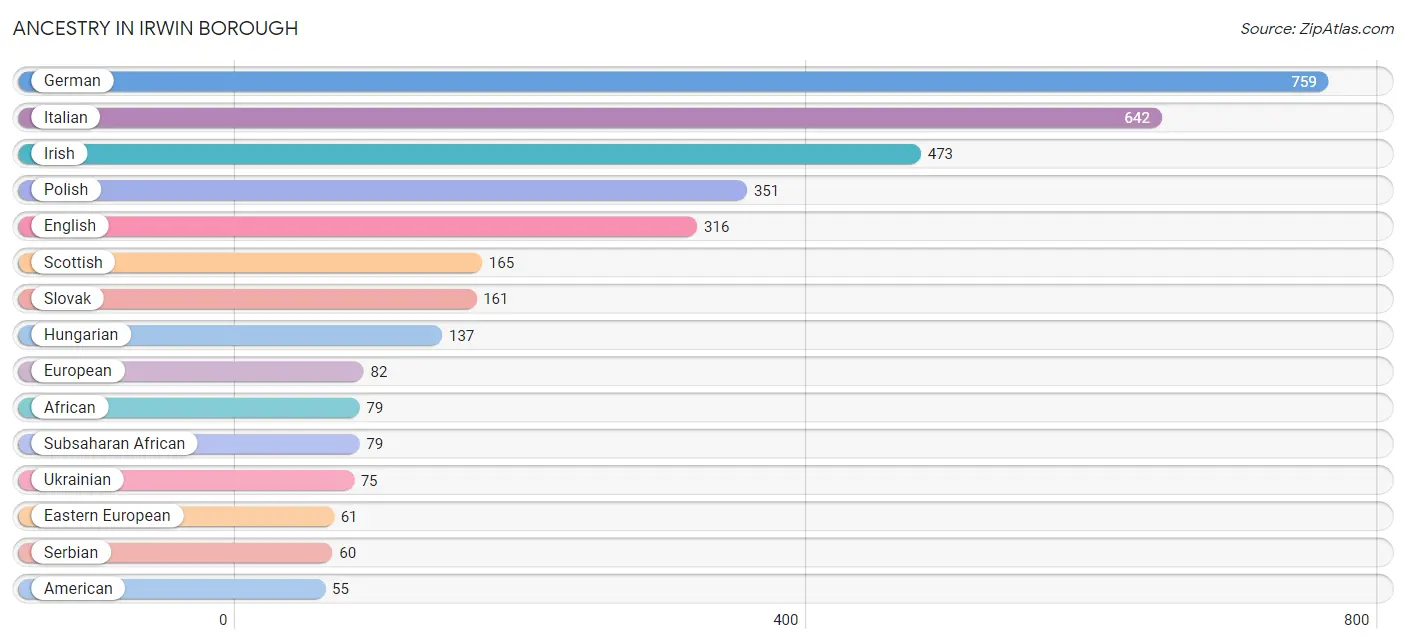
| Ancestry | # Population | % Population |
| African | 79 | 2.0% |
| American | 55 | 1.4% |
| Arab | 39 | 1.0% |
| Austrian | 17 | 0.4% |
| Cuban | 22 | 0.6% |
| Dutch | 20 | 0.5% |
| Eastern European | 61 | 1.6% |
| English | 316 | 8.2% |
| European | 82 | 2.1% |
| French | 55 | 1.4% |
| German | 759 | 19.6% |
| Guamanian / Chamorro | 18 | 0.5% |
| Hungarian | 137 | 3.5% |
| Iranian | 22 | 0.6% |
| Irish | 473 | 12.2% |
| Italian | 642 | 16.6% |
| Mexican | 18 | 0.5% |
| Norwegian | 18 | 0.5% |
| Pennsylvania German | 10 | 0.3% |
| Polish | 351 | 9.0% |
| Romanian | 22 | 0.6% |
| Russian | 17 | 0.4% |
| Scotch-Irish | 31 | 0.8% |
| Scottish | 165 | 4.3% |
| Serbian | 60 | 1.5% |
| Slovak | 161 | 4.2% |
| South American | 15 | 0.4% |
| Spaniard | 28 | 0.7% |
| Subsaharan African | 79 | 2.0% |
| Swedish | 31 | 0.8% |
| Syrian | 39 | 1.0% |
| Ukrainian | 75 | 1.9% |
| Venezuelan | 15 | 0.4% | View All 33 Rows |
Immigrants in Irwin borough
The most numerous immigrant groups reported in Irwin borough came from Europe (38 | 1.0%), Italy (23 | 0.6%), Southern Europe (23 | 0.6%), Germany (15 | 0.4%), and Western Europe (15 | 0.4%), together accounting for 2.9% of all Irwin borough residents.
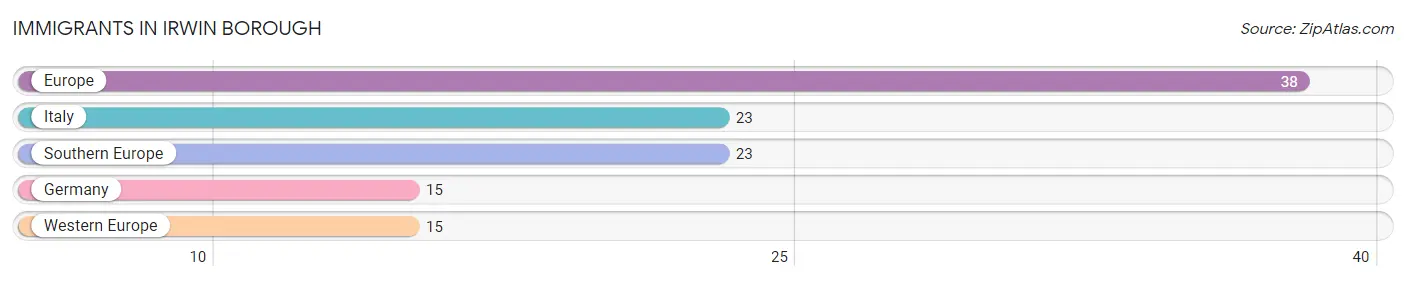
| Immigration Origin | # Population | % Population |
| Europe | 38 | 1.0% |
| Germany | 15 | 0.4% |
| Italy | 23 | 0.6% |
| Southern Europe | 23 | 0.6% |
| Western Europe | 15 | 0.4% | View All 5 Rows |
Sex and Age in Irwin borough
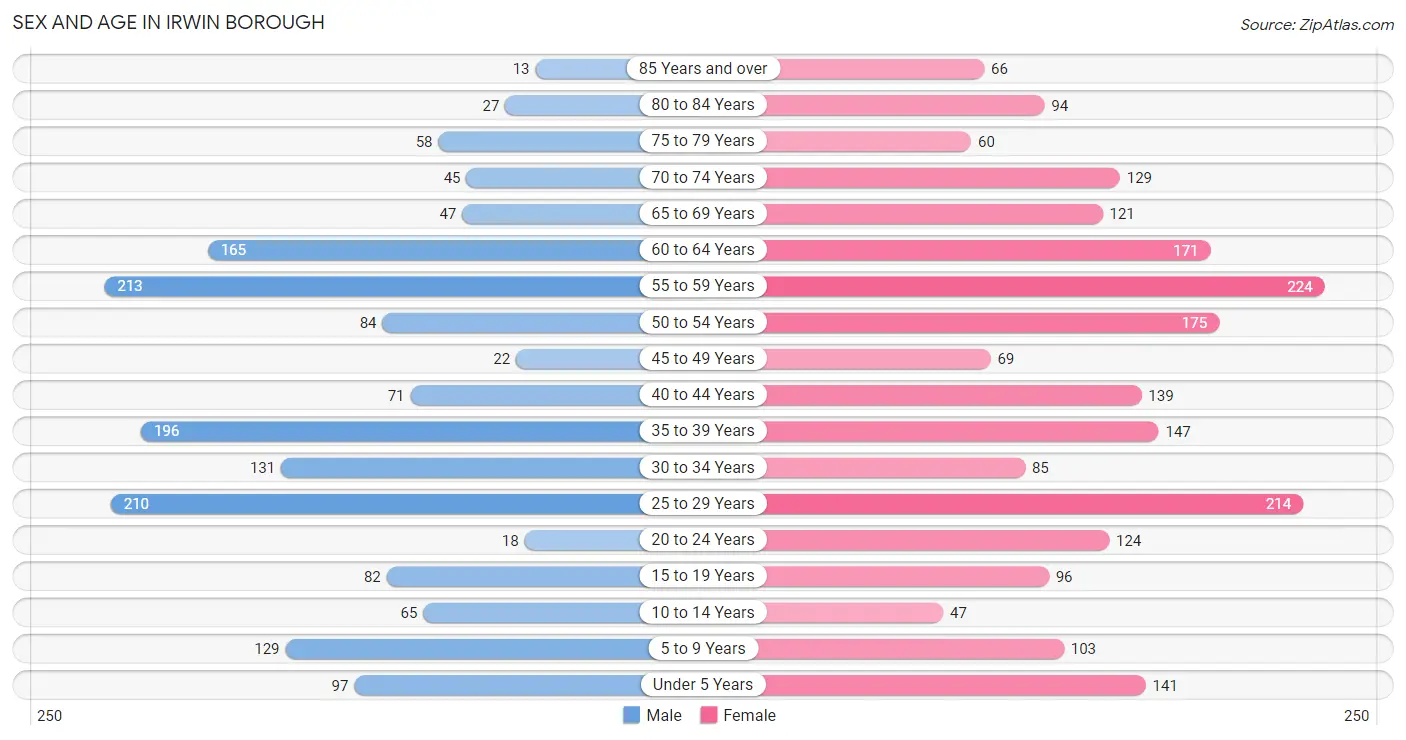
Sex and Age in Irwin borough
The most populous age groups in Irwin borough are 55 to 59 Years (213 | 12.7%) for men and 55 to 59 Years (224 | 10.2%) for women.
| Age Bracket | Male | Female |
| Under 5 Years | 97 (5.8%) | 141 (6.4%) |
| 5 to 9 Years | 129 (7.7%) | 103 (4.7%) |
| 10 to 14 Years | 65 (3.9%) | 47 (2.1%) |
| 15 to 19 Years | 82 (4.9%) | 96 (4.3%) |
| 20 to 24 Years | 18 (1.1%) | 124 (5.6%) |
| 25 to 29 Years | 210 (12.6%) | 214 (9.7%) |
| 30 to 34 Years | 131 (7.8%) | 85 (3.8%) |
| 35 to 39 Years | 196 (11.7%) | 147 (6.7%) |
| 40 to 44 Years | 71 (4.2%) | 139 (6.3%) |
| 45 to 49 Years | 22 (1.3%) | 69 (3.1%) |
| 50 to 54 Years | 84 (5.0%) | 175 (7.9%) |
| 55 to 59 Years | 213 (12.7%) | 224 (10.2%) |
| 60 to 64 Years | 165 (9.9%) | 171 (7.8%) |
| 65 to 69 Years | 47 (2.8%) | 121 (5.5%) |
| 70 to 74 Years | 45 (2.7%) | 129 (5.9%) |
| 75 to 79 Years | 58 (3.5%) | 60 (2.7%) |
| 80 to 84 Years | 27 (1.6%) | 94 (4.3%) |
| 85 Years and over | 13 (0.8%) | 66 (3.0%) |
| Total | 1,673 (100.0%) | 2,205 (100.0%) |
Families and Households in Irwin borough
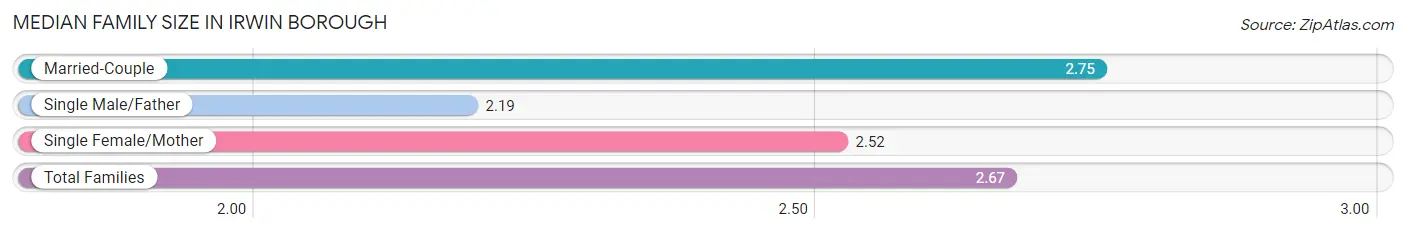
Median Family Size in Irwin borough
The median family size in Irwin borough is 2.67 persons per family, with married-couple families (593 | 67.0%) accounting for the largest median family size of 2.75 persons per family. On the other hand, single male/father families (16 | 1.8%) represent the smallest median family size with 2.19 persons per family.
| Family Type | # Families | Family Size |
| Married-Couple | 593 (67.0%) | 2.75 |
| Single Male/Father | 16 (1.8%) | 2.19 |
| Single Female/Mother | 276 (31.2%) | 2.52 |
| Total Families | 885 (100.0%) | 2.67 |
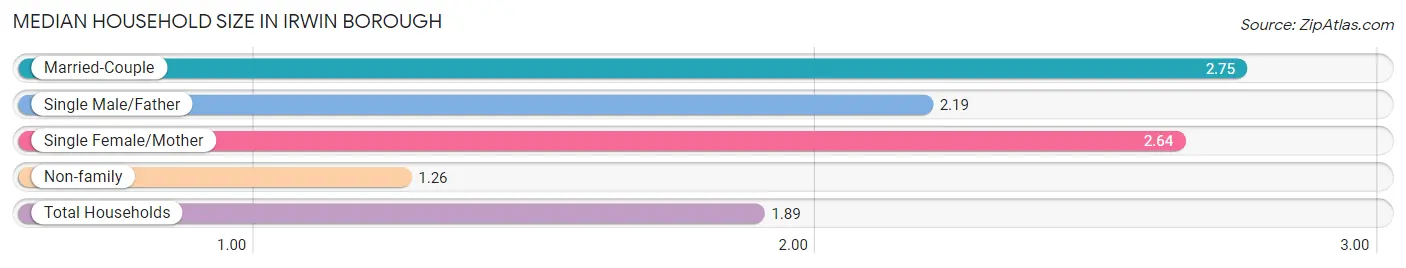
Median Household Size in Irwin borough
The median household size in Irwin borough is 1.89 persons per household, with married-couple households (593 | 29.0%) accounting for the largest median household size of 2.75 persons per household. non-family households (1,161 | 56.7%) represent the smallest median household size with 1.26 persons per household.
| Household Type | # Households | Household Size |
| Married-Couple | 593 (29.0%) | 2.75 |
| Single Male/Father | 16 (0.8%) | 2.19 |
| Single Female/Mother | 276 (13.5%) | 2.64 |
| Non-family | 1,161 (56.7%) | 1.26 |
| Total Households | 2,046 (100.0%) | 1.89 |
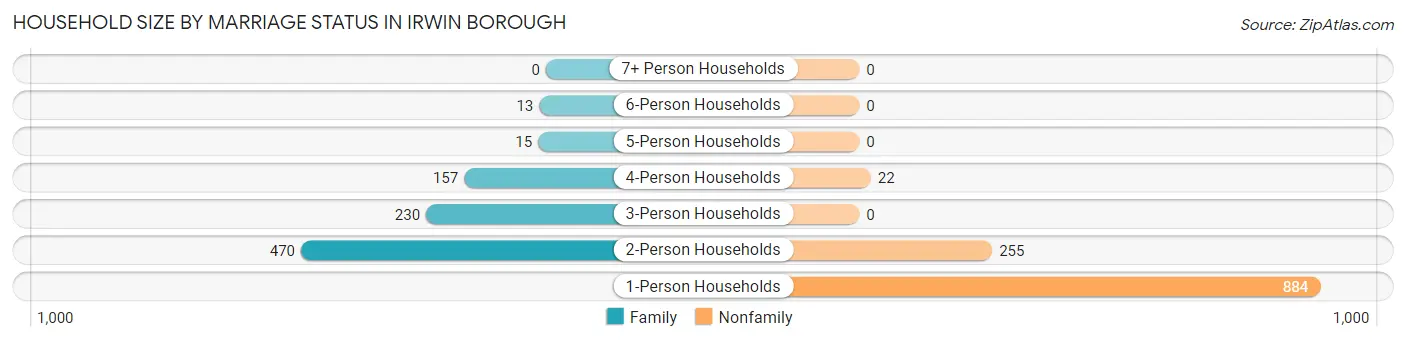
Household Size by Marriage Status in Irwin borough
Out of a total of 2,046 households in Irwin borough, 885 (43.3%) are family households, while 1,161 (56.7%) are nonfamily households. The most numerous type of family households are 2-person households, comprising 470, and the most common type of nonfamily households are 1-person households, comprising 884.
| Household Size | Family Households | Nonfamily Households |
| 1-Person Households | - | 884 (43.2%) |
| 2-Person Households | 470 (23.0%) | 255 (12.5%) |
| 3-Person Households | 230 (11.2%) | 0 (0.0%) |
| 4-Person Households | 157 (7.7%) | 22 (1.1%) |
| 5-Person Households | 15 (0.7%) | 0 (0.0%) |
| 6-Person Households | 13 (0.6%) | 0 (0.0%) |
| 7+ Person Households | 0 (0.0%) | 0 (0.0%) |
| Total | 885 (43.3%) | 1,161 (56.7%) |
Female Fertility in Irwin borough
Fertility by Age in Irwin borough
Average fertility rate in Irwin borough is 17.0 births per 1,000 women. Women in the age bracket of 20 to 34 years have the highest fertility rate with 35.0 births per 1,000 women. Women in the age bracket of 20 to 34 years acount for 100.0% of all women with births.
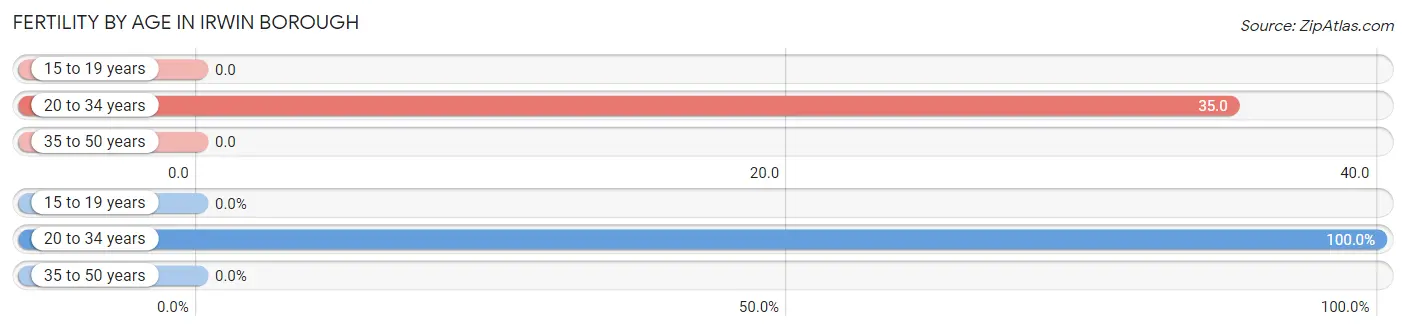
| Age Bracket | Women with Births | Births / 1,000 Women |
| 15 to 19 years | 0 (0.0%) | 0.0 |
| 20 to 34 years | 15 (100.0%) | 35.0 |
| 35 to 50 years | 0 (0.0%) | 0.0 |
| Total | 15 (100.0%) | 17.0 |
Fertility by Age by Marriage Status in Irwin borough
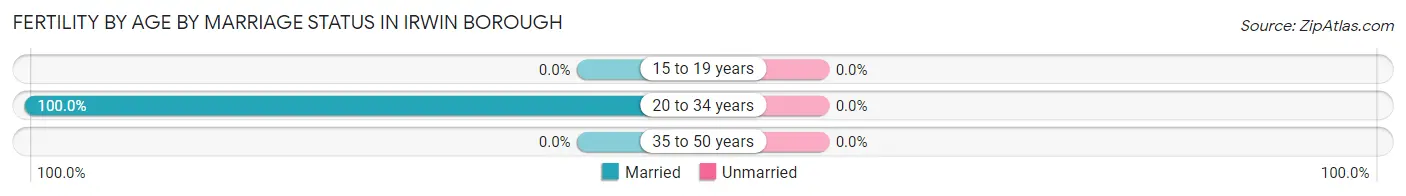
| Age Bracket | Married | Unmarried |
| 15 to 19 years | 0 (0.0%) | 0 (0.0%) |
| 20 to 34 years | 15 (100.0%) | 0 (0.0%) |
| 35 to 50 years | 0 (0.0%) | 0 (0.0%) |
| Total | 15 (100.0%) | 0 (0.0%) |
Fertility by Education in Irwin borough
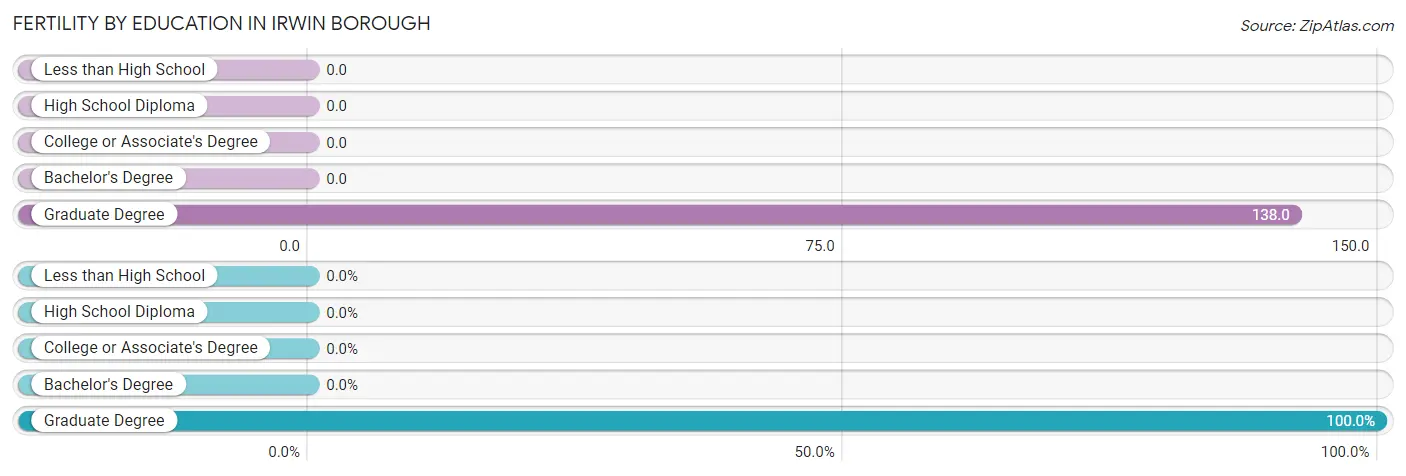
| Educational Attainment | Women with Births | Births / 1,000 Women |
| Less than High School | 0 (0.0%) | 0.0 |
| High School Diploma | 0 (0.0%) | 0.0 |
| College or Associate's Degree | 0 (0.0%) | 0.0 |
| Bachelor's Degree | 0 (0.0%) | 0.0 |
| Graduate Degree | 15 (100.0%) | 138.0 |
| Total | 15 (100.0%) | 17.0 |
Fertility by Education by Marriage Status in Irwin borough
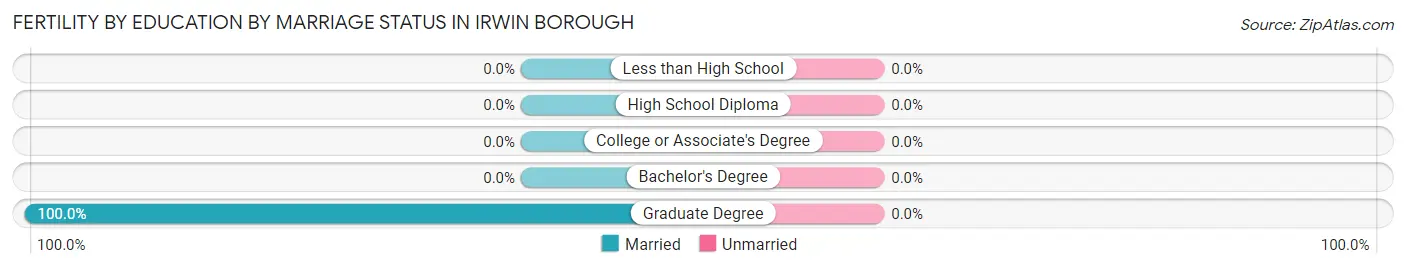
| Educational Attainment | Married | Unmarried |
| Less than High School | 0 (0.0%) | 0 (0.0%) |
| High School Diploma | 0 (0.0%) | 0 (0.0%) |
| College or Associate's Degree | 0 (0.0%) | 0 (0.0%) |
| Bachelor's Degree | 0 (0.0%) | 0 (0.0%) |
| Graduate Degree | 15 (100.0%) | 0 (0.0%) |
| Total | 15 (100.0%) | 0 (0.0%) |
Employment Characteristics in Irwin borough
Employment by Class of Employer in Irwin borough
Among the 2,090 employed individuals in Irwin borough, private company employees (1,430 | 68.4%), not-for-profit organizations (327 | 15.7%), and local government employees (125 | 6.0%) make up the most common classes of employment.
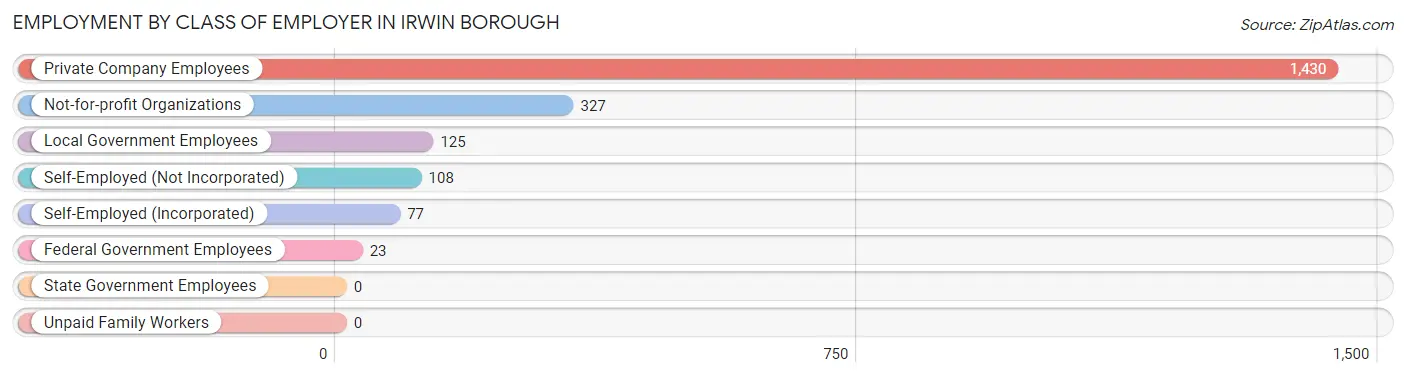
| Employer Class | # Employees | % Employees |
| Private Company Employees | 1,430 | 68.4% |
| Self-Employed (Incorporated) | 77 | 3.7% |
| Self-Employed (Not Incorporated) | 108 | 5.2% |
| Not-for-profit Organizations | 327 | 15.7% |
| Local Government Employees | 125 | 6.0% |
| State Government Employees | 0 | 0.0% |
| Federal Government Employees | 23 | 1.1% |
| Unpaid Family Workers | 0 | 0.0% |
| Total | 2,090 | 100.0% |
Employment Status by Age in Irwin borough
According to the labor force statistics for Irwin borough, out of the total population over 16 years of age (3,254), 69.9% or 2,275 individuals are in the labor force, with 4.7% or 107 of them unemployed. The age group with the highest labor force participation rate is 20 to 24 years, with 100.0% or 142 individuals in the labor force. Within the labor force, the 45 to 54 years age range has the highest percentage of unemployed individuals, with 24.2% or 80 of them being unemployed.
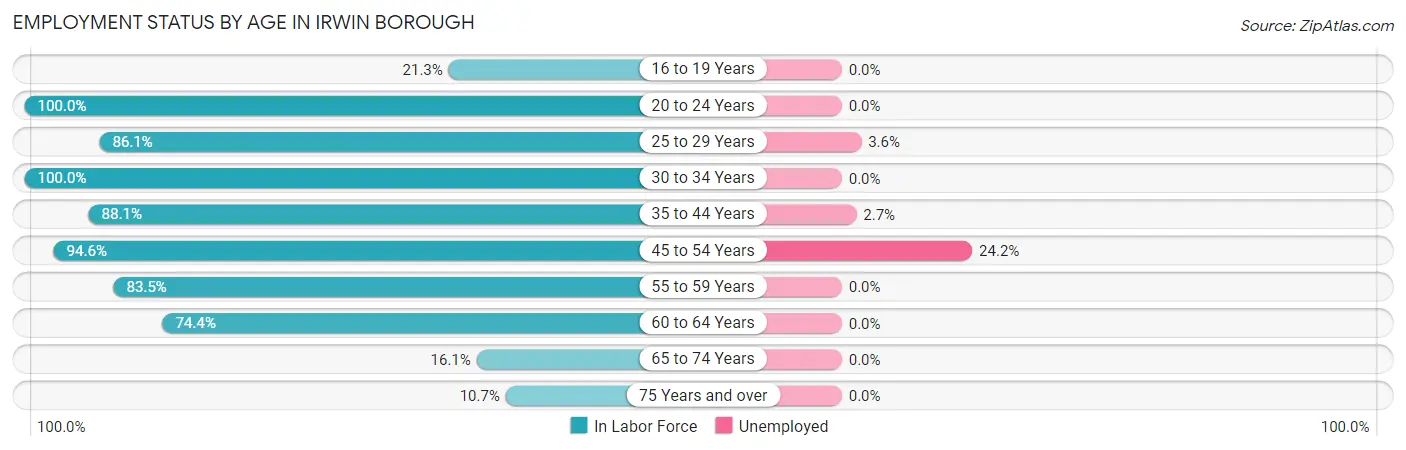
| Age Bracket | In Labor Force | Unemployed |
| 16 to 19 Years | 29 (21.3%) | 0 (0.0%) |
| 20 to 24 Years | 142 (100.0%) | 0 (0.0%) |
| 25 to 29 Years | 365 (86.1%) | 13 (3.6%) |
| 30 to 34 Years | 216 (100.0%) | 0 (0.0%) |
| 35 to 44 Years | 487 (88.1%) | 13 (2.7%) |
| 45 to 54 Years | 331 (94.6%) | 80 (24.2%) |
| 55 to 59 Years | 365 (83.5%) | 0 (0.0%) |
| 60 to 64 Years | 250 (74.4%) | 0 (0.0%) |
| 65 to 74 Years | 55 (16.1%) | 0 (0.0%) |
| 75 Years and over | 34 (10.7%) | 0 (0.0%) |
| Total | 2,275 (69.9%) | 107 (4.7%) |
Employment Status by Educational Attainment in Irwin borough
According to labor force statistics for Irwin borough, 87.0% of individuals (2,015) out of the total population between 25 and 64 years of age (2,316) are in the labor force, with 5.3% or 107 of them being unemployed. The group with the highest labor force participation rate are those with the educational attainment of less than high school, with 100.0% or 23 individuals in the labor force. Within the labor force, individuals with bachelor's degree or higher education have the highest percentage of unemployment, with 9.8% or 93 of them being unemployed.
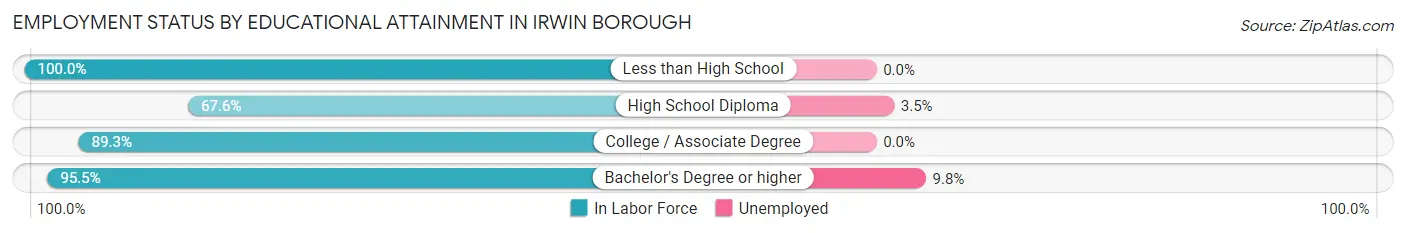
| Educational Attainment | In Labor Force | Unemployed |
| Less than High School | 23 (100.0%) | 0 (0.0%) |
| High School Diploma | 370 (67.6%) | 19 (3.5%) |
| College / Associate Degree | 670 (89.3%) | 0 (0.0%) |
| Bachelor's Degree or higher | 951 (95.5%) | 98 (9.8%) |
| Total | 2,015 (87.0%) | 123 (5.3%) |
Employment Occupations by Sex in Irwin borough
Management, Business, Science and Arts Occupations
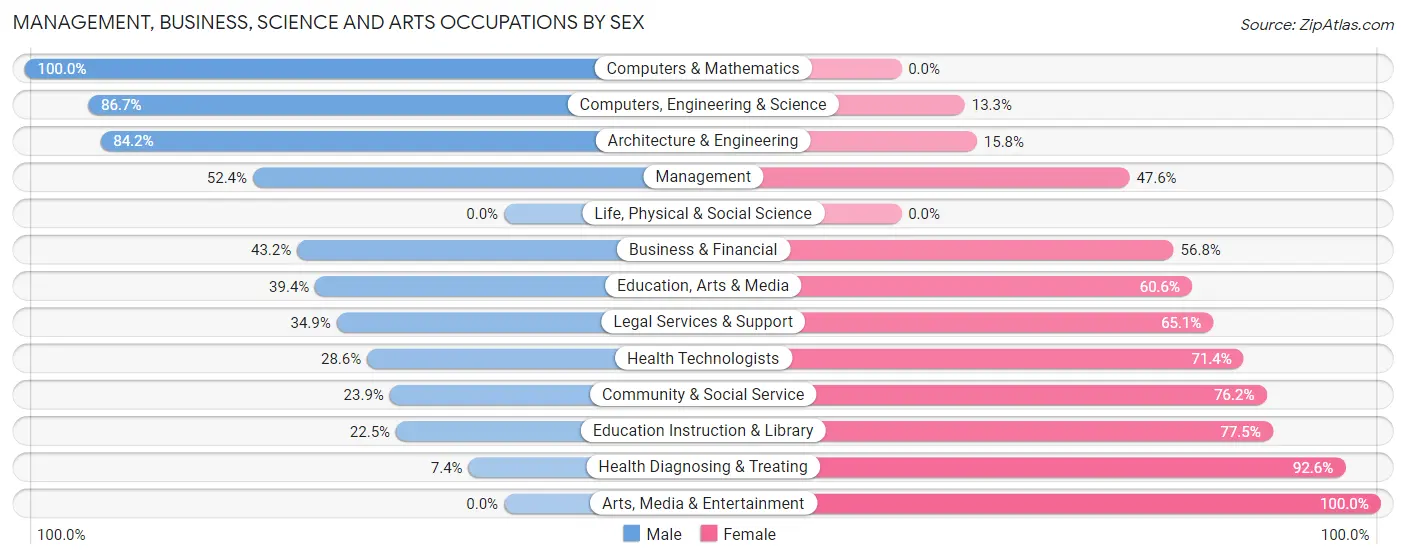
The most common Management, Business, Science and Arts occupations in Irwin borough are Community & Social Service (524 | 24.2%), Education Instruction & Library (284 | 13.1%), Management (189 | 8.7%), Health Diagnosing & Treating (135 | 6.2%), and Computers, Engineering & Science (113 | 5.2%).
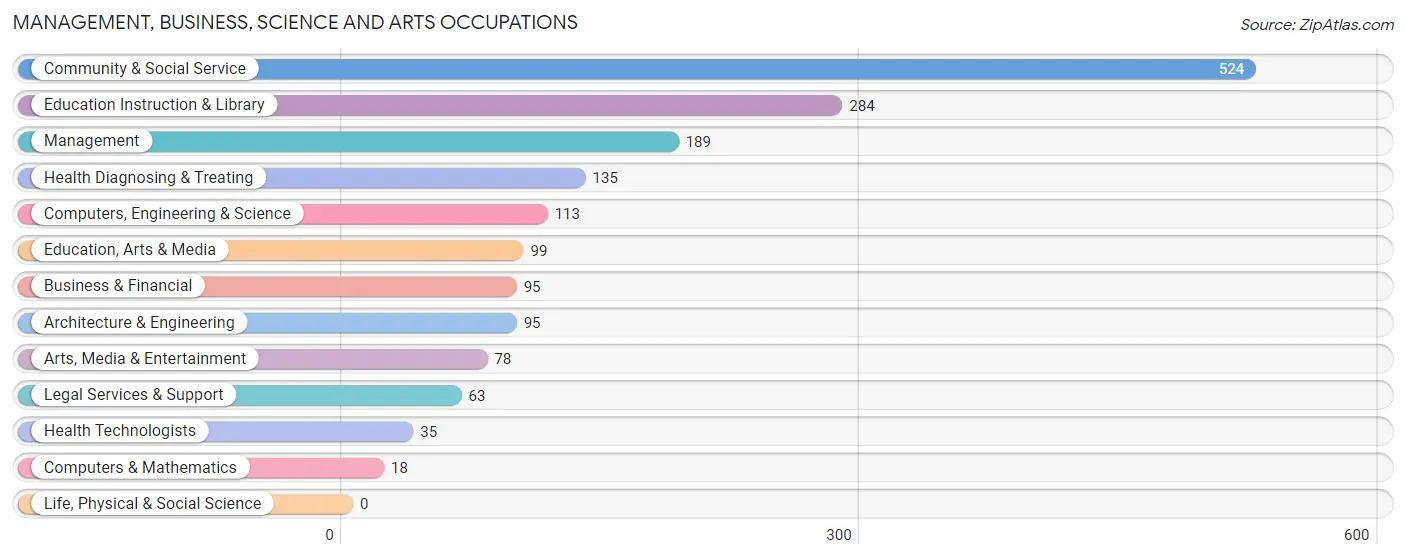
Management, Business, Science and Arts Occupations by Sex
Within the Management, Business, Science and Arts occupations in Irwin borough, the most male-oriented occupations are Computers & Mathematics (100.0%), Computers, Engineering & Science (86.7%), and Architecture & Engineering (84.2%), while the most female-oriented occupations are Arts, Media & Entertainment (100.0%), Health Diagnosing & Treating (92.6%), and Education Instruction & Library (77.5%).
| Occupation | Male | Female |
| Management | 99 (52.4%) | 90 (47.6%) |
| Business & Financial | 41 (43.2%) | 54 (56.8%) |
| Computers, Engineering & Science | 98 (86.7%) | 15 (13.3%) |
| Computers & Mathematics | 18 (100.0%) | 0 (0.0%) |
| Architecture & Engineering | 80 (84.2%) | 15 (15.8%) |
| Life, Physical & Social Science | 0 (0.0%) | 0 (0.0%) |
| Community & Social Service | 125 (23.8%) | 399 (76.1%) |
| Education, Arts & Media | 39 (39.4%) | 60 (60.6%) |
| Legal Services & Support | 22 (34.9%) | 41 (65.1%) |
| Education Instruction & Library | 64 (22.5%) | 220 (77.5%) |
| Arts, Media & Entertainment | 0 (0.0%) | 78 (100.0%) |
| Health Diagnosing & Treating | 10 (7.4%) | 125 (92.6%) |
| Health Technologists | 10 (28.6%) | 25 (71.4%) |
| Total (Category) | 373 (35.3%) | 683 (64.7%) |
| Total (Overall) | 996 (45.9%) | 1,172 (54.1%) |
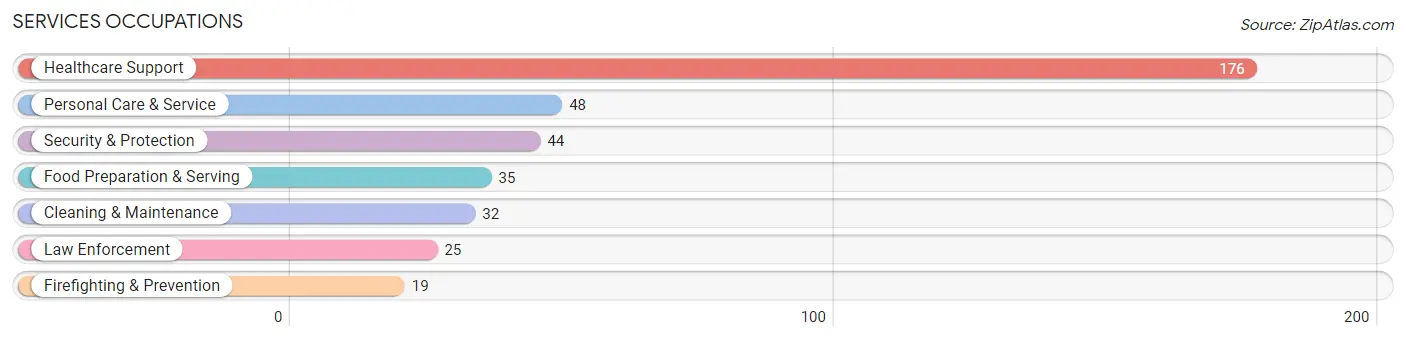
Services Occupations
The most common Services occupations in Irwin borough are Healthcare Support (176 | 8.1%), Personal Care & Service (48 | 2.2%), Security & Protection (44 | 2.0%), Food Preparation & Serving (35 | 1.6%), and Cleaning & Maintenance (32 | 1.5%).
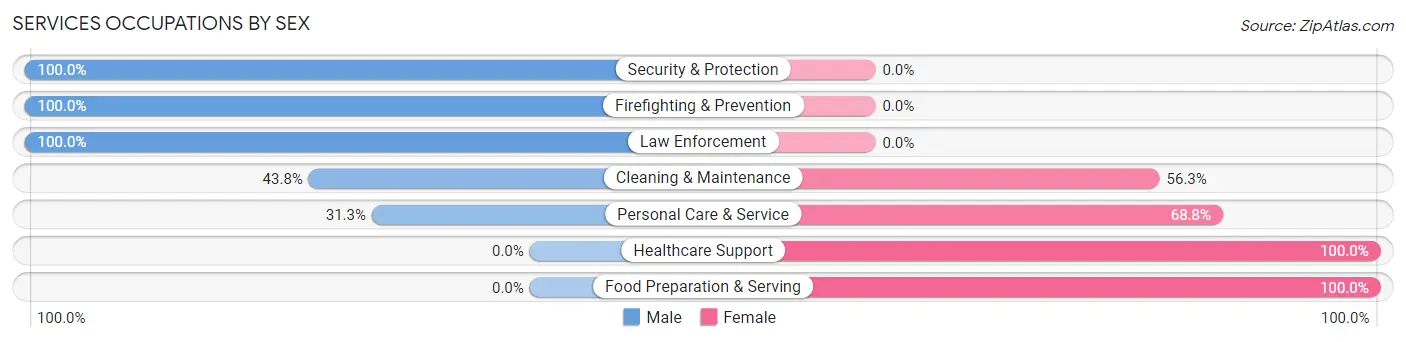
Services Occupations by Sex
Within the Services occupations in Irwin borough, the most male-oriented occupations are Security & Protection (100.0%), Firefighting & Prevention (100.0%), and Law Enforcement (100.0%), while the most female-oriented occupations are Healthcare Support (100.0%), Food Preparation & Serving (100.0%), and Personal Care & Service (68.8%).
| Occupation | Male | Female |
| Healthcare Support | 0 (0.0%) | 176 (100.0%) |
| Security & Protection | 44 (100.0%) | 0 (0.0%) |
| Firefighting & Prevention | 19 (100.0%) | 0 (0.0%) |
| Law Enforcement | 25 (100.0%) | 0 (0.0%) |
| Food Preparation & Serving | 0 (0.0%) | 35 (100.0%) |
| Cleaning & Maintenance | 14 (43.8%) | 18 (56.2%) |
| Personal Care & Service | 15 (31.2%) | 33 (68.8%) |
| Total (Category) | 73 (21.8%) | 262 (78.2%) |
| Total (Overall) | 996 (45.9%) | 1,172 (54.1%) |
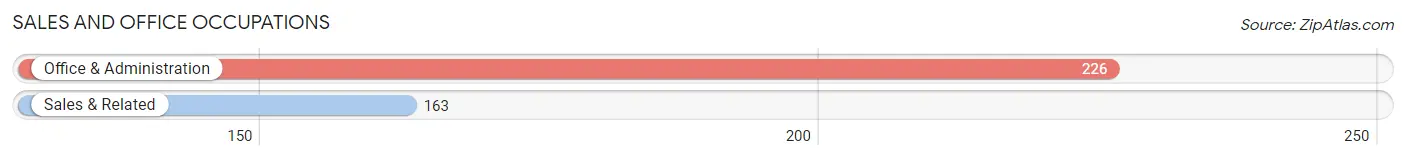
Sales and Office Occupations
The most common Sales and Office occupations in Irwin borough are Office & Administration (226 | 10.4%), and Sales & Related (163 | 7.5%).
Sales and Office Occupations by Sex
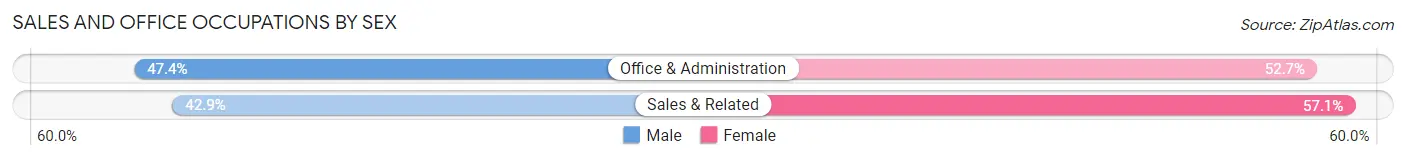
| Occupation | Male | Female |
| Sales & Related | 70 (42.9%) | 93 (57.1%) |
| Office & Administration | 107 (47.3%) | 119 (52.6%) |
| Total (Category) | 177 (45.5%) | 212 (54.5%) |
| Total (Overall) | 996 (45.9%) | 1,172 (54.1%) |
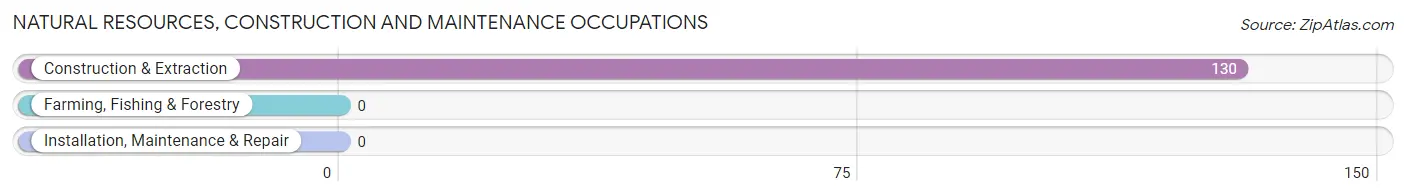
Natural Resources, Construction and Maintenance Occupations
The most common Natural Resources, Construction and Maintenance occupations in Irwin borough are , and Construction & Extraction (130 | 6.0%).
Natural Resources, Construction and Maintenance Occupations by Sex
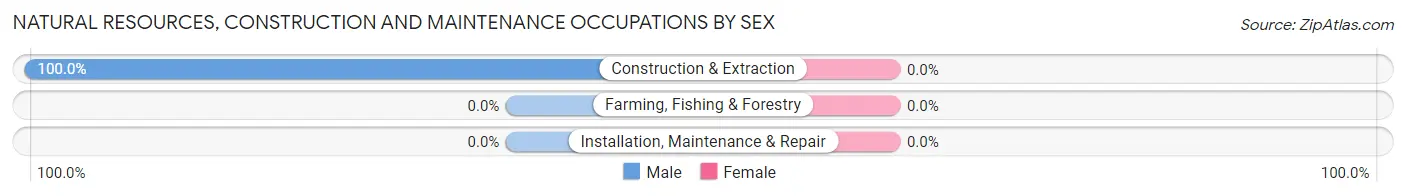
| Occupation | Male | Female |
| Farming, Fishing & Forestry | 0 (0.0%) | 0 (0.0%) |
| Construction & Extraction | 130 (100.0%) | 0 (0.0%) |
| Installation, Maintenance & Repair | 0 (0.0%) | 0 (0.0%) |
| Total (Category) | 130 (100.0%) | 0 (0.0%) |
| Total (Overall) | 996 (45.9%) | 1,172 (54.1%) |
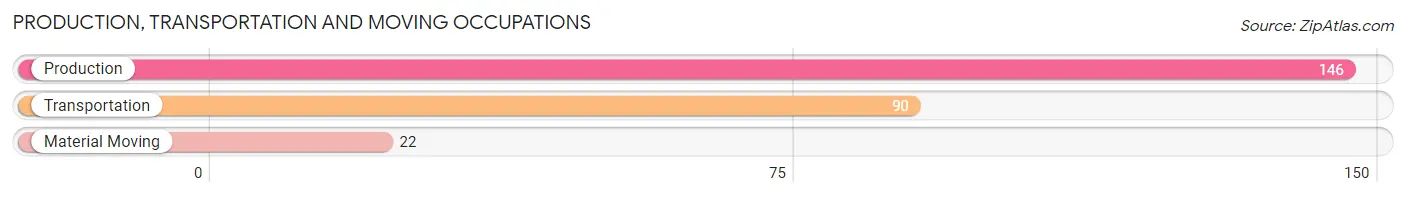
Production, Transportation and Moving Occupations
The most common Production, Transportation and Moving occupations in Irwin borough are Production (146 | 6.7%), Transportation (90 | 4.2%), and Material Moving (22 | 1.0%).
Production, Transportation and Moving Occupations by Sex
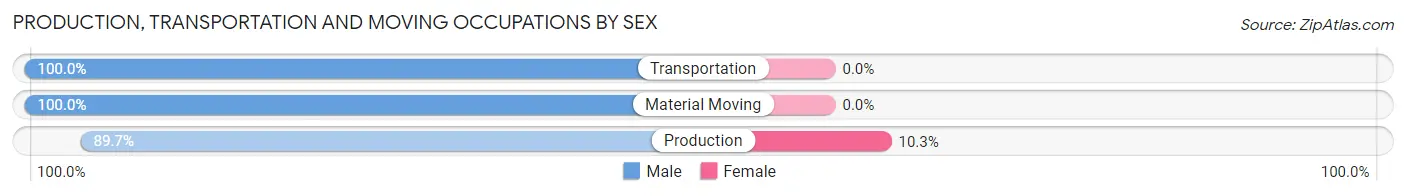
| Occupation | Male | Female |
| Production | 131 (89.7%) | 15 (10.3%) |
| Transportation | 90 (100.0%) | 0 (0.0%) |
| Material Moving | 22 (100.0%) | 0 (0.0%) |
| Total (Category) | 243 (94.2%) | 15 (5.8%) |
| Total (Overall) | 996 (45.9%) | 1,172 (54.1%) |
Employment Industries by Sex in Irwin borough
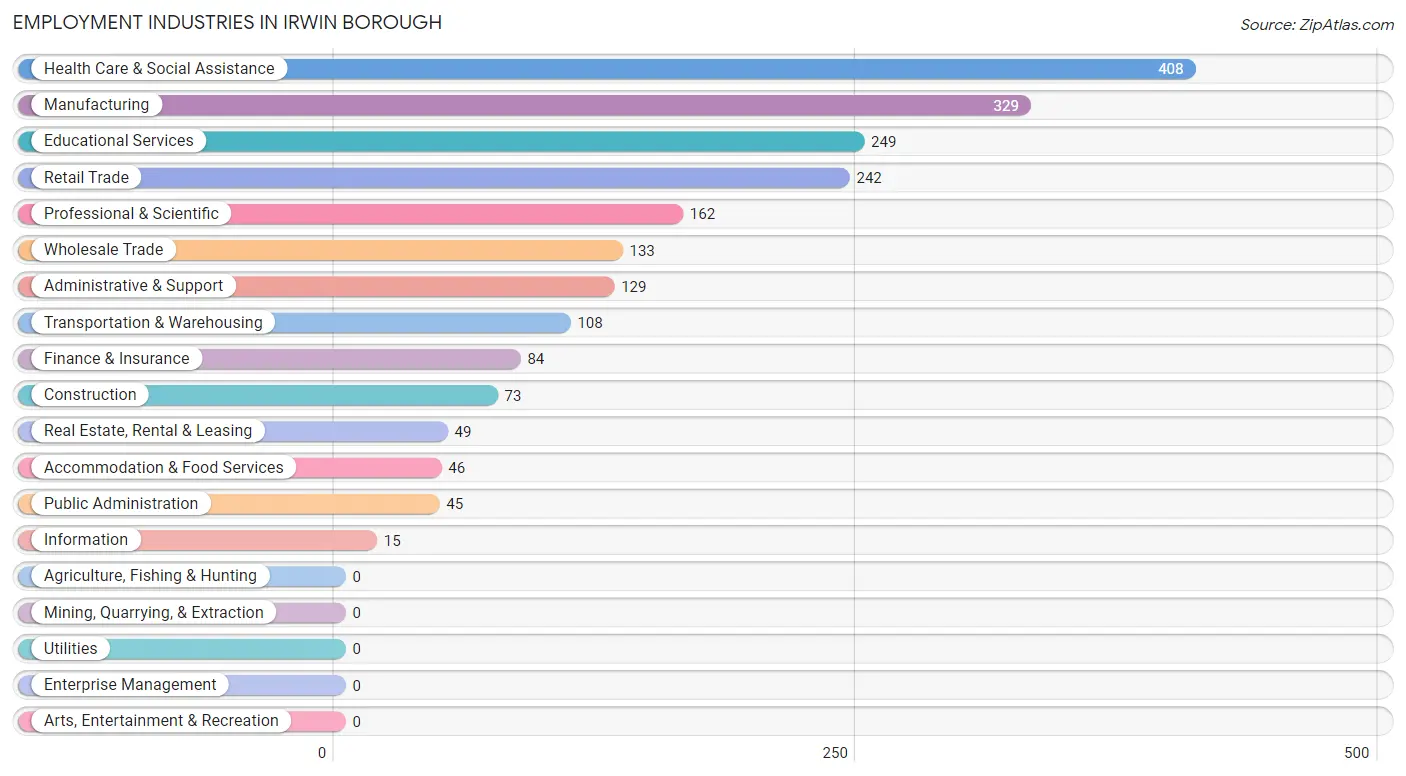
Employment Industries in Irwin borough
The major employment industries in Irwin borough include Health Care & Social Assistance (408 | 18.8%), Manufacturing (329 | 15.2%), Educational Services (249 | 11.5%), Retail Trade (242 | 11.2%), and Professional & Scientific (162 | 7.5%).
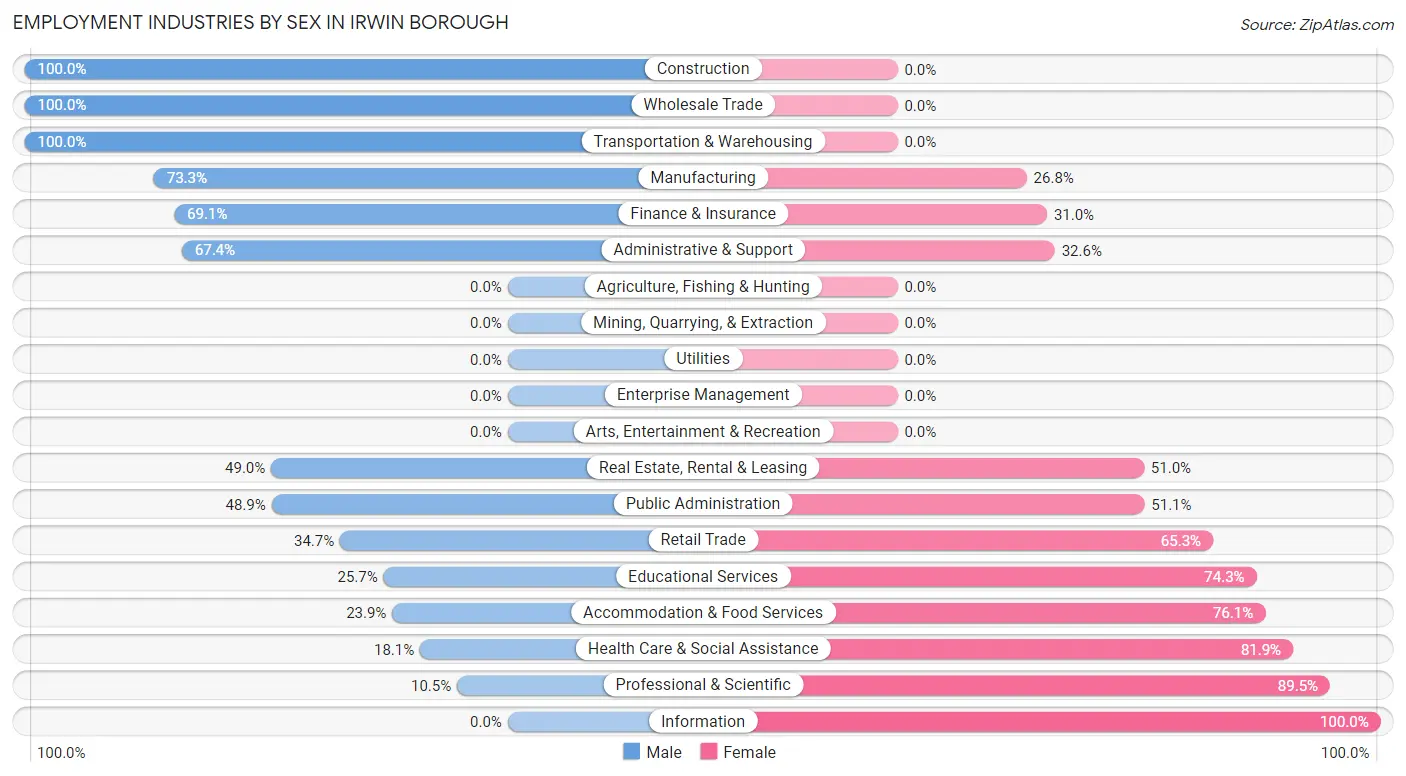
Employment Industries by Sex in Irwin borough
The Irwin borough industries that see more men than women are Construction (100.0%), Wholesale Trade (100.0%), and Transportation & Warehousing (100.0%), whereas the industries that tend to have a higher number of women are Information (100.0%), Professional & Scientific (89.5%), and Health Care & Social Assistance (81.9%).
| Industry | Male | Female |
| Agriculture, Fishing & Hunting | 0 (0.0%) | 0 (0.0%) |
| Mining, Quarrying, & Extraction | 0 (0.0%) | 0 (0.0%) |
| Construction | 73 (100.0%) | 0 (0.0%) |
| Manufacturing | 241 (73.3%) | 88 (26.8%) |
| Wholesale Trade | 133 (100.0%) | 0 (0.0%) |
| Retail Trade | 84 (34.7%) | 158 (65.3%) |
| Transportation & Warehousing | 108 (100.0%) | 0 (0.0%) |
| Utilities | 0 (0.0%) | 0 (0.0%) |
| Information | 0 (0.0%) | 15 (100.0%) |
| Finance & Insurance | 58 (69.1%) | 26 (30.9%) |
| Real Estate, Rental & Leasing | 24 (49.0%) | 25 (51.0%) |
| Professional & Scientific | 17 (10.5%) | 145 (89.5%) |
| Enterprise Management | 0 (0.0%) | 0 (0.0%) |
| Administrative & Support | 87 (67.4%) | 42 (32.6%) |
| Educational Services | 64 (25.7%) | 185 (74.3%) |
| Health Care & Social Assistance | 74 (18.1%) | 334 (81.9%) |
| Arts, Entertainment & Recreation | 0 (0.0%) | 0 (0.0%) |
| Accommodation & Food Services | 11 (23.9%) | 35 (76.1%) |
| Public Administration | 22 (48.9%) | 23 (51.1%) |
| Total | 996 (45.9%) | 1,172 (54.1%) |
Education in Irwin borough
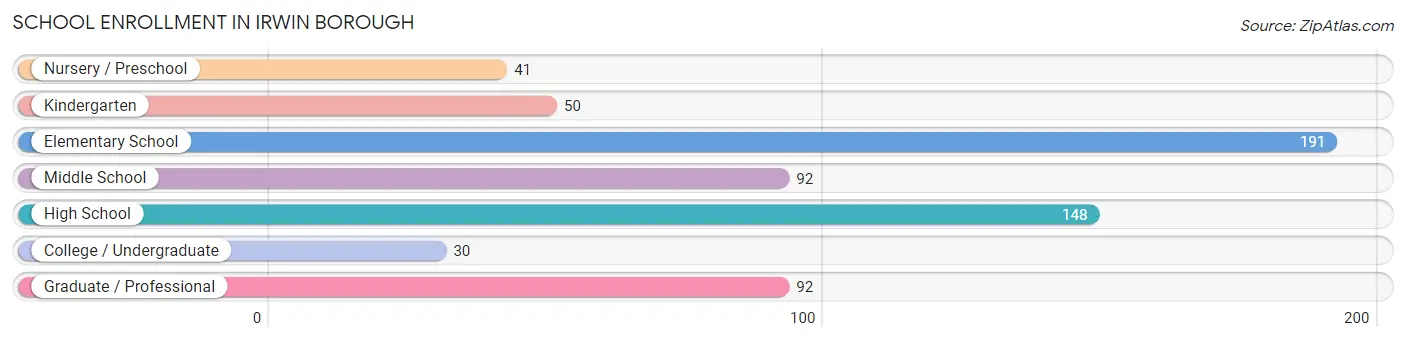
School Enrollment in Irwin borough
The most common levels of schooling among the 644 students in Irwin borough are elementary school (191 | 29.7%), high school (148 | 23.0%), and middle school (92 | 14.3%).
| School Level | # Students | % Students |
| Nursery / Preschool | 41 | 6.4% |
| Kindergarten | 50 | 7.8% |
| Elementary School | 191 | 29.7% |
| Middle School | 92 | 14.3% |
| High School | 148 | 23.0% |
| College / Undergraduate | 30 | 4.7% |
| Graduate / Professional | 92 | 14.3% |
| Total | 644 | 100.0% |
School Enrollment by Age by Funding Source in Irwin borough
Out of a total of 644 students who are enrolled in schools in Irwin borough, 74 (11.5%) attend a private institution, while the remaining 570 (88.5%) are enrolled in public schools. The age group of 35 years and over has the highest likelihood of being enrolled in private schools, with 74 (100.0% in the age bracket) enrolled. Conversely, the age group of 3 to 4 year olds has the lowest likelihood of being enrolled in a private school, with 30 (100.0% in the age bracket) attending a public institution.
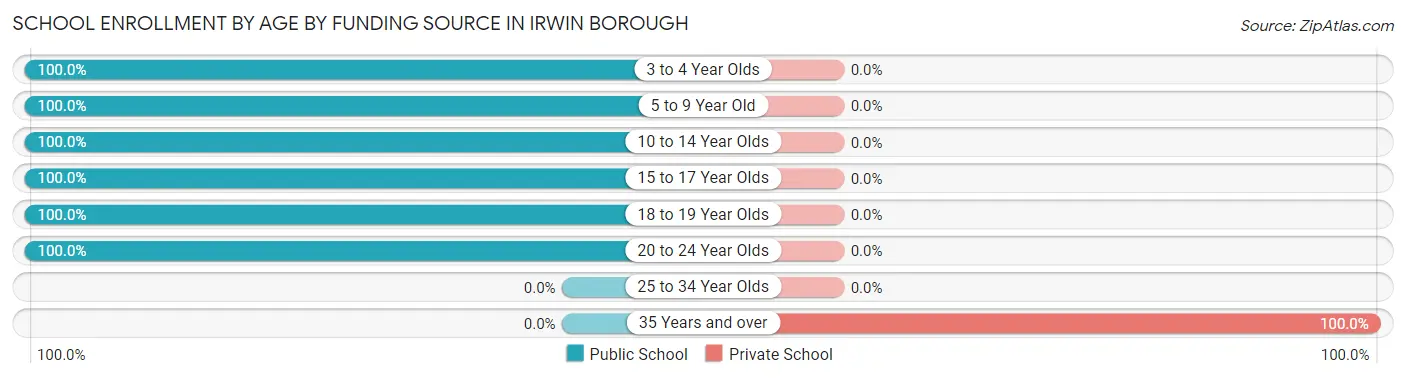
| Age Bracket | Public School | Private School |
| 3 to 4 Year Olds | 30 (100.0%) | 0 (0.0%) |
| 5 to 9 Year Old | 232 (100.0%) | 0 (0.0%) |
| 10 to 14 Year Olds | 112 (100.0%) | 0 (0.0%) |
| 15 to 17 Year Olds | 148 (100.0%) | 0 (0.0%) |
| 18 to 19 Year Olds | 30 (100.0%) | 0 (0.0%) |
| 20 to 24 Year Olds | 18 (100.0%) | 0 (0.0%) |
| 25 to 34 Year Olds | 0 (0.0%) | 0 (0.0%) |
| 35 Years and over | 0 (0.0%) | 74 (100.0%) |
| Total | 570 (88.5%) | 74 (11.5%) |
Educational Attainment by Field of Study in Irwin borough
Science & technology (197 | 16.2%), social sciences (174 | 14.3%), engineering (158 | 13.0%), education (130 | 10.7%), and psychology (127 | 10.4%) are the most common fields of study among 1,217 individuals in Irwin borough who have obtained a bachelor's degree or higher.
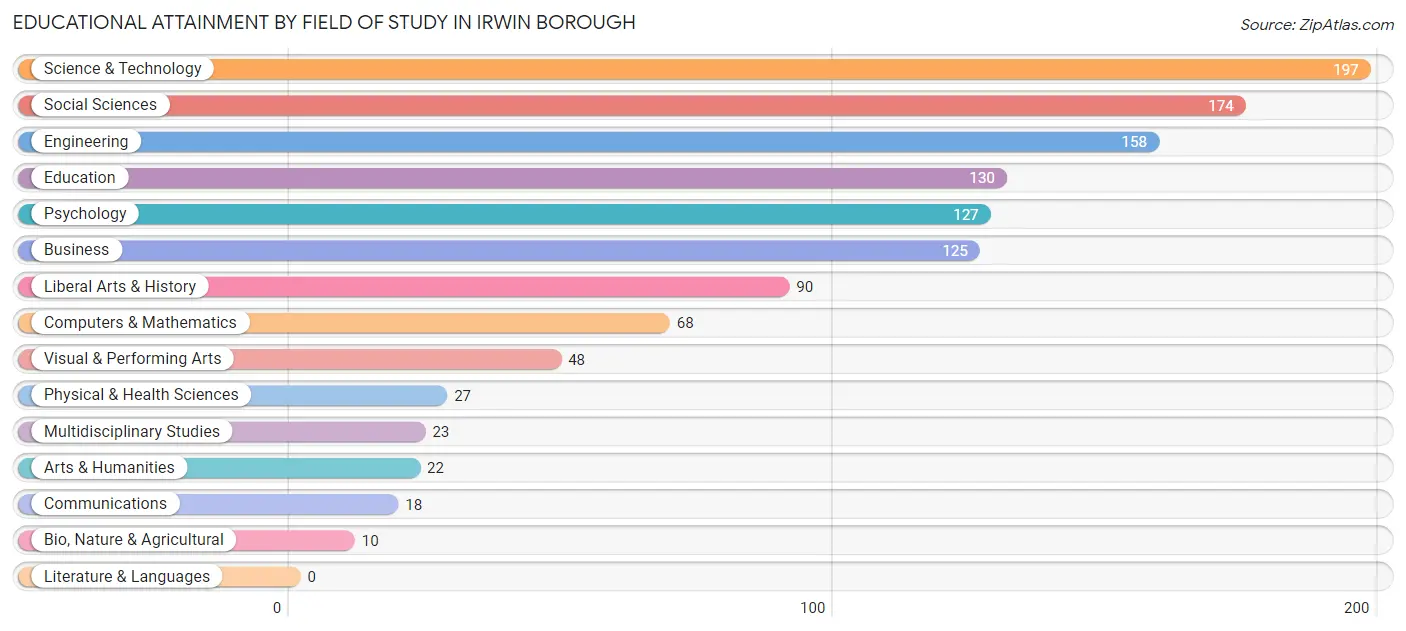
| Field of Study | # Graduates | % Graduates |
| Computers & Mathematics | 68 | 5.6% |
| Bio, Nature & Agricultural | 10 | 0.8% |
| Physical & Health Sciences | 27 | 2.2% |
| Psychology | 127 | 10.4% |
| Social Sciences | 174 | 14.3% |
| Engineering | 158 | 13.0% |
| Multidisciplinary Studies | 23 | 1.9% |
| Science & Technology | 197 | 16.2% |
| Business | 125 | 10.3% |
| Education | 130 | 10.7% |
| Literature & Languages | 0 | 0.0% |
| Liberal Arts & History | 90 | 7.4% |
| Visual & Performing Arts | 48 | 3.9% |
| Communications | 18 | 1.5% |
| Arts & Humanities | 22 | 1.8% |
| Total | 1,217 | 100.0% |
Transportation & Commute in Irwin borough
Vehicle Availability by Sex in Irwin borough
The most prevalent vehicle ownership categories in Irwin borough are males with 2 vehicles (467, accounting for 48.6%) and females with 2 vehicles (504, making up 41.4%).
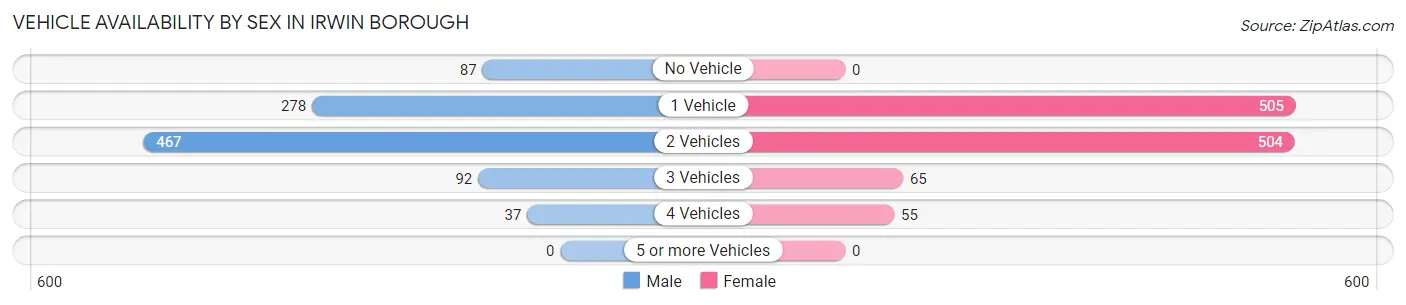
| Vehicles Available | Male | Female |
| No Vehicle | 87 (9.0%) | 0 (0.0%) |
| 1 Vehicle | 278 (28.9%) | 505 (44.7%) |
| 2 Vehicles | 467 (48.6%) | 504 (44.6%) |
| 3 Vehicles | 92 (9.6%) | 65 (5.8%) |
| 4 Vehicles | 37 (3.8%) | 55 (4.9%) |
| 5 or more Vehicles | 0 (0.0%) | 0 (0.0%) |
| Total | 961 (100.0%) | 1,129 (100.0%) |
Commute Time in Irwin borough
The most frequently occuring commute durations in Irwin borough are 20 to 24 minutes (323 commuters, 16.8%), 30 to 34 minutes (276 commuters, 14.4%), and 25 to 29 minutes (266 commuters, 13.9%).
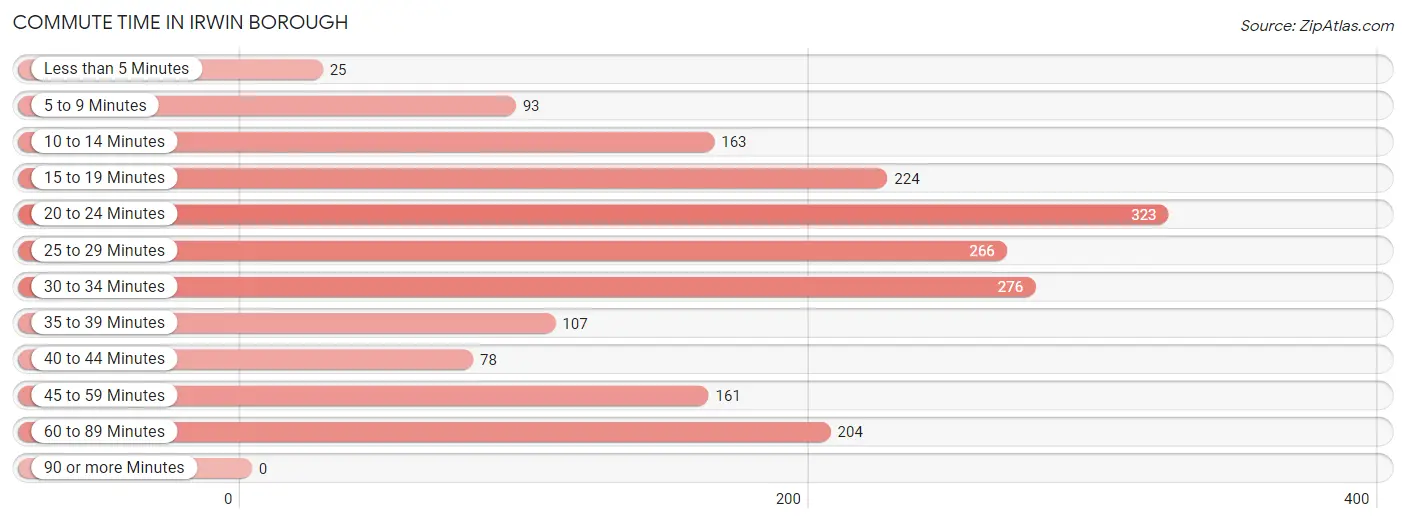
| Commute Time | # Commuters | % Commuters |
| Less than 5 Minutes | 25 | 1.3% |
| 5 to 9 Minutes | 93 | 4.8% |
| 10 to 14 Minutes | 163 | 8.5% |
| 15 to 19 Minutes | 224 | 11.7% |
| 20 to 24 Minutes | 323 | 16.8% |
| 25 to 29 Minutes | 266 | 13.9% |
| 30 to 34 Minutes | 276 | 14.4% |
| 35 to 39 Minutes | 107 | 5.6% |
| 40 to 44 Minutes | 78 | 4.1% |
| 45 to 59 Minutes | 161 | 8.4% |
| 60 to 89 Minutes | 204 | 10.6% |
| 90 or more Minutes | 0 | 0.0% |
Commute Time by Sex in Irwin borough
The most common commute times in Irwin borough are 20 to 24 minutes (198 commuters, 22.8%) for males and 25 to 29 minutes (204 commuters, 19.4%) for females.
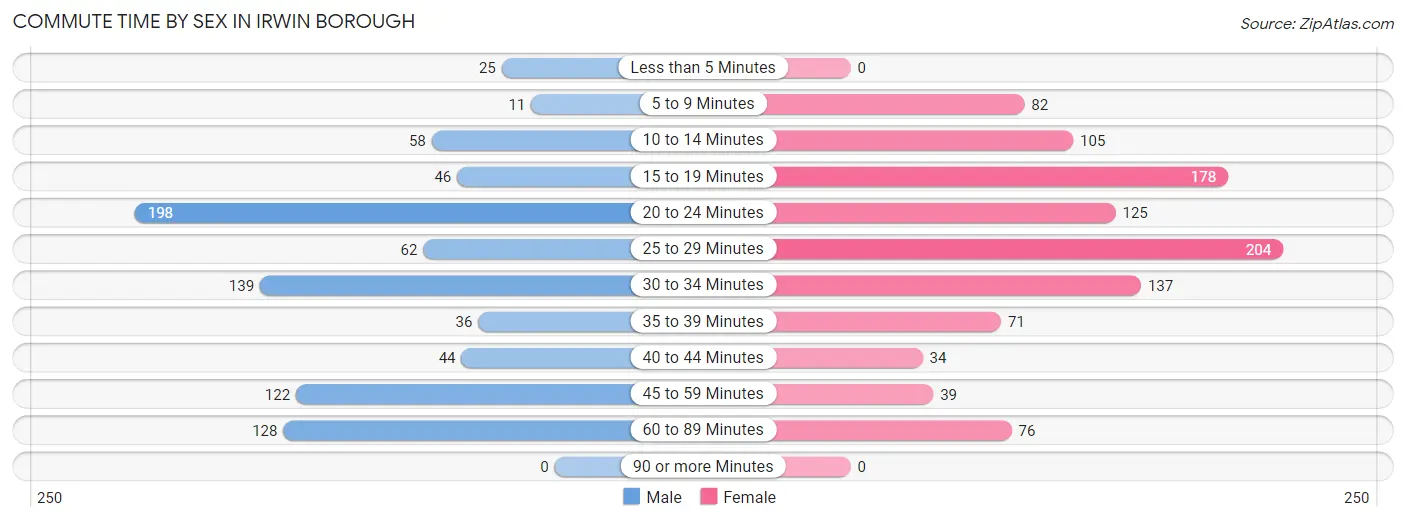
| Commute Time | Male | Female |
| Less than 5 Minutes | 25 (2.9%) | 0 (0.0%) |
| 5 to 9 Minutes | 11 (1.3%) | 82 (7.8%) |
| 10 to 14 Minutes | 58 (6.7%) | 105 (10.0%) |
| 15 to 19 Minutes | 46 (5.3%) | 178 (16.9%) |
| 20 to 24 Minutes | 198 (22.8%) | 125 (11.9%) |
| 25 to 29 Minutes | 62 (7.1%) | 204 (19.4%) |
| 30 to 34 Minutes | 139 (16.0%) | 137 (13.0%) |
| 35 to 39 Minutes | 36 (4.1%) | 71 (6.8%) |
| 40 to 44 Minutes | 44 (5.1%) | 34 (3.2%) |
| 45 to 59 Minutes | 122 (14.0%) | 39 (3.7%) |
| 60 to 89 Minutes | 128 (14.7%) | 76 (7.2%) |
| 90 or more Minutes | 0 (0.0%) | 0 (0.0%) |
Time of Departure to Work by Sex in Irwin borough
The most frequent times of departure to work in Irwin borough are 6:30 AM to 6:59 AM (126, 14.5%) for males and 7:30 AM to 7:59 AM (154, 14.6%) for females.
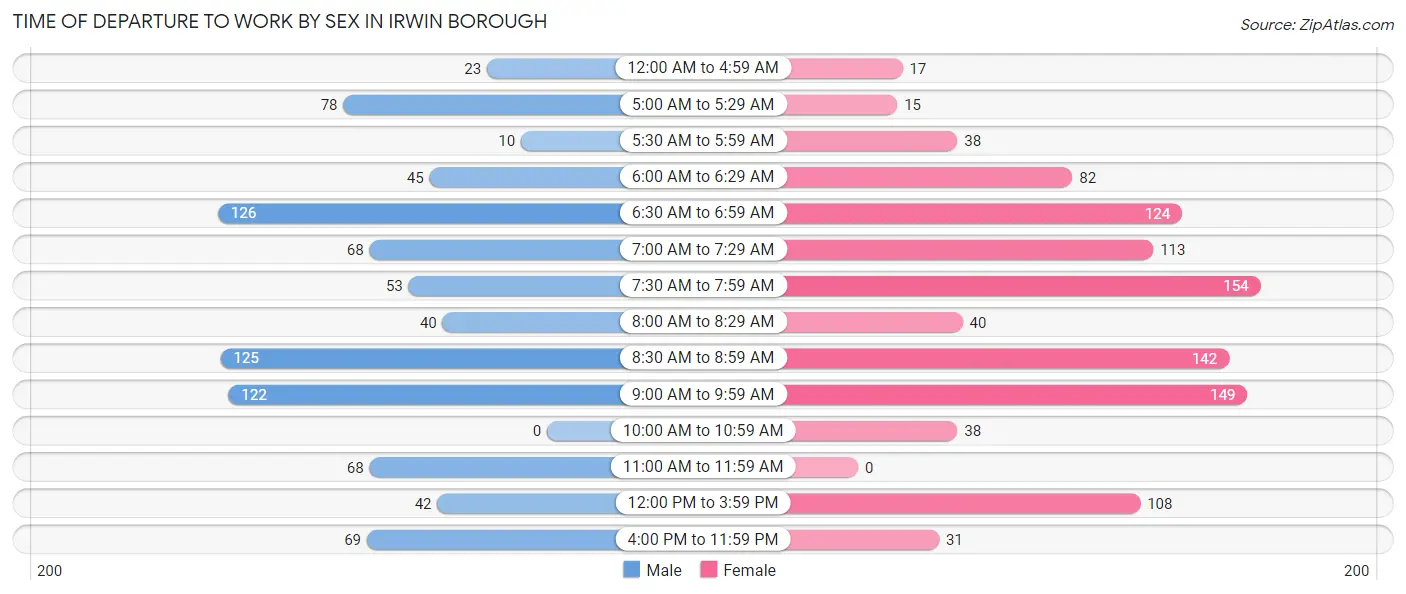
| Time of Departure | Male | Female |
| 12:00 AM to 4:59 AM | 23 (2.6%) | 17 (1.6%) |
| 5:00 AM to 5:29 AM | 78 (9.0%) | 15 (1.4%) |
| 5:30 AM to 5:59 AM | 10 (1.1%) | 38 (3.6%) |
| 6:00 AM to 6:29 AM | 45 (5.2%) | 82 (7.8%) |
| 6:30 AM to 6:59 AM | 126 (14.5%) | 124 (11.8%) |
| 7:00 AM to 7:29 AM | 68 (7.8%) | 113 (10.7%) |
| 7:30 AM to 7:59 AM | 53 (6.1%) | 154 (14.6%) |
| 8:00 AM to 8:29 AM | 40 (4.6%) | 40 (3.8%) |
| 8:30 AM to 8:59 AM | 125 (14.4%) | 142 (13.5%) |
| 9:00 AM to 9:59 AM | 122 (14.0%) | 149 (14.2%) |
| 10:00 AM to 10:59 AM | 0 (0.0%) | 38 (3.6%) |
| 11:00 AM to 11:59 AM | 68 (7.8%) | 0 (0.0%) |
| 12:00 PM to 3:59 PM | 42 (4.8%) | 108 (10.3%) |
| 4:00 PM to 11:59 PM | 69 (7.9%) | 31 (2.9%) |
| Total | 869 (100.0%) | 1,051 (100.0%) |
Housing Occupancy in Irwin borough
Occupancy by Ownership in Irwin borough
Of the total 2,046 dwellings in Irwin borough, owner-occupied units account for 929 (45.4%), while renter-occupied units make up 1,117 (54.6%).
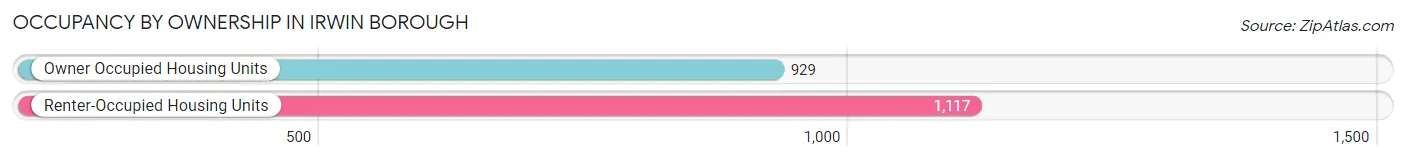
| Occupancy | # Housing Units | % Housing Units |
| Owner Occupied Housing Units | 929 | 45.4% |
| Renter-Occupied Housing Units | 1,117 | 54.6% |
| Total Occupied Housing Units | 2,046 | 100.0% |
Occupancy by Household Size in Irwin borough
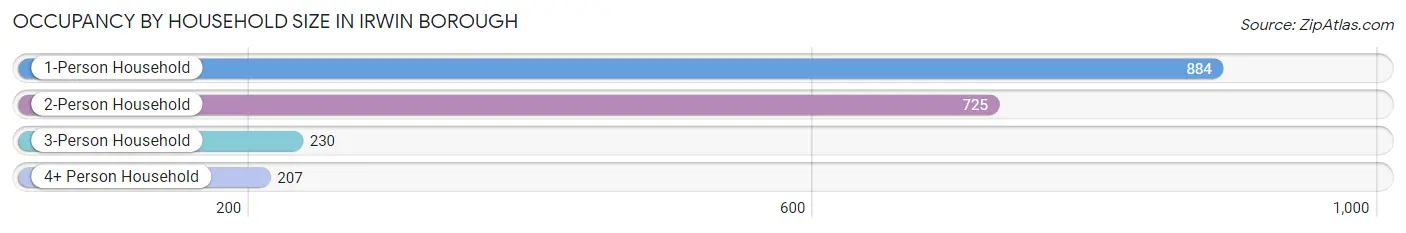
| Household Size | # Housing Units | % Housing Units |
| 1-Person Household | 884 | 43.2% |
| 2-Person Household | 725 | 35.4% |
| 3-Person Household | 230 | 11.2% |
| 4+ Person Household | 207 | 10.1% |
| Total Housing Units | 2,046 | 100.0% |
Occupancy by Ownership by Household Size in Irwin borough
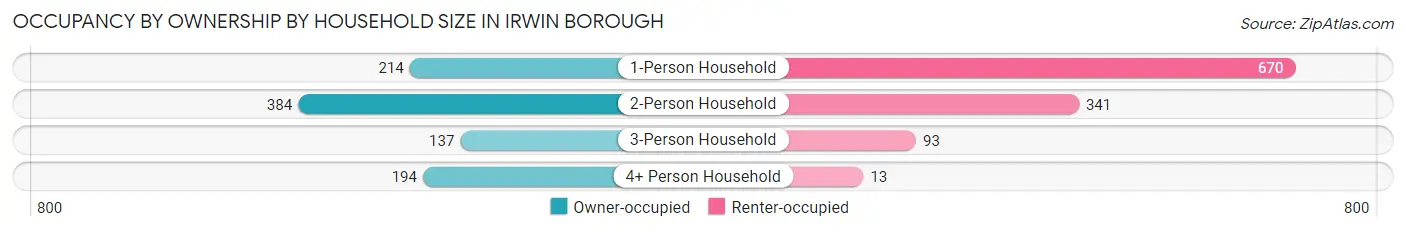
| Household Size | Owner-occupied | Renter-occupied |
| 1-Person Household | 214 (24.2%) | 670 (75.8%) |
| 2-Person Household | 384 (53.0%) | 341 (47.0%) |
| 3-Person Household | 137 (59.6%) | 93 (40.4%) |
| 4+ Person Household | 194 (93.7%) | 13 (6.3%) |
| Total Housing Units | 929 (45.4%) | 1,117 (54.6%) |
Occupancy by Educational Attainment in Irwin borough
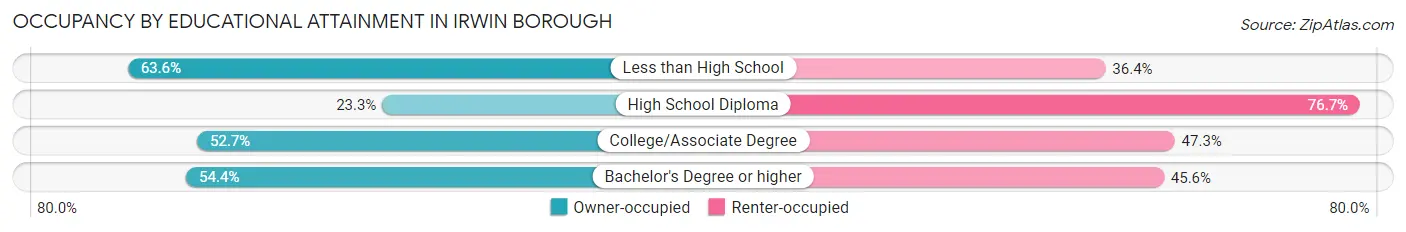
| Household Size | Owner-occupied | Renter-occupied |
| Less than High School | 35 (63.6%) | 20 (36.4%) |
| High School Diploma | 132 (23.3%) | 435 (76.7%) |
| College/Associate Degree | 376 (52.7%) | 338 (47.3%) |
| Bachelor's Degree or higher | 386 (54.4%) | 324 (45.6%) |
Occupancy by Age of Householder in Irwin borough
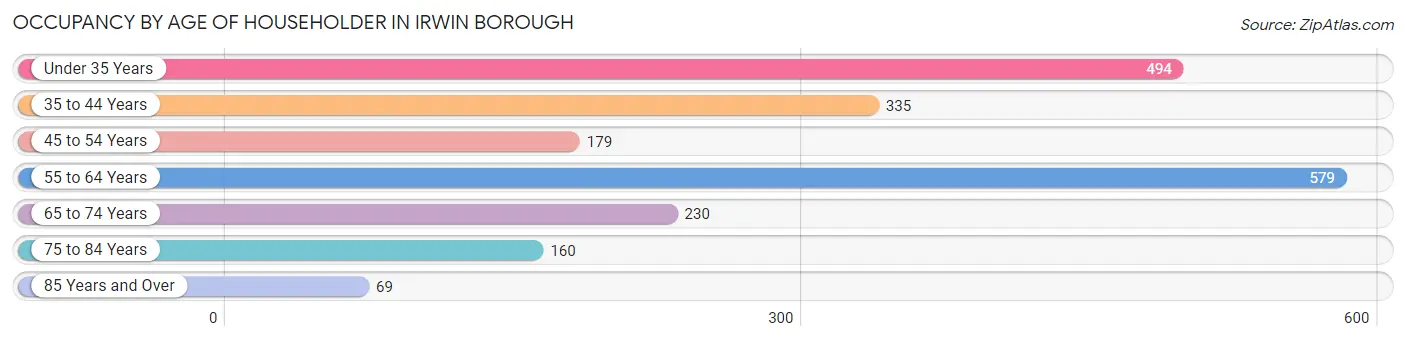
| Age Bracket | # Households | % Households |
| Under 35 Years | 494 | 24.1% |
| 35 to 44 Years | 335 | 16.4% |
| 45 to 54 Years | 179 | 8.7% |
| 55 to 64 Years | 579 | 28.3% |
| 65 to 74 Years | 230 | 11.2% |
| 75 to 84 Years | 160 | 7.8% |
| 85 Years and Over | 69 | 3.4% |
| Total | 2,046 | 100.0% |
Housing Finances in Irwin borough
Median Income by Occupancy in Irwin borough
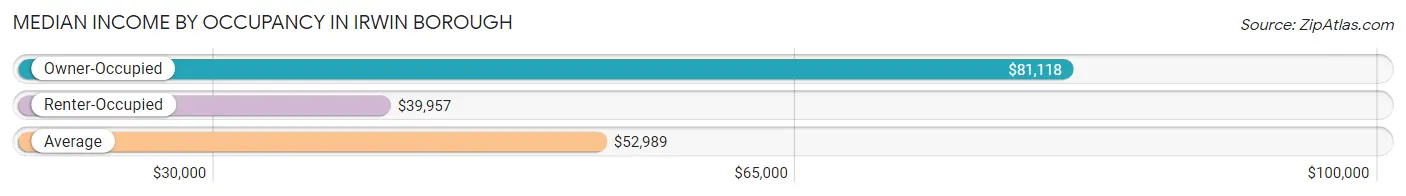
| Occupancy Type | # Households | Median Income |
| Owner-Occupied | 929 (45.4%) | $81,118 |
| Renter-Occupied | 1,117 (54.6%) | $39,957 |
| Average | 2,046 (100.0%) | $52,989 |
Occupancy by Householder Income Bracket in Irwin borough
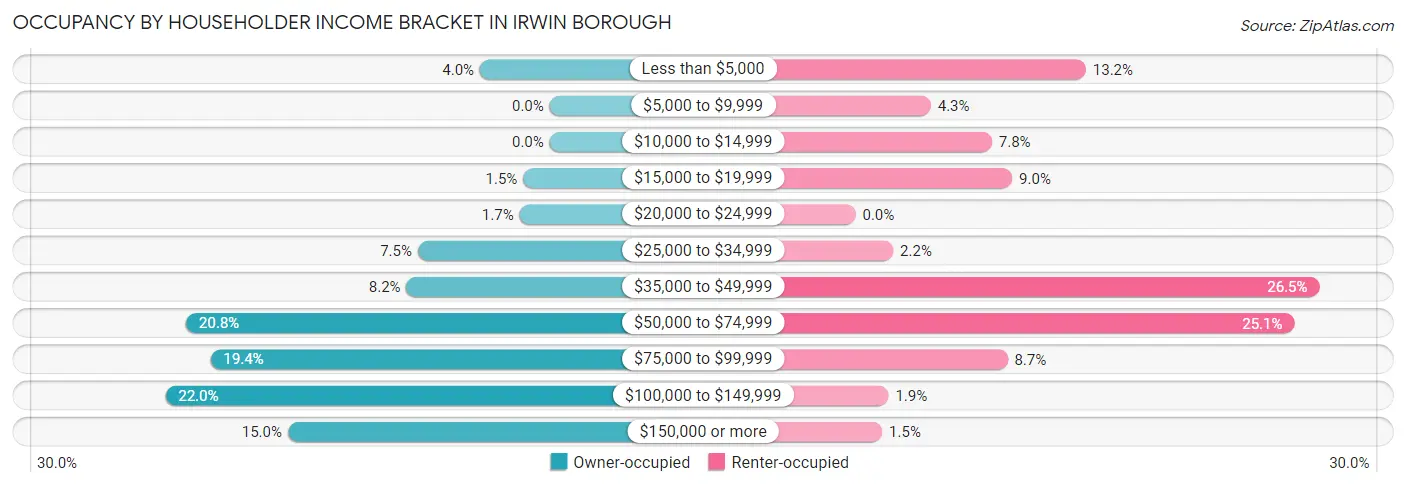
| Income Bracket | Owner-occupied | Renter-occupied |
| Less than $5,000 | 37 (4.0%) | 147 (13.2%) |
| $5,000 to $9,999 | 0 (0.0%) | 48 (4.3%) |
| $10,000 to $14,999 | 0 (0.0%) | 87 (7.8%) |
| $15,000 to $19,999 | 14 (1.5%) | 100 (8.9%) |
| $20,000 to $24,999 | 16 (1.7%) | 0 (0.0%) |
| $25,000 to $34,999 | 70 (7.5%) | 24 (2.1%) |
| $35,000 to $49,999 | 76 (8.2%) | 296 (26.5%) |
| $50,000 to $74,999 | 193 (20.8%) | 280 (25.1%) |
| $75,000 to $99,999 | 180 (19.4%) | 97 (8.7%) |
| $100,000 to $149,999 | 204 (22.0%) | 21 (1.9%) |
| $150,000 or more | 139 (15.0%) | 17 (1.5%) |
| Total | 929 (100.0%) | 1,117 (100.0%) |
Monthly Housing Cost Tiers in Irwin borough
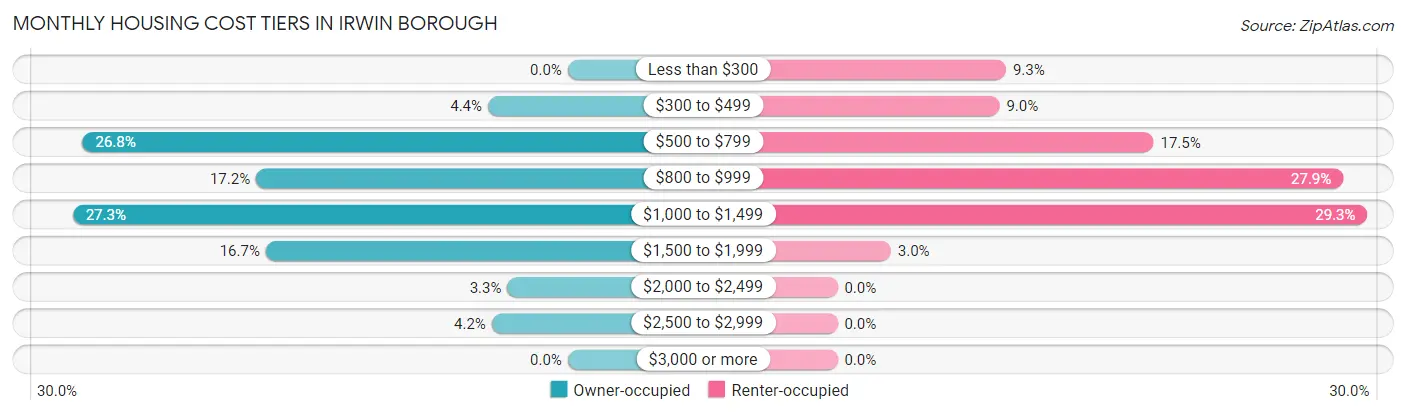
| Monthly Cost | Owner-occupied | Renter-occupied |
| Less than $300 | 0 (0.0%) | 104 (9.3%) |
| $300 to $499 | 41 (4.4%) | 100 (8.9%) |
| $500 to $799 | 249 (26.8%) | 195 (17.5%) |
| $800 to $999 | 160 (17.2%) | 312 (27.9%) |
| $1,000 to $1,499 | 254 (27.3%) | 327 (29.3%) |
| $1,500 to $1,999 | 155 (16.7%) | 33 (2.9%) |
| $2,000 to $2,499 | 31 (3.3%) | 0 (0.0%) |
| $2,500 to $2,999 | 39 (4.2%) | 0 (0.0%) |
| $3,000 or more | 0 (0.0%) | 0 (0.0%) |
| Total | 929 (100.0%) | 1,117 (100.0%) |
Physical Housing Characteristics in Irwin borough
Housing Structures in Irwin borough
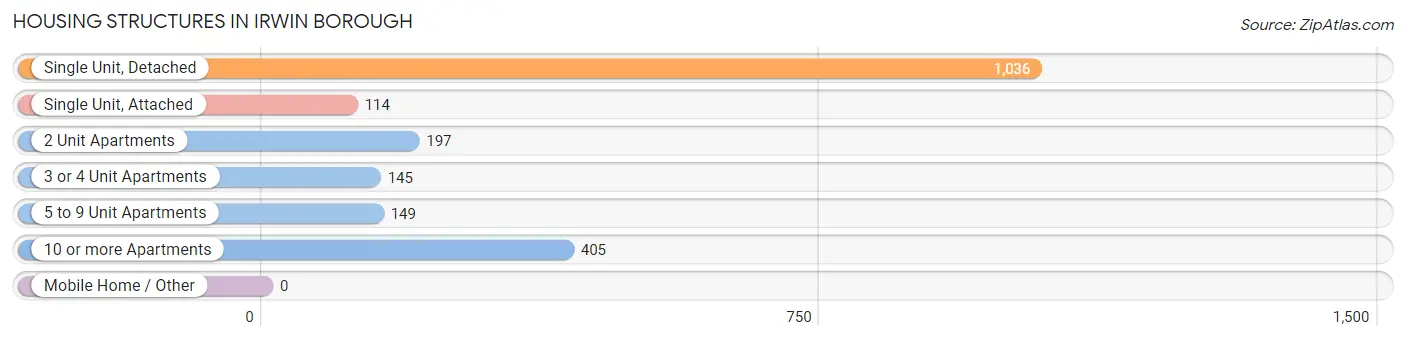
| Structure Type | # Housing Units | % Housing Units |
| Single Unit, Detached | 1,036 | 50.6% |
| Single Unit, Attached | 114 | 5.6% |
| 2 Unit Apartments | 197 | 9.6% |
| 3 or 4 Unit Apartments | 145 | 7.1% |
| 5 to 9 Unit Apartments | 149 | 7.3% |
| 10 or more Apartments | 405 | 19.8% |
| Mobile Home / Other | 0 | 0.0% |
| Total | 2,046 | 100.0% |
Housing Structures by Occupancy in Irwin borough
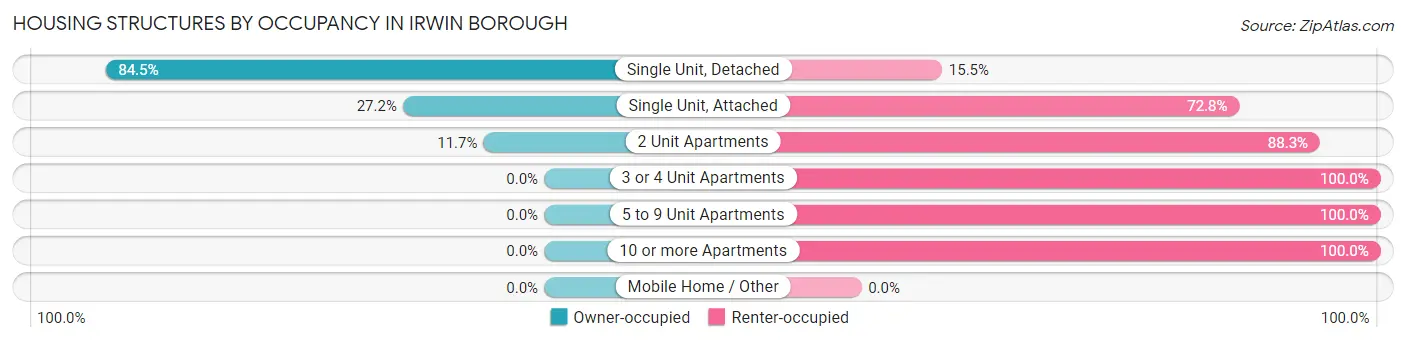
| Structure Type | Owner-occupied | Renter-occupied |
| Single Unit, Detached | 875 (84.5%) | 161 (15.5%) |
| Single Unit, Attached | 31 (27.2%) | 83 (72.8%) |
| 2 Unit Apartments | 23 (11.7%) | 174 (88.3%) |
| 3 or 4 Unit Apartments | 0 (0.0%) | 145 (100.0%) |
| 5 to 9 Unit Apartments | 0 (0.0%) | 149 (100.0%) |
| 10 or more Apartments | 0 (0.0%) | 405 (100.0%) |
| Mobile Home / Other | 0 (0.0%) | 0 (0.0%) |
| Total | 929 (45.4%) | 1,117 (54.6%) |
Housing Structures by Number of Rooms in Irwin borough
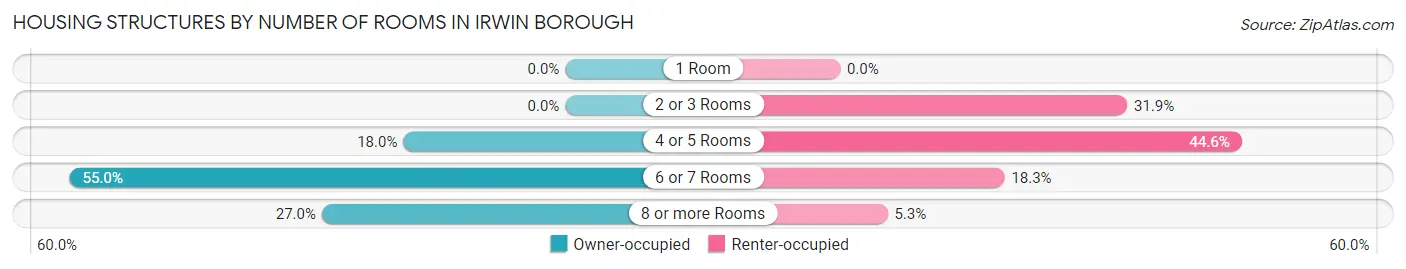
| Number of Rooms | Owner-occupied | Renter-occupied |
| 1 Room | 0 (0.0%) | 0 (0.0%) |
| 2 or 3 Rooms | 0 (0.0%) | 356 (31.9%) |
| 4 or 5 Rooms | 167 (18.0%) | 498 (44.6%) |
| 6 or 7 Rooms | 511 (55.0%) | 204 (18.3%) |
| 8 or more Rooms | 251 (27.0%) | 59 (5.3%) |
| Total | 929 (100.0%) | 1,117 (100.0%) |
Housing Structure by Heating Type in Irwin borough
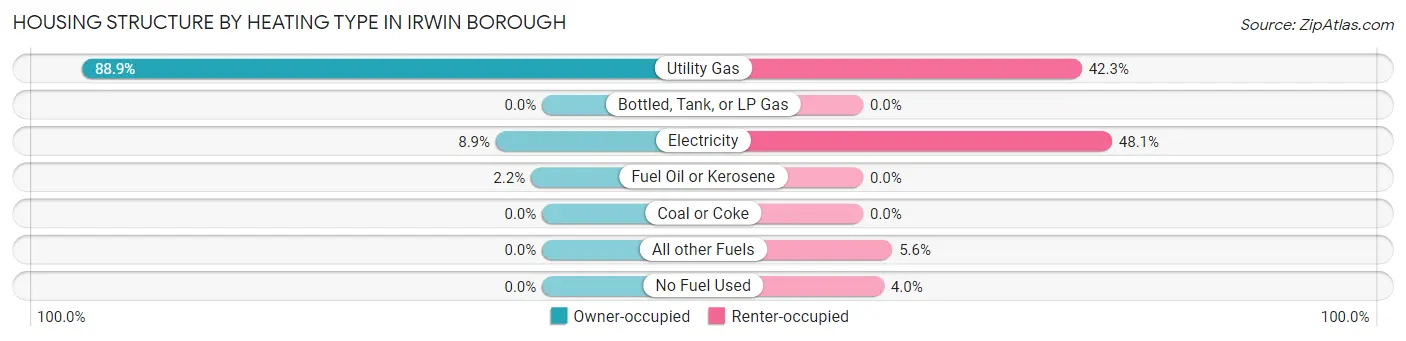
| Heating Type | Owner-occupied | Renter-occupied |
| Utility Gas | 826 (88.9%) | 472 (42.3%) |
| Bottled, Tank, or LP Gas | 0 (0.0%) | 0 (0.0%) |
| Electricity | 83 (8.9%) | 537 (48.1%) |
| Fuel Oil or Kerosene | 20 (2.1%) | 0 (0.0%) |
| Coal or Coke | 0 (0.0%) | 0 (0.0%) |
| All other Fuels | 0 (0.0%) | 63 (5.6%) |
| No Fuel Used | 0 (0.0%) | 45 (4.0%) |
| Total | 929 (100.0%) | 1,117 (100.0%) |
Household Vehicle Usage in Irwin borough
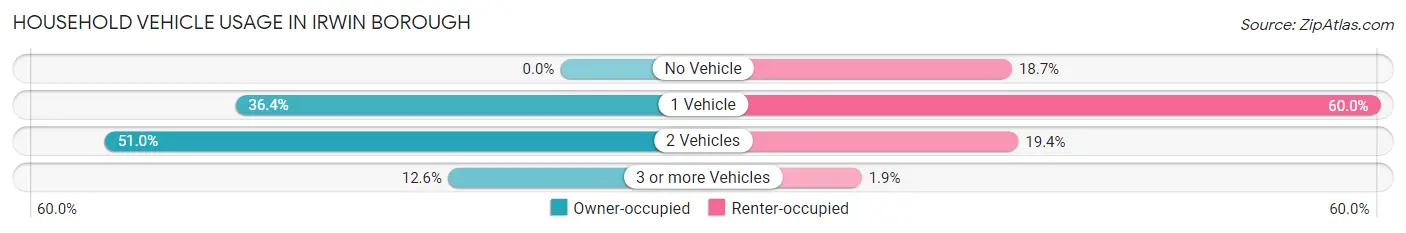
| Vehicles per Household | Owner-occupied | Renter-occupied |
| No Vehicle | 0 (0.0%) | 209 (18.7%) |
| 1 Vehicle | 338 (36.4%) | 670 (60.0%) |
| 2 Vehicles | 474 (51.0%) | 217 (19.4%) |
| 3 or more Vehicles | 117 (12.6%) | 21 (1.9%) |
| Total | 929 (100.0%) | 1,117 (100.0%) |
Real Estate & Mortgages in Irwin borough
Real Estate and Mortgage Overview in Irwin borough
| Characteristic | Without Mortgage | With Mortgage |
| Housing Units | 348 | 581 |
| Median Property Value | $223,800 | $179,700 |
| Median Household Income | $74,028 | $76 |
| Monthly Housing Costs | $687 | $0 |
| Real Estate Taxes | $2,507 | $9 |
Property Value by Mortgage Status in Irwin borough
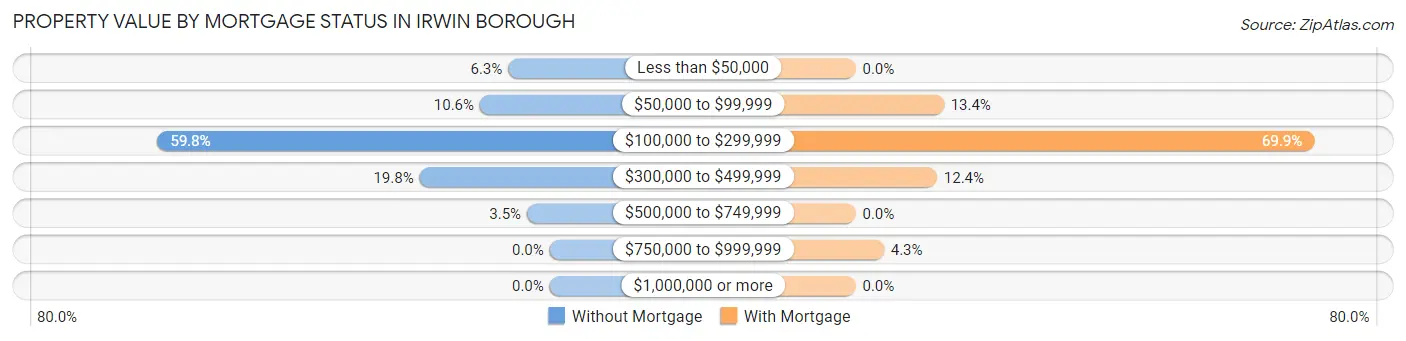
| Property Value | Without Mortgage | With Mortgage |
| Less than $50,000 | 22 (6.3%) | 0 (0.0%) |
| $50,000 to $99,999 | 37 (10.6%) | 78 (13.4%) |
| $100,000 to $299,999 | 208 (59.8%) | 406 (69.9%) |
| $300,000 to $499,999 | 69 (19.8%) | 72 (12.4%) |
| $500,000 to $749,999 | 12 (3.5%) | 0 (0.0%) |
| $750,000 to $999,999 | 0 (0.0%) | 25 (4.3%) |
| $1,000,000 or more | 0 (0.0%) | 0 (0.0%) |
| Total | 348 (100.0%) | 581 (100.0%) |
Household Income by Mortgage Status in Irwin borough
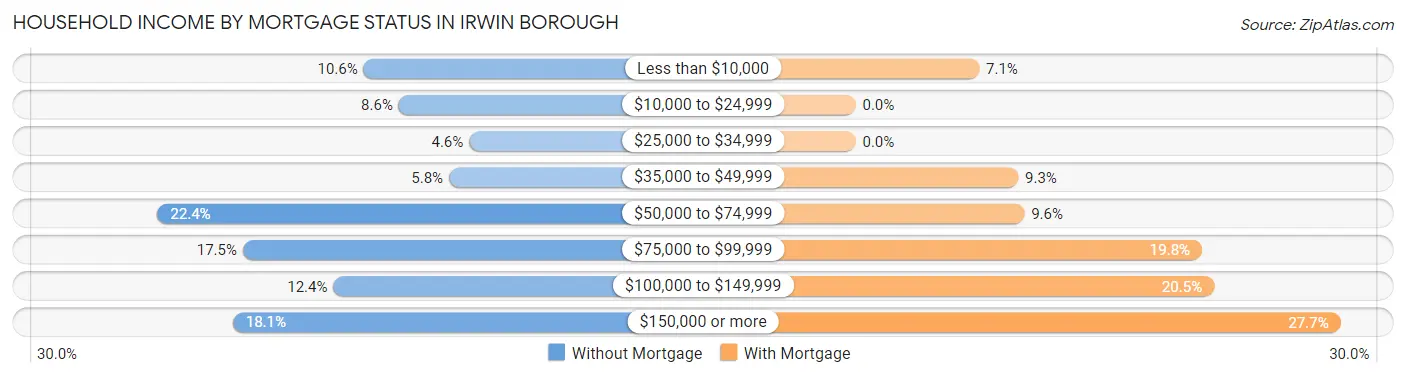
| Household Income | Without Mortgage | With Mortgage |
| Less than $10,000 | 37 (10.6%) | 41 (7.1%) |
| $10,000 to $24,999 | 30 (8.6%) | 0 (0.0%) |
| $25,000 to $34,999 | 16 (4.6%) | 0 (0.0%) |
| $35,000 to $49,999 | 20 (5.8%) | 54 (9.3%) |
| $50,000 to $74,999 | 78 (22.4%) | 56 (9.6%) |
| $75,000 to $99,999 | 61 (17.5%) | 115 (19.8%) |
| $100,000 to $149,999 | 43 (12.4%) | 119 (20.5%) |
| $150,000 or more | 63 (18.1%) | 161 (27.7%) |
| Total | 348 (100.0%) | 581 (100.0%) |
Property Value to Household Income Ratio in Irwin borough
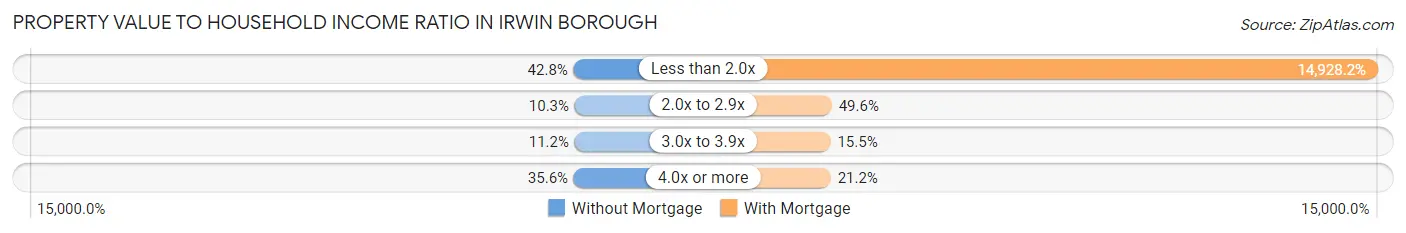
| Value-to-Income Ratio | Without Mortgage | With Mortgage |
| Less than 2.0x | 149 (42.8%) | 86,733 (14,928.2%) |
| 2.0x to 2.9x | 36 (10.3%) | 288 (49.6%) |
| 3.0x to 3.9x | 39 (11.2%) | 90 (15.5%) |
| 4.0x or more | 124 (35.6%) | 123 (21.2%) |
| Total | 348 (100.0%) | 581 (100.0%) |
Real Estate Taxes by Mortgage Status in Irwin borough

| Property Taxes | Without Mortgage | With Mortgage |
| Less than $800 | 0 (0.0%) | 0 (0.0%) |
| $800 to $1,499 | 83 (23.8%) | 41 (7.1%) |
| $800 to $1,499 | 265 (76.1%) | 218 (37.5%) |
| Total | 348 (100.0%) | 581 (100.0%) |
Health & Disability in Irwin borough
Health Insurance Coverage by Age in Irwin borough
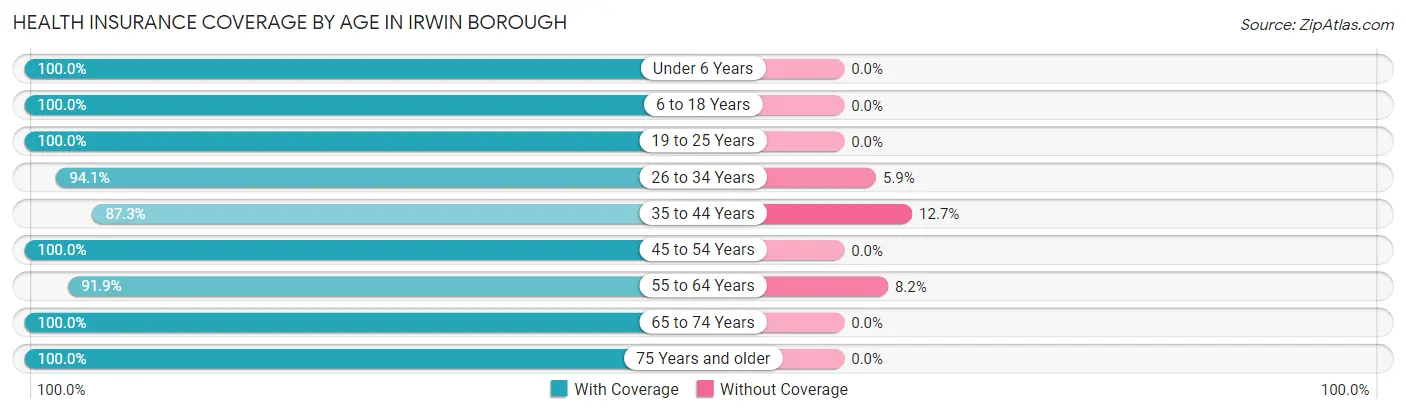
| Age Bracket | With Coverage | Without Coverage |
| Under 6 Years | 276 (100.0%) | 0 (0.0%) |
| 6 to 18 Years | 469 (100.0%) | 0 (0.0%) |
| 19 to 25 Years | 223 (100.0%) | 0 (0.0%) |
| 26 to 34 Years | 540 (94.1%) | 34 (5.9%) |
| 35 to 44 Years | 483 (87.3%) | 70 (12.7%) |
| 45 to 54 Years | 350 (100.0%) | 0 (0.0%) |
| 55 to 64 Years | 710 (91.8%) | 63 (8.2%) |
| 65 to 74 Years | 342 (100.0%) | 0 (0.0%) |
| 75 Years and older | 297 (100.0%) | 0 (0.0%) |
| Total | 3,690 (95.7%) | 167 (4.3%) |
Health Insurance Coverage by Citizenship Status in Irwin borough
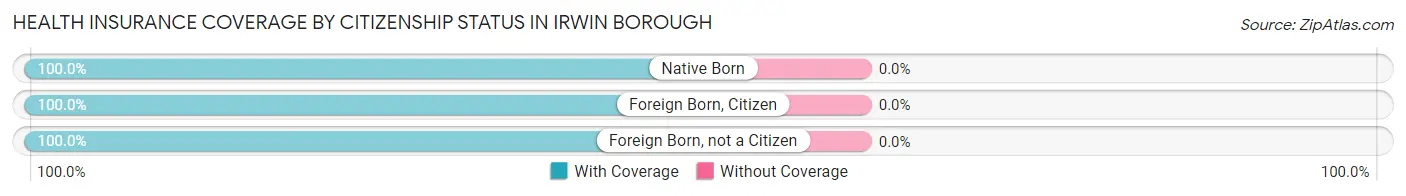
| Citizenship Status | With Coverage | Without Coverage |
| Native Born | 276 (100.0%) | 0 (0.0%) |
| Foreign Born, Citizen | 469 (100.0%) | 0 (0.0%) |
| Foreign Born, not a Citizen | 223 (100.0%) | 0 (0.0%) |
Health Insurance Coverage by Household Income in Irwin borough
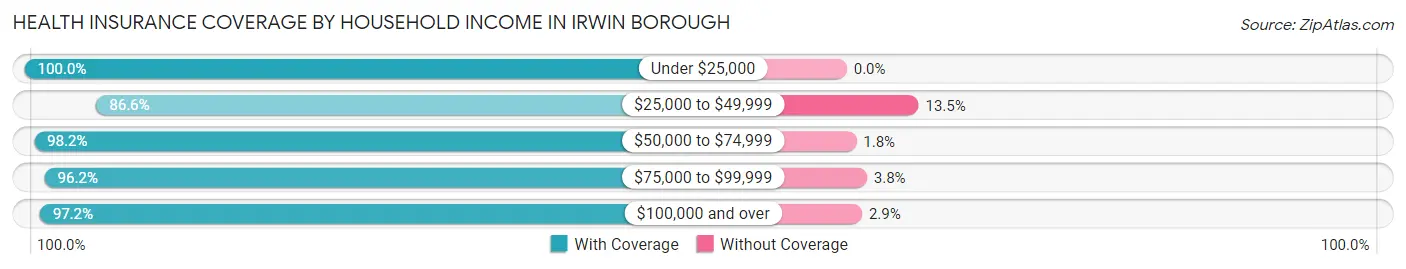
| Household Income | With Coverage | Without Coverage |
| Under $25,000 | 717 (100.0%) | 0 (0.0%) |
| $25,000 to $49,999 | 650 (86.6%) | 101 (13.5%) |
| $50,000 to $74,999 | 714 (98.2%) | 13 (1.8%) |
| $75,000 to $99,999 | 588 (96.2%) | 23 (3.8%) |
| $100,000 and over | 1,021 (97.2%) | 30 (2.9%) |
Public vs Private Health Insurance Coverage by Age in Irwin borough
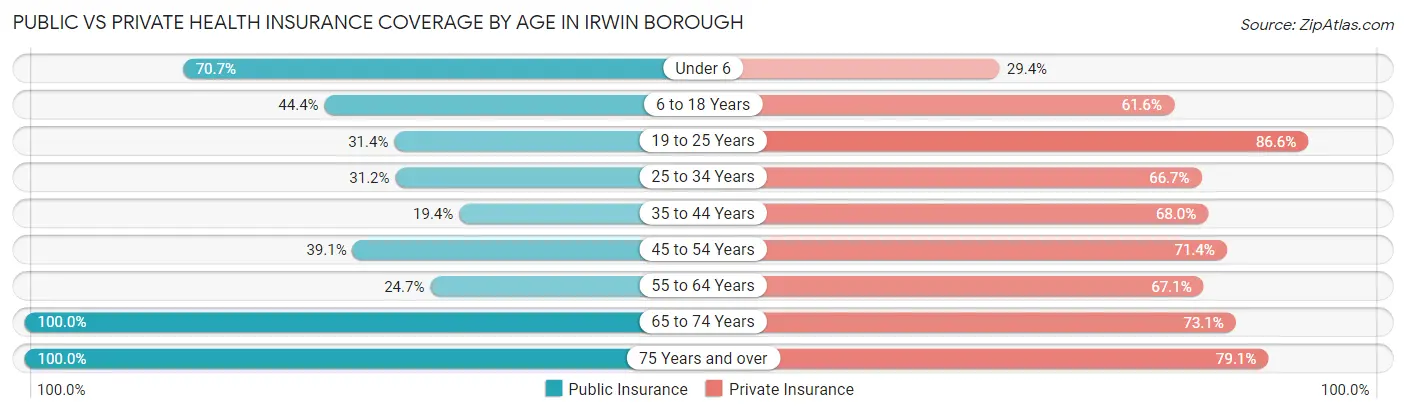
| Age Bracket | Public Insurance | Private Insurance |
| Under 6 | 195 (70.7%) | 81 (29.3%) |
| 6 to 18 Years | 208 (44.4%) | 289 (61.6%) |
| 19 to 25 Years | 70 (31.4%) | 193 (86.6%) |
| 25 to 34 Years | 179 (31.2%) | 383 (66.7%) |
| 35 to 44 Years | 107 (19.4%) | 376 (68.0%) |
| 45 to 54 Years | 137 (39.1%) | 250 (71.4%) |
| 55 to 64 Years | 191 (24.7%) | 519 (67.1%) |
| 65 to 74 Years | 342 (100.0%) | 250 (73.1%) |
| 75 Years and over | 297 (100.0%) | 235 (79.1%) |
| Total | 1,726 (44.8%) | 2,576 (66.8%) |
Disability Status by Sex by Age in Irwin borough
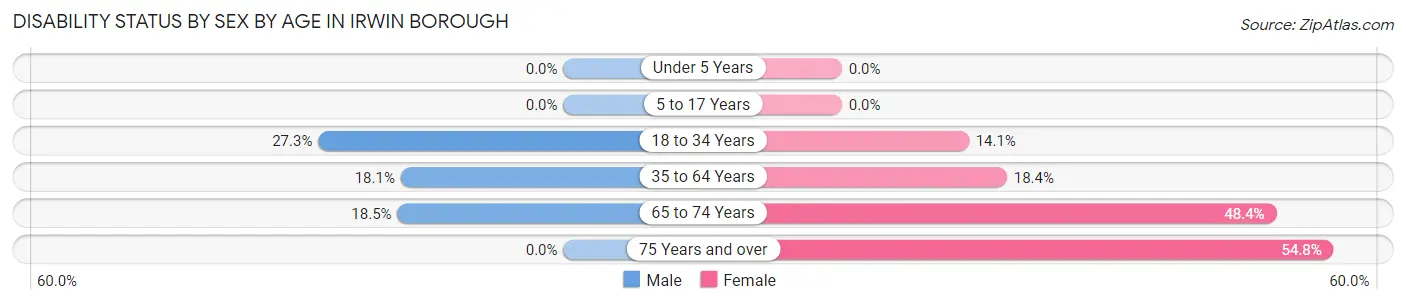
| Age Bracket | Male | Female |
| Under 5 Years | 0 (0.0%) | 0 (0.0%) |
| 5 to 17 Years | 0 (0.0%) | 0 (0.0%) |
| 18 to 34 Years | 98 (27.3%) | 64 (14.1%) |
| 35 to 64 Years | 136 (18.1%) | 170 (18.4%) |
| 65 to 74 Years | 17 (18.5%) | 121 (48.4%) |
| 75 Years and over | 0 (0.0%) | 109 (54.8%) |
Disability Class by Sex by Age in Irwin borough
Disability Class: Hearing Difficulty
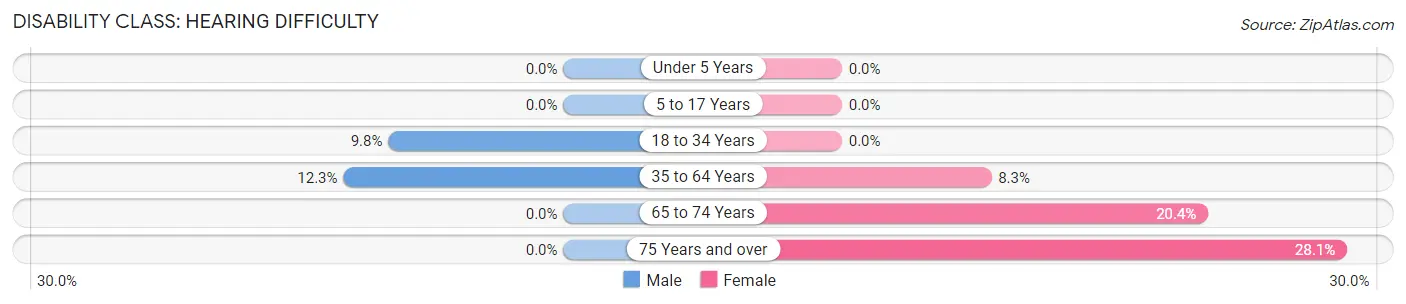
| Age Bracket | Male | Female |
| Under 5 Years | 0 (0.0%) | 0 (0.0%) |
| 5 to 17 Years | 0 (0.0%) | 0 (0.0%) |
| 18 to 34 Years | 35 (9.8%) | 0 (0.0%) |
| 35 to 64 Years | 92 (12.2%) | 77 (8.3%) |
| 65 to 74 Years | 0 (0.0%) | 51 (20.4%) |
| 75 Years and over | 0 (0.0%) | 56 (28.1%) |
Disability Class: Vision Difficulty
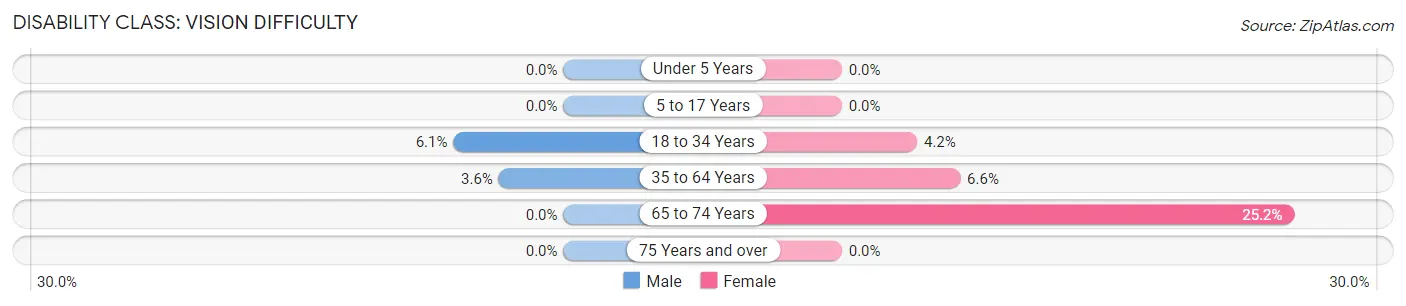
| Age Bracket | Male | Female |
| Under 5 Years | 0 (0.0%) | 0 (0.0%) |
| 5 to 17 Years | 0 (0.0%) | 0 (0.0%) |
| 18 to 34 Years | 22 (6.1%) | 19 (4.2%) |
| 35 to 64 Years | 27 (3.6%) | 61 (6.6%) |
| 65 to 74 Years | 0 (0.0%) | 63 (25.2%) |
| 75 Years and over | 0 (0.0%) | 0 (0.0%) |
Disability Class: Cognitive Difficulty
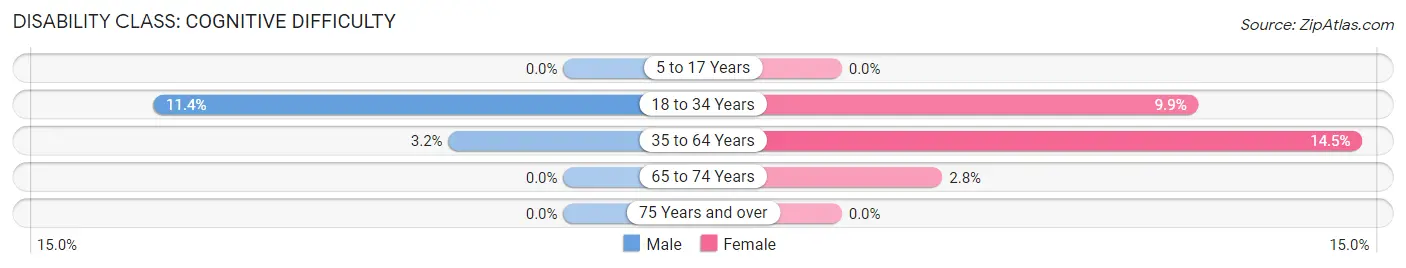
| Age Bracket | Male | Female |
| 5 to 17 Years | 0 (0.0%) | 0 (0.0%) |
| 18 to 34 Years | 41 (11.4%) | 45 (9.9%) |
| 35 to 64 Years | 24 (3.2%) | 134 (14.5%) |
| 65 to 74 Years | 0 (0.0%) | 7 (2.8%) |
| 75 Years and over | 0 (0.0%) | 0 (0.0%) |
Disability Class: Ambulatory Difficulty
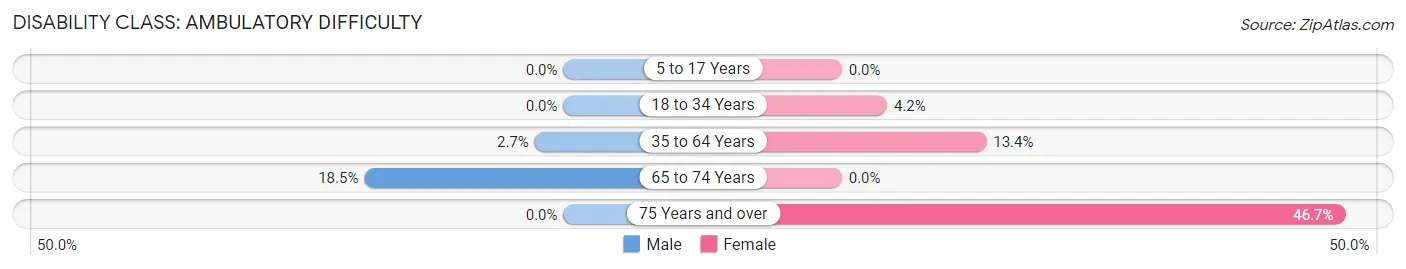
| Age Bracket | Male | Female |
| 5 to 17 Years | 0 (0.0%) | 0 (0.0%) |
| 18 to 34 Years | 0 (0.0%) | 19 (4.2%) |
| 35 to 64 Years | 20 (2.7%) | 124 (13.4%) |
| 65 to 74 Years | 17 (18.5%) | 0 (0.0%) |
| 75 Years and over | 0 (0.0%) | 93 (46.7%) |
Disability Class: Self-Care Difficulty
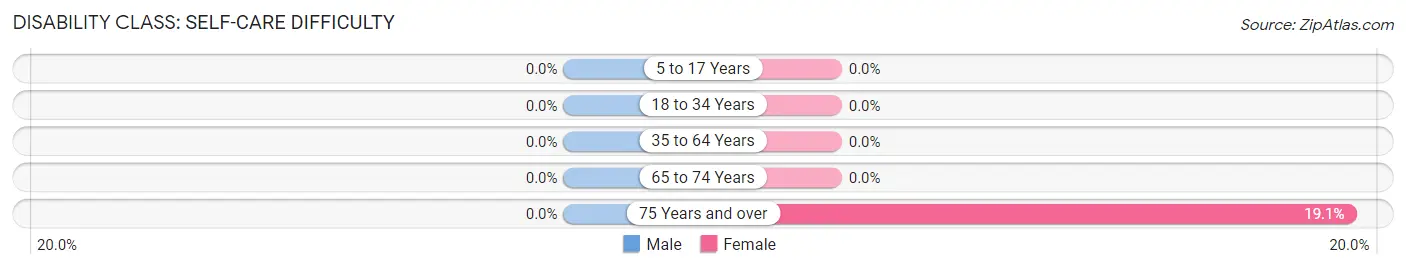
| Age Bracket | Male | Female |
| 5 to 17 Years | 0 (0.0%) | 0 (0.0%) |
| 18 to 34 Years | 0 (0.0%) | 0 (0.0%) |
| 35 to 64 Years | 0 (0.0%) | 0 (0.0%) |
| 65 to 74 Years | 0 (0.0%) | 0 (0.0%) |
| 75 Years and over | 0 (0.0%) | 38 (19.1%) |
Technology Access in Irwin borough
Computing Device Access in Irwin borough
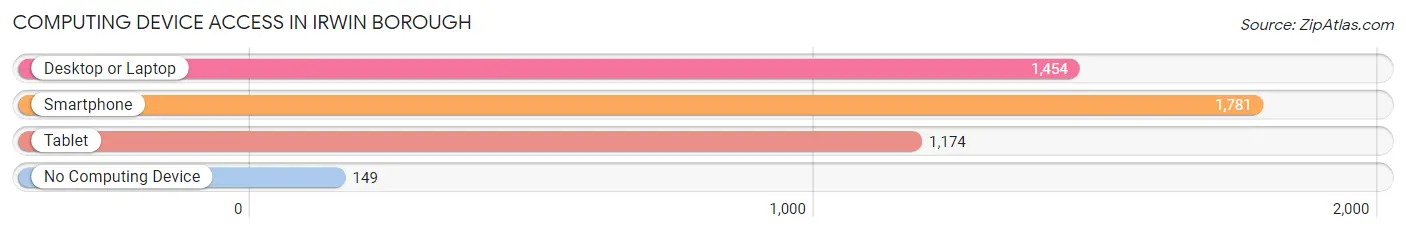
| Device Type | # Households | % Households |
| Desktop or Laptop | 1,454 | 71.1% |
| Smartphone | 1,781 | 87.1% |
| Tablet | 1,174 | 57.4% |
| No Computing Device | 149 | 7.3% |
| Total | 2,046 | 100.0% |
Internet Access in Irwin borough
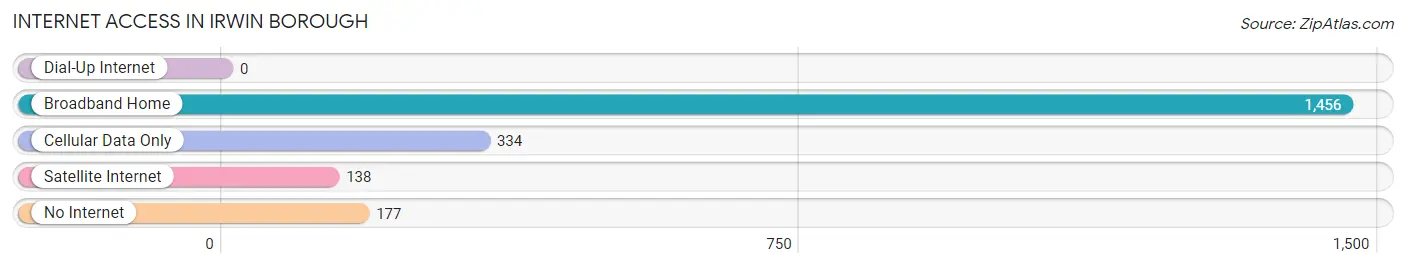
| Internet Type | # Households | % Households |
| Dial-Up Internet | 0 | 0.0% |
| Broadband Home | 1,456 | 71.2% |
| Cellular Data Only | 334 | 16.3% |
| Satellite Internet | 138 | 6.7% |
| No Internet | 177 | 8.6% |
| Total | 2,046 | 100.0% |
Irwin borough Summary
Irwin Borough is a small borough located in Westmoreland County, Pennsylvania. It is situated in the southwestern part of the county, approximately 25 miles southeast of Pittsburgh. The borough is bordered by North Huntingdon Township to the north, Penn Township to the east, and Manor Borough to the south. The population of Irwin Borough was 2,945 at the 2010 census.
History
The area that is now Irwin Borough was first settled in the late 1700s by a group of Scotch-Irish immigrants. The town was originally known as "Irwin's Crossroads" due to its location at the intersection of two major roads. In 1851, the town was officially incorporated as Irwin Borough.
The town grew rapidly in the late 19th and early 20th centuries, due in part to the construction of the Pennsylvania Railroad in 1852. The railroad provided a direct connection to Pittsburgh, which allowed the town to become a major hub for the coal and steel industries. The town also became a popular destination for tourists, who were drawn to the area's natural beauty and recreational opportunities.
Geography
Irwin Borough is located at 40°17'N 79°37'W (40.2833, -79.6167). According to the United States Census Bureau, the borough has a total area of 1.2 square miles (3.1 km2), all of it land.
The borough is located in the Allegheny Plateau region of Pennsylvania. The terrain is generally hilly, with elevations ranging from 1,000 to 1,500 feet above sea level. The borough is drained by the Loyalhanna Creek, which flows through the center of town.
Economy
The economy of Irwin Borough is largely based on the service sector. The borough is home to a variety of retail stores, restaurants, and other businesses. The borough is also home to several manufacturing companies, including a steel mill and a paper mill.
The borough is also home to a number of small businesses, including a variety of professional services, such as accounting, legal, and medical services. The borough is also home to a number of small-scale agricultural operations, such as farms and nurseries.
Demographics
As of the 2010 census, there were 2,945 people, 1,220 households, and 790 families residing in the borough. The population density was 2,457.3 people per square mile (948.3/km2). There were 1,320 housing units at an average density of 1,093.3 per square mile (422.3/km2). The racial makeup of the borough was 97.2% White, 0.7% African American, 0.2% Native American, 0.7% Asian, 0.1% Pacific Islander, 0.3% from other races, and 0.9% from two or more races. Hispanic or Latino of any race were 1.2% of the population.
There were 1,220 households, out of which 28.2% had children under the age of 18 living with them, 46.2% were married couples living together, 13.2% had a female householder with no husband present, and 35.2% were non-families. 30.2% of all households were made up of individuals, and 14.2% had someone living alone who was 65 years of age or older. The average household size was 2.41 and the average family size was 2.98.
In the borough, the population was spread out, with 23.2% under the age of 18, 7.2% from 18 to 24, 28.7% from 25 to 44, 22.7% from 45 to 64, and 18.2% who were 65 years of age or older. The median age was 39 years. For every 100 females, there were 91.2 males. For every 100 females age 18 and over, there were 87.2 males.
The median income for a household in the borough was $37,917, and the median income for a family was $45,000. Males had a median income of $35,000 versus $25,000 for females. The per capita income for the borough was $19,845. About 6.2% of families and 8.2% of the population were below the poverty line, including 10.2% of those under age 18 and 6.2% of those age 65 or over.
Common Questions
What is Per Capita Income in Irwin borough?
Per Capita income in Irwin borough is $36,884.
What is the Median Family Income in Irwin borough?
Median Family Income in Irwin borough is $76,321.
What is the Median Household income in Irwin borough?
Median Household Income in Irwin borough is $52,989.
What is Income or Wage Gap in Irwin borough?
Income or Wage Gap in Irwin borough is 9.8%.
Women in Irwin borough earn 90.2 cents for every dollar earned by a man.
What is Inequality or Gini Index in Irwin borough?
Inequality or Gini Index in Irwin borough is 0.45.
What is the Total Population of Irwin borough?
Total Population of Irwin borough is 3,878.
What is the Total Male Population of Irwin borough?
Total Male Population of Irwin borough is 1,673.
What is the Total Female Population of Irwin borough?
Total Female Population of Irwin borough is 2,205.
What is the Ratio of Males per 100 Females in Irwin borough?
There are 75.87 Males per 100 Females in Irwin borough.
What is the Ratio of Females per 100 Males in Irwin borough?
There are 131.80 Females per 100 Males in Irwin borough.
What is the Median Population Age in Irwin borough?
Median Population Age in Irwin borough is 40.9 Years.
What is the Average Family Size in Irwin borough
Average Family Size in Irwin borough is 2.7 People.
What is the Average Household Size in Irwin borough
Average Household Size in Irwin borough is 1.9 People.
How Large is the Labor Force in Irwin borough?
There are 2,275 People in the Labor Forcein in Irwin borough.
What is the Percentage of People in the Labor Force in Irwin borough?
69.9% of People are in the Labor Force in Irwin borough.
What is the Unemployment Rate in Irwin borough?
Unemployment Rate in Irwin borough is 4.7%.