Zip Codes with the Highest Percentage of Families with Income Below $10,000 in Pennsylvania
RELATED REPORTS & OPTIONS
Family Income | $0-10k
Pennsylvania
Compare Zip Codes
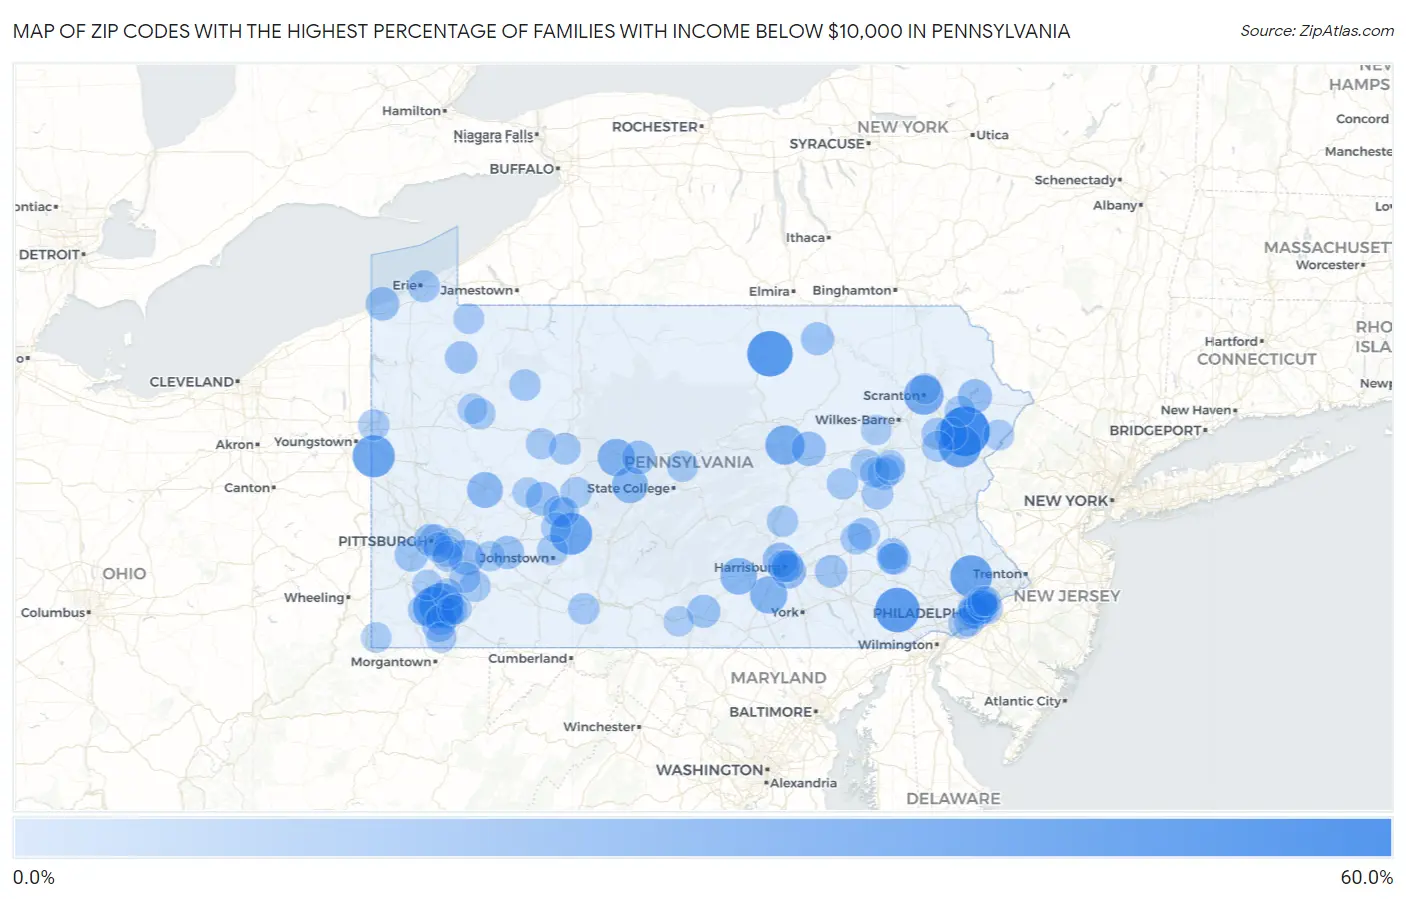
Map of Zip Codes with the Highest Percentage of Families with Income Below $10,000 in Pennsylvania
0.0%
60.0%
Zip Codes with the Highest Percentage of Families with Income Below $10,000 in Pennsylvania
| Zip Code | Families with Income < $10k | vs State | vs National | |
| 1. | 18342 | 58.9% | 2.9%(+56.0)#1 | 3.1%(+55.8)#47 |
| 2. | 16939 | 48.1% | 2.9%(+45.2)#2 | 3.1%(+45.0)#73 |
| 3. | 19369 | 45.2% | 2.9%(+42.3)#3 | 3.1%(+42.1)#83 |
| 4. | 15444 | 43.5% | 2.9%(+40.6)#4 | 3.1%(+40.4)#89 |
| 5. | 18355 | 39.5% | 2.9%(+36.6)#5 | 3.1%(+36.4)#113 |
| 6. | 16132 | 39.2% | 2.9%(+36.3)#6 | 3.1%(+36.1)#116 |
| 7. | 15948 | 38.7% | 2.9%(+35.8)#7 | 3.1%(+35.6)#121 |
| 8. | 19436 | 38.6% | 2.9%(+35.7)#8 | 3.1%(+35.5)#123 |
| 9. | 15450 | 37.5% | 2.9%(+34.6)#9 | 3.1%(+34.4)#127 |
| 10. | 18503 | 32.4% | 2.9%(+29.5)#10 | 3.1%(+29.3)#167 |
| 11. | 17887 | 31.4% | 2.9%(+28.5)#11 | 3.1%(+28.3)#174 |
| 12. | 16855 | 26.3% | 2.9%(+23.4)#12 | 3.1%(+23.2)#272 |
| 13. | 17323 | 26.3% | 2.9%(+23.4)#13 | 3.1%(+23.2)#273 |
| 14. | 17081 | 25.0% | 2.9%(+22.1)#14 | 3.1%(+21.9)#304 |
| 15. | 16677 | 23.4% | 2.9%(+20.5)#15 | 3.1%(+20.3)#358 |
| 16. | 16236 | 22.6% | 2.9%(+19.7)#16 | 3.1%(+19.5)#385 |
| 17. | 15692 | 21.9% | 2.9%(+19.0)#17 | 3.1%(+18.8)#408 |
| 18. | 17104 | 19.7% | 2.9%(+16.8)#18 | 3.1%(+16.6)#492 |
| 19. | 17093 | 19.4% | 2.9%(+16.5)#19 | 3.1%(+16.3)#508 |
| 20. | 17884 | 18.8% | 2.9%(+15.9)#20 | 3.1%(+15.7)#542 |
| 21. | 18451 | 18.2% | 2.9%(+15.3)#21 | 3.1%(+15.1)#575 |
| 22. | 15351 | 17.7% | 2.9%(+14.8)#22 | 3.1%(+14.6)#603 |
| 23. | 19132 | 17.1% | 2.9%(+14.2)#23 | 3.1%(+14.0)#655 |
| 24. | 16847 | 16.9% | 2.9%(+14.0)#24 | 3.1%(+13.8)#679 |
| 25. | 15734 | 16.9% | 2.9%(+14.0)#25 | 3.1%(+13.8)#680 |
| 26. | 16430 | 16.7% | 2.9%(+13.8)#26 | 3.1%(+13.6)#695 |
| 27. | 15671 | 16.0% | 2.9%(+13.1)#27 | 3.1%(+12.9)#749 |
| 28. | 15031 | 15.9% | 2.9%(+13.0)#28 | 3.1%(+12.8)#761 |
| 29. | 17254 | 15.4% | 2.9%(+12.5)#29 | 3.1%(+12.3)#818 |
| 30. | 18814 | 15.4% | 2.9%(+12.5)#30 | 3.1%(+12.3)#822 |
| 31. | 19104 | 14.8% | 2.9%(+11.9)#31 | 3.1%(+11.7)#878 |
| 32. | 16328 | 14.1% | 2.9%(+11.2)#32 | 3.1%(+11.0)#966 |
| 33. | 18346 | 14.0% | 2.9%(+11.1)#33 | 3.1%(+10.9)#969 |
| 34. | 17064 | 14.0% | 2.9%(+11.1)#34 | 3.1%(+10.9)#972 |
| 35. | 15219 | 13.8% | 2.9%(+10.9)#35 | 3.1%(+10.7)#1,000 |
| 36. | 17102 | 13.6% | 2.9%(+10.7)#36 | 3.1%(+10.5)#1,029 |
| 37. | 19559 | 13.4% | 2.9%(+10.5)#37 | 3.1%(+10.3)#1,064 |
| 38. | 19133 | 13.2% | 2.9%(+10.3)#38 | 3.1%(+10.1)#1,085 |
| 39. | 17103 | 13.2% | 2.9%(+10.3)#39 | 3.1%(+10.1)#1,089 |
| 40. | 16503 | 13.0% | 2.9%(+10.1)#40 | 3.1%(+9.90)#1,112 |
| 41. | 18237 | 12.9% | 2.9%(+10.00)#41 | 3.1%(+9.80)#1,140 |
| 42. | 18347 | 12.5% | 2.9%(+9.60)#42 | 3.1%(+9.40)#1,221 |
| 43. | 19602 | 12.2% | 2.9%(+9.30)#43 | 3.1%(+9.10)#1,280 |
| 44. | 15865 | 12.2% | 2.9%(+9.30)#44 | 3.1%(+9.10)#1,287 |
| 45. | 19139 | 12.1% | 2.9%(+9.20)#45 | 3.1%(+9.00)#1,296 |
| 46. | 19121 | 12.0% | 2.9%(+9.10)#46 | 3.1%(+8.90)#1,316 |
| 47. | 15468 | 11.9% | 2.9%(+9.00)#47 | 3.1%(+8.80)#1,350 |
| 48. | 15213 | 11.8% | 2.9%(+8.90)#48 | 3.1%(+8.70)#1,368 |
| 49. | 15710 | 11.7% | 2.9%(+8.80)#49 | 3.1%(+8.60)#1,413 |
| 50. | 16239 | 11.6% | 2.9%(+8.70)#50 | 3.1%(+8.50)#1,419 |
| 51. | 15322 | 11.6% | 2.9%(+8.70)#51 | 3.1%(+8.50)#1,425 |
| 52. | 17925 | 11.6% | 2.9%(+8.70)#52 | 3.1%(+8.50)#1,438 |
| 53. | 19550 | 11.4% | 2.9%(+8.50)#53 | 3.1%(+8.30)#1,494 |
| 54. | 18241 | 11.4% | 2.9%(+8.50)#54 | 3.1%(+8.30)#1,496 |
| 55. | 15550 | 11.3% | 2.9%(+8.40)#55 | 3.1%(+8.20)#1,512 |
| 56. | 17061 | 11.0% | 2.9%(+8.10)#56 | 3.1%(+7.90)#1,590 |
| 57. | 19601 | 10.9% | 2.9%(+8.00)#57 | 3.1%(+7.80)#1,608 |
| 58. | 16121 | 10.9% | 2.9%(+8.00)#58 | 3.1%(+7.80)#1,621 |
| 59. | 17888 | 10.9% | 2.9%(+8.00)#59 | 3.1%(+7.80)#1,634 |
| 60. | 16853 | 10.8% | 2.9%(+7.90)#60 | 3.1%(+7.70)#1,672 |
| 61. | 15612 | 10.7% | 2.9%(+7.80)#61 | 3.1%(+7.60)#1,694 |
| 62. | 16692 | 10.6% | 2.9%(+7.70)#62 | 3.1%(+7.50)#1,725 |
| 63. | 19611 | 10.5% | 2.9%(+7.60)#63 | 3.1%(+7.40)#1,740 |
| 64. | 18610 | 10.5% | 2.9%(+7.60)#64 | 3.1%(+7.40)#1,747 |
| 65. | 15695 | 10.5% | 2.9%(+7.60)#65 | 3.1%(+7.40)#1,765 |
| 66. | 15145 | 10.4% | 2.9%(+7.50)#66 | 3.1%(+7.30)#1,784 |
| 67. | 15410 | 10.3% | 2.9%(+7.40)#67 | 3.1%(+7.20)#1,812 |
| 68. | 18508 | 10.1% | 2.9%(+7.20)#68 | 3.1%(+7.00)#1,870 |
| 69. | 15906 | 10.1% | 2.9%(+7.20)#69 | 3.1%(+7.00)#1,872 |
| 70. | 18445 | 10.1% | 2.9%(+7.20)#70 | 3.1%(+7.00)#1,881 |
| 71. | 15110 | 10.0% | 2.9%(+7.10)#71 | 3.1%(+6.90)#1,913 |
| 72. | 16331 | 10.0% | 2.9%(+7.10)#72 | 3.1%(+6.90)#1,938 |
| 73. | 15847 | 10.0% | 2.9%(+7.10)#73 | 3.1%(+6.90)#1,942 |
| 74. | 18324 | 9.8% | 2.9%(+6.90)#74 | 3.1%(+6.70)#1,993 |
| 75. | 19134 | 9.7% | 2.9%(+6.80)#75 | 3.1%(+6.60)#2,028 |
| 76. | 15714 | 9.7% | 2.9%(+6.80)#76 | 3.1%(+6.60)#2,037 |
| 77. | 19076 | 9.6% | 2.9%(+6.70)#77 | 3.1%(+6.50)#2,080 |
| 78. | 19131 | 9.5% | 2.9%(+6.60)#78 | 3.1%(+6.40)#2,107 |
| 79. | 15483 | 9.5% | 2.9%(+6.60)#79 | 3.1%(+6.40)#2,144 |
| 80. | 15132 | 9.4% | 2.9%(+6.50)#80 | 3.1%(+6.30)#2,157 |
| 81. | 16407 | 9.3% | 2.9%(+6.40)#81 | 3.1%(+6.20)#2,201 |
| 82. | 19079 | 9.3% | 2.9%(+6.40)#82 | 3.1%(+6.20)#2,203 |
| 83. | 15467 | 9.3% | 2.9%(+6.40)#83 | 3.1%(+6.20)#2,237 |
| 84. | 19140 | 9.2% | 2.9%(+6.30)#84 | 3.1%(+6.10)#2,239 |
| 85. | 15314 | 9.2% | 2.9%(+6.30)#85 | 3.1%(+6.10)#2,263 |
| 86. | 15480 | 9.1% | 2.9%(+6.20)#86 | 3.1%(+6.00)#2,330 |
| 87. | 15207 | 9.0% | 2.9%(+6.10)#87 | 3.1%(+5.90)#2,366 |
| 88. | 19141 | 8.9% | 2.9%(+6.00)#88 | 3.1%(+5.80)#2,400 |
| 89. | 18248 | 8.8% | 2.9%(+5.90)#89 | 3.1%(+5.70)#2,493 |
| 90. | 15310 | 8.8% | 2.9%(+5.90)#90 | 3.1%(+5.70)#2,497 |
| 91. | 16319 | 8.6% | 2.9%(+5.70)#91 | 3.1%(+5.50)#2,606 |
| 92. | 18254 | 8.6% | 2.9%(+5.70)#92 | 3.1%(+5.50)#2,611 |
| 93. | 15422 | 8.6% | 2.9%(+5.70)#93 | 3.1%(+5.50)#2,619 |
| 94. | 15957 | 8.6% | 2.9%(+5.70)#94 | 3.1%(+5.50)#2,620 |
| 95. | 18617 | 8.5% | 2.9%(+5.60)#95 | 3.1%(+5.40)#2,673 |
| 96. | 15662 | 8.5% | 2.9%(+5.60)#96 | 3.1%(+5.40)#2,683 |
| 97. | 19120 | 8.4% | 2.9%(+5.50)#97 | 3.1%(+5.30)#2,699 |
| 98. | 18201 | 8.4% | 2.9%(+5.50)#98 | 3.1%(+5.30)#2,708 |
| 99. | 17252 | 8.4% | 2.9%(+5.50)#99 | 3.1%(+5.30)#2,736 |
| 100. | 15747 | 8.4% | 2.9%(+5.50)#100 | 3.1%(+5.30)#2,748 |
Common Questions
What are the Top 10 Zip Codes with the Highest Percentage of Families with Income Below $10,000 in Pennsylvania?
Top 10 Zip Codes with the Highest Percentage of Families with Income Below $10,000 in Pennsylvania are:
What zip code has the Highest Percentage of Families with Income Below $10,000 in Pennsylvania?
18342 has the Highest Percentage of Families with Income Below $10,000 in Pennsylvania with 58.9%.
What is the Percentage of Families with Income Below $10,000 in the State of Pennsylvania?
Percentage of Families with Income Below $10,000 in Pennsylvania is 2.9%.
What is the Percentage of Families with Income Below $10,000 in the United States?
Percentage of Families with Income Below $10,000 in the United States is 3.1%.