New Columbus borough, PA Map & Demographics
New Columbus borough Overview
$25,553
PER CAPITA INCOME
$35,568
AVG FAMILY INCOME
$35,625
AVG HOUSEHOLD INCOME
0.48
INEQUALITY / GINI INDEX
245
TOTAL POPULATION
124
MALE POPULATION
121
FEMALE POPULATION
102.48
MALES / 100 FEMALES
97.58
FEMALES / 100 MALES
50.9
MEDIAN AGE
2.7
AVG FAMILY SIZE
2.5
AVG HOUSEHOLD SIZE
114
LABOR FORCE [ PEOPLE ]
53.0%
PERCENT IN LABOR FORCE
0.9%
UNEMPLOYMENT RATE
Income in New Columbus borough
Income Overview in New Columbus borough
Per Capita Income in New Columbus borough is $25,553, while median incomes of families and households are $35,568 and $35,625 respectively.
| Characteristic | Number | Measure |
| Per Capita Income | 245 | $25,553 |
| Median Family Income | 81 | $35,568 |
| Mean Family Income | 81 | $60,138 |
| Median Household Income | 100 | $35,625 |
| Mean Household Income | 100 | $60,925 |
| Income Deficit | 81 | $0 |
| Wage / Income Gap (%) | 245 | 0.00% |
| Wage / Income Gap ($) | 245 | 100.00¢ per $1 |
| Gini / Inequality Index | 245 | 0.48 |
Earnings by Sex in New Columbus borough
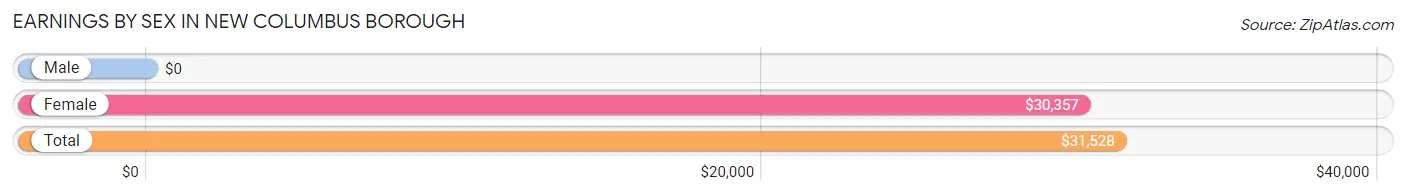
| Sex | Number | Average Earnings |
| Male | 67 (57.3%) | $0 |
| Female | 50 (42.7%) | $30,357 |
| Total | 117 (100.0%) | $31,528 |
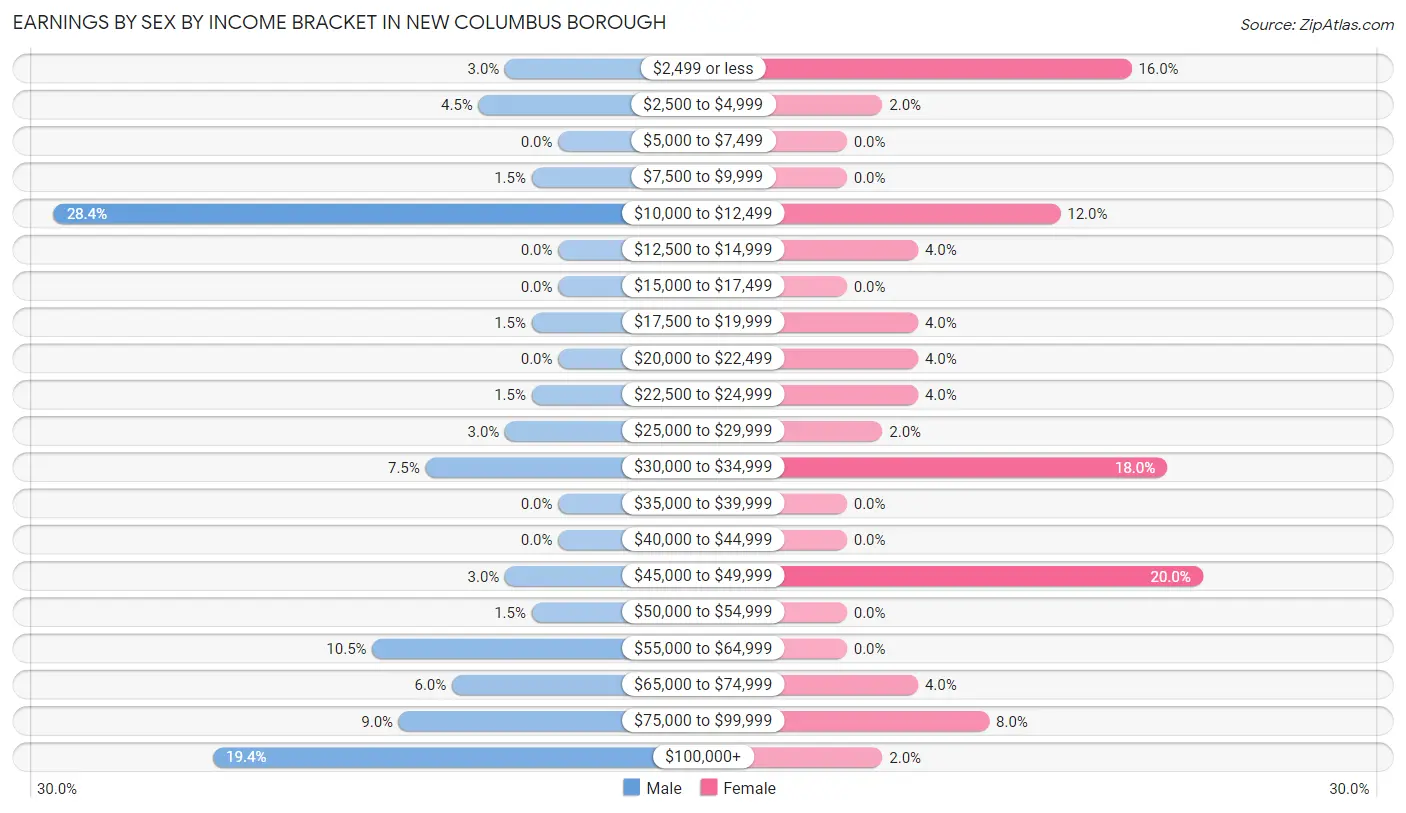
Earnings by Sex by Income Bracket in New Columbus borough
The most common earnings brackets in New Columbus borough are $10,000 to $12,499 for men (19 | 28.4%) and $45,000 to $49,999 for women (10 | 20.0%).
| Income | Male | Female |
| $2,499 or less | 2 (3.0%) | 8 (16.0%) |
| $2,500 to $4,999 | 3 (4.5%) | 1 (2.0%) |
| $5,000 to $7,499 | 0 (0.0%) | 0 (0.0%) |
| $7,500 to $9,999 | 1 (1.5%) | 0 (0.0%) |
| $10,000 to $12,499 | 19 (28.4%) | 6 (12.0%) |
| $12,500 to $14,999 | 0 (0.0%) | 2 (4.0%) |
| $15,000 to $17,499 | 0 (0.0%) | 0 (0.0%) |
| $17,500 to $19,999 | 1 (1.5%) | 2 (4.0%) |
| $20,000 to $22,499 | 0 (0.0%) | 2 (4.0%) |
| $22,500 to $24,999 | 1 (1.5%) | 2 (4.0%) |
| $25,000 to $29,999 | 2 (3.0%) | 1 (2.0%) |
| $30,000 to $34,999 | 5 (7.5%) | 9 (18.0%) |
| $35,000 to $39,999 | 0 (0.0%) | 0 (0.0%) |
| $40,000 to $44,999 | 0 (0.0%) | 0 (0.0%) |
| $45,000 to $49,999 | 2 (3.0%) | 10 (20.0%) |
| $50,000 to $54,999 | 1 (1.5%) | 0 (0.0%) |
| $55,000 to $64,999 | 7 (10.4%) | 0 (0.0%) |
| $65,000 to $74,999 | 4 (6.0%) | 2 (4.0%) |
| $75,000 to $99,999 | 6 (9.0%) | 4 (8.0%) |
| $100,000+ | 13 (19.4%) | 1 (2.0%) |
| Total | 67 (100.0%) | 50 (100.0%) |
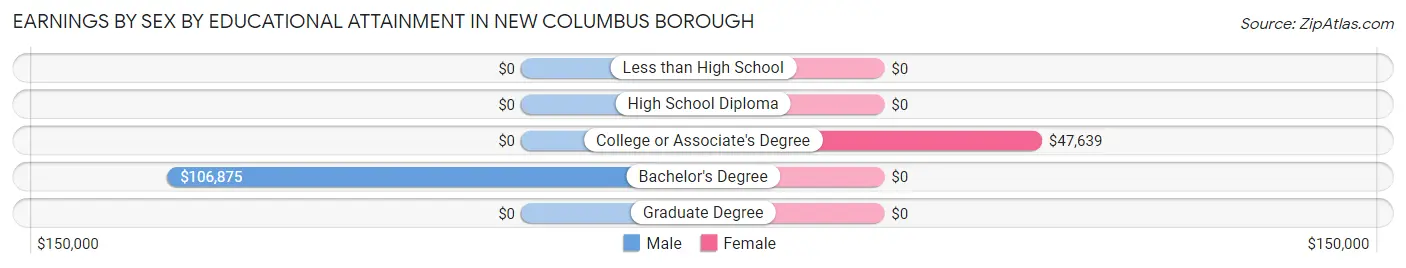
Earnings by Sex by Educational Attainment in New Columbus borough
Average earnings in New Columbus borough are $62,750 for men and $28,750 for women, a difference of 54.2%. Men with an educational attainment of bachelor's degree enjoy the highest average annual earnings of $106,875, while those with bachelor's degree education earn the least with $106,875. Women with an educational attainment of college or associate's degree earn the most with the average annual earnings of $47,639, while those with college or associate's degree education have the smallest earnings of $47,639.
| Educational Attainment | Male Income | Female Income |
| Less than High School | - | - |
| High School Diploma | - | - |
| College or Associate's Degree | - | - |
| Bachelor's Degree | $106,875 | $0 |
| Graduate Degree | - | - |
| Total | $62,750 | $28,750 |
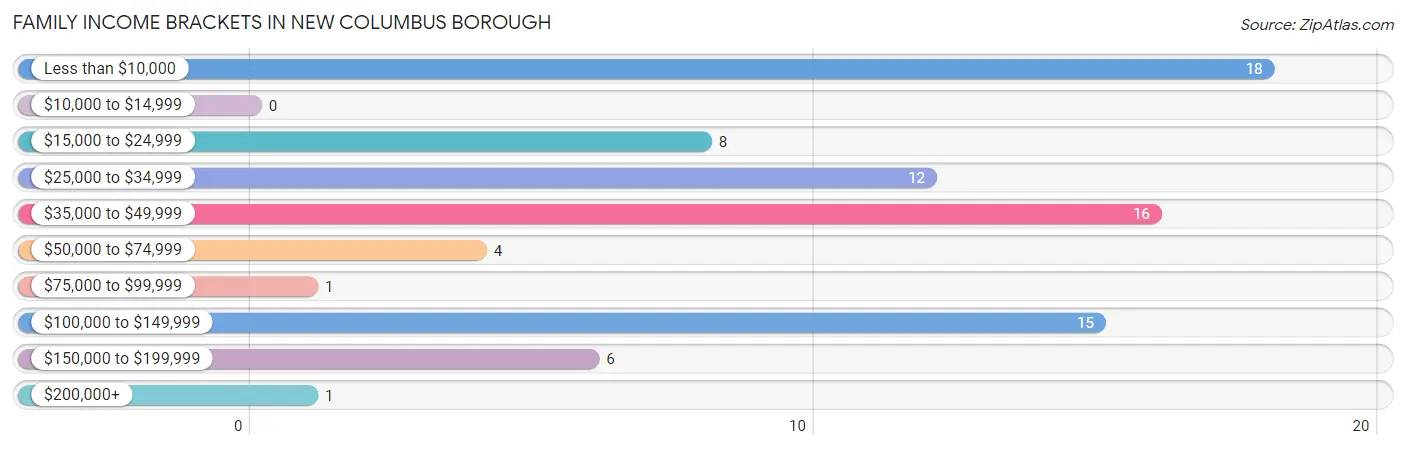
Family Income in New Columbus borough
Family Income Brackets in New Columbus borough
According to the New Columbus borough family income data, there are 18 families falling into the less than $10,000 income range, which is the most common income bracket and makes up 22.2% of all families.
| Income Bracket | # Families | % Families |
| Less than $10,000 | 18 | 22.2% |
| $10,000 to $14,999 | 0 | 0.0% |
| $15,000 to $24,999 | 8 | 9.9% |
| $25,000 to $34,999 | 12 | 14.8% |
| $35,000 to $49,999 | 16 | 19.8% |
| $50,000 to $74,999 | 4 | 4.9% |
| $75,000 to $99,999 | 1 | 1.2% |
| $100,000 to $149,999 | 15 | 18.5% |
| $150,000 to $199,999 | 6 | 7.4% |
| $200,000+ | 1 | 1.2% |
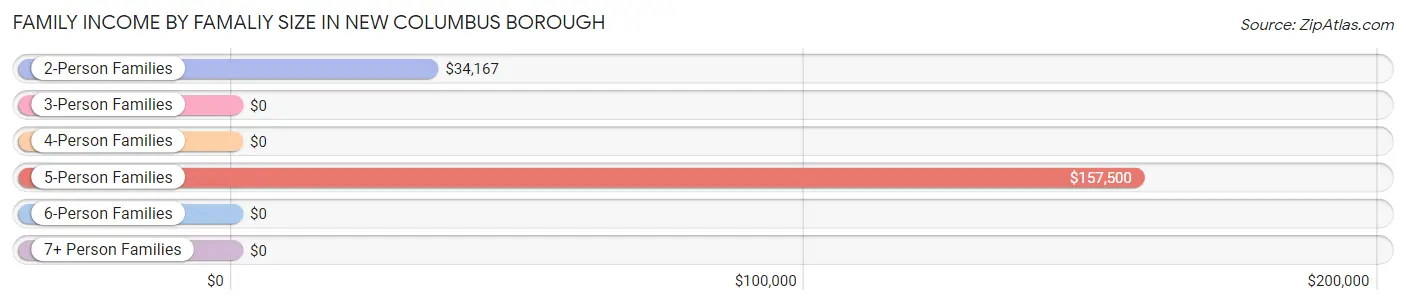
Family Income by Famaliy Size in New Columbus borough
5-person families (6 | 7.4%) account for the highest median family income in New Columbus borough with $157,500 per family, while 5-person families (6 | 7.4%) have the highest median income of $31,500 per family member.
| Income Bracket | # Families | Median Income |
| 2-Person Families | 52 (64.2%) | $34,167 |
| 3-Person Families | 13 (16.1%) | $0 |
| 4-Person Families | 10 (12.3%) | $0 |
| 5-Person Families | 6 (7.4%) | $157,500 |
| 6-Person Families | 0 (0.0%) | $0 |
| 7+ Person Families | 0 (0.0%) | $0 |
| Total | 81 (100.0%) | $35,568 |
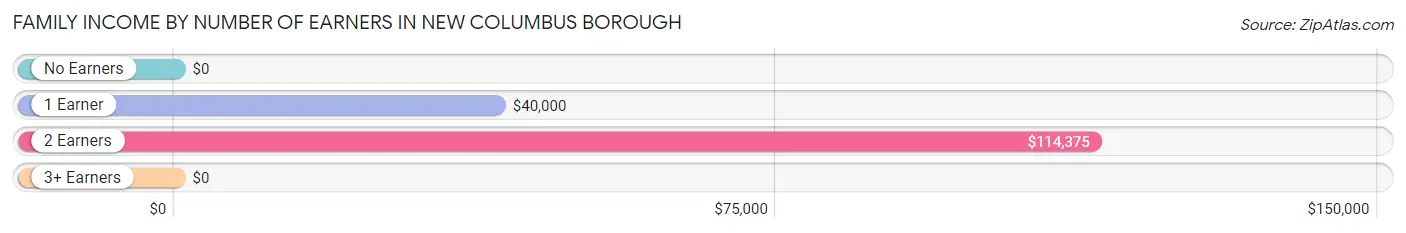
Family Income by Number of Earners in New Columbus borough
| Number of Earners | # Families | Median Income |
| No Earners | 35 (43.2%) | $0 |
| 1 Earner | 14 (17.3%) | $40,000 |
| 2 Earners | 19 (23.5%) | $114,375 |
| 3+ Earners | 13 (16.1%) | $0 |
| Total | 81 (100.0%) | $35,568 |
Household Income in New Columbus borough
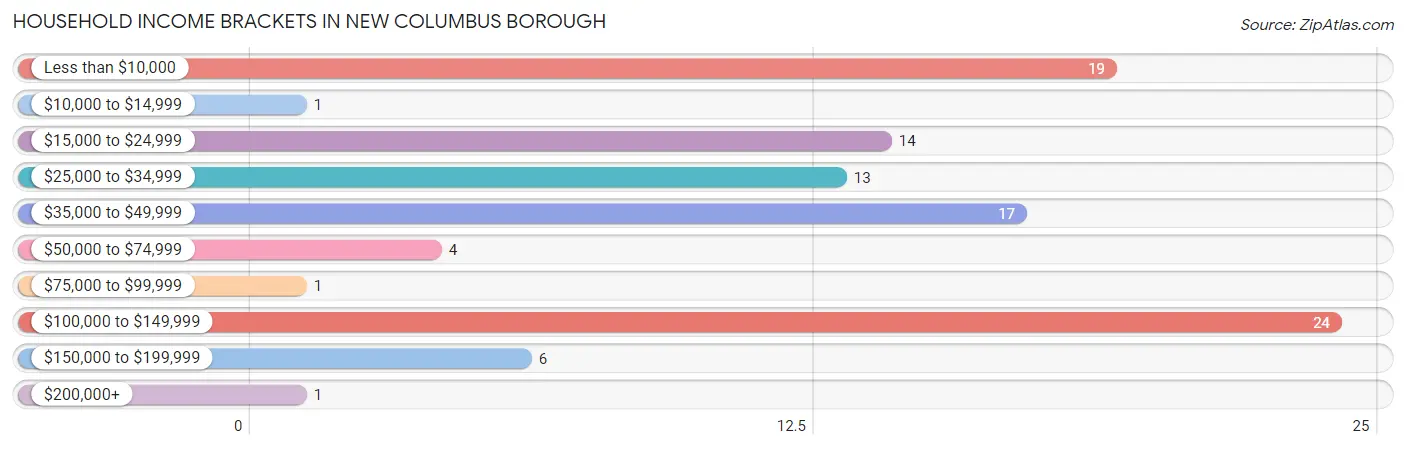
Household Income Brackets in New Columbus borough
With 24 households falling in the category, the $100,000 to $149,999 income range is the most frequent in New Columbus borough, accounting for 24.0% of all households. In contrast, only 1 households (1.0%) fall into the $10,000 to $14,999 income bracket, making it the least populous group.
| Income Bracket | # Households | % Households |
| Less than $10,000 | 19 | 19.0% |
| $10,000 to $14,999 | 1 | 1.0% |
| $15,000 to $24,999 | 14 | 14.0% |
| $25,000 to $34,999 | 13 | 13.0% |
| $35,000 to $49,999 | 17 | 17.0% |
| $50,000 to $74,999 | 4 | 4.0% |
| $75,000 to $99,999 | 1 | 1.0% |
| $100,000 to $149,999 | 24 | 24.0% |
| $150,000 to $199,999 | 6 | 6.0% |
| $200,000+ | 1 | 1.0% |
Household Income by Householder Age in New Columbus borough
| Income Bracket | # Households | Median Income |
| 15 to 24 Years | 2 (2.0%) | $0 |
| 25 to 44 Years | 19 (19.0%) | $0 |
| 45 to 64 Years | 35 (35.0%) | $0 |
| 65+ Years | 44 (44.0%) | $0 |
| Total | 100 (100.0%) | $35,625 |
Poverty in New Columbus borough
Income Below Poverty by Sex and Age in New Columbus borough
With 10.5% poverty level for males and 28.1% for females among the residents of New Columbus borough, 75 year old and over males and under 5 year old females are the most vulnerable to poverty, with 12 males (40.0%) and 4 females (100.0%) in their respective age groups living below the poverty level.
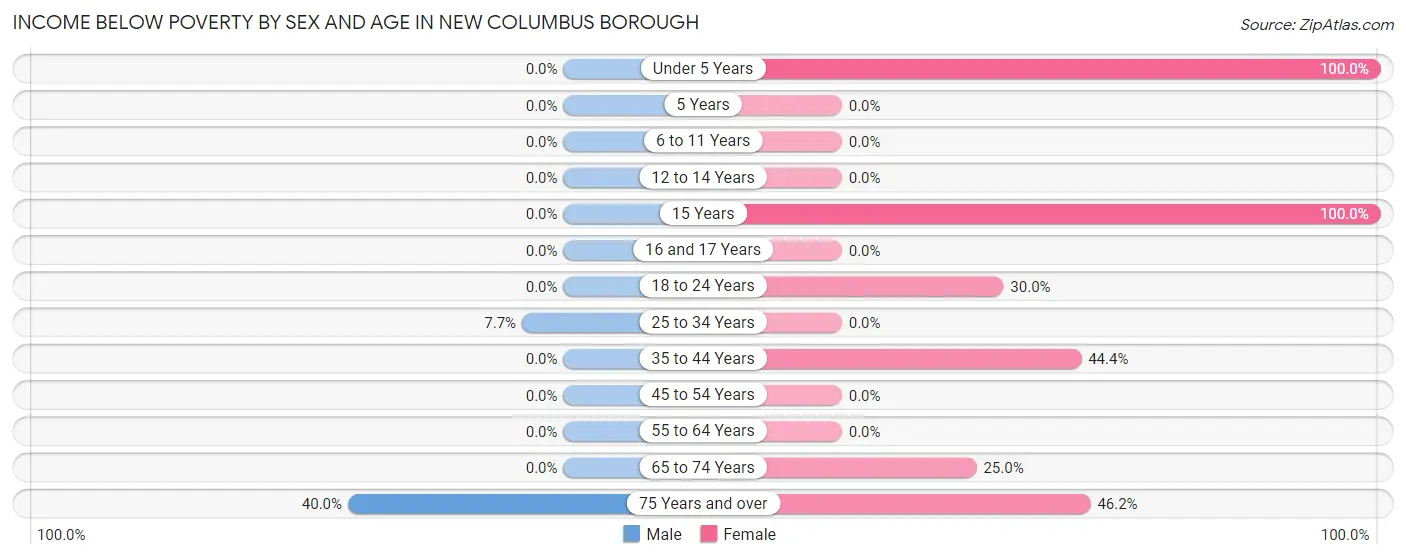
| Age Bracket | Male | Female |
| Under 5 Years | 0 (0.0%) | 4 (100.0%) |
| 5 Years | 0 (0.0%) | 0 (0.0%) |
| 6 to 11 Years | 0 (0.0%) | 0 (0.0%) |
| 12 to 14 Years | 0 (0.0%) | 0 (0.0%) |
| 15 Years | 0 (0.0%) | 4 (100.0%) |
| 16 and 17 Years | 0 (0.0%) | 0 (0.0%) |
| 18 to 24 Years | 0 (0.0%) | 3 (30.0%) |
| 25 to 34 Years | 1 (7.7%) | 0 (0.0%) |
| 35 to 44 Years | 0 (0.0%) | 4 (44.4%) |
| 45 to 54 Years | 0 (0.0%) | 0 (0.0%) |
| 55 to 64 Years | 0 (0.0%) | 0 (0.0%) |
| 65 to 74 Years | 0 (0.0%) | 1 (25.0%) |
| 75 Years and over | 12 (40.0%) | 18 (46.2%) |
| Total | 13 (10.5%) | 34 (28.1%) |
Income Above Poverty by Sex and Age in New Columbus borough
According to the poverty statistics in New Columbus borough, males aged under 5 years and females aged 5 years are the age groups that are most secure financially, with 100.0% of males and 100.0% of females in these age groups living above the poverty line.
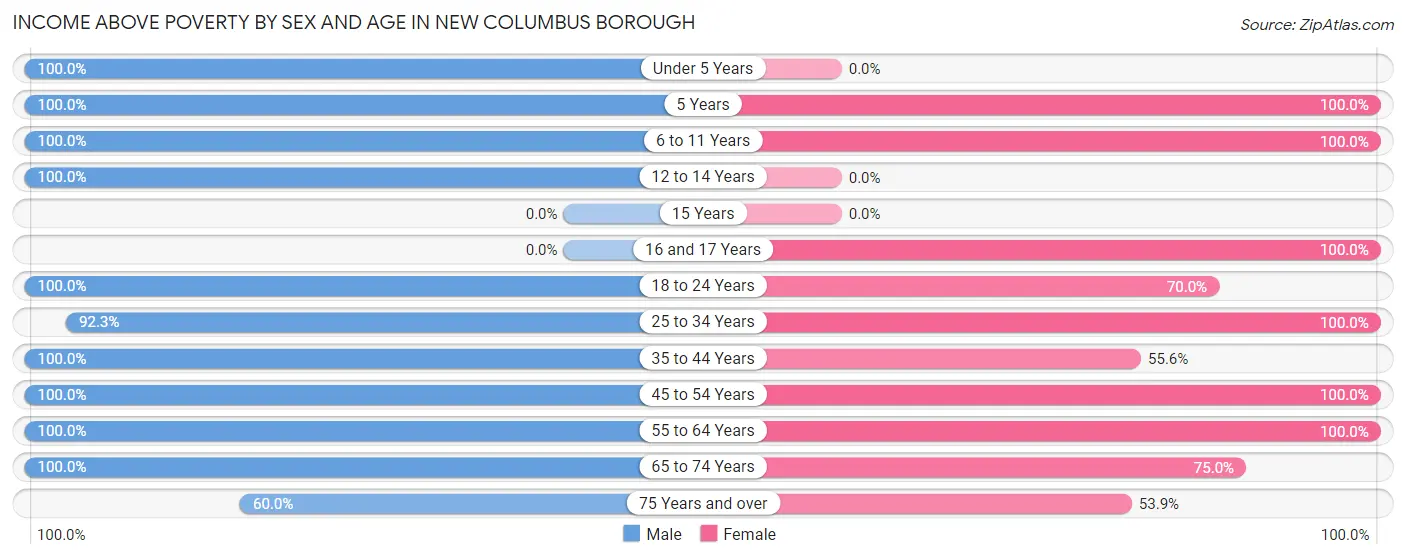
| Age Bracket | Male | Female |
| Under 5 Years | 4 (100.0%) | 0 (0.0%) |
| 5 Years | 1 (100.0%) | 1 (100.0%) |
| 6 to 11 Years | 7 (100.0%) | 6 (100.0%) |
| 12 to 14 Years | 3 (100.0%) | 0 (0.0%) |
| 15 Years | 0 (0.0%) | 0 (0.0%) |
| 16 and 17 Years | 0 (0.0%) | 3 (100.0%) |
| 18 to 24 Years | 16 (100.0%) | 7 (70.0%) |
| 25 to 34 Years | 12 (92.3%) | 12 (100.0%) |
| 35 to 44 Years | 5 (100.0%) | 5 (55.6%) |
| 45 to 54 Years | 16 (100.0%) | 13 (100.0%) |
| 55 to 64 Years | 25 (100.0%) | 16 (100.0%) |
| 65 to 74 Years | 4 (100.0%) | 3 (75.0%) |
| 75 Years and over | 18 (60.0%) | 21 (53.8%) |
| Total | 111 (89.5%) | 87 (71.9%) |
Income Below Poverty Among Married-Couple Families in New Columbus borough
The poverty statistics for married-couple families in New Columbus borough show that 25.7% or 18 of the total 70 families live below the poverty line. Families with no children have the highest poverty rate of 31.6%, comprising of 18 families. On the other hand, families with 1 or 2 children have the lowest poverty rate of 0.0%, which includes 0 families.
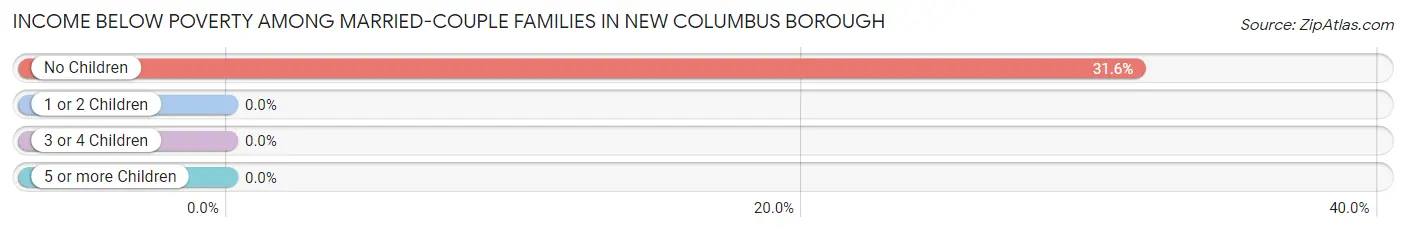
| Children | Above Poverty | Below Poverty |
| No Children | 39 (68.4%) | 18 (31.6%) |
| 1 or 2 Children | 10 (100.0%) | 0 (0.0%) |
| 3 or 4 Children | 3 (100.0%) | 0 (0.0%) |
| 5 or more Children | 0 (0.0%) | 0 (0.0%) |
| Total | 52 (74.3%) | 18 (25.7%) |
Income Below Poverty Among Single-Parent Households in New Columbus borough
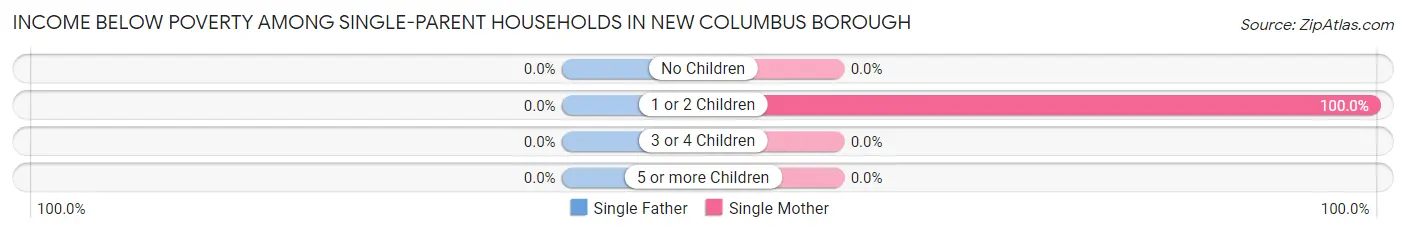
| Children | Single Father | Single Mother |
| No Children | 0 (0.0%) | 0 (0.0%) |
| 1 or 2 Children | 0 (0.0%) | 4 (100.0%) |
| 3 or 4 Children | 0 (0.0%) | 0 (0.0%) |
| 5 or more Children | 0 (0.0%) | 0 (0.0%) |
| Total | 0 (0.0%) | 4 (40.0%) |
Income Below Poverty Among Married-Couple vs Single-Parent Households in New Columbus borough
The poverty data for New Columbus borough shows that 18 of the married-couple family households (25.7%) and 4 of the single-parent households (36.4%) are living below the poverty level. Within the married-couple family households, those with no children have the highest poverty rate, with 18 households (31.6%) falling below the poverty line. Among the single-parent households, those with 1 or 2 children have the highest poverty rate, with 4 household (100.0%) living below poverty.
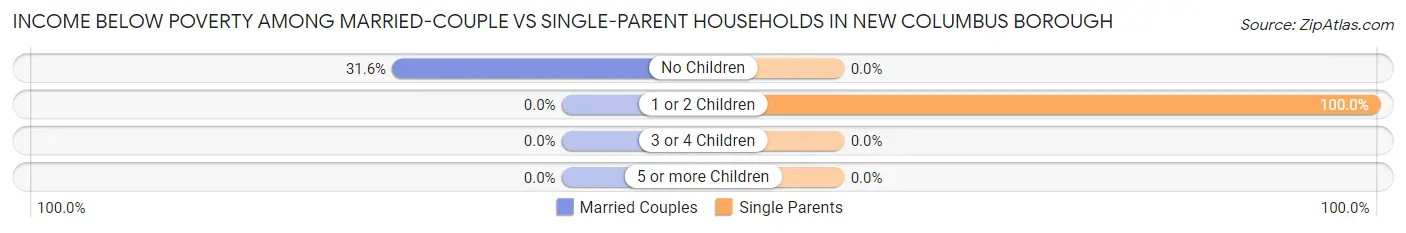
| Children | Married-Couple Families | Single-Parent Households |
| No Children | 18 (31.6%) | 0 (0.0%) |
| 1 or 2 Children | 0 (0.0%) | 4 (100.0%) |
| 3 or 4 Children | 0 (0.0%) | 0 (0.0%) |
| 5 or more Children | 0 (0.0%) | 0 (0.0%) |
| Total | 18 (25.7%) | 4 (36.4%) |
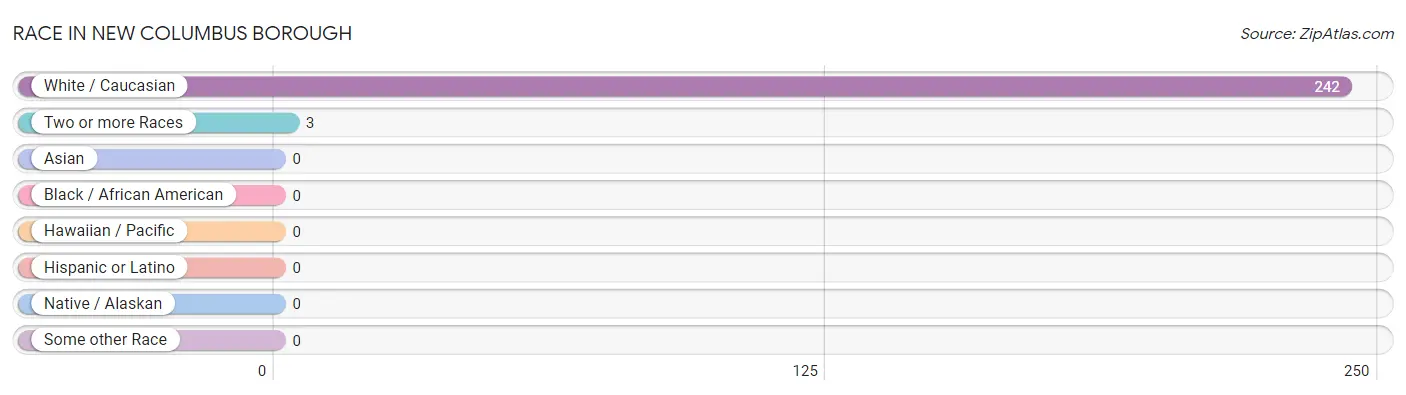
Race in New Columbus borough
The most populous races in New Columbus borough are White / Caucasian (242 | 98.8%), and Two or more Races (3 | 1.2%).
| Race | # Population | % Population |
| Asian | 0 | 0.0% |
| Black / African American | 0 | 0.0% |
| Hawaiian / Pacific | 0 | 0.0% |
| Hispanic or Latino | 0 | 0.0% |
| Native / Alaskan | 0 | 0.0% |
| White / Caucasian | 242 | 98.8% |
| Two or more Races | 3 | 1.2% |
| Some other Race | 0 | 0.0% |
| Total | 245 | 100.0% |
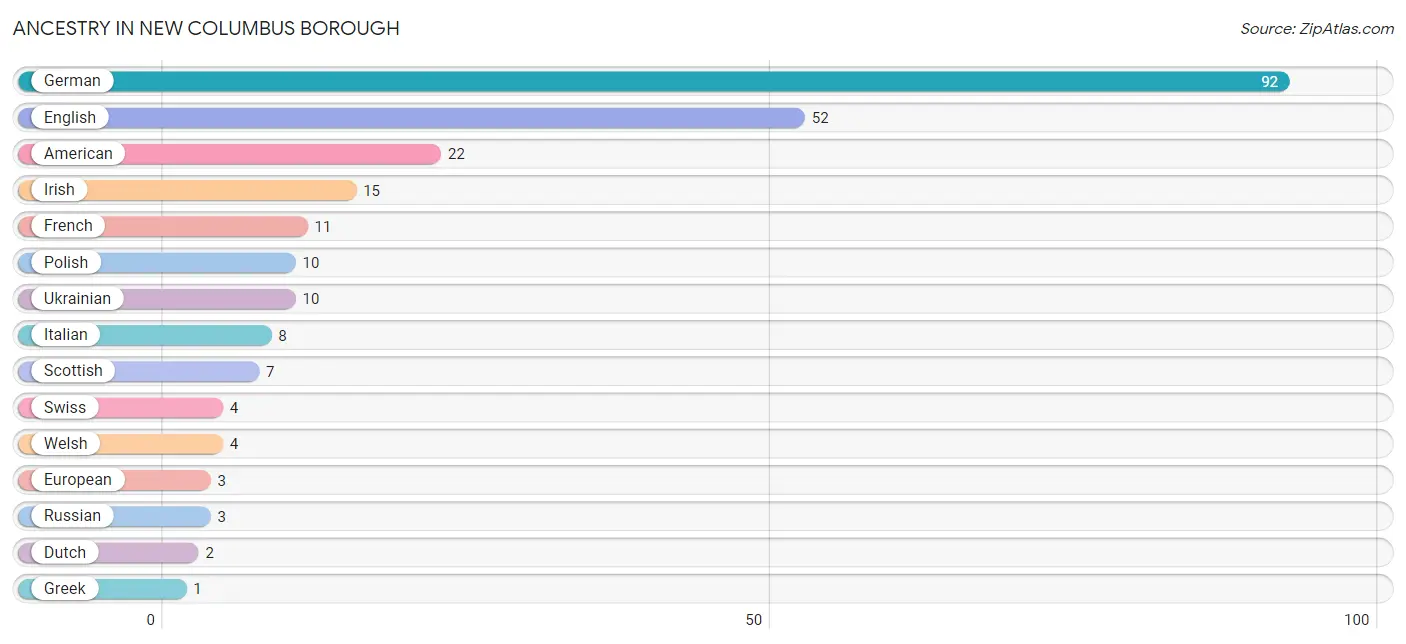
Ancestry in New Columbus borough
The most populous ancestries reported in New Columbus borough are German (92 | 37.6%), English (52 | 21.2%), American (22 | 9.0%), Irish (15 | 6.1%), and French (11 | 4.5%), together accounting for 78.4% of all New Columbus borough residents.
| Ancestry | # Population | % Population |
| American | 22 | 9.0% |
| Dutch | 2 | 0.8% |
| English | 52 | 21.2% |
| European | 3 | 1.2% |
| French | 11 | 4.5% |
| German | 92 | 37.6% |
| Greek | 1 | 0.4% |
| Irish | 15 | 6.1% |
| Italian | 8 | 3.3% |
| Polish | 10 | 4.1% |
| Russian | 3 | 1.2% |
| Scottish | 7 | 2.9% |
| Swedish | 1 | 0.4% |
| Swiss | 4 | 1.6% |
| Ukrainian | 10 | 4.1% |
| Welsh | 4 | 1.6% | View All 16 Rows |
Immigrants in New Columbus borough

| Immigration Origin | # Population | % Population | View All 0 Rows |
Sex and Age in New Columbus borough
Sex and Age in New Columbus borough
The most populous age groups in New Columbus borough are 20 to 24 Years (16 | 12.9%) for men and 75 to 79 Years (23 | 19.0%) for women.
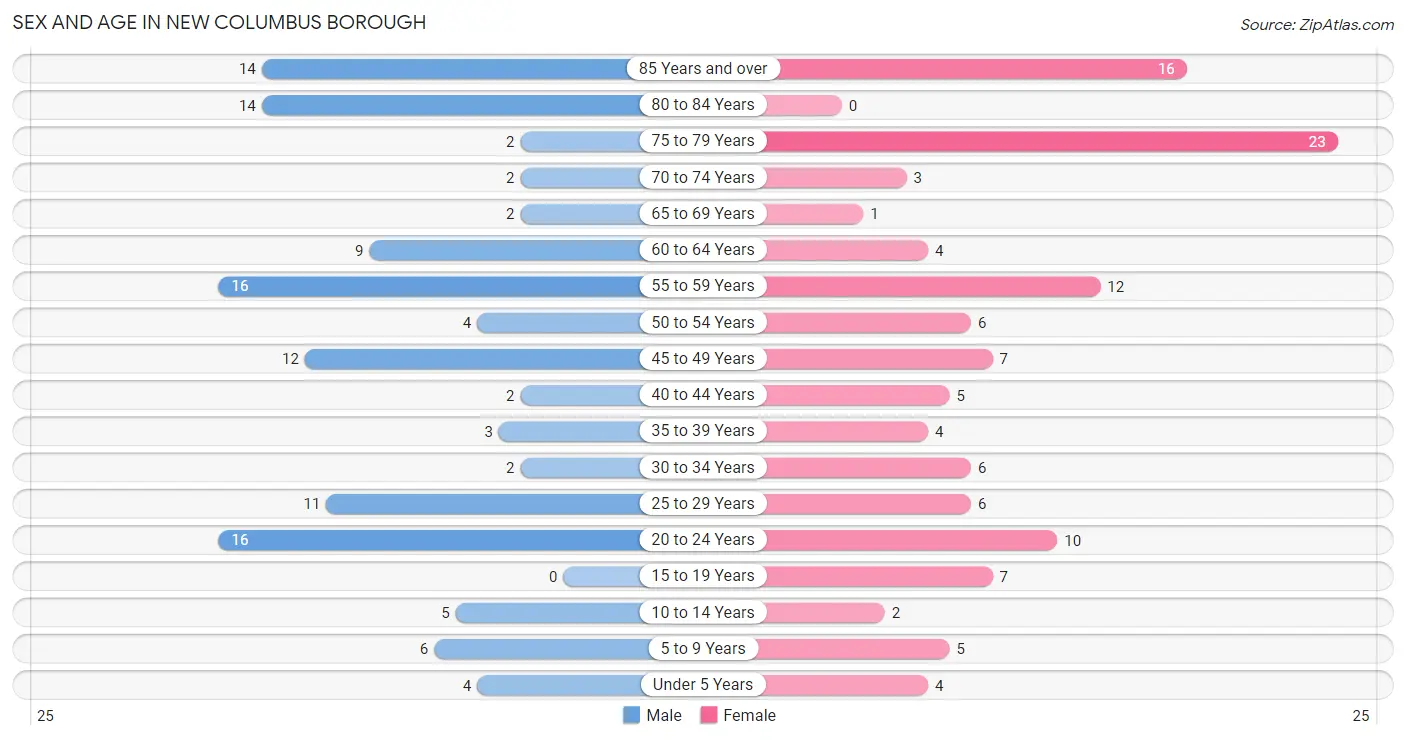
| Age Bracket | Male | Female |
| Under 5 Years | 4 (3.2%) | 4 (3.3%) |
| 5 to 9 Years | 6 (4.8%) | 5 (4.1%) |
| 10 to 14 Years | 5 (4.0%) | 2 (1.7%) |
| 15 to 19 Years | 0 (0.0%) | 7 (5.8%) |
| 20 to 24 Years | 16 (12.9%) | 10 (8.3%) |
| 25 to 29 Years | 11 (8.9%) | 6 (5.0%) |
| 30 to 34 Years | 2 (1.6%) | 6 (5.0%) |
| 35 to 39 Years | 3 (2.4%) | 4 (3.3%) |
| 40 to 44 Years | 2 (1.6%) | 5 (4.1%) |
| 45 to 49 Years | 12 (9.7%) | 7 (5.8%) |
| 50 to 54 Years | 4 (3.2%) | 6 (5.0%) |
| 55 to 59 Years | 16 (12.9%) | 12 (9.9%) |
| 60 to 64 Years | 9 (7.3%) | 4 (3.3%) |
| 65 to 69 Years | 2 (1.6%) | 1 (0.8%) |
| 70 to 74 Years | 2 (1.6%) | 3 (2.5%) |
| 75 to 79 Years | 2 (1.6%) | 23 (19.0%) |
| 80 to 84 Years | 14 (11.3%) | 0 (0.0%) |
| 85 Years and over | 14 (11.3%) | 16 (13.2%) |
| Total | 124 (100.0%) | 121 (100.0%) |
Families and Households in New Columbus borough
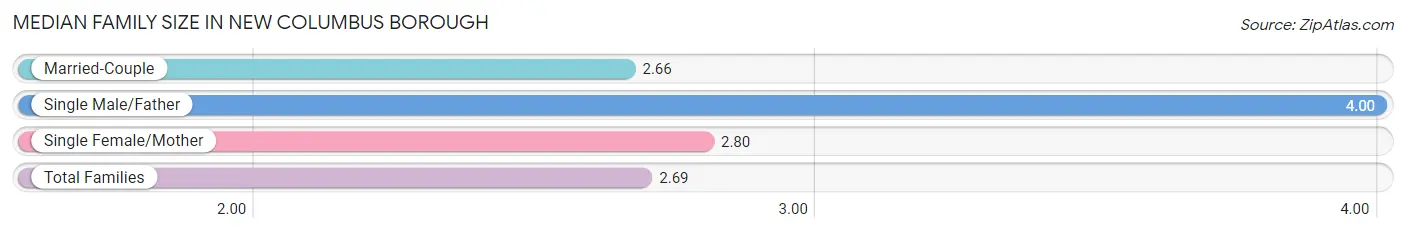
Median Family Size in New Columbus borough
The median family size in New Columbus borough is 2.69 persons per family, with single male/father families (1 | 1.2%) accounting for the largest median family size of 4 persons per family. On the other hand, married-couple families (70 | 86.4%) represent the smallest median family size with 2.66 persons per family.
| Family Type | # Families | Family Size |
| Married-Couple | 70 (86.4%) | 2.66 |
| Single Male/Father | 1 (1.2%) | 4.00 |
| Single Female/Mother | 10 (12.3%) | 2.80 |
| Total Families | 81 (100.0%) | 2.69 |
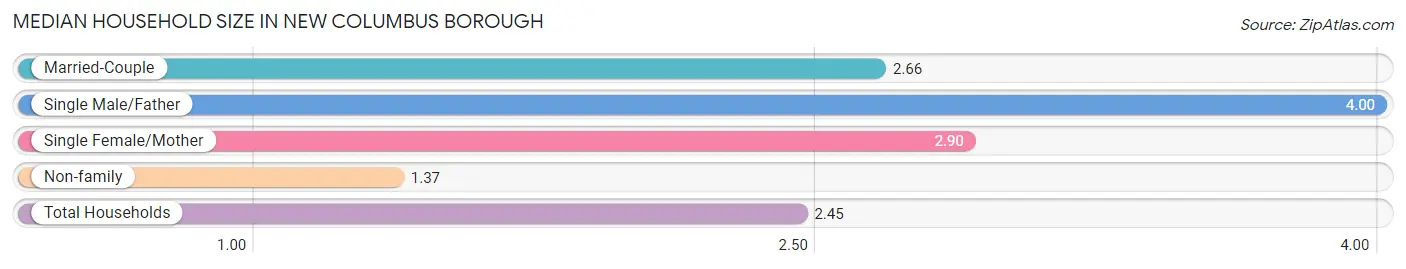
Median Household Size in New Columbus borough
The median household size in New Columbus borough is 2.45 persons per household, with single male/father households (1 | 1.0%) accounting for the largest median household size of 4 persons per household. non-family households (19 | 19.0%) represent the smallest median household size with 1.37 persons per household.
| Household Type | # Households | Household Size |
| Married-Couple | 70 (70.0%) | 2.66 |
| Single Male/Father | 1 (1.0%) | 4.00 |
| Single Female/Mother | 10 (10.0%) | 2.90 |
| Non-family | 19 (19.0%) | 1.37 |
| Total Households | 100 (100.0%) | 2.45 |
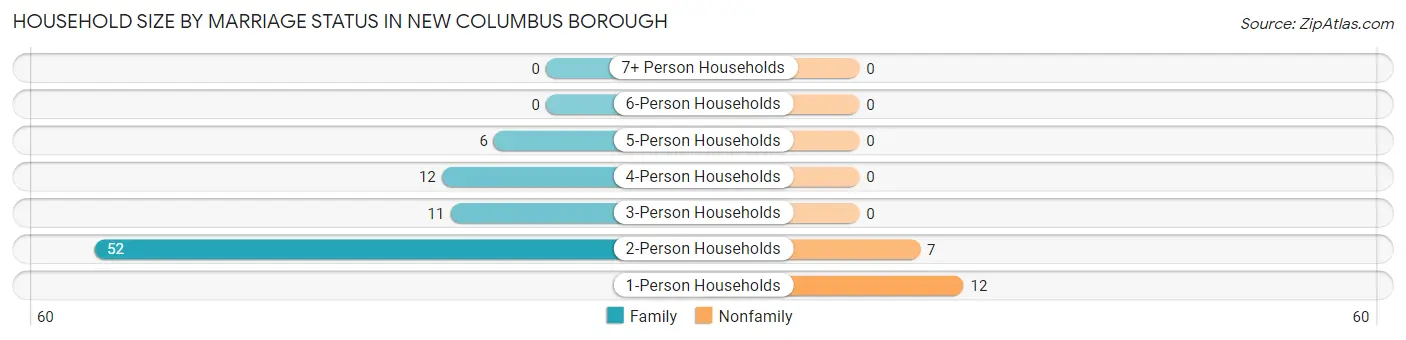
Household Size by Marriage Status in New Columbus borough
Out of a total of 100 households in New Columbus borough, 81 (81.0%) are family households, while 19 (19.0%) are nonfamily households. The most numerous type of family households are 2-person households, comprising 52, and the most common type of nonfamily households are 1-person households, comprising 12.
| Household Size | Family Households | Nonfamily Households |
| 1-Person Households | - | 12 (12.0%) |
| 2-Person Households | 52 (52.0%) | 7 (7.0%) |
| 3-Person Households | 11 (11.0%) | 0 (0.0%) |
| 4-Person Households | 12 (12.0%) | 0 (0.0%) |
| 5-Person Households | 6 (6.0%) | 0 (0.0%) |
| 6-Person Households | 0 (0.0%) | 0 (0.0%) |
| 7+ Person Households | 0 (0.0%) | 0 (0.0%) |
| Total | 81 (81.0%) | 19 (19.0%) |
Female Fertility in New Columbus borough
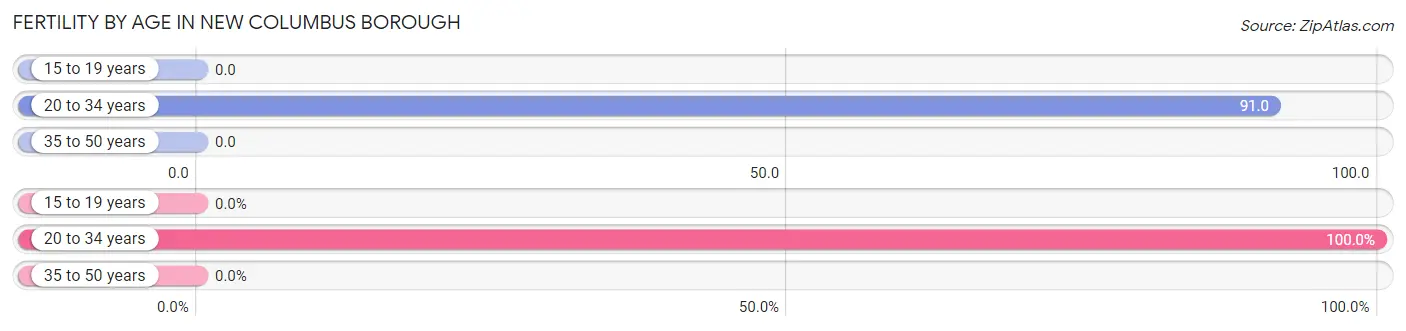
Fertility by Age in New Columbus borough
Average fertility rate in New Columbus borough is 40.0 births per 1,000 women. Women in the age bracket of 20 to 34 years have the highest fertility rate with 91.0 births per 1,000 women. Women in the age bracket of 20 to 34 years acount for 100.0% of all women with births.
| Age Bracket | Women with Births | Births / 1,000 Women |
| 15 to 19 years | 0 (0.0%) | 0.0 |
| 20 to 34 years | 2 (100.0%) | 91.0 |
| 35 to 50 years | 0 (0.0%) | 0.0 |
| Total | 2 (100.0%) | 40.0 |
Fertility by Age by Marriage Status in New Columbus borough
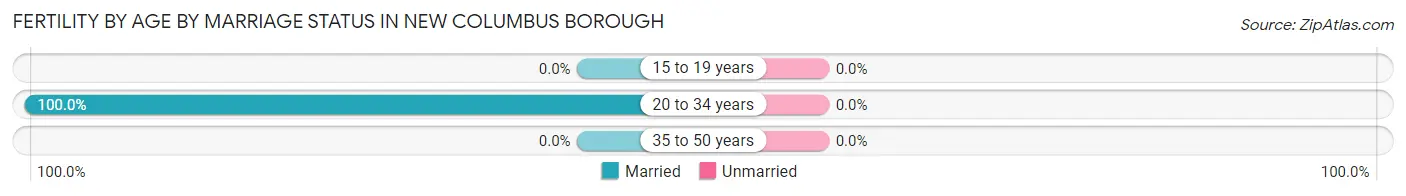
| Age Bracket | Married | Unmarried |
| 15 to 19 years | 0 (0.0%) | 0 (0.0%) |
| 20 to 34 years | 2 (100.0%) | 0 (0.0%) |
| 35 to 50 years | 0 (0.0%) | 0 (0.0%) |
| Total | 2 (100.0%) | 0 (0.0%) |
Fertility by Education in New Columbus borough
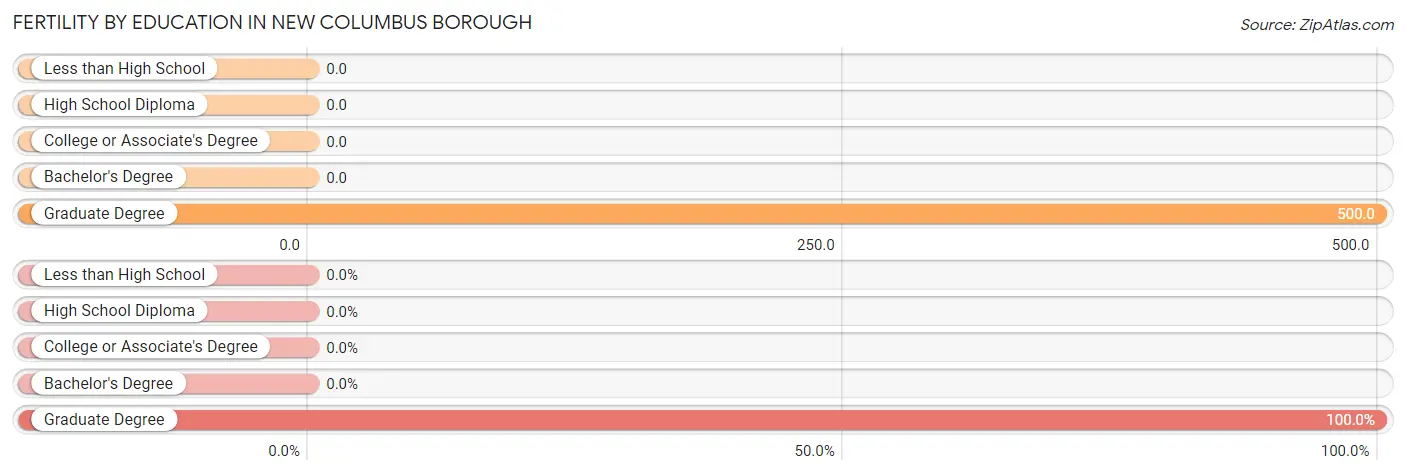
| Educational Attainment | Women with Births | Births / 1,000 Women |
| Less than High School | 0 (0.0%) | 0.0 |
| High School Diploma | 0 (0.0%) | 0.0 |
| College or Associate's Degree | 0 (0.0%) | 0.0 |
| Bachelor's Degree | 0 (0.0%) | 0.0 |
| Graduate Degree | 2 (100.0%) | 500.0 |
| Total | 2 (100.0%) | 40.0 |
Fertility by Education by Marriage Status in New Columbus borough
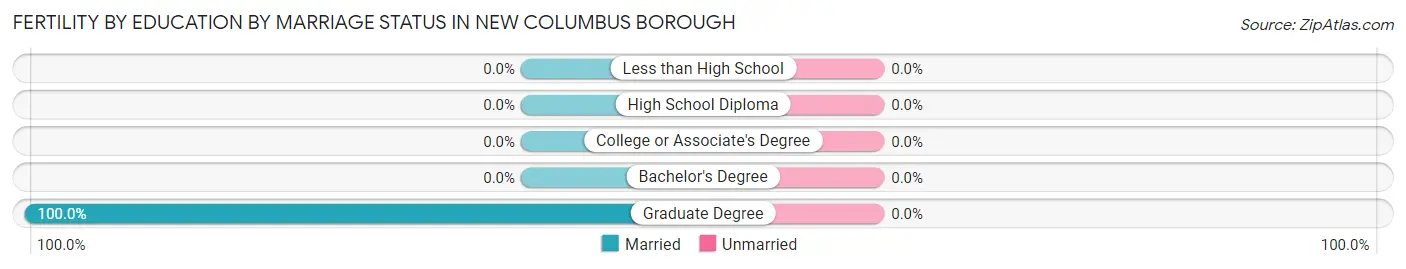
| Educational Attainment | Married | Unmarried |
| Less than High School | 0 (0.0%) | 0 (0.0%) |
| High School Diploma | 0 (0.0%) | 0 (0.0%) |
| College or Associate's Degree | 0 (0.0%) | 0 (0.0%) |
| Bachelor's Degree | 0 (0.0%) | 0 (0.0%) |
| Graduate Degree | 2 (100.0%) | 0 (0.0%) |
| Total | 2 (100.0%) | 0 (0.0%) |
Employment Characteristics in New Columbus borough
Employment by Class of Employer in New Columbus borough
Among the 111 employed individuals in New Columbus borough, private company employees (74 | 66.7%), local government employees (11 | 9.9%), and self-employed (not incorporated) (6 | 5.4%) make up the most common classes of employment.
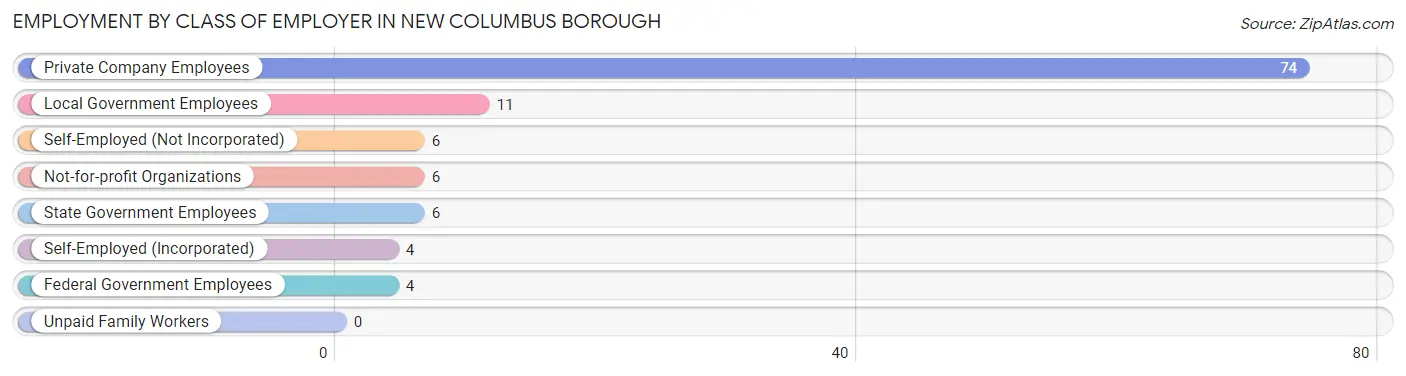
| Employer Class | # Employees | % Employees |
| Private Company Employees | 74 | 66.7% |
| Self-Employed (Incorporated) | 4 | 3.6% |
| Self-Employed (Not Incorporated) | 6 | 5.4% |
| Not-for-profit Organizations | 6 | 5.4% |
| Local Government Employees | 11 | 9.9% |
| State Government Employees | 6 | 5.4% |
| Federal Government Employees | 4 | 3.6% |
| Unpaid Family Workers | 0 | 0.0% |
| Total | 111 | 100.0% |
Employment Status by Age in New Columbus borough
According to the labor force statistics for New Columbus borough, out of the total population over 16 years of age (215), 53.0% or 114 individuals are in the labor force, with 0.9% or 1 of them unemployed. The age group with the highest labor force participation rate is 45 to 54 years, with 96.6% or 28 individuals in the labor force. Within the labor force, the 25 to 29 years age range has the highest percentage of unemployed individuals, with 7.7% or 1 of them being unemployed.
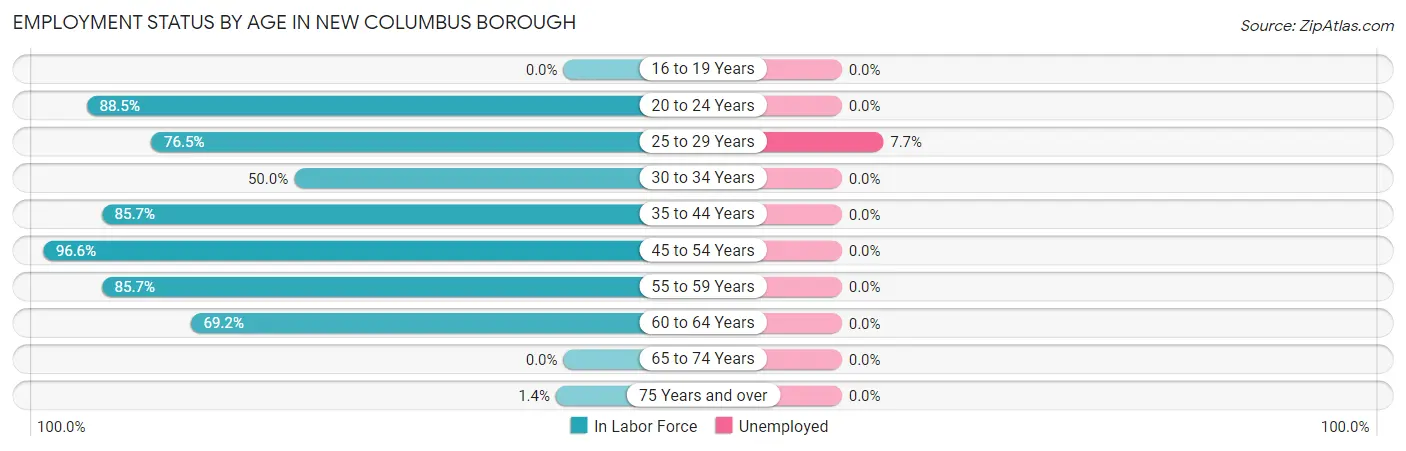
| Age Bracket | In Labor Force | Unemployed |
| 16 to 19 Years | 0 (0.0%) | 0 (0.0%) |
| 20 to 24 Years | 23 (88.5%) | 0 (0.0%) |
| 25 to 29 Years | 13 (76.5%) | 1 (7.7%) |
| 30 to 34 Years | 4 (50.0%) | 0 (0.0%) |
| 35 to 44 Years | 12 (85.7%) | 0 (0.0%) |
| 45 to 54 Years | 28 (96.6%) | 0 (0.0%) |
| 55 to 59 Years | 24 (85.7%) | 0 (0.0%) |
| 60 to 64 Years | 9 (69.2%) | 0 (0.0%) |
| 65 to 74 Years | 0 (0.0%) | 0 (0.0%) |
| 75 Years and over | 1 (1.4%) | 0 (0.0%) |
| Total | 114 (53.0%) | 1 (0.9%) |
Employment Status by Educational Attainment in New Columbus borough
According to labor force statistics for New Columbus borough, 82.6% of individuals (90) out of the total population between 25 and 64 years of age (109) are in the labor force, with 1.1% or 1 of them being unemployed. The group with the highest labor force participation rate are those with the educational attainment of bachelor's degree or higher, with 94.1% or 16 individuals in the labor force. Within the labor force, individuals with college / associate degree education have the highest percentage of unemployment, with 3.3% or 1 of them being unemployed.
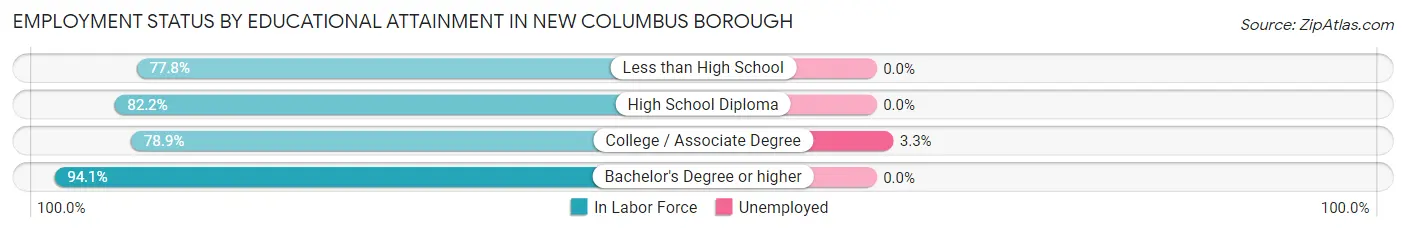
| Educational Attainment | In Labor Force | Unemployed |
| Less than High School | 7 (77.8%) | 0 (0.0%) |
| High School Diploma | 37 (82.2%) | 0 (0.0%) |
| College / Associate Degree | 30 (78.9%) | 1 (3.3%) |
| Bachelor's Degree or higher | 16 (94.1%) | 0 (0.0%) |
| Total | 90 (82.6%) | 1 (1.1%) |
Employment Occupations by Sex in New Columbus borough
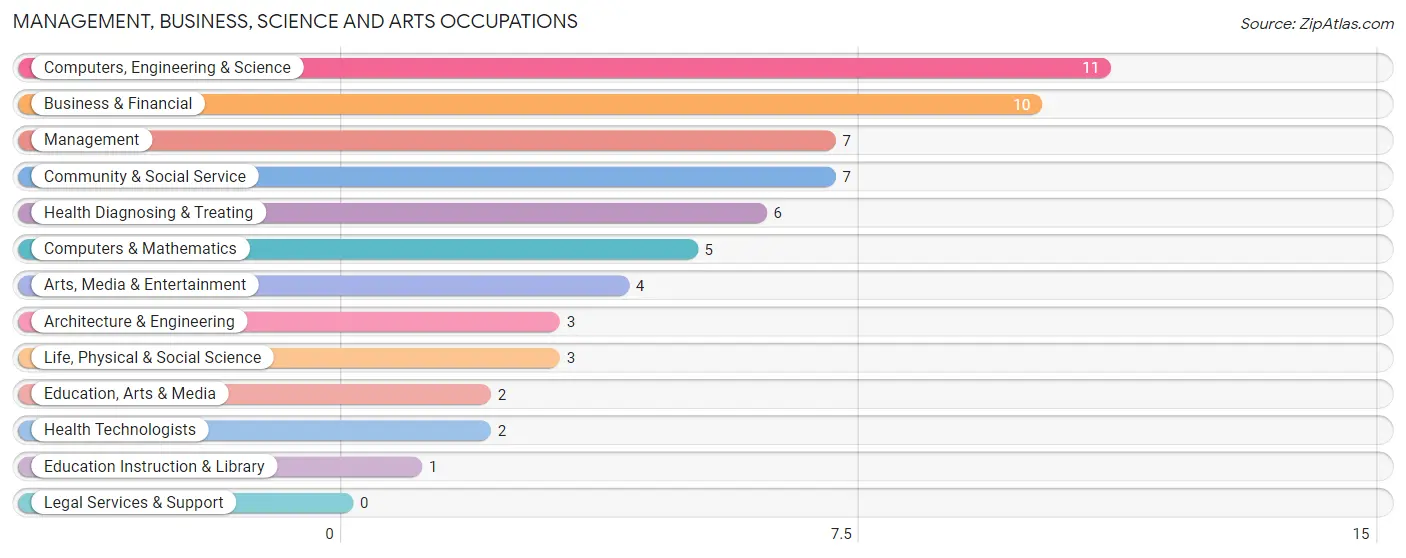
Management, Business, Science and Arts Occupations
The most common Management, Business, Science and Arts occupations in New Columbus borough are Computers, Engineering & Science (11 | 9.7%), Business & Financial (10 | 8.8%), Management (7 | 6.2%), Community & Social Service (7 | 6.2%), and Health Diagnosing & Treating (6 | 5.3%).
Management, Business, Science and Arts Occupations by Sex
Within the Management, Business, Science and Arts occupations in New Columbus borough, the most male-oriented occupations are Management (100.0%), Architecture & Engineering (100.0%), and Life, Physical & Social Science (100.0%), while the most female-oriented occupations are Community & Social Service (100.0%), Education, Arts & Media (100.0%), and Education Instruction & Library (100.0%).
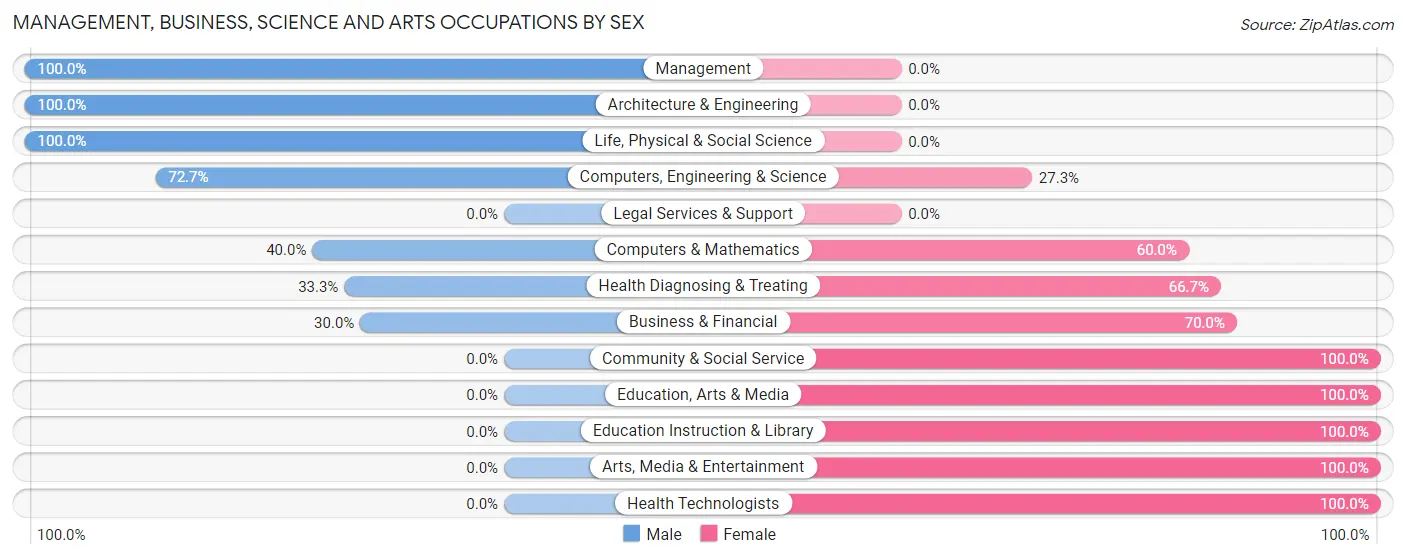
| Occupation | Male | Female |
| Management | 7 (100.0%) | 0 (0.0%) |
| Business & Financial | 3 (30.0%) | 7 (70.0%) |
| Computers, Engineering & Science | 8 (72.7%) | 3 (27.3%) |
| Computers & Mathematics | 2 (40.0%) | 3 (60.0%) |
| Architecture & Engineering | 3 (100.0%) | 0 (0.0%) |
| Life, Physical & Social Science | 3 (100.0%) | 0 (0.0%) |
| Community & Social Service | 0 (0.0%) | 7 (100.0%) |
| Education, Arts & Media | 0 (0.0%) | 2 (100.0%) |
| Legal Services & Support | 0 (0.0%) | 0 (0.0%) |
| Education Instruction & Library | 0 (0.0%) | 1 (100.0%) |
| Arts, Media & Entertainment | 0 (0.0%) | 4 (100.0%) |
| Health Diagnosing & Treating | 2 (33.3%) | 4 (66.7%) |
| Health Technologists | 0 (0.0%) | 2 (100.0%) |
| Total (Category) | 20 (48.8%) | 21 (51.2%) |
| Total (Overall) | 66 (58.4%) | 47 (41.6%) |
Services Occupations
The most common Services occupations in New Columbus borough are Healthcare Support (2 | 1.8%), Personal Care & Service (2 | 1.8%), and Food Preparation & Serving (1 | 0.9%).
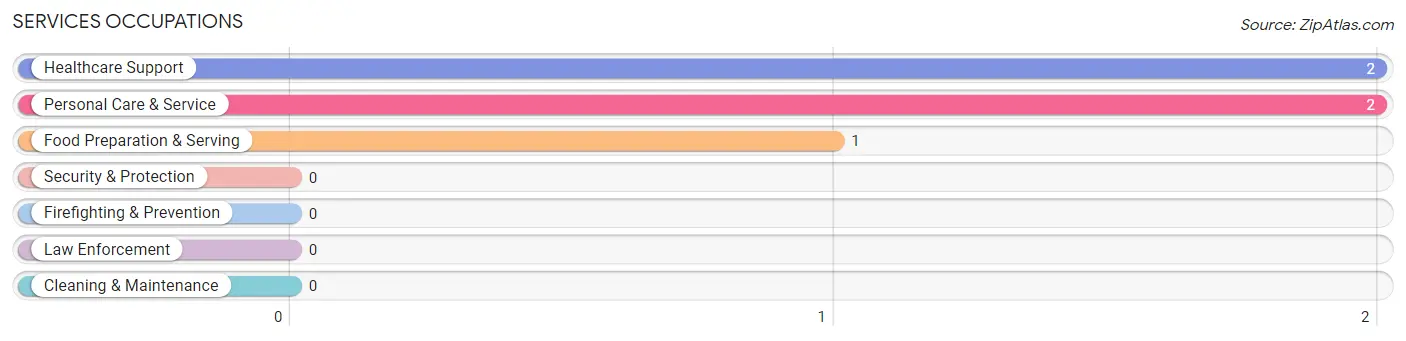
Services Occupations by Sex
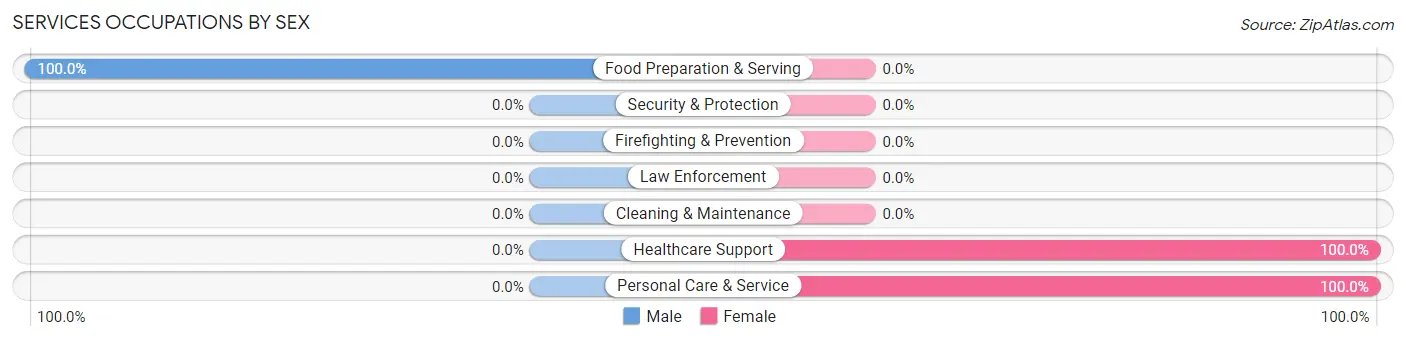
| Occupation | Male | Female |
| Healthcare Support | 0 (0.0%) | 2 (100.0%) |
| Security & Protection | 0 (0.0%) | 0 (0.0%) |
| Firefighting & Prevention | 0 (0.0%) | 0 (0.0%) |
| Law Enforcement | 0 (0.0%) | 0 (0.0%) |
| Food Preparation & Serving | 1 (100.0%) | 0 (0.0%) |
| Cleaning & Maintenance | 0 (0.0%) | 0 (0.0%) |
| Personal Care & Service | 0 (0.0%) | 2 (100.0%) |
| Total (Category) | 1 (20.0%) | 4 (80.0%) |
| Total (Overall) | 66 (58.4%) | 47 (41.6%) |
Sales and Office Occupations
The most common Sales and Office occupations in New Columbus borough are Sales & Related (15 | 13.3%), and Office & Administration (8 | 7.1%).
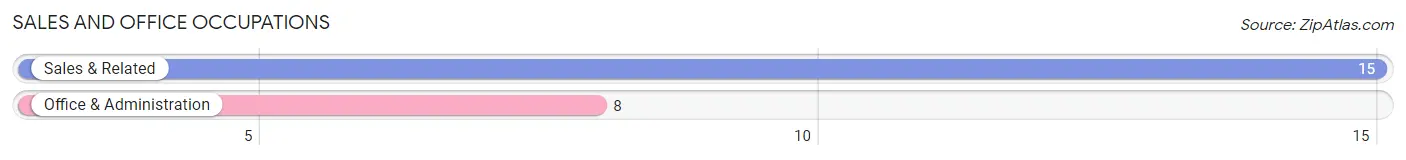
Sales and Office Occupations by Sex
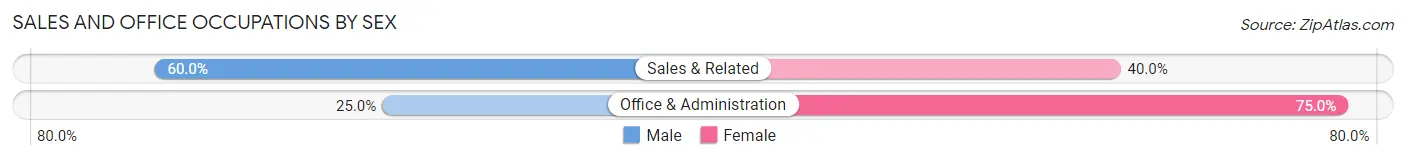
| Occupation | Male | Female |
| Sales & Related | 9 (60.0%) | 6 (40.0%) |
| Office & Administration | 2 (25.0%) | 6 (75.0%) |
| Total (Category) | 11 (47.8%) | 12 (52.2%) |
| Total (Overall) | 66 (58.4%) | 47 (41.6%) |
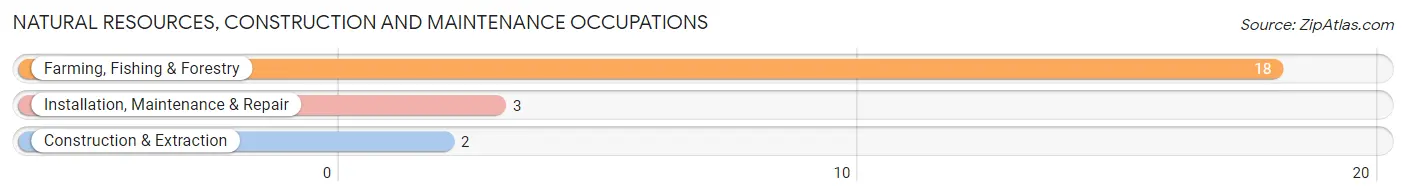
Natural Resources, Construction and Maintenance Occupations
The most common Natural Resources, Construction and Maintenance occupations in New Columbus borough are Farming, Fishing & Forestry (18 | 15.9%), Installation, Maintenance & Repair (3 | 2.6%), and Construction & Extraction (2 | 1.8%).
Natural Resources, Construction and Maintenance Occupations by Sex
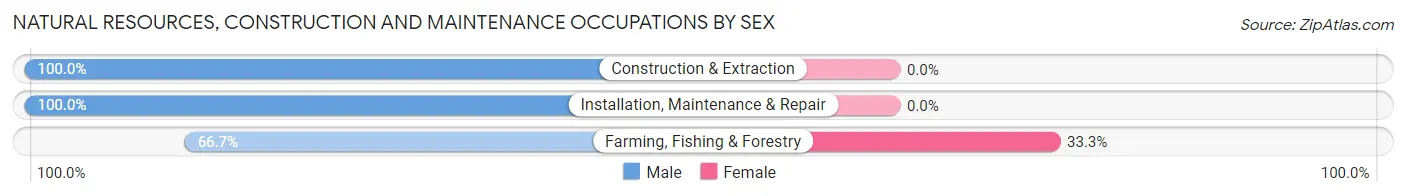
| Occupation | Male | Female |
| Farming, Fishing & Forestry | 12 (66.7%) | 6 (33.3%) |
| Construction & Extraction | 2 (100.0%) | 0 (0.0%) |
| Installation, Maintenance & Repair | 3 (100.0%) | 0 (0.0%) |
| Total (Category) | 17 (73.9%) | 6 (26.1%) |
| Total (Overall) | 66 (58.4%) | 47 (41.6%) |
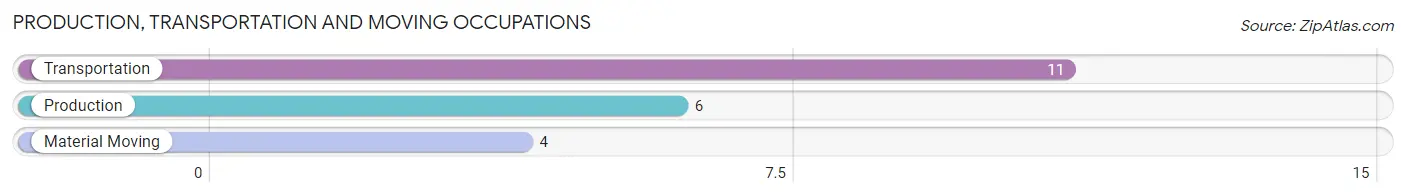
Production, Transportation and Moving Occupations
The most common Production, Transportation and Moving occupations in New Columbus borough are Transportation (11 | 9.7%), Production (6 | 5.3%), and Material Moving (4 | 3.5%).
Production, Transportation and Moving Occupations by Sex
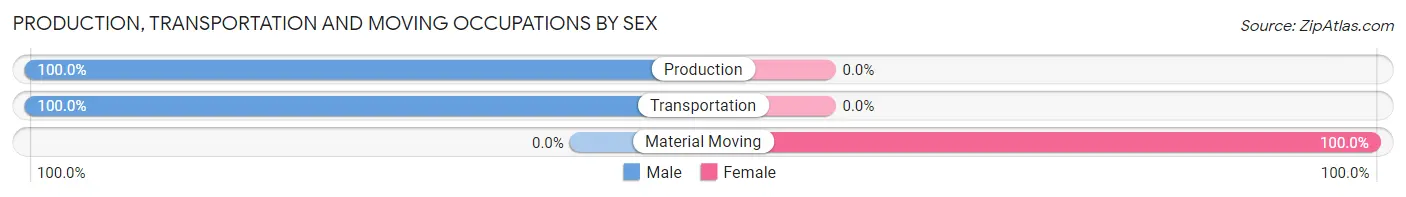
| Occupation | Male | Female |
| Production | 6 (100.0%) | 0 (0.0%) |
| Transportation | 11 (100.0%) | 0 (0.0%) |
| Material Moving | 0 (0.0%) | 4 (100.0%) |
| Total (Category) | 17 (80.9%) | 4 (19.1%) |
| Total (Overall) | 66 (58.4%) | 47 (41.6%) |
Employment Industries by Sex in New Columbus borough
Employment Industries in New Columbus borough
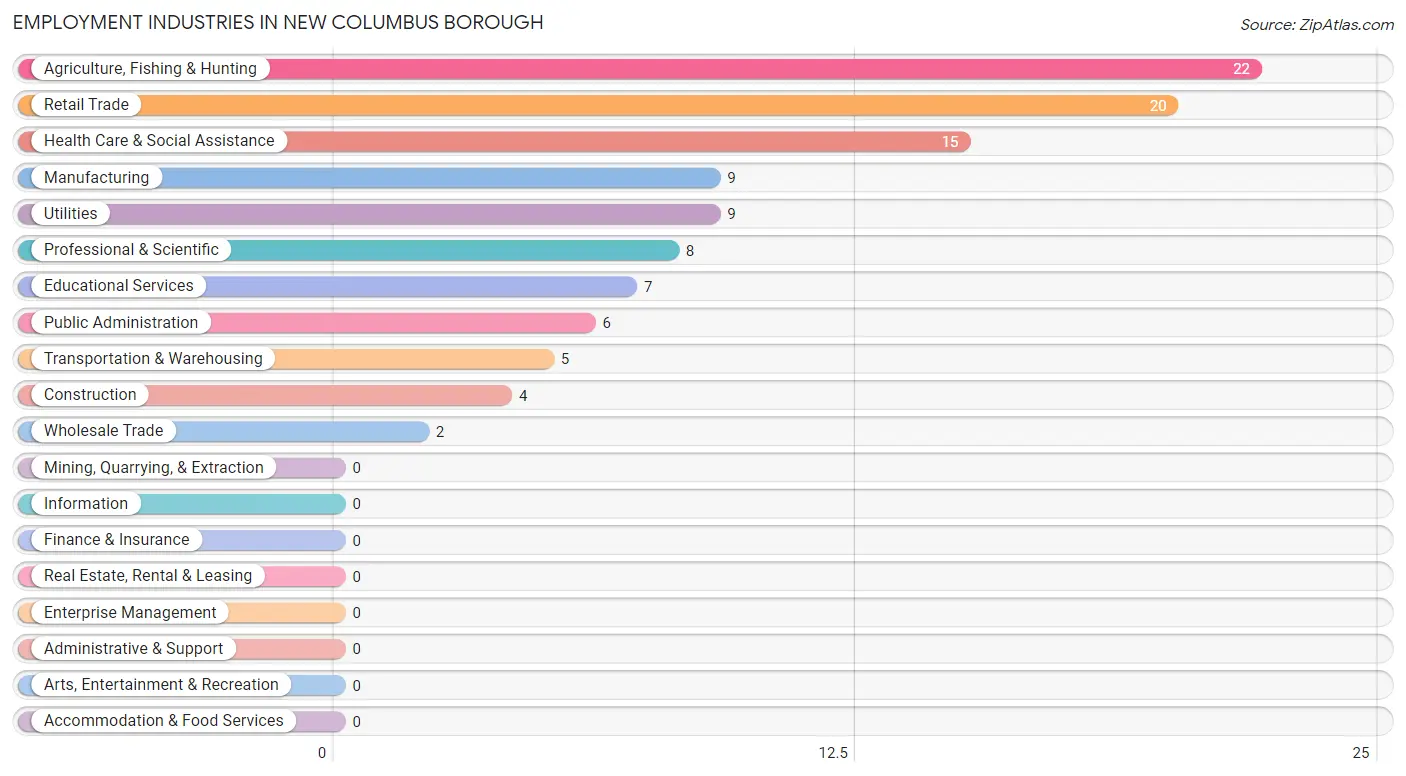
The major employment industries in New Columbus borough include Agriculture, Fishing & Hunting (22 | 19.5%), Retail Trade (20 | 17.7%), Health Care & Social Assistance (15 | 13.3%), Manufacturing (9 | 8.0%), and Utilities (9 | 8.0%).
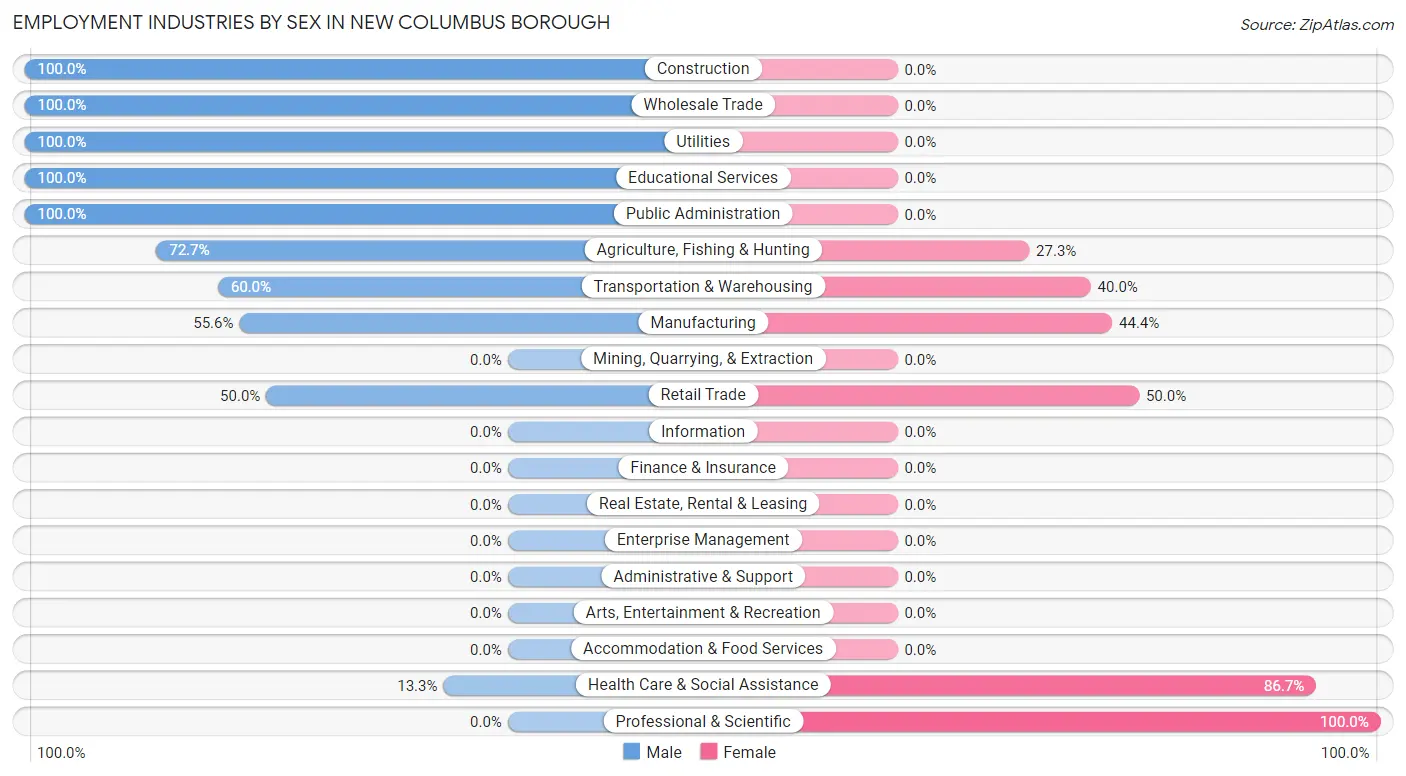
Employment Industries by Sex in New Columbus borough
The New Columbus borough industries that see more men than women are Construction (100.0%), Wholesale Trade (100.0%), and Utilities (100.0%), whereas the industries that tend to have a higher number of women are Professional & Scientific (100.0%), Health Care & Social Assistance (86.7%), and Retail Trade (50.0%).
| Industry | Male | Female |
| Agriculture, Fishing & Hunting | 16 (72.7%) | 6 (27.3%) |
| Mining, Quarrying, & Extraction | 0 (0.0%) | 0 (0.0%) |
| Construction | 4 (100.0%) | 0 (0.0%) |
| Manufacturing | 5 (55.6%) | 4 (44.4%) |
| Wholesale Trade | 2 (100.0%) | 0 (0.0%) |
| Retail Trade | 10 (50.0%) | 10 (50.0%) |
| Transportation & Warehousing | 3 (60.0%) | 2 (40.0%) |
| Utilities | 9 (100.0%) | 0 (0.0%) |
| Information | 0 (0.0%) | 0 (0.0%) |
| Finance & Insurance | 0 (0.0%) | 0 (0.0%) |
| Real Estate, Rental & Leasing | 0 (0.0%) | 0 (0.0%) |
| Professional & Scientific | 0 (0.0%) | 8 (100.0%) |
| Enterprise Management | 0 (0.0%) | 0 (0.0%) |
| Administrative & Support | 0 (0.0%) | 0 (0.0%) |
| Educational Services | 7 (100.0%) | 0 (0.0%) |
| Health Care & Social Assistance | 2 (13.3%) | 13 (86.7%) |
| Arts, Entertainment & Recreation | 0 (0.0%) | 0 (0.0%) |
| Accommodation & Food Services | 0 (0.0%) | 0 (0.0%) |
| Public Administration | 6 (100.0%) | 0 (0.0%) |
| Total | 66 (58.4%) | 47 (41.6%) |
Education in New Columbus borough
School Enrollment in New Columbus borough
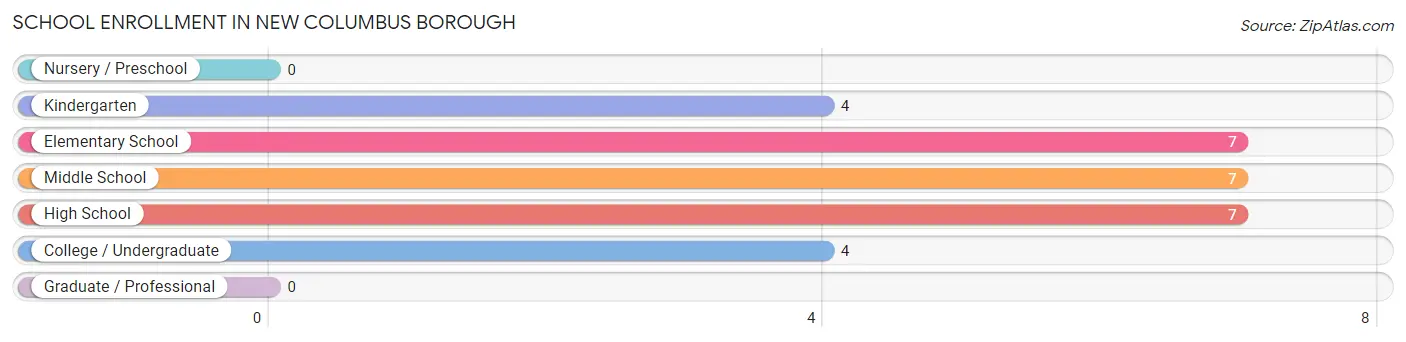
The most common levels of schooling among the 29 students in New Columbus borough are elementary school (7 | 24.1%), middle school (7 | 24.1%), and high school (7 | 24.1%).
| School Level | # Students | % Students |
| Nursery / Preschool | 0 | 0.0% |
| Kindergarten | 4 | 13.8% |
| Elementary School | 7 | 24.1% |
| Middle School | 7 | 24.1% |
| High School | 7 | 24.1% |
| College / Undergraduate | 4 | 13.8% |
| Graduate / Professional | 0 | 0.0% |
| Total | 29 | 100.0% |
School Enrollment by Age by Funding Source in New Columbus borough
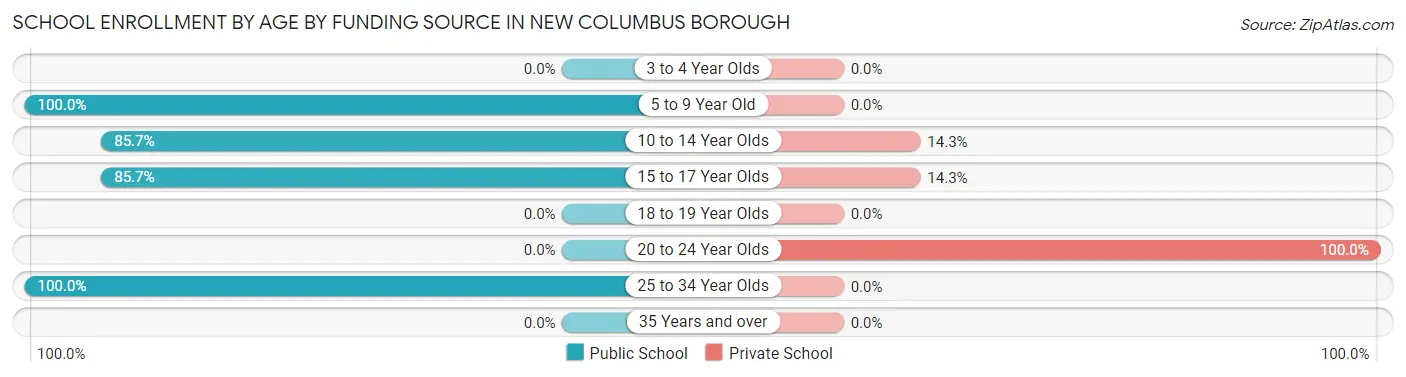
Out of a total of 29 students who are enrolled in schools in New Columbus borough, 4 (13.8%) attend a private institution, while the remaining 25 (86.2%) are enrolled in public schools. The age group of 20 to 24 year olds has the highest likelihood of being enrolled in private schools, with 2 (100.0% in the age bracket) enrolled. Conversely, the age group of 5 to 9 year old has the lowest likelihood of being enrolled in a private school, with 11 (100.0% in the age bracket) attending a public institution.
| Age Bracket | Public School | Private School |
| 3 to 4 Year Olds | 0 (0.0%) | 0 (0.0%) |
| 5 to 9 Year Old | 11 (100.0%) | 0 (0.0%) |
| 10 to 14 Year Olds | 6 (85.7%) | 1 (14.3%) |
| 15 to 17 Year Olds | 6 (85.7%) | 1 (14.3%) |
| 18 to 19 Year Olds | 0 (0.0%) | 0 (0.0%) |
| 20 to 24 Year Olds | 0 (0.0%) | 2 (100.0%) |
| 25 to 34 Year Olds | 2 (100.0%) | 0 (0.0%) |
| 35 Years and over | 0 (0.0%) | 0 (0.0%) |
| Total | 25 (86.2%) | 4 (13.8%) |
Educational Attainment by Field of Study in New Columbus borough
Engineering (7 | 36.8%), bio, nature & agricultural (4 | 21.0%), business (3 | 15.8%), psychology (2 | 10.5%), and education (1 | 5.3%) are the most common fields of study among 19 individuals in New Columbus borough who have obtained a bachelor's degree or higher.
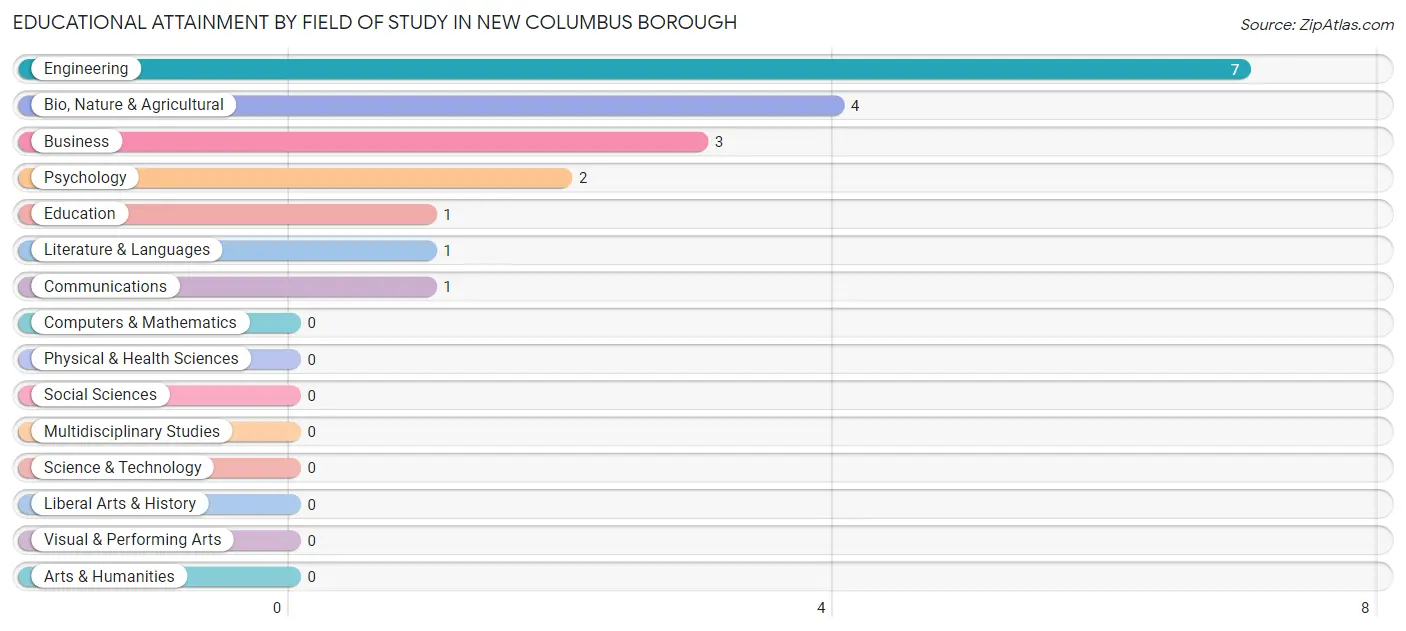
| Field of Study | # Graduates | % Graduates |
| Computers & Mathematics | 0 | 0.0% |
| Bio, Nature & Agricultural | 4 | 21.0% |
| Physical & Health Sciences | 0 | 0.0% |
| Psychology | 2 | 10.5% |
| Social Sciences | 0 | 0.0% |
| Engineering | 7 | 36.8% |
| Multidisciplinary Studies | 0 | 0.0% |
| Science & Technology | 0 | 0.0% |
| Business | 3 | 15.8% |
| Education | 1 | 5.3% |
| Literature & Languages | 1 | 5.3% |
| Liberal Arts & History | 0 | 0.0% |
| Visual & Performing Arts | 0 | 0.0% |
| Communications | 1 | 5.3% |
| Arts & Humanities | 0 | 0.0% |
| Total | 19 | 100.0% |
Transportation & Commute in New Columbus borough
Vehicle Availability by Sex in New Columbus borough
The most prevalent vehicle ownership categories in New Columbus borough are males with 4 vehicles (26, accounting for 40.6%) and females with 4 vehicles (10, making up 55.3%).
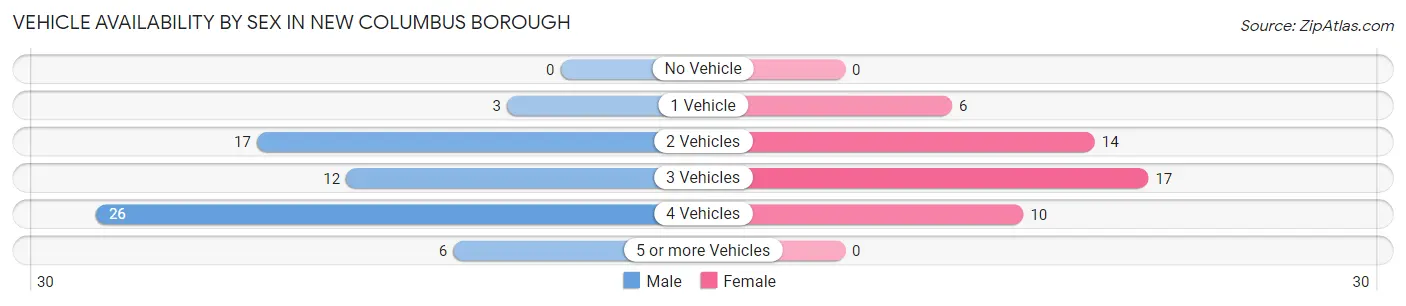
| Vehicles Available | Male | Female |
| No Vehicle | 0 (0.0%) | 0 (0.0%) |
| 1 Vehicle | 3 (4.7%) | 6 (12.8%) |
| 2 Vehicles | 17 (26.6%) | 14 (29.8%) |
| 3 Vehicles | 12 (18.8%) | 17 (36.2%) |
| 4 Vehicles | 26 (40.6%) | 10 (21.3%) |
| 5 or more Vehicles | 6 (9.4%) | 0 (0.0%) |
| Total | 64 (100.0%) | 47 (100.0%) |
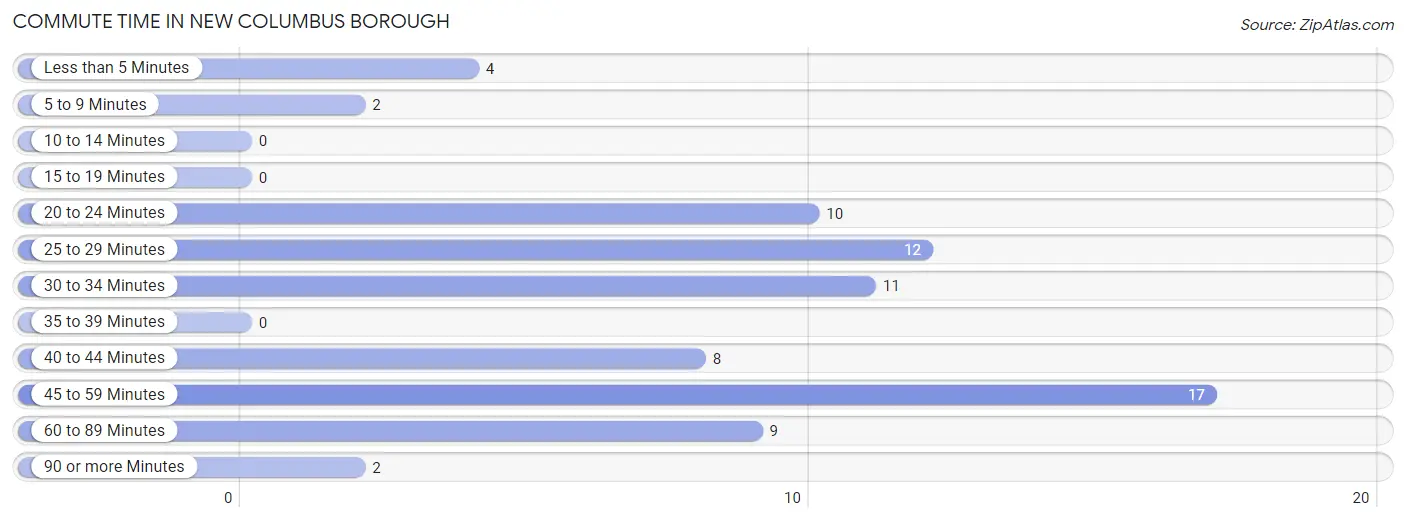
Commute Time in New Columbus borough
The most frequently occuring commute durations in New Columbus borough are 45 to 59 minutes (17 commuters, 22.7%), 25 to 29 minutes (12 commuters, 16.0%), and 30 to 34 minutes (11 commuters, 14.7%).
| Commute Time | # Commuters | % Commuters |
| Less than 5 Minutes | 4 | 5.3% |
| 5 to 9 Minutes | 2 | 2.7% |
| 10 to 14 Minutes | 0 | 0.0% |
| 15 to 19 Minutes | 0 | 0.0% |
| 20 to 24 Minutes | 10 | 13.3% |
| 25 to 29 Minutes | 12 | 16.0% |
| 30 to 34 Minutes | 11 | 14.7% |
| 35 to 39 Minutes | 0 | 0.0% |
| 40 to 44 Minutes | 8 | 10.7% |
| 45 to 59 Minutes | 17 | 22.7% |
| 60 to 89 Minutes | 9 | 12.0% |
| 90 or more Minutes | 2 | 2.7% |
Commute Time by Sex in New Columbus borough
The most common commute times in New Columbus borough are 60 to 89 minutes (8 commuters, 19.5%) for males and 45 to 59 minutes (11 commuters, 32.4%) for females.
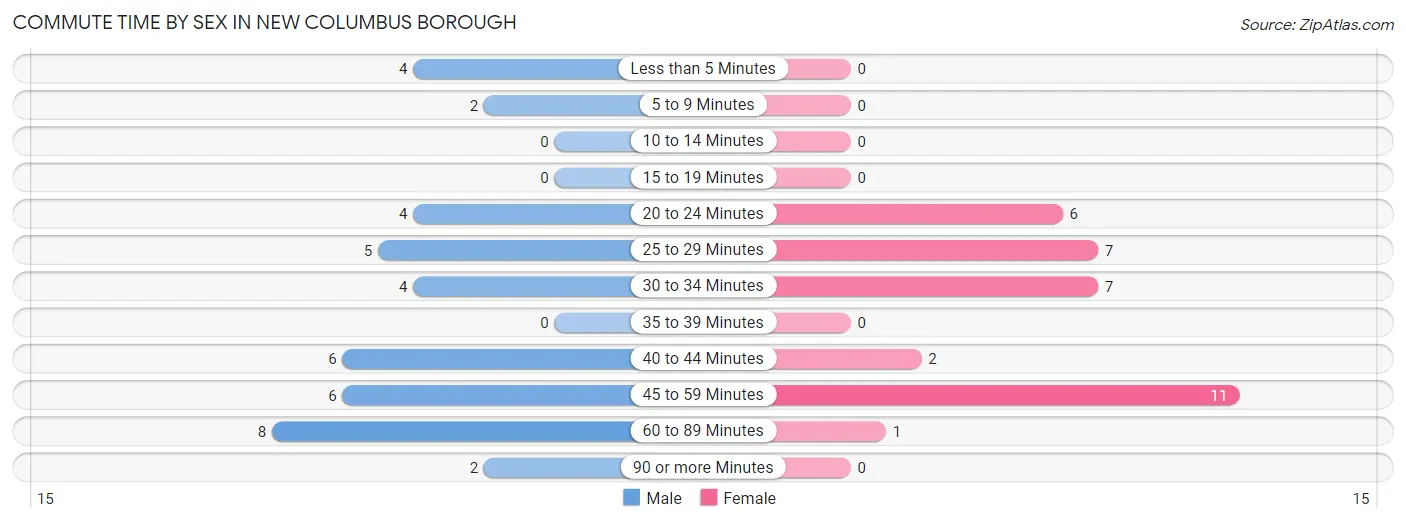
| Commute Time | Male | Female |
| Less than 5 Minutes | 4 (9.8%) | 0 (0.0%) |
| 5 to 9 Minutes | 2 (4.9%) | 0 (0.0%) |
| 10 to 14 Minutes | 0 (0.0%) | 0 (0.0%) |
| 15 to 19 Minutes | 0 (0.0%) | 0 (0.0%) |
| 20 to 24 Minutes | 4 (9.8%) | 6 (17.6%) |
| 25 to 29 Minutes | 5 (12.2%) | 7 (20.6%) |
| 30 to 34 Minutes | 4 (9.8%) | 7 (20.6%) |
| 35 to 39 Minutes | 0 (0.0%) | 0 (0.0%) |
| 40 to 44 Minutes | 6 (14.6%) | 2 (5.9%) |
| 45 to 59 Minutes | 6 (14.6%) | 11 (32.4%) |
| 60 to 89 Minutes | 8 (19.5%) | 1 (2.9%) |
| 90 or more Minutes | 2 (4.9%) | 0 (0.0%) |
Time of Departure to Work by Sex in New Columbus borough
The most frequent times of departure to work in New Columbus borough are 6:00 AM to 6:29 AM (8, 19.5%) for males and 8:00 AM to 8:29 AM (9, 26.5%) for females.
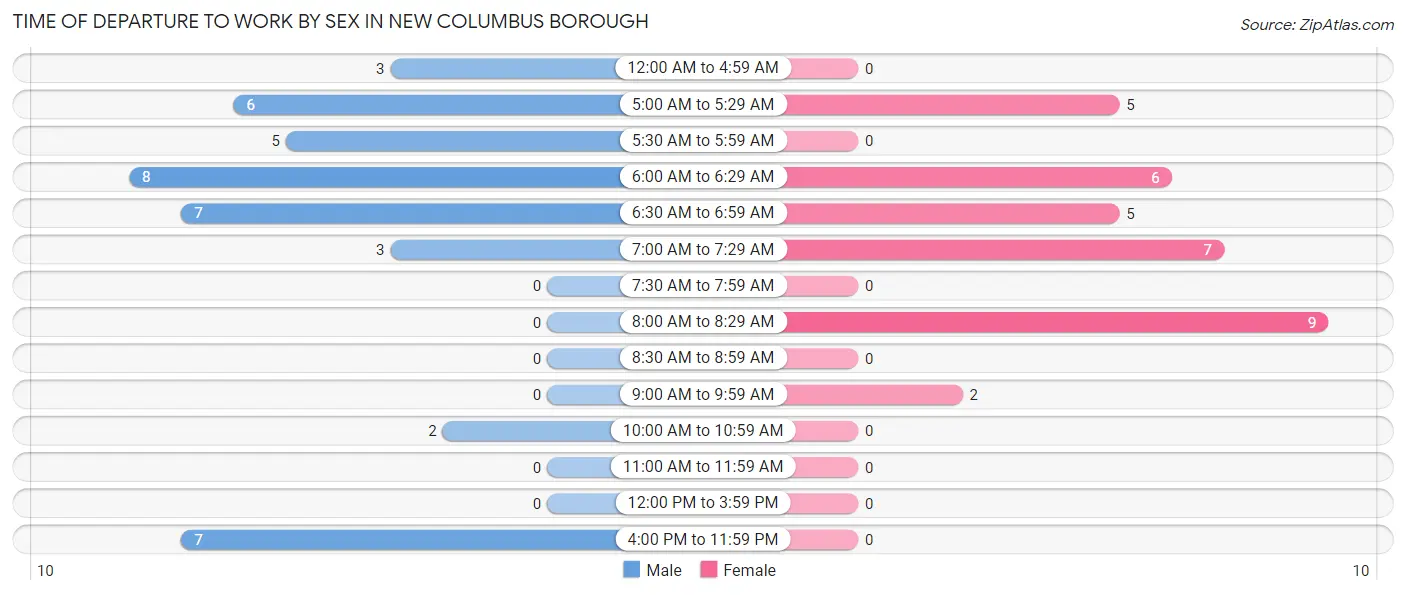
| Time of Departure | Male | Female |
| 12:00 AM to 4:59 AM | 3 (7.3%) | 0 (0.0%) |
| 5:00 AM to 5:29 AM | 6 (14.6%) | 5 (14.7%) |
| 5:30 AM to 5:59 AM | 5 (12.2%) | 0 (0.0%) |
| 6:00 AM to 6:29 AM | 8 (19.5%) | 6 (17.6%) |
| 6:30 AM to 6:59 AM | 7 (17.1%) | 5 (14.7%) |
| 7:00 AM to 7:29 AM | 3 (7.3%) | 7 (20.6%) |
| 7:30 AM to 7:59 AM | 0 (0.0%) | 0 (0.0%) |
| 8:00 AM to 8:29 AM | 0 (0.0%) | 9 (26.5%) |
| 8:30 AM to 8:59 AM | 0 (0.0%) | 0 (0.0%) |
| 9:00 AM to 9:59 AM | 0 (0.0%) | 2 (5.9%) |
| 10:00 AM to 10:59 AM | 2 (4.9%) | 0 (0.0%) |
| 11:00 AM to 11:59 AM | 0 (0.0%) | 0 (0.0%) |
| 12:00 PM to 3:59 PM | 0 (0.0%) | 0 (0.0%) |
| 4:00 PM to 11:59 PM | 7 (17.1%) | 0 (0.0%) |
| Total | 41 (100.0%) | 34 (100.0%) |
Housing Occupancy in New Columbus borough
Occupancy by Ownership in New Columbus borough
Of the total 100 dwellings in New Columbus borough, owner-occupied units account for 84 (84.0%), while renter-occupied units make up 16 (16.0%).
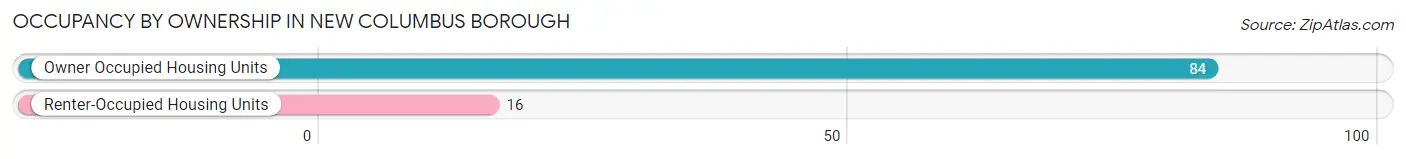
| Occupancy | # Housing Units | % Housing Units |
| Owner Occupied Housing Units | 84 | 84.0% |
| Renter-Occupied Housing Units | 16 | 16.0% |
| Total Occupied Housing Units | 100 | 100.0% |
Occupancy by Household Size in New Columbus borough
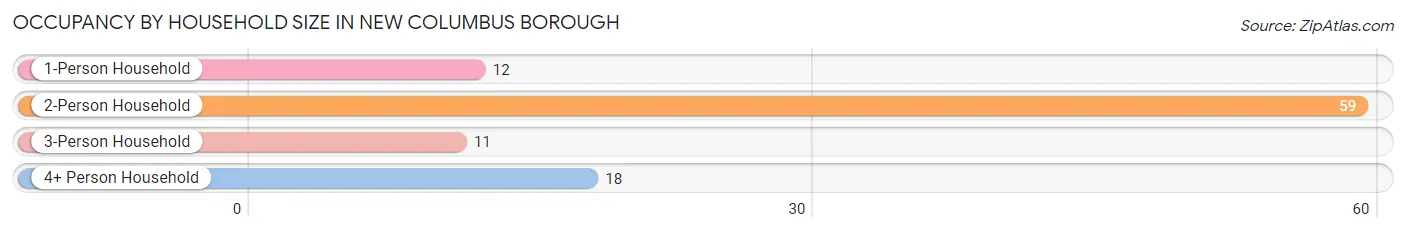
| Household Size | # Housing Units | % Housing Units |
| 1-Person Household | 12 | 12.0% |
| 2-Person Household | 59 | 59.0% |
| 3-Person Household | 11 | 11.0% |
| 4+ Person Household | 18 | 18.0% |
| Total Housing Units | 100 | 100.0% |
Occupancy by Ownership by Household Size in New Columbus borough
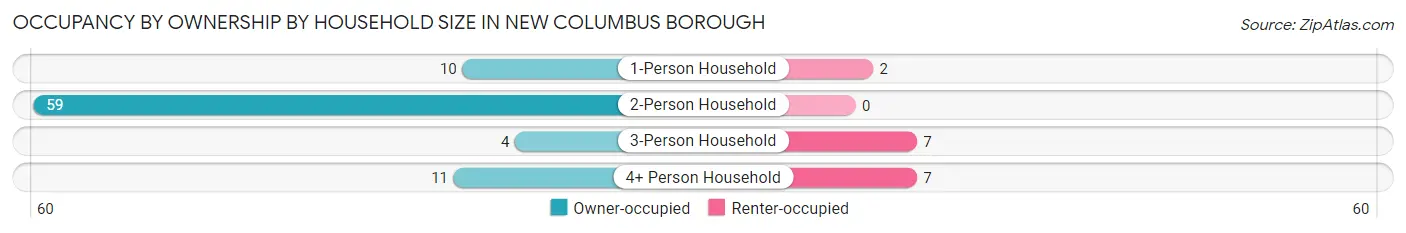
| Household Size | Owner-occupied | Renter-occupied |
| 1-Person Household | 10 (83.3%) | 2 (16.7%) |
| 2-Person Household | 59 (100.0%) | 0 (0.0%) |
| 3-Person Household | 4 (36.4%) | 7 (63.6%) |
| 4+ Person Household | 11 (61.1%) | 7 (38.9%) |
| Total Housing Units | 84 (84.0%) | 16 (16.0%) |
Occupancy by Educational Attainment in New Columbus borough
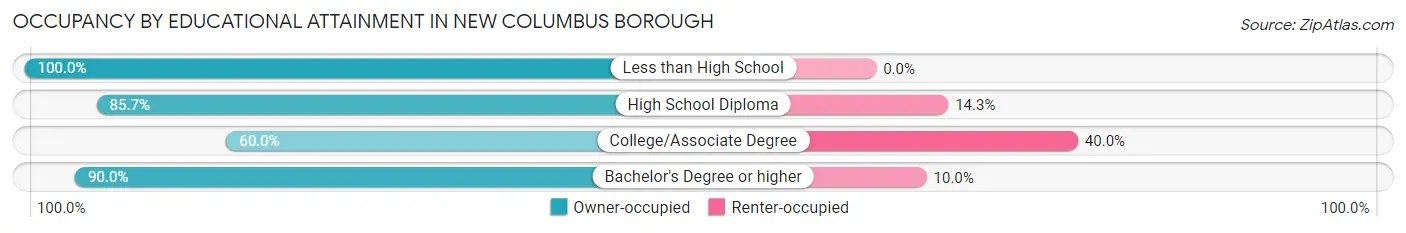
| Household Size | Owner-occupied | Renter-occupied |
| Less than High School | 12 (100.0%) | 0 (0.0%) |
| High School Diploma | 54 (85.7%) | 9 (14.3%) |
| College/Associate Degree | 9 (60.0%) | 6 (40.0%) |
| Bachelor's Degree or higher | 9 (90.0%) | 1 (10.0%) |
Occupancy by Age of Householder in New Columbus borough
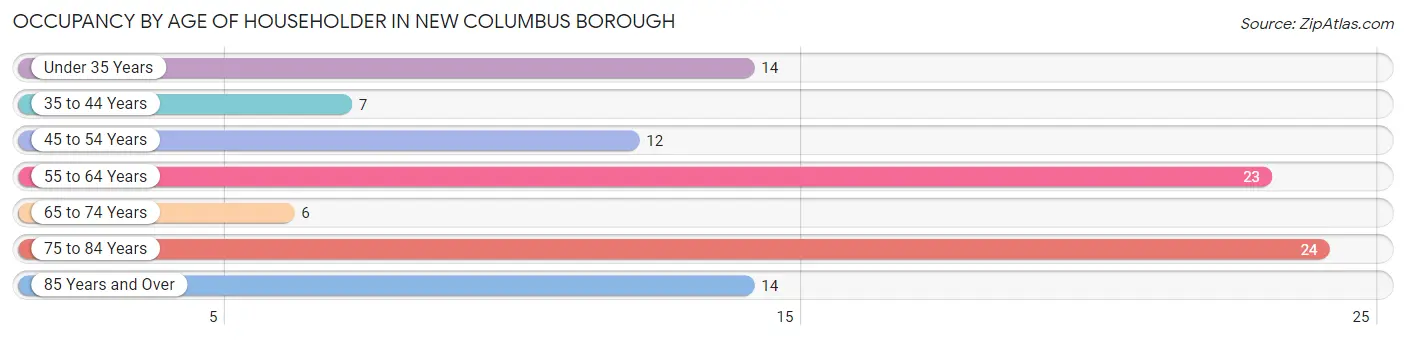
| Age Bracket | # Households | % Households |
| Under 35 Years | 14 | 14.0% |
| 35 to 44 Years | 7 | 7.0% |
| 45 to 54 Years | 12 | 12.0% |
| 55 to 64 Years | 23 | 23.0% |
| 65 to 74 Years | 6 | 6.0% |
| 75 to 84 Years | 24 | 24.0% |
| 85 Years and Over | 14 | 14.0% |
| Total | 100 | 100.0% |
Housing Finances in New Columbus borough
Median Income by Occupancy in New Columbus borough
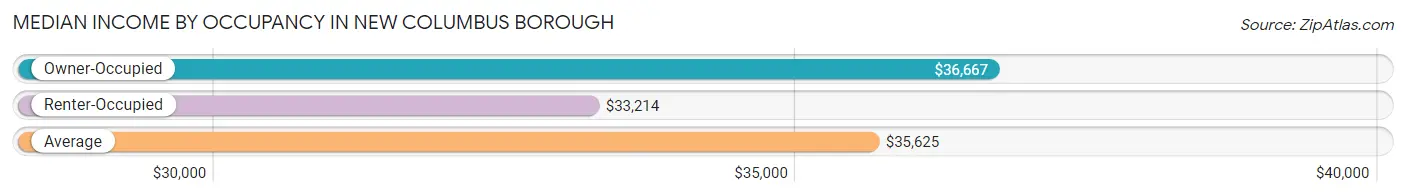
| Occupancy Type | # Households | Median Income |
| Owner-Occupied | 84 (84.0%) | $36,667 |
| Renter-Occupied | 16 (16.0%) | $33,214 |
| Average | 100 (100.0%) | $35,625 |
Occupancy by Householder Income Bracket in New Columbus borough
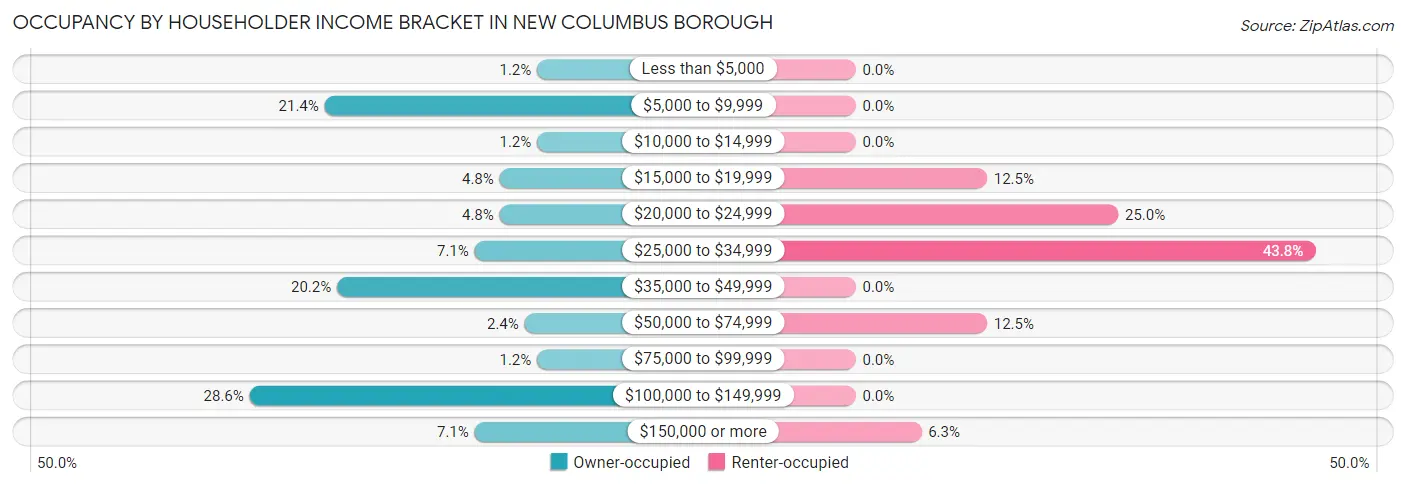
| Income Bracket | Owner-occupied | Renter-occupied |
| Less than $5,000 | 1 (1.2%) | 0 (0.0%) |
| $5,000 to $9,999 | 18 (21.4%) | 0 (0.0%) |
| $10,000 to $14,999 | 1 (1.2%) | 0 (0.0%) |
| $15,000 to $19,999 | 4 (4.8%) | 2 (12.5%) |
| $20,000 to $24,999 | 4 (4.8%) | 4 (25.0%) |
| $25,000 to $34,999 | 6 (7.1%) | 7 (43.8%) |
| $35,000 to $49,999 | 17 (20.2%) | 0 (0.0%) |
| $50,000 to $74,999 | 2 (2.4%) | 2 (12.5%) |
| $75,000 to $99,999 | 1 (1.2%) | 0 (0.0%) |
| $100,000 to $149,999 | 24 (28.6%) | 0 (0.0%) |
| $150,000 or more | 6 (7.1%) | 1 (6.2%) |
| Total | 84 (100.0%) | 16 (100.0%) |
Monthly Housing Cost Tiers in New Columbus borough
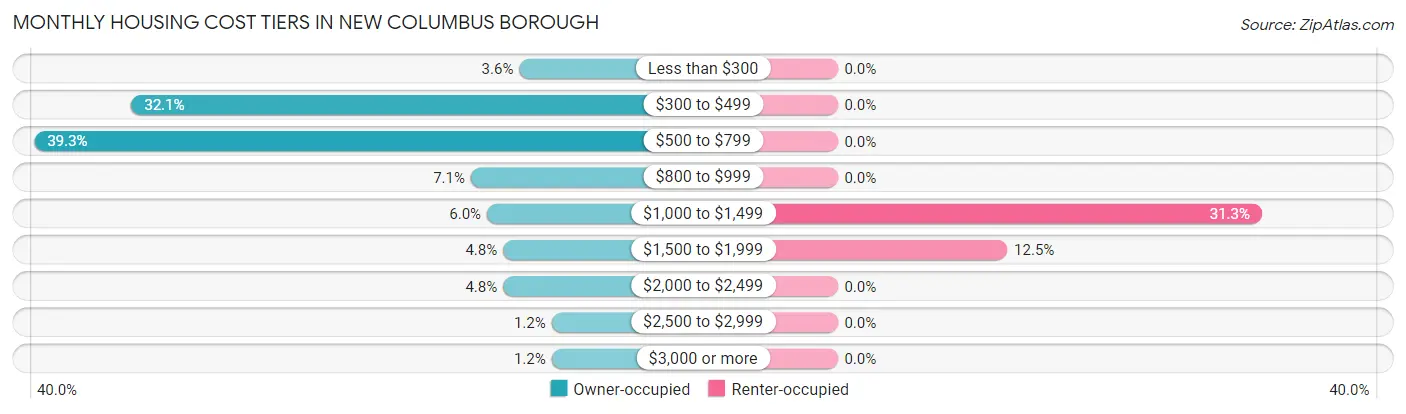
| Monthly Cost | Owner-occupied | Renter-occupied |
| Less than $300 | 3 (3.6%) | 0 (0.0%) |
| $300 to $499 | 27 (32.1%) | 0 (0.0%) |
| $500 to $799 | 33 (39.3%) | 0 (0.0%) |
| $800 to $999 | 6 (7.1%) | 0 (0.0%) |
| $1,000 to $1,499 | 5 (5.9%) | 5 (31.2%) |
| $1,500 to $1,999 | 4 (4.8%) | 2 (12.5%) |
| $2,000 to $2,499 | 4 (4.8%) | 0 (0.0%) |
| $2,500 to $2,999 | 1 (1.2%) | 0 (0.0%) |
| $3,000 or more | 1 (1.2%) | 0 (0.0%) |
| Total | 84 (100.0%) | 16 (100.0%) |
Physical Housing Characteristics in New Columbus borough
Housing Structures in New Columbus borough
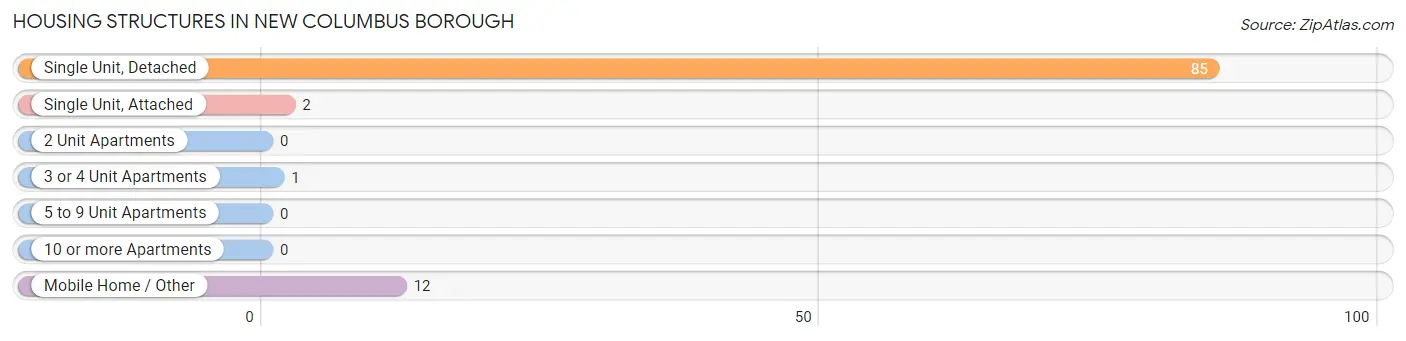
| Structure Type | # Housing Units | % Housing Units |
| Single Unit, Detached | 85 | 85.0% |
| Single Unit, Attached | 2 | 2.0% |
| 2 Unit Apartments | 0 | 0.0% |
| 3 or 4 Unit Apartments | 1 | 1.0% |
| 5 to 9 Unit Apartments | 0 | 0.0% |
| 10 or more Apartments | 0 | 0.0% |
| Mobile Home / Other | 12 | 12.0% |
| Total | 100 | 100.0% |
Housing Structures by Occupancy in New Columbus borough
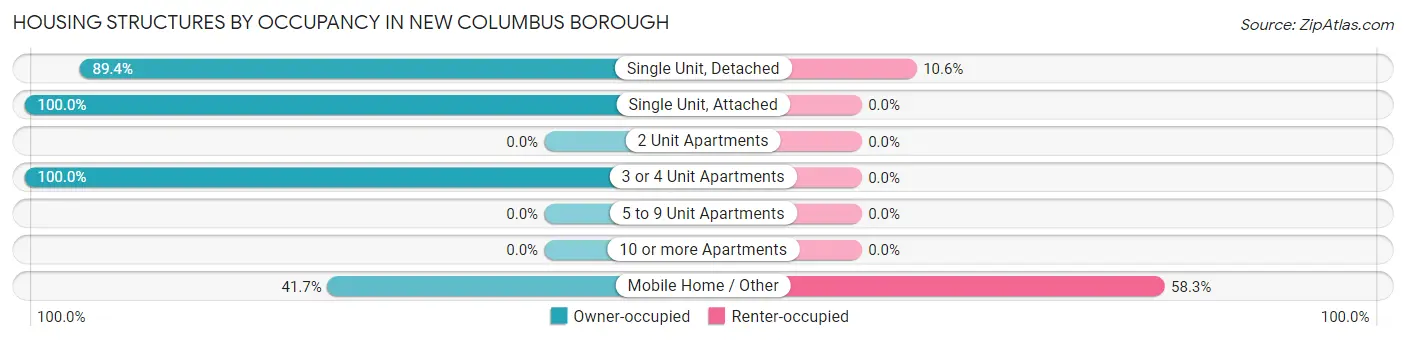
| Structure Type | Owner-occupied | Renter-occupied |
| Single Unit, Detached | 76 (89.4%) | 9 (10.6%) |
| Single Unit, Attached | 2 (100.0%) | 0 (0.0%) |
| 2 Unit Apartments | 0 (0.0%) | 0 (0.0%) |
| 3 or 4 Unit Apartments | 1 (100.0%) | 0 (0.0%) |
| 5 to 9 Unit Apartments | 0 (0.0%) | 0 (0.0%) |
| 10 or more Apartments | 0 (0.0%) | 0 (0.0%) |
| Mobile Home / Other | 5 (41.7%) | 7 (58.3%) |
| Total | 84 (84.0%) | 16 (16.0%) |
Housing Structures by Number of Rooms in New Columbus borough
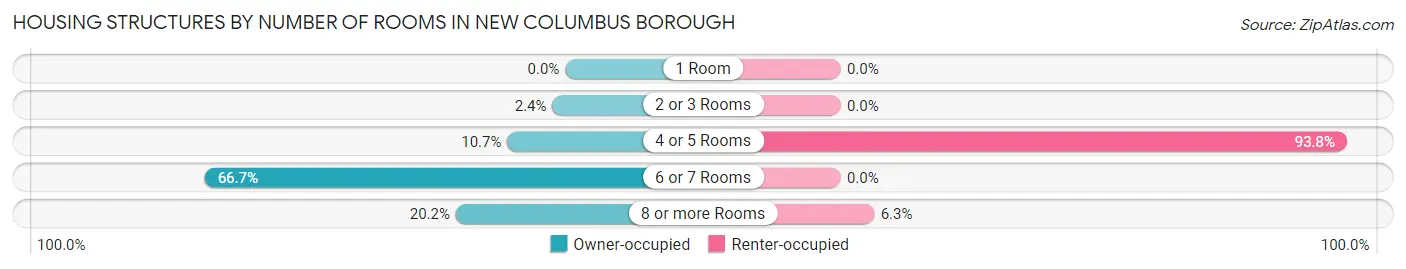
| Number of Rooms | Owner-occupied | Renter-occupied |
| 1 Room | 0 (0.0%) | 0 (0.0%) |
| 2 or 3 Rooms | 2 (2.4%) | 0 (0.0%) |
| 4 or 5 Rooms | 9 (10.7%) | 15 (93.8%) |
| 6 or 7 Rooms | 56 (66.7%) | 0 (0.0%) |
| 8 or more Rooms | 17 (20.2%) | 1 (6.2%) |
| Total | 84 (100.0%) | 16 (100.0%) |
Housing Structure by Heating Type in New Columbus borough
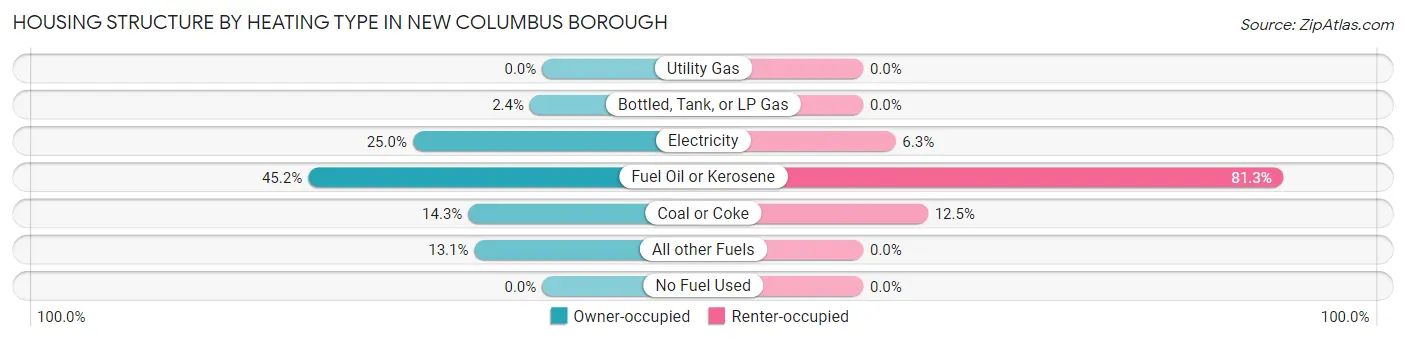
| Heating Type | Owner-occupied | Renter-occupied |
| Utility Gas | 0 (0.0%) | 0 (0.0%) |
| Bottled, Tank, or LP Gas | 2 (2.4%) | 0 (0.0%) |
| Electricity | 21 (25.0%) | 1 (6.2%) |
| Fuel Oil or Kerosene | 38 (45.2%) | 13 (81.2%) |
| Coal or Coke | 12 (14.3%) | 2 (12.5%) |
| All other Fuels | 11 (13.1%) | 0 (0.0%) |
| No Fuel Used | 0 (0.0%) | 0 (0.0%) |
| Total | 84 (100.0%) | 16 (100.0%) |
Household Vehicle Usage in New Columbus borough
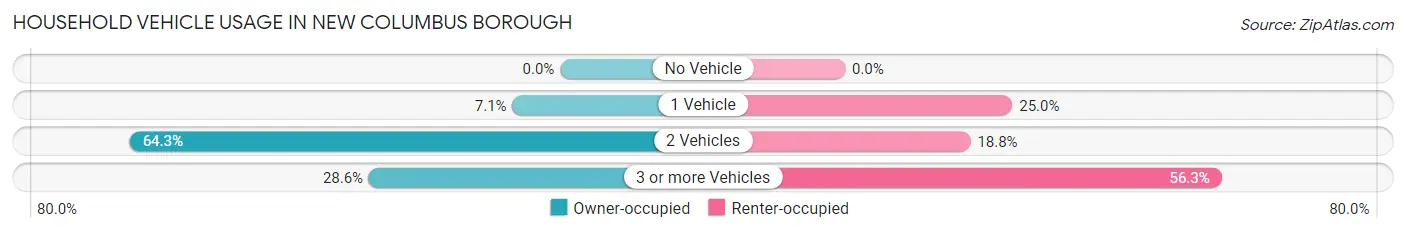
| Vehicles per Household | Owner-occupied | Renter-occupied |
| No Vehicle | 0 (0.0%) | 0 (0.0%) |
| 1 Vehicle | 6 (7.1%) | 4 (25.0%) |
| 2 Vehicles | 54 (64.3%) | 3 (18.8%) |
| 3 or more Vehicles | 24 (28.6%) | 9 (56.2%) |
| Total | 84 (100.0%) | 16 (100.0%) |
Real Estate & Mortgages in New Columbus borough
Real Estate and Mortgage Overview in New Columbus borough
| Characteristic | Without Mortgage | With Mortgage |
| Housing Units | 54 | 30 |
| Median Property Value | $161,400 | $170,500 |
| Median Household Income | $34,167 | $6 |
| Monthly Housing Costs | $425 | $1 |
| Real Estate Taxes | $2,143 | $0 |
Property Value by Mortgage Status in New Columbus borough
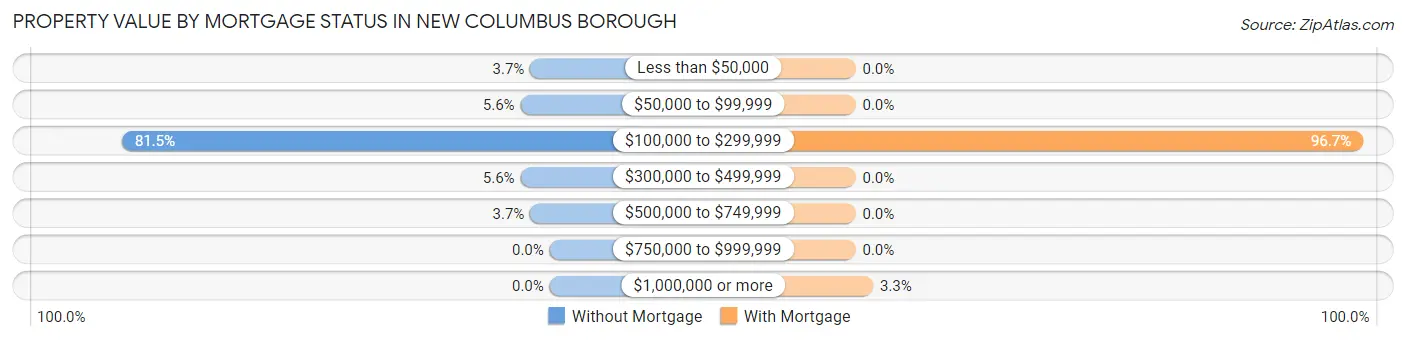
| Property Value | Without Mortgage | With Mortgage |
| Less than $50,000 | 2 (3.7%) | 0 (0.0%) |
| $50,000 to $99,999 | 3 (5.6%) | 0 (0.0%) |
| $100,000 to $299,999 | 44 (81.5%) | 29 (96.7%) |
| $300,000 to $499,999 | 3 (5.6%) | 0 (0.0%) |
| $500,000 to $749,999 | 2 (3.7%) | 0 (0.0%) |
| $750,000 to $999,999 | 0 (0.0%) | 0 (0.0%) |
| $1,000,000 or more | 0 (0.0%) | 1 (3.3%) |
| Total | 54 (100.0%) | 30 (100.0%) |
Household Income by Mortgage Status in New Columbus borough
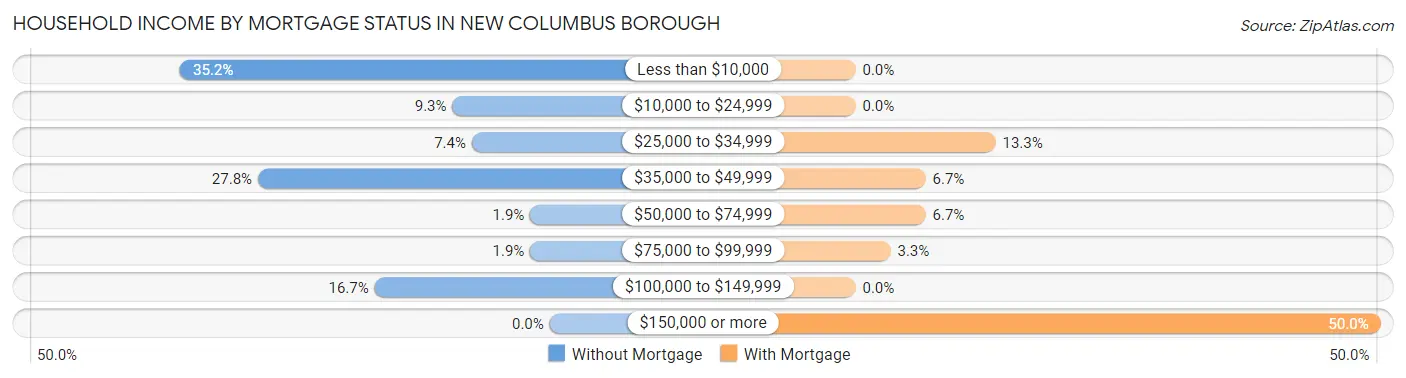
| Household Income | Without Mortgage | With Mortgage |
| Less than $10,000 | 19 (35.2%) | 0 (0.0%) |
| $10,000 to $24,999 | 5 (9.3%) | 0 (0.0%) |
| $25,000 to $34,999 | 4 (7.4%) | 4 (13.3%) |
| $35,000 to $49,999 | 15 (27.8%) | 2 (6.7%) |
| $50,000 to $74,999 | 1 (1.8%) | 2 (6.7%) |
| $75,000 to $99,999 | 1 (1.8%) | 1 (3.3%) |
| $100,000 to $149,999 | 9 (16.7%) | 0 (0.0%) |
| $150,000 or more | 0 (0.0%) | 15 (50.0%) |
| Total | 54 (100.0%) | 30 (100.0%) |
Property Value to Household Income Ratio in New Columbus borough
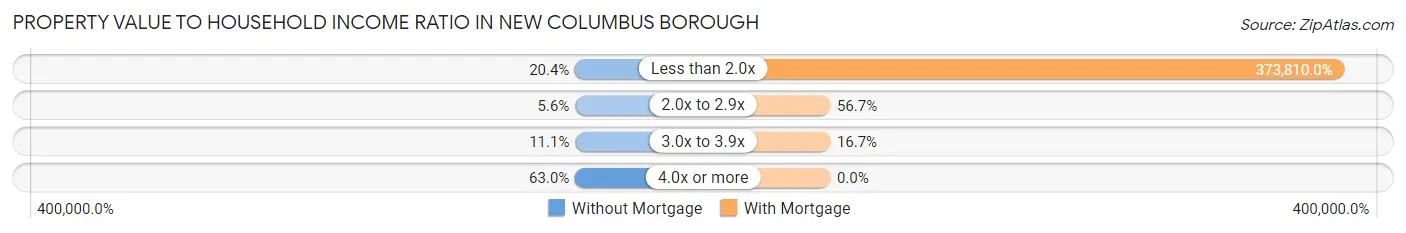
| Value-to-Income Ratio | Without Mortgage | With Mortgage |
| Less than 2.0x | 11 (20.4%) | 112,143 (373,810.0%) |
| 2.0x to 2.9x | 3 (5.6%) | 17 (56.7%) |
| 3.0x to 3.9x | 6 (11.1%) | 5 (16.7%) |
| 4.0x or more | 34 (63.0%) | 0 (0.0%) |
| Total | 54 (100.0%) | 30 (100.0%) |
Real Estate Taxes by Mortgage Status in New Columbus borough
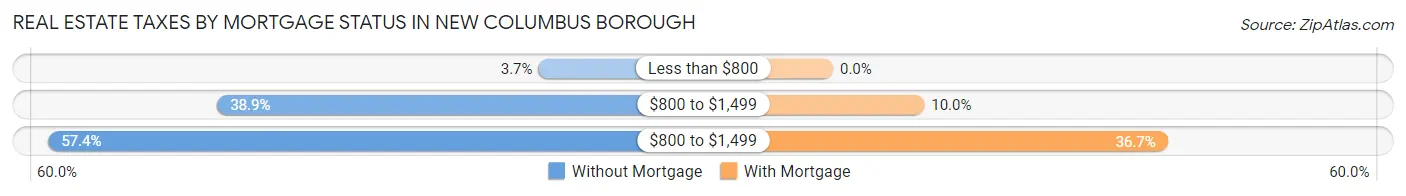
| Property Taxes | Without Mortgage | With Mortgage |
| Less than $800 | 2 (3.7%) | 0 (0.0%) |
| $800 to $1,499 | 21 (38.9%) | 3 (10.0%) |
| $800 to $1,499 | 31 (57.4%) | 11 (36.7%) |
| Total | 54 (100.0%) | 30 (100.0%) |
Health & Disability in New Columbus borough
Health Insurance Coverage by Age in New Columbus borough
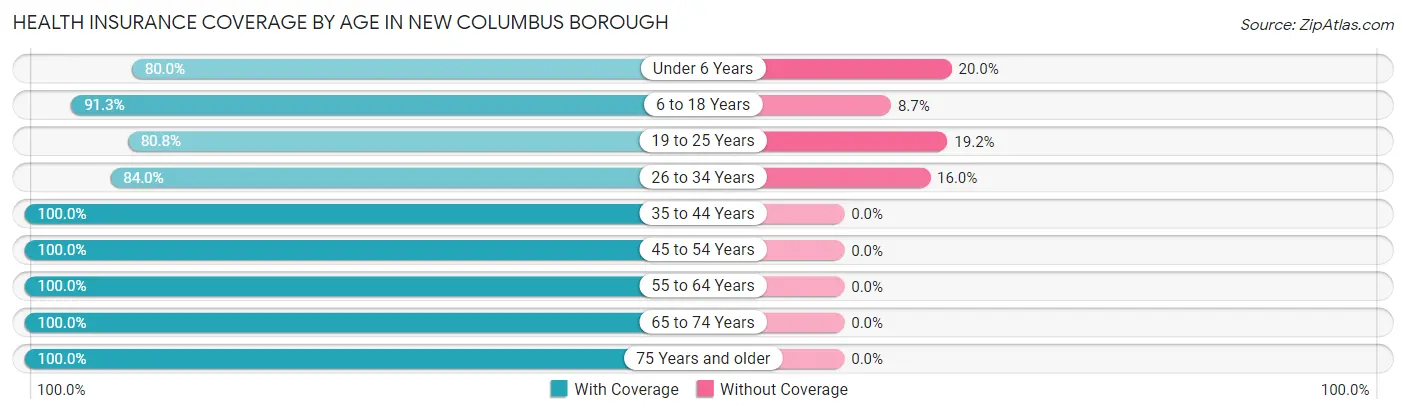
| Age Bracket | With Coverage | Without Coverage |
| Under 6 Years | 8 (80.0%) | 2 (20.0%) |
| 6 to 18 Years | 21 (91.3%) | 2 (8.7%) |
| 19 to 25 Years | 21 (80.8%) | 5 (19.2%) |
| 26 to 34 Years | 21 (84.0%) | 4 (16.0%) |
| 35 to 44 Years | 14 (100.0%) | 0 (0.0%) |
| 45 to 54 Years | 29 (100.0%) | 0 (0.0%) |
| 55 to 64 Years | 41 (100.0%) | 0 (0.0%) |
| 65 to 74 Years | 8 (100.0%) | 0 (0.0%) |
| 75 Years and older | 69 (100.0%) | 0 (0.0%) |
| Total | 232 (94.7%) | 13 (5.3%) |
Health Insurance Coverage by Citizenship Status in New Columbus borough
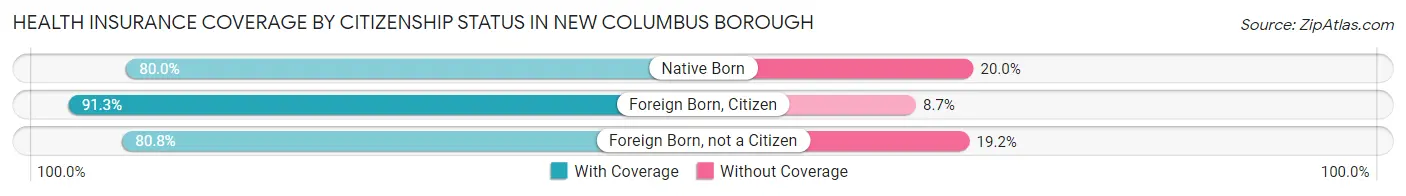
| Citizenship Status | With Coverage | Without Coverage |
| Native Born | 8 (80.0%) | 2 (20.0%) |
| Foreign Born, Citizen | 21 (91.3%) | 2 (8.7%) |
| Foreign Born, not a Citizen | 21 (80.8%) | 5 (19.2%) |
Health Insurance Coverage by Household Income in New Columbus borough
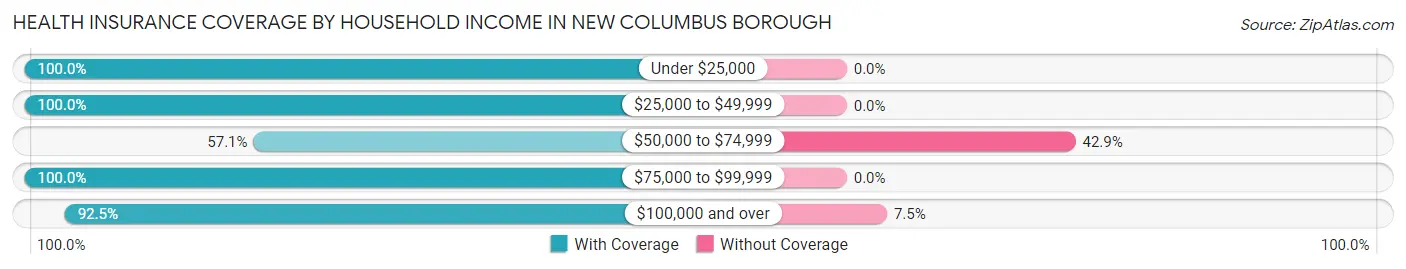
| Household Income | With Coverage | Without Coverage |
| Under $25,000 | 59 (100.0%) | 0 (0.0%) |
| $25,000 to $49,999 | 75 (100.0%) | 0 (0.0%) |
| $50,000 to $74,999 | 8 (57.1%) | 6 (42.9%) |
| $75,000 to $99,999 | 4 (100.0%) | 0 (0.0%) |
| $100,000 and over | 86 (92.5%) | 7 (7.5%) |
Public vs Private Health Insurance Coverage by Age in New Columbus borough
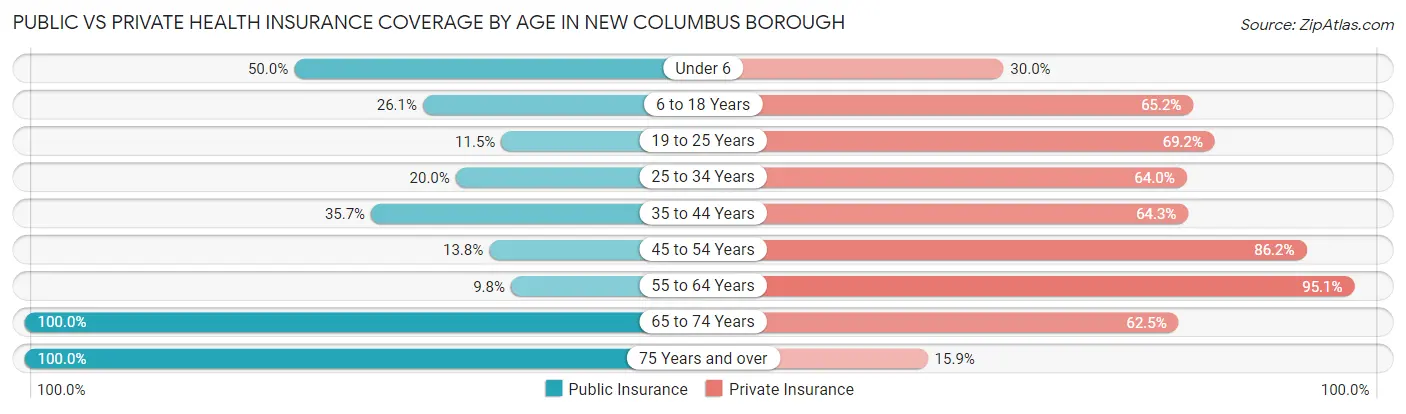
| Age Bracket | Public Insurance | Private Insurance |
| Under 6 | 5 (50.0%) | 3 (30.0%) |
| 6 to 18 Years | 6 (26.1%) | 15 (65.2%) |
| 19 to 25 Years | 3 (11.5%) | 18 (69.2%) |
| 25 to 34 Years | 5 (20.0%) | 16 (64.0%) |
| 35 to 44 Years | 5 (35.7%) | 9 (64.3%) |
| 45 to 54 Years | 4 (13.8%) | 25 (86.2%) |
| 55 to 64 Years | 4 (9.8%) | 39 (95.1%) |
| 65 to 74 Years | 8 (100.0%) | 5 (62.5%) |
| 75 Years and over | 69 (100.0%) | 11 (15.9%) |
| Total | 109 (44.5%) | 141 (57.6%) |
Disability Status by Sex by Age in New Columbus borough
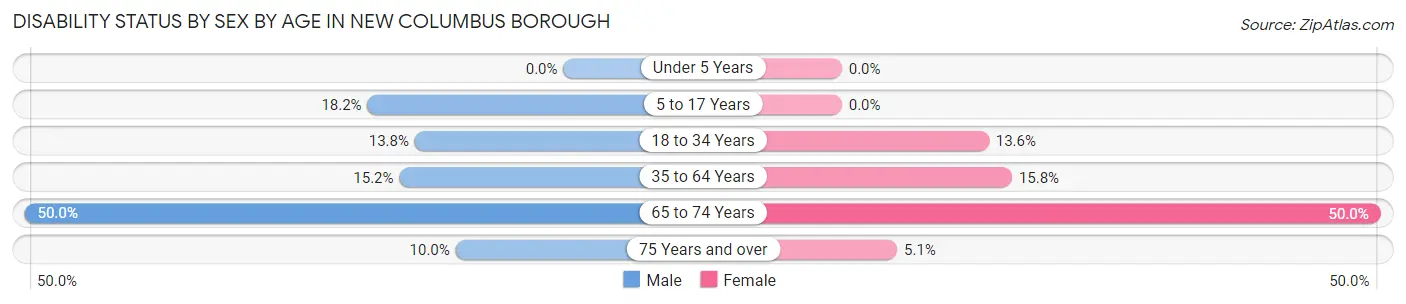
| Age Bracket | Male | Female |
| Under 5 Years | 0 (0.0%) | 0 (0.0%) |
| 5 to 17 Years | 2 (18.2%) | 0 (0.0%) |
| 18 to 34 Years | 4 (13.8%) | 3 (13.6%) |
| 35 to 64 Years | 7 (15.2%) | 6 (15.8%) |
| 65 to 74 Years | 2 (50.0%) | 2 (50.0%) |
| 75 Years and over | 3 (10.0%) | 2 (5.1%) |
Disability Class by Sex by Age in New Columbus borough
Disability Class: Hearing Difficulty
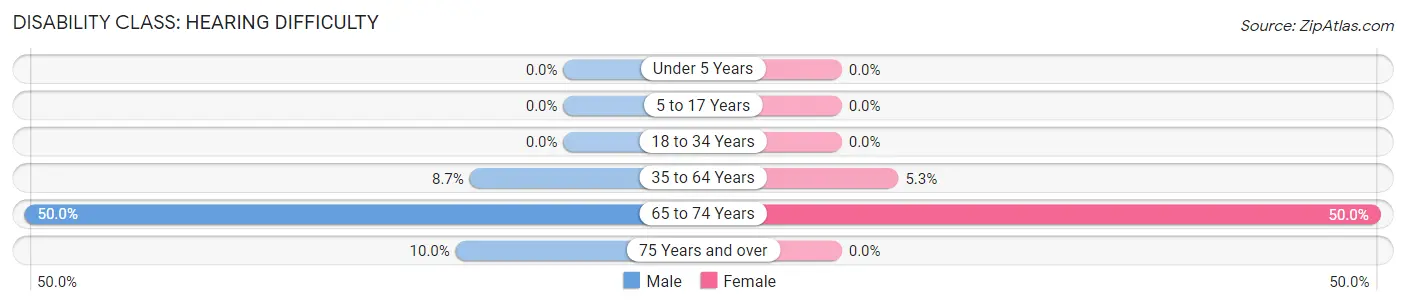
| Age Bracket | Male | Female |
| Under 5 Years | 0 (0.0%) | 0 (0.0%) |
| 5 to 17 Years | 0 (0.0%) | 0 (0.0%) |
| 18 to 34 Years | 0 (0.0%) | 0 (0.0%) |
| 35 to 64 Years | 4 (8.7%) | 2 (5.3%) |
| 65 to 74 Years | 2 (50.0%) | 2 (50.0%) |
| 75 Years and over | 3 (10.0%) | 0 (0.0%) |
Disability Class: Vision Difficulty
| Age Bracket | Male | Female |
| Under 5 Years | 0 (0.0%) | 0 (0.0%) |
| 5 to 17 Years | 0 (0.0%) | 0 (0.0%) |
| 18 to 34 Years | 0 (0.0%) | 0 (0.0%) |
| 35 to 64 Years | 0 (0.0%) | 0 (0.0%) |
| 65 to 74 Years | 0 (0.0%) | 0 (0.0%) |
| 75 Years and over | 0 (0.0%) | 0 (0.0%) |
Disability Class: Cognitive Difficulty
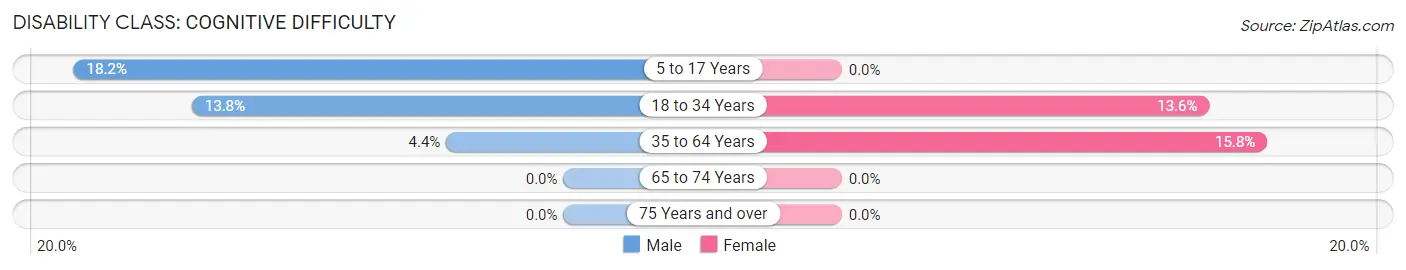
| Age Bracket | Male | Female |
| 5 to 17 Years | 2 (18.2%) | 0 (0.0%) |
| 18 to 34 Years | 4 (13.8%) | 3 (13.6%) |
| 35 to 64 Years | 2 (4.3%) | 6 (15.8%) |
| 65 to 74 Years | 0 (0.0%) | 0 (0.0%) |
| 75 Years and over | 0 (0.0%) | 0 (0.0%) |
Disability Class: Ambulatory Difficulty
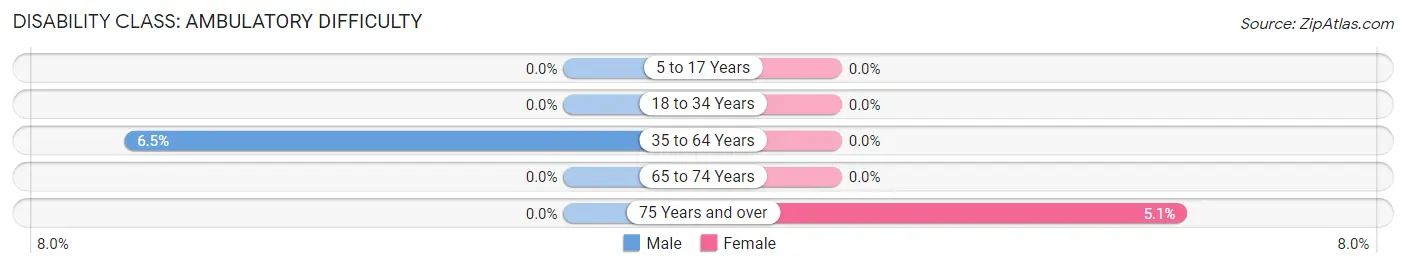
| Age Bracket | Male | Female |
| 5 to 17 Years | 0 (0.0%) | 0 (0.0%) |
| 18 to 34 Years | 0 (0.0%) | 0 (0.0%) |
| 35 to 64 Years | 3 (6.5%) | 0 (0.0%) |
| 65 to 74 Years | 0 (0.0%) | 0 (0.0%) |
| 75 Years and over | 0 (0.0%) | 2 (5.1%) |
Disability Class: Self-Care Difficulty
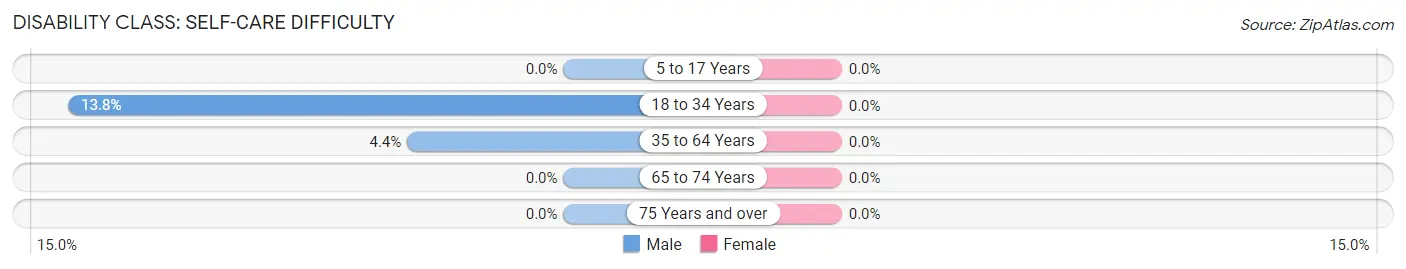
| Age Bracket | Male | Female |
| 5 to 17 Years | 0 (0.0%) | 0 (0.0%) |
| 18 to 34 Years | 4 (13.8%) | 0 (0.0%) |
| 35 to 64 Years | 2 (4.3%) | 0 (0.0%) |
| 65 to 74 Years | 0 (0.0%) | 0 (0.0%) |
| 75 Years and over | 0 (0.0%) | 0 (0.0%) |
Technology Access in New Columbus borough
Computing Device Access in New Columbus borough
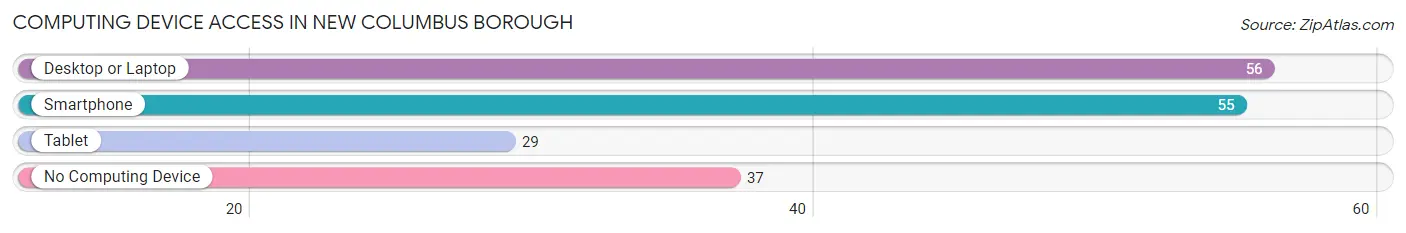
| Device Type | # Households | % Households |
| Desktop or Laptop | 56 | 56.0% |
| Smartphone | 55 | 55.0% |
| Tablet | 29 | 29.0% |
| No Computing Device | 37 | 37.0% |
| Total | 100 | 100.0% |
Internet Access in New Columbus borough
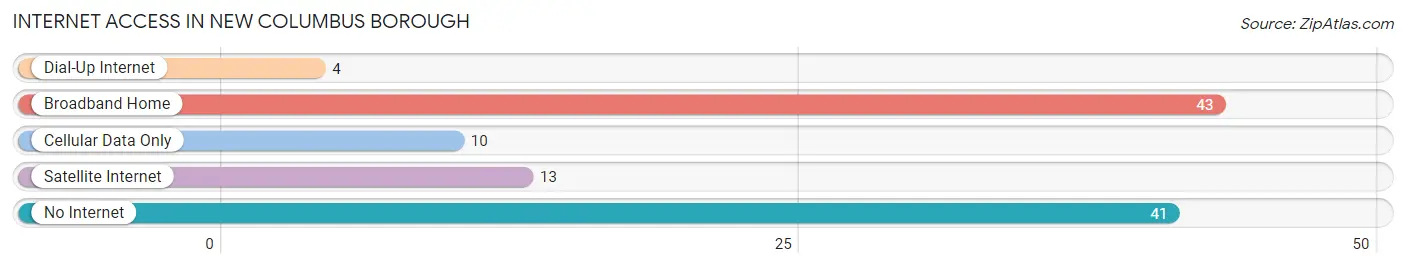
| Internet Type | # Households | % Households |
| Dial-Up Internet | 4 | 4.0% |
| Broadband Home | 43 | 43.0% |
| Cellular Data Only | 10 | 10.0% |
| Satellite Internet | 13 | 13.0% |
| No Internet | 41 | 41.0% |
| Total | 100 | 100.0% |
New Columbus borough Summary
Columbus Borough is a small borough located in the state of Pennsylvania. It is located in the southwestern corner of the state, in the county of Lancaster. The borough is situated in the heart of the Susquehanna Valley, and is surrounded by the townships of East Hempfield, West Hempfield, and Manor. The population of the borough was 1,845 at the 2010 census.
History
The area that is now Columbus Borough was first settled in the late 1700s by German immigrants. The first settlers were mostly farmers, and the area was known as “Columbia”. The name was changed to “Columbus” in 1819, in honor of Christopher Columbus. The borough was officially incorporated in 1833.
In the late 1800s, the borough was a thriving industrial center, with several factories and mills. The most prominent of these was the Columbus Iron Works, which was founded in 1867 and produced a variety of products, including stoves, boilers, and agricultural implements. The iron works closed in the early 1900s, but the borough continued to be an important industrial center, with several other factories and mills.
The borough was also home to several important educational institutions. The first school in the borough was established in 1819, and the first high school was established in 1867. The borough also had several churches, including the First Presbyterian Church, which was founded in 1819.
Geography
Columbus Borough is located in the southwestern corner of the state of Pennsylvania, in the county of Lancaster. The borough is situated in the heart of the Susquehanna Valley, and is surrounded by the townships of East Hempfield, West Hempfield, and Manor. The borough is located approximately 25 miles west of the city of Lancaster, and approximately 50 miles east of the city of Harrisburg.
The borough is situated on the banks of the Conestoga River, and is bordered by the townships of East Hempfield, West Hempfield, and Manor. The borough is located in a rural area, and is surrounded by rolling hills and farmland. The borough is also home to several parks, including the Columbus Borough Park, which features a playground, picnic area, and walking trails.
Economy
The economy of Columbus Borough is largely based on agriculture and manufacturing. The borough is home to several farms, which produce a variety of crops, including corn, soybeans, and wheat. The borough is also home to several factories and mills, which produce a variety of products, including furniture, clothing, and paper products.
The borough is also home to several small businesses, including restaurants, retail stores, and professional services. The borough is also home to several banks, which provide financial services to the local community.
Demographics
As of the 2010 census, the population of Columbus Borough was 1,845. The racial makeup of the borough was 95.3% White, 1.2% African American, 0.2% Native American, 0.7% Asian, 0.1% Pacific Islander, 0.7% from other races, and 1.9% from two or more races. Hispanic or Latino of any race were 2.2% of the population.
The median household income in the borough was $45,938, and the median family income was $54,844. The per capita income in the borough was $21,945. About 8.3% of families and 10.2% of the population were below the poverty line, including 14.2% of those under age 18 and 6.2% of those age 65 or over.
Common Questions
What is Per Capita Income in New Columbus borough?
Per Capita income in New Columbus borough is $25,553.
What is the Median Family Income in New Columbus borough?
Median Family Income in New Columbus borough is $35,568.
What is the Median Household income in New Columbus borough?
Median Household Income in New Columbus borough is $35,625.
What is Inequality or Gini Index in New Columbus borough?
Inequality or Gini Index in New Columbus borough is 0.48.
What is the Total Population of New Columbus borough?
Total Population of New Columbus borough is 245.
What is the Total Male Population of New Columbus borough?
Total Male Population of New Columbus borough is 124.
What is the Total Female Population of New Columbus borough?
Total Female Population of New Columbus borough is 121.
What is the Ratio of Males per 100 Females in New Columbus borough?
There are 102.48 Males per 100 Females in New Columbus borough.
What is the Ratio of Females per 100 Males in New Columbus borough?
There are 97.58 Females per 100 Males in New Columbus borough.
What is the Median Population Age in New Columbus borough?
Median Population Age in New Columbus borough is 50.9 Years.
What is the Average Family Size in New Columbus borough
Average Family Size in New Columbus borough is 2.7 People.
What is the Average Household Size in New Columbus borough
Average Household Size in New Columbus borough is 2.5 People.
How Large is the Labor Force in New Columbus borough?
There are 114 People in the Labor Forcein in New Columbus borough.
What is the Percentage of People in the Labor Force in New Columbus borough?
53.0% of People are in the Labor Force in New Columbus borough.
What is the Unemployment Rate in New Columbus borough?
Unemployment Rate in New Columbus borough is 0.9%.