Nuremberg, PA Map & Demographics
Nuremberg Map
Nuremberg Overview
$38,956
PER CAPITA INCOME
$50,972
AVG FAMILY INCOME
$50,556
AVG HOUSEHOLD INCOME
0.46
INEQUALITY / GINI INDEX
268
TOTAL POPULATION
92
MALE POPULATION
176
FEMALE POPULATION
52.27
MALES / 100 FEMALES
191.30
FEMALES / 100 MALES
62.7
MEDIAN AGE
2.1
AVG FAMILY SIZE
1.8
AVG HOUSEHOLD SIZE
106
LABOR FORCE [ PEOPLE ]
45.7%
PERCENT IN LABOR FORCE
7.5%
UNEMPLOYMENT RATE
Nuremberg Zip Codes
Nuremberg Area Codes
Income in Nuremberg
Income Overview in Nuremberg
Per Capita Income in Nuremberg is $38,956, while median incomes of families and households are $50,972 and $50,556 respectively.
| Characteristic | Number | Measure |
| Per Capita Income | 268 | $38,956 |
| Median Family Income | 77 | $50,972 |
| Mean Family Income | 77 | $77,964 |
| Median Household Income | 152 | $50,556 |
| Mean Household Income | 152 | $65,993 |
| Income Deficit | 77 | $0 |
| Wage / Income Gap (%) | 268 | 0.00% |
| Wage / Income Gap ($) | 268 | 100.00¢ per $1 |
| Gini / Inequality Index | 268 | 0.46 |
Earnings by Sex in Nuremberg
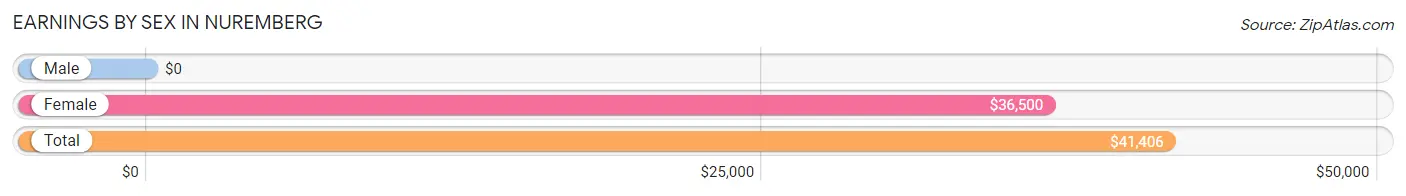
| Sex | Number | Average Earnings |
| Male | 21 (20.8%) | $0 |
| Female | 80 (79.2%) | $36,500 |
| Total | 101 (100.0%) | $41,406 |
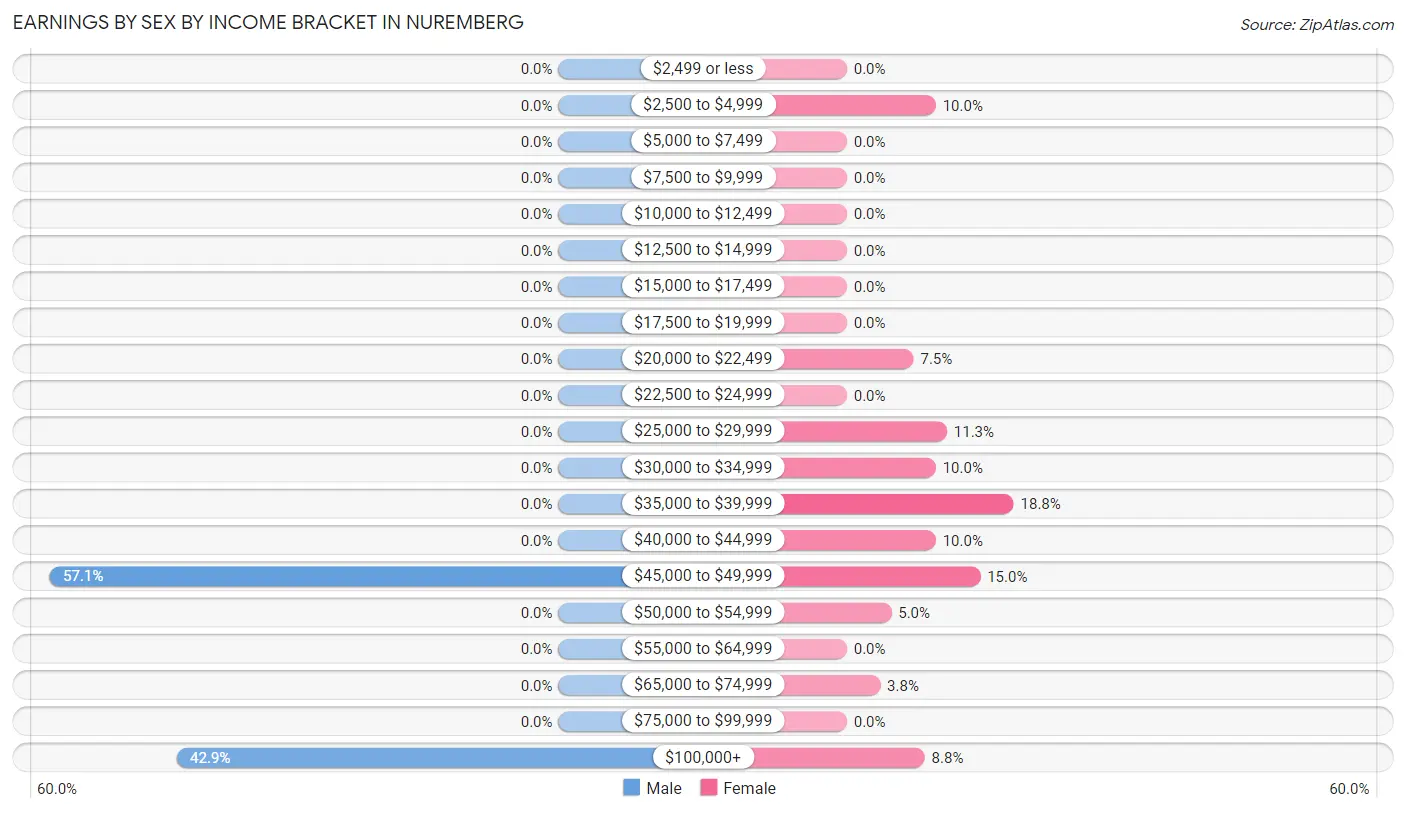
Earnings by Sex by Income Bracket in Nuremberg
The most common earnings brackets in Nuremberg are $45,000 to $49,999 for men (12 | 57.1%) and $35,000 to $39,999 for women (15 | 18.8%).
| Income | Male | Female |
| $2,499 or less | 0 (0.0%) | 0 (0.0%) |
| $2,500 to $4,999 | 0 (0.0%) | 8 (10.0%) |
| $5,000 to $7,499 | 0 (0.0%) | 0 (0.0%) |
| $7,500 to $9,999 | 0 (0.0%) | 0 (0.0%) |
| $10,000 to $12,499 | 0 (0.0%) | 0 (0.0%) |
| $12,500 to $14,999 | 0 (0.0%) | 0 (0.0%) |
| $15,000 to $17,499 | 0 (0.0%) | 0 (0.0%) |
| $17,500 to $19,999 | 0 (0.0%) | 0 (0.0%) |
| $20,000 to $22,499 | 0 (0.0%) | 6 (7.5%) |
| $22,500 to $24,999 | 0 (0.0%) | 0 (0.0%) |
| $25,000 to $29,999 | 0 (0.0%) | 9 (11.3%) |
| $30,000 to $34,999 | 0 (0.0%) | 8 (10.0%) |
| $35,000 to $39,999 | 0 (0.0%) | 15 (18.8%) |
| $40,000 to $44,999 | 0 (0.0%) | 8 (10.0%) |
| $45,000 to $49,999 | 12 (57.1%) | 12 (15.0%) |
| $50,000 to $54,999 | 0 (0.0%) | 4 (5.0%) |
| $55,000 to $64,999 | 0 (0.0%) | 0 (0.0%) |
| $65,000 to $74,999 | 0 (0.0%) | 3 (3.7%) |
| $75,000 to $99,999 | 0 (0.0%) | 0 (0.0%) |
| $100,000+ | 9 (42.9%) | 7 (8.7%) |
| Total | 21 (100.0%) | 80 (100.0%) |
Earnings by Sex by Educational Attainment in Nuremberg
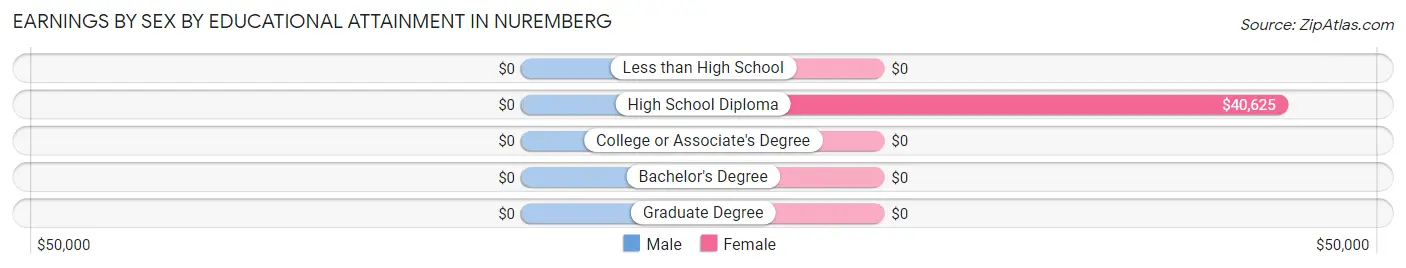
| Educational Attainment | Male Income | Female Income |
| Less than High School | - | - |
| High School Diploma | - | - |
| College or Associate's Degree | - | - |
| Bachelor's Degree | - | - |
| Graduate Degree | - | - |
| Total | - | - |
Family Income in Nuremberg
Family Income Brackets in Nuremberg
According to the Nuremberg family income data, there are 16 families falling into the $50,000 to $74,999 income range, which is the most common income bracket and makes up 20.8% of all families.

| Income Bracket | # Families | % Families |
| Less than $10,000 | 9 | 11.7% |
| $10,000 to $14,999 | 0 | 0.0% |
| $15,000 to $24,999 | 0 | 0.0% |
| $25,000 to $34,999 | 11 | 14.3% |
| $35,000 to $49,999 | 15 | 19.5% |
| $50,000 to $74,999 | 16 | 20.8% |
| $75,000 to $99,999 | 9 | 11.7% |
| $100,000 to $149,999 | 13 | 16.9% |
| $150,000 to $199,999 | 0 | 0.0% |
| $200,000+ | 4 | 5.2% |
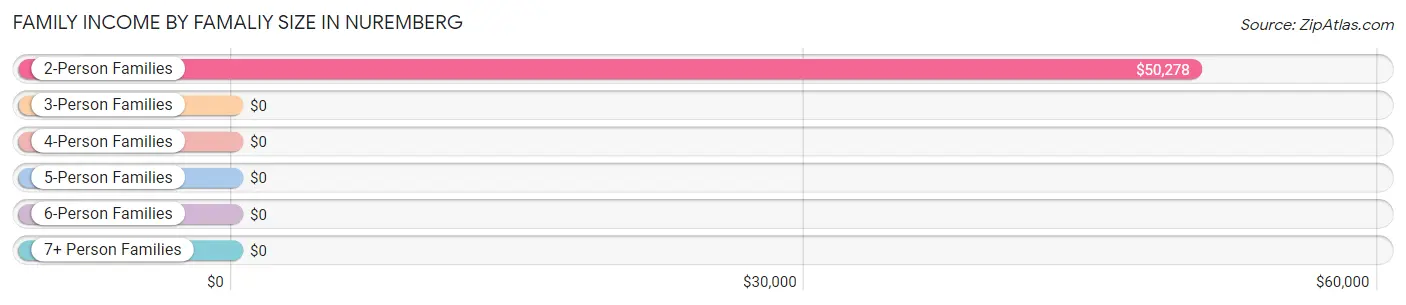
Family Income by Famaliy Size in Nuremberg
2-person families (72 | 93.5%) account for the highest median family income in Nuremberg with $50,278 per family, while 2-person families (72 | 93.5%) have the highest median income of $25,139 per family member.
| Income Bracket | # Families | Median Income |
| 2-Person Families | 72 (93.5%) | $50,278 |
| 3-Person Families | 0 (0.0%) | $0 |
| 4-Person Families | 5 (6.5%) | $0 |
| 5-Person Families | 0 (0.0%) | $0 |
| 6-Person Families | 0 (0.0%) | $0 |
| 7+ Person Families | 0 (0.0%) | $0 |
| Total | 77 (100.0%) | $50,972 |
Family Income by Number of Earners in Nuremberg
| Number of Earners | # Families | Median Income |
| No Earners | 20 (26.0%) | $0 |
| 1 Earner | 48 (62.3%) | $0 |
| 2 Earners | 9 (11.7%) | $0 |
| 3+ Earners | 0 (0.0%) | $0 |
| Total | 77 (100.0%) | $50,972 |
Household Income in Nuremberg
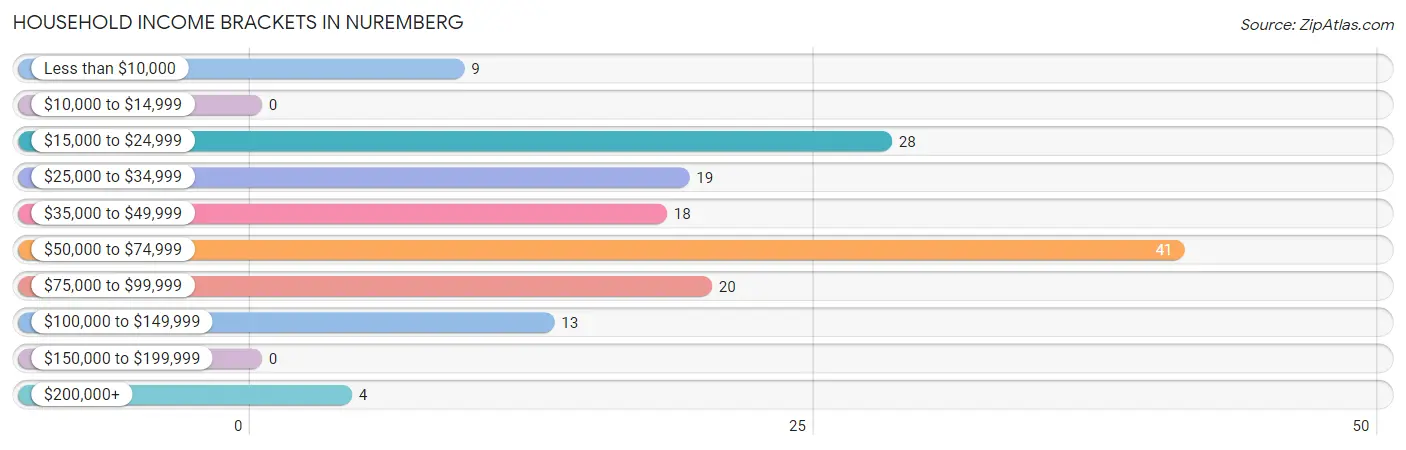
Household Income Brackets in Nuremberg
With 41 households falling in the category, the $50,000 to $74,999 income range is the most frequent in Nuremberg, accounting for 27.0% of all households.
| Income Bracket | # Households | % Households |
| Less than $10,000 | 9 | 5.9% |
| $10,000 to $14,999 | 0 | 0.0% |
| $15,000 to $24,999 | 28 | 18.4% |
| $25,000 to $34,999 | 19 | 12.5% |
| $35,000 to $49,999 | 18 | 11.8% |
| $50,000 to $74,999 | 41 | 27.0% |
| $75,000 to $99,999 | 20 | 13.2% |
| $100,000 to $149,999 | 13 | 8.6% |
| $150,000 to $199,999 | 0 | 0.0% |
| $200,000+ | 4 | 2.6% |
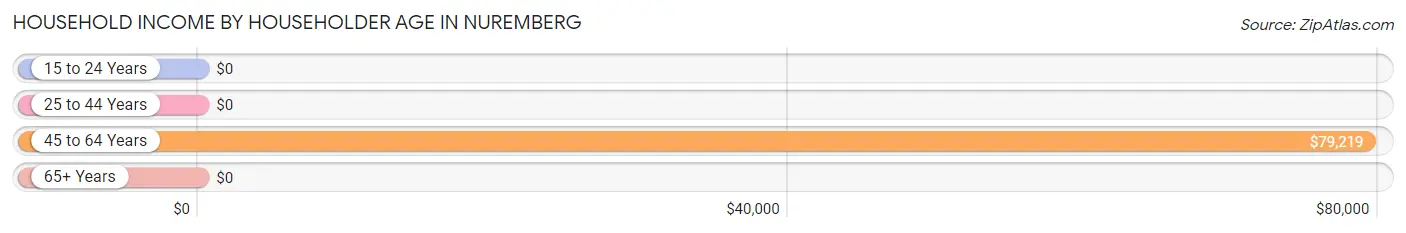
Household Income by Householder Age in Nuremberg
The median household income in Nuremberg is $50,556, with the highest median household income of $79,219 found in the 45 to 64 years age bracket for the primary householder. A total of 23 households (15.1%) fall into this category. Meanwhile, the 15 to 24 years age bracket for the primary householder has the lowest median household income of $0, with 15 households (9.9%) in this group.
| Income Bracket | # Households | Median Income |
| 15 to 24 Years | 15 (9.9%) | $0 |
| 25 to 44 Years | 21 (13.8%) | $0 |
| 45 to 64 Years | 23 (15.1%) | $79,219 |
| 65+ Years | 93 (61.2%) | $0 |
| Total | 152 (100.0%) | $50,556 |
Poverty in Nuremberg
Income Below Poverty by Sex and Age in Nuremberg
With 33.7% poverty level for males and 5.1% for females among the residents of Nuremberg, 55 to 64 year old males and 65 to 74 year old females are the most vulnerable to poverty, with 19 males (67.9%) and 9 females (24.3%) in their respective age groups living below the poverty level.
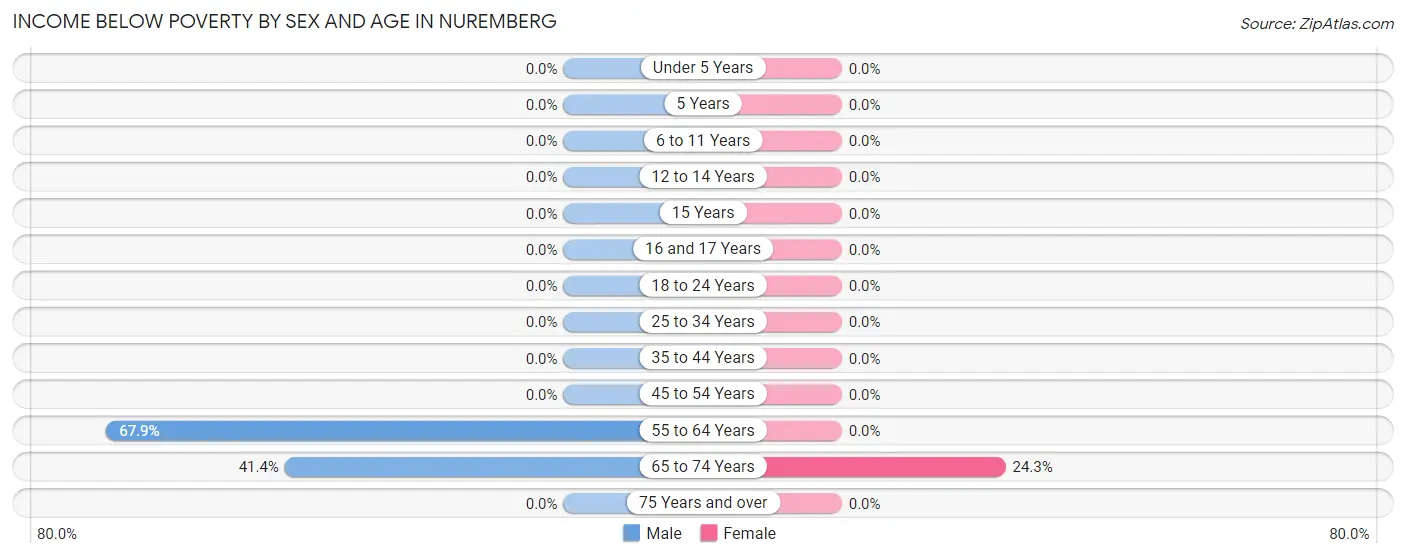
| Age Bracket | Male | Female |
| Under 5 Years | 0 (0.0%) | 0 (0.0%) |
| 5 Years | 0 (0.0%) | 0 (0.0%) |
| 6 to 11 Years | 0 (0.0%) | 0 (0.0%) |
| 12 to 14 Years | 0 (0.0%) | 0 (0.0%) |
| 15 Years | 0 (0.0%) | 0 (0.0%) |
| 16 and 17 Years | 0 (0.0%) | 0 (0.0%) |
| 18 to 24 Years | 0 (0.0%) | 0 (0.0%) |
| 25 to 34 Years | 0 (0.0%) | 0 (0.0%) |
| 35 to 44 Years | 0 (0.0%) | 0 (0.0%) |
| 45 to 54 Years | 0 (0.0%) | 0 (0.0%) |
| 55 to 64 Years | 19 (67.9%) | 0 (0.0%) |
| 65 to 74 Years | 12 (41.4%) | 9 (24.3%) |
| 75 Years and over | 0 (0.0%) | 0 (0.0%) |
| Total | 31 (33.7%) | 9 (5.1%) |
Income Above Poverty by Sex and Age in Nuremberg
According to the poverty statistics in Nuremberg, males aged under 5 years and females aged 5 years are the age groups that are most secure financially, with 100.0% of males and 100.0% of females in these age groups living above the poverty line.
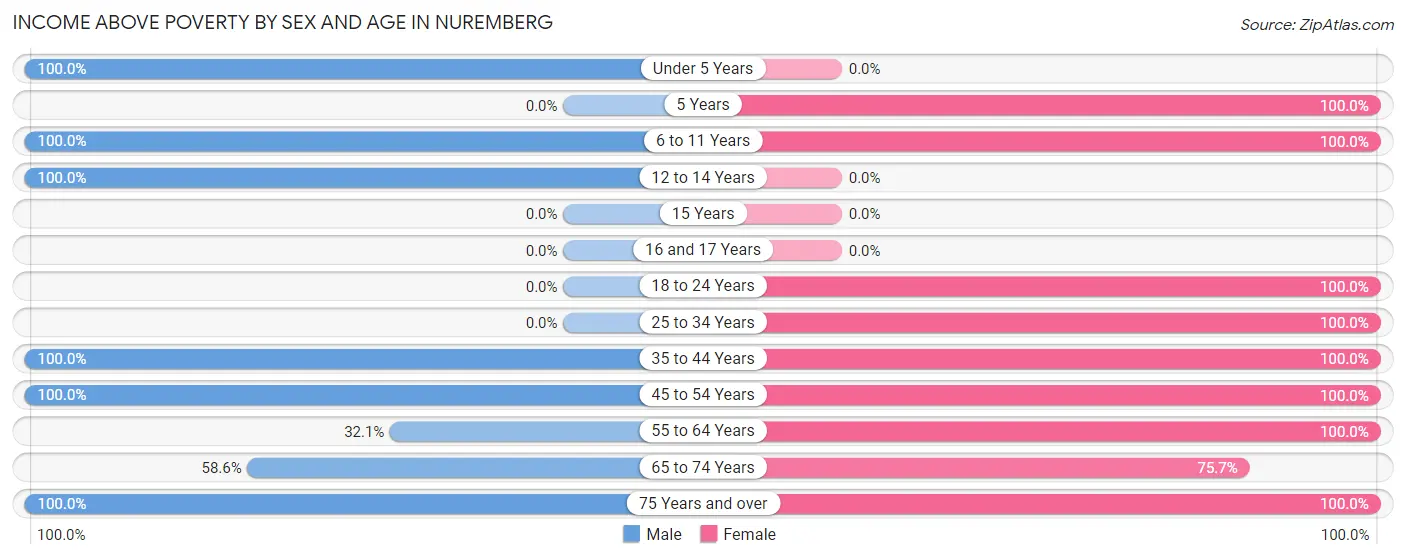
| Age Bracket | Male | Female |
| Under 5 Years | 10 (100.0%) | 0 (0.0%) |
| 5 Years | 0 (0.0%) | 14 (100.0%) |
| 6 to 11 Years | 4 (100.0%) | 4 (100.0%) |
| 12 to 14 Years | 4 (100.0%) | 0 (0.0%) |
| 15 Years | 0 (0.0%) | 0 (0.0%) |
| 16 and 17 Years | 0 (0.0%) | 0 (0.0%) |
| 18 to 24 Years | 0 (0.0%) | 15 (100.0%) |
| 25 to 34 Years | 0 (0.0%) | 13 (100.0%) |
| 35 to 44 Years | 8 (100.0%) | 14 (100.0%) |
| 45 to 54 Years | 7 (100.0%) | 8 (100.0%) |
| 55 to 64 Years | 9 (32.1%) | 15 (100.0%) |
| 65 to 74 Years | 17 (58.6%) | 28 (75.7%) |
| 75 Years and over | 2 (100.0%) | 56 (100.0%) |
| Total | 61 (66.3%) | 167 (94.9%) |
Income Below Poverty Among Married-Couple Families in Nuremberg
The poverty statistics for married-couple families in Nuremberg show that 25.0% or 9 of the total 36 families live below the poverty line. Families with no children have the highest poverty rate of 29.0%, comprising of 9 families. On the other hand, families with 1 or 2 children have the lowest poverty rate of 0.0%, which includes 0 families.
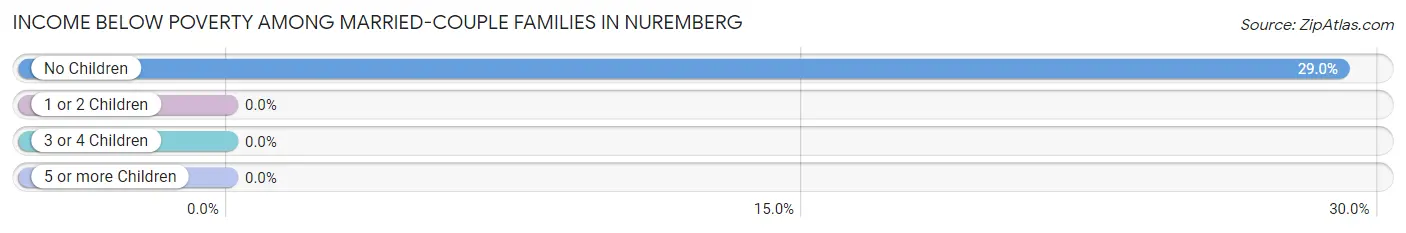
| Children | Above Poverty | Below Poverty |
| No Children | 22 (71.0%) | 9 (29.0%) |
| 1 or 2 Children | 5 (100.0%) | 0 (0.0%) |
| 3 or 4 Children | 0 (0.0%) | 0 (0.0%) |
| 5 or more Children | 0 (0.0%) | 0 (0.0%) |
| Total | 27 (75.0%) | 9 (25.0%) |
Income Below Poverty Among Single-Parent Households in Nuremberg
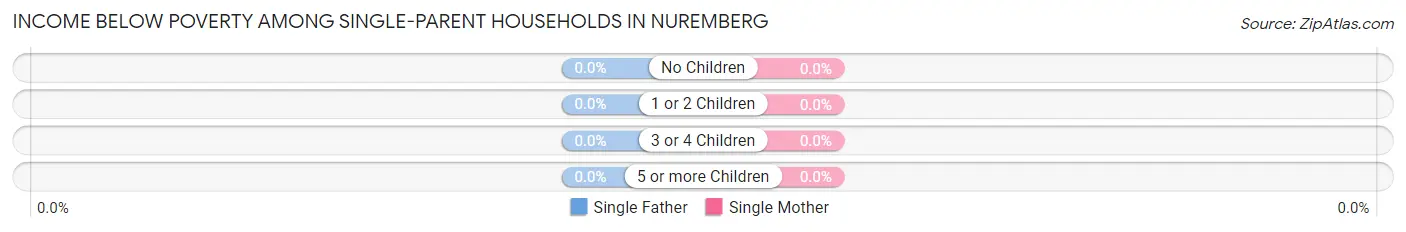
| Children | Single Father | Single Mother |
| No Children | 0 (0.0%) | 0 (0.0%) |
| 1 or 2 Children | 0 (0.0%) | 0 (0.0%) |
| 3 or 4 Children | 0 (0.0%) | 0 (0.0%) |
| 5 or more Children | 0 (0.0%) | 0 (0.0%) |
| Total | 0 (0.0%) | 0 (0.0%) |
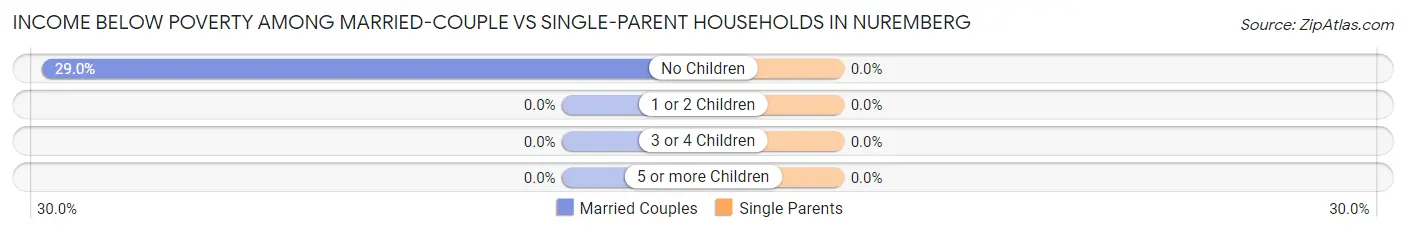
Income Below Poverty Among Married-Couple vs Single-Parent Households in Nuremberg
| Children | Married-Couple Families | Single-Parent Households |
| No Children | 9 (29.0%) | 0 (0.0%) |
| 1 or 2 Children | 0 (0.0%) | 0 (0.0%) |
| 3 or 4 Children | 0 (0.0%) | 0 (0.0%) |
| 5 or more Children | 0 (0.0%) | 0 (0.0%) |
| Total | 9 (25.0%) | 0 (0.0%) |
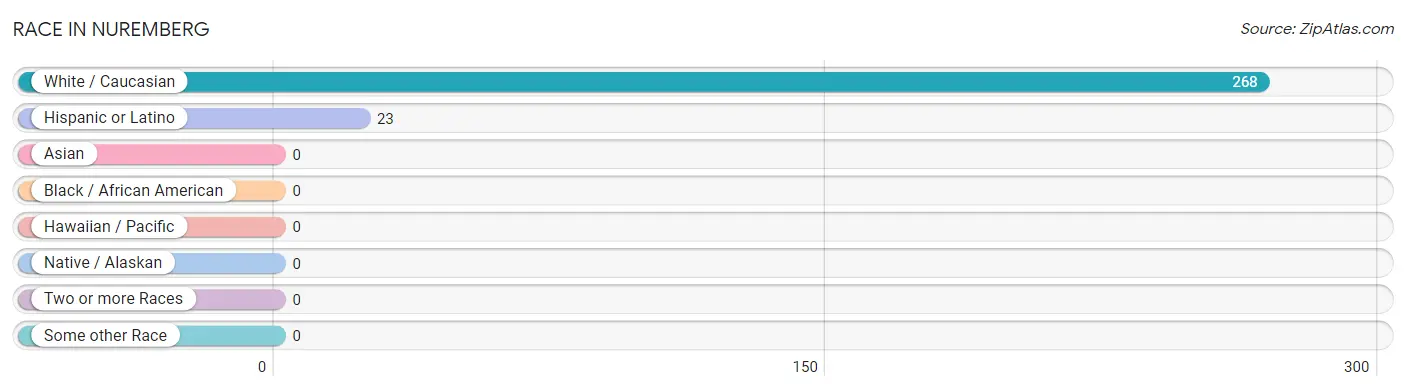
Race in Nuremberg
The most populous races in Nuremberg are White / Caucasian (268 | 100.0%), and Hispanic or Latino (23 | 8.6%).
| Race | # Population | % Population |
| Asian | 0 | 0.0% |
| Black / African American | 0 | 0.0% |
| Hawaiian / Pacific | 0 | 0.0% |
| Hispanic or Latino | 23 | 8.6% |
| Native / Alaskan | 0 | 0.0% |
| White / Caucasian | 268 | 100.0% |
| Two or more Races | 0 | 0.0% |
| Some other Race | 0 | 0.0% |
| Total | 268 | 100.0% |
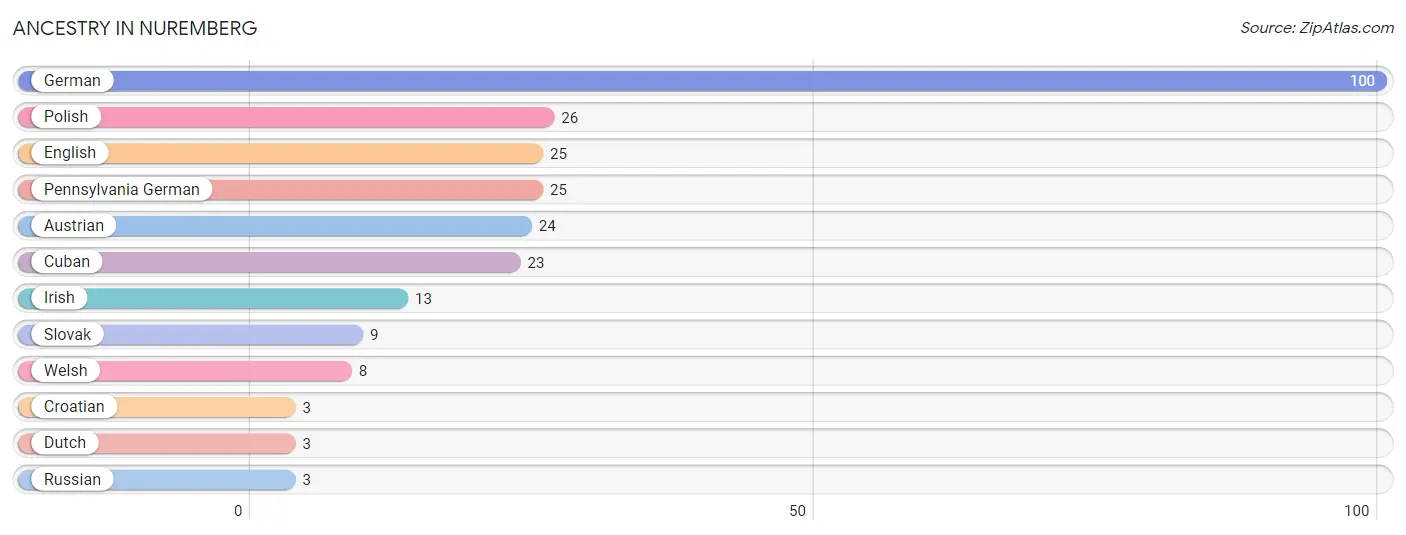
Ancestry in Nuremberg
The most populous ancestries reported in Nuremberg are German (100 | 37.3%), Polish (26 | 9.7%), English (25 | 9.3%), Pennsylvania German (25 | 9.3%), and Austrian (24 | 9.0%), together accounting for 74.6% of all Nuremberg residents.
| Ancestry | # Population | % Population |
| Austrian | 24 | 9.0% |
| Croatian | 3 | 1.1% |
| Cuban | 23 | 8.6% |
| Dutch | 3 | 1.1% |
| English | 25 | 9.3% |
| German | 100 | 37.3% |
| Irish | 13 | 4.9% |
| Pennsylvania German | 25 | 9.3% |
| Polish | 26 | 9.7% |
| Russian | 3 | 1.1% |
| Slovak | 9 | 3.4% |
| Welsh | 8 | 3.0% | View All 12 Rows |
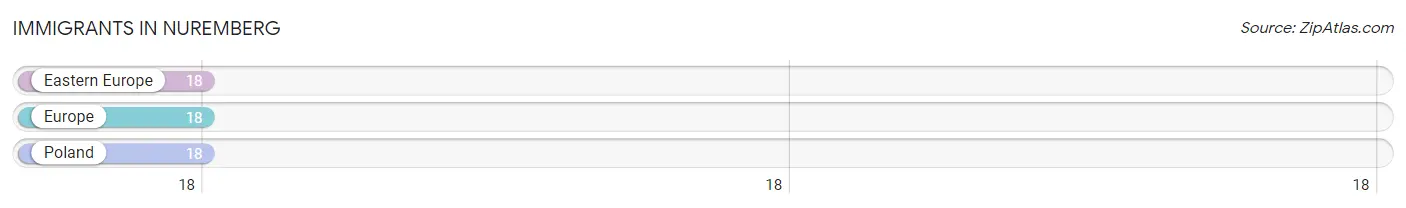
Immigrants in Nuremberg
The most numerous immigrant groups reported in Nuremberg came from Eastern Europe (18 | 6.7%), Europe (18 | 6.7%), and Poland (18 | 6.7%), together accounting for 20.2% of all Nuremberg residents.
| Immigration Origin | # Population | % Population |
| Eastern Europe | 18 | 6.7% |
| Europe | 18 | 6.7% |
| Poland | 18 | 6.7% | View All 3 Rows |
Sex and Age in Nuremberg
Sex and Age in Nuremberg
The most populous age groups in Nuremberg are 55 to 59 Years (19 | 20.6%) for men and 75 to 79 Years (31 | 17.6%) for women.
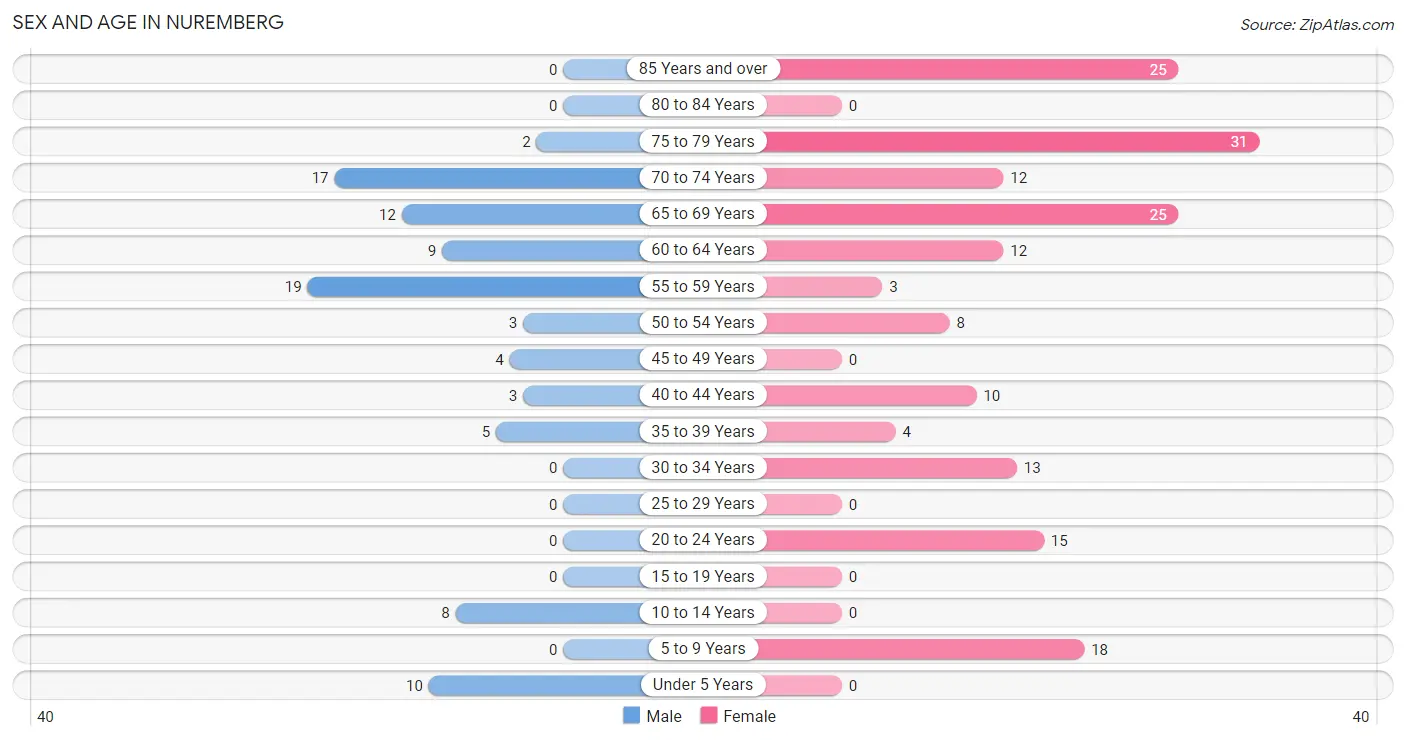
| Age Bracket | Male | Female |
| Under 5 Years | 10 (10.9%) | 0 (0.0%) |
| 5 to 9 Years | 0 (0.0%) | 18 (10.2%) |
| 10 to 14 Years | 8 (8.7%) | 0 (0.0%) |
| 15 to 19 Years | 0 (0.0%) | 0 (0.0%) |
| 20 to 24 Years | 0 (0.0%) | 15 (8.5%) |
| 25 to 29 Years | 0 (0.0%) | 0 (0.0%) |
| 30 to 34 Years | 0 (0.0%) | 13 (7.4%) |
| 35 to 39 Years | 5 (5.4%) | 4 (2.3%) |
| 40 to 44 Years | 3 (3.3%) | 10 (5.7%) |
| 45 to 49 Years | 4 (4.3%) | 0 (0.0%) |
| 50 to 54 Years | 3 (3.3%) | 8 (4.5%) |
| 55 to 59 Years | 19 (20.6%) | 3 (1.7%) |
| 60 to 64 Years | 9 (9.8%) | 12 (6.8%) |
| 65 to 69 Years | 12 (13.0%) | 25 (14.2%) |
| 70 to 74 Years | 17 (18.5%) | 12 (6.8%) |
| 75 to 79 Years | 2 (2.2%) | 31 (17.6%) |
| 80 to 84 Years | 0 (0.0%) | 0 (0.0%) |
| 85 Years and over | 0 (0.0%) | 25 (14.2%) |
| Total | 92 (100.0%) | 176 (100.0%) |
Families and Households in Nuremberg
Median Family Size in Nuremberg
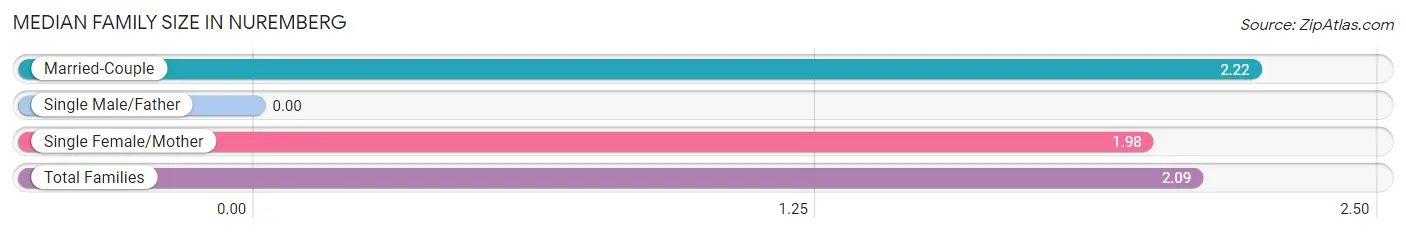
| Family Type | # Families | Family Size |
| Married-Couple | 36 (46.8%) | 2.22 |
| Single Male/Father | 0 (0.0%) | - |
| Single Female/Mother | 41 (53.2%) | 1.98 |
| Total Families | 77 (100.0%) | 2.09 |
Median Household Size in Nuremberg
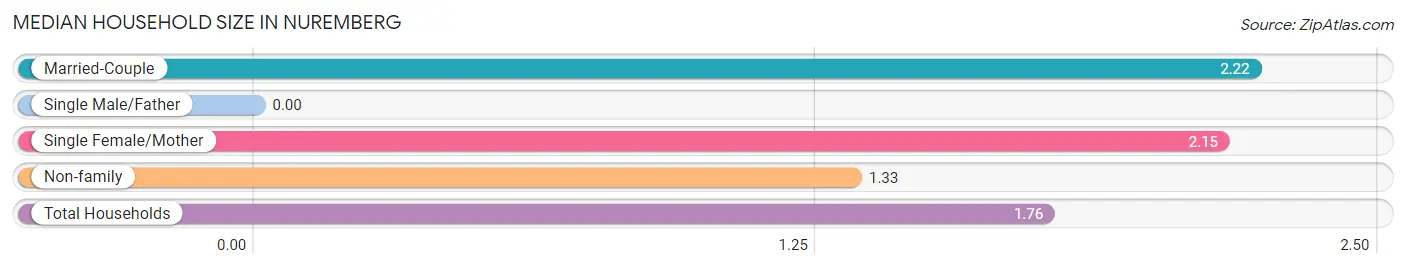
| Household Type | # Households | Household Size |
| Married-Couple | 36 (23.7%) | 2.22 |
| Single Male/Father | 0 (0.0%) | - |
| Single Female/Mother | 41 (27.0%) | 2.15 |
| Non-family | 75 (49.3%) | 1.33 |
| Total Households | 152 (100.0%) | 1.76 |
Household Size by Marriage Status in Nuremberg
Out of a total of 152 households in Nuremberg, 77 (50.7%) are family households, while 75 (49.3%) are nonfamily households. The most numerous type of family households are 2-person households, comprising 68, and the most common type of nonfamily households are 1-person households, comprising 60.
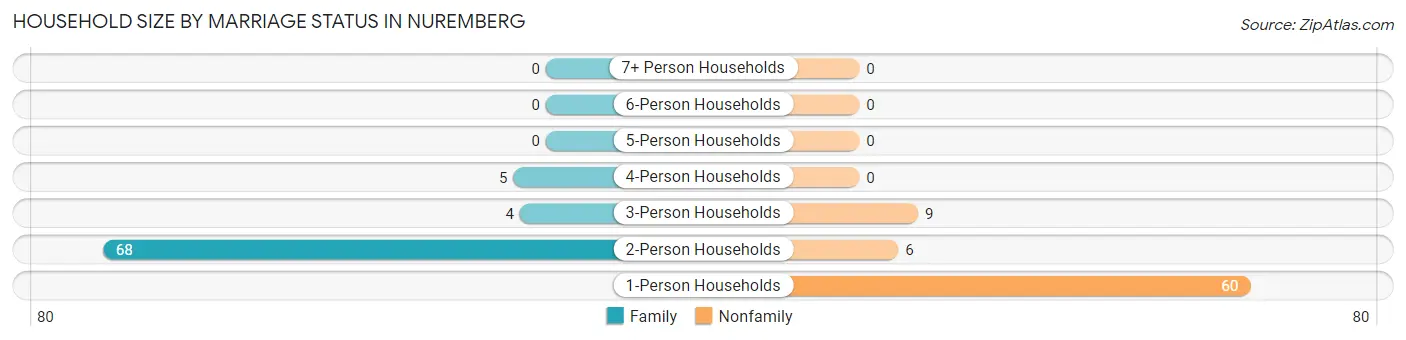
| Household Size | Family Households | Nonfamily Households |
| 1-Person Households | - | 60 (39.5%) |
| 2-Person Households | 68 (44.7%) | 6 (4.0%) |
| 3-Person Households | 4 (2.6%) | 9 (5.9%) |
| 4-Person Households | 5 (3.3%) | 0 (0.0%) |
| 5-Person Households | 0 (0.0%) | 0 (0.0%) |
| 6-Person Households | 0 (0.0%) | 0 (0.0%) |
| 7+ Person Households | 0 (0.0%) | 0 (0.0%) |
| Total | 77 (50.7%) | 75 (49.3%) |
Female Fertility in Nuremberg
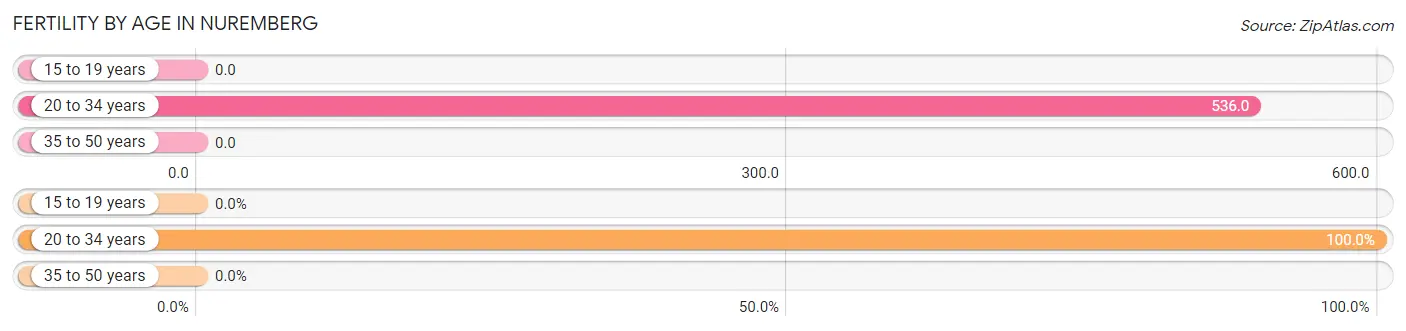
Fertility by Age in Nuremberg
Average fertility rate in Nuremberg is 300.0 births per 1,000 women. Women in the age bracket of 20 to 34 years have the highest fertility rate with 536.0 births per 1,000 women. Women in the age bracket of 20 to 34 years acount for 100.0% of all women with births.
| Age Bracket | Women with Births | Births / 1,000 Women |
| 15 to 19 years | 0 (0.0%) | 0.0 |
| 20 to 34 years | 15 (100.0%) | 536.0 |
| 35 to 50 years | 0 (0.0%) | 0.0 |
| Total | 15 (100.0%) | 300.0 |
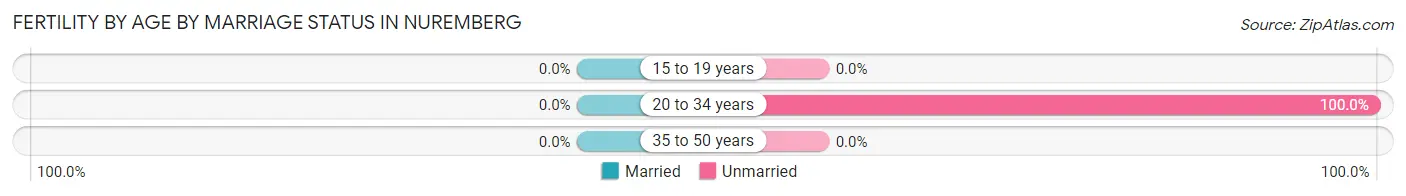
Fertility by Age by Marriage Status in Nuremberg
| Age Bracket | Married | Unmarried |
| 15 to 19 years | 0 (0.0%) | 0 (0.0%) |
| 20 to 34 years | 0 (0.0%) | 15 (100.0%) |
| 35 to 50 years | 0 (0.0%) | 0 (0.0%) |
| Total | 0 (0.0%) | 15 (100.0%) |
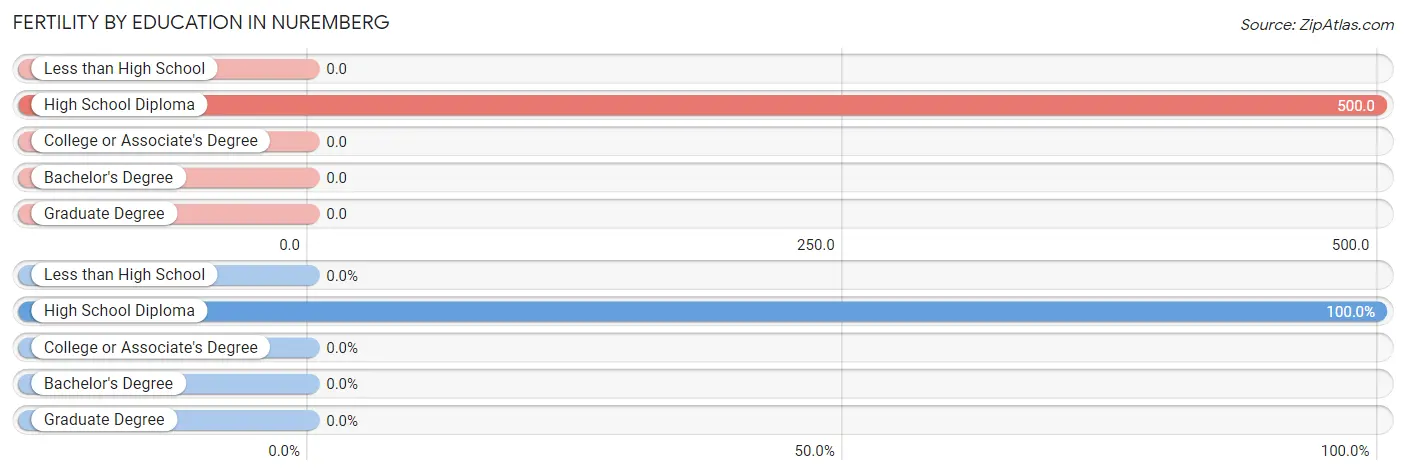
Fertility by Education in Nuremberg
| Educational Attainment | Women with Births | Births / 1,000 Women |
| Less than High School | 0 (0.0%) | 0.0 |
| High School Diploma | 15 (100.0%) | 500.0 |
| College or Associate's Degree | 0 (0.0%) | 0.0 |
| Bachelor's Degree | 0 (0.0%) | 0.0 |
| Graduate Degree | 0 (0.0%) | 0.0 |
| Total | 15 (100.0%) | 300.0 |
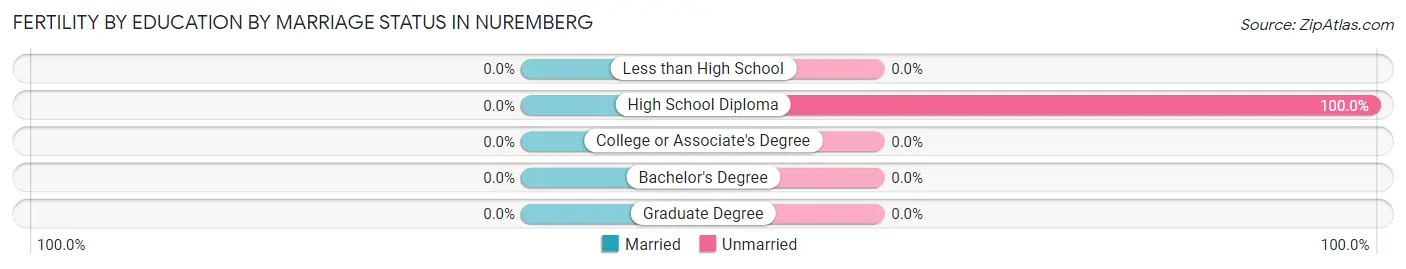
Fertility by Education by Marriage Status in Nuremberg
| Educational Attainment | Married | Unmarried |
| Less than High School | 0 (0.0%) | 0 (0.0%) |
| High School Diploma | 0 (0.0%) | 15 (100.0%) |
| College or Associate's Degree | 0 (0.0%) | 0 (0.0%) |
| Bachelor's Degree | 0 (0.0%) | 0 (0.0%) |
| Graduate Degree | 0 (0.0%) | 0 (0.0%) |
| Total | 0 (0.0%) | 15 (100.0%) |
Employment Characteristics in Nuremberg
Employment by Class of Employer in Nuremberg
Among the 91 employed individuals in Nuremberg, private company employees (48 | 52.7%), not-for-profit organizations (40 | 44.0%), and local government employees (3 | 3.3%) make up the most common classes of employment.
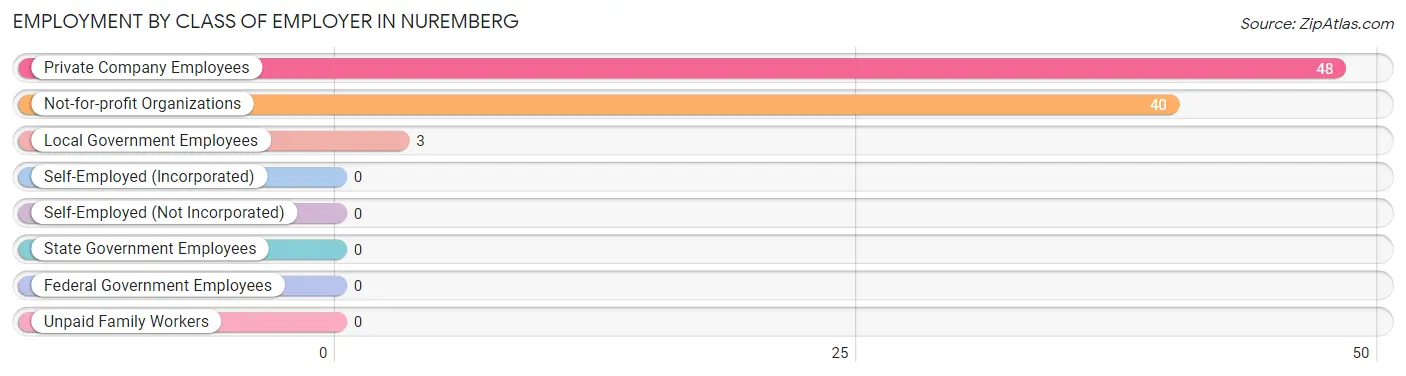
| Employer Class | # Employees | % Employees |
| Private Company Employees | 48 | 52.7% |
| Self-Employed (Incorporated) | 0 | 0.0% |
| Self-Employed (Not Incorporated) | 0 | 0.0% |
| Not-for-profit Organizations | 40 | 44.0% |
| Local Government Employees | 3 | 3.3% |
| State Government Employees | 0 | 0.0% |
| Federal Government Employees | 0 | 0.0% |
| Unpaid Family Workers | 0 | 0.0% |
| Total | 91 | 100.0% |
Employment Status by Age in Nuremberg
According to the labor force statistics for Nuremberg, out of the total population over 16 years of age (232), 45.7% or 106 individuals are in the labor force, with 7.5% or 8 of them unemployed. The age group with the highest labor force participation rate is 20 to 24 years, with 100.0% or 15 individuals in the labor force. Within the labor force, the 65 to 74 years age range has the highest percentage of unemployed individuals, with 33.3% or 8 of them being unemployed.
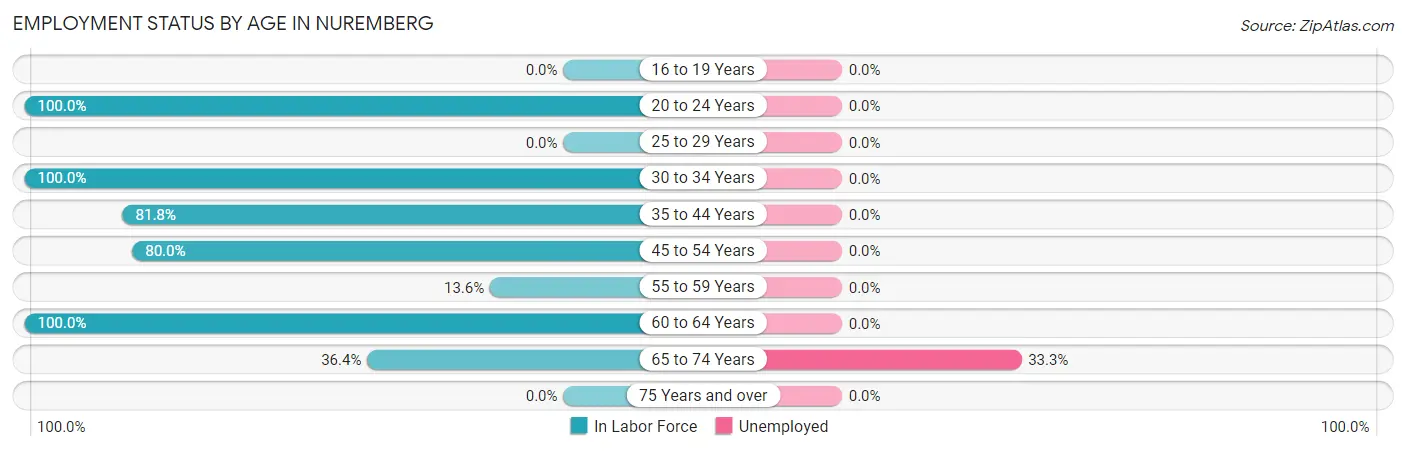
| Age Bracket | In Labor Force | Unemployed |
| 16 to 19 Years | 0 (0.0%) | 0 (0.0%) |
| 20 to 24 Years | 15 (100.0%) | 0 (0.0%) |
| 25 to 29 Years | 0 (0.0%) | 0 (0.0%) |
| 30 to 34 Years | 13 (100.0%) | 0 (0.0%) |
| 35 to 44 Years | 18 (81.8%) | 0 (0.0%) |
| 45 to 54 Years | 12 (80.0%) | 0 (0.0%) |
| 55 to 59 Years | 3 (13.6%) | 0 (0.0%) |
| 60 to 64 Years | 21 (100.0%) | 0 (0.0%) |
| 65 to 74 Years | 24 (36.4%) | 8 (33.3%) |
| 75 Years and over | 0 (0.0%) | 0 (0.0%) |
| Total | 106 (45.7%) | 8 (7.5%) |
Employment Status by Educational Attainment in Nuremberg
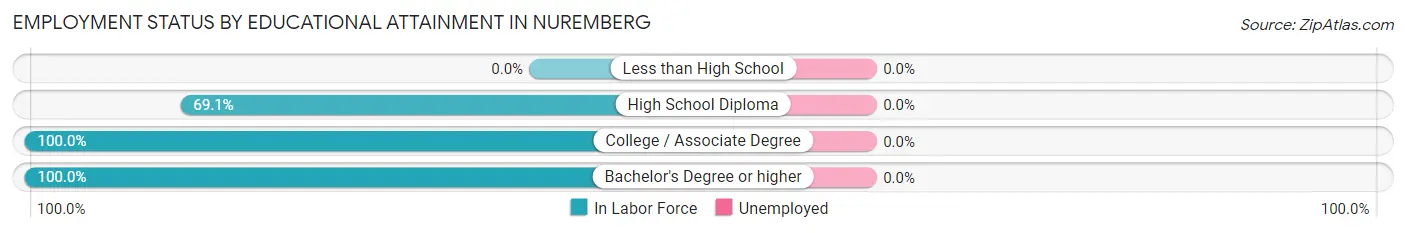
| Educational Attainment | In Labor Force | Unemployed |
| Less than High School | 0 (0.0%) | 0 (0.0%) |
| High School Diploma | 38 (69.1%) | 0 (0.0%) |
| College / Associate Degree | 23 (100.0%) | 0 (0.0%) |
| Bachelor's Degree or higher | 6 (100.0%) | 0 (0.0%) |
| Total | 67 (72.0%) | 0 (0.0%) |
Employment Occupations by Sex in Nuremberg
Management, Business, Science and Arts Occupations
The most common Management, Business, Science and Arts occupations in Nuremberg are Management (15 | 15.3%), Community & Social Service (3 | 3.1%), Arts, Media & Entertainment (3 | 3.1%), and Health Diagnosing & Treating (3 | 3.1%).
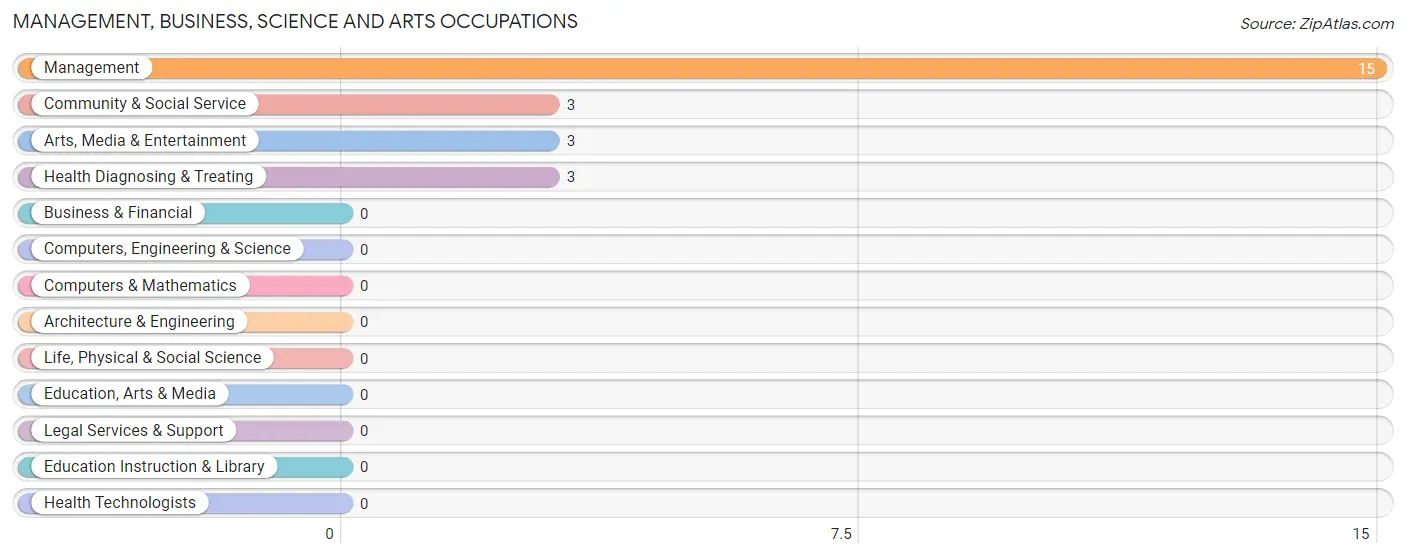
Management, Business, Science and Arts Occupations by Sex
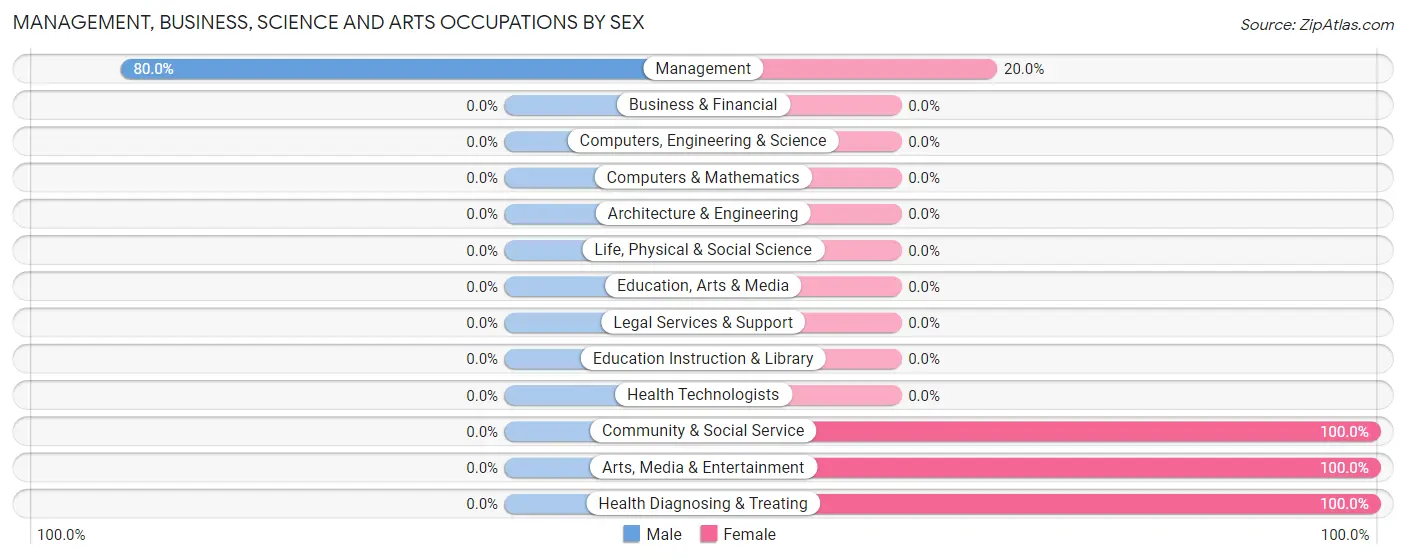
| Occupation | Male | Female |
| Management | 12 (80.0%) | 3 (20.0%) |
| Business & Financial | 0 (0.0%) | 0 (0.0%) |
| Computers, Engineering & Science | 0 (0.0%) | 0 (0.0%) |
| Computers & Mathematics | 0 (0.0%) | 0 (0.0%) |
| Architecture & Engineering | 0 (0.0%) | 0 (0.0%) |
| Life, Physical & Social Science | 0 (0.0%) | 0 (0.0%) |
| Community & Social Service | 0 (0.0%) | 3 (100.0%) |
| Education, Arts & Media | 0 (0.0%) | 0 (0.0%) |
| Legal Services & Support | 0 (0.0%) | 0 (0.0%) |
| Education Instruction & Library | 0 (0.0%) | 0 (0.0%) |
| Arts, Media & Entertainment | 0 (0.0%) | 3 (100.0%) |
| Health Diagnosing & Treating | 0 (0.0%) | 3 (100.0%) |
| Health Technologists | 0 (0.0%) | 0 (0.0%) |
| Total (Category) | 12 (57.1%) | 9 (42.9%) |
| Total (Overall) | 21 (21.4%) | 77 (78.6%) |
Services Occupations
The most common Services occupations in Nuremberg are , and Cleaning & Maintenance (8 | 8.2%).
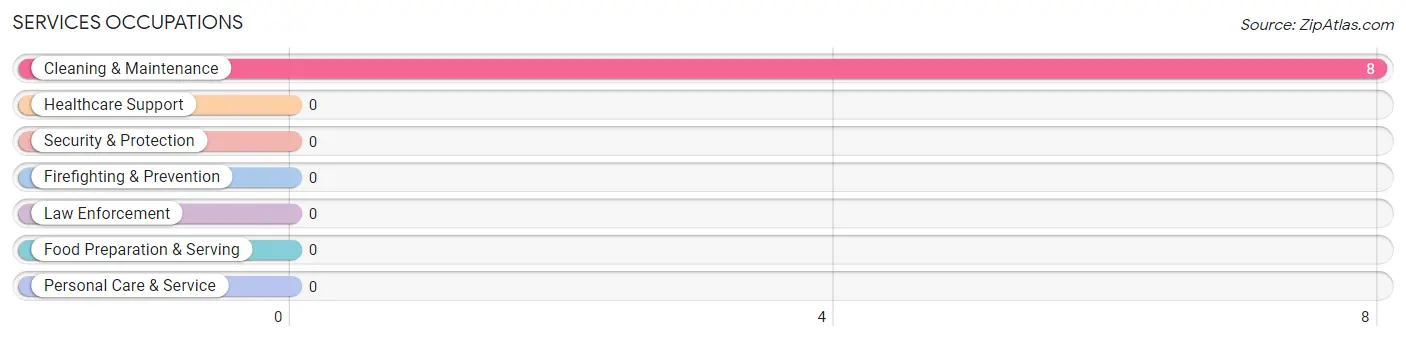
Services Occupations by Sex
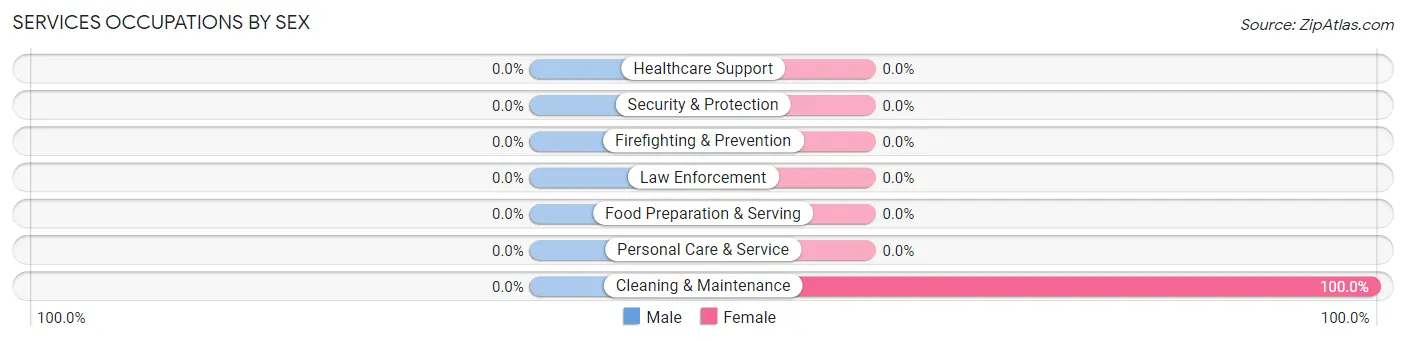
| Occupation | Male | Female |
| Healthcare Support | 0 (0.0%) | 0 (0.0%) |
| Security & Protection | 0 (0.0%) | 0 (0.0%) |
| Firefighting & Prevention | 0 (0.0%) | 0 (0.0%) |
| Law Enforcement | 0 (0.0%) | 0 (0.0%) |
| Food Preparation & Serving | 0 (0.0%) | 0 (0.0%) |
| Cleaning & Maintenance | 0 (0.0%) | 8 (100.0%) |
| Personal Care & Service | 0 (0.0%) | 0 (0.0%) |
| Total (Category) | 0 (0.0%) | 8 (100.0%) |
| Total (Overall) | 21 (21.4%) | 77 (78.6%) |
Sales and Office Occupations
The most common Sales and Office occupations in Nuremberg are Office & Administration (25 | 25.5%), and Sales & Related (4 | 4.1%).
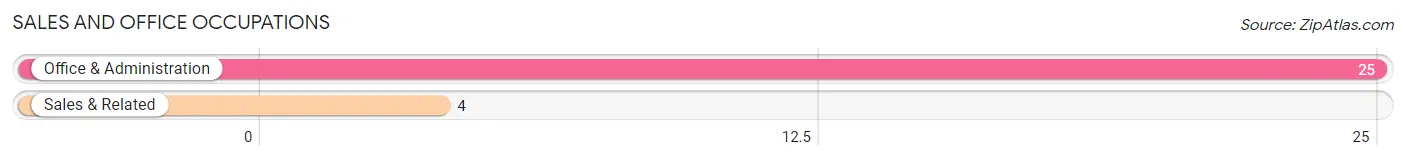
Sales and Office Occupations by Sex
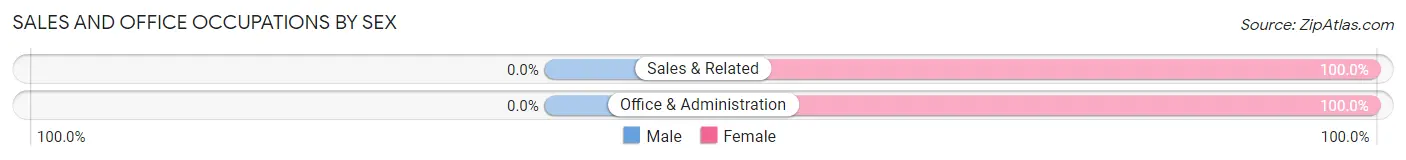
| Occupation | Male | Female |
| Sales & Related | 0 (0.0%) | 4 (100.0%) |
| Office & Administration | 0 (0.0%) | 25 (100.0%) |
| Total (Category) | 0 (0.0%) | 29 (100.0%) |
| Total (Overall) | 21 (21.4%) | 77 (78.6%) |
Natural Resources, Construction and Maintenance Occupations
The most common Natural Resources, Construction and Maintenance occupations in Nuremberg are , and Construction & Extraction (7 | 7.1%).
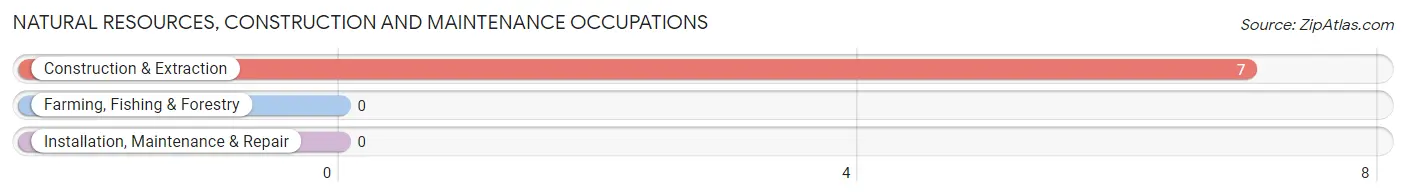
Natural Resources, Construction and Maintenance Occupations by Sex
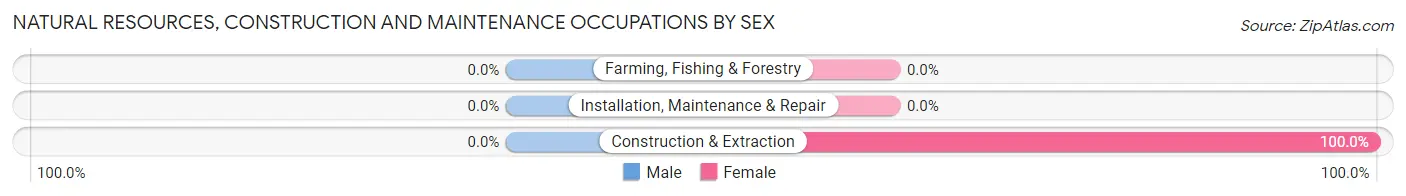
| Occupation | Male | Female |
| Farming, Fishing & Forestry | 0 (0.0%) | 0 (0.0%) |
| Construction & Extraction | 0 (0.0%) | 7 (100.0%) |
| Installation, Maintenance & Repair | 0 (0.0%) | 0 (0.0%) |
| Total (Category) | 0 (0.0%) | 7 (100.0%) |
| Total (Overall) | 21 (21.4%) | 77 (78.6%) |
Production, Transportation and Moving Occupations
The most common Production, Transportation and Moving occupations in Nuremberg are Production (15 | 15.3%), Transportation (9 | 9.2%), and Material Moving (9 | 9.2%).
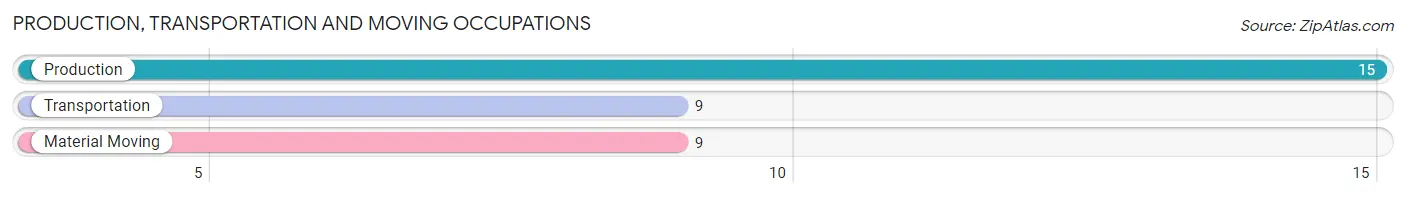
Production, Transportation and Moving Occupations by Sex
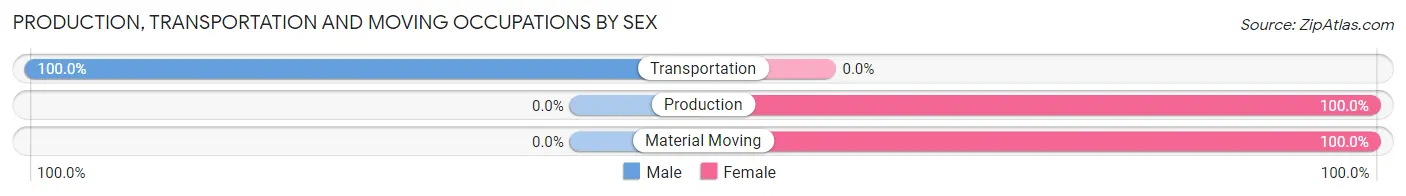
| Occupation | Male | Female |
| Production | 0 (0.0%) | 15 (100.0%) |
| Transportation | 9 (100.0%) | 0 (0.0%) |
| Material Moving | 0 (0.0%) | 9 (100.0%) |
| Total (Category) | 9 (27.3%) | 24 (72.7%) |
| Total (Overall) | 21 (21.4%) | 77 (78.6%) |
Employment Industries by Sex in Nuremberg
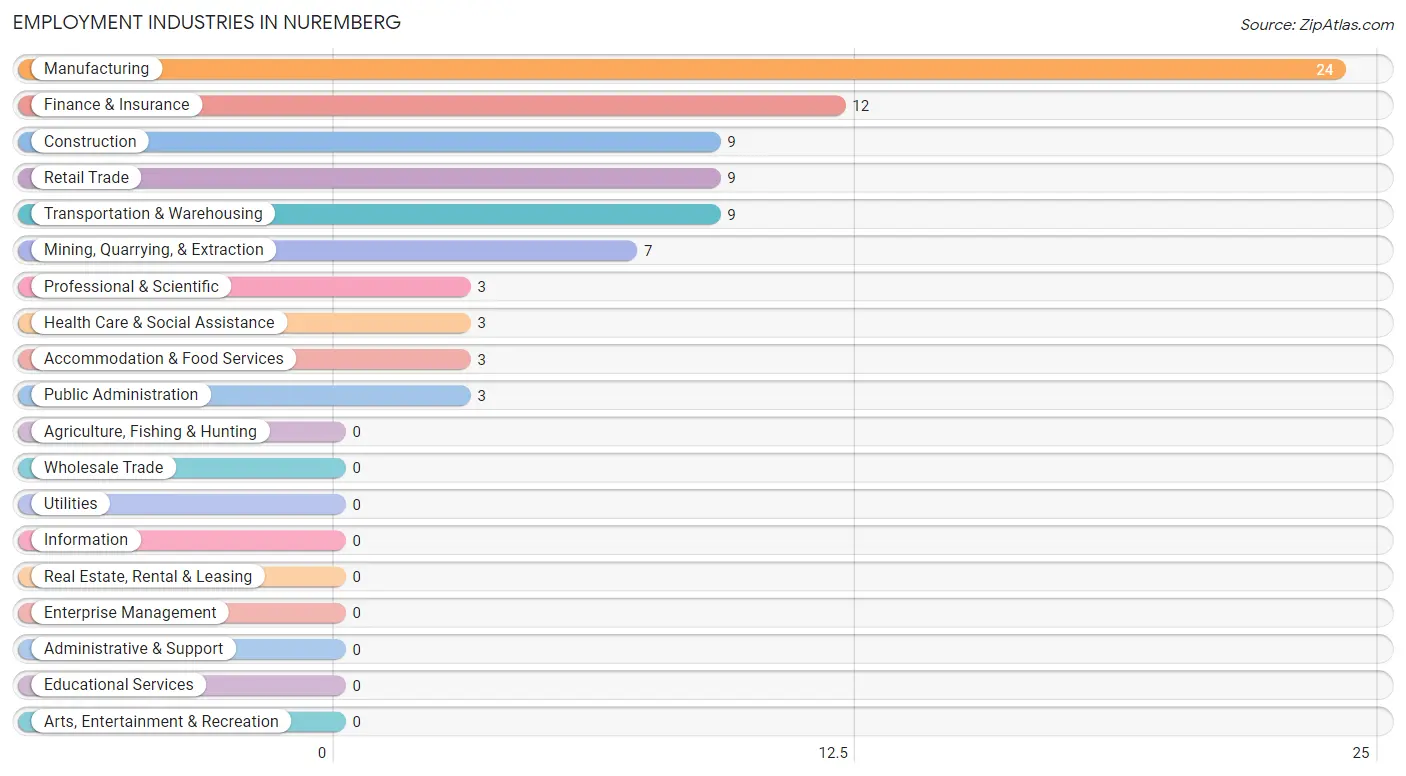
Employment Industries in Nuremberg
The major employment industries in Nuremberg include Manufacturing (24 | 24.5%), Finance & Insurance (12 | 12.2%), Construction (9 | 9.2%), Retail Trade (9 | 9.2%), and Transportation & Warehousing (9 | 9.2%).
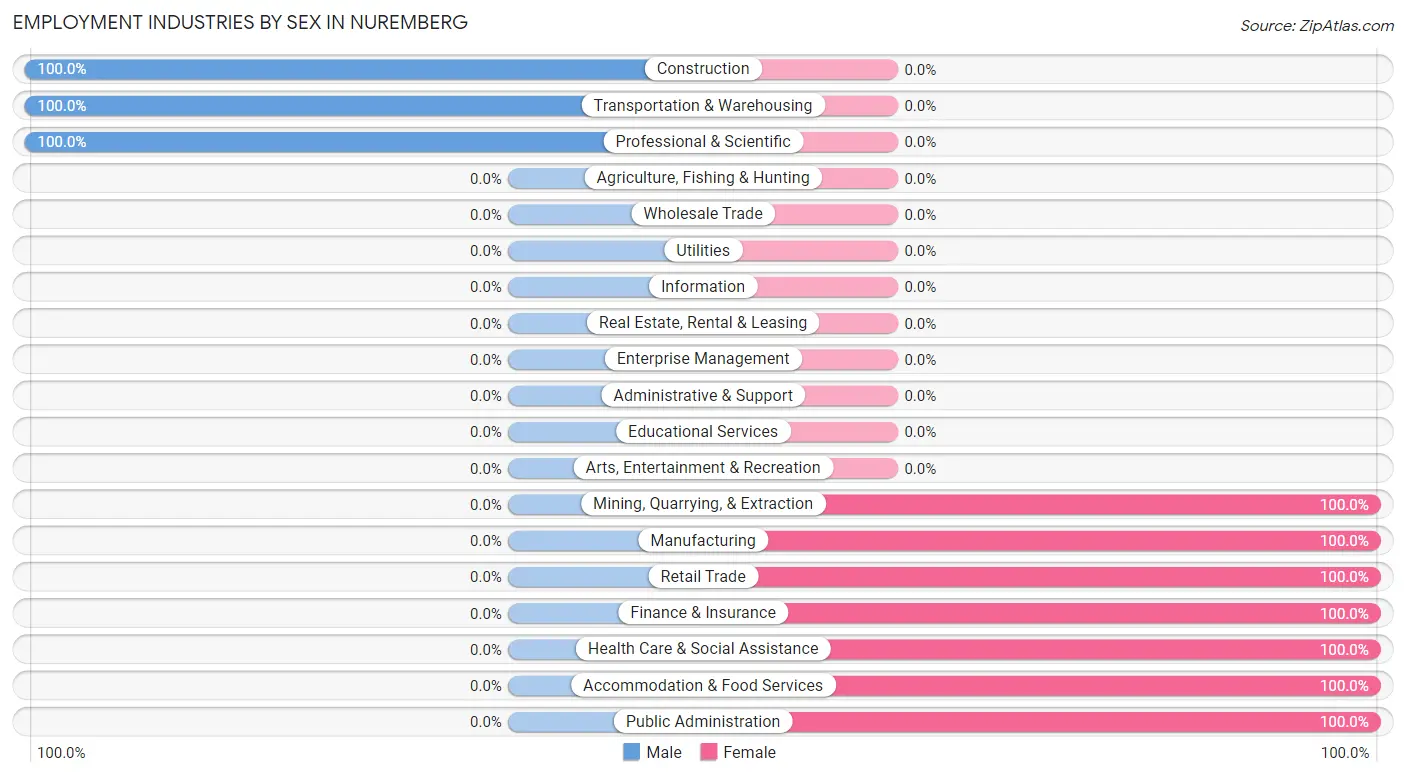
Employment Industries by Sex in Nuremberg
The Nuremberg industries that see more men than women are Construction (100.0%), Transportation & Warehousing (100.0%), and Professional & Scientific (100.0%), whereas the industries that tend to have a higher number of women are Mining, Quarrying, & Extraction (100.0%), Manufacturing (100.0%), and Retail Trade (100.0%).
| Industry | Male | Female |
| Agriculture, Fishing & Hunting | 0 (0.0%) | 0 (0.0%) |
| Mining, Quarrying, & Extraction | 0 (0.0%) | 7 (100.0%) |
| Construction | 9 (100.0%) | 0 (0.0%) |
| Manufacturing | 0 (0.0%) | 24 (100.0%) |
| Wholesale Trade | 0 (0.0%) | 0 (0.0%) |
| Retail Trade | 0 (0.0%) | 9 (100.0%) |
| Transportation & Warehousing | 9 (100.0%) | 0 (0.0%) |
| Utilities | 0 (0.0%) | 0 (0.0%) |
| Information | 0 (0.0%) | 0 (0.0%) |
| Finance & Insurance | 0 (0.0%) | 12 (100.0%) |
| Real Estate, Rental & Leasing | 0 (0.0%) | 0 (0.0%) |
| Professional & Scientific | 3 (100.0%) | 0 (0.0%) |
| Enterprise Management | 0 (0.0%) | 0 (0.0%) |
| Administrative & Support | 0 (0.0%) | 0 (0.0%) |
| Educational Services | 0 (0.0%) | 0 (0.0%) |
| Health Care & Social Assistance | 0 (0.0%) | 3 (100.0%) |
| Arts, Entertainment & Recreation | 0 (0.0%) | 0 (0.0%) |
| Accommodation & Food Services | 0 (0.0%) | 3 (100.0%) |
| Public Administration | 0 (0.0%) | 3 (100.0%) |
| Total | 21 (21.4%) | 77 (78.6%) |
Education in Nuremberg
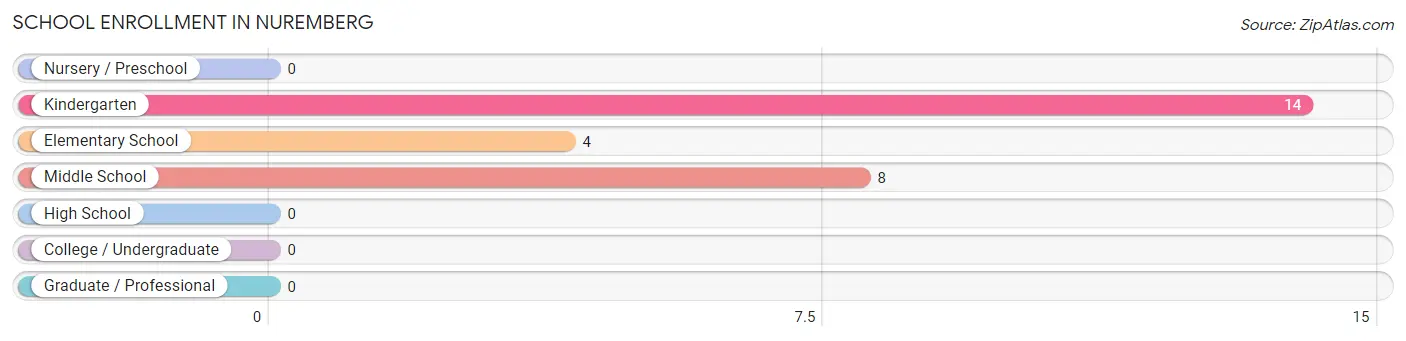
School Enrollment in Nuremberg
The most common levels of schooling among the 26 students in Nuremberg are kindergarten (14 | 53.8%), middle school (8 | 30.8%), and elementary school (4 | 15.4%).
| School Level | # Students | % Students |
| Nursery / Preschool | 0 | 0.0% |
| Kindergarten | 14 | 53.8% |
| Elementary School | 4 | 15.4% |
| Middle School | 8 | 30.8% |
| High School | 0 | 0.0% |
| College / Undergraduate | 0 | 0.0% |
| Graduate / Professional | 0 | 0.0% |
| Total | 26 | 100.0% |
School Enrollment by Age by Funding Source in Nuremberg
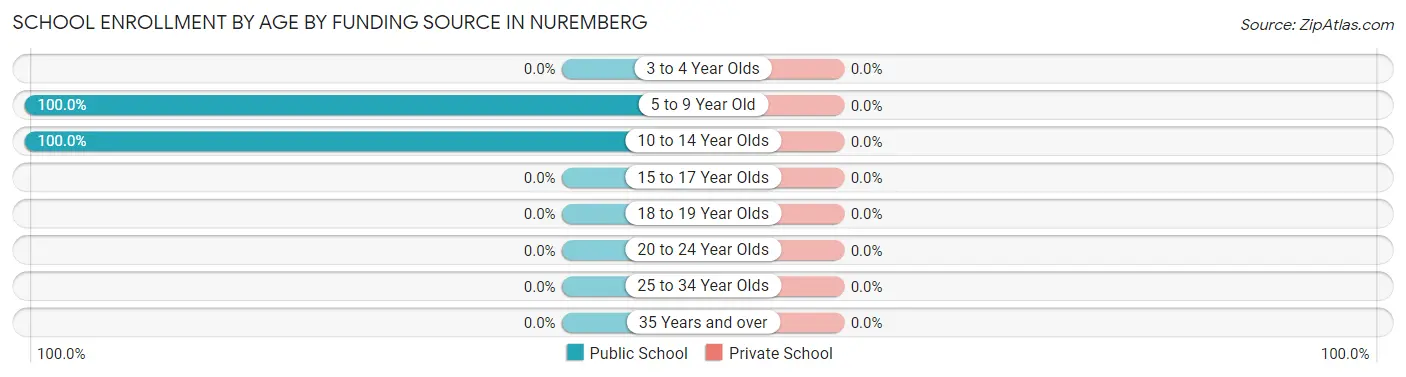
| Age Bracket | Public School | Private School |
| 3 to 4 Year Olds | 0 (0.0%) | 0 (0.0%) |
| 5 to 9 Year Old | 18 (100.0%) | 0 (0.0%) |
| 10 to 14 Year Olds | 8 (100.0%) | 0 (0.0%) |
| 15 to 17 Year Olds | 0 (0.0%) | 0 (0.0%) |
| 18 to 19 Year Olds | 0 (0.0%) | 0 (0.0%) |
| 20 to 24 Year Olds | 0 (0.0%) | 0 (0.0%) |
| 25 to 34 Year Olds | 0 (0.0%) | 0 (0.0%) |
| 35 Years and over | 0 (0.0%) | 0 (0.0%) |
| Total | 26 (100.0%) | 0 (0.0%) |
Educational Attainment by Field of Study in Nuremberg
Engineering (9 | 60.0%), education (3 | 20.0%), and visual & performing arts (3 | 20.0%) are the most common fields of study among 15 individuals in Nuremberg who have obtained a bachelor's degree or higher.
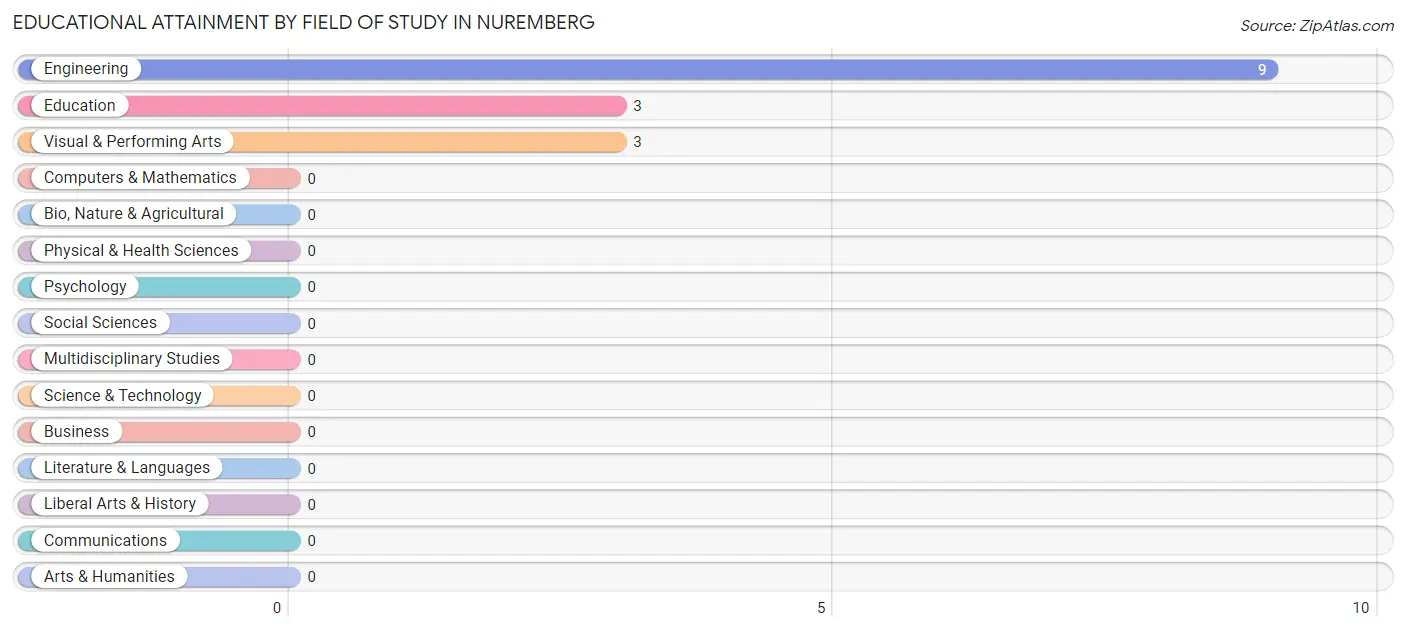
| Field of Study | # Graduates | % Graduates |
| Computers & Mathematics | 0 | 0.0% |
| Bio, Nature & Agricultural | 0 | 0.0% |
| Physical & Health Sciences | 0 | 0.0% |
| Psychology | 0 | 0.0% |
| Social Sciences | 0 | 0.0% |
| Engineering | 9 | 60.0% |
| Multidisciplinary Studies | 0 | 0.0% |
| Science & Technology | 0 | 0.0% |
| Business | 0 | 0.0% |
| Education | 3 | 20.0% |
| Literature & Languages | 0 | 0.0% |
| Liberal Arts & History | 0 | 0.0% |
| Visual & Performing Arts | 3 | 20.0% |
| Communications | 0 | 0.0% |
| Arts & Humanities | 0 | 0.0% |
| Total | 15 | 100.0% |
Transportation & Commute in Nuremberg
Vehicle Availability by Sex in Nuremberg
The most prevalent vehicle ownership categories in Nuremberg are males with 2 vehicles (12, accounting for 57.1%) and females with 2 vehicles (23, making up 17.1%).
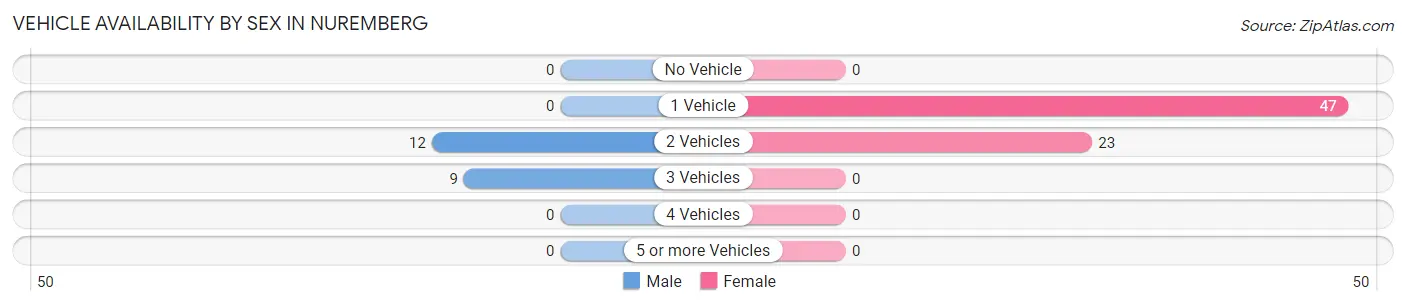
| Vehicles Available | Male | Female |
| No Vehicle | 0 (0.0%) | 0 (0.0%) |
| 1 Vehicle | 0 (0.0%) | 47 (67.1%) |
| 2 Vehicles | 12 (57.1%) | 23 (32.9%) |
| 3 Vehicles | 9 (42.9%) | 0 (0.0%) |
| 4 Vehicles | 0 (0.0%) | 0 (0.0%) |
| 5 or more Vehicles | 0 (0.0%) | 0 (0.0%) |
| Total | 21 (100.0%) | 70 (100.0%) |
Commute Time in Nuremberg
The most frequently occuring commute durations in Nuremberg are 20 to 24 minutes (33 commuters, 36.3%), 10 to 14 minutes (14 commuters, 15.4%), and 25 to 29 minutes (13 commuters, 14.3%).
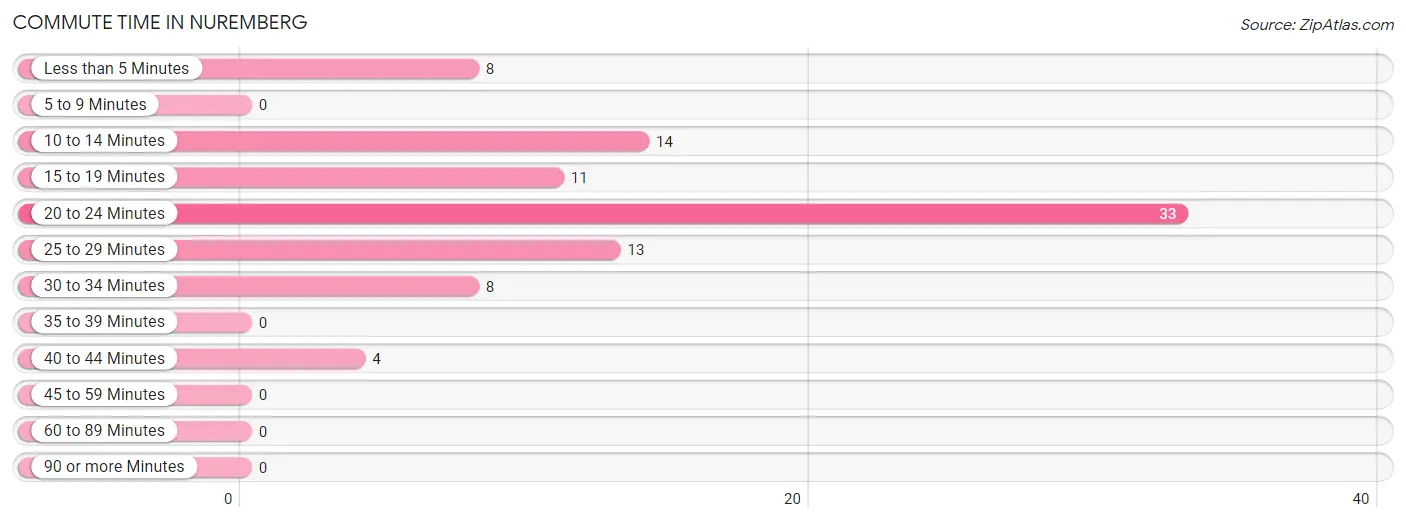
| Commute Time | # Commuters | % Commuters |
| Less than 5 Minutes | 8 | 8.8% |
| 5 to 9 Minutes | 0 | 0.0% |
| 10 to 14 Minutes | 14 | 15.4% |
| 15 to 19 Minutes | 11 | 12.1% |
| 20 to 24 Minutes | 33 | 36.3% |
| 25 to 29 Minutes | 13 | 14.3% |
| 30 to 34 Minutes | 8 | 8.8% |
| 35 to 39 Minutes | 0 | 0.0% |
| 40 to 44 Minutes | 4 | 4.4% |
| 45 to 59 Minutes | 0 | 0.0% |
| 60 to 89 Minutes | 0 | 0.0% |
| 90 or more Minutes | 0 | 0.0% |
Commute Time by Sex in Nuremberg
The most common commute times in Nuremberg are 20 to 24 minutes (9 commuters, 42.9%) for males and 20 to 24 minutes (24 commuters, 34.3%) for females.
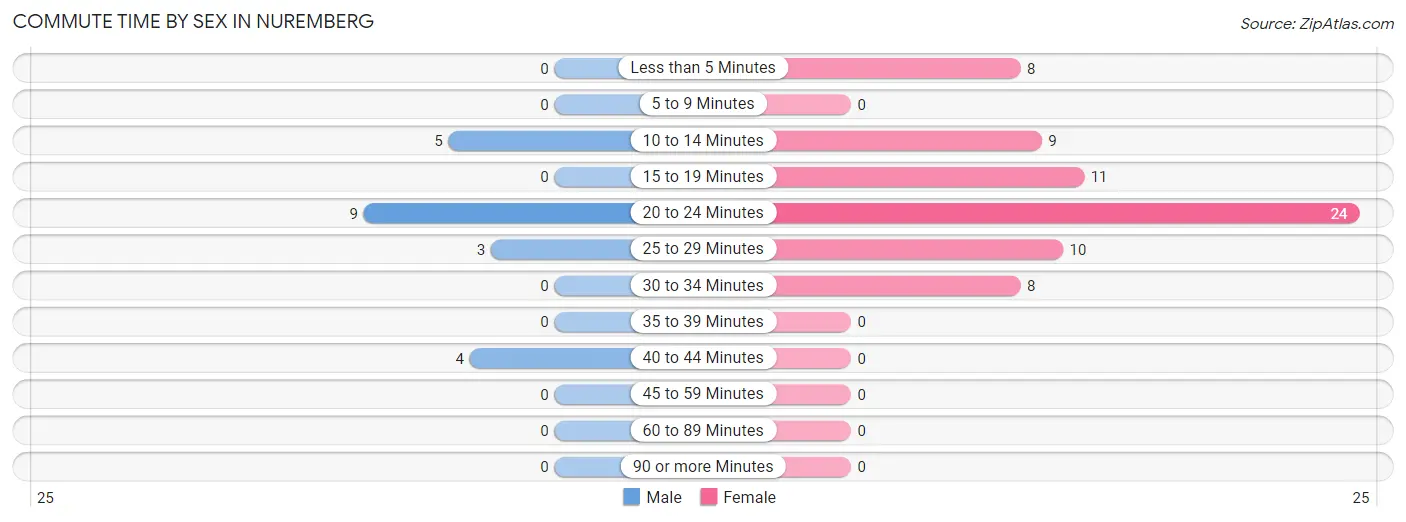
| Commute Time | Male | Female |
| Less than 5 Minutes | 0 (0.0%) | 8 (11.4%) |
| 5 to 9 Minutes | 0 (0.0%) | 0 (0.0%) |
| 10 to 14 Minutes | 5 (23.8%) | 9 (12.9%) |
| 15 to 19 Minutes | 0 (0.0%) | 11 (15.7%) |
| 20 to 24 Minutes | 9 (42.9%) | 24 (34.3%) |
| 25 to 29 Minutes | 3 (14.3%) | 10 (14.3%) |
| 30 to 34 Minutes | 0 (0.0%) | 8 (11.4%) |
| 35 to 39 Minutes | 0 (0.0%) | 0 (0.0%) |
| 40 to 44 Minutes | 4 (19.1%) | 0 (0.0%) |
| 45 to 59 Minutes | 0 (0.0%) | 0 (0.0%) |
| 60 to 89 Minutes | 0 (0.0%) | 0 (0.0%) |
| 90 or more Minutes | 0 (0.0%) | 0 (0.0%) |
Time of Departure to Work by Sex in Nuremberg
The most frequent times of departure to work in Nuremberg are 6:00 AM to 6:29 AM (9, 42.9%) for males and 7:00 AM to 7:29 AM (16, 22.9%) for females.
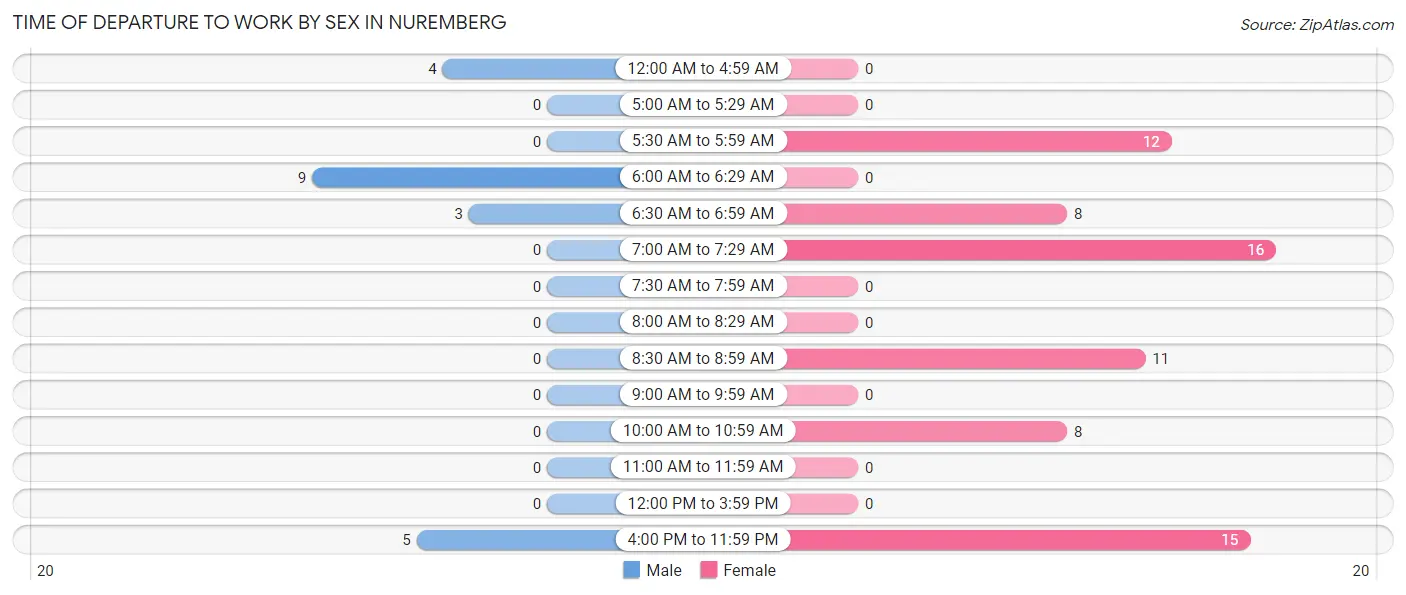
| Time of Departure | Male | Female |
| 12:00 AM to 4:59 AM | 4 (19.1%) | 0 (0.0%) |
| 5:00 AM to 5:29 AM | 0 (0.0%) | 0 (0.0%) |
| 5:30 AM to 5:59 AM | 0 (0.0%) | 12 (17.1%) |
| 6:00 AM to 6:29 AM | 9 (42.9%) | 0 (0.0%) |
| 6:30 AM to 6:59 AM | 3 (14.3%) | 8 (11.4%) |
| 7:00 AM to 7:29 AM | 0 (0.0%) | 16 (22.9%) |
| 7:30 AM to 7:59 AM | 0 (0.0%) | 0 (0.0%) |
| 8:00 AM to 8:29 AM | 0 (0.0%) | 0 (0.0%) |
| 8:30 AM to 8:59 AM | 0 (0.0%) | 11 (15.7%) |
| 9:00 AM to 9:59 AM | 0 (0.0%) | 0 (0.0%) |
| 10:00 AM to 10:59 AM | 0 (0.0%) | 8 (11.4%) |
| 11:00 AM to 11:59 AM | 0 (0.0%) | 0 (0.0%) |
| 12:00 PM to 3:59 PM | 0 (0.0%) | 0 (0.0%) |
| 4:00 PM to 11:59 PM | 5 (23.8%) | 15 (21.4%) |
| Total | 21 (100.0%) | 70 (100.0%) |
Housing Occupancy in Nuremberg
Occupancy by Ownership in Nuremberg
Of the total 152 dwellings in Nuremberg, owner-occupied units account for 108 (71.1%), while renter-occupied units make up 44 (28.9%).
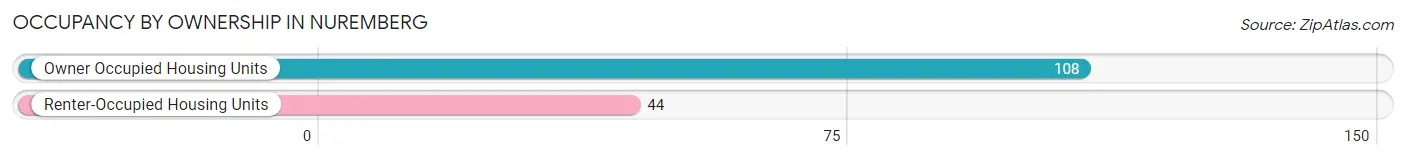
| Occupancy | # Housing Units | % Housing Units |
| Owner Occupied Housing Units | 108 | 71.1% |
| Renter-Occupied Housing Units | 44 | 28.9% |
| Total Occupied Housing Units | 152 | 100.0% |
Occupancy by Household Size in Nuremberg
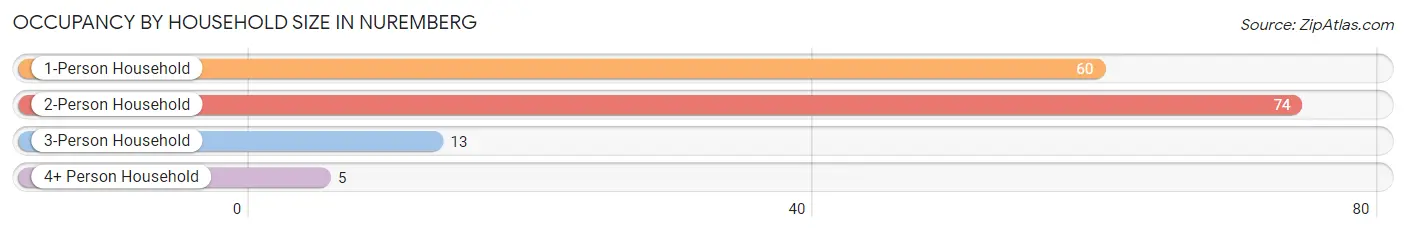
| Household Size | # Housing Units | % Housing Units |
| 1-Person Household | 60 | 39.5% |
| 2-Person Household | 74 | 48.7% |
| 3-Person Household | 13 | 8.6% |
| 4+ Person Household | 5 | 3.3% |
| Total Housing Units | 152 | 100.0% |
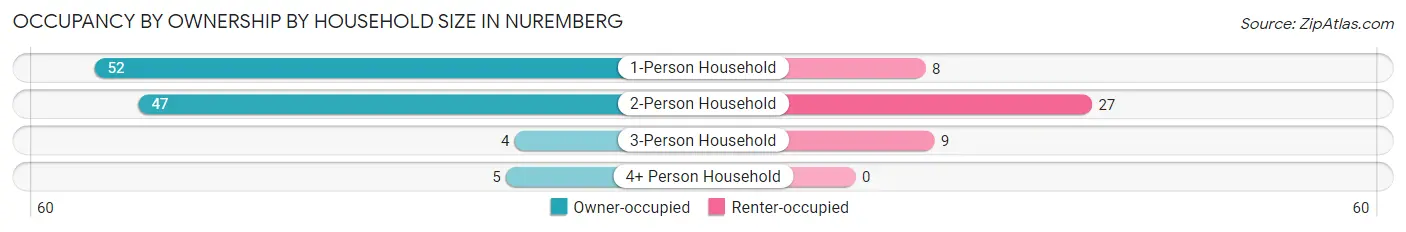
Occupancy by Ownership by Household Size in Nuremberg
| Household Size | Owner-occupied | Renter-occupied |
| 1-Person Household | 52 (86.7%) | 8 (13.3%) |
| 2-Person Household | 47 (63.5%) | 27 (36.5%) |
| 3-Person Household | 4 (30.8%) | 9 (69.2%) |
| 4+ Person Household | 5 (100.0%) | 0 (0.0%) |
| Total Housing Units | 108 (71.1%) | 44 (28.9%) |
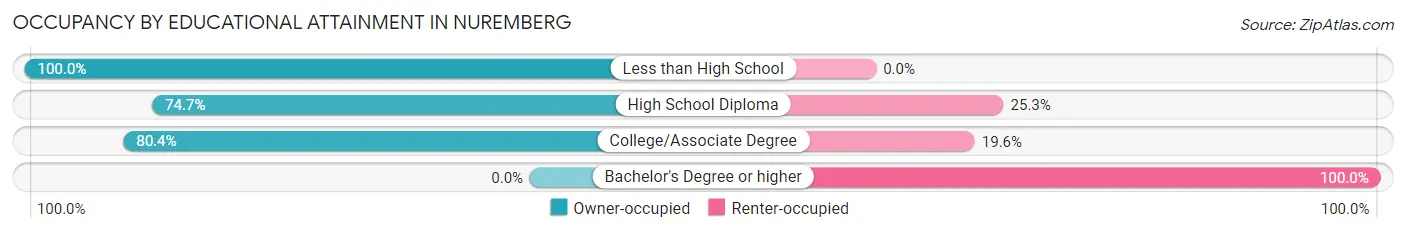
Occupancy by Educational Attainment in Nuremberg
| Household Size | Owner-occupied | Renter-occupied |
| Less than High School | 3 (100.0%) | 0 (0.0%) |
| High School Diploma | 68 (74.7%) | 23 (25.3%) |
| College/Associate Degree | 37 (80.4%) | 9 (19.6%) |
| Bachelor's Degree or higher | 0 (0.0%) | 12 (100.0%) |
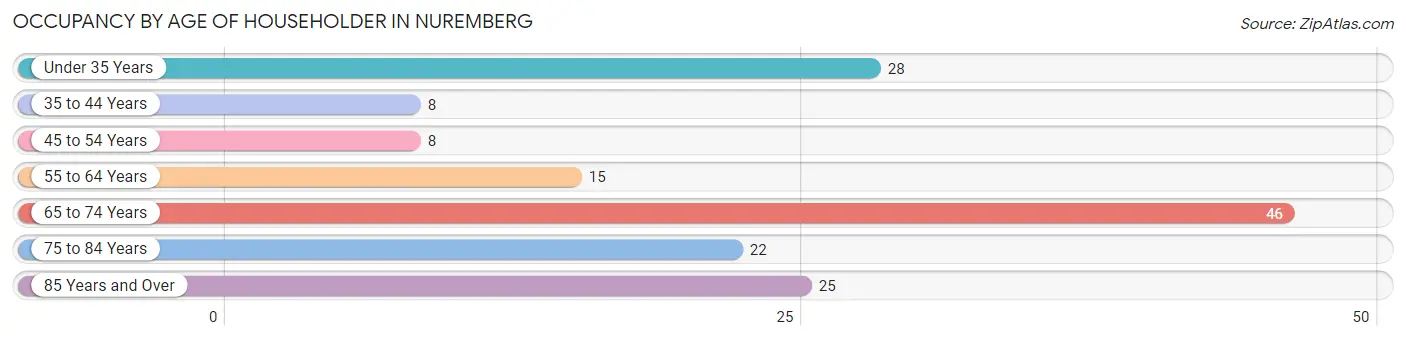
Occupancy by Age of Householder in Nuremberg
| Age Bracket | # Households | % Households |
| Under 35 Years | 28 | 18.4% |
| 35 to 44 Years | 8 | 5.3% |
| 45 to 54 Years | 8 | 5.3% |
| 55 to 64 Years | 15 | 9.9% |
| 65 to 74 Years | 46 | 30.3% |
| 75 to 84 Years | 22 | 14.5% |
| 85 Years and Over | 25 | 16.5% |
| Total | 152 | 100.0% |
Housing Finances in Nuremberg
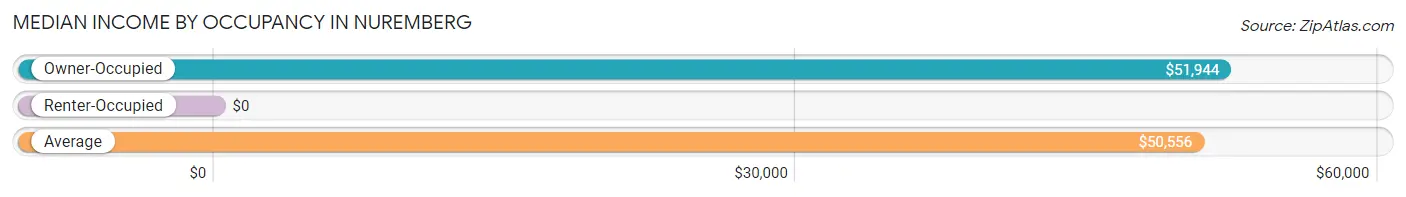
Median Income by Occupancy in Nuremberg
| Occupancy Type | # Households | Median Income |
| Owner-Occupied | 108 (71.1%) | $51,944 |
| Renter-Occupied | 44 (28.9%) | $0 |
| Average | 152 (100.0%) | $50,556 |
Occupancy by Householder Income Bracket in Nuremberg
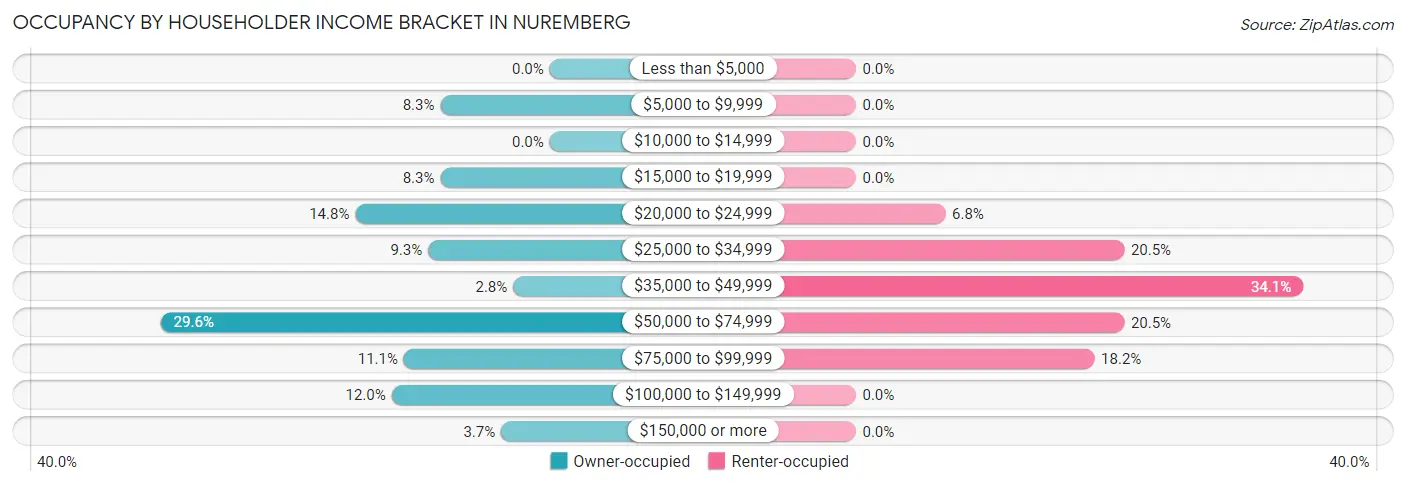
| Income Bracket | Owner-occupied | Renter-occupied |
| Less than $5,000 | 0 (0.0%) | 0 (0.0%) |
| $5,000 to $9,999 | 9 (8.3%) | 0 (0.0%) |
| $10,000 to $14,999 | 0 (0.0%) | 0 (0.0%) |
| $15,000 to $19,999 | 9 (8.3%) | 0 (0.0%) |
| $20,000 to $24,999 | 16 (14.8%) | 3 (6.8%) |
| $25,000 to $34,999 | 10 (9.3%) | 9 (20.4%) |
| $35,000 to $49,999 | 3 (2.8%) | 15 (34.1%) |
| $50,000 to $74,999 | 32 (29.6%) | 9 (20.4%) |
| $75,000 to $99,999 | 12 (11.1%) | 8 (18.2%) |
| $100,000 to $149,999 | 13 (12.0%) | 0 (0.0%) |
| $150,000 or more | 4 (3.7%) | 0 (0.0%) |
| Total | 108 (100.0%) | 44 (100.0%) |
Monthly Housing Cost Tiers in Nuremberg
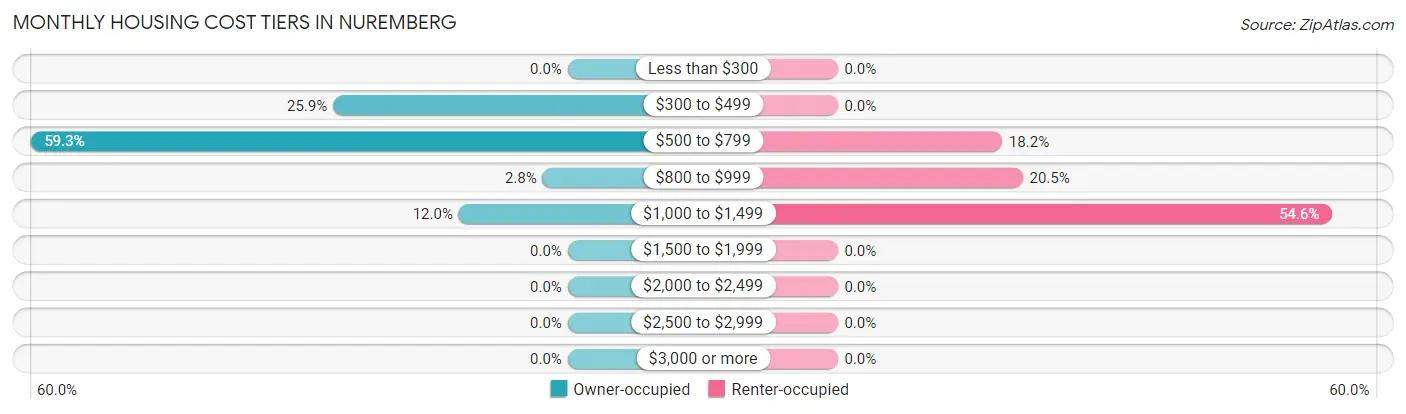
| Monthly Cost | Owner-occupied | Renter-occupied |
| Less than $300 | 0 (0.0%) | 0 (0.0%) |
| $300 to $499 | 28 (25.9%) | 0 (0.0%) |
| $500 to $799 | 64 (59.3%) | 8 (18.2%) |
| $800 to $999 | 3 (2.8%) | 9 (20.4%) |
| $1,000 to $1,499 | 13 (12.0%) | 24 (54.5%) |
| $1,500 to $1,999 | 0 (0.0%) | 0 (0.0%) |
| $2,000 to $2,499 | 0 (0.0%) | 0 (0.0%) |
| $2,500 to $2,999 | 0 (0.0%) | 0 (0.0%) |
| $3,000 or more | 0 (0.0%) | 0 (0.0%) |
| Total | 108 (100.0%) | 44 (100.0%) |
Physical Housing Characteristics in Nuremberg
Housing Structures in Nuremberg
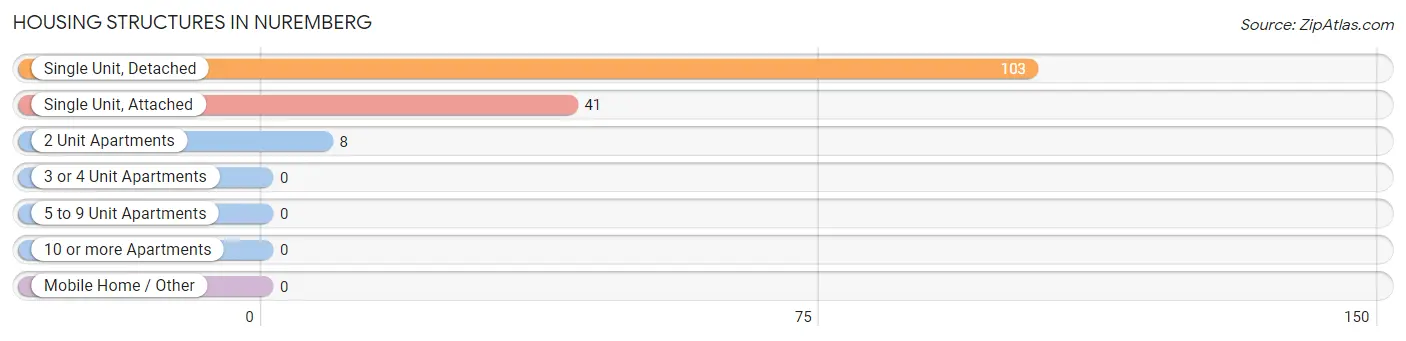
| Structure Type | # Housing Units | % Housing Units |
| Single Unit, Detached | 103 | 67.8% |
| Single Unit, Attached | 41 | 27.0% |
| 2 Unit Apartments | 8 | 5.3% |
| 3 or 4 Unit Apartments | 0 | 0.0% |
| 5 to 9 Unit Apartments | 0 | 0.0% |
| 10 or more Apartments | 0 | 0.0% |
| Mobile Home / Other | 0 | 0.0% |
| Total | 152 | 100.0% |
Housing Structures by Occupancy in Nuremberg
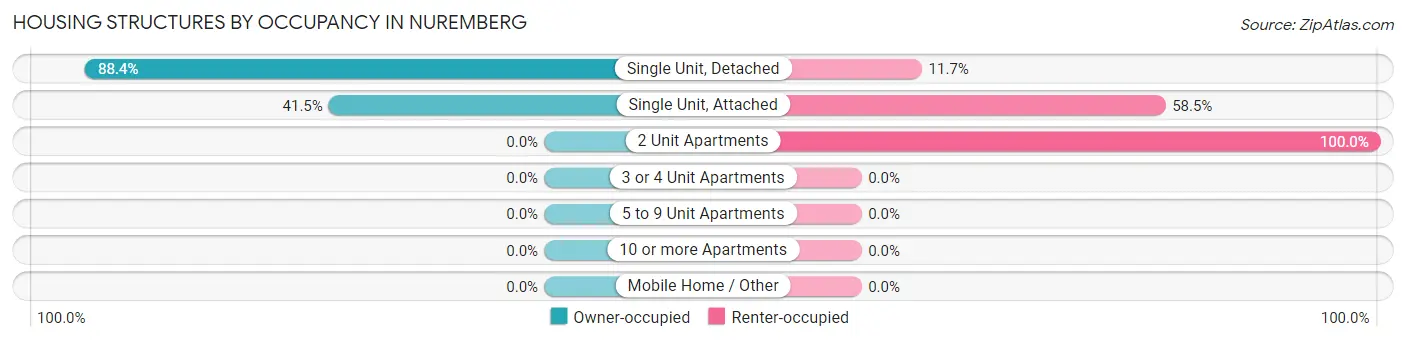
| Structure Type | Owner-occupied | Renter-occupied |
| Single Unit, Detached | 91 (88.3%) | 12 (11.7%) |
| Single Unit, Attached | 17 (41.5%) | 24 (58.5%) |
| 2 Unit Apartments | 0 (0.0%) | 8 (100.0%) |
| 3 or 4 Unit Apartments | 0 (0.0%) | 0 (0.0%) |
| 5 to 9 Unit Apartments | 0 (0.0%) | 0 (0.0%) |
| 10 or more Apartments | 0 (0.0%) | 0 (0.0%) |
| Mobile Home / Other | 0 (0.0%) | 0 (0.0%) |
| Total | 108 (71.1%) | 44 (28.9%) |
Housing Structures by Number of Rooms in Nuremberg
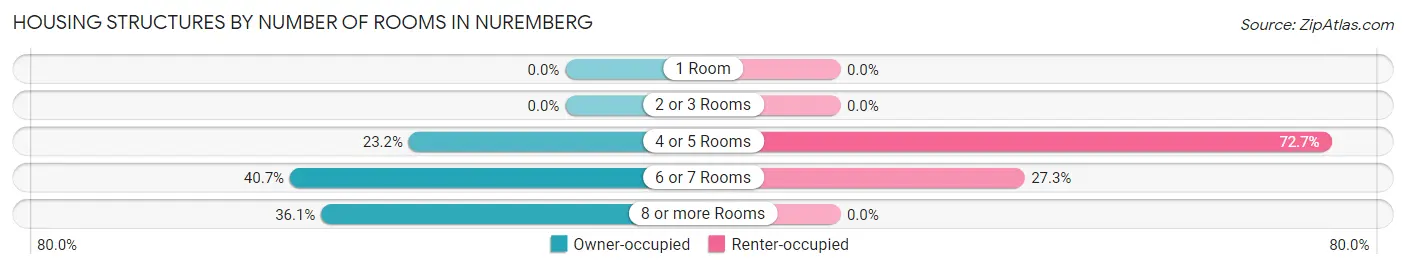
| Number of Rooms | Owner-occupied | Renter-occupied |
| 1 Room | 0 (0.0%) | 0 (0.0%) |
| 2 or 3 Rooms | 0 (0.0%) | 0 (0.0%) |
| 4 or 5 Rooms | 25 (23.2%) | 32 (72.7%) |
| 6 or 7 Rooms | 44 (40.7%) | 12 (27.3%) |
| 8 or more Rooms | 39 (36.1%) | 0 (0.0%) |
| Total | 108 (100.0%) | 44 (100.0%) |
Housing Structure by Heating Type in Nuremberg
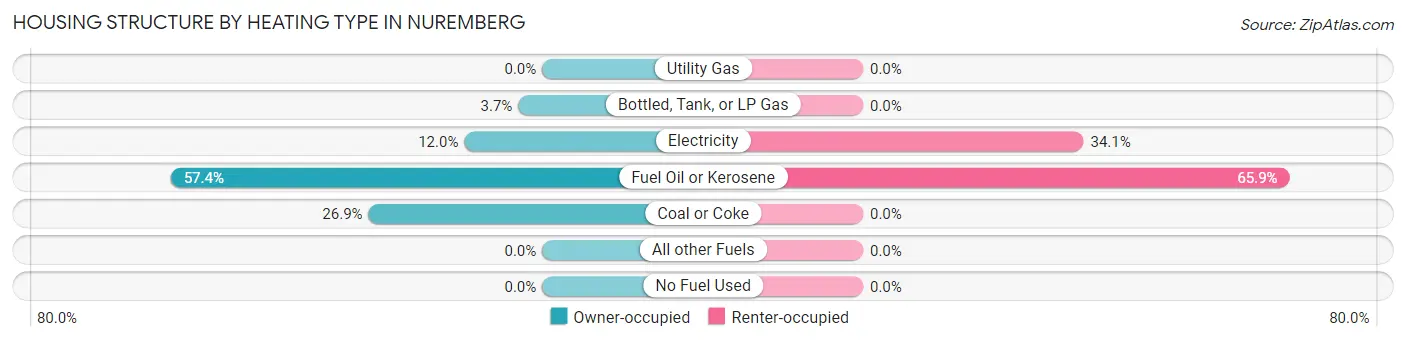
| Heating Type | Owner-occupied | Renter-occupied |
| Utility Gas | 0 (0.0%) | 0 (0.0%) |
| Bottled, Tank, or LP Gas | 4 (3.7%) | 0 (0.0%) |
| Electricity | 13 (12.0%) | 15 (34.1%) |
| Fuel Oil or Kerosene | 62 (57.4%) | 29 (65.9%) |
| Coal or Coke | 29 (26.9%) | 0 (0.0%) |
| All other Fuels | 0 (0.0%) | 0 (0.0%) |
| No Fuel Used | 0 (0.0%) | 0 (0.0%) |
| Total | 108 (100.0%) | 44 (100.0%) |
Household Vehicle Usage in Nuremberg
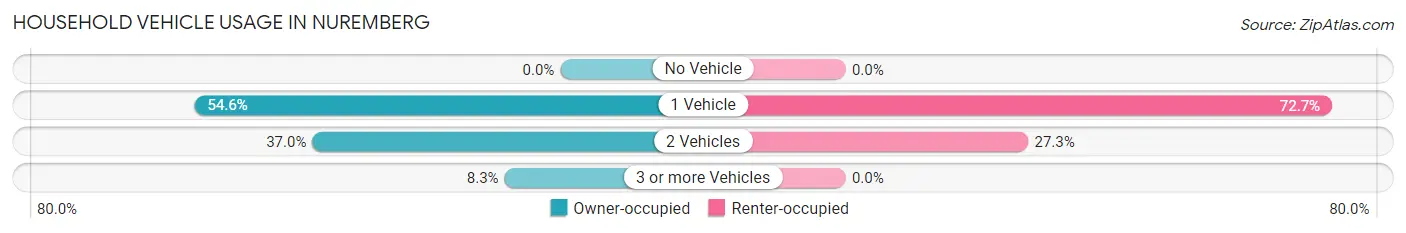
| Vehicles per Household | Owner-occupied | Renter-occupied |
| No Vehicle | 0 (0.0%) | 0 (0.0%) |
| 1 Vehicle | 59 (54.6%) | 32 (72.7%) |
| 2 Vehicles | 40 (37.0%) | 12 (27.3%) |
| 3 or more Vehicles | 9 (8.3%) | 0 (0.0%) |
| Total | 108 (100.0%) | 44 (100.0%) |
Real Estate & Mortgages in Nuremberg
Real Estate and Mortgage Overview in Nuremberg
| Characteristic | Without Mortgage | With Mortgage |
| Housing Units | 80 | 28 |
| Median Property Value | $87,600 | $146,200 |
| Median Household Income | - | - |
| Monthly Housing Costs | $532 | $0 |
| Real Estate Taxes | $1,129 | $0 |
Property Value by Mortgage Status in Nuremberg
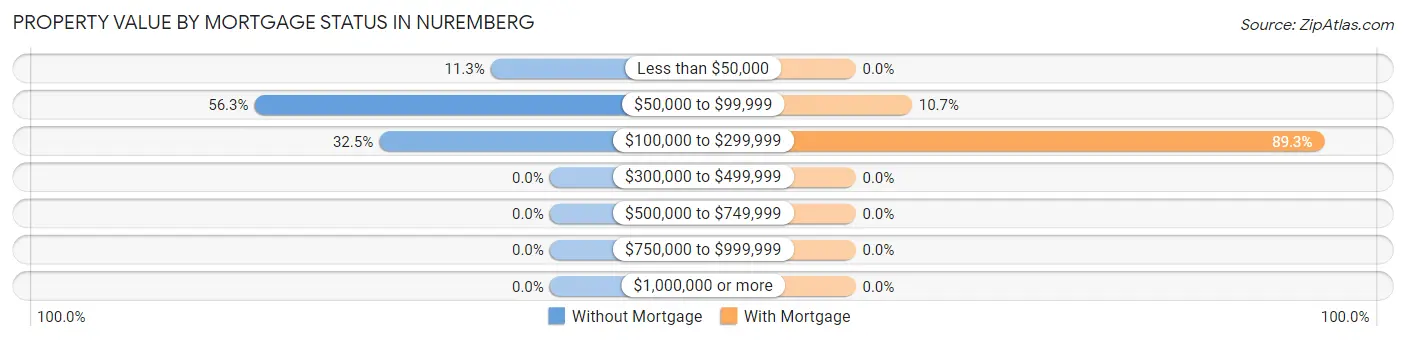
| Property Value | Without Mortgage | With Mortgage |
| Less than $50,000 | 9 (11.3%) | 0 (0.0%) |
| $50,000 to $99,999 | 45 (56.2%) | 3 (10.7%) |
| $100,000 to $299,999 | 26 (32.5%) | 25 (89.3%) |
| $300,000 to $499,999 | 0 (0.0%) | 0 (0.0%) |
| $500,000 to $749,999 | 0 (0.0%) | 0 (0.0%) |
| $750,000 to $999,999 | 0 (0.0%) | 0 (0.0%) |
| $1,000,000 or more | 0 (0.0%) | 0 (0.0%) |
| Total | 80 (100.0%) | 28 (100.0%) |
Household Income by Mortgage Status in Nuremberg
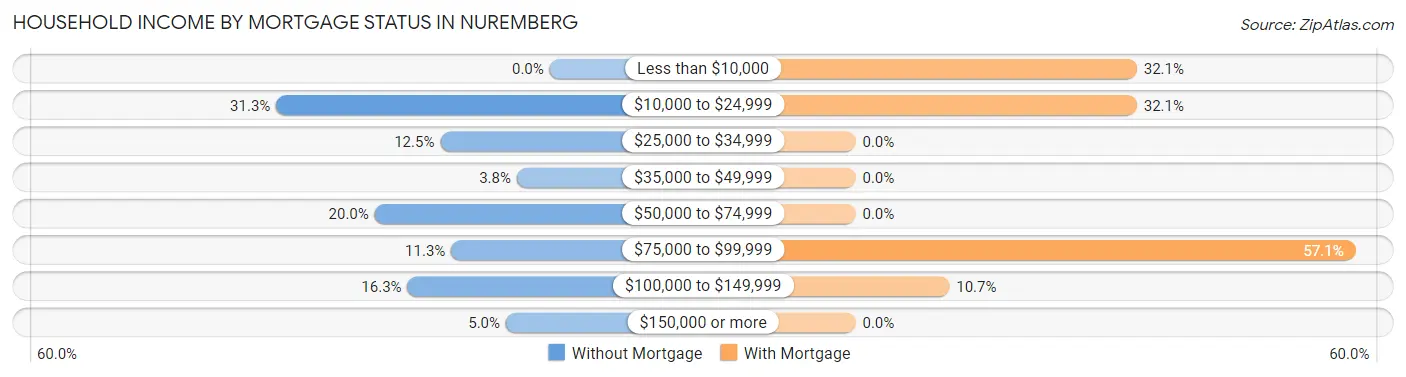
| Household Income | Without Mortgage | With Mortgage |
| Less than $10,000 | 0 (0.0%) | 9 (32.1%) |
| $10,000 to $24,999 | 25 (31.2%) | 9 (32.1%) |
| $25,000 to $34,999 | 10 (12.5%) | 0 (0.0%) |
| $35,000 to $49,999 | 3 (3.7%) | 0 (0.0%) |
| $50,000 to $74,999 | 16 (20.0%) | 0 (0.0%) |
| $75,000 to $99,999 | 9 (11.3%) | 16 (57.1%) |
| $100,000 to $149,999 | 13 (16.3%) | 3 (10.7%) |
| $150,000 or more | 4 (5.0%) | 0 (0.0%) |
| Total | 80 (100.0%) | 28 (100.0%) |
Property Value to Household Income Ratio in Nuremberg
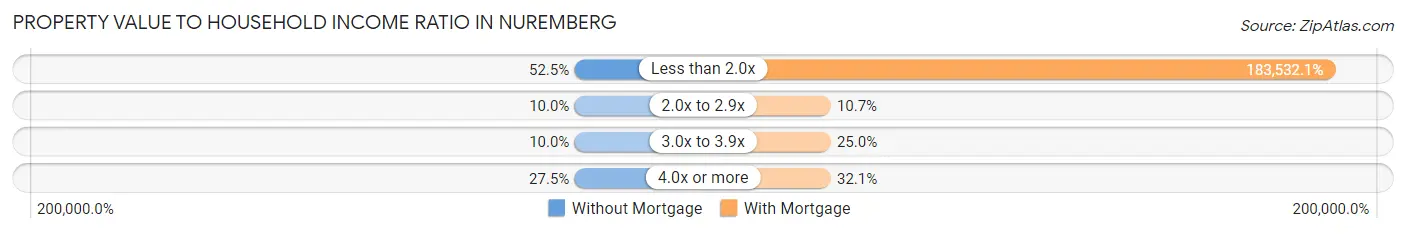
| Value-to-Income Ratio | Without Mortgage | With Mortgage |
| Less than 2.0x | 42 (52.5%) | 51,389 (183,532.1%) |
| 2.0x to 2.9x | 8 (10.0%) | 3 (10.7%) |
| 3.0x to 3.9x | 8 (10.0%) | 7 (25.0%) |
| 4.0x or more | 22 (27.5%) | 9 (32.1%) |
| Total | 80 (100.0%) | 28 (100.0%) |
Real Estate Taxes by Mortgage Status in Nuremberg
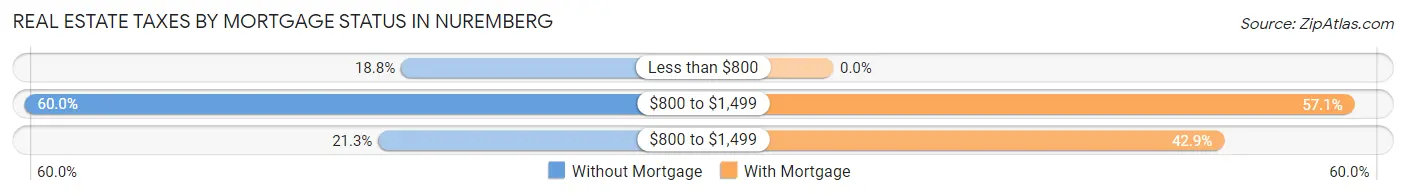
| Property Taxes | Without Mortgage | With Mortgage |
| Less than $800 | 15 (18.8%) | 0 (0.0%) |
| $800 to $1,499 | 48 (60.0%) | 16 (57.1%) |
| $800 to $1,499 | 17 (21.2%) | 12 (42.9%) |
| Total | 80 (100.0%) | 28 (100.0%) |
Health & Disability in Nuremberg
Health Insurance Coverage by Age in Nuremberg
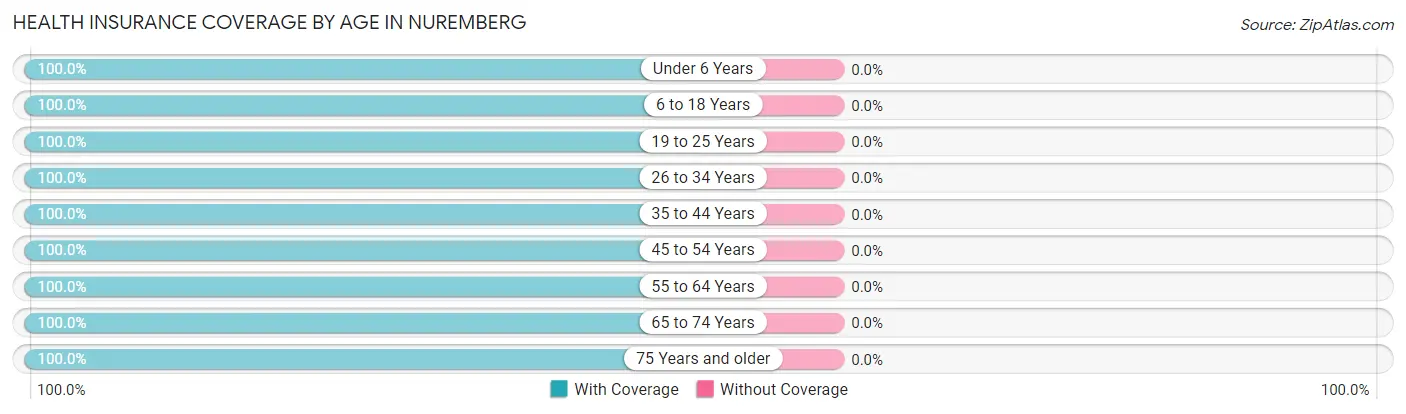
| Age Bracket | With Coverage | Without Coverage |
| Under 6 Years | 24 (100.0%) | 0 (0.0%) |
| 6 to 18 Years | 12 (100.0%) | 0 (0.0%) |
| 19 to 25 Years | 15 (100.0%) | 0 (0.0%) |
| 26 to 34 Years | 13 (100.0%) | 0 (0.0%) |
| 35 to 44 Years | 22 (100.0%) | 0 (0.0%) |
| 45 to 54 Years | 15 (100.0%) | 0 (0.0%) |
| 55 to 64 Years | 43 (100.0%) | 0 (0.0%) |
| 65 to 74 Years | 66 (100.0%) | 0 (0.0%) |
| 75 Years and older | 58 (100.0%) | 0 (0.0%) |
| Total | 268 (100.0%) | 0 (0.0%) |
Health Insurance Coverage by Citizenship Status in Nuremberg
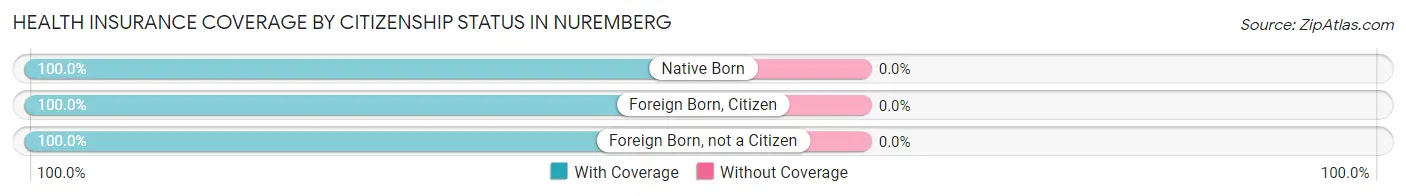
| Citizenship Status | With Coverage | Without Coverage |
| Native Born | 24 (100.0%) | 0 (0.0%) |
| Foreign Born, Citizen | 12 (100.0%) | 0 (0.0%) |
| Foreign Born, not a Citizen | 15 (100.0%) | 0 (0.0%) |
Health Insurance Coverage by Household Income in Nuremberg
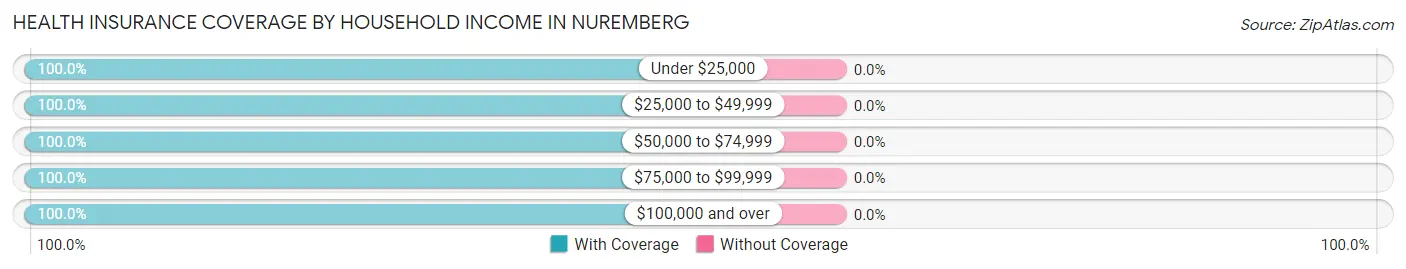
| Household Income | With Coverage | Without Coverage |
| Under $25,000 | 49 (100.0%) | 0 (0.0%) |
| $25,000 to $49,999 | 64 (100.0%) | 0 (0.0%) |
| $50,000 to $74,999 | 75 (100.0%) | 0 (0.0%) |
| $75,000 to $99,999 | 32 (100.0%) | 0 (0.0%) |
| $100,000 and over | 48 (100.0%) | 0 (0.0%) |
Public vs Private Health Insurance Coverage by Age in Nuremberg
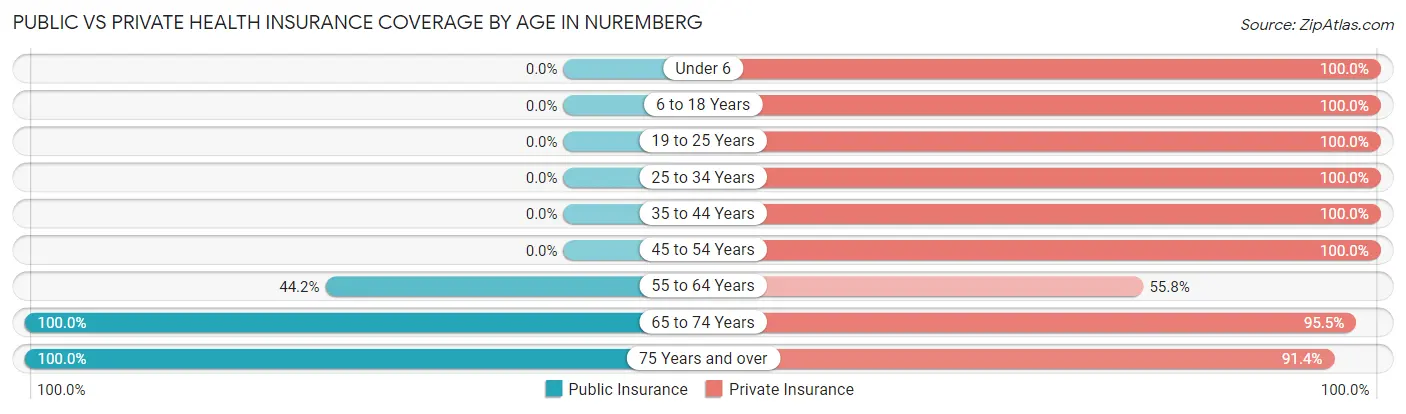
| Age Bracket | Public Insurance | Private Insurance |
| Under 6 | 0 (0.0%) | 24 (100.0%) |
| 6 to 18 Years | 0 (0.0%) | 12 (100.0%) |
| 19 to 25 Years | 0 (0.0%) | 15 (100.0%) |
| 25 to 34 Years | 0 (0.0%) | 13 (100.0%) |
| 35 to 44 Years | 0 (0.0%) | 22 (100.0%) |
| 45 to 54 Years | 0 (0.0%) | 15 (100.0%) |
| 55 to 64 Years | 19 (44.2%) | 24 (55.8%) |
| 65 to 74 Years | 66 (100.0%) | 63 (95.5%) |
| 75 Years and over | 58 (100.0%) | 53 (91.4%) |
| Total | 143 (53.4%) | 241 (89.9%) |
Disability Status by Sex by Age in Nuremberg
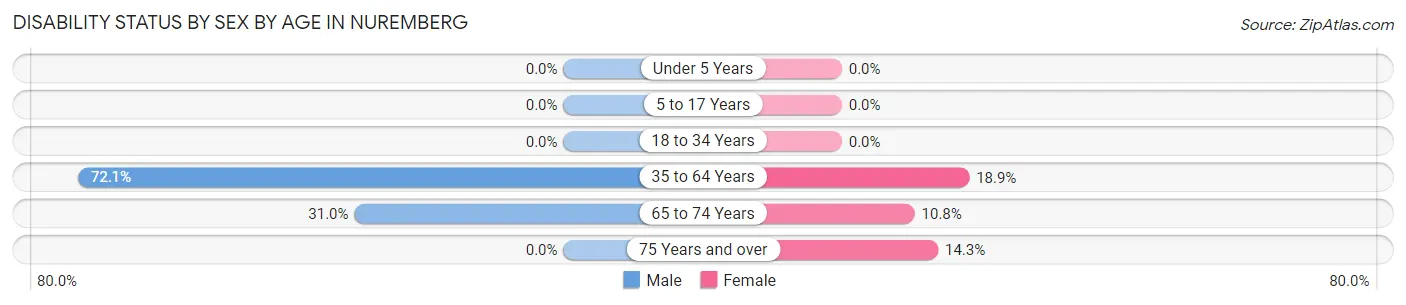
| Age Bracket | Male | Female |
| Under 5 Years | 0 (0.0%) | 0 (0.0%) |
| 5 to 17 Years | 0 (0.0%) | 0 (0.0%) |
| 18 to 34 Years | 0 (0.0%) | 0 (0.0%) |
| 35 to 64 Years | 31 (72.1%) | 7 (18.9%) |
| 65 to 74 Years | 9 (31.0%) | 4 (10.8%) |
| 75 Years and over | 0 (0.0%) | 8 (14.3%) |
Disability Class by Sex by Age in Nuremberg
Disability Class: Hearing Difficulty
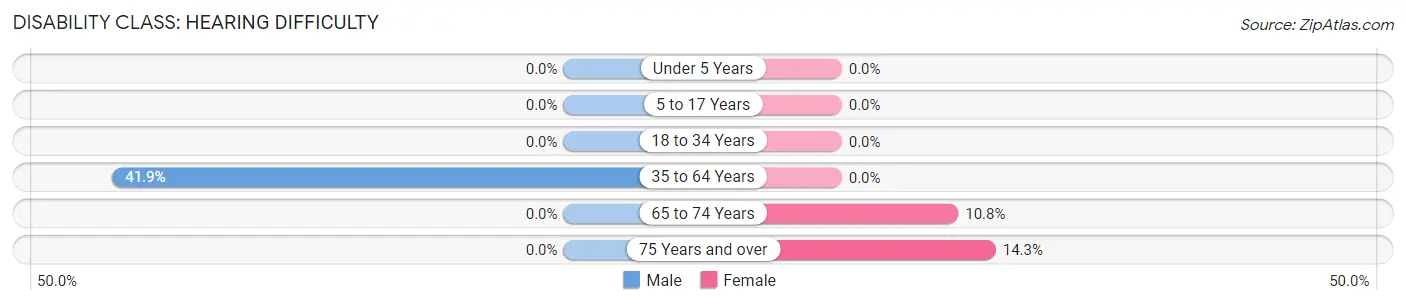
| Age Bracket | Male | Female |
| Under 5 Years | 0 (0.0%) | 0 (0.0%) |
| 5 to 17 Years | 0 (0.0%) | 0 (0.0%) |
| 18 to 34 Years | 0 (0.0%) | 0 (0.0%) |
| 35 to 64 Years | 18 (41.9%) | 0 (0.0%) |
| 65 to 74 Years | 0 (0.0%) | 4 (10.8%) |
| 75 Years and over | 0 (0.0%) | 8 (14.3%) |
Disability Class: Vision Difficulty
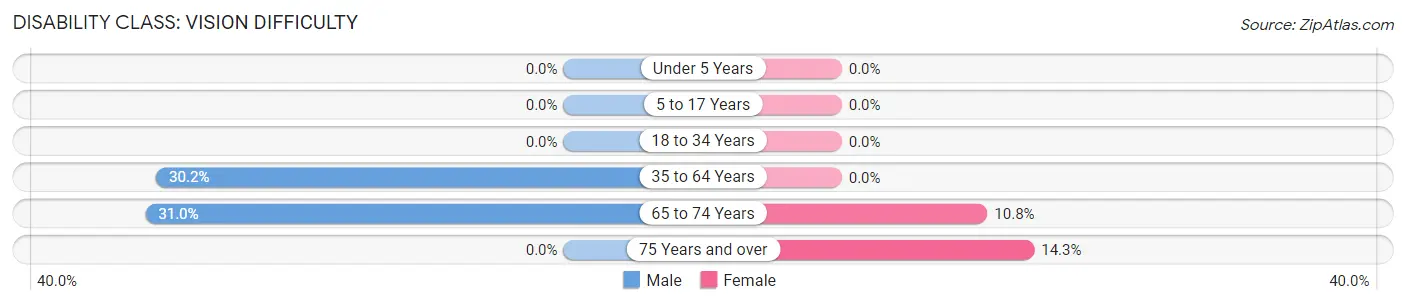
| Age Bracket | Male | Female |
| Under 5 Years | 0 (0.0%) | 0 (0.0%) |
| 5 to 17 Years | 0 (0.0%) | 0 (0.0%) |
| 18 to 34 Years | 0 (0.0%) | 0 (0.0%) |
| 35 to 64 Years | 13 (30.2%) | 0 (0.0%) |
| 65 to 74 Years | 9 (31.0%) | 4 (10.8%) |
| 75 Years and over | 0 (0.0%) | 8 (14.3%) |
Disability Class: Cognitive Difficulty
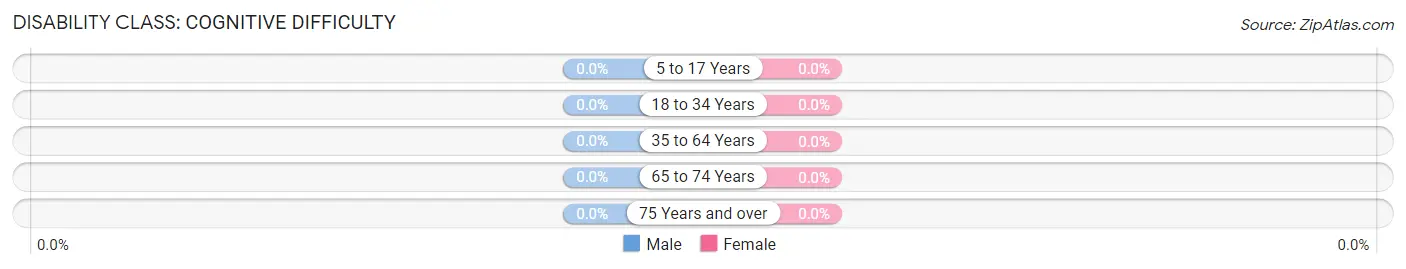
| Age Bracket | Male | Female |
| 5 to 17 Years | 0 (0.0%) | 0 (0.0%) |
| 18 to 34 Years | 0 (0.0%) | 0 (0.0%) |
| 35 to 64 Years | 0 (0.0%) | 0 (0.0%) |
| 65 to 74 Years | 0 (0.0%) | 0 (0.0%) |
| 75 Years and over | 0 (0.0%) | 0 (0.0%) |
Disability Class: Ambulatory Difficulty
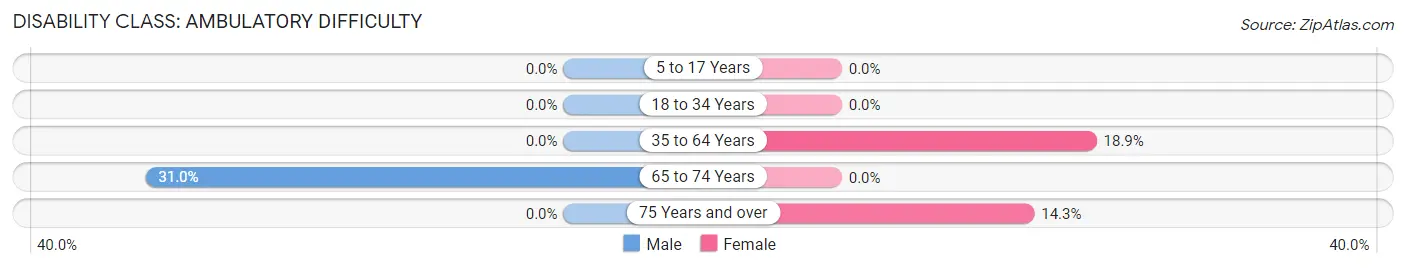
| Age Bracket | Male | Female |
| 5 to 17 Years | 0 (0.0%) | 0 (0.0%) |
| 18 to 34 Years | 0 (0.0%) | 0 (0.0%) |
| 35 to 64 Years | 0 (0.0%) | 7 (18.9%) |
| 65 to 74 Years | 9 (31.0%) | 0 (0.0%) |
| 75 Years and over | 0 (0.0%) | 8 (14.3%) |
Disability Class: Self-Care Difficulty
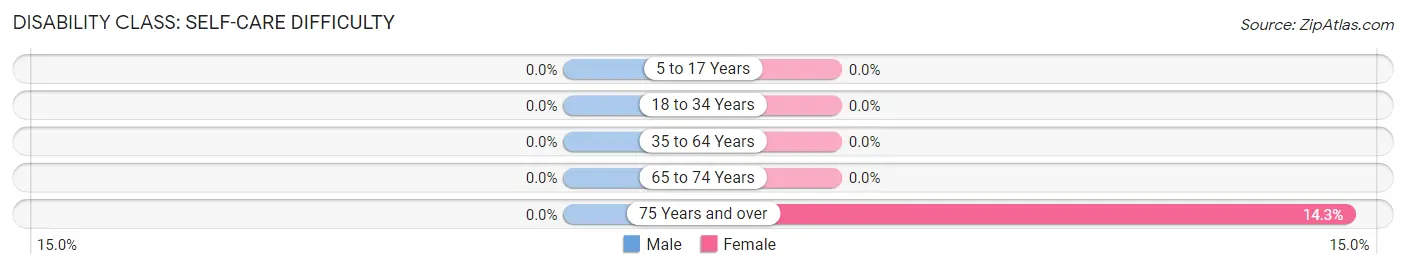
| Age Bracket | Male | Female |
| 5 to 17 Years | 0 (0.0%) | 0 (0.0%) |
| 18 to 34 Years | 0 (0.0%) | 0 (0.0%) |
| 35 to 64 Years | 0 (0.0%) | 0 (0.0%) |
| 65 to 74 Years | 0 (0.0%) | 0 (0.0%) |
| 75 Years and over | 0 (0.0%) | 8 (14.3%) |
Technology Access in Nuremberg
Computing Device Access in Nuremberg
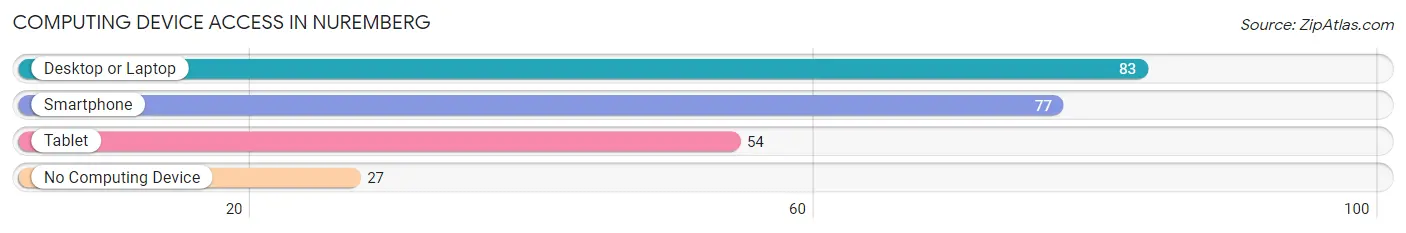
| Device Type | # Households | % Households |
| Desktop or Laptop | 83 | 54.6% |
| Smartphone | 77 | 50.7% |
| Tablet | 54 | 35.5% |
| No Computing Device | 27 | 17.8% |
| Total | 152 | 100.0% |
Internet Access in Nuremberg
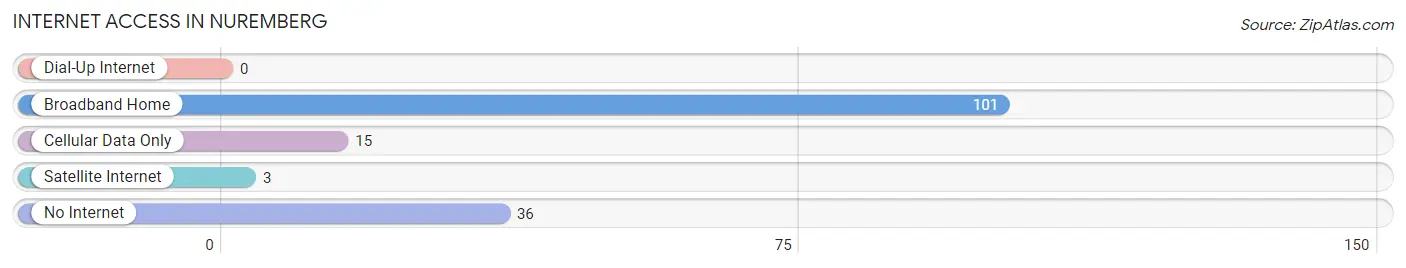
| Internet Type | # Households | % Households |
| Dial-Up Internet | 0 | 0.0% |
| Broadband Home | 101 | 66.4% |
| Cellular Data Only | 15 | 9.9% |
| Satellite Internet | 3 | 2.0% |
| No Internet | 36 | 23.7% |
| Total | 152 | 100.0% |
Nuremberg Summary
Nuremberg is a borough located in Schuylkill County, Pennsylvania, United States. The population was 1,845 at the 2010 census. It is part of the Pottsville, PA Micropolitan Statistical Area.
History
Nuremberg was founded in 1845 by German immigrants who named it after the city of Nuremberg in Bavaria, Germany. The first settlers were mostly farmers and miners. The first post office was established in 1848. The first school was built in 1851. The first church was built in 1853.
The borough was incorporated in 1872. In the late 19th century, Nuremberg was a thriving coal mining town. The coal industry declined in the early 20th century, and the population of the borough decreased.
Geography
Nuremberg is located at 40°45'7" North, 76°14'17" West (40.7519, -76.2380). According to the United States Census Bureau, the borough has a total area of 0.7 square miles (1.8 km2), all of it land.
Demographics
As of the census of 2000, there were 1,845 people, 745 households, and 517 families residing in the borough. The population density was 2,619.3 people per square mile (1,011.2/km2). There were 809 housing units at an average density of 1,142.3 per square mile (440.2/km2). The racial makeup of the borough was 98.45% White, 0.11% African American, 0.05% Native American, 0.05% Asian, 0.05% Pacific Islander, 0.60% from other races, and 0.69% from two or more races. Hispanic or Latino of any race were 0.71% of the population.
Economy
Nuremberg’s economy is largely based on agriculture and tourism. The borough is home to several farms, including dairy farms, vegetable farms, and fruit farms. The borough also has several small businesses, including restaurants, shops, and services.
Tourism is an important part of the local economy. The borough is home to several attractions, including the Nuremberg Historical Society Museum, the Nuremberg Community Park, and the Nuremberg Zoo. The borough also hosts several annual events, such as the Nuremberg Fall Festival and the Nuremberg Christmas Parade.
The borough is also home to several manufacturing companies, including a paper mill and a metal fabrication plant.
Conclusion
Nuremberg is a borough located in Schuylkill County, Pennsylvania. It was founded in 1845 by German immigrants and was once a thriving coal mining town. Today, the borough’s economy is largely based on agriculture and tourism. The borough is home to several farms, small businesses, and manufacturing companies. It is also home to several attractions and hosts several annual events.
Common Questions
What is Per Capita Income in Nuremberg?
Per Capita income in Nuremberg is $38,956.
What is the Median Family Income in Nuremberg?
Median Family Income in Nuremberg is $50,972.
What is the Median Household income in Nuremberg?
Median Household Income in Nuremberg is $50,556.
What is Inequality or Gini Index in Nuremberg?
Inequality or Gini Index in Nuremberg is 0.46.
What is the Total Population of Nuremberg?
Total Population of Nuremberg is 268.
What is the Total Male Population of Nuremberg?
Total Male Population of Nuremberg is 92.
What is the Total Female Population of Nuremberg?
Total Female Population of Nuremberg is 176.
What is the Ratio of Males per 100 Females in Nuremberg?
There are 52.27 Males per 100 Females in Nuremberg.
What is the Ratio of Females per 100 Males in Nuremberg?
There are 191.30 Females per 100 Males in Nuremberg.
What is the Median Population Age in Nuremberg?
Median Population Age in Nuremberg is 62.7 Years.
What is the Average Family Size in Nuremberg
Average Family Size in Nuremberg is 2.1 People.
What is the Average Household Size in Nuremberg
Average Household Size in Nuremberg is 1.8 People.
How Large is the Labor Force in Nuremberg?
There are 106 People in the Labor Forcein in Nuremberg.
What is the Percentage of People in the Labor Force in Nuremberg?
45.7% of People are in the Labor Force in Nuremberg.
What is the Unemployment Rate in Nuremberg?
Unemployment Rate in Nuremberg is 7.5%.