Reynoldsville borough, PA Map & Demographics
Reynoldsville borough Overview
$23,942
PER CAPITA INCOME
$57,500
AVG FAMILY INCOME
$43,797
AVG HOUSEHOLD INCOME
37.0%
WAGE / INCOME GAP [ % ]
63.0¢/ $1
WAGE / INCOME GAP [ $ ]
0.46
INEQUALITY / GINI INDEX
2,551
TOTAL POPULATION
1,326
MALE POPULATION
1,225
FEMALE POPULATION
108.24
MALES / 100 FEMALES
92.38
FEMALES / 100 MALES
36.5
MEDIAN AGE
3.2
AVG FAMILY SIZE
2.5
AVG HOUSEHOLD SIZE
1,221
LABOR FORCE [ PEOPLE ]
59.9%
PERCENT IN LABOR FORCE
9.7%
UNEMPLOYMENT RATE
Income in Reynoldsville borough
Income Overview in Reynoldsville borough
Per Capita Income in Reynoldsville borough is $23,942, while median incomes of families and households are $57,500 and $43,797 respectively.
| Characteristic | Number | Measure |
| Per Capita Income | 2,551 | $23,942 |
| Median Family Income | 590 | $57,500 |
| Mean Family Income | 590 | $73,455 |
| Median Household Income | 1,029 | $43,797 |
| Mean Household Income | 1,029 | $56,630 |
| Income Deficit | 590 | $0 |
| Wage / Income Gap (%) | 2,551 | 36.95% |
| Wage / Income Gap ($) | 2,551 | 63.05¢ per $1 |
| Gini / Inequality Index | 2,551 | 0.46 |
Earnings by Sex in Reynoldsville borough
Average Earnings in Reynoldsville borough are $32,675, $41,114 for men and $25,921 for women, a difference of 36.9%.
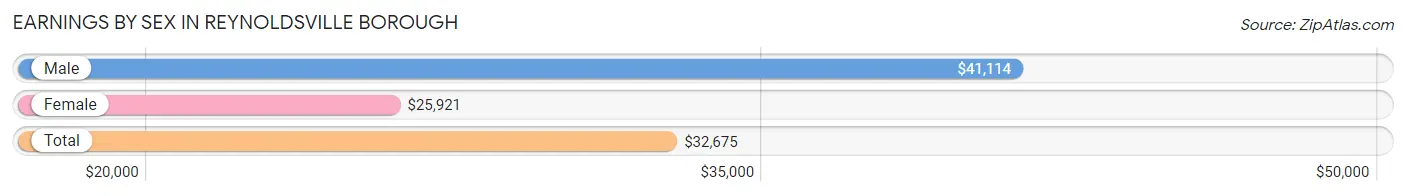
| Sex | Number | Average Earnings |
| Male | 681 (53.1%) | $41,114 |
| Female | 602 (46.9%) | $25,921 |
| Total | 1,283 (100.0%) | $32,675 |
Earnings by Sex by Income Bracket in Reynoldsville borough
The most common earnings brackets in Reynoldsville borough are $40,000 to $44,999 for men (127 | 18.6%) and $75,000 to $99,999 for women (78 | 13.0%).
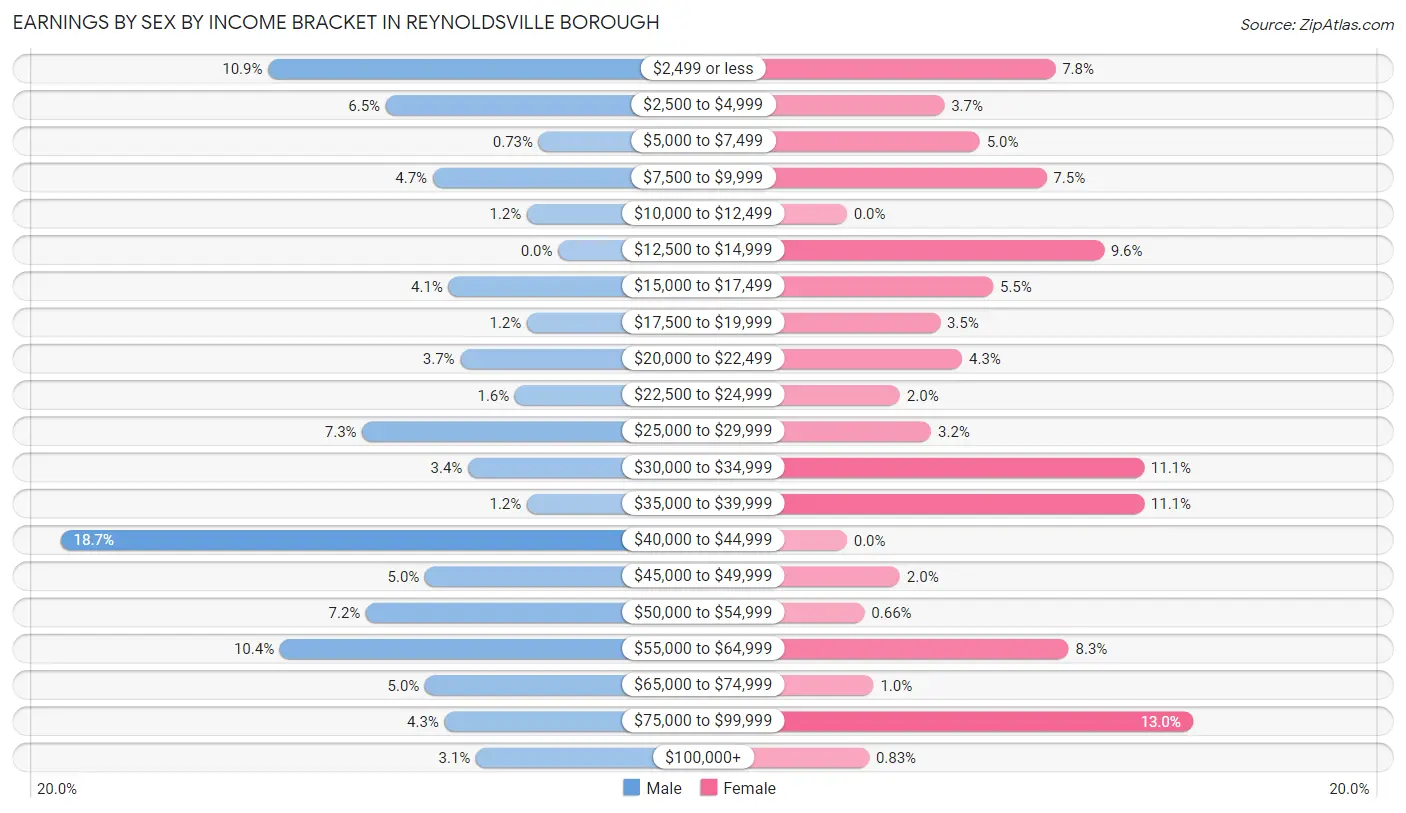
| Income | Male | Female |
| $2,499 or less | 74 (10.9%) | 47 (7.8%) |
| $2,500 to $4,999 | 44 (6.5%) | 22 (3.6%) |
| $5,000 to $7,499 | 5 (0.7%) | 30 (5.0%) |
| $7,500 to $9,999 | 32 (4.7%) | 45 (7.5%) |
| $10,000 to $12,499 | 8 (1.2%) | 0 (0.0%) |
| $12,500 to $14,999 | 0 (0.0%) | 58 (9.6%) |
| $15,000 to $17,499 | 28 (4.1%) | 33 (5.5%) |
| $17,500 to $19,999 | 8 (1.2%) | 21 (3.5%) |
| $20,000 to $22,499 | 25 (3.7%) | 26 (4.3%) |
| $22,500 to $24,999 | 11 (1.6%) | 12 (2.0%) |
| $25,000 to $29,999 | 50 (7.3%) | 19 (3.2%) |
| $30,000 to $34,999 | 23 (3.4%) | 67 (11.1%) |
| $35,000 to $39,999 | 8 (1.2%) | 67 (11.1%) |
| $40,000 to $44,999 | 127 (18.6%) | 0 (0.0%) |
| $45,000 to $49,999 | 34 (5.0%) | 12 (2.0%) |
| $50,000 to $54,999 | 49 (7.2%) | 4 (0.7%) |
| $55,000 to $64,999 | 71 (10.4%) | 50 (8.3%) |
| $65,000 to $74,999 | 34 (5.0%) | 6 (1.0%) |
| $75,000 to $99,999 | 29 (4.3%) | 78 (13.0%) |
| $100,000+ | 21 (3.1%) | 5 (0.8%) |
| Total | 681 (100.0%) | 602 (100.0%) |
Earnings by Sex by Educational Attainment in Reynoldsville borough
Average earnings in Reynoldsville borough are $44,531 for men and $33,043 for women, a difference of 25.8%. Men with an educational attainment of bachelor's degree enjoy the highest average annual earnings of $50,875, while those with college or associate's degree education earn the least with $30,500. Women with an educational attainment of graduate degree earn the most with the average annual earnings of $89,821, while those with high school diploma education have the smallest earnings of $15,804.
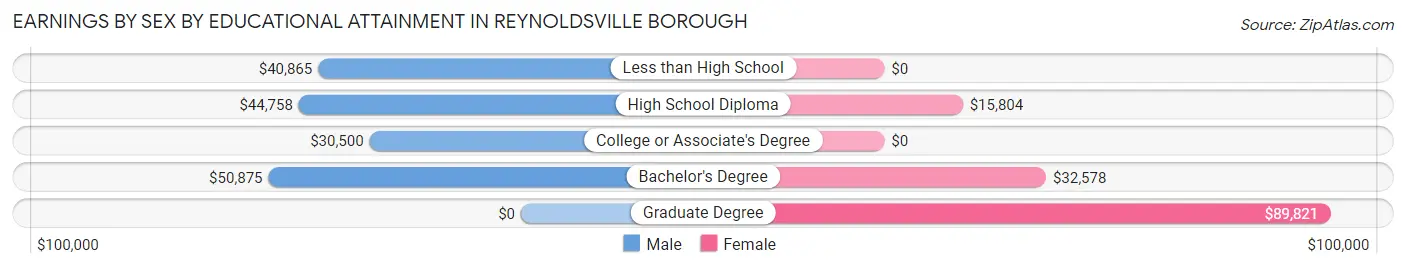
| Educational Attainment | Male Income | Female Income |
| Less than High School | $40,865 | $0 |
| High School Diploma | $44,758 | $15,804 |
| College or Associate's Degree | $30,500 | $0 |
| Bachelor's Degree | $50,875 | $32,578 |
| Graduate Degree | - | - |
| Total | $44,531 | $33,043 |
Family Income in Reynoldsville borough
Family Income Brackets in Reynoldsville borough
According to the Reynoldsville borough family income data, there are 127 families falling into the $50,000 to $74,999 income range, which is the most common income bracket and makes up 21.5% of all families.
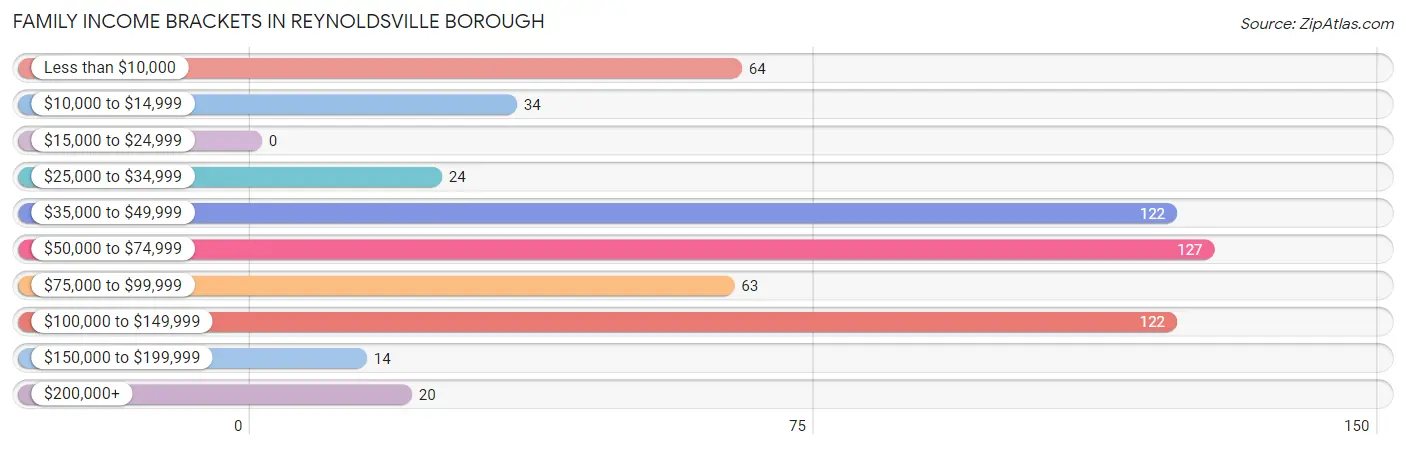
| Income Bracket | # Families | % Families |
| Less than $10,000 | 64 | 10.8% |
| $10,000 to $14,999 | 34 | 5.8% |
| $15,000 to $24,999 | 0 | 0.0% |
| $25,000 to $34,999 | 24 | 4.1% |
| $35,000 to $49,999 | 122 | 20.7% |
| $50,000 to $74,999 | 127 | 21.5% |
| $75,000 to $99,999 | 63 | 10.7% |
| $100,000 to $149,999 | 122 | 20.7% |
| $150,000 to $199,999 | 14 | 2.4% |
| $200,000+ | 20 | 3.4% |
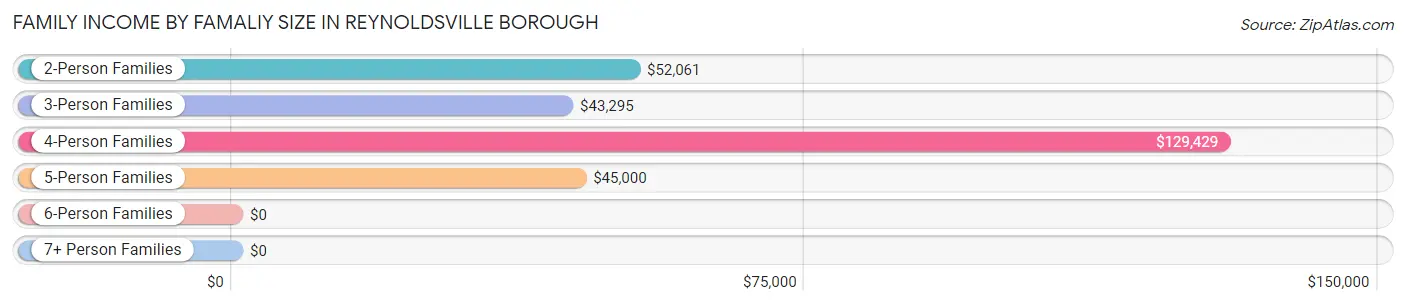
Family Income by Famaliy Size in Reynoldsville borough
4-person families (189 | 32.0%) account for the highest median family income in Reynoldsville borough with $129,429 per family, while 4-person families (189 | 32.0%) have the highest median income of $32,357 per family member.
| Income Bracket | # Families | Median Income |
| 2-Person Families | 277 (46.9%) | $52,061 |
| 3-Person Families | 89 (15.1%) | $43,295 |
| 4-Person Families | 189 (32.0%) | $129,429 |
| 5-Person Families | 26 (4.4%) | $45,000 |
| 6-Person Families | 5 (0.9%) | $0 |
| 7+ Person Families | 4 (0.7%) | $0 |
| Total | 590 (100.0%) | $57,500 |
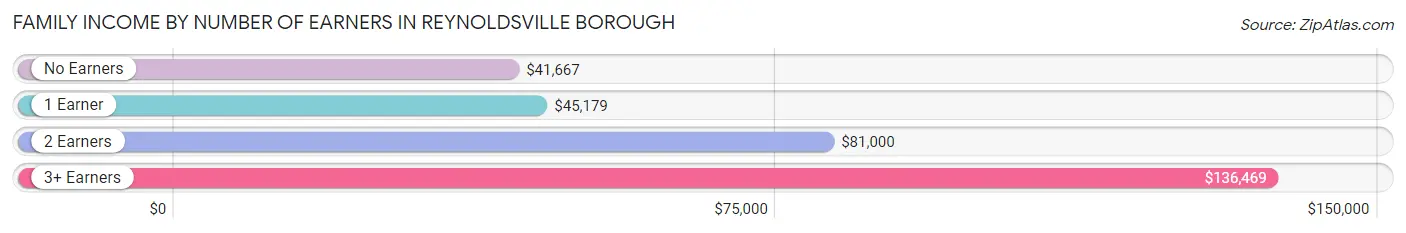
Family Income by Number of Earners in Reynoldsville borough
The median family income in Reynoldsville borough is $57,500, with families comprising 3+ earners (101) having the highest median family income of $136,469, while families with no earners (106) have the lowest median family income of $41,667, accounting for 17.1% and 18.0% of families, respectively.
| Number of Earners | # Families | Median Income |
| No Earners | 106 (18.0%) | $41,667 |
| 1 Earner | 193 (32.7%) | $45,179 |
| 2 Earners | 190 (32.2%) | $81,000 |
| 3+ Earners | 101 (17.1%) | $136,469 |
| Total | 590 (100.0%) | $57,500 |
Household Income in Reynoldsville borough
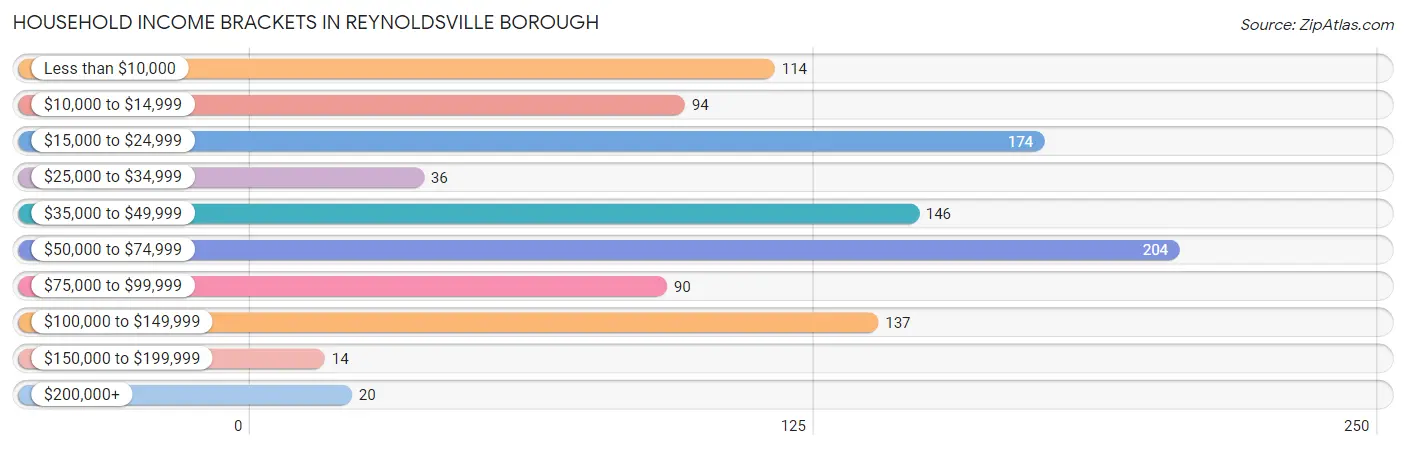
Household Income Brackets in Reynoldsville borough
With 204 households falling in the category, the $50,000 to $74,999 income range is the most frequent in Reynoldsville borough, accounting for 19.8% of all households. In contrast, only 14 households (1.4%) fall into the $150,000 to $199,999 income bracket, making it the least populous group.
| Income Bracket | # Households | % Households |
| Less than $10,000 | 114 | 11.1% |
| $10,000 to $14,999 | 94 | 9.1% |
| $15,000 to $24,999 | 174 | 16.9% |
| $25,000 to $34,999 | 36 | 3.5% |
| $35,000 to $49,999 | 146 | 14.2% |
| $50,000 to $74,999 | 204 | 19.8% |
| $75,000 to $99,999 | 90 | 8.7% |
| $100,000 to $149,999 | 137 | 13.3% |
| $150,000 to $199,999 | 14 | 1.4% |
| $200,000+ | 20 | 1.9% |
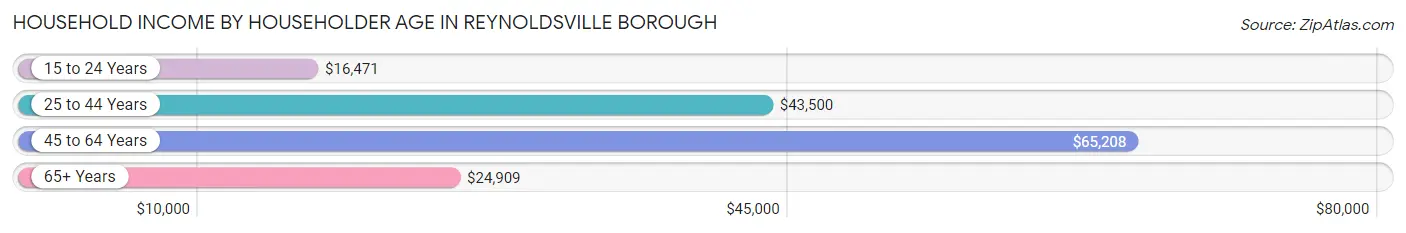
Household Income by Householder Age in Reynoldsville borough
The median household income in Reynoldsville borough is $43,797, with the highest median household income of $65,208 found in the 45 to 64 years age bracket for the primary householder. A total of 371 households (36.0%) fall into this category. Meanwhile, the 15 to 24 years age bracket for the primary householder has the lowest median household income of $16,471, with 36 households (3.5%) in this group.
| Income Bracket | # Households | Median Income |
| 15 to 24 Years | 36 (3.5%) | $16,471 |
| 25 to 44 Years | 328 (31.9%) | $43,500 |
| 45 to 64 Years | 371 (36.0%) | $65,208 |
| 65+ Years | 294 (28.6%) | $24,909 |
| Total | 1,029 (100.0%) | $43,797 |
Poverty in Reynoldsville borough
Income Below Poverty by Sex and Age in Reynoldsville borough
With 14.8% poverty level for males and 28.2% for females among the residents of Reynoldsville borough, 15 year old males and 5 year old females are the most vulnerable to poverty, with 6 males (46.2%) and 17 females (100.0%) in their respective age groups living below the poverty level.
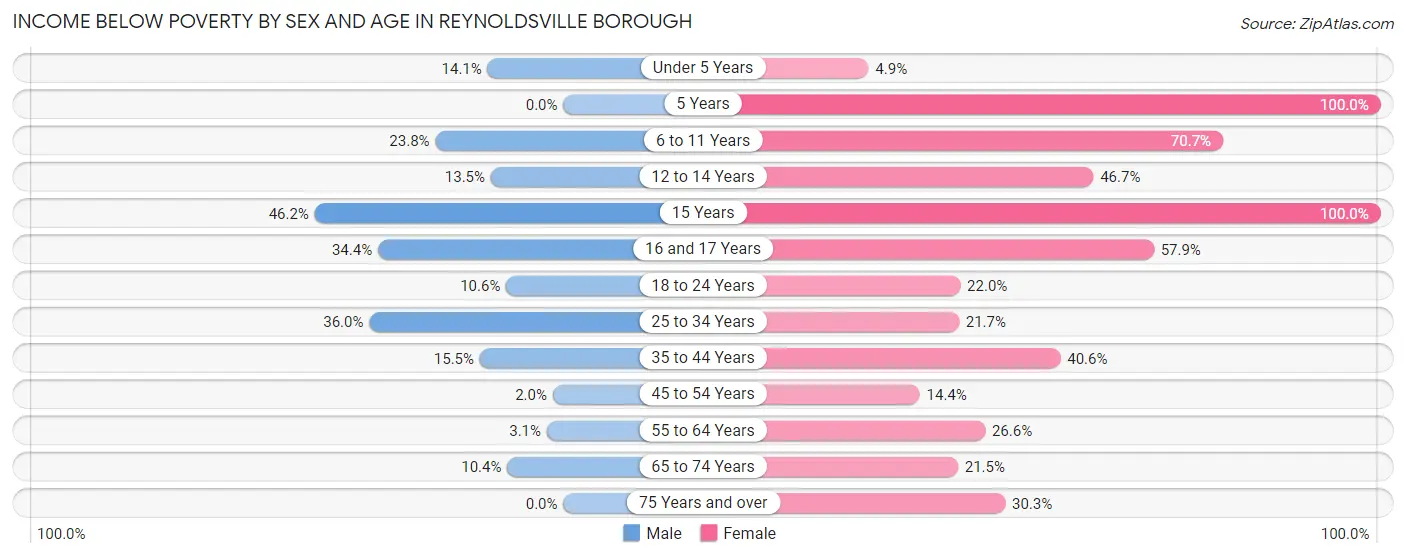
| Age Bracket | Male | Female |
| Under 5 Years | 18 (14.1%) | 4 (4.9%) |
| 5 Years | 0 (0.0%) | 17 (100.0%) |
| 6 to 11 Years | 19 (23.7%) | 29 (70.7%) |
| 12 to 14 Years | 7 (13.5%) | 28 (46.7%) |
| 15 Years | 6 (46.2%) | 11 (100.0%) |
| 16 and 17 Years | 32 (34.4%) | 11 (57.9%) |
| 18 to 24 Years | 16 (10.6%) | 29 (22.0%) |
| 25 to 34 Years | 58 (36.0%) | 33 (21.7%) |
| 35 to 44 Years | 20 (15.5%) | 58 (40.6%) |
| 45 to 54 Years | 4 (2.0%) | 26 (14.4%) |
| 55 to 64 Years | 3 (3.1%) | 42 (26.6%) |
| 65 to 74 Years | 13 (10.4%) | 31 (21.5%) |
| 75 Years and over | 0 (0.0%) | 20 (30.3%) |
| Total | 196 (14.8%) | 339 (28.2%) |
Income Above Poverty by Sex and Age in Reynoldsville borough
According to the poverty statistics in Reynoldsville borough, males aged 5 years and females aged under 5 years are the age groups that are most secure financially, with 100.0% of males and 95.1% of females in these age groups living above the poverty line.
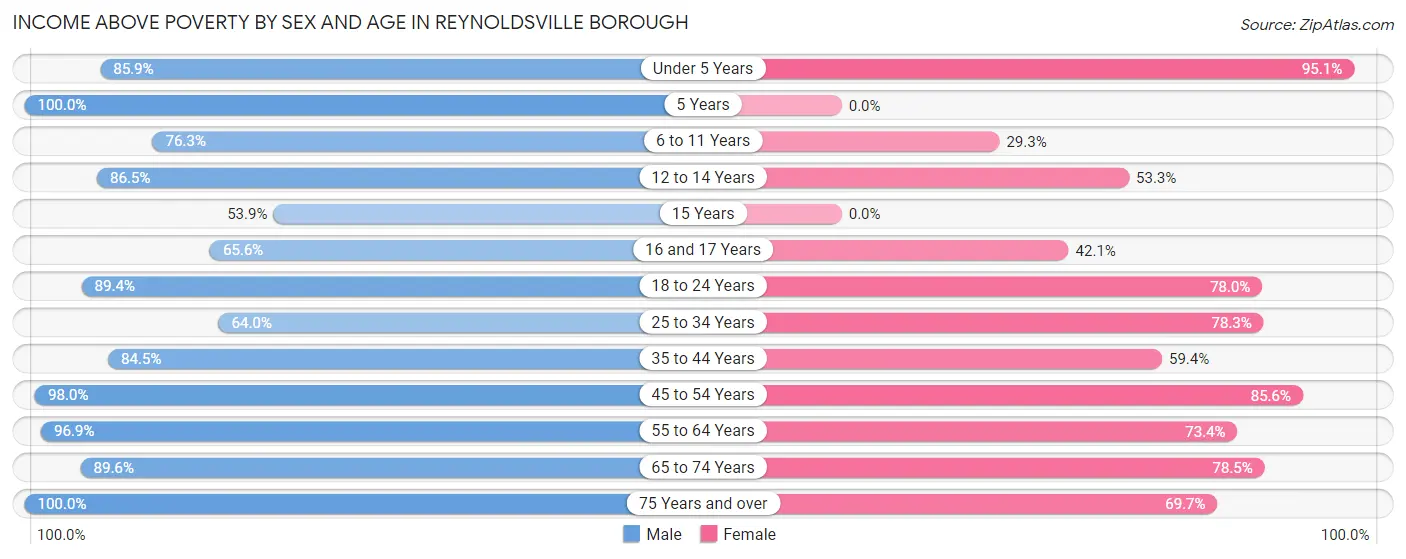
| Age Bracket | Male | Female |
| Under 5 Years | 110 (85.9%) | 77 (95.1%) |
| 5 Years | 8 (100.0%) | 0 (0.0%) |
| 6 to 11 Years | 61 (76.2%) | 12 (29.3%) |
| 12 to 14 Years | 45 (86.5%) | 32 (53.3%) |
| 15 Years | 7 (53.8%) | 0 (0.0%) |
| 16 and 17 Years | 61 (65.6%) | 8 (42.1%) |
| 18 to 24 Years | 135 (89.4%) | 103 (78.0%) |
| 25 to 34 Years | 103 (64.0%) | 119 (78.3%) |
| 35 to 44 Years | 109 (84.5%) | 85 (59.4%) |
| 45 to 54 Years | 200 (98.0%) | 154 (85.6%) |
| 55 to 64 Years | 95 (96.9%) | 116 (73.4%) |
| 65 to 74 Years | 112 (89.6%) | 113 (78.5%) |
| 75 Years and over | 84 (100.0%) | 46 (69.7%) |
| Total | 1,130 (85.2%) | 865 (71.8%) |
Income Below Poverty Among Married-Couple Families in Reynoldsville borough
The poverty statistics for married-couple families in Reynoldsville borough show that 4.2% or 16 of the total 378 families live below the poverty line. Families with 3 or 4 children have the highest poverty rate of 33.3%, comprising of 5 families. On the other hand, families with no children have the lowest poverty rate of 2.9%, which includes 7 families.
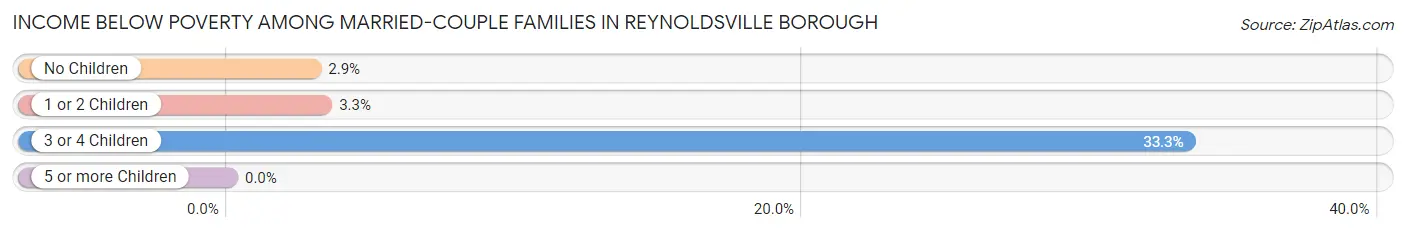
| Children | Above Poverty | Below Poverty |
| No Children | 234 (97.1%) | 7 (2.9%) |
| 1 or 2 Children | 118 (96.7%) | 4 (3.3%) |
| 3 or 4 Children | 10 (66.7%) | 5 (33.3%) |
| 5 or more Children | 0 (0.0%) | 0 (0.0%) |
| Total | 362 (95.8%) | 16 (4.2%) |
Income Below Poverty Among Single-Parent Households in Reynoldsville borough
According to the poverty data in Reynoldsville borough, 12.5% or 7 single-father households and 51.3% or 80 single-mother households are living below the poverty line. Among single-father households, those with 1 or 2 children have the highest poverty rate, with 7 households (29.2%) experiencing poverty. Likewise, among single-mother households, those with 3 or 4 children have the highest poverty rate, with 25 households (100.0%) falling below the poverty line.
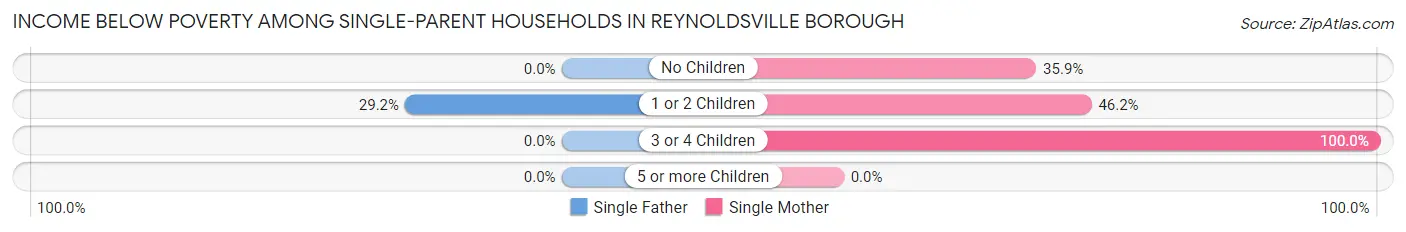
| Children | Single Father | Single Mother |
| No Children | 0 (0.0%) | 19 (35.8%) |
| 1 or 2 Children | 7 (29.2%) | 36 (46.2%) |
| 3 or 4 Children | 0 (0.0%) | 25 (100.0%) |
| 5 or more Children | 0 (0.0%) | 0 (0.0%) |
| Total | 7 (12.5%) | 80 (51.3%) |
Income Below Poverty Among Married-Couple vs Single-Parent Households in Reynoldsville borough
The poverty data for Reynoldsville borough shows that 16 of the married-couple family households (4.2%) and 87 of the single-parent households (41.0%) are living below the poverty level. Within the married-couple family households, those with 3 or 4 children have the highest poverty rate, with 5 households (33.3%) falling below the poverty line. Among the single-parent households, those with 3 or 4 children have the highest poverty rate, with 25 household (78.1%) living below poverty.
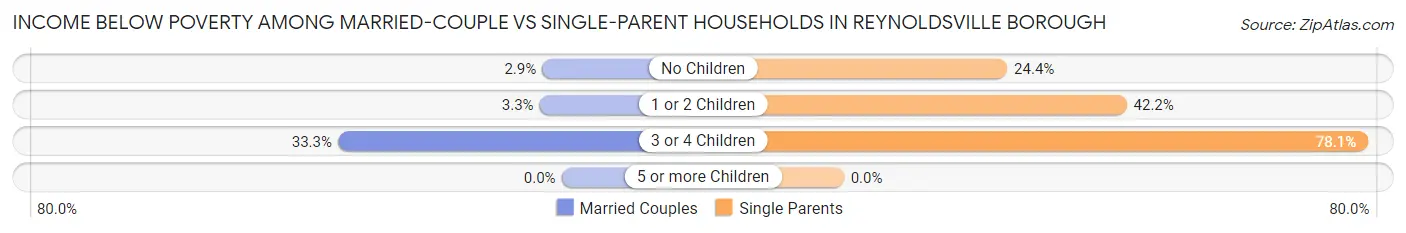
| Children | Married-Couple Families | Single-Parent Households |
| No Children | 7 (2.9%) | 19 (24.4%) |
| 1 or 2 Children | 4 (3.3%) | 43 (42.2%) |
| 3 or 4 Children | 5 (33.3%) | 25 (78.1%) |
| 5 or more Children | 0 (0.0%) | 0 (0.0%) |
| Total | 16 (4.2%) | 87 (41.0%) |
Race in Reynoldsville borough
The most populous races in Reynoldsville borough are White / Caucasian (2,472 | 96.9%), Two or more Races (44 | 1.7%), and Asian (27 | 1.1%).
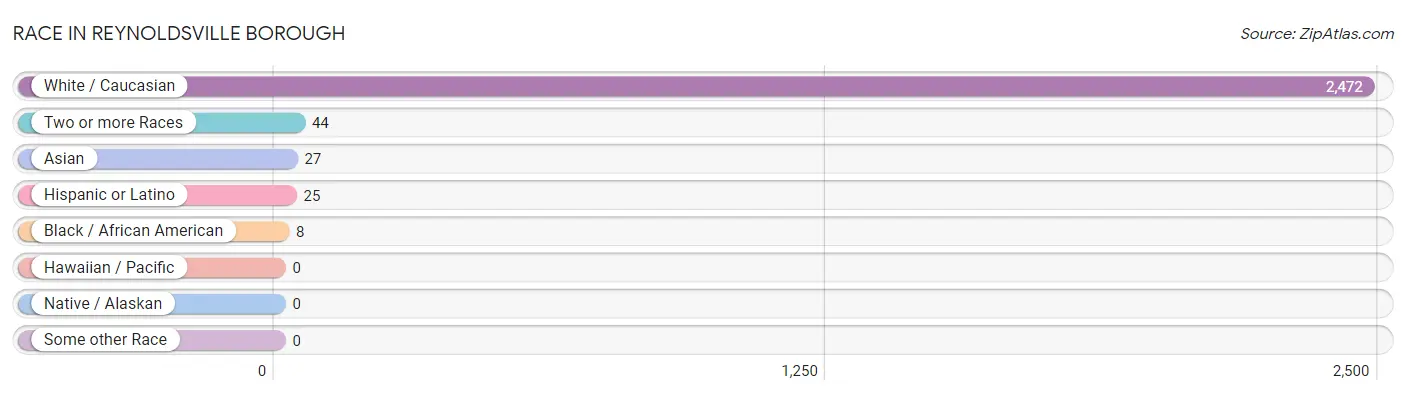
| Race | # Population | % Population |
| Asian | 27 | 1.1% |
| Black / African American | 8 | 0.3% |
| Hawaiian / Pacific | 0 | 0.0% |
| Hispanic or Latino | 25 | 1.0% |
| Native / Alaskan | 0 | 0.0% |
| White / Caucasian | 2,472 | 96.9% |
| Two or more Races | 44 | 1.7% |
| Some other Race | 0 | 0.0% |
| Total | 2,551 | 100.0% |
Ancestry in Reynoldsville borough
The most populous ancestries reported in Reynoldsville borough are German (921 | 36.1%), English (335 | 13.1%), Irish (282 | 11.1%), Italian (232 | 9.1%), and French (172 | 6.7%), together accounting for 76.1% of all Reynoldsville borough residents.
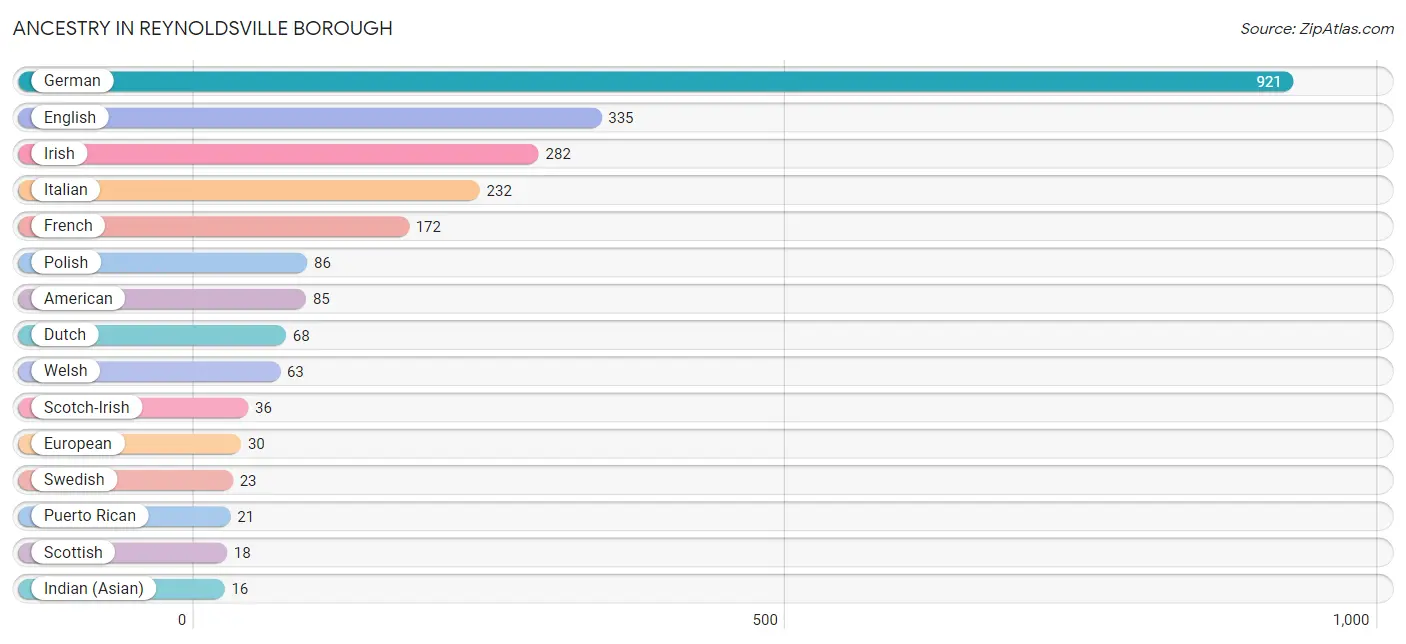
| Ancestry | # Population | % Population |
| African | 1 | 0.0% |
| American | 85 | 3.3% |
| Australian | 5 | 0.2% |
| Bhutanese | 11 | 0.4% |
| British | 10 | 0.4% |
| Dominican | 4 | 0.2% |
| Dutch | 68 | 2.7% |
| Eastern European | 6 | 0.2% |
| English | 335 | 13.1% |
| European | 30 | 1.2% |
| French | 172 | 6.7% |
| German | 921 | 36.1% |
| Greek | 5 | 0.2% |
| Indian (Asian) | 16 | 0.6% |
| Irish | 282 | 11.1% |
| Italian | 232 | 9.1% |
| Lithuanian | 15 | 0.6% |
| Northern European | 6 | 0.2% |
| Polish | 86 | 3.4% |
| Portuguese | 3 | 0.1% |
| Puerto Rican | 21 | 0.8% |
| Russian | 15 | 0.6% |
| Scotch-Irish | 36 | 1.4% |
| Scottish | 18 | 0.7% |
| Slovak | 9 | 0.4% |
| Subsaharan African | 1 | 0.0% |
| Swedish | 23 | 0.9% |
| Welsh | 63 | 2.5% | View All 28 Rows |
Immigrants in Reynoldsville borough
The most numerous immigrant groups reported in Reynoldsville borough came from Asia (16 | 0.6%), China (16 | 0.6%), Eastern Asia (16 | 0.6%), Eastern Europe (5 | 0.2%), and Europe (5 | 0.2%), together accounting for 2.3% of all Reynoldsville borough residents.
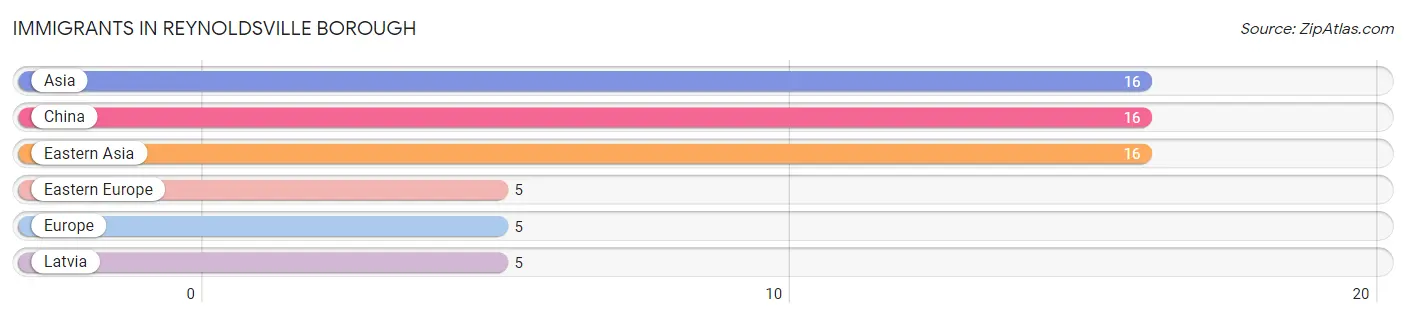
| Immigration Origin | # Population | % Population |
| Asia | 16 | 0.6% |
| China | 16 | 0.6% |
| Eastern Asia | 16 | 0.6% |
| Eastern Europe | 5 | 0.2% |
| Europe | 5 | 0.2% |
| Latvia | 5 | 0.2% | View All 6 Rows |
Sex and Age in Reynoldsville borough
Sex and Age in Reynoldsville borough
The most populous age groups in Reynoldsville borough are 15 to 19 Years (151 | 11.4%) for men and 45 to 49 Years (122 | 10.0%) for women.
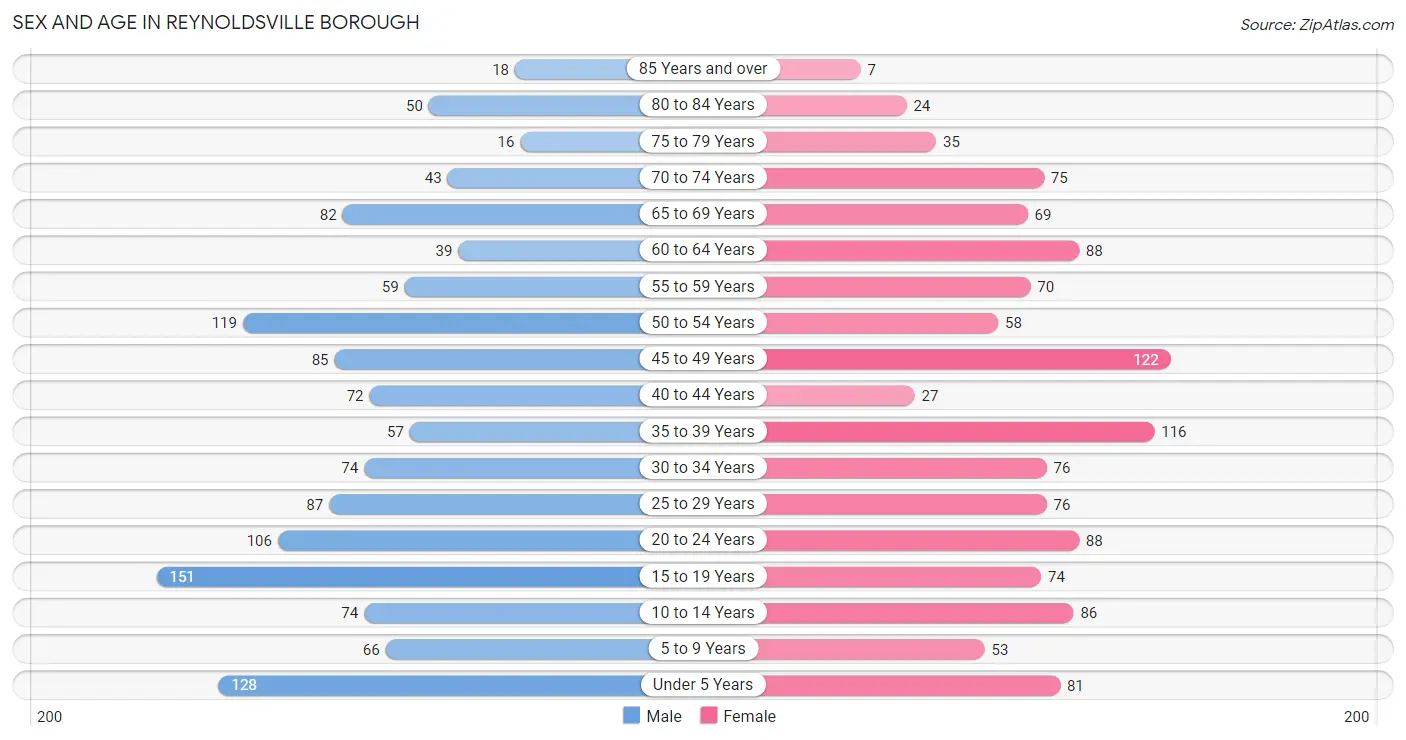
| Age Bracket | Male | Female |
| Under 5 Years | 128 (9.7%) | 81 (6.6%) |
| 5 to 9 Years | 66 (5.0%) | 53 (4.3%) |
| 10 to 14 Years | 74 (5.6%) | 86 (7.0%) |
| 15 to 19 Years | 151 (11.4%) | 74 (6.0%) |
| 20 to 24 Years | 106 (8.0%) | 88 (7.2%) |
| 25 to 29 Years | 87 (6.6%) | 76 (6.2%) |
| 30 to 34 Years | 74 (5.6%) | 76 (6.2%) |
| 35 to 39 Years | 57 (4.3%) | 116 (9.5%) |
| 40 to 44 Years | 72 (5.4%) | 27 (2.2%) |
| 45 to 49 Years | 85 (6.4%) | 122 (10.0%) |
| 50 to 54 Years | 119 (9.0%) | 58 (4.7%) |
| 55 to 59 Years | 59 (4.4%) | 70 (5.7%) |
| 60 to 64 Years | 39 (2.9%) | 88 (7.2%) |
| 65 to 69 Years | 82 (6.2%) | 69 (5.6%) |
| 70 to 74 Years | 43 (3.2%) | 75 (6.1%) |
| 75 to 79 Years | 16 (1.2%) | 35 (2.9%) |
| 80 to 84 Years | 50 (3.8%) | 24 (2.0%) |
| 85 Years and over | 18 (1.4%) | 7 (0.6%) |
| Total | 1,326 (100.0%) | 1,225 (100.0%) |
Families and Households in Reynoldsville borough
Median Family Size in Reynoldsville borough
The median family size in Reynoldsville borough is 3.23 persons per family, with married-couple families (378 | 64.1%) accounting for the largest median family size of 3.44 persons per family. On the other hand, single female/mother families (156 | 26.4%) represent the smallest median family size with 2.84 persons per family.
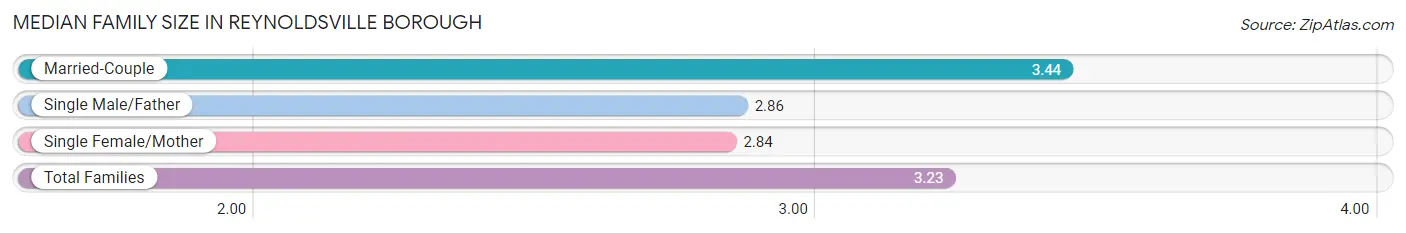
| Family Type | # Families | Family Size |
| Married-Couple | 378 (64.1%) | 3.44 |
| Single Male/Father | 56 (9.5%) | 2.86 |
| Single Female/Mother | 156 (26.4%) | 2.84 |
| Total Families | 590 (100.0%) | 3.23 |
Median Household Size in Reynoldsville borough
The median household size in Reynoldsville borough is 2.47 persons per household, with married-couple households (378 | 36.7%) accounting for the largest median household size of 3.47 persons per household. non-family households (439 | 42.7%) represent the smallest median household size with 1.25 persons per household.
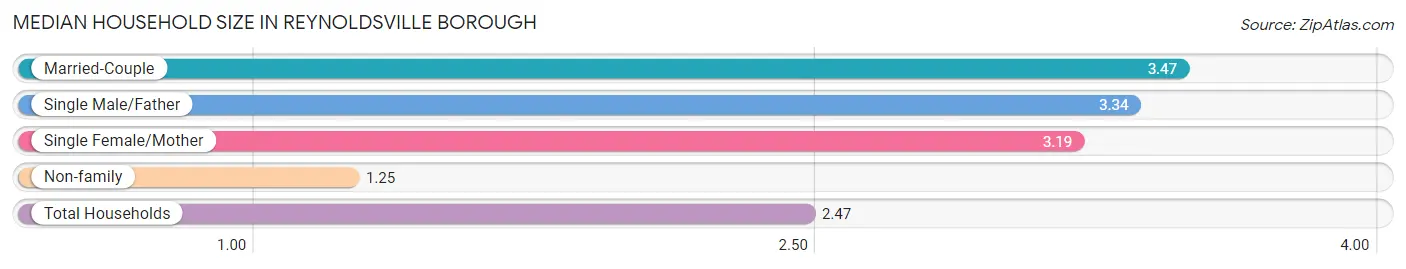
| Household Type | # Households | Household Size |
| Married-Couple | 378 (36.7%) | 3.47 |
| Single Male/Father | 56 (5.4%) | 3.34 |
| Single Female/Mother | 156 (15.2%) | 3.19 |
| Non-family | 439 (42.7%) | 1.25 |
| Total Households | 1,029 (100.0%) | 2.47 |
Household Size by Marriage Status in Reynoldsville borough
Out of a total of 1,029 households in Reynoldsville borough, 590 (57.3%) are family households, while 439 (42.7%) are nonfamily households. The most numerous type of family households are 2-person households, comprising 244, and the most common type of nonfamily households are 1-person households, comprising 376.
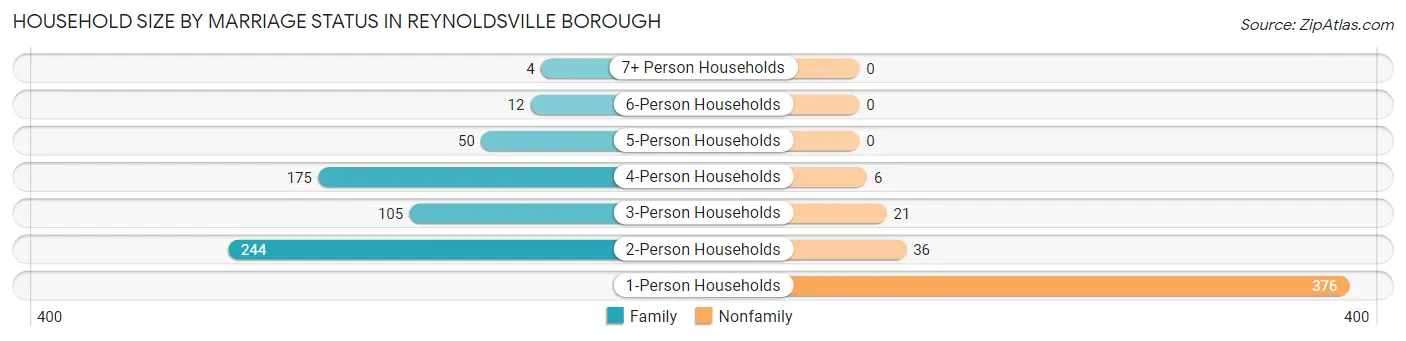
| Household Size | Family Households | Nonfamily Households |
| 1-Person Households | - | 376 (36.5%) |
| 2-Person Households | 244 (23.7%) | 36 (3.5%) |
| 3-Person Households | 105 (10.2%) | 21 (2.0%) |
| 4-Person Households | 175 (17.0%) | 6 (0.6%) |
| 5-Person Households | 50 (4.9%) | 0 (0.0%) |
| 6-Person Households | 12 (1.2%) | 0 (0.0%) |
| 7+ Person Households | 4 (0.4%) | 0 (0.0%) |
| Total | 590 (57.3%) | 439 (42.7%) |
Female Fertility in Reynoldsville borough
Fertility by Age in Reynoldsville borough
Average fertility rate in Reynoldsville borough is 3.0 births per 1,000 women. Women in the age bracket of 15 to 19 years have the highest fertility rate with 27.0 births per 1,000 women. Women in the age bracket of 15 to 19 years acount for 100.0% of all women with births.
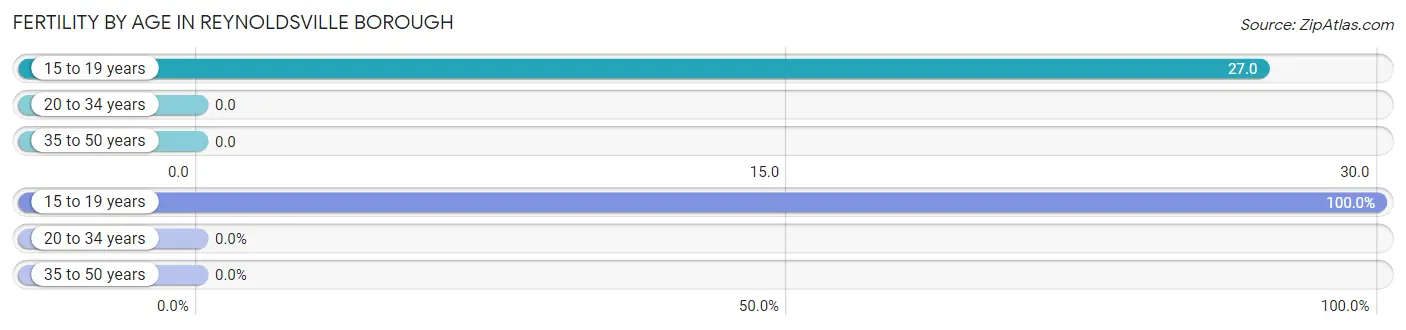
| Age Bracket | Women with Births | Births / 1,000 Women |
| 15 to 19 years | 2 (100.0%) | 27.0 |
| 20 to 34 years | 0 (0.0%) | 0.0 |
| 35 to 50 years | 0 (0.0%) | 0.0 |
| Total | 2 (100.0%) | 3.0 |
Fertility by Age by Marriage Status in Reynoldsville borough
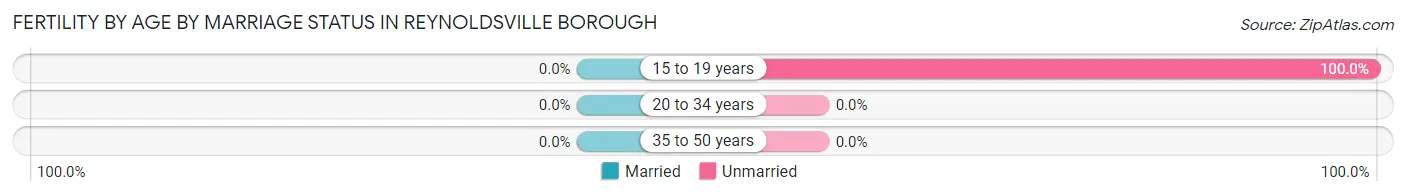
| Age Bracket | Married | Unmarried |
| 15 to 19 years | 0 (0.0%) | 2 (100.0%) |
| 20 to 34 years | 0 (0.0%) | 0 (0.0%) |
| 35 to 50 years | 0 (0.0%) | 0 (0.0%) |
| Total | 0 (0.0%) | 2 (100.0%) |
Fertility by Education in Reynoldsville borough
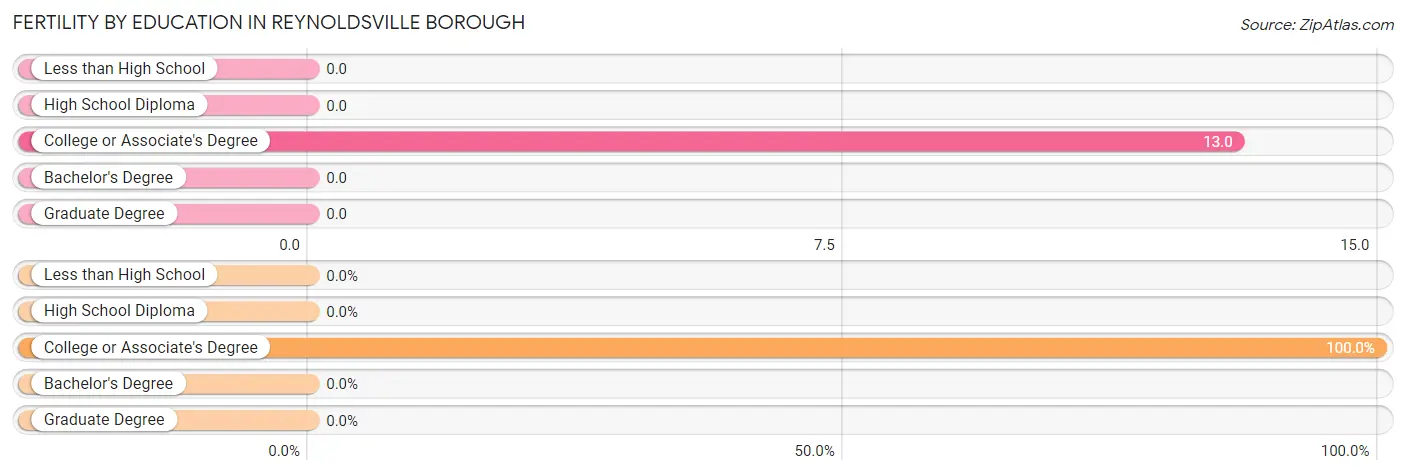
| Educational Attainment | Women with Births | Births / 1,000 Women |
| Less than High School | 0 (0.0%) | 0.0 |
| High School Diploma | 0 (0.0%) | 0.0 |
| College or Associate's Degree | 2 (100.0%) | 13.0 |
| Bachelor's Degree | 0 (0.0%) | 0.0 |
| Graduate Degree | 0 (0.0%) | 0.0 |
| Total | 2 (100.0%) | 3.0 |
Fertility by Education by Marriage Status in Reynoldsville borough
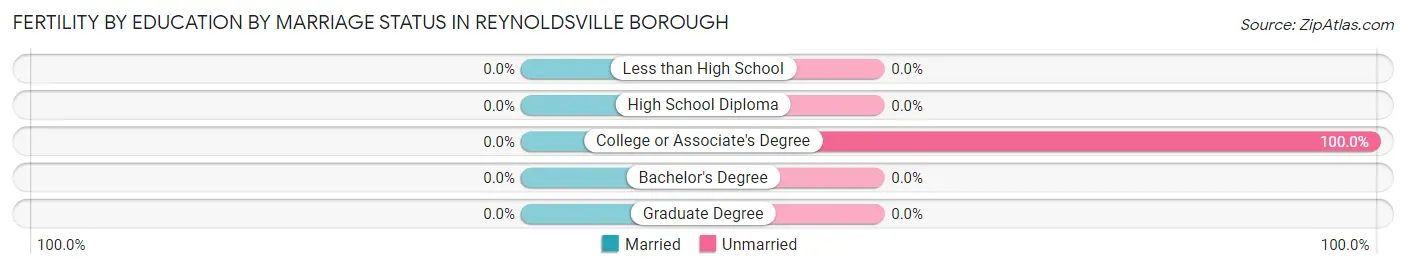
| Educational Attainment | Married | Unmarried |
| Less than High School | 0 (0.0%) | 0 (0.0%) |
| High School Diploma | 0 (0.0%) | 0 (0.0%) |
| College or Associate's Degree | 0 (0.0%) | 2 (100.0%) |
| Bachelor's Degree | 0 (0.0%) | 0 (0.0%) |
| Graduate Degree | 0 (0.0%) | 0 (0.0%) |
| Total | 0 (0.0%) | 2 (100.0%) |
Employment Characteristics in Reynoldsville borough
Employment by Class of Employer in Reynoldsville borough
Among the 1,044 employed individuals in Reynoldsville borough, private company employees (828 | 79.3%), self-employed (not incorporated) (79 | 7.6%), and not-for-profit organizations (73 | 7.0%) make up the most common classes of employment.
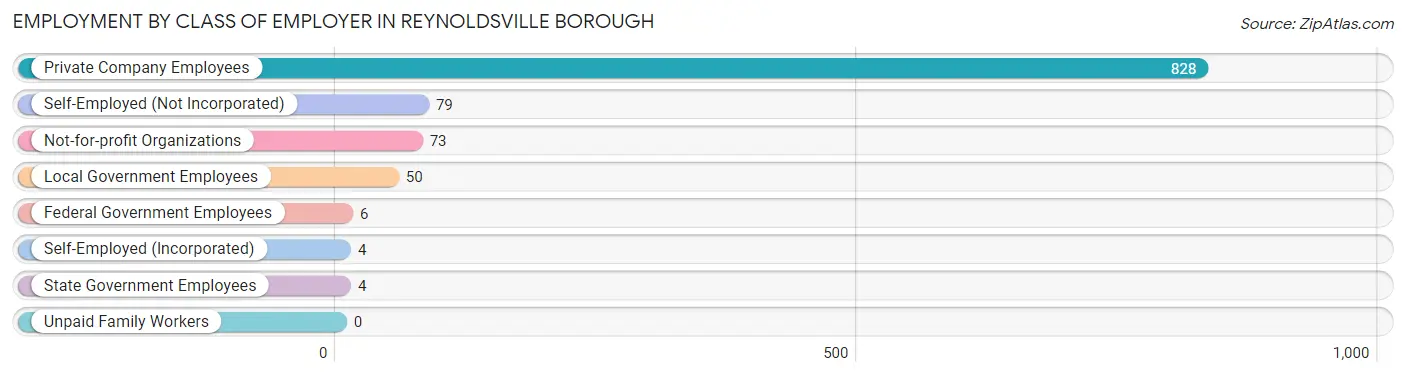
| Employer Class | # Employees | % Employees |
| Private Company Employees | 828 | 79.3% |
| Self-Employed (Incorporated) | 4 | 0.4% |
| Self-Employed (Not Incorporated) | 79 | 7.6% |
| Not-for-profit Organizations | 73 | 7.0% |
| Local Government Employees | 50 | 4.8% |
| State Government Employees | 4 | 0.4% |
| Federal Government Employees | 6 | 0.6% |
| Unpaid Family Workers | 0 | 0.0% |
| Total | 1,044 | 100.0% |
Employment Status by Age in Reynoldsville borough
According to the labor force statistics for Reynoldsville borough, out of the total population over 16 years of age (2,039), 59.9% or 1,221 individuals are in the labor force, with 9.7% or 118 of them unemployed. The age group with the highest labor force participation rate is 45 to 54 years, with 83.3% or 320 individuals in the labor force. Within the labor force, the 75 years and over age range has the highest percentage of unemployed individuals, with 36.4% or 4 of them being unemployed.
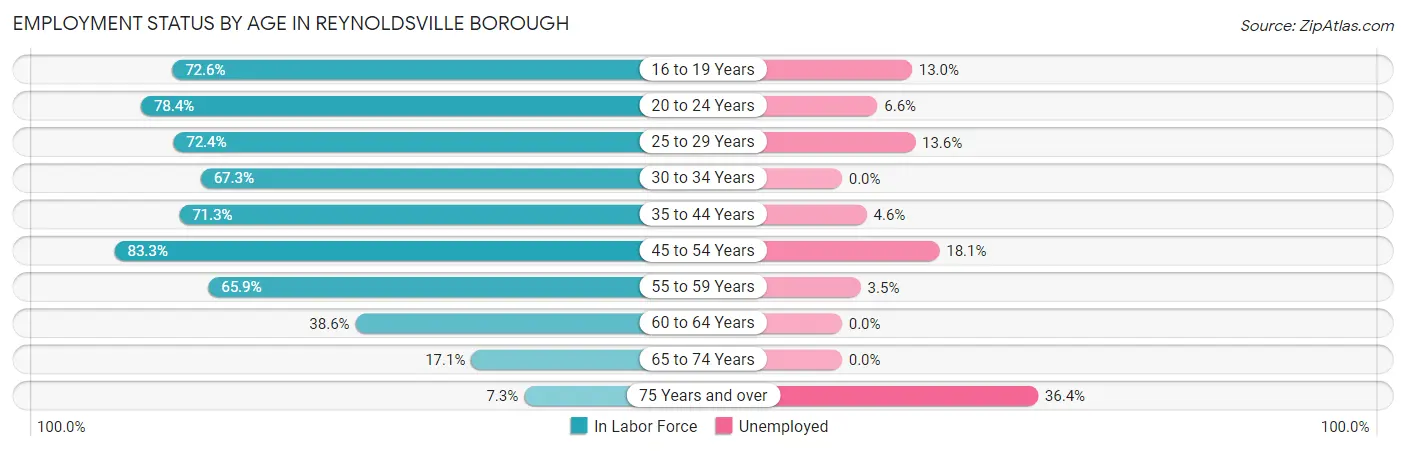
| Age Bracket | In Labor Force | Unemployed |
| 16 to 19 Years | 146 (72.6%) | 19 (13.0%) |
| 20 to 24 Years | 152 (78.4%) | 10 (6.6%) |
| 25 to 29 Years | 118 (72.4%) | 16 (13.6%) |
| 30 to 34 Years | 101 (67.3%) | 0 (0.0%) |
| 35 to 44 Years | 194 (71.3%) | 9 (4.6%) |
| 45 to 54 Years | 320 (83.3%) | 58 (18.1%) |
| 55 to 59 Years | 85 (65.9%) | 3 (3.5%) |
| 60 to 64 Years | 49 (38.6%) | 0 (0.0%) |
| 65 to 74 Years | 46 (17.1%) | 0 (0.0%) |
| 75 Years and over | 11 (7.3%) | 4 (36.4%) |
| Total | 1,221 (59.9%) | 118 (9.7%) |
Employment Status by Educational Attainment in Reynoldsville borough
According to labor force statistics for Reynoldsville borough, 70.8% of individuals (867) out of the total population between 25 and 64 years of age (1,225) are in the labor force, with 9.9% or 86 of them being unemployed. The group with the highest labor force participation rate are those with the educational attainment of bachelor's degree or higher, with 84.0% or 131 individuals in the labor force. Within the labor force, individuals with high school diploma education have the highest percentage of unemployment, with 19.2% or 79 of them being unemployed.
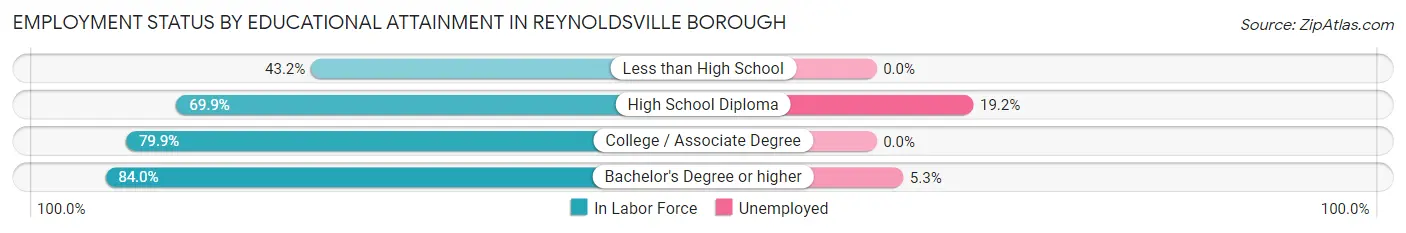
| Educational Attainment | In Labor Force | Unemployed |
| Less than High School | 70 (43.2%) | 0 (0.0%) |
| High School Diploma | 412 (69.9%) | 113 (19.2%) |
| College / Associate Degree | 254 (79.9%) | 0 (0.0%) |
| Bachelor's Degree or higher | 131 (84.0%) | 8 (5.3%) |
| Total | 867 (70.8%) | 121 (9.9%) |
Employment Occupations by Sex in Reynoldsville borough
Management, Business, Science and Arts Occupations
The most common Management, Business, Science and Arts occupations in Reynoldsville borough are Computers, Engineering & Science (91 | 8.3%), Computers & Mathematics (64 | 5.8%), Management (60 | 5.4%), Health Diagnosing & Treating (57 | 5.2%), and Community & Social Service (32 | 2.9%).
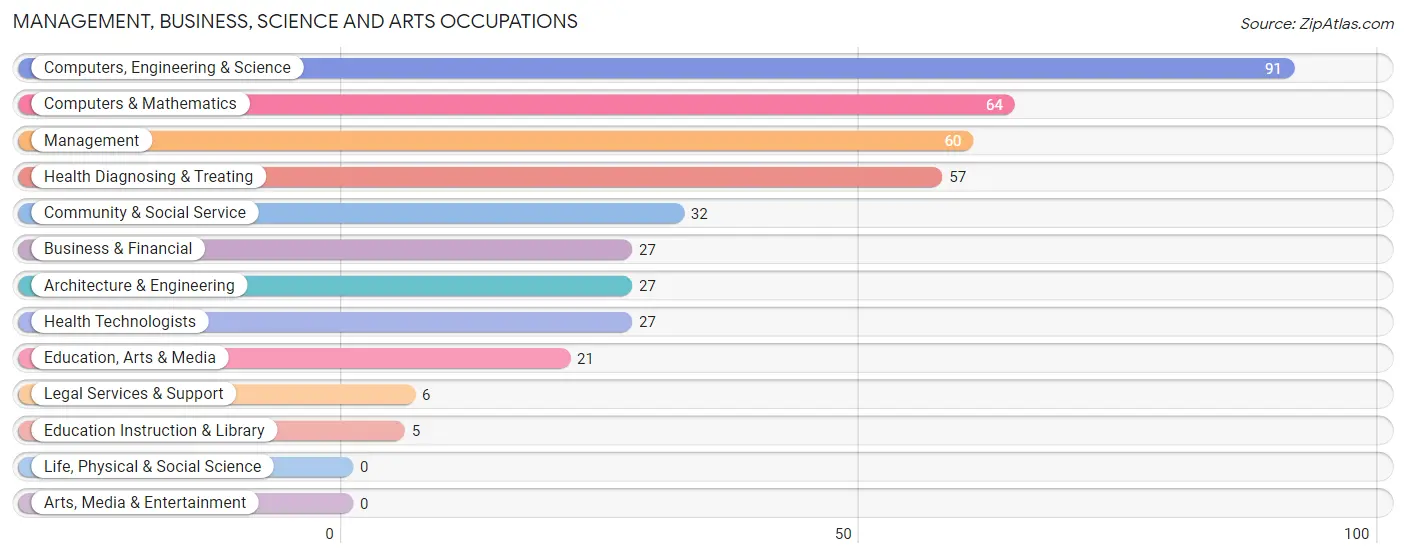
Management, Business, Science and Arts Occupations by Sex
Within the Management, Business, Science and Arts occupations in Reynoldsville borough, the most male-oriented occupations are Legal Services & Support (100.0%), Business & Financial (77.8%), and Management (55.0%), while the most female-oriented occupations are Education, Arts & Media (100.0%), Education Instruction & Library (100.0%), and Health Technologists (100.0%).
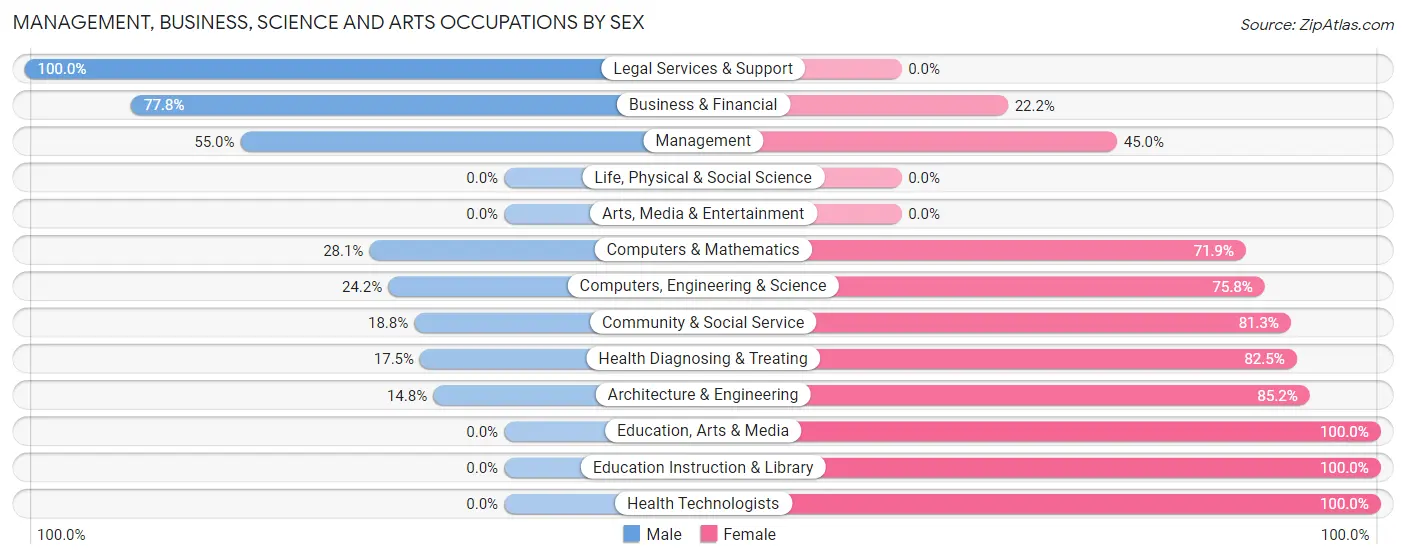
| Occupation | Male | Female |
| Management | 33 (55.0%) | 27 (45.0%) |
| Business & Financial | 21 (77.8%) | 6 (22.2%) |
| Computers, Engineering & Science | 22 (24.2%) | 69 (75.8%) |
| Computers & Mathematics | 18 (28.1%) | 46 (71.9%) |
| Architecture & Engineering | 4 (14.8%) | 23 (85.2%) |
| Life, Physical & Social Science | 0 (0.0%) | 0 (0.0%) |
| Community & Social Service | 6 (18.8%) | 26 (81.2%) |
| Education, Arts & Media | 0 (0.0%) | 21 (100.0%) |
| Legal Services & Support | 6 (100.0%) | 0 (0.0%) |
| Education Instruction & Library | 0 (0.0%) | 5 (100.0%) |
| Arts, Media & Entertainment | 0 (0.0%) | 0 (0.0%) |
| Health Diagnosing & Treating | 10 (17.5%) | 47 (82.5%) |
| Health Technologists | 0 (0.0%) | 27 (100.0%) |
| Total (Category) | 92 (34.5%) | 175 (65.5%) |
| Total (Overall) | 580 (52.6%) | 523 (47.4%) |
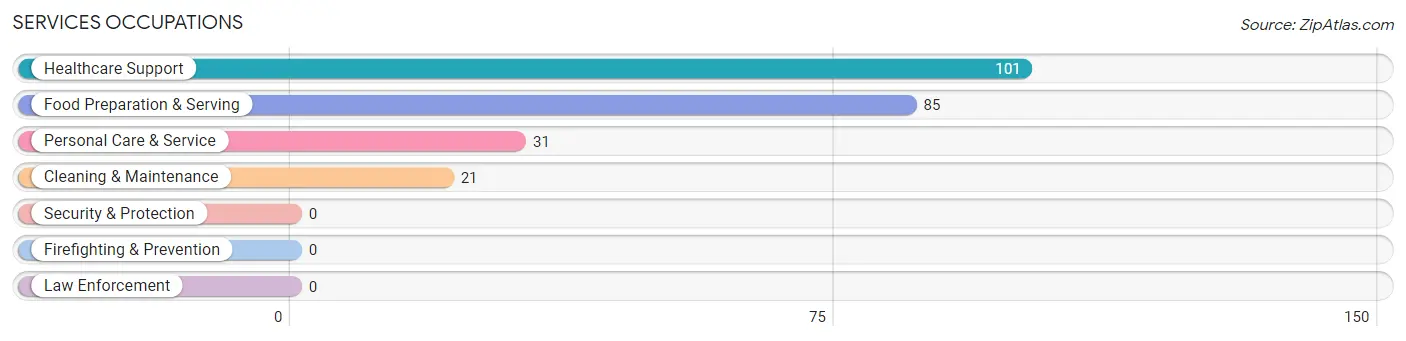
Services Occupations
The most common Services occupations in Reynoldsville borough are Healthcare Support (101 | 9.2%), Food Preparation & Serving (85 | 7.7%), Personal Care & Service (31 | 2.8%), and Cleaning & Maintenance (21 | 1.9%).
Services Occupations by Sex
Within the Services occupations in Reynoldsville borough, the most male-oriented occupations are Food Preparation & Serving (50.6%), Healthcare Support (32.7%), and Cleaning & Maintenance (28.6%), while the most female-oriented occupations are Personal Care & Service (100.0%), Cleaning & Maintenance (71.4%), and Healthcare Support (67.3%).
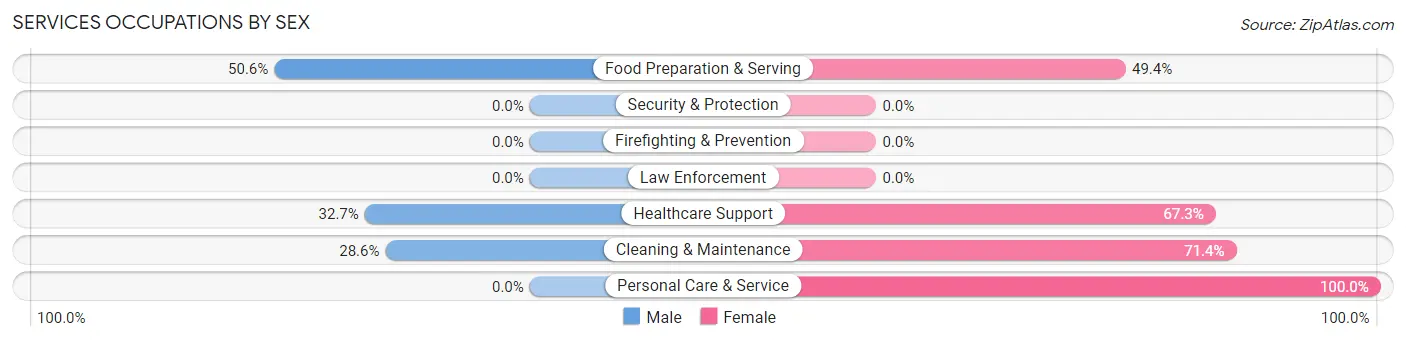
| Occupation | Male | Female |
| Healthcare Support | 33 (32.7%) | 68 (67.3%) |
| Security & Protection | 0 (0.0%) | 0 (0.0%) |
| Firefighting & Prevention | 0 (0.0%) | 0 (0.0%) |
| Law Enforcement | 0 (0.0%) | 0 (0.0%) |
| Food Preparation & Serving | 43 (50.6%) | 42 (49.4%) |
| Cleaning & Maintenance | 6 (28.6%) | 15 (71.4%) |
| Personal Care & Service | 0 (0.0%) | 31 (100.0%) |
| Total (Category) | 82 (34.4%) | 156 (65.5%) |
| Total (Overall) | 580 (52.6%) | 523 (47.4%) |
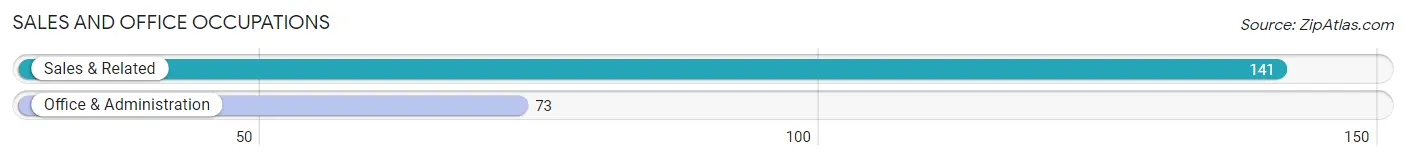
Sales and Office Occupations
The most common Sales and Office occupations in Reynoldsville borough are Sales & Related (141 | 12.8%), and Office & Administration (73 | 6.6%).
Sales and Office Occupations by Sex
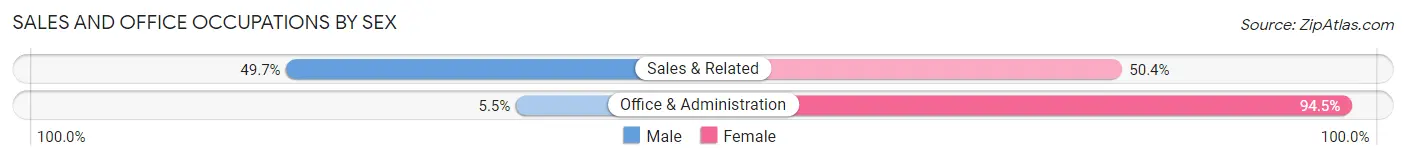
| Occupation | Male | Female |
| Sales & Related | 70 (49.6%) | 71 (50.3%) |
| Office & Administration | 4 (5.5%) | 69 (94.5%) |
| Total (Category) | 74 (34.6%) | 140 (65.4%) |
| Total (Overall) | 580 (52.6%) | 523 (47.4%) |
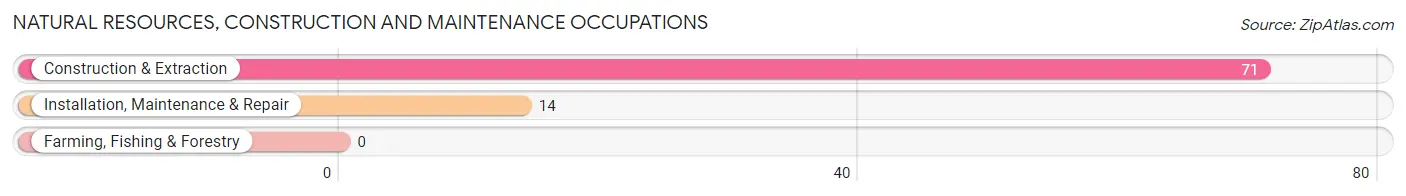
Natural Resources, Construction and Maintenance Occupations
The most common Natural Resources, Construction and Maintenance occupations in Reynoldsville borough are Construction & Extraction (71 | 6.4%), and Installation, Maintenance & Repair (14 | 1.3%).
Natural Resources, Construction and Maintenance Occupations by Sex
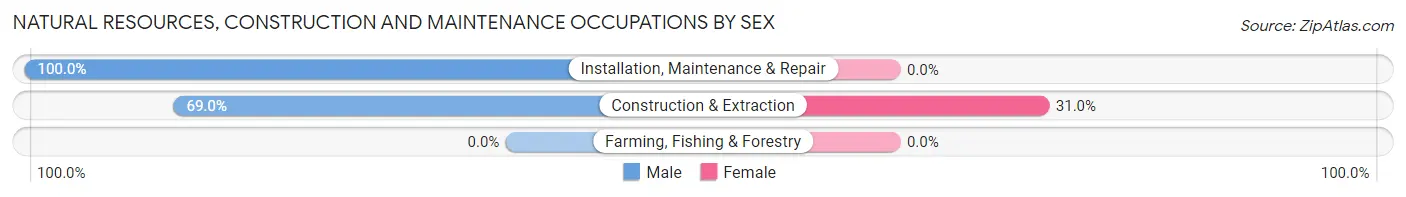
| Occupation | Male | Female |
| Farming, Fishing & Forestry | 0 (0.0%) | 0 (0.0%) |
| Construction & Extraction | 49 (69.0%) | 22 (31.0%) |
| Installation, Maintenance & Repair | 14 (100.0%) | 0 (0.0%) |
| Total (Category) | 63 (74.1%) | 22 (25.9%) |
| Total (Overall) | 580 (52.6%) | 523 (47.4%) |
Production, Transportation and Moving Occupations
The most common Production, Transportation and Moving occupations in Reynoldsville borough are Production (156 | 14.1%), Transportation (103 | 9.3%), and Material Moving (40 | 3.6%).
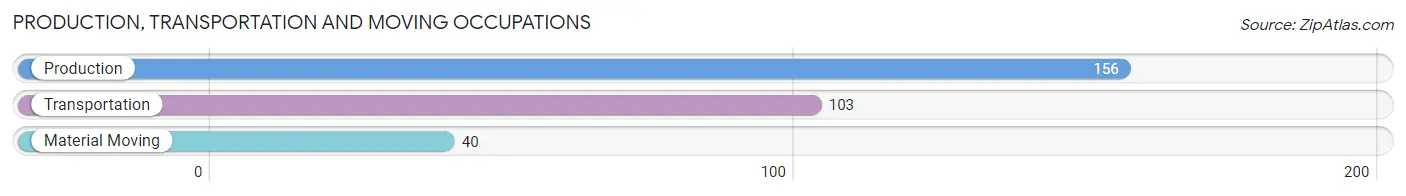
Production, Transportation and Moving Occupations by Sex
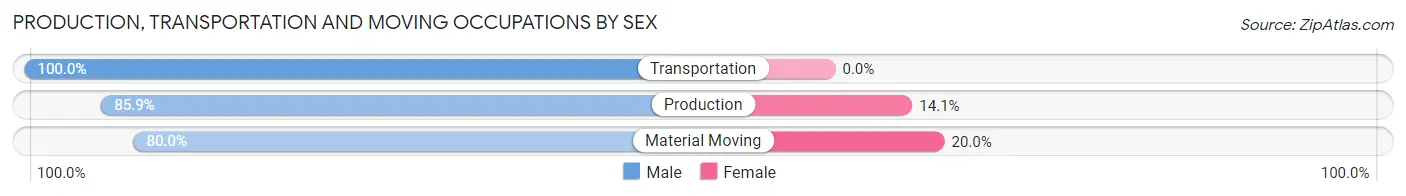
| Occupation | Male | Female |
| Production | 134 (85.9%) | 22 (14.1%) |
| Transportation | 103 (100.0%) | 0 (0.0%) |
| Material Moving | 32 (80.0%) | 8 (20.0%) |
| Total (Category) | 269 (90.0%) | 30 (10.0%) |
| Total (Overall) | 580 (52.6%) | 523 (47.4%) |
Employment Industries by Sex in Reynoldsville borough
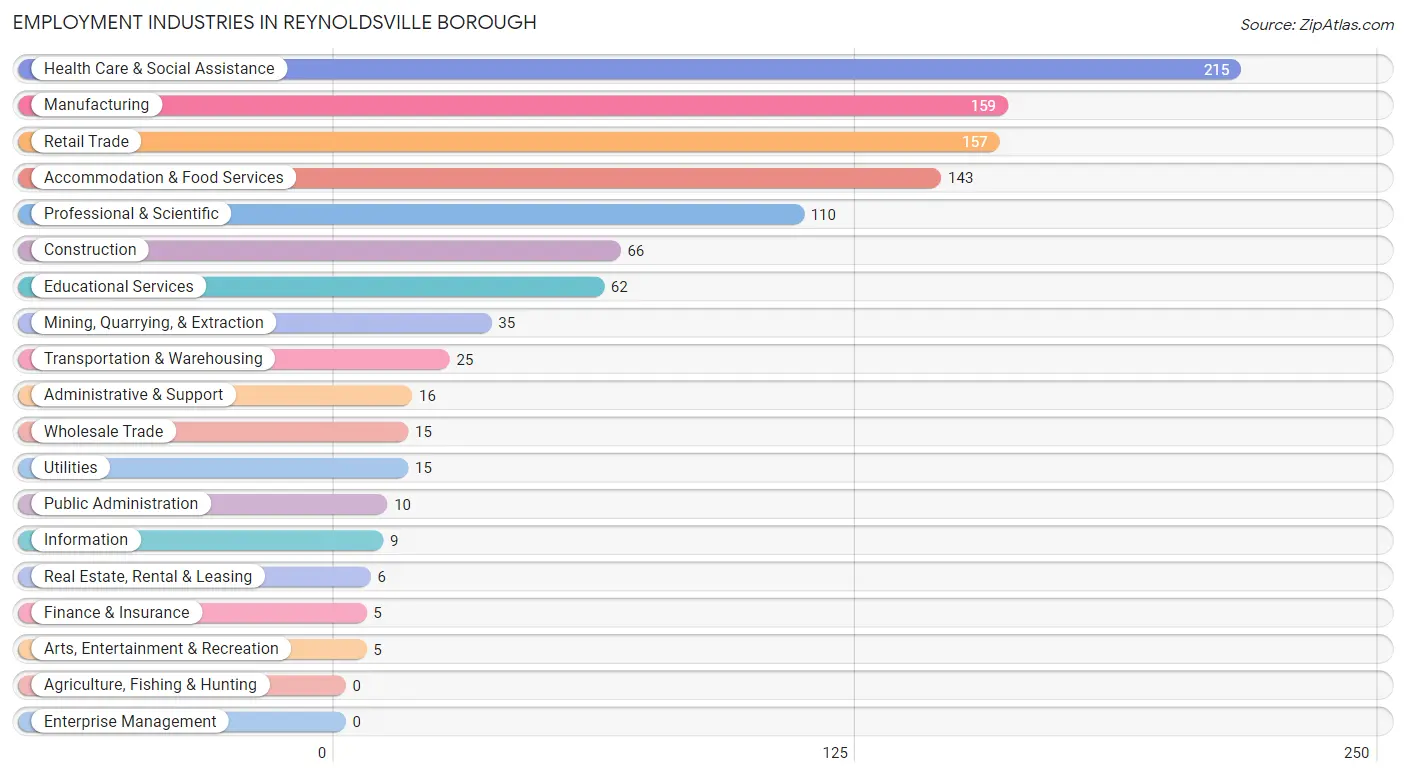
Employment Industries in Reynoldsville borough
The major employment industries in Reynoldsville borough include Health Care & Social Assistance (215 | 19.5%), Manufacturing (159 | 14.4%), Retail Trade (157 | 14.2%), Accommodation & Food Services (143 | 13.0%), and Professional & Scientific (110 | 10.0%).
Employment Industries by Sex in Reynoldsville borough
The Reynoldsville borough industries that see more men than women are Mining, Quarrying, & Extraction (100.0%), Wholesale Trade (100.0%), and Transportation & Warehousing (100.0%), whereas the industries that tend to have a higher number of women are Finance & Insurance (100.0%), Administrative & Support (100.0%), and Professional & Scientific (89.1%).
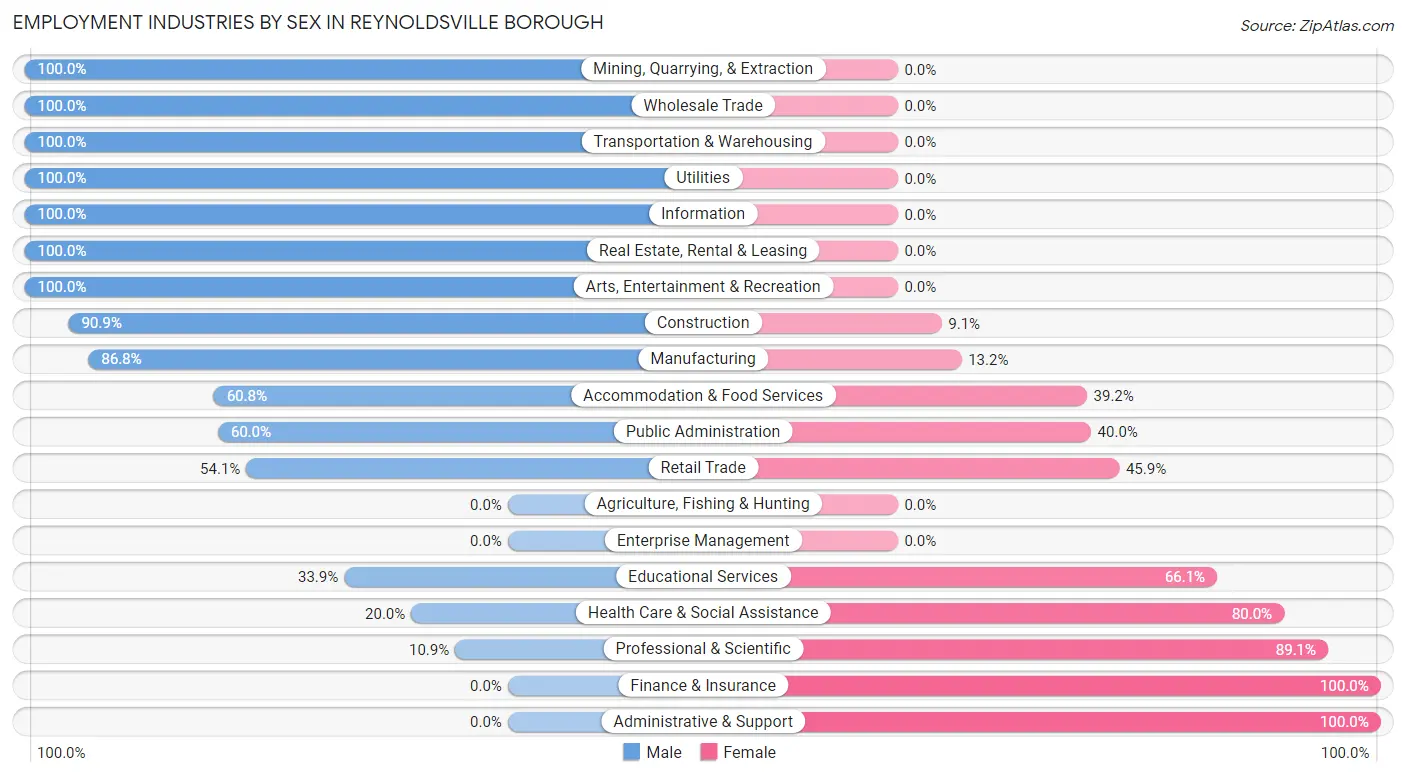
| Industry | Male | Female |
| Agriculture, Fishing & Hunting | 0 (0.0%) | 0 (0.0%) |
| Mining, Quarrying, & Extraction | 35 (100.0%) | 0 (0.0%) |
| Construction | 60 (90.9%) | 6 (9.1%) |
| Manufacturing | 138 (86.8%) | 21 (13.2%) |
| Wholesale Trade | 15 (100.0%) | 0 (0.0%) |
| Retail Trade | 85 (54.1%) | 72 (45.9%) |
| Transportation & Warehousing | 25 (100.0%) | 0 (0.0%) |
| Utilities | 15 (100.0%) | 0 (0.0%) |
| Information | 9 (100.0%) | 0 (0.0%) |
| Finance & Insurance | 0 (0.0%) | 5 (100.0%) |
| Real Estate, Rental & Leasing | 6 (100.0%) | 0 (0.0%) |
| Professional & Scientific | 12 (10.9%) | 98 (89.1%) |
| Enterprise Management | 0 (0.0%) | 0 (0.0%) |
| Administrative & Support | 0 (0.0%) | 16 (100.0%) |
| Educational Services | 21 (33.9%) | 41 (66.1%) |
| Health Care & Social Assistance | 43 (20.0%) | 172 (80.0%) |
| Arts, Entertainment & Recreation | 5 (100.0%) | 0 (0.0%) |
| Accommodation & Food Services | 87 (60.8%) | 56 (39.2%) |
| Public Administration | 6 (60.0%) | 4 (40.0%) |
| Total | 580 (52.6%) | 523 (47.4%) |
Education in Reynoldsville borough
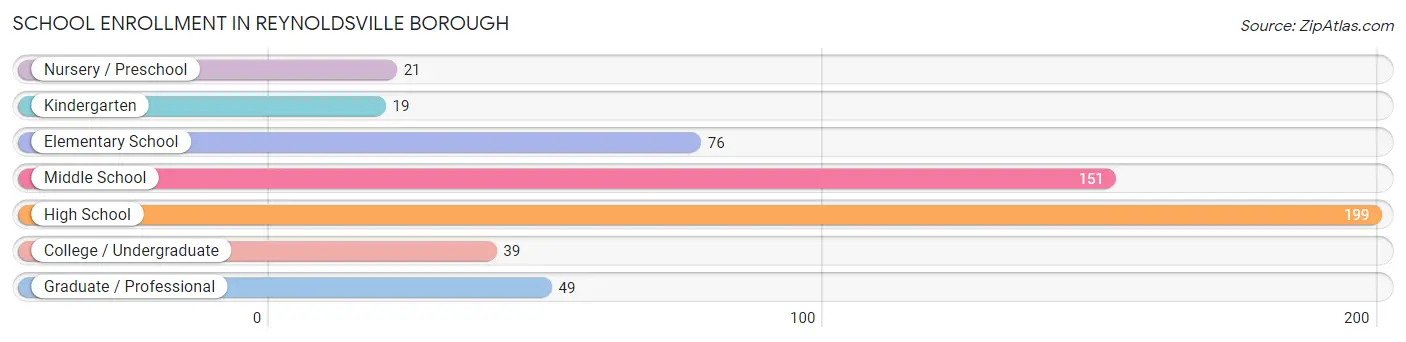
School Enrollment in Reynoldsville borough
The most common levels of schooling among the 554 students in Reynoldsville borough are high school (199 | 35.9%), middle school (151 | 27.3%), and elementary school (76 | 13.7%).
| School Level | # Students | % Students |
| Nursery / Preschool | 21 | 3.8% |
| Kindergarten | 19 | 3.4% |
| Elementary School | 76 | 13.7% |
| Middle School | 151 | 27.3% |
| High School | 199 | 35.9% |
| College / Undergraduate | 39 | 7.0% |
| Graduate / Professional | 49 | 8.8% |
| Total | 554 | 100.0% |
School Enrollment by Age by Funding Source in Reynoldsville borough
Out of a total of 554 students who are enrolled in schools in Reynoldsville borough, 62 (11.2%) attend a private institution, while the remaining 492 (88.8%) are enrolled in public schools. The age group of 20 to 24 year olds has the highest likelihood of being enrolled in private schools, with 22 (51.2% in the age bracket) enrolled. Conversely, the age group of 3 to 4 year olds has the lowest likelihood of being enrolled in a private school, with 4 (100.0% in the age bracket) attending a public institution.
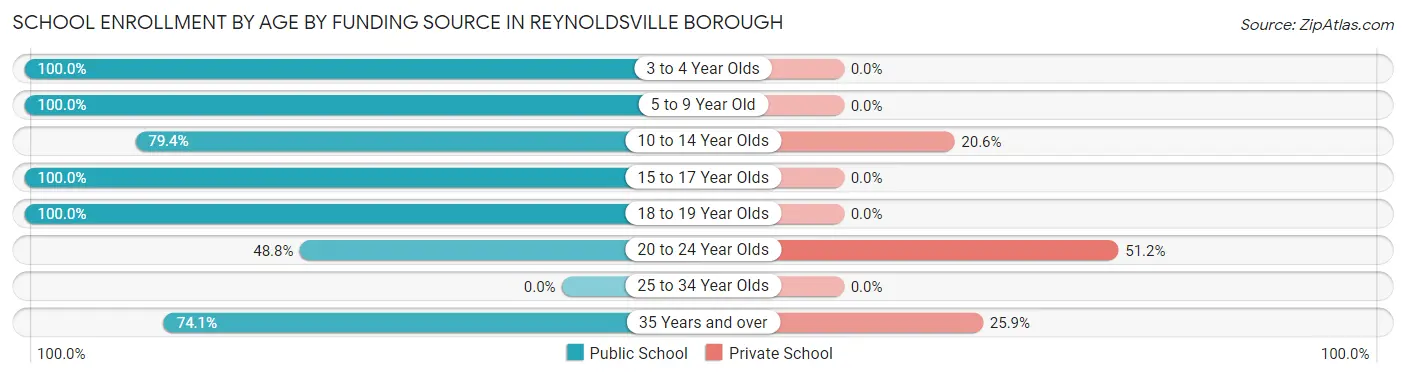
| Age Bracket | Public School | Private School |
| 3 to 4 Year Olds | 4 (100.0%) | 0 (0.0%) |
| 5 to 9 Year Old | 105 (100.0%) | 0 (0.0%) |
| 10 to 14 Year Olds | 127 (79.4%) | 33 (20.6%) |
| 15 to 17 Year Olds | 136 (100.0%) | 0 (0.0%) |
| 18 to 19 Year Olds | 79 (100.0%) | 0 (0.0%) |
| 20 to 24 Year Olds | 21 (48.8%) | 22 (51.2%) |
| 25 to 34 Year Olds | 0 (0.0%) | 0 (0.0%) |
| 35 Years and over | 20 (74.1%) | 7 (25.9%) |
| Total | 492 (88.8%) | 62 (11.2%) |
Educational Attainment by Field of Study in Reynoldsville borough
Business (51 | 27.7%), education (41 | 22.3%), arts & humanities (23 | 12.5%), science & technology (19 | 10.3%), and psychology (18 | 9.8%) are the most common fields of study among 184 individuals in Reynoldsville borough who have obtained a bachelor's degree or higher.
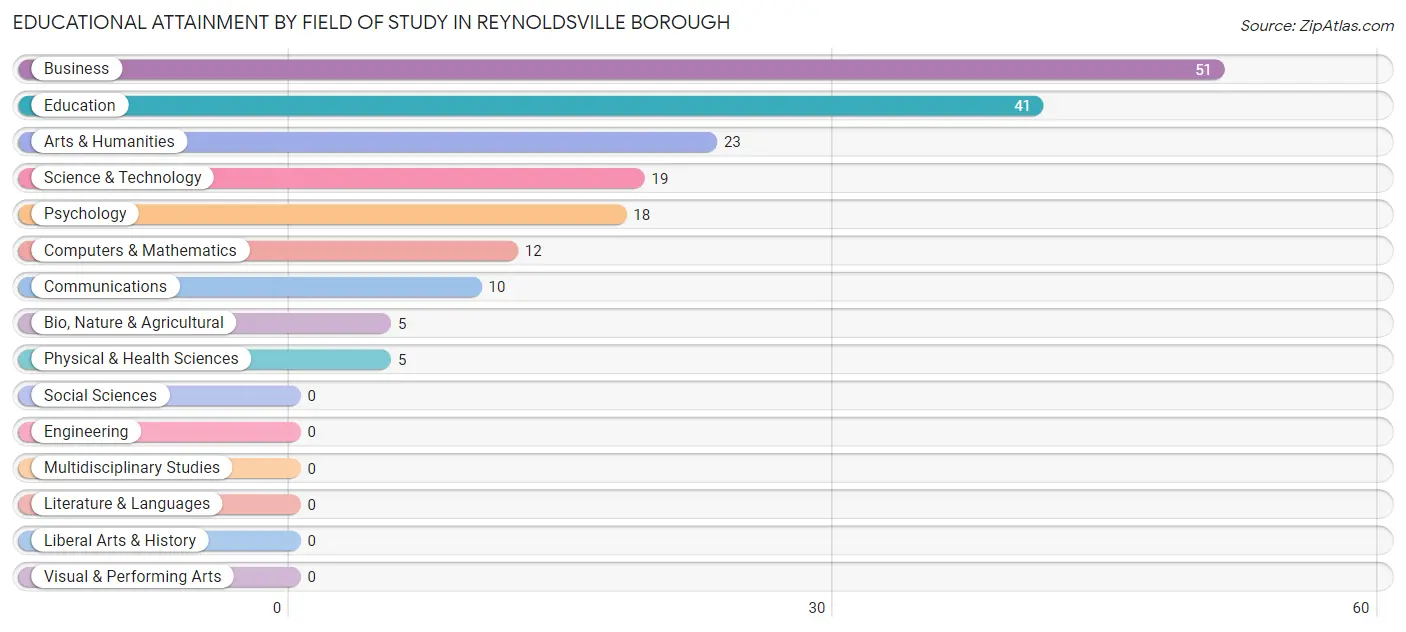
| Field of Study | # Graduates | % Graduates |
| Computers & Mathematics | 12 | 6.5% |
| Bio, Nature & Agricultural | 5 | 2.7% |
| Physical & Health Sciences | 5 | 2.7% |
| Psychology | 18 | 9.8% |
| Social Sciences | 0 | 0.0% |
| Engineering | 0 | 0.0% |
| Multidisciplinary Studies | 0 | 0.0% |
| Science & Technology | 19 | 10.3% |
| Business | 51 | 27.7% |
| Education | 41 | 22.3% |
| Literature & Languages | 0 | 0.0% |
| Liberal Arts & History | 0 | 0.0% |
| Visual & Performing Arts | 0 | 0.0% |
| Communications | 10 | 5.4% |
| Arts & Humanities | 23 | 12.5% |
| Total | 184 | 100.0% |
Transportation & Commute in Reynoldsville borough
Vehicle Availability by Sex in Reynoldsville borough
The most prevalent vehicle ownership categories in Reynoldsville borough are males with 2 vehicles (223, accounting for 41.2%) and females with 2 vehicles (239, making up 44.4%).
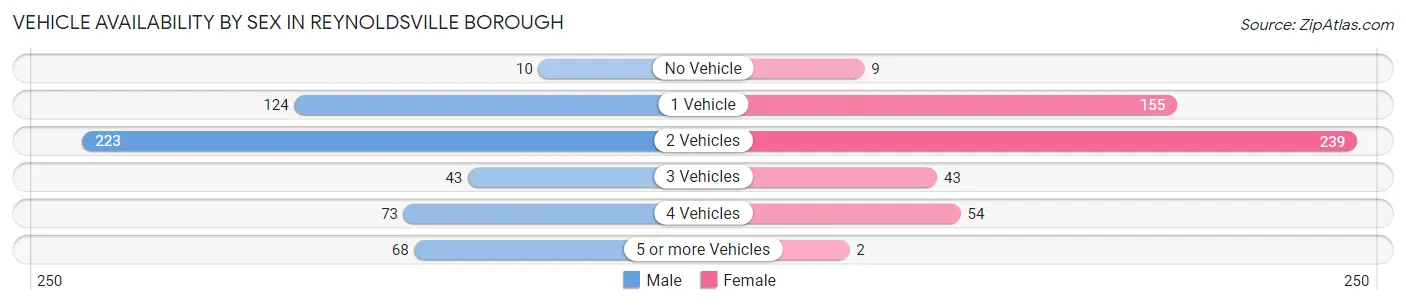
| Vehicles Available | Male | Female |
| No Vehicle | 10 (1.8%) | 9 (1.8%) |
| 1 Vehicle | 124 (22.9%) | 155 (30.9%) |
| 2 Vehicles | 223 (41.2%) | 239 (47.6%) |
| 3 Vehicles | 43 (8.0%) | 43 (8.6%) |
| 4 Vehicles | 73 (13.5%) | 54 (10.8%) |
| 5 or more Vehicles | 68 (12.6%) | 2 (0.4%) |
| Total | 541 (100.0%) | 502 (100.0%) |
Commute Time in Reynoldsville borough
The most frequently occuring commute durations in Reynoldsville borough are 20 to 24 minutes (286 commuters, 29.7%), 10 to 14 minutes (161 commuters, 16.7%), and 5 to 9 minutes (119 commuters, 12.4%).
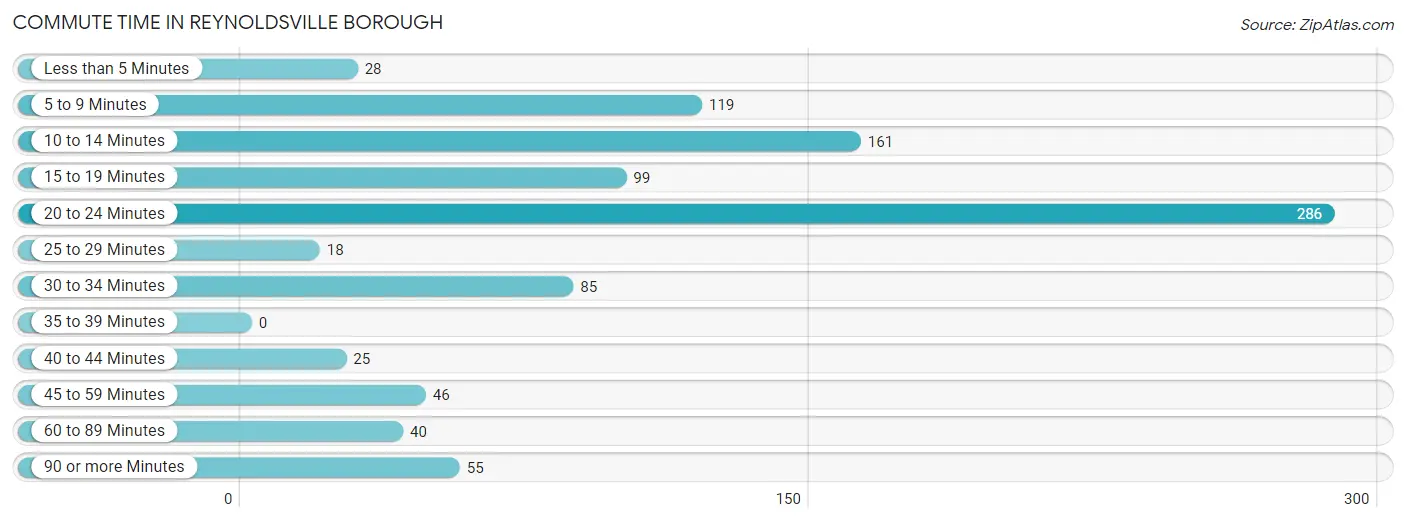
| Commute Time | # Commuters | % Commuters |
| Less than 5 Minutes | 28 | 2.9% |
| 5 to 9 Minutes | 119 | 12.4% |
| 10 to 14 Minutes | 161 | 16.7% |
| 15 to 19 Minutes | 99 | 10.3% |
| 20 to 24 Minutes | 286 | 29.7% |
| 25 to 29 Minutes | 18 | 1.9% |
| 30 to 34 Minutes | 85 | 8.8% |
| 35 to 39 Minutes | 0 | 0.0% |
| 40 to 44 Minutes | 25 | 2.6% |
| 45 to 59 Minutes | 46 | 4.8% |
| 60 to 89 Minutes | 40 | 4.2% |
| 90 or more Minutes | 55 | 5.7% |
Commute Time by Sex in Reynoldsville borough
The most common commute times in Reynoldsville borough are 20 to 24 minutes (140 commuters, 26.5%) for males and 20 to 24 minutes (146 commuters, 33.7%) for females.
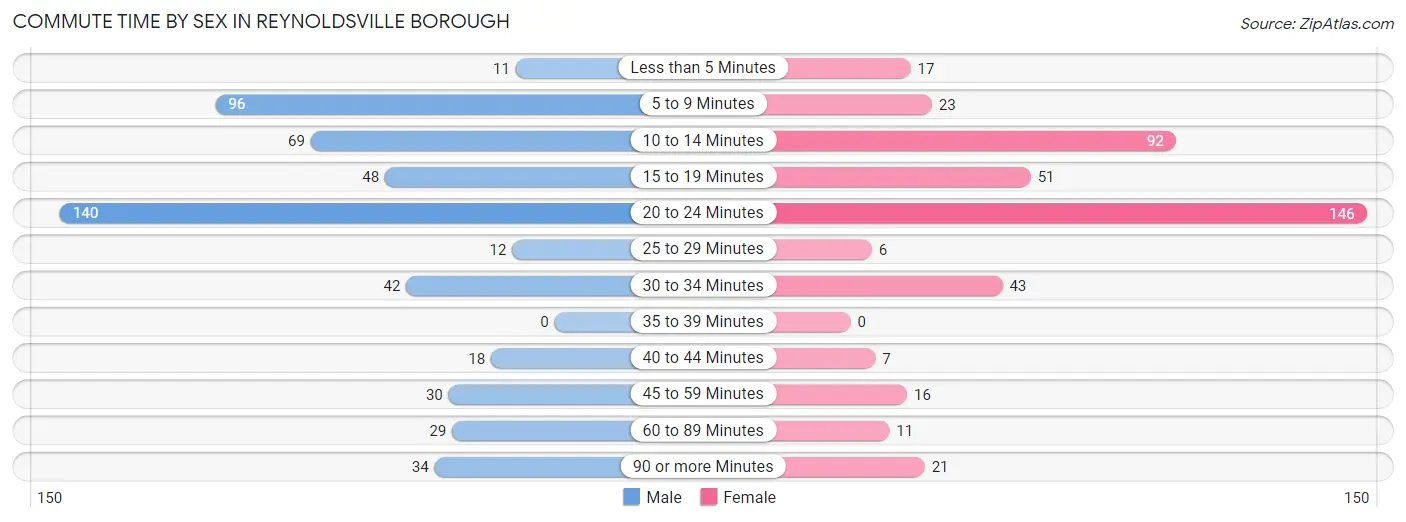
| Commute Time | Male | Female |
| Less than 5 Minutes | 11 (2.1%) | 17 (3.9%) |
| 5 to 9 Minutes | 96 (18.1%) | 23 (5.3%) |
| 10 to 14 Minutes | 69 (13.0%) | 92 (21.2%) |
| 15 to 19 Minutes | 48 (9.1%) | 51 (11.8%) |
| 20 to 24 Minutes | 140 (26.5%) | 146 (33.7%) |
| 25 to 29 Minutes | 12 (2.3%) | 6 (1.4%) |
| 30 to 34 Minutes | 42 (7.9%) | 43 (9.9%) |
| 35 to 39 Minutes | 0 (0.0%) | 0 (0.0%) |
| 40 to 44 Minutes | 18 (3.4%) | 7 (1.6%) |
| 45 to 59 Minutes | 30 (5.7%) | 16 (3.7%) |
| 60 to 89 Minutes | 29 (5.5%) | 11 (2.5%) |
| 90 or more Minutes | 34 (6.4%) | 21 (4.9%) |
Time of Departure to Work by Sex in Reynoldsville borough
The most frequent times of departure to work in Reynoldsville borough are 4:00 PM to 11:59 PM (89, 16.8%) for males and 5:30 AM to 5:59 AM (51, 11.8%) for females.
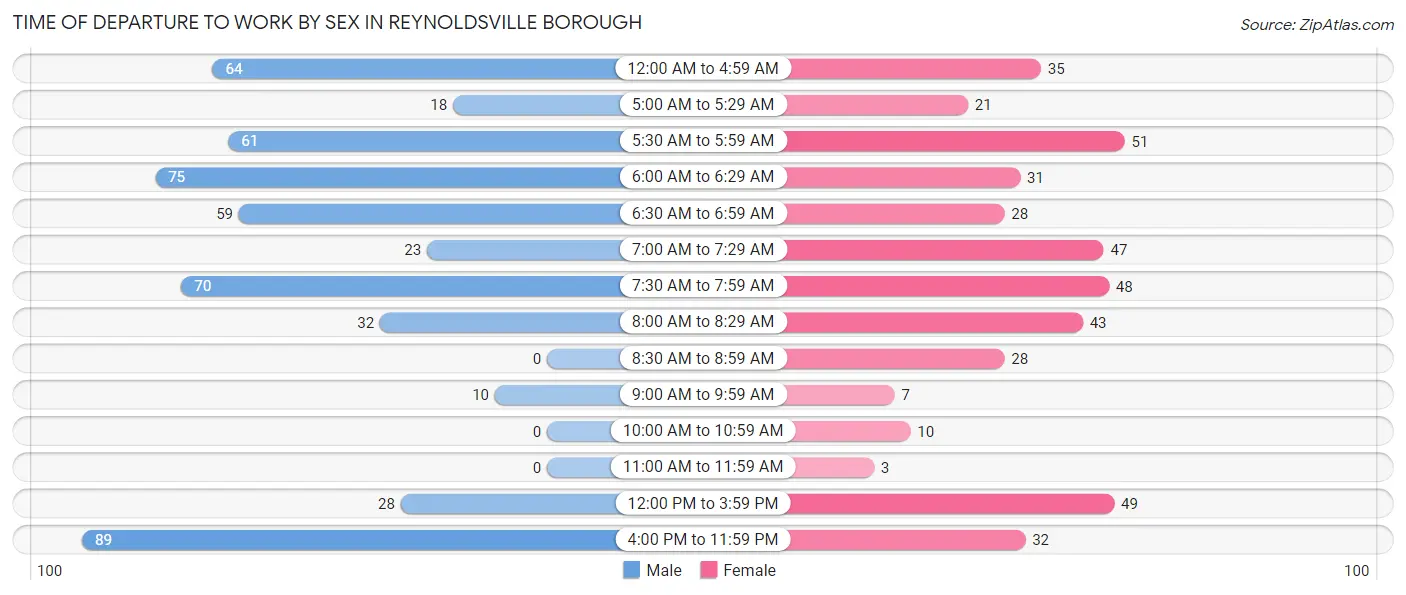
| Time of Departure | Male | Female |
| 12:00 AM to 4:59 AM | 64 (12.1%) | 35 (8.1%) |
| 5:00 AM to 5:29 AM | 18 (3.4%) | 21 (4.9%) |
| 5:30 AM to 5:59 AM | 61 (11.5%) | 51 (11.8%) |
| 6:00 AM to 6:29 AM | 75 (14.2%) | 31 (7.2%) |
| 6:30 AM to 6:59 AM | 59 (11.2%) | 28 (6.5%) |
| 7:00 AM to 7:29 AM | 23 (4.3%) | 47 (10.8%) |
| 7:30 AM to 7:59 AM | 70 (13.2%) | 48 (11.1%) |
| 8:00 AM to 8:29 AM | 32 (6.0%) | 43 (9.9%) |
| 8:30 AM to 8:59 AM | 0 (0.0%) | 28 (6.5%) |
| 9:00 AM to 9:59 AM | 10 (1.9%) | 7 (1.6%) |
| 10:00 AM to 10:59 AM | 0 (0.0%) | 10 (2.3%) |
| 11:00 AM to 11:59 AM | 0 (0.0%) | 3 (0.7%) |
| 12:00 PM to 3:59 PM | 28 (5.3%) | 49 (11.3%) |
| 4:00 PM to 11:59 PM | 89 (16.8%) | 32 (7.4%) |
| Total | 529 (100.0%) | 433 (100.0%) |
Housing Occupancy in Reynoldsville borough
Occupancy by Ownership in Reynoldsville borough
Of the total 1,029 dwellings in Reynoldsville borough, owner-occupied units account for 534 (51.9%), while renter-occupied units make up 495 (48.1%).
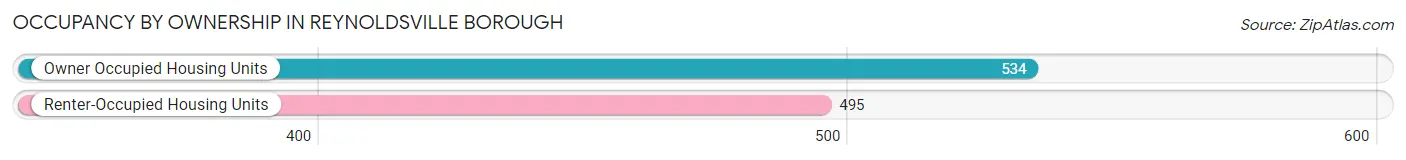
| Occupancy | # Housing Units | % Housing Units |
| Owner Occupied Housing Units | 534 | 51.9% |
| Renter-Occupied Housing Units | 495 | 48.1% |
| Total Occupied Housing Units | 1,029 | 100.0% |
Occupancy by Household Size in Reynoldsville borough
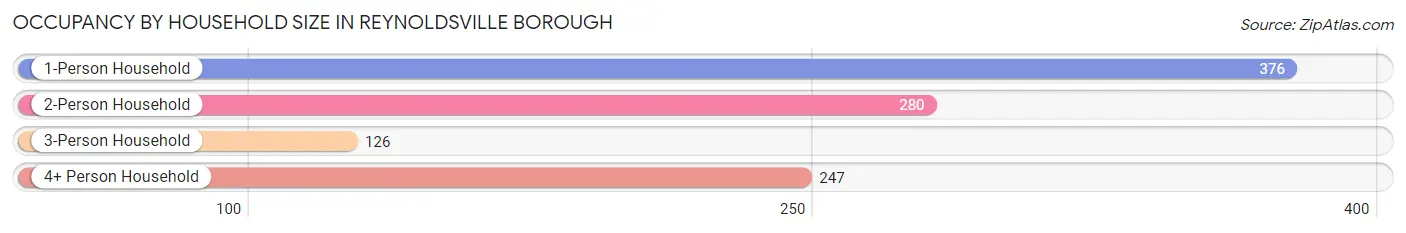
| Household Size | # Housing Units | % Housing Units |
| 1-Person Household | 376 | 36.5% |
| 2-Person Household | 280 | 27.2% |
| 3-Person Household | 126 | 12.2% |
| 4+ Person Household | 247 | 24.0% |
| Total Housing Units | 1,029 | 100.0% |
Occupancy by Ownership by Household Size in Reynoldsville borough
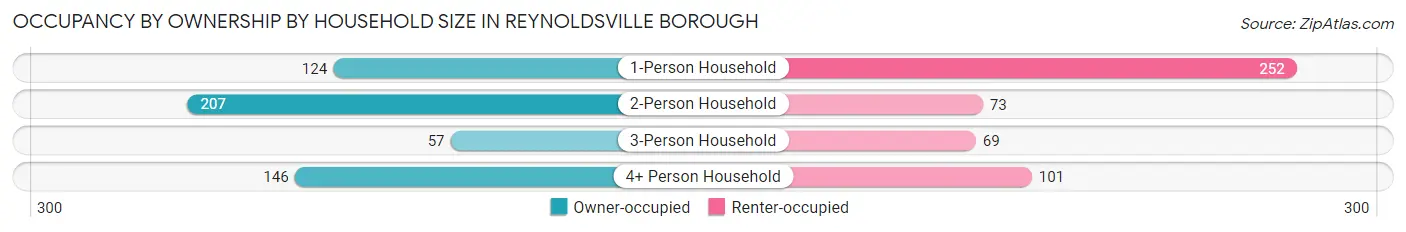
| Household Size | Owner-occupied | Renter-occupied |
| 1-Person Household | 124 (33.0%) | 252 (67.0%) |
| 2-Person Household | 207 (73.9%) | 73 (26.1%) |
| 3-Person Household | 57 (45.2%) | 69 (54.8%) |
| 4+ Person Household | 146 (59.1%) | 101 (40.9%) |
| Total Housing Units | 534 (51.9%) | 495 (48.1%) |
Occupancy by Educational Attainment in Reynoldsville borough
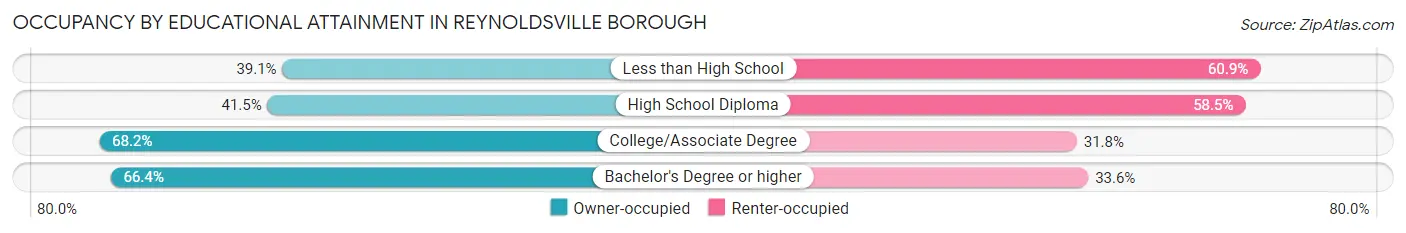
| Household Size | Owner-occupied | Renter-occupied |
| Less than High School | 52 (39.1%) | 81 (60.9%) |
| High School Diploma | 197 (41.5%) | 278 (58.5%) |
| College/Associate Degree | 210 (68.2%) | 98 (31.8%) |
| Bachelor's Degree or higher | 75 (66.4%) | 38 (33.6%) |
Occupancy by Age of Householder in Reynoldsville borough
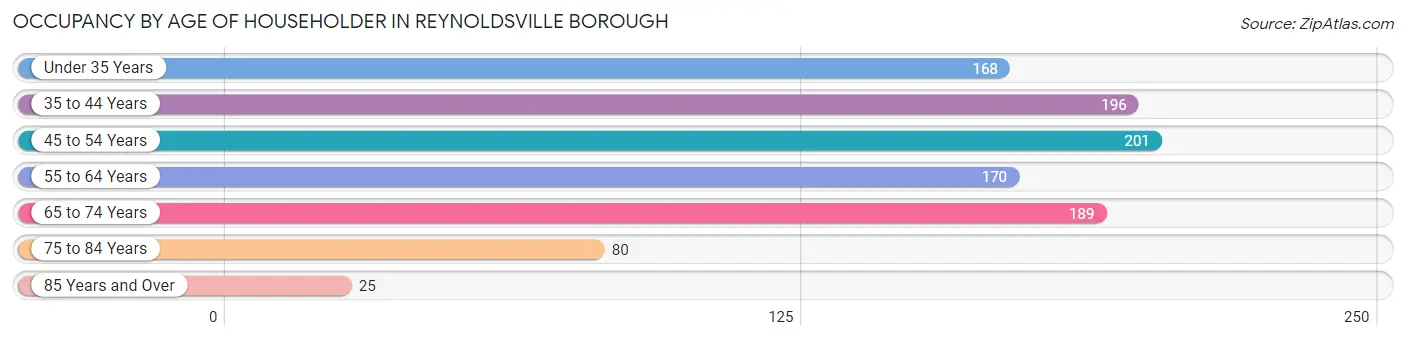
| Age Bracket | # Households | % Households |
| Under 35 Years | 168 | 16.3% |
| 35 to 44 Years | 196 | 19.1% |
| 45 to 54 Years | 201 | 19.5% |
| 55 to 64 Years | 170 | 16.5% |
| 65 to 74 Years | 189 | 18.4% |
| 75 to 84 Years | 80 | 7.8% |
| 85 Years and Over | 25 | 2.4% |
| Total | 1,029 | 100.0% |
Housing Finances in Reynoldsville borough
Median Income by Occupancy in Reynoldsville borough
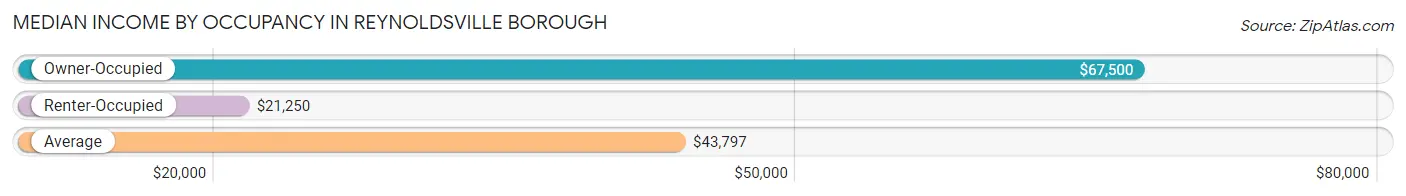
| Occupancy Type | # Households | Median Income |
| Owner-Occupied | 534 (51.9%) | $67,500 |
| Renter-Occupied | 495 (48.1%) | $21,250 |
| Average | 1,029 (100.0%) | $43,797 |
Occupancy by Householder Income Bracket in Reynoldsville borough
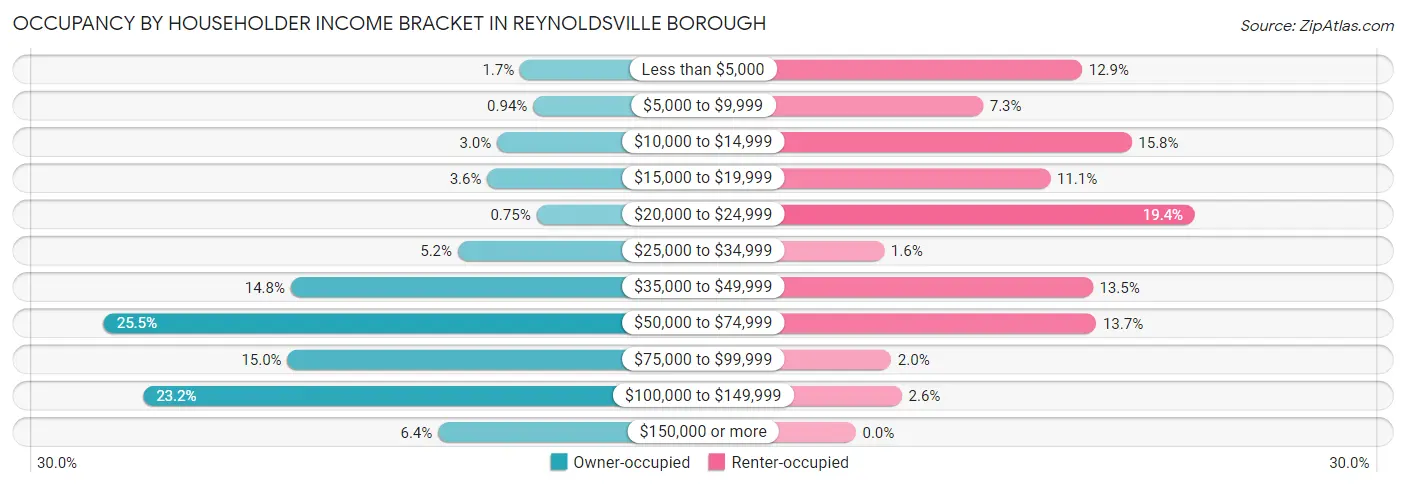
| Income Bracket | Owner-occupied | Renter-occupied |
| Less than $5,000 | 9 (1.7%) | 64 (12.9%) |
| $5,000 to $9,999 | 5 (0.9%) | 36 (7.3%) |
| $10,000 to $14,999 | 16 (3.0%) | 78 (15.8%) |
| $15,000 to $19,999 | 19 (3.6%) | 55 (11.1%) |
| $20,000 to $24,999 | 4 (0.7%) | 96 (19.4%) |
| $25,000 to $34,999 | 28 (5.2%) | 8 (1.6%) |
| $35,000 to $49,999 | 79 (14.8%) | 67 (13.5%) |
| $50,000 to $74,999 | 136 (25.5%) | 68 (13.7%) |
| $75,000 to $99,999 | 80 (15.0%) | 10 (2.0%) |
| $100,000 to $149,999 | 124 (23.2%) | 13 (2.6%) |
| $150,000 or more | 34 (6.4%) | 0 (0.0%) |
| Total | 534 (100.0%) | 495 (100.0%) |
Monthly Housing Cost Tiers in Reynoldsville borough
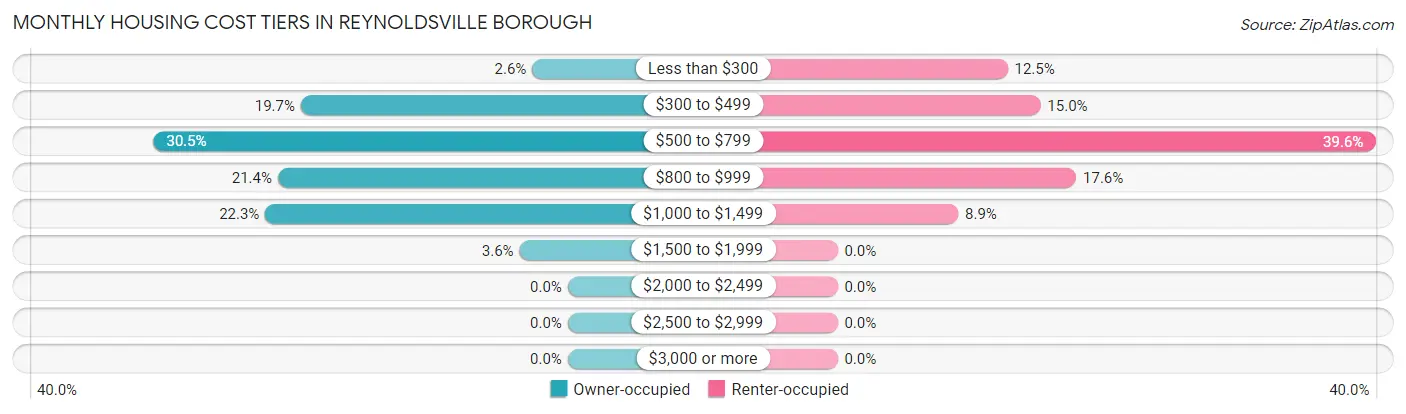
| Monthly Cost | Owner-occupied | Renter-occupied |
| Less than $300 | 14 (2.6%) | 62 (12.5%) |
| $300 to $499 | 105 (19.7%) | 74 (14.9%) |
| $500 to $799 | 163 (30.5%) | 196 (39.6%) |
| $800 to $999 | 114 (21.3%) | 87 (17.6%) |
| $1,000 to $1,499 | 119 (22.3%) | 44 (8.9%) |
| $1,500 to $1,999 | 19 (3.6%) | 0 (0.0%) |
| $2,000 to $2,499 | 0 (0.0%) | 0 (0.0%) |
| $2,500 to $2,999 | 0 (0.0%) | 0 (0.0%) |
| $3,000 or more | 0 (0.0%) | 0 (0.0%) |
| Total | 534 (100.0%) | 495 (100.0%) |
Physical Housing Characteristics in Reynoldsville borough
Housing Structures in Reynoldsville borough
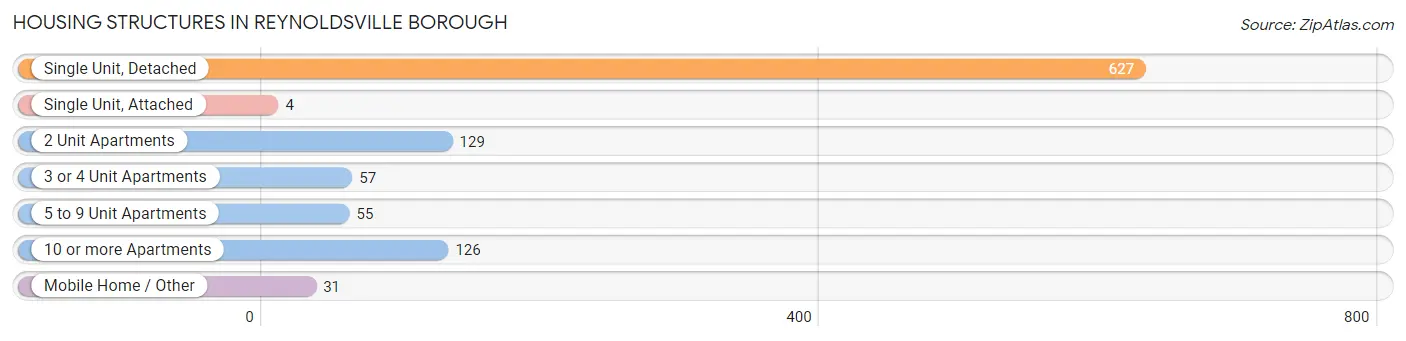
| Structure Type | # Housing Units | % Housing Units |
| Single Unit, Detached | 627 | 60.9% |
| Single Unit, Attached | 4 | 0.4% |
| 2 Unit Apartments | 129 | 12.5% |
| 3 or 4 Unit Apartments | 57 | 5.5% |
| 5 to 9 Unit Apartments | 55 | 5.3% |
| 10 or more Apartments | 126 | 12.2% |
| Mobile Home / Other | 31 | 3.0% |
| Total | 1,029 | 100.0% |
Housing Structures by Occupancy in Reynoldsville borough
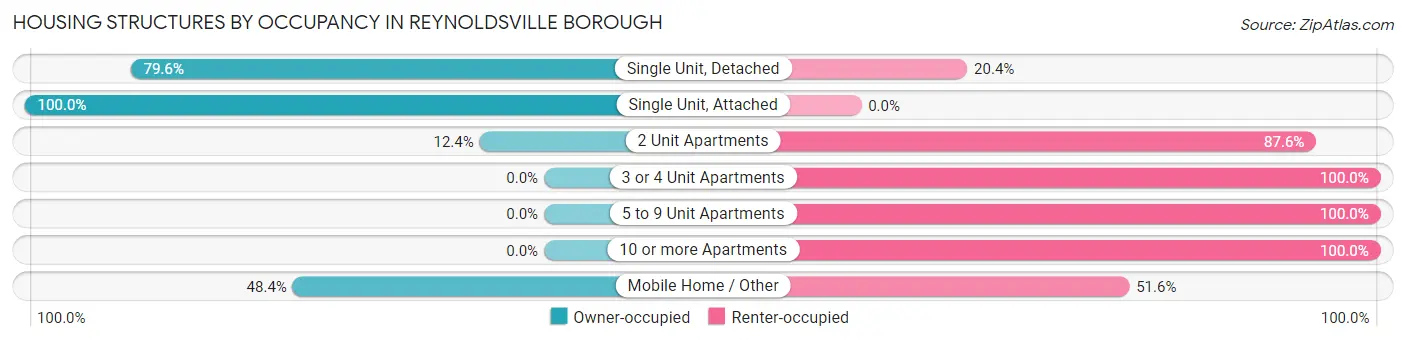
| Structure Type | Owner-occupied | Renter-occupied |
| Single Unit, Detached | 499 (79.6%) | 128 (20.4%) |
| Single Unit, Attached | 4 (100.0%) | 0 (0.0%) |
| 2 Unit Apartments | 16 (12.4%) | 113 (87.6%) |
| 3 or 4 Unit Apartments | 0 (0.0%) | 57 (100.0%) |
| 5 to 9 Unit Apartments | 0 (0.0%) | 55 (100.0%) |
| 10 or more Apartments | 0 (0.0%) | 126 (100.0%) |
| Mobile Home / Other | 15 (48.4%) | 16 (51.6%) |
| Total | 534 (51.9%) | 495 (48.1%) |
Housing Structures by Number of Rooms in Reynoldsville borough
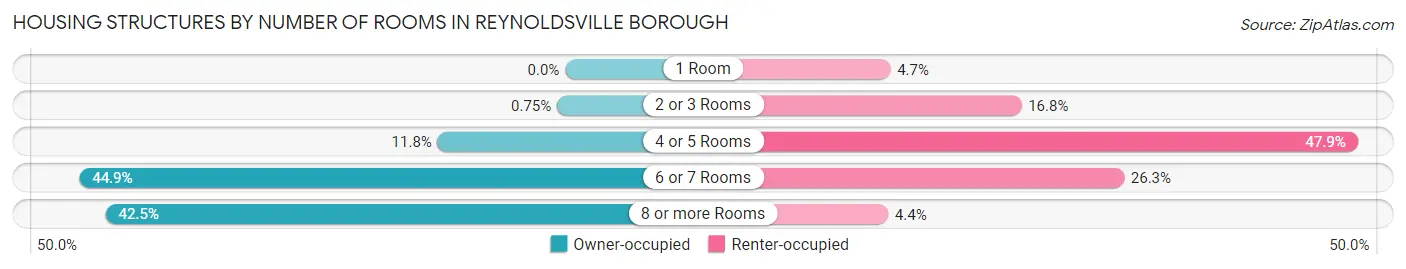
| Number of Rooms | Owner-occupied | Renter-occupied |
| 1 Room | 0 (0.0%) | 23 (4.6%) |
| 2 or 3 Rooms | 4 (0.7%) | 83 (16.8%) |
| 4 or 5 Rooms | 63 (11.8%) | 237 (47.9%) |
| 6 or 7 Rooms | 240 (44.9%) | 130 (26.3%) |
| 8 or more Rooms | 227 (42.5%) | 22 (4.4%) |
| Total | 534 (100.0%) | 495 (100.0%) |
Housing Structure by Heating Type in Reynoldsville borough
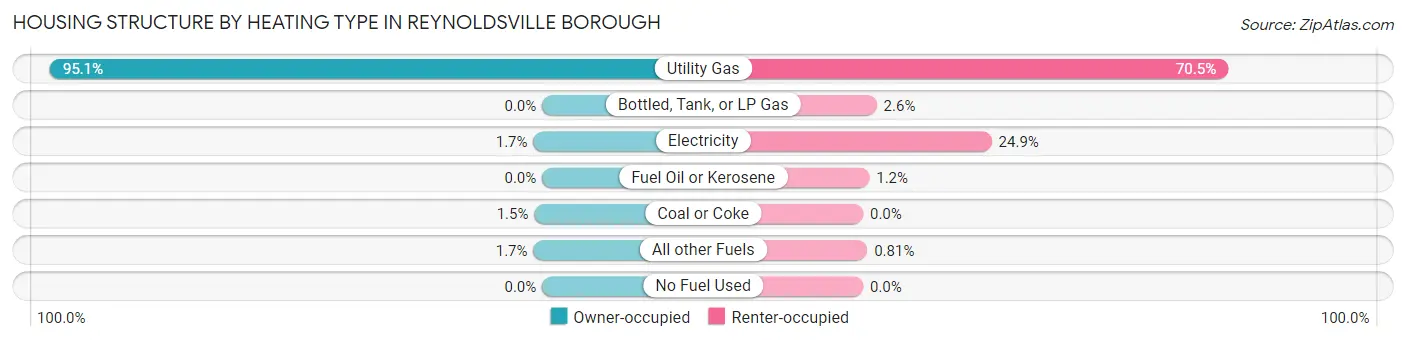
| Heating Type | Owner-occupied | Renter-occupied |
| Utility Gas | 508 (95.1%) | 349 (70.5%) |
| Bottled, Tank, or LP Gas | 0 (0.0%) | 13 (2.6%) |
| Electricity | 9 (1.7%) | 123 (24.8%) |
| Fuel Oil or Kerosene | 0 (0.0%) | 6 (1.2%) |
| Coal or Coke | 8 (1.5%) | 0 (0.0%) |
| All other Fuels | 9 (1.7%) | 4 (0.8%) |
| No Fuel Used | 0 (0.0%) | 0 (0.0%) |
| Total | 534 (100.0%) | 495 (100.0%) |
Household Vehicle Usage in Reynoldsville borough
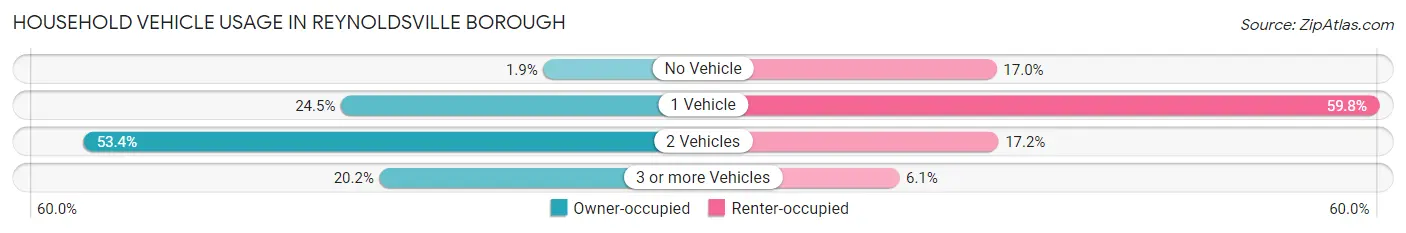
| Vehicles per Household | Owner-occupied | Renter-occupied |
| No Vehicle | 10 (1.9%) | 84 (17.0%) |
| 1 Vehicle | 131 (24.5%) | 296 (59.8%) |
| 2 Vehicles | 285 (53.4%) | 85 (17.2%) |
| 3 or more Vehicles | 108 (20.2%) | 30 (6.1%) |
| Total | 534 (100.0%) | 495 (100.0%) |
Real Estate & Mortgages in Reynoldsville borough
Real Estate and Mortgage Overview in Reynoldsville borough
| Characteristic | Without Mortgage | With Mortgage |
| Housing Units | 216 | 318 |
| Median Property Value | $89,400 | $87,200 |
| Median Household Income | $51,786 | $22 |
| Monthly Housing Costs | $469 | $0 |
| Real Estate Taxes | $1,153 | $11 |
Property Value by Mortgage Status in Reynoldsville borough
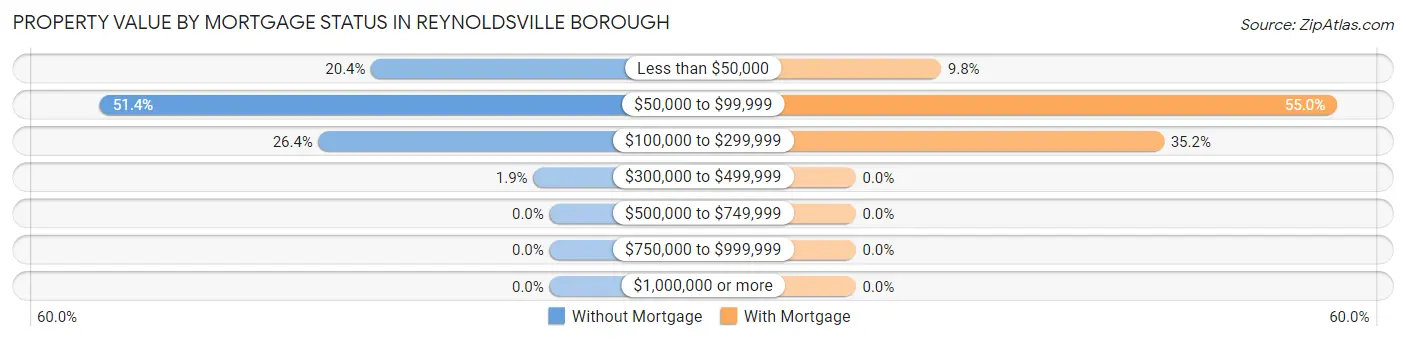
| Property Value | Without Mortgage | With Mortgage |
| Less than $50,000 | 44 (20.4%) | 31 (9.8%) |
| $50,000 to $99,999 | 111 (51.4%) | 175 (55.0%) |
| $100,000 to $299,999 | 57 (26.4%) | 112 (35.2%) |
| $300,000 to $499,999 | 4 (1.8%) | 0 (0.0%) |
| $500,000 to $749,999 | 0 (0.0%) | 0 (0.0%) |
| $750,000 to $999,999 | 0 (0.0%) | 0 (0.0%) |
| $1,000,000 or more | 0 (0.0%) | 0 (0.0%) |
| Total | 216 (100.0%) | 318 (100.0%) |
Household Income by Mortgage Status in Reynoldsville borough
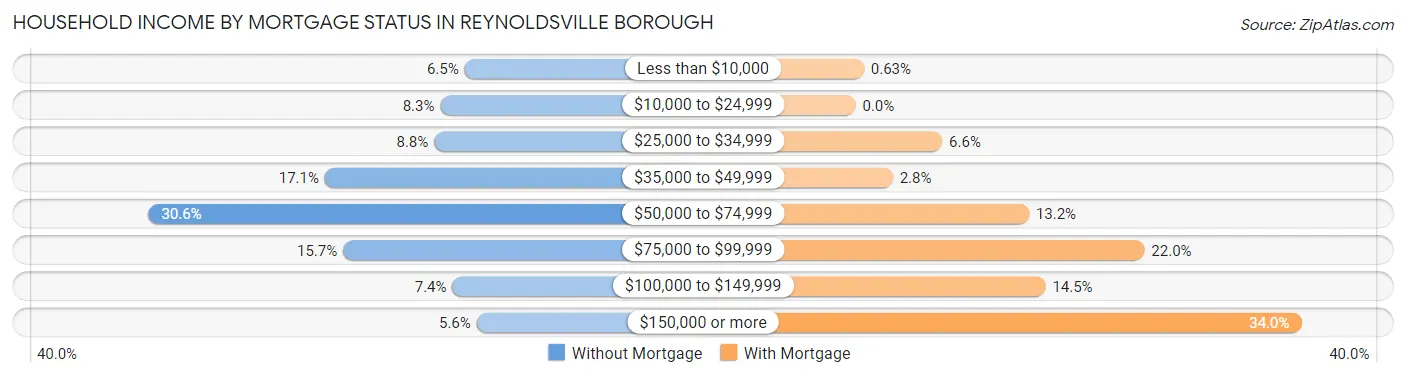
| Household Income | Without Mortgage | With Mortgage |
| Less than $10,000 | 14 (6.5%) | 2 (0.6%) |
| $10,000 to $24,999 | 18 (8.3%) | 0 (0.0%) |
| $25,000 to $34,999 | 19 (8.8%) | 21 (6.6%) |
| $35,000 to $49,999 | 37 (17.1%) | 9 (2.8%) |
| $50,000 to $74,999 | 66 (30.6%) | 42 (13.2%) |
| $75,000 to $99,999 | 34 (15.7%) | 70 (22.0%) |
| $100,000 to $149,999 | 16 (7.4%) | 46 (14.5%) |
| $150,000 or more | 12 (5.6%) | 108 (34.0%) |
| Total | 216 (100.0%) | 318 (100.0%) |
Property Value to Household Income Ratio in Reynoldsville borough
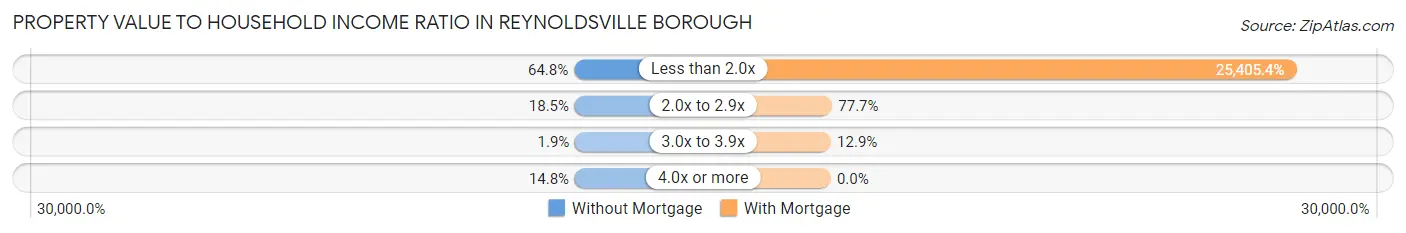
| Value-to-Income Ratio | Without Mortgage | With Mortgage |
| Less than 2.0x | 140 (64.8%) | 80,789 (25,405.4%) |
| 2.0x to 2.9x | 40 (18.5%) | 247 (77.7%) |
| 3.0x to 3.9x | 4 (1.8%) | 41 (12.9%) |
| 4.0x or more | 32 (14.8%) | 0 (0.0%) |
| Total | 216 (100.0%) | 318 (100.0%) |
Real Estate Taxes by Mortgage Status in Reynoldsville borough
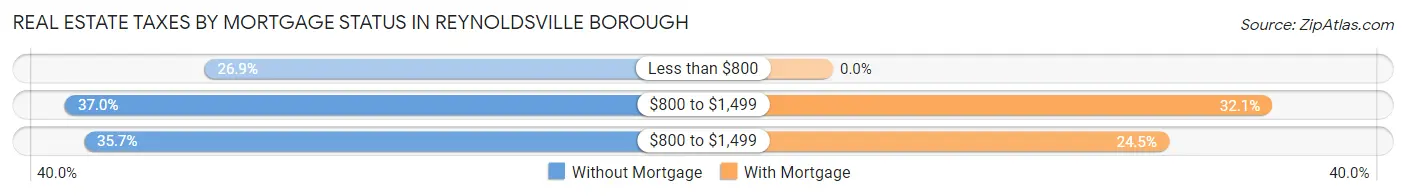
| Property Taxes | Without Mortgage | With Mortgage |
| Less than $800 | 58 (26.9%) | 0 (0.0%) |
| $800 to $1,499 | 80 (37.0%) | 102 (32.1%) |
| $800 to $1,499 | 77 (35.6%) | 78 (24.5%) |
| Total | 216 (100.0%) | 318 (100.0%) |
Health & Disability in Reynoldsville borough
Health Insurance Coverage by Age in Reynoldsville borough
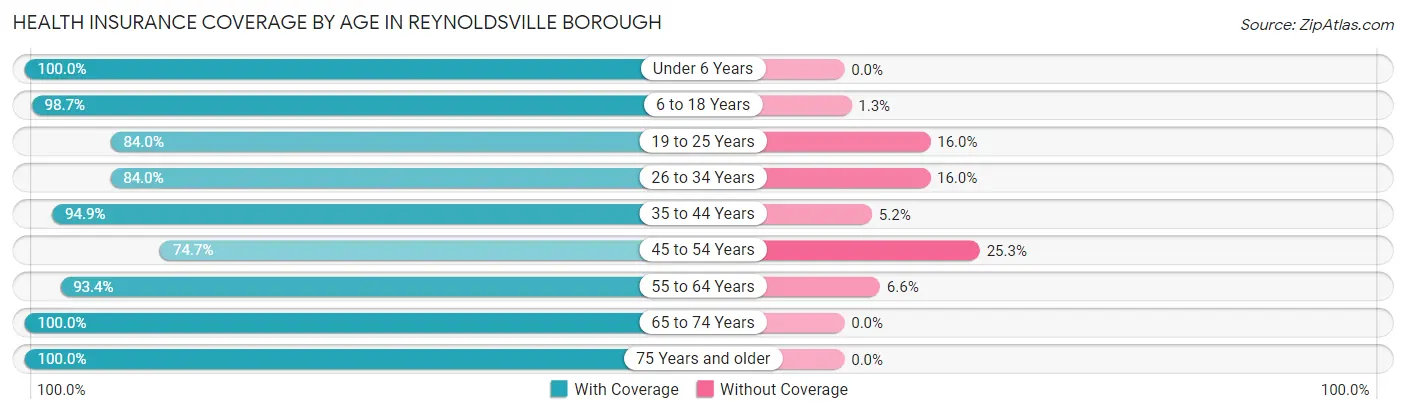
| Age Bracket | With Coverage | Without Coverage |
| Under 6 Years | 234 (100.0%) | 0 (0.0%) |
| 6 to 18 Years | 449 (98.7%) | 6 (1.3%) |
| 19 to 25 Years | 199 (84.0%) | 38 (16.0%) |
| 26 to 34 Years | 247 (84.0%) | 47 (16.0%) |
| 35 to 44 Years | 258 (94.9%) | 14 (5.1%) |
| 45 to 54 Years | 287 (74.7%) | 97 (25.3%) |
| 55 to 64 Years | 239 (93.4%) | 17 (6.6%) |
| 65 to 74 Years | 269 (100.0%) | 0 (0.0%) |
| 75 Years and older | 150 (100.0%) | 0 (0.0%) |
| Total | 2,332 (91.4%) | 219 (8.6%) |
Health Insurance Coverage by Citizenship Status in Reynoldsville borough
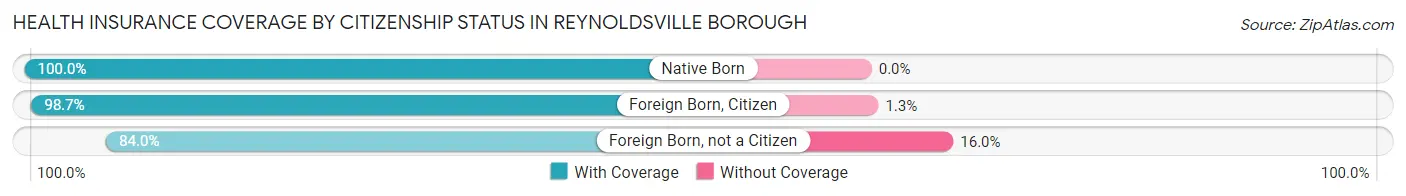
| Citizenship Status | With Coverage | Without Coverage |
| Native Born | 234 (100.0%) | 0 (0.0%) |
| Foreign Born, Citizen | 449 (98.7%) | 6 (1.3%) |
| Foreign Born, not a Citizen | 199 (84.0%) | 38 (16.0%) |
Health Insurance Coverage by Household Income in Reynoldsville borough
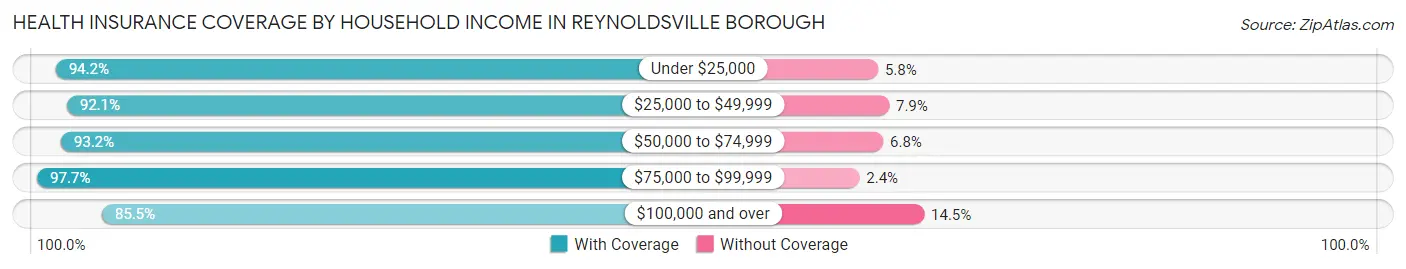
| Household Income | With Coverage | Without Coverage |
| Under $25,000 | 580 (94.2%) | 36 (5.8%) |
| $25,000 to $49,999 | 431 (92.1%) | 37 (7.9%) |
| $50,000 to $74,999 | 480 (93.2%) | 35 (6.8%) |
| $75,000 to $99,999 | 208 (97.7%) | 5 (2.4%) |
| $100,000 and over | 626 (85.5%) | 106 (14.5%) |
Public vs Private Health Insurance Coverage by Age in Reynoldsville borough
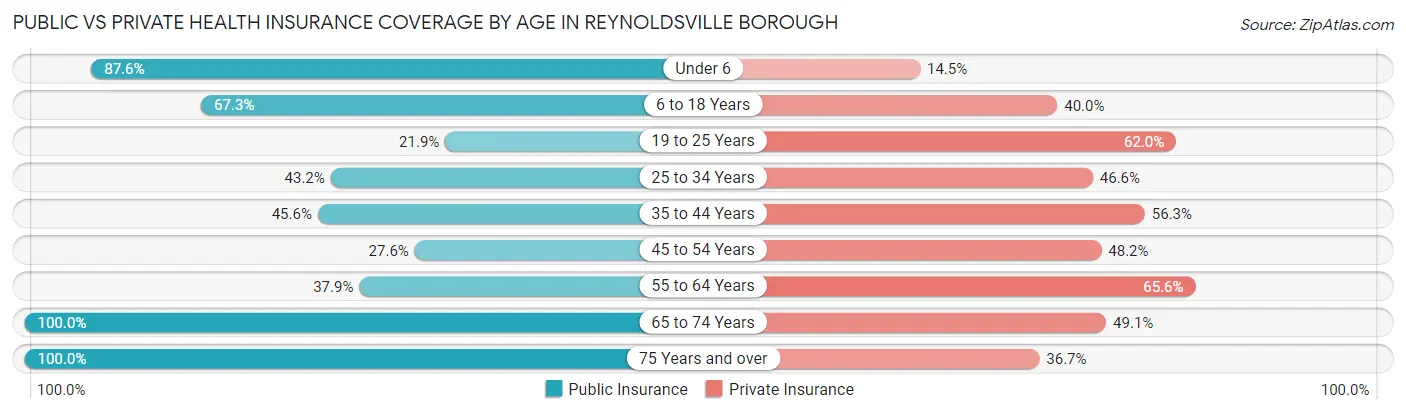
| Age Bracket | Public Insurance | Private Insurance |
| Under 6 | 205 (87.6%) | 34 (14.5%) |
| 6 to 18 Years | 306 (67.2%) | 182 (40.0%) |
| 19 to 25 Years | 52 (21.9%) | 147 (62.0%) |
| 25 to 34 Years | 127 (43.2%) | 137 (46.6%) |
| 35 to 44 Years | 124 (45.6%) | 153 (56.2%) |
| 45 to 54 Years | 106 (27.6%) | 185 (48.2%) |
| 55 to 64 Years | 97 (37.9%) | 168 (65.6%) |
| 65 to 74 Years | 269 (100.0%) | 132 (49.1%) |
| 75 Years and over | 150 (100.0%) | 55 (36.7%) |
| Total | 1,436 (56.3%) | 1,193 (46.8%) |
Disability Status by Sex by Age in Reynoldsville borough
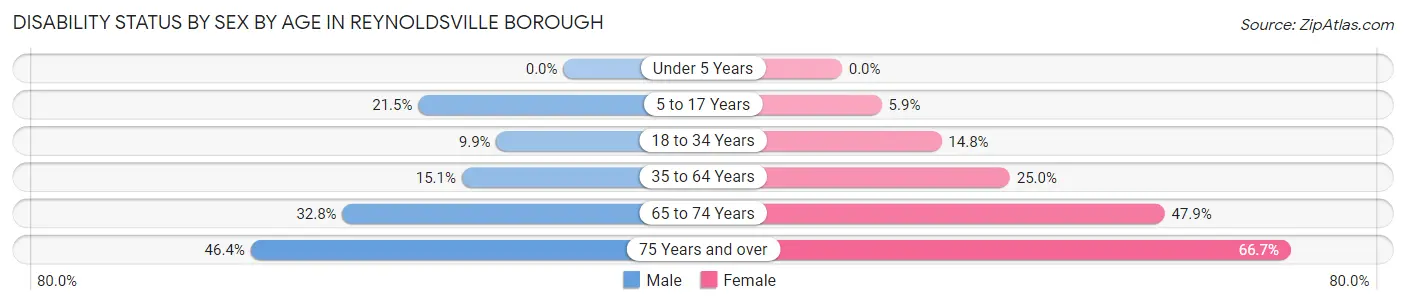
| Age Bracket | Male | Female |
| Under 5 Years | 0 (0.0%) | 0 (0.0%) |
| 5 to 17 Years | 53 (21.5%) | 10 (5.9%) |
| 18 to 34 Years | 31 (9.9%) | 42 (14.8%) |
| 35 to 64 Years | 65 (15.1%) | 120 (24.9%) |
| 65 to 74 Years | 41 (32.8%) | 69 (47.9%) |
| 75 Years and over | 39 (46.4%) | 44 (66.7%) |
Disability Class by Sex by Age in Reynoldsville borough
Disability Class: Hearing Difficulty
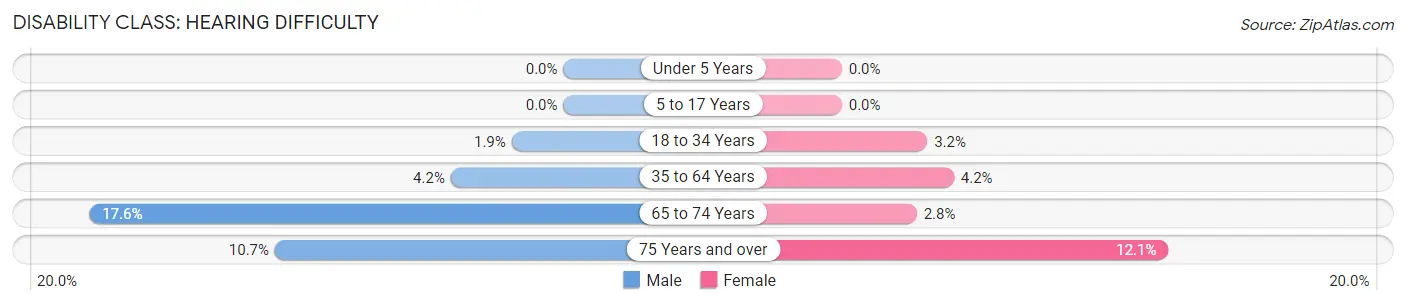
| Age Bracket | Male | Female |
| Under 5 Years | 0 (0.0%) | 0 (0.0%) |
| 5 to 17 Years | 0 (0.0%) | 0 (0.0%) |
| 18 to 34 Years | 6 (1.9%) | 9 (3.2%) |
| 35 to 64 Years | 18 (4.2%) | 20 (4.2%) |
| 65 to 74 Years | 22 (17.6%) | 4 (2.8%) |
| 75 Years and over | 9 (10.7%) | 8 (12.1%) |
Disability Class: Vision Difficulty
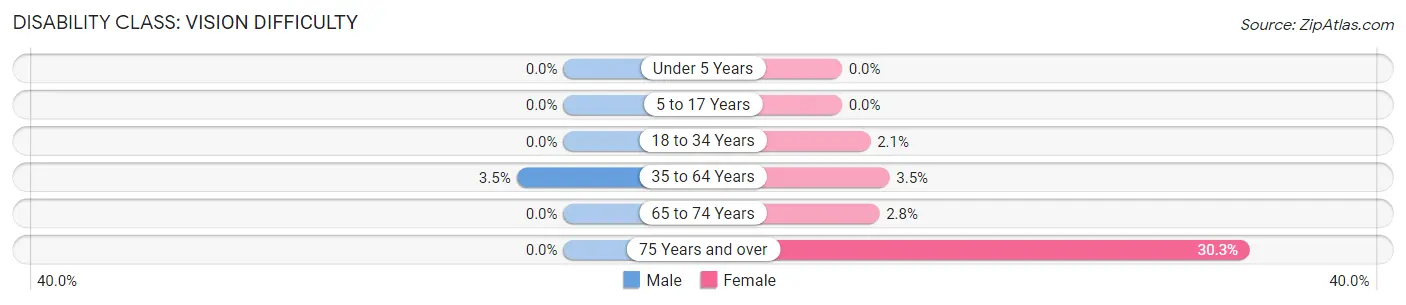
| Age Bracket | Male | Female |
| Under 5 Years | 0 (0.0%) | 0 (0.0%) |
| 5 to 17 Years | 0 (0.0%) | 0 (0.0%) |
| 18 to 34 Years | 0 (0.0%) | 6 (2.1%) |
| 35 to 64 Years | 15 (3.5%) | 17 (3.5%) |
| 65 to 74 Years | 0 (0.0%) | 4 (2.8%) |
| 75 Years and over | 0 (0.0%) | 20 (30.3%) |
Disability Class: Cognitive Difficulty
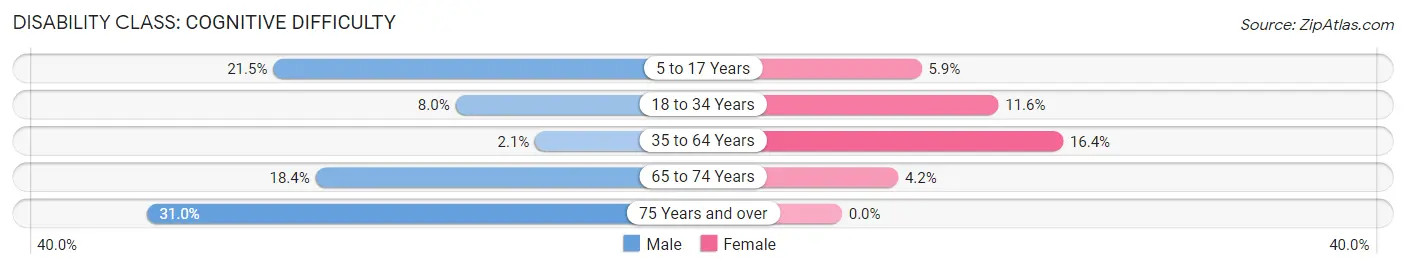
| Age Bracket | Male | Female |
| 5 to 17 Years | 53 (21.5%) | 10 (5.9%) |
| 18 to 34 Years | 25 (8.0%) | 33 (11.6%) |
| 35 to 64 Years | 9 (2.1%) | 79 (16.4%) |
| 65 to 74 Years | 23 (18.4%) | 6 (4.2%) |
| 75 Years and over | 26 (30.9%) | 0 (0.0%) |
Disability Class: Ambulatory Difficulty
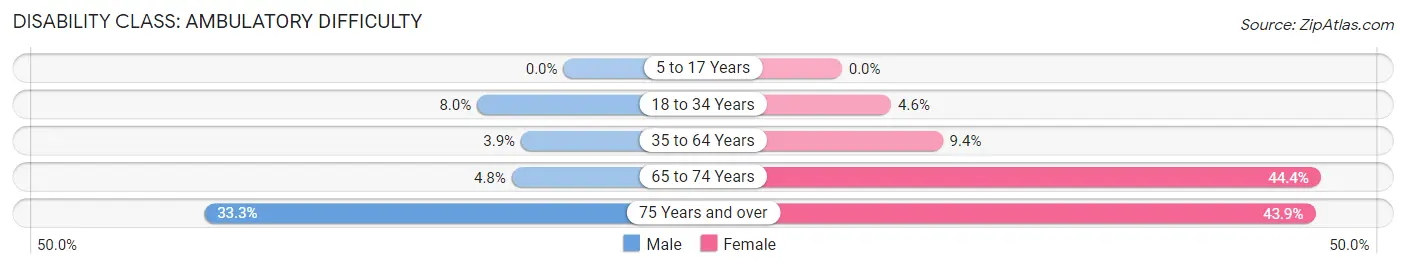
| Age Bracket | Male | Female |
| 5 to 17 Years | 0 (0.0%) | 0 (0.0%) |
| 18 to 34 Years | 25 (8.0%) | 13 (4.6%) |
| 35 to 64 Years | 17 (3.9%) | 45 (9.4%) |
| 65 to 74 Years | 6 (4.8%) | 64 (44.4%) |
| 75 Years and over | 28 (33.3%) | 29 (43.9%) |
Disability Class: Self-Care Difficulty
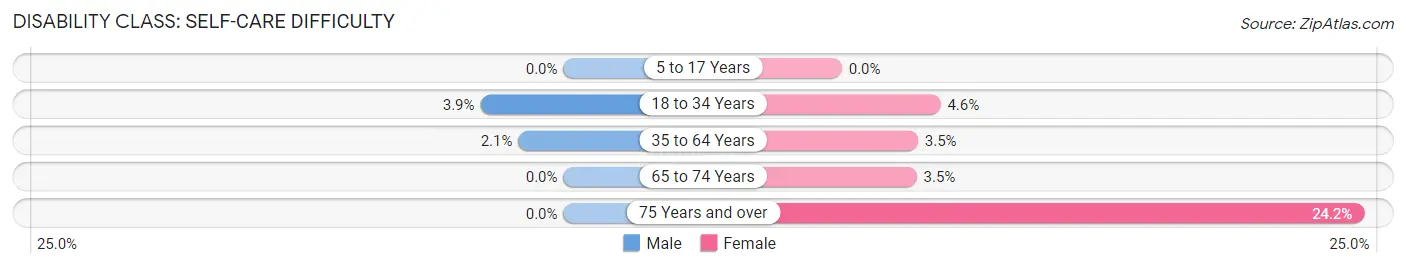
| Age Bracket | Male | Female |
| 5 to 17 Years | 0 (0.0%) | 0 (0.0%) |
| 18 to 34 Years | 12 (3.8%) | 13 (4.6%) |
| 35 to 64 Years | 9 (2.1%) | 17 (3.5%) |
| 65 to 74 Years | 0 (0.0%) | 5 (3.5%) |
| 75 Years and over | 0 (0.0%) | 16 (24.2%) |
Technology Access in Reynoldsville borough
Computing Device Access in Reynoldsville borough
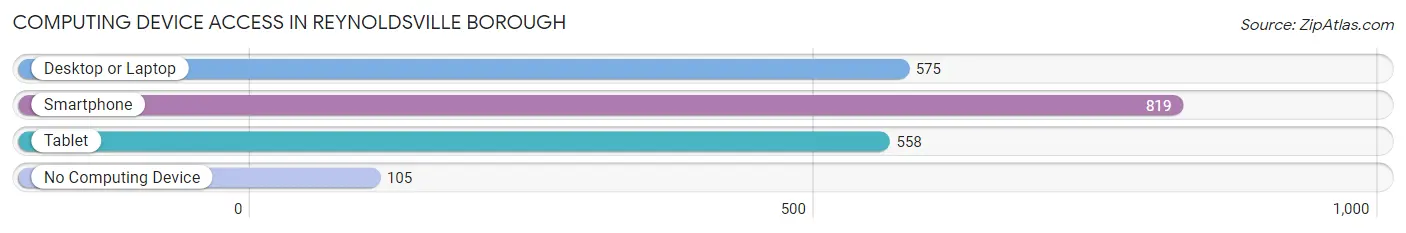
| Device Type | # Households | % Households |
| Desktop or Laptop | 575 | 55.9% |
| Smartphone | 819 | 79.6% |
| Tablet | 558 | 54.2% |
| No Computing Device | 105 | 10.2% |
| Total | 1,029 | 100.0% |
Internet Access in Reynoldsville borough
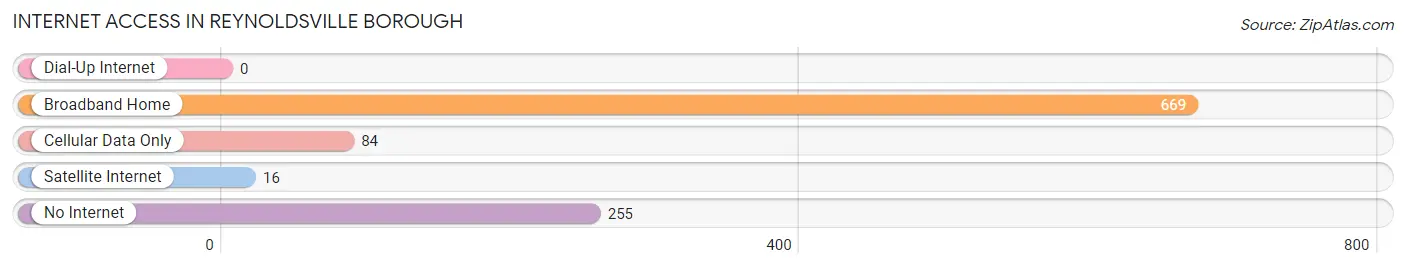
| Internet Type | # Households | % Households |
| Dial-Up Internet | 0 | 0.0% |
| Broadband Home | 669 | 65.0% |
| Cellular Data Only | 84 | 8.2% |
| Satellite Internet | 16 | 1.5% |
| No Internet | 255 | 24.8% |
| Total | 1,029 | 100.0% |
Reynoldsville borough Summary
Reynoldsville Borough is a small borough located in Jefferson County, Pennsylvania. It is situated in the foothills of the Allegheny Mountains and is part of the larger Punxsutawney-Reynoldsville Metropolitan Statistical Area. The borough has a population of 1,845 as of the 2010 census.
History
Reynoldsville Borough was founded in 1851 by William Reynolds, a local landowner. The town was named after him and was incorporated in 1872. The town was originally a farming community, but it soon developed into a small industrial center. The town was home to several factories, including a tannery, a sawmill, a grist mill, and a brickyard.
In the late 19th century, the town was a popular tourist destination, with several hotels and resorts. The town was also home to a number of churches, including the First Presbyterian Church, which was founded in 1872.
Geography
Reynoldsville Borough is located in the foothills of the Allegheny Mountains in western Pennsylvania. It is situated in the Punxsutawney-Reynoldsville Metropolitan Statistical Area. The borough is bordered by the townships of Bell, Henderson, and Perry.
The borough has a total area of 1.2 square miles, all of which is land. The borough is located at an elevation of 1,845 feet above sea level.
Economy
Reynoldsville Borough is a small, rural community with a population of 1,845 as of the 2010 census. The town is home to several small businesses, including a grocery store, a hardware store, and a few restaurants. The town is also home to a number of small manufacturing companies, including a furniture manufacturer and a plastics manufacturer.
The town is also home to a number of small farms, which produce a variety of crops, including corn, soybeans, and hay. The town is also home to a number of small wineries, which produce a variety of wines.
Demographics
As of the 2010 census, the population of Reynoldsville Borough was 1,845. The racial makeup of the borough was 97.3% White, 0.7% African American, 0.2% Native American, 0.2% Asian, 0.1% from other races, and 1.5% from two or more races. Hispanic or Latino of any race were 0.7% of the population.
The median income for a household in the borough was $37,500, and the median income for a family was $45,000. The per capita income for the borough was $18,845. About 11.2% of families and 14.2% of the population were below the poverty line, including 19.2% of those under age 18 and 8.2% of those age 65 or over.
Common Questions
What is Per Capita Income in Reynoldsville borough?
Per Capita income in Reynoldsville borough is $23,942.
What is the Median Family Income in Reynoldsville borough?
Median Family Income in Reynoldsville borough is $57,500.
What is the Median Household income in Reynoldsville borough?
Median Household Income in Reynoldsville borough is $43,797.
What is Income or Wage Gap in Reynoldsville borough?
Income or Wage Gap in Reynoldsville borough is 37.0%.
Women in Reynoldsville borough earn 63.0 cents for every dollar earned by a man.
What is Inequality or Gini Index in Reynoldsville borough?
Inequality or Gini Index in Reynoldsville borough is 0.46.
What is the Total Population of Reynoldsville borough?
Total Population of Reynoldsville borough is 2,551.
What is the Total Male Population of Reynoldsville borough?
Total Male Population of Reynoldsville borough is 1,326.
What is the Total Female Population of Reynoldsville borough?
Total Female Population of Reynoldsville borough is 1,225.
What is the Ratio of Males per 100 Females in Reynoldsville borough?
There are 108.24 Males per 100 Females in Reynoldsville borough.
What is the Ratio of Females per 100 Males in Reynoldsville borough?
There are 92.38 Females per 100 Males in Reynoldsville borough.
What is the Median Population Age in Reynoldsville borough?
Median Population Age in Reynoldsville borough is 36.5 Years.
What is the Average Family Size in Reynoldsville borough
Average Family Size in Reynoldsville borough is 3.2 People.
What is the Average Household Size in Reynoldsville borough
Average Household Size in Reynoldsville borough is 2.5 People.
How Large is the Labor Force in Reynoldsville borough?
There are 1,221 People in the Labor Forcein in Reynoldsville borough.
What is the Percentage of People in the Labor Force in Reynoldsville borough?
59.9% of People are in the Labor Force in Reynoldsville borough.
What is the Unemployment Rate in Reynoldsville borough?
Unemployment Rate in Reynoldsville borough is 9.7%.