Zip Codes with the Highest Percentage of Families with Income Below $10,000 in New Castle, PA
RELATED REPORTS & OPTIONS
Family Income | $0-10k
New Castle
Compare Zip Codes
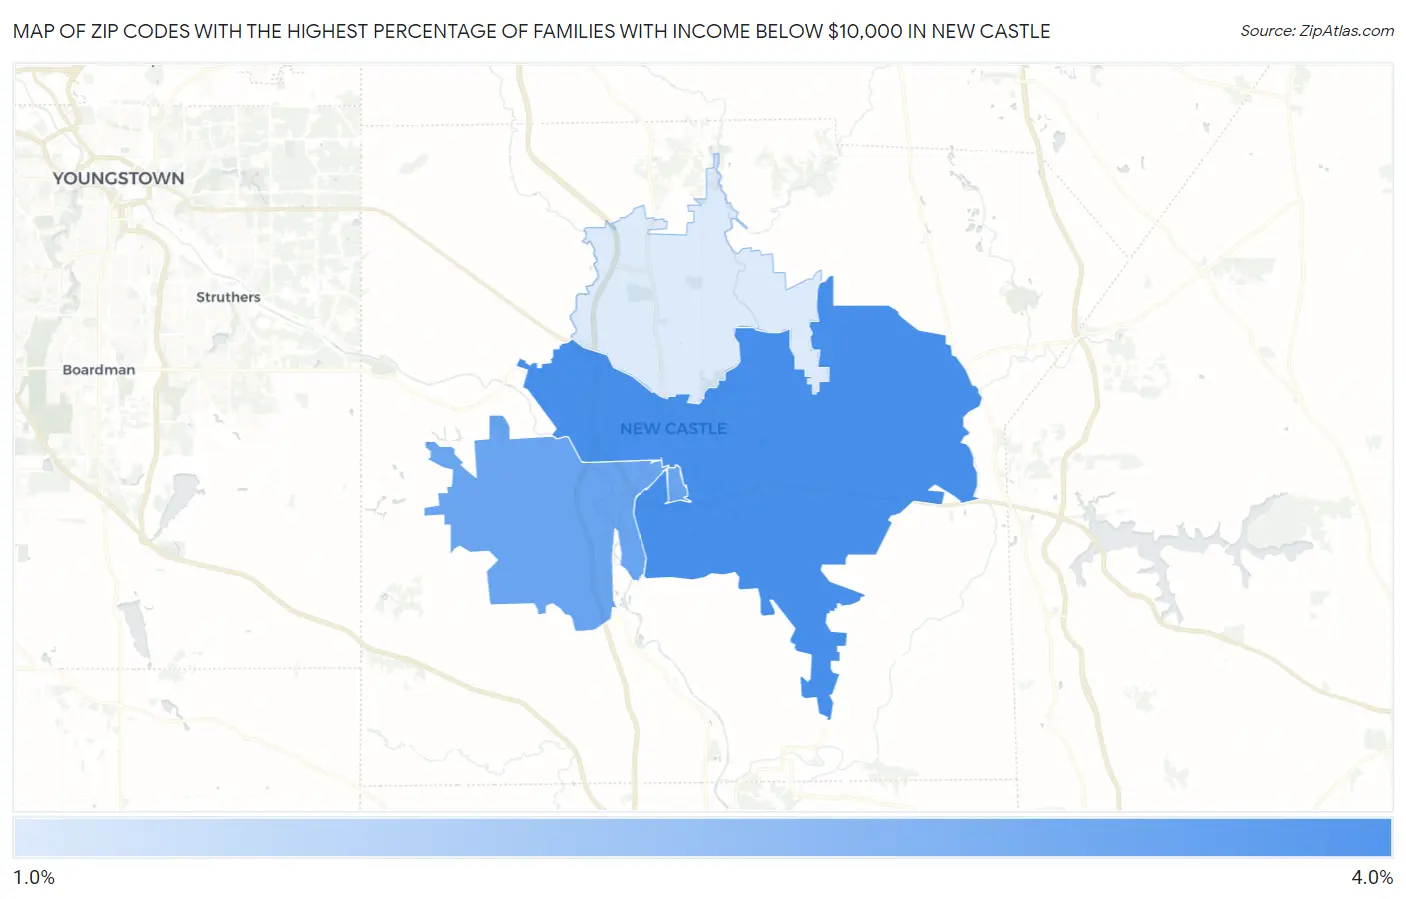
Map of Zip Codes with the Highest Percentage of Families with Income Below $10,000 in New Castle
1.8%
4.0%
Zip Codes with the Highest Percentage of Families with Income Below $10,000 in New Castle, PA
| Zip Code | Families with Income < $10k | vs State | vs National | |
| 1. | 16101 | 4.0% | 2.9%(+1.10)#335 | 3.1%(+0.900)#8,155 |
| 2. | 16102 | 3.5% | 2.9%(+0.600)#410 | 3.1%(+0.400)#9,641 |
| 3. | 16105 | 1.8% | 2.9%(-1.10)#764 | 3.1%(-1.30)#16,385 |
1
Common Questions
What are the Top Zip Codes with the Highest Percentage of Families with Income Below $10,000 in New Castle, PA?
Top Zip Codes with the Highest Percentage of Families with Income Below $10,000 in New Castle, PA are:
What zip code has the Highest Percentage of Families with Income Below $10,000 in New Castle, PA?
16101 has the Highest Percentage of Families with Income Below $10,000 in New Castle, PA with 4.0%.
What is the Percentage of Families with Income Below $10,000 in New Castle, PA?
Percentage of Families with Income Below $10,000 in New Castle is 5.7%.
What is the Percentage of Families with Income Below $10,000 in Pennsylvania?
Percentage of Families with Income Below $10,000 in Pennsylvania is 2.9%.
What is the Percentage of Families with Income Below $10,000 in the United States?
Percentage of Families with Income Below $10,000 in the United States is 3.1%.