Mount Union borough, PA Map & Demographics
Mount Union borough Overview
$22,687
PER CAPITA INCOME
$46,500
AVG FAMILY INCOME
$38,382
AVG HOUSEHOLD INCOME
37.7%
WAGE / INCOME GAP [ % ]
62.3¢/ $1
WAGE / INCOME GAP [ $ ]
0.45
INEQUALITY / GINI INDEX
2,130
TOTAL POPULATION
1,194
MALE POPULATION
936
FEMALE POPULATION
127.56
MALES / 100 FEMALES
78.39
FEMALES / 100 MALES
34.8
MEDIAN AGE
2.9
AVG FAMILY SIZE
2.3
AVG HOUSEHOLD SIZE
977
LABOR FORCE [ PEOPLE ]
59.5%
PERCENT IN LABOR FORCE
14.0%
UNEMPLOYMENT RATE
Income in Mount Union borough
Income Overview in Mount Union borough
Per Capita Income in Mount Union borough is $22,687, while median incomes of families and households are $46,500 and $38,382 respectively.
| Characteristic | Number | Measure |
| Per Capita Income | 2,130 | $22,687 |
| Median Family Income | 524 | $46,500 |
| Mean Family Income | 524 | $56,412 |
| Median Household Income | 896 | $38,382 |
| Mean Household Income | 896 | $48,420 |
| Income Deficit | 524 | $0 |
| Wage / Income Gap (%) | 2,130 | 37.65% |
| Wage / Income Gap ($) | 2,130 | 62.35¢ per $1 |
| Gini / Inequality Index | 2,130 | 0.45 |
Earnings by Sex in Mount Union borough
Average Earnings in Mount Union borough are $33,996, $37,869 for men and $23,611 for women, a difference of 37.7%.
| Sex | Number | Average Earnings |
| Male | 607 (60.6%) | $37,869 |
| Female | 394 (39.4%) | $23,611 |
| Total | 1,001 (100.0%) | $33,996 |
Earnings by Sex by Income Bracket in Mount Union borough
The most common earnings brackets in Mount Union borough are $55,000 to $64,999 for men (134 | 22.1%) and $35,000 to $39,999 for women (48 | 12.2%).
| Income | Male | Female |
| $2,499 or less | 55 (9.1%) | 35 (8.9%) |
| $2,500 to $4,999 | 12 (2.0%) | 23 (5.8%) |
| $5,000 to $7,499 | 17 (2.8%) | 32 (8.1%) |
| $7,500 to $9,999 | 20 (3.3%) | 21 (5.3%) |
| $10,000 to $12,499 | 29 (4.8%) | 16 (4.1%) |
| $12,500 to $14,999 | 5 (0.8%) | 12 (3.0%) |
| $15,000 to $17,499 | 5 (0.8%) | 9 (2.3%) |
| $17,500 to $19,999 | 24 (4.0%) | 11 (2.8%) |
| $20,000 to $22,499 | 32 (5.3%) | 34 (8.6%) |
| $22,500 to $24,999 | 9 (1.5%) | 9 (2.3%) |
| $25,000 to $29,999 | 29 (4.8%) | 8 (2.0%) |
| $30,000 to $34,999 | 52 (8.6%) | 26 (6.6%) |
| $35,000 to $39,999 | 52 (8.6%) | 48 (12.2%) |
| $40,000 to $44,999 | 11 (1.8%) | 0 (0.0%) |
| $45,000 to $49,999 | 47 (7.7%) | 34 (8.6%) |
| $50,000 to $54,999 | 29 (4.8%) | 15 (3.8%) |
| $55,000 to $64,999 | 134 (22.1%) | 5 (1.3%) |
| $65,000 to $74,999 | 20 (3.3%) | 4 (1.0%) |
| $75,000 to $99,999 | 9 (1.5%) | 43 (10.9%) |
| $100,000+ | 16 (2.6%) | 9 (2.3%) |
| Total | 607 (100.0%) | 394 (100.0%) |
Earnings by Sex by Educational Attainment in Mount Union borough
Average earnings in Mount Union borough are $46,667 for men and $32,813 for women, a difference of 29.7%. Men with an educational attainment of bachelor's degree enjoy the highest average annual earnings of $51,875, while those with high school diploma education earn the least with $48,650. Women with an educational attainment of bachelor's degree earn the most with the average annual earnings of $98,081, while those with college or associate's degree education have the smallest earnings of $20,809.
| Educational Attainment | Male Income | Female Income |
| Less than High School | - | - |
| High School Diploma | $48,650 | $34,000 |
| College or Associate's Degree | $51,563 | $20,809 |
| Bachelor's Degree | $51,875 | $98,081 |
| Graduate Degree | - | - |
| Total | $46,667 | $32,813 |
Family Income in Mount Union borough
Family Income Brackets in Mount Union borough
According to the Mount Union borough family income data, there are 124 families falling into the $50,000 to $74,999 income range, which is the most common income bracket and makes up 23.7% of all families. Conversely, the $10,000 to $14,999 income bracket is the least frequent group with only 5 families (0.9%) belonging to this category.
| Income Bracket | # Families | % Families |
| Less than $10,000 | 81 | 15.5% |
| $10,000 to $14,999 | 5 | 1.0% |
| $15,000 to $24,999 | 82 | 15.6% |
| $25,000 to $34,999 | 24 | 4.6% |
| $35,000 to $49,999 | 99 | 18.9% |
| $50,000 to $74,999 | 124 | 23.7% |
| $75,000 to $99,999 | 10 | 1.9% |
| $100,000 to $149,999 | 51 | 9.7% |
| $150,000 to $199,999 | 43 | 8.2% |
| $200,000+ | 5 | 1.0% |
Family Income by Famaliy Size in Mount Union borough
2-person families (262 | 50.0%) account for the highest median family income in Mount Union borough with $50,694 per family, while 2-person families (262 | 50.0%) have the highest median income of $25,347 per family member.
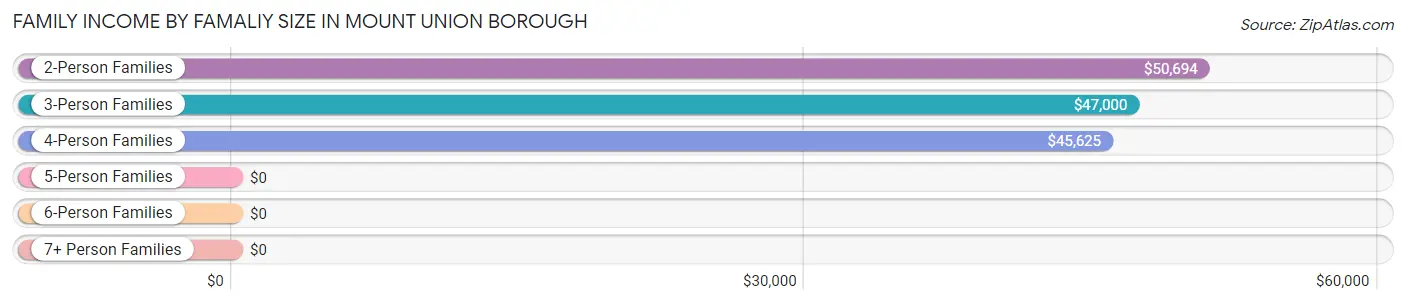
| Income Bracket | # Families | Median Income |
| 2-Person Families | 262 (50.0%) | $50,694 |
| 3-Person Families | 128 (24.4%) | $47,000 |
| 4-Person Families | 86 (16.4%) | $45,625 |
| 5-Person Families | 44 (8.4%) | $0 |
| 6-Person Families | 0 (0.0%) | $0 |
| 7+ Person Families | 4 (0.8%) | $0 |
| Total | 524 (100.0%) | $46,500 |
Family Income by Number of Earners in Mount Union borough
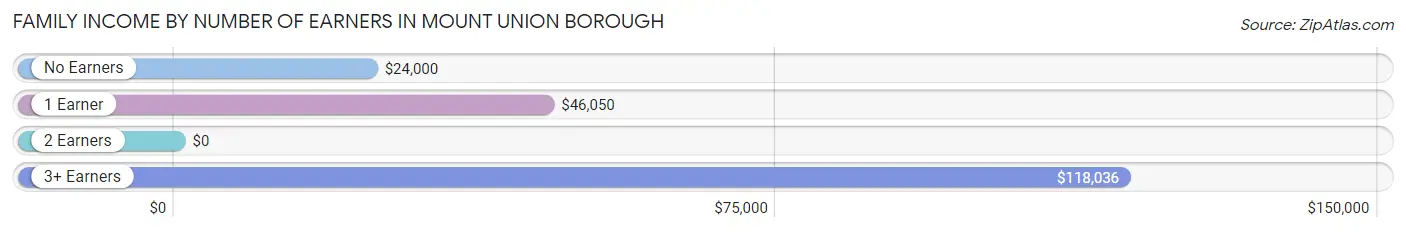
| Number of Earners | # Families | Median Income |
| No Earners | 112 (21.4%) | $24,000 |
| 1 Earner | 253 (48.3%) | $46,050 |
| 2 Earners | 128 (24.4%) | $0 |
| 3+ Earners | 31 (5.9%) | $118,036 |
| Total | 524 (100.0%) | $46,500 |
Household Income in Mount Union borough
Household Income Brackets in Mount Union borough
With 184 households falling in the category, the $15,000 to $24,999 income range is the most frequent in Mount Union borough, accounting for 20.5% of all households. In contrast, only 5 households (0.6%) fall into the $200,000+ income bracket, making it the least populous group.
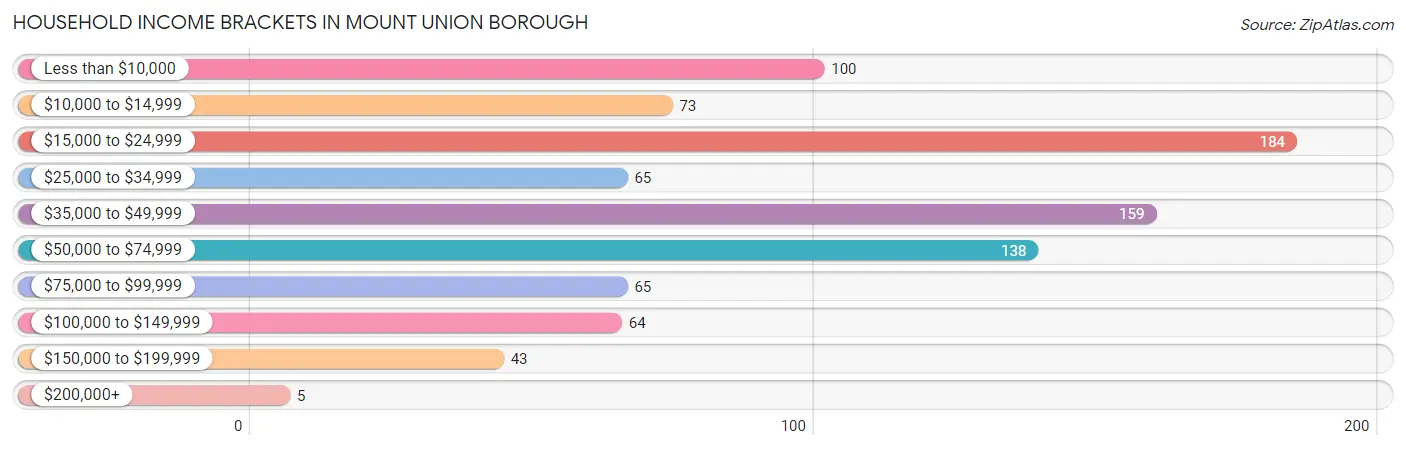
| Income Bracket | # Households | % Households |
| Less than $10,000 | 100 | 11.2% |
| $10,000 to $14,999 | 73 | 8.1% |
| $15,000 to $24,999 | 184 | 20.5% |
| $25,000 to $34,999 | 65 | 7.3% |
| $35,000 to $49,999 | 159 | 17.7% |
| $50,000 to $74,999 | 138 | 15.4% |
| $75,000 to $99,999 | 65 | 7.3% |
| $100,000 to $149,999 | 64 | 7.1% |
| $150,000 to $199,999 | 43 | 4.8% |
| $200,000+ | 5 | 0.6% |
Household Income by Householder Age in Mount Union borough
The median household income in Mount Union borough is $38,382, with the highest median household income of $48,333 found in the 25 to 44 years age bracket for the primary householder. A total of 288 households (32.1%) fall into this category. Meanwhile, the 65+ years age bracket for the primary householder has the lowest median household income of $28,173, with 235 households (26.2%) in this group.
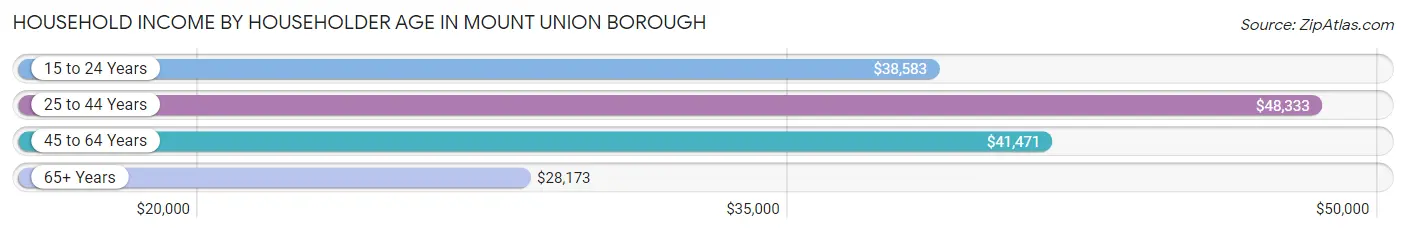
| Income Bracket | # Households | Median Income |
| 15 to 24 Years | 61 (6.8%) | $38,583 |
| 25 to 44 Years | 288 (32.1%) | $48,333 |
| 45 to 64 Years | 312 (34.8%) | $41,471 |
| 65+ Years | 235 (26.2%) | $28,173 |
| Total | 896 (100.0%) | $38,382 |
Poverty in Mount Union borough
Income Below Poverty by Sex and Age in Mount Union borough
With 25.1% poverty level for males and 41.3% for females among the residents of Mount Union borough, 16 and 17 year old males and 16 and 17 year old females are the most vulnerable to poverty, with 8 males (72.7%) and 17 females (73.9%) in their respective age groups living below the poverty level.
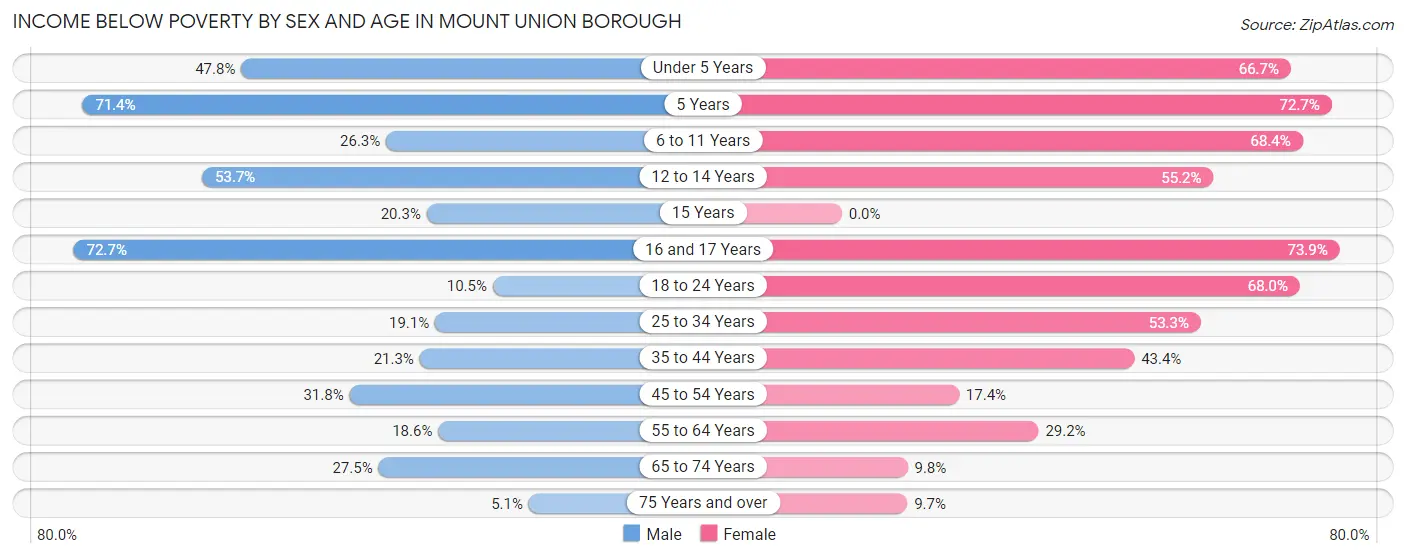
| Age Bracket | Male | Female |
| Under 5 Years | 33 (47.8%) | 44 (66.7%) |
| 5 Years | 5 (71.4%) | 24 (72.7%) |
| 6 to 11 Years | 20 (26.3%) | 39 (68.4%) |
| 12 to 14 Years | 44 (53.7%) | 16 (55.2%) |
| 15 Years | 14 (20.3%) | 0 (0.0%) |
| 16 and 17 Years | 8 (72.7%) | 17 (73.9%) |
| 18 to 24 Years | 11 (10.5%) | 34 (68.0%) |
| 25 to 34 Years | 36 (19.1%) | 113 (53.3%) |
| 35 to 44 Years | 16 (21.3%) | 33 (43.4%) |
| 45 to 54 Years | 47 (31.8%) | 16 (17.4%) |
| 55 to 64 Years | 34 (18.6%) | 33 (29.2%) |
| 65 to 74 Years | 28 (27.5%) | 8 (9.8%) |
| 75 Years and over | 4 (5.1%) | 10 (9.7%) |
| Total | 300 (25.1%) | 387 (41.3%) |
Income Above Poverty by Sex and Age in Mount Union borough
According to the poverty statistics in Mount Union borough, males aged 75 years and over and females aged 75 years and over are the age groups that are most secure financially, with 94.9% of males and 90.3% of females in these age groups living above the poverty line.
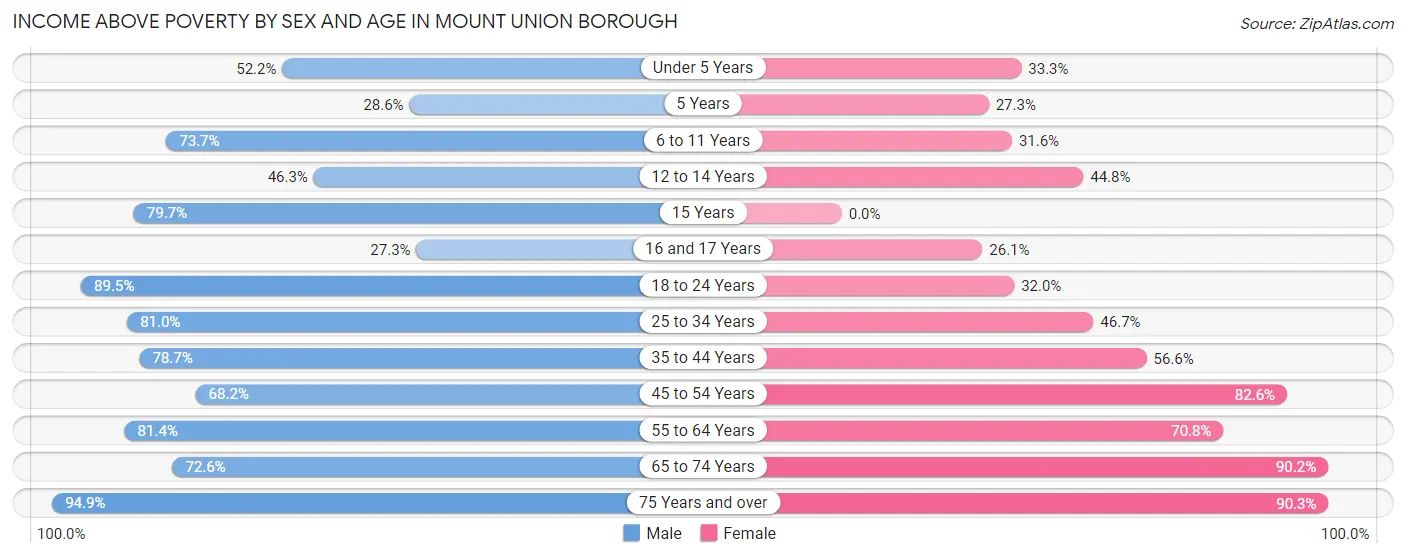
| Age Bracket | Male | Female |
| Under 5 Years | 36 (52.2%) | 22 (33.3%) |
| 5 Years | 2 (28.6%) | 9 (27.3%) |
| 6 to 11 Years | 56 (73.7%) | 18 (31.6%) |
| 12 to 14 Years | 38 (46.3%) | 13 (44.8%) |
| 15 Years | 55 (79.7%) | 0 (0.0%) |
| 16 and 17 Years | 3 (27.3%) | 6 (26.1%) |
| 18 to 24 Years | 94 (89.5%) | 16 (32.0%) |
| 25 to 34 Years | 153 (80.9%) | 99 (46.7%) |
| 35 to 44 Years | 59 (78.7%) | 43 (56.6%) |
| 45 to 54 Years | 101 (68.2%) | 76 (82.6%) |
| 55 to 64 Years | 149 (81.4%) | 80 (70.8%) |
| 65 to 74 Years | 74 (72.6%) | 74 (90.2%) |
| 75 Years and over | 74 (94.9%) | 93 (90.3%) |
| Total | 894 (74.9%) | 549 (58.7%) |
Income Below Poverty Among Married-Couple Families in Mount Union borough
The poverty statistics for married-couple families in Mount Union borough show that 19.7% or 51 of the total 259 families live below the poverty line. Families with 5 or more children have the highest poverty rate of 100.0%, comprising of 4 families. On the other hand, families with no children have the lowest poverty rate of 12.6%, which includes 22 families.
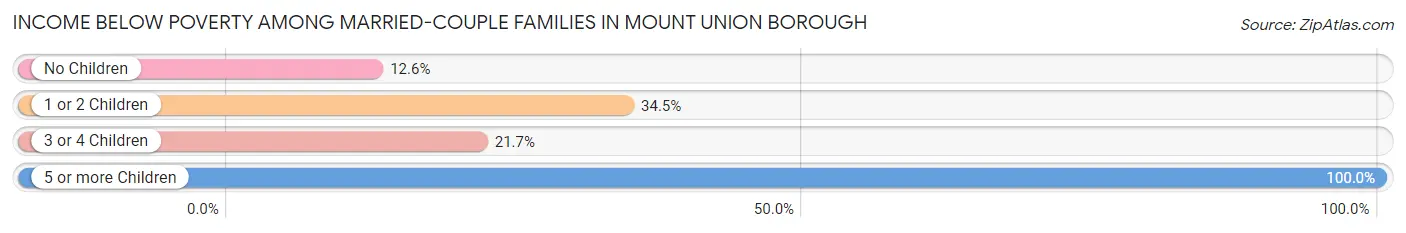
| Children | Above Poverty | Below Poverty |
| No Children | 152 (87.4%) | 22 (12.6%) |
| 1 or 2 Children | 38 (65.5%) | 20 (34.5%) |
| 3 or 4 Children | 18 (78.3%) | 5 (21.7%) |
| 5 or more Children | 0 (0.0%) | 4 (100.0%) |
| Total | 208 (80.3%) | 51 (19.7%) |
Income Below Poverty Among Single-Parent Households in Mount Union borough
According to the poverty data in Mount Union borough, 4.8% or 4 single-father households and 54.1% or 98 single-mother households are living below the poverty line. Among single-father households, those with 1 or 2 children have the highest poverty rate, with 4 households (6.8%) experiencing poverty. Likewise, among single-mother households, those with 1 or 2 children have the highest poverty rate, with 69 households (80.2%) falling below the poverty line.
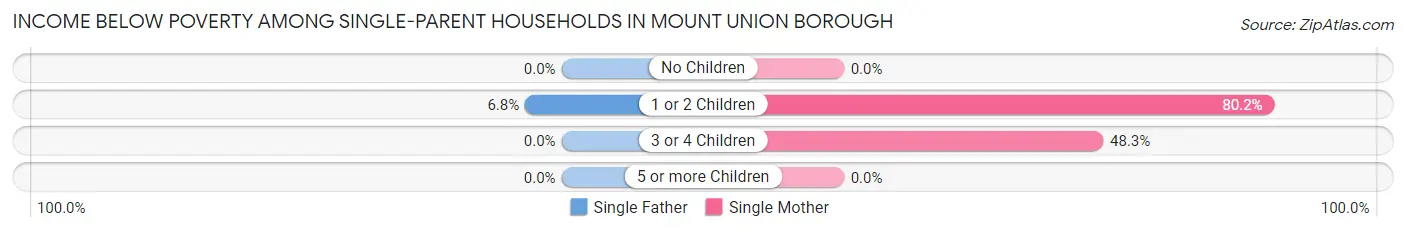
| Children | Single Father | Single Mother |
| No Children | 0 (0.0%) | 0 (0.0%) |
| 1 or 2 Children | 4 (6.8%) | 69 (80.2%) |
| 3 or 4 Children | 0 (0.0%) | 29 (48.3%) |
| 5 or more Children | 0 (0.0%) | 0 (0.0%) |
| Total | 4 (4.8%) | 98 (54.1%) |
Income Below Poverty Among Married-Couple vs Single-Parent Households in Mount Union borough
The poverty data for Mount Union borough shows that 51 of the married-couple family households (19.7%) and 102 of the single-parent households (38.5%) are living below the poverty level. Within the married-couple family households, those with 5 or more children have the highest poverty rate, with 4 households (100.0%) falling below the poverty line. Among the single-parent households, those with 1 or 2 children have the highest poverty rate, with 73 household (50.3%) living below poverty.
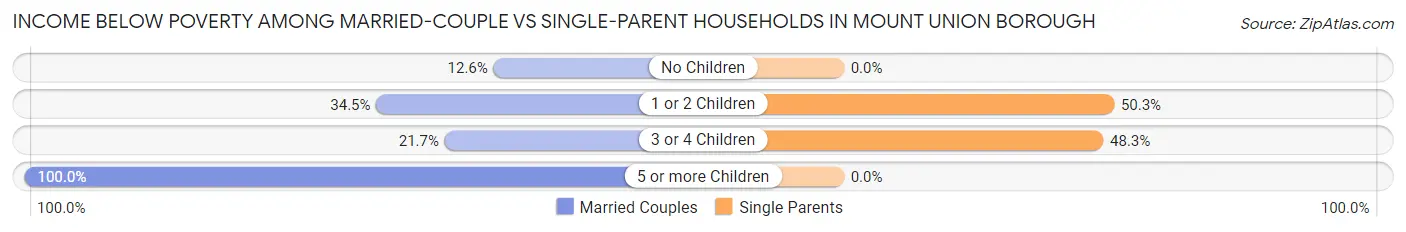
| Children | Married-Couple Families | Single-Parent Households |
| No Children | 22 (12.6%) | 0 (0.0%) |
| 1 or 2 Children | 20 (34.5%) | 73 (50.3%) |
| 3 or 4 Children | 5 (21.7%) | 29 (48.3%) |
| 5 or more Children | 4 (100.0%) | 0 (0.0%) |
| Total | 51 (19.7%) | 102 (38.5%) |
Race in Mount Union borough
The most populous races in Mount Union borough are White / Caucasian (1,847 | 86.7%), Black / African American (192 | 9.0%), and Two or more Races (91 | 4.3%).
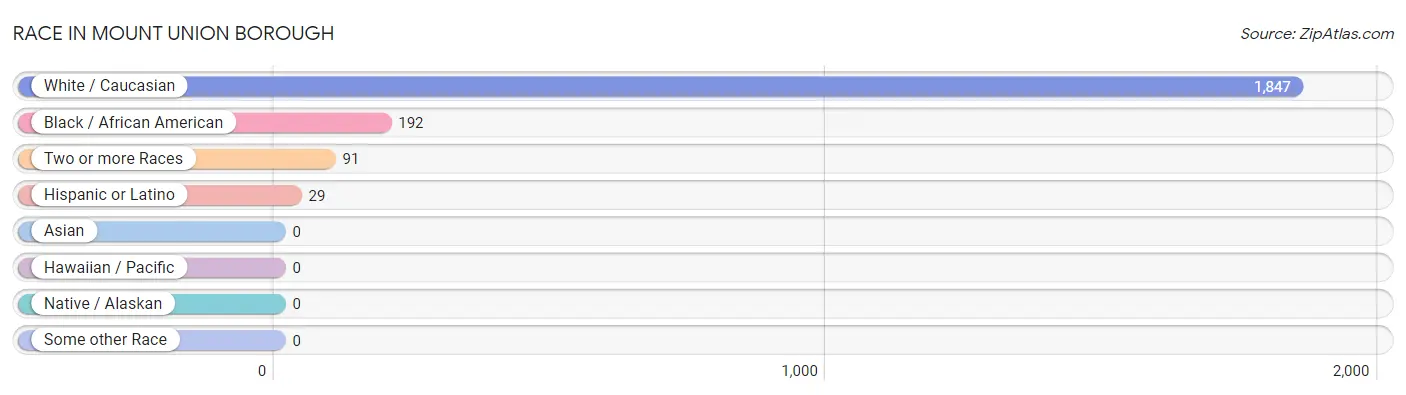
| Race | # Population | % Population |
| Asian | 0 | 0.0% |
| Black / African American | 192 | 9.0% |
| Hawaiian / Pacific | 0 | 0.0% |
| Hispanic or Latino | 29 | 1.4% |
| Native / Alaskan | 0 | 0.0% |
| White / Caucasian | 1,847 | 86.7% |
| Two or more Races | 91 | 4.3% |
| Some other Race | 0 | 0.0% |
| Total | 2,130 | 100.0% |
Ancestry in Mount Union borough
The most populous ancestries reported in Mount Union borough are German (399 | 18.7%), Irish (266 | 12.5%), Italian (259 | 12.2%), American (227 | 10.7%), and English (126 | 5.9%), together accounting for 60.0% of all Mount Union borough residents.
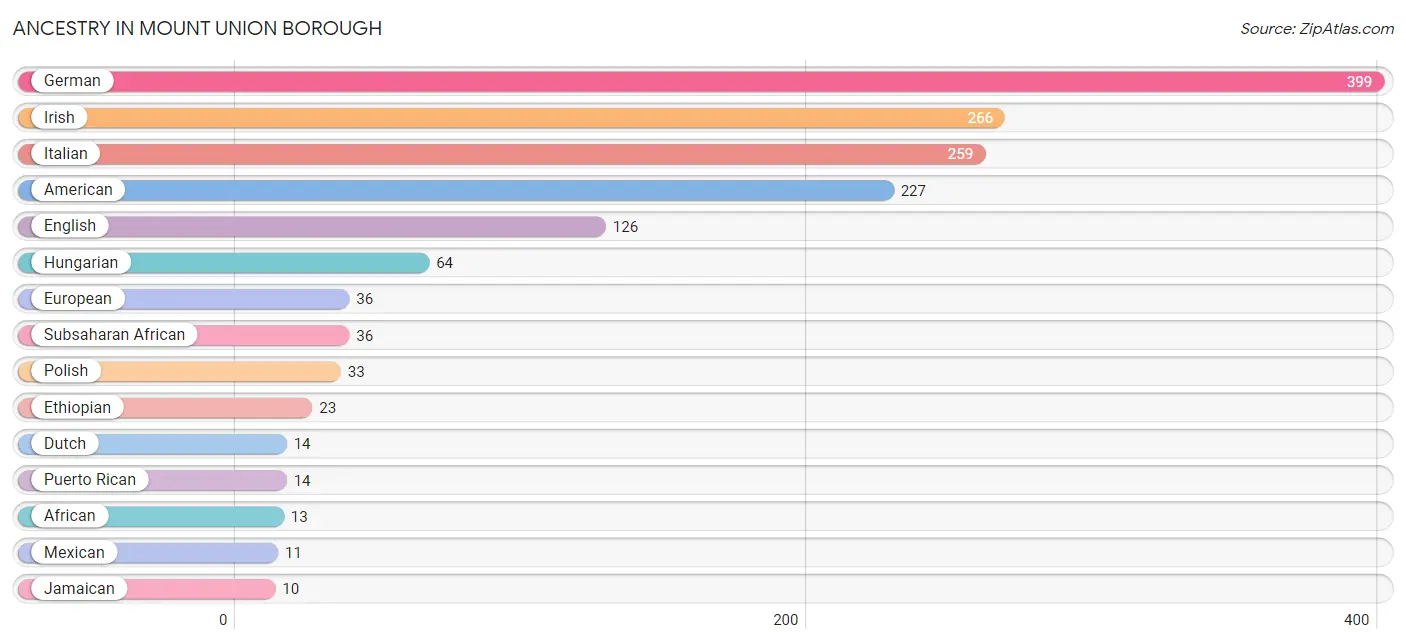
| Ancestry | # Population | % Population |
| African | 13 | 0.6% |
| American | 227 | 10.7% |
| Dutch | 14 | 0.7% |
| English | 126 | 5.9% |
| Ethiopian | 23 | 1.1% |
| European | 36 | 1.7% |
| French | 4 | 0.2% |
| French Canadian | 4 | 0.2% |
| German | 399 | 18.7% |
| Hungarian | 64 | 3.0% |
| Irish | 266 | 12.5% |
| Italian | 259 | 12.2% |
| Jamaican | 10 | 0.5% |
| Latvian | 5 | 0.2% |
| Mexican | 11 | 0.5% |
| Norwegian | 5 | 0.2% |
| Polish | 33 | 1.5% |
| Puerto Rican | 14 | 0.7% |
| Scotch-Irish | 7 | 0.3% |
| Scottish | 5 | 0.2% |
| Subsaharan African | 36 | 1.7% |
| Swedish | 5 | 0.2% |
| Ukrainian | 5 | 0.2% |
| Welsh | 8 | 0.4% | View All 24 Rows |
Immigrants in Mount Union borough
The most numerous immigrant groups reported in Mount Union borough came from Europe (14 | 0.7%), Germany (14 | 0.7%), and Western Europe (14 | 0.7%), together accounting for 2.0% of all Mount Union borough residents.
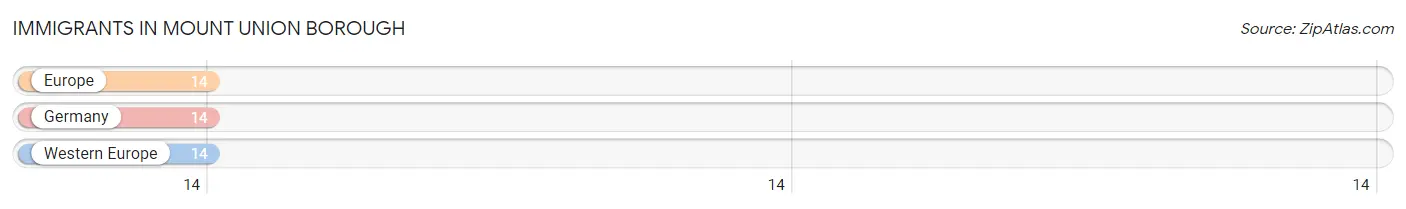
| Immigration Origin | # Population | % Population |
| Europe | 14 | 0.7% |
| Germany | 14 | 0.7% |
| Western Europe | 14 | 0.7% | View All 3 Rows |
Sex and Age in Mount Union borough
Sex and Age in Mount Union borough
The most populous age groups in Mount Union borough are 15 to 19 Years (114 | 9.6%) for men and 30 to 34 Years (126 | 13.5%) for women.
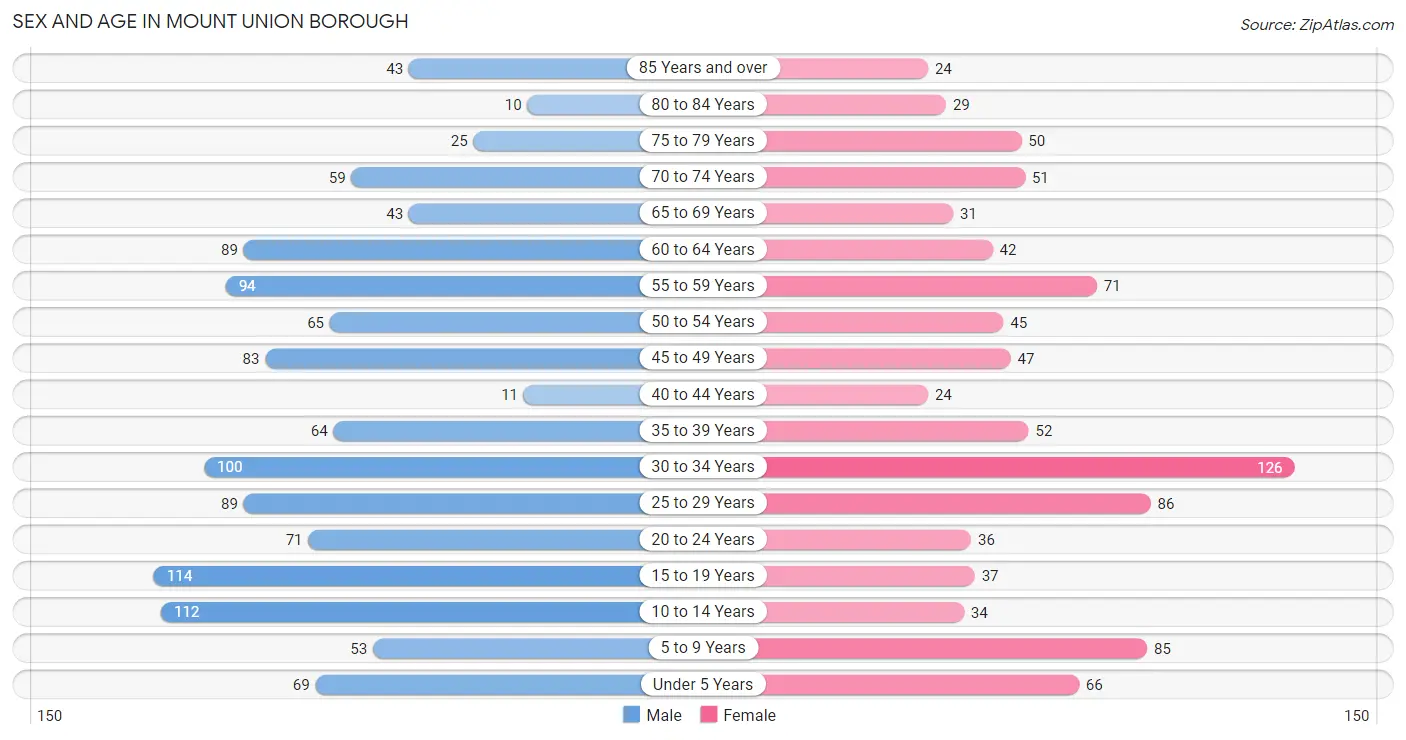
| Age Bracket | Male | Female |
| Under 5 Years | 69 (5.8%) | 66 (7.0%) |
| 5 to 9 Years | 53 (4.4%) | 85 (9.1%) |
| 10 to 14 Years | 112 (9.4%) | 34 (3.6%) |
| 15 to 19 Years | 114 (9.6%) | 37 (4.0%) |
| 20 to 24 Years | 71 (5.9%) | 36 (3.8%) |
| 25 to 29 Years | 89 (7.4%) | 86 (9.2%) |
| 30 to 34 Years | 100 (8.4%) | 126 (13.5%) |
| 35 to 39 Years | 64 (5.4%) | 52 (5.6%) |
| 40 to 44 Years | 11 (0.9%) | 24 (2.6%) |
| 45 to 49 Years | 83 (7.0%) | 47 (5.0%) |
| 50 to 54 Years | 65 (5.4%) | 45 (4.8%) |
| 55 to 59 Years | 94 (7.9%) | 71 (7.6%) |
| 60 to 64 Years | 89 (7.4%) | 42 (4.5%) |
| 65 to 69 Years | 43 (3.6%) | 31 (3.3%) |
| 70 to 74 Years | 59 (4.9%) | 51 (5.4%) |
| 75 to 79 Years | 25 (2.1%) | 50 (5.3%) |
| 80 to 84 Years | 10 (0.8%) | 29 (3.1%) |
| 85 Years and over | 43 (3.6%) | 24 (2.6%) |
| Total | 1,194 (100.0%) | 936 (100.0%) |
Families and Households in Mount Union borough
Median Family Size in Mount Union borough
The median family size in Mount Union borough is 2.91 persons per family, with single female/mother families (181 | 34.5%) accounting for the largest median family size of 3.11 persons per family. On the other hand, single male/father families (84 | 16.0%) represent the smallest median family size with 1.90 persons per family.
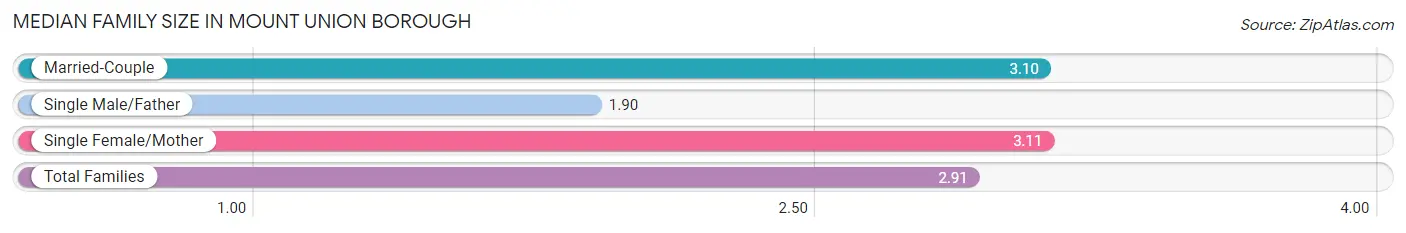
| Family Type | # Families | Family Size |
| Married-Couple | 259 (49.4%) | 3.10 |
| Single Male/Father | 84 (16.0%) | 1.90 |
| Single Female/Mother | 181 (34.5%) | 3.11 |
| Total Families | 524 (100.0%) | 2.91 |
Median Household Size in Mount Union borough
The median household size in Mount Union borough is 2.34 persons per household, with single female/mother households (181 | 20.2%) accounting for the largest median household size of 3.52 persons per household. non-family households (372 | 41.5%) represent the smallest median household size with 1.22 persons per household.
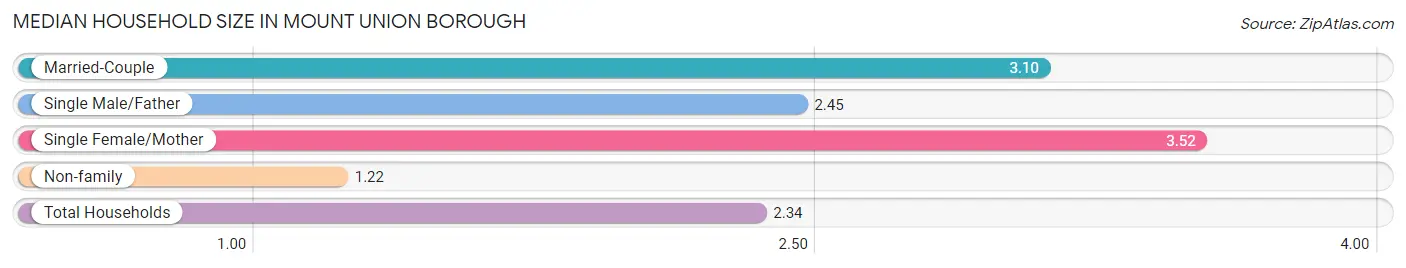
| Household Type | # Households | Household Size |
| Married-Couple | 259 (28.9%) | 3.10 |
| Single Male/Father | 84 (9.4%) | 2.45 |
| Single Female/Mother | 181 (20.2%) | 3.52 |
| Non-family | 372 (41.5%) | 1.22 |
| Total Households | 896 (100.0%) | 2.34 |
Household Size by Marriage Status in Mount Union borough
Out of a total of 896 households in Mount Union borough, 524 (58.5%) are family households, while 372 (41.5%) are nonfamily households. The most numerous type of family households are 2-person households, comprising 209, and the most common type of nonfamily households are 1-person households, comprising 322.
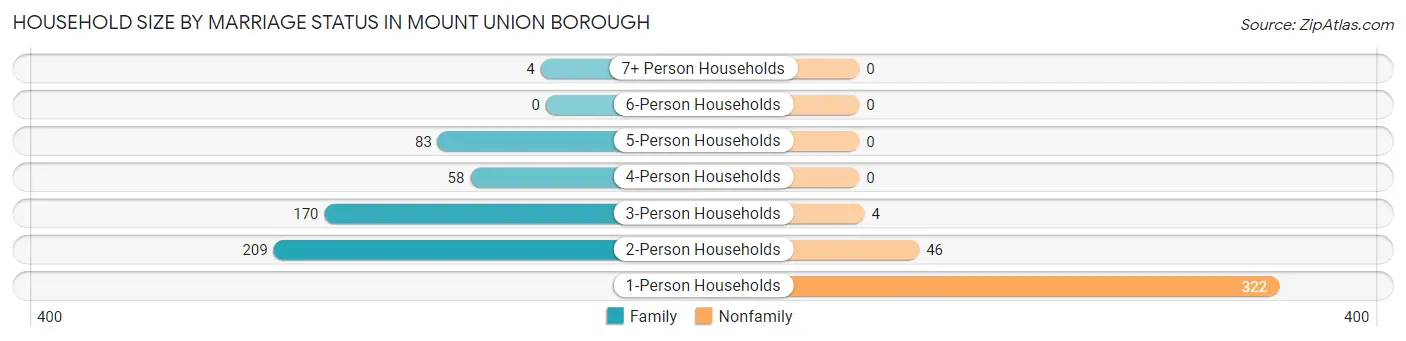
| Household Size | Family Households | Nonfamily Households |
| 1-Person Households | - | 322 (35.9%) |
| 2-Person Households | 209 (23.3%) | 46 (5.1%) |
| 3-Person Households | 170 (19.0%) | 4 (0.4%) |
| 4-Person Households | 58 (6.5%) | 0 (0.0%) |
| 5-Person Households | 83 (9.3%) | 0 (0.0%) |
| 6-Person Households | 0 (0.0%) | 0 (0.0%) |
| 7+ Person Households | 4 (0.4%) | 0 (0.0%) |
| Total | 524 (58.5%) | 372 (41.5%) |
Female Fertility in Mount Union borough
Fertility by Age in Mount Union borough
Average fertility rate in Mount Union borough is 84.0 births per 1,000 women. Women in the age bracket of 20 to 34 years have the highest fertility rate with 141.0 births per 1,000 women. Women in the age bracket of 20 to 34 years acount for 100.0% of all women with births.
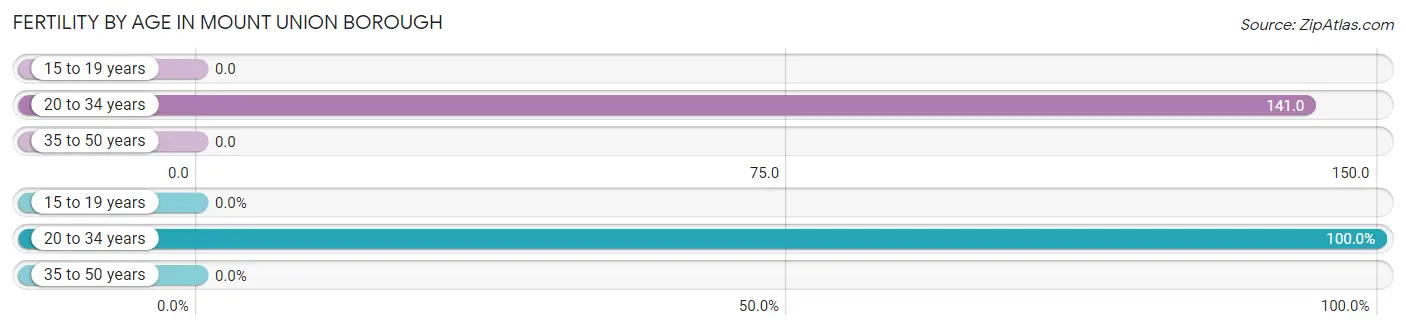
| Age Bracket | Women with Births | Births / 1,000 Women |
| 15 to 19 years | 0 (0.0%) | 0.0 |
| 20 to 34 years | 35 (100.0%) | 141.0 |
| 35 to 50 years | 0 (0.0%) | 0.0 |
| Total | 35 (100.0%) | 84.0 |
Fertility by Age by Marriage Status in Mount Union borough
71.4% of women with births (35) in Mount Union borough are married. The highest percentage of unmarried women with births falls into 20 to 34 years age bracket with 28.6% of them unmarried at the time of birth, while the lowest percentage of unmarried women with births belong to 20 to 34 years age bracket with 28.6% of them unmarried.
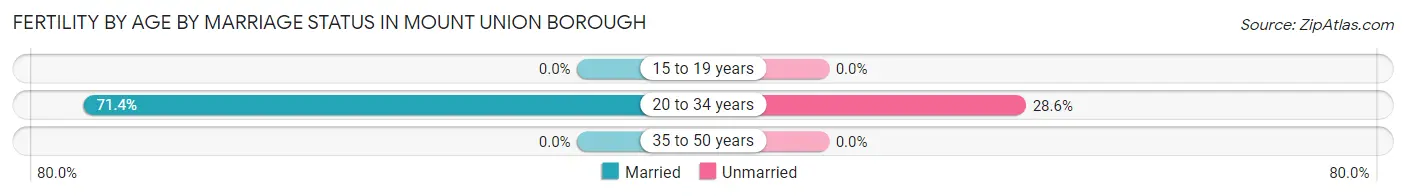
| Age Bracket | Married | Unmarried |
| 15 to 19 years | 0 (0.0%) | 0 (0.0%) |
| 20 to 34 years | 25 (71.4%) | 10 (28.6%) |
| 35 to 50 years | 0 (0.0%) | 0 (0.0%) |
| Total | 25 (71.4%) | 10 (28.6%) |
Fertility by Education in Mount Union borough
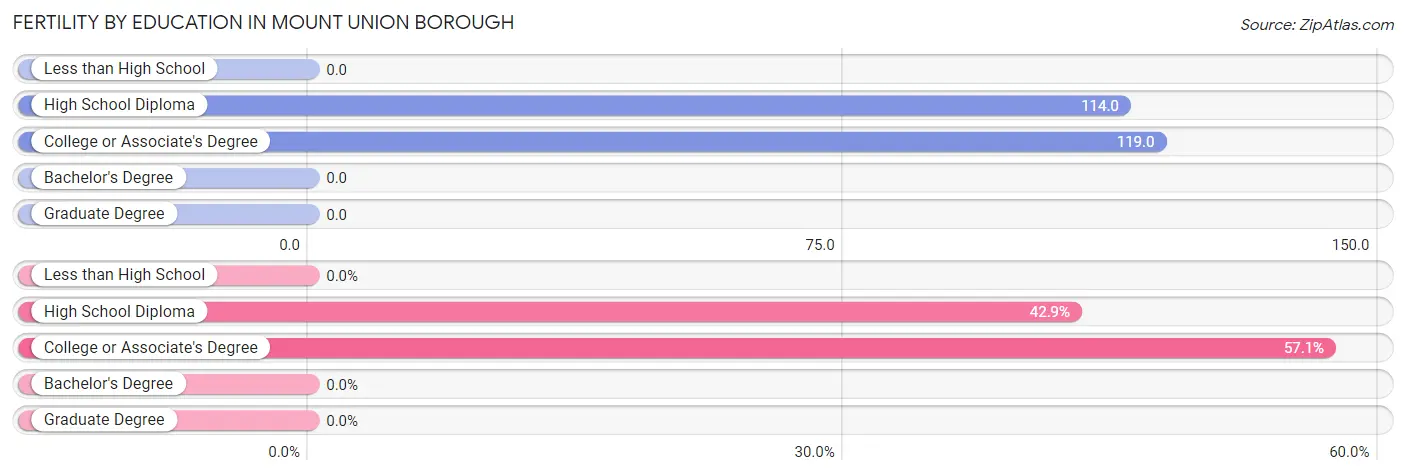
| Educational Attainment | Women with Births | Births / 1,000 Women |
| Less than High School | 0 (0.0%) | 0.0 |
| High School Diploma | 15 (42.9%) | 114.0 |
| College or Associate's Degree | 20 (57.1%) | 119.0 |
| Bachelor's Degree | 0 (0.0%) | 0.0 |
| Graduate Degree | 0 (0.0%) | 0.0 |
| Total | 35 (100.0%) | 84.0 |
Fertility by Education by Marriage Status in Mount Union borough
28.6% of women with births in Mount Union borough are unmarried. Women with the educational attainment of college or associate's degree are most likely to be married with 100.0% of them married at childbirth, while women with the educational attainment of high school diploma are least likely to be married with 66.7% of them unmarried at childbirth.
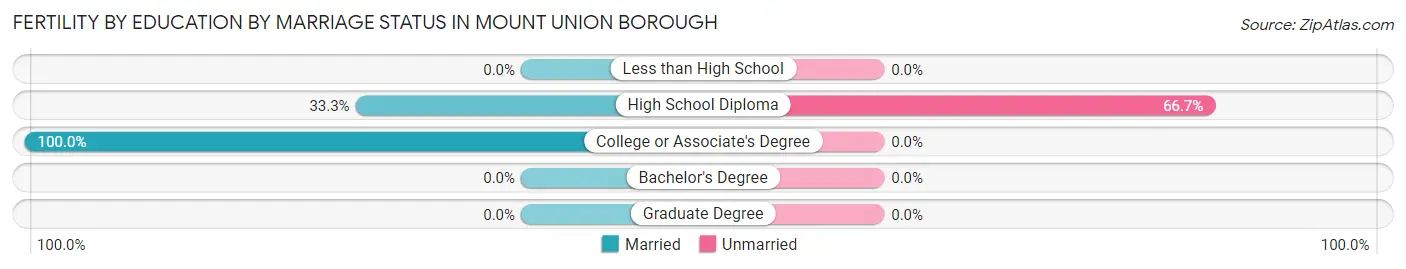
| Educational Attainment | Married | Unmarried |
| Less than High School | 0 (0.0%) | 0 (0.0%) |
| High School Diploma | 5 (33.3%) | 10 (66.7%) |
| College or Associate's Degree | 20 (100.0%) | 0 (0.0%) |
| Bachelor's Degree | 0 (0.0%) | 0 (0.0%) |
| Graduate Degree | 0 (0.0%) | 0 (0.0%) |
| Total | 25 (71.4%) | 10 (28.6%) |
Employment Characteristics in Mount Union borough
Employment by Class of Employer in Mount Union borough
Among the 826 employed individuals in Mount Union borough, private company employees (557 | 67.4%), not-for-profit organizations (122 | 14.8%), and state government employees (47 | 5.7%) make up the most common classes of employment.
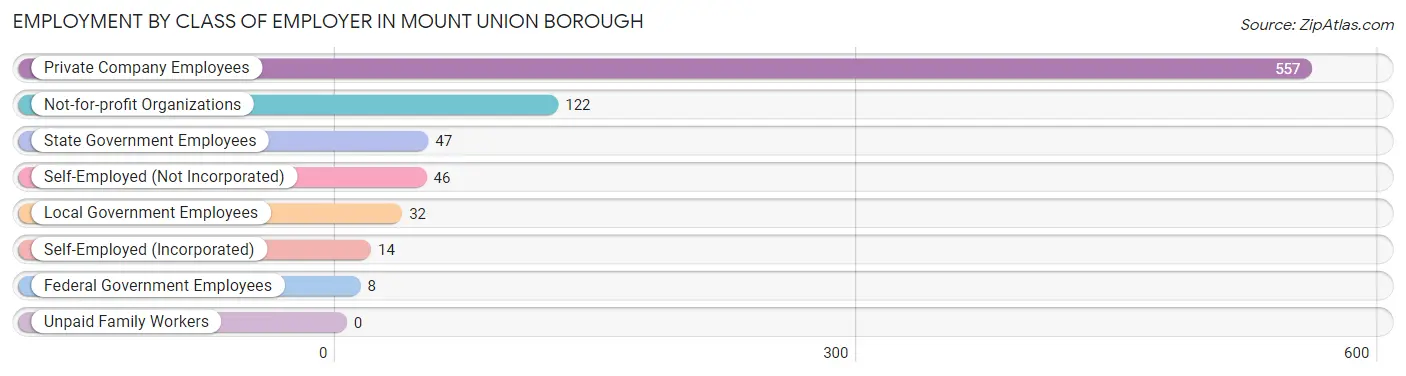
| Employer Class | # Employees | % Employees |
| Private Company Employees | 557 | 67.4% |
| Self-Employed (Incorporated) | 14 | 1.7% |
| Self-Employed (Not Incorporated) | 46 | 5.6% |
| Not-for-profit Organizations | 122 | 14.8% |
| Local Government Employees | 32 | 3.9% |
| State Government Employees | 47 | 5.7% |
| Federal Government Employees | 8 | 1.0% |
| Unpaid Family Workers | 0 | 0.0% |
| Total | 826 | 100.0% |
Employment Status by Age in Mount Union borough
According to the labor force statistics for Mount Union borough, out of the total population over 16 years of age (1,642), 59.5% or 977 individuals are in the labor force, with 14.0% or 137 of them unemployed. The age group with the highest labor force participation rate is 35 to 44 years, with 92.1% or 139 individuals in the labor force. Within the labor force, the 16 to 19 years age range has the highest percentage of unemployed individuals, with 64.3% or 27 of them being unemployed.
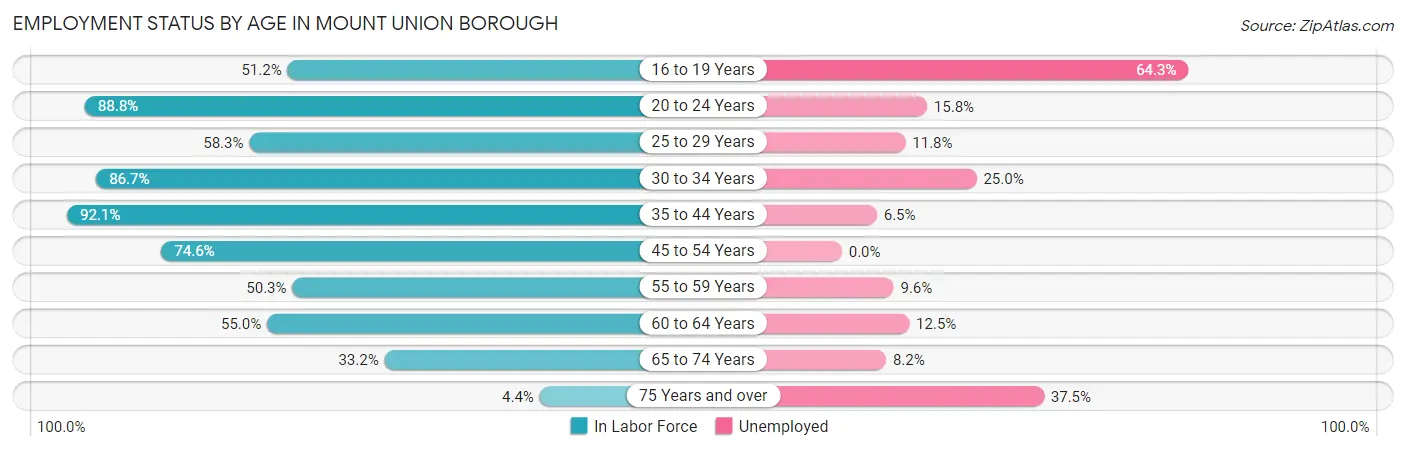
| Age Bracket | In Labor Force | Unemployed |
| 16 to 19 Years | 42 (51.2%) | 27 (64.3%) |
| 20 to 24 Years | 95 (88.8%) | 15 (15.8%) |
| 25 to 29 Years | 102 (58.3%) | 12 (11.8%) |
| 30 to 34 Years | 196 (86.7%) | 49 (25.0%) |
| 35 to 44 Years | 139 (92.1%) | 9 (6.5%) |
| 45 to 54 Years | 179 (74.6%) | 0 (0.0%) |
| 55 to 59 Years | 83 (50.3%) | 8 (9.6%) |
| 60 to 64 Years | 72 (55.0%) | 9 (12.5%) |
| 65 to 74 Years | 61 (33.2%) | 5 (8.2%) |
| 75 Years and over | 8 (4.4%) | 3 (37.5%) |
| Total | 977 (59.5%) | 137 (14.0%) |
Employment Status by Educational Attainment in Mount Union borough
According to labor force statistics for Mount Union borough, 70.9% of individuals (771) out of the total population between 25 and 64 years of age (1,088) are in the labor force, with 11.3% or 87 of them being unemployed. The group with the highest labor force participation rate are those with the educational attainment of bachelor's degree or higher, with 78.9% or 90 individuals in the labor force. Within the labor force, individuals with college / associate degree education have the highest percentage of unemployment, with 17.9% or 38 of them being unemployed.
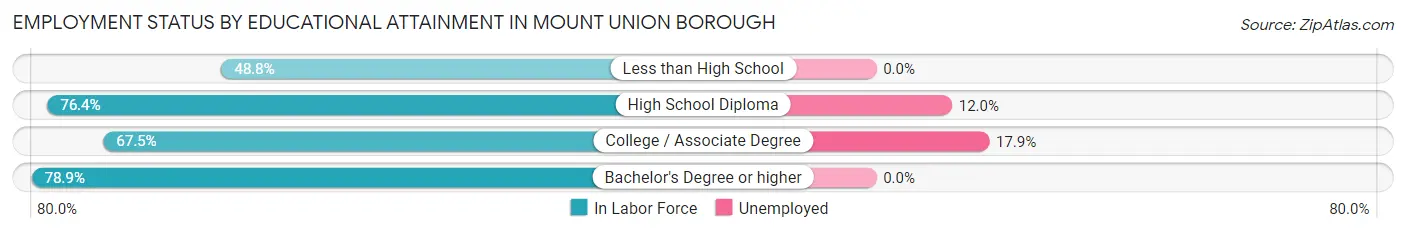
| Educational Attainment | In Labor Force | Unemployed |
| Less than High School | 62 (48.8%) | 0 (0.0%) |
| High School Diploma | 407 (76.4%) | 64 (12.0%) |
| College / Associate Degree | 212 (67.5%) | 56 (17.9%) |
| Bachelor's Degree or higher | 90 (78.9%) | 0 (0.0%) |
| Total | 771 (70.9%) | 123 (11.3%) |
Employment Occupations by Sex in Mount Union borough
Management, Business, Science and Arts Occupations
The most common Management, Business, Science and Arts occupations in Mount Union borough are Community & Social Service (80 | 9.5%), Business & Financial (71 | 8.5%), Health Diagnosing & Treating (59 | 7.0%), Management (42 | 5.0%), and Education, Arts & Media (37 | 4.4%).
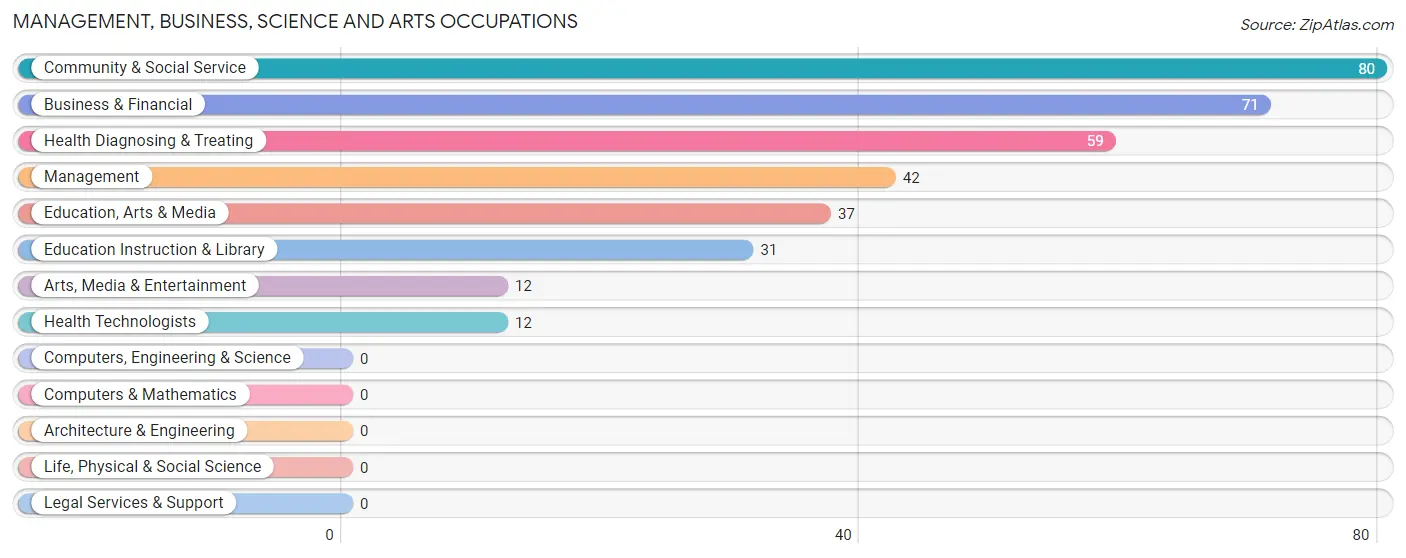
Management, Business, Science and Arts Occupations by Sex
Within the Management, Business, Science and Arts occupations in Mount Union borough, the most male-oriented occupations are Arts, Media & Entertainment (66.7%), Management (61.9%), and Education, Arts & Media (54.0%), while the most female-oriented occupations are Health Diagnosing & Treating (100.0%), Health Technologists (100.0%), and Business & Financial (95.8%).
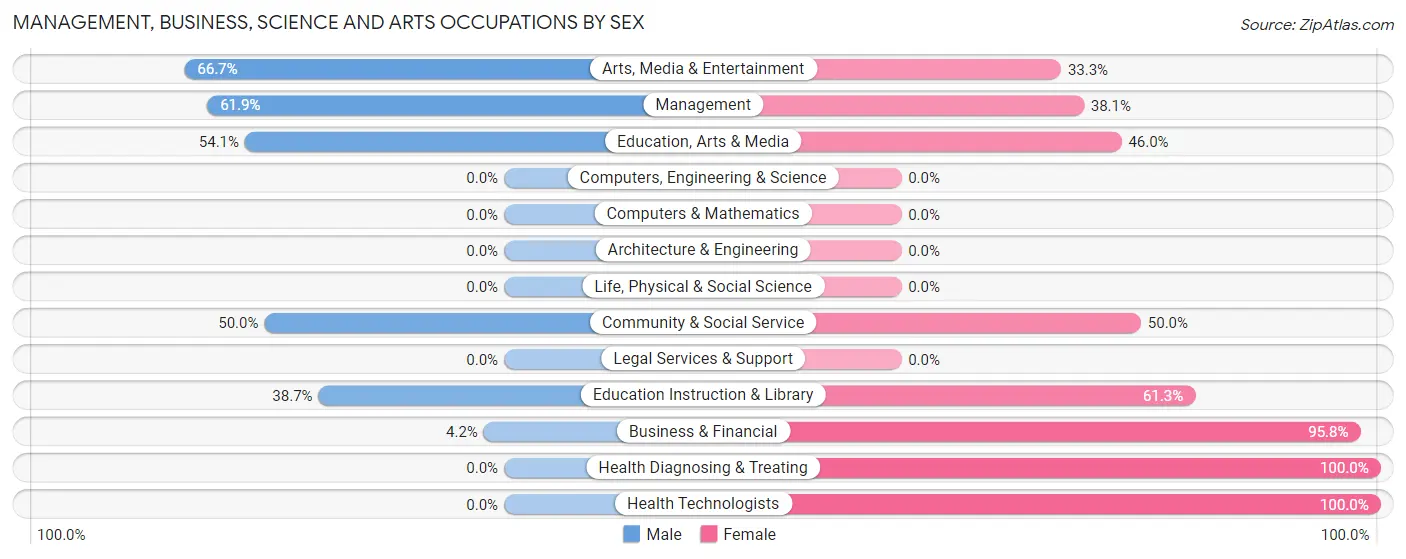
| Occupation | Male | Female |
| Management | 26 (61.9%) | 16 (38.1%) |
| Business & Financial | 3 (4.2%) | 68 (95.8%) |
| Computers, Engineering & Science | 0 (0.0%) | 0 (0.0%) |
| Computers & Mathematics | 0 (0.0%) | 0 (0.0%) |
| Architecture & Engineering | 0 (0.0%) | 0 (0.0%) |
| Life, Physical & Social Science | 0 (0.0%) | 0 (0.0%) |
| Community & Social Service | 40 (50.0%) | 40 (50.0%) |
| Education, Arts & Media | 20 (54.0%) | 17 (46.0%) |
| Legal Services & Support | 0 (0.0%) | 0 (0.0%) |
| Education Instruction & Library | 12 (38.7%) | 19 (61.3%) |
| Arts, Media & Entertainment | 8 (66.7%) | 4 (33.3%) |
| Health Diagnosing & Treating | 0 (0.0%) | 59 (100.0%) |
| Health Technologists | 0 (0.0%) | 12 (100.0%) |
| Total (Category) | 69 (27.4%) | 183 (72.6%) |
| Total (Overall) | 488 (58.1%) | 352 (41.9%) |
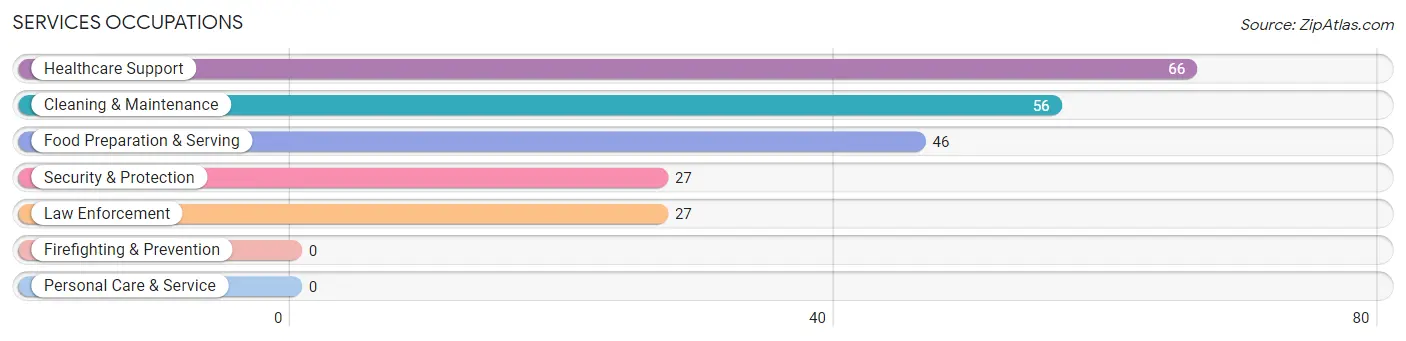
Services Occupations
The most common Services occupations in Mount Union borough are Healthcare Support (66 | 7.9%), Cleaning & Maintenance (56 | 6.7%), Food Preparation & Serving (46 | 5.5%), Security & Protection (27 | 3.2%), and Law Enforcement (27 | 3.2%).
Services Occupations by Sex
Within the Services occupations in Mount Union borough, the most male-oriented occupations are Security & Protection (100.0%), Law Enforcement (100.0%), and Cleaning & Maintenance (91.1%), while the most female-oriented occupations are Food Preparation & Serving (87.0%), Healthcare Support (78.8%), and Cleaning & Maintenance (8.9%).
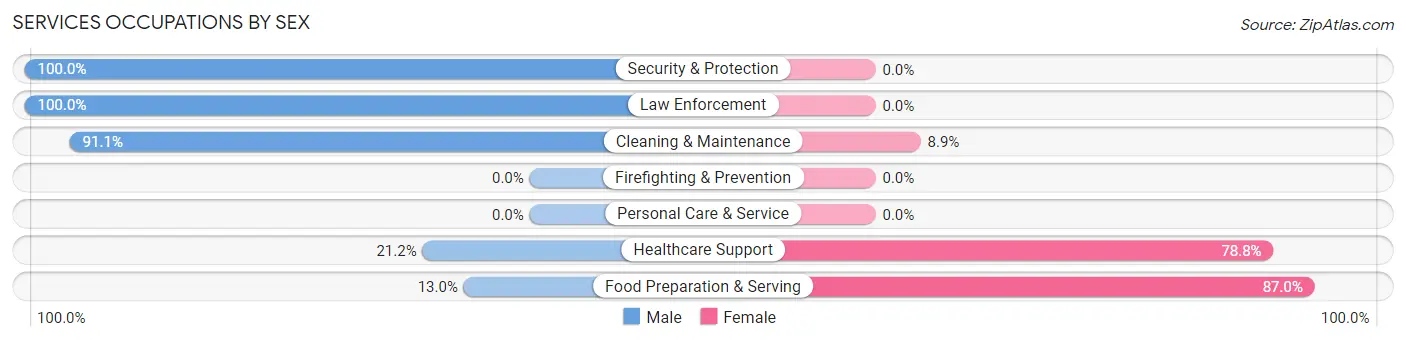
| Occupation | Male | Female |
| Healthcare Support | 14 (21.2%) | 52 (78.8%) |
| Security & Protection | 27 (100.0%) | 0 (0.0%) |
| Firefighting & Prevention | 0 (0.0%) | 0 (0.0%) |
| Law Enforcement | 27 (100.0%) | 0 (0.0%) |
| Food Preparation & Serving | 6 (13.0%) | 40 (87.0%) |
| Cleaning & Maintenance | 51 (91.1%) | 5 (8.9%) |
| Personal Care & Service | 0 (0.0%) | 0 (0.0%) |
| Total (Category) | 98 (50.3%) | 97 (49.7%) |
| Total (Overall) | 488 (58.1%) | 352 (41.9%) |
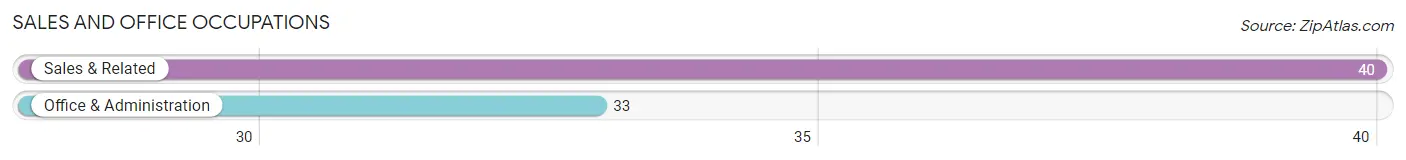
Sales and Office Occupations
The most common Sales and Office occupations in Mount Union borough are Sales & Related (40 | 4.8%), and Office & Administration (33 | 3.9%).
Sales and Office Occupations by Sex
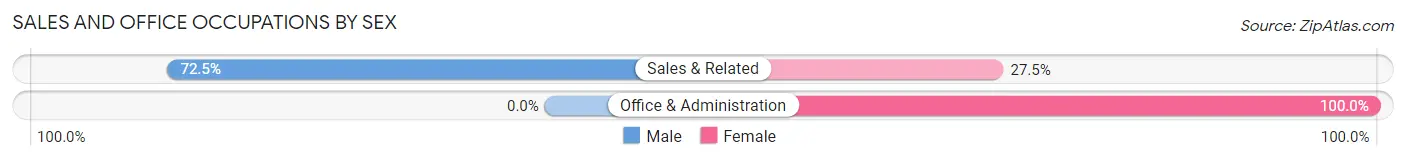
| Occupation | Male | Female |
| Sales & Related | 29 (72.5%) | 11 (27.5%) |
| Office & Administration | 0 (0.0%) | 33 (100.0%) |
| Total (Category) | 29 (39.7%) | 44 (60.3%) |
| Total (Overall) | 488 (58.1%) | 352 (41.9%) |
Natural Resources, Construction and Maintenance Occupations
The most common Natural Resources, Construction and Maintenance occupations in Mount Union borough are Construction & Extraction (58 | 6.9%), and Installation, Maintenance & Repair (35 | 4.2%).
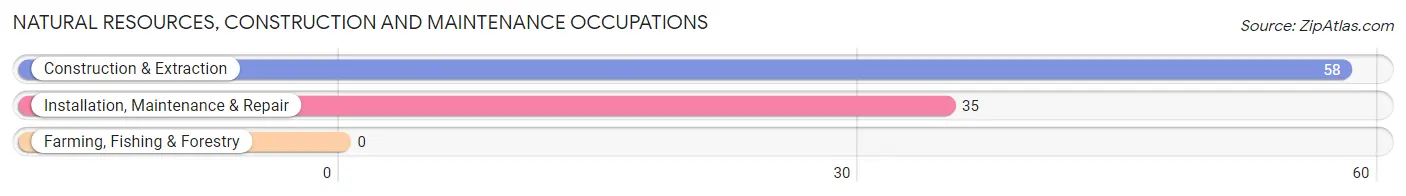
Natural Resources, Construction and Maintenance Occupations by Sex
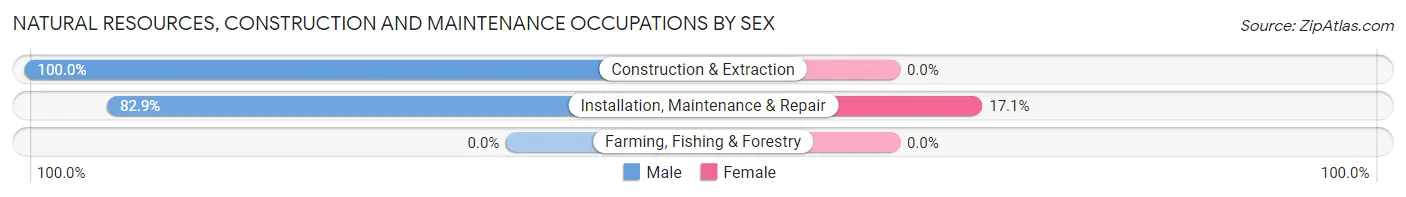
| Occupation | Male | Female |
| Farming, Fishing & Forestry | 0 (0.0%) | 0 (0.0%) |
| Construction & Extraction | 58 (100.0%) | 0 (0.0%) |
| Installation, Maintenance & Repair | 29 (82.9%) | 6 (17.1%) |
| Total (Category) | 87 (93.5%) | 6 (6.5%) |
| Total (Overall) | 488 (58.1%) | 352 (41.9%) |
Production, Transportation and Moving Occupations
The most common Production, Transportation and Moving occupations in Mount Union borough are Production (125 | 14.9%), Material Moving (65 | 7.7%), and Transportation (37 | 4.4%).
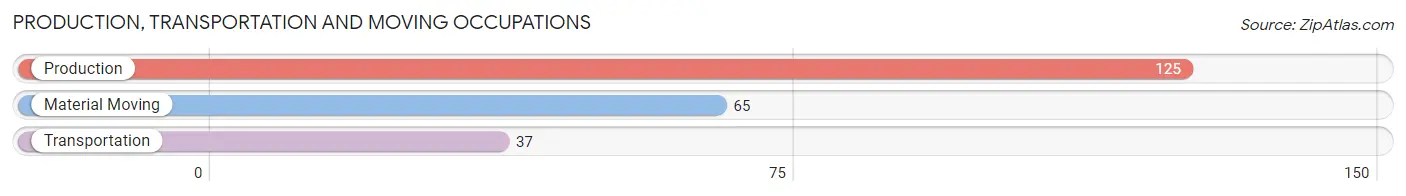
Production, Transportation and Moving Occupations by Sex
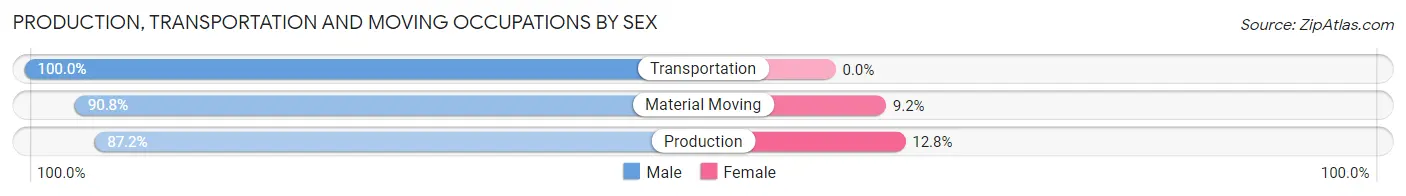
| Occupation | Male | Female |
| Production | 109 (87.2%) | 16 (12.8%) |
| Transportation | 37 (100.0%) | 0 (0.0%) |
| Material Moving | 59 (90.8%) | 6 (9.2%) |
| Total (Category) | 205 (90.3%) | 22 (9.7%) |
| Total (Overall) | 488 (58.1%) | 352 (41.9%) |
Employment Industries by Sex in Mount Union borough
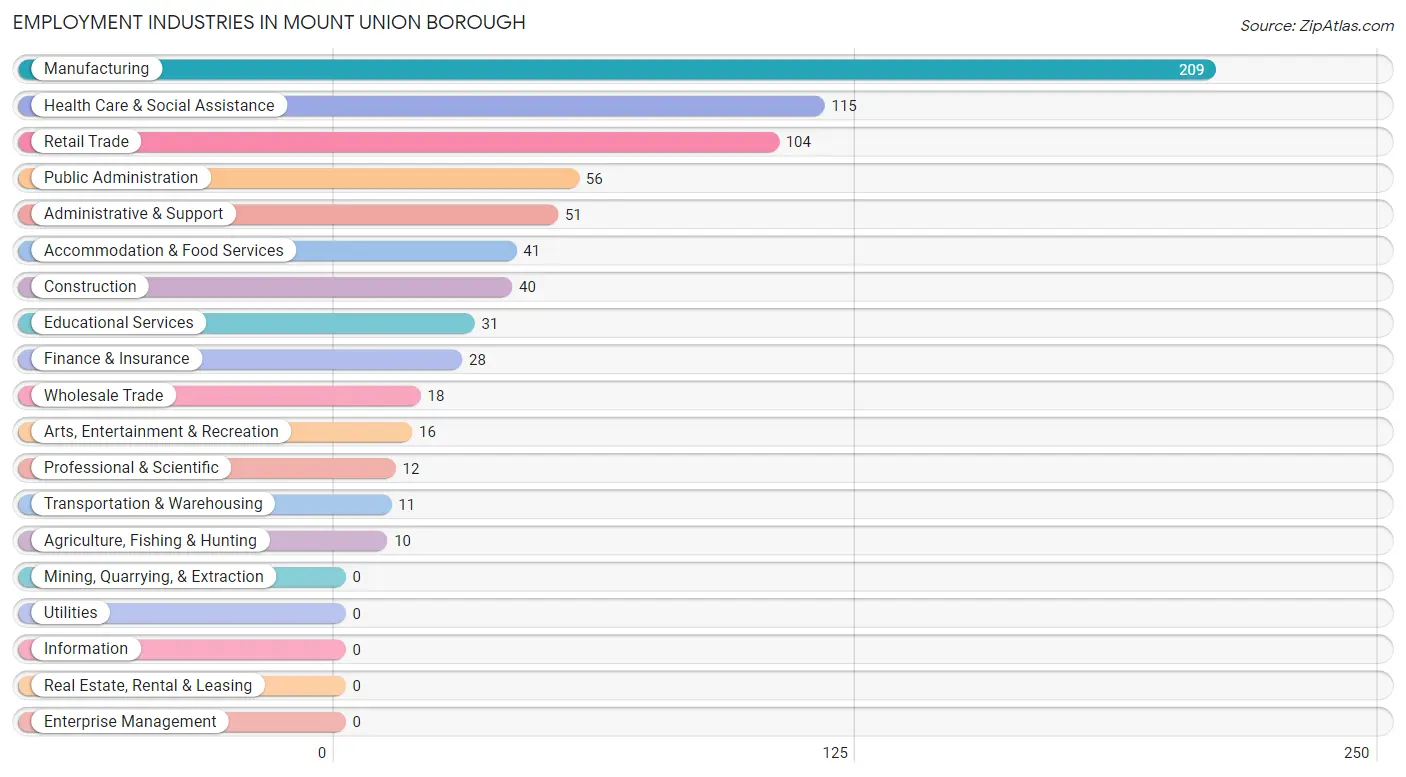
Employment Industries in Mount Union borough
The major employment industries in Mount Union borough include Manufacturing (209 | 24.9%), Health Care & Social Assistance (115 | 13.7%), Retail Trade (104 | 12.4%), Public Administration (56 | 6.7%), and Administrative & Support (51 | 6.1%).
Employment Industries by Sex in Mount Union borough
The Mount Union borough industries that see more men than women are Agriculture, Fishing & Hunting (100.0%), Construction (100.0%), and Wholesale Trade (100.0%), whereas the industries that tend to have a higher number of women are Finance & Insurance (100.0%), Professional & Scientific (100.0%), and Health Care & Social Assistance (100.0%).
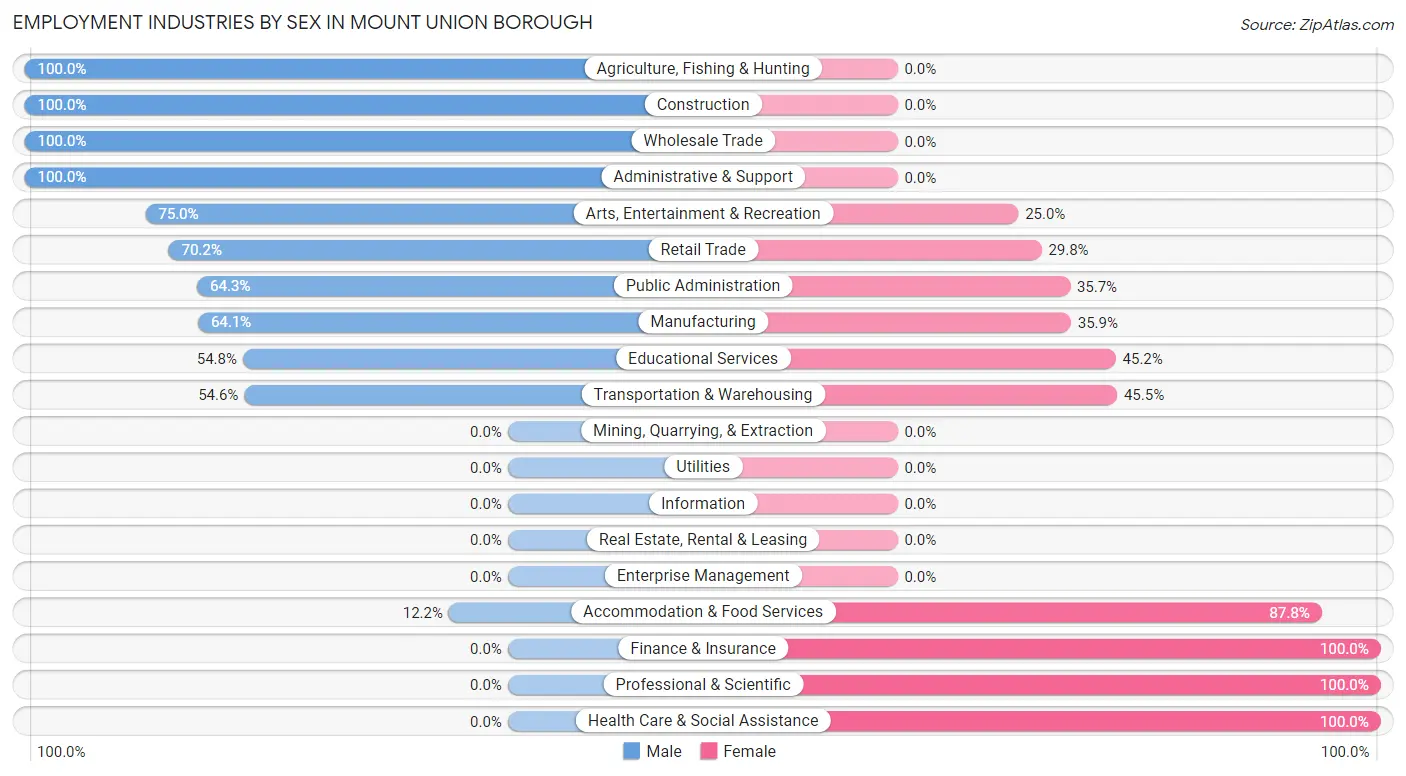
| Industry | Male | Female |
| Agriculture, Fishing & Hunting | 10 (100.0%) | 0 (0.0%) |
| Mining, Quarrying, & Extraction | 0 (0.0%) | 0 (0.0%) |
| Construction | 40 (100.0%) | 0 (0.0%) |
| Manufacturing | 134 (64.1%) | 75 (35.9%) |
| Wholesale Trade | 18 (100.0%) | 0 (0.0%) |
| Retail Trade | 73 (70.2%) | 31 (29.8%) |
| Transportation & Warehousing | 6 (54.5%) | 5 (45.5%) |
| Utilities | 0 (0.0%) | 0 (0.0%) |
| Information | 0 (0.0%) | 0 (0.0%) |
| Finance & Insurance | 0 (0.0%) | 28 (100.0%) |
| Real Estate, Rental & Leasing | 0 (0.0%) | 0 (0.0%) |
| Professional & Scientific | 0 (0.0%) | 12 (100.0%) |
| Enterprise Management | 0 (0.0%) | 0 (0.0%) |
| Administrative & Support | 51 (100.0%) | 0 (0.0%) |
| Educational Services | 17 (54.8%) | 14 (45.2%) |
| Health Care & Social Assistance | 0 (0.0%) | 115 (100.0%) |
| Arts, Entertainment & Recreation | 12 (75.0%) | 4 (25.0%) |
| Accommodation & Food Services | 5 (12.2%) | 36 (87.8%) |
| Public Administration | 36 (64.3%) | 20 (35.7%) |
| Total | 488 (58.1%) | 352 (41.9%) |
Education in Mount Union borough
School Enrollment in Mount Union borough
The most common levels of schooling among the 414 students in Mount Union borough are middle school (126 | 30.4%), elementary school (111 | 26.8%), and high school (97 | 23.4%).
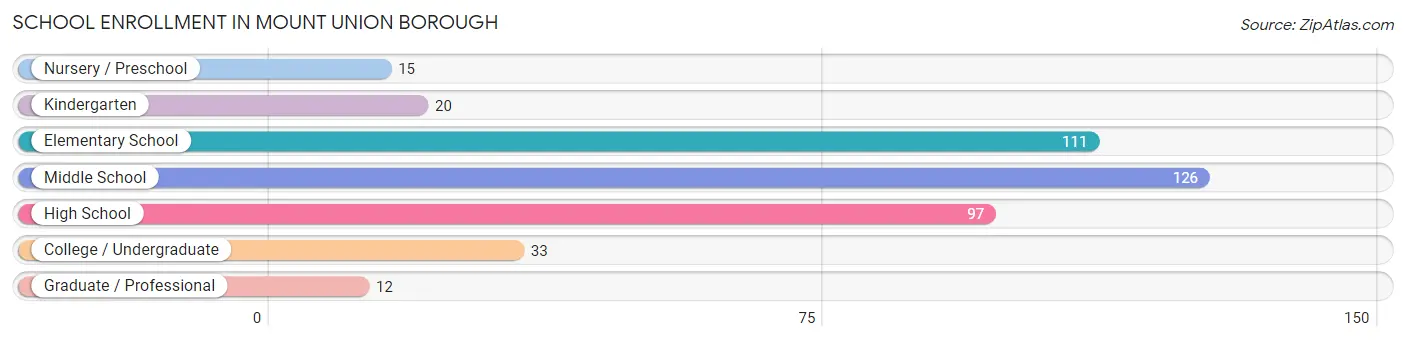
| School Level | # Students | % Students |
| Nursery / Preschool | 15 | 3.6% |
| Kindergarten | 20 | 4.8% |
| Elementary School | 111 | 26.8% |
| Middle School | 126 | 30.4% |
| High School | 97 | 23.4% |
| College / Undergraduate | 33 | 8.0% |
| Graduate / Professional | 12 | 2.9% |
| Total | 414 | 100.0% |
School Enrollment by Age by Funding Source in Mount Union borough
Out of a total of 414 students who are enrolled in schools in Mount Union borough, 63 (15.2%) attend a private institution, while the remaining 351 (84.8%) are enrolled in public schools. The age group of 20 to 24 year olds has the highest likelihood of being enrolled in private schools, with 7 (100.0% in the age bracket) enrolled. Conversely, the age group of 3 to 4 year olds has the lowest likelihood of being enrolled in a private school, with 5 (100.0% in the age bracket) attending a public institution.
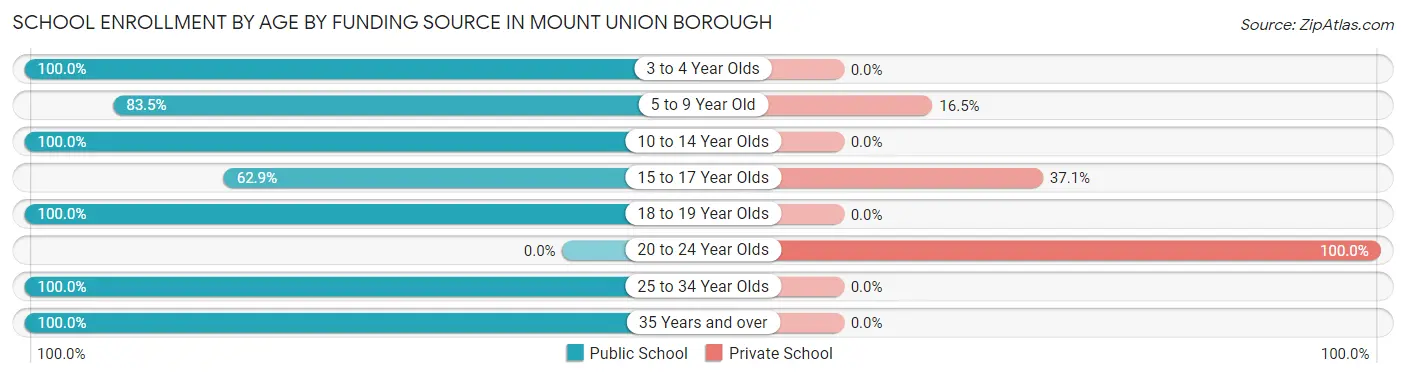
| Age Bracket | Public School | Private School |
| 3 to 4 Year Olds | 5 (100.0%) | 0 (0.0%) |
| 5 to 9 Year Old | 101 (83.5%) | 20 (16.5%) |
| 10 to 14 Year Olds | 146 (100.0%) | 0 (0.0%) |
| 15 to 17 Year Olds | 61 (62.9%) | 36 (37.1%) |
| 18 to 19 Year Olds | 11 (100.0%) | 0 (0.0%) |
| 20 to 24 Year Olds | 0 (0.0%) | 7 (100.0%) |
| 25 to 34 Year Olds | 14 (100.0%) | 0 (0.0%) |
| 35 Years and over | 13 (100.0%) | 0 (0.0%) |
| Total | 351 (84.8%) | 63 (15.2%) |
Educational Attainment by Field of Study in Mount Union borough
Business (52 | 34.9%), science & technology (26 | 17.4%), arts & humanities (21 | 14.1%), education (17 | 11.4%), and physical & health sciences (12 | 8.1%) are the most common fields of study among 149 individuals in Mount Union borough who have obtained a bachelor's degree or higher.
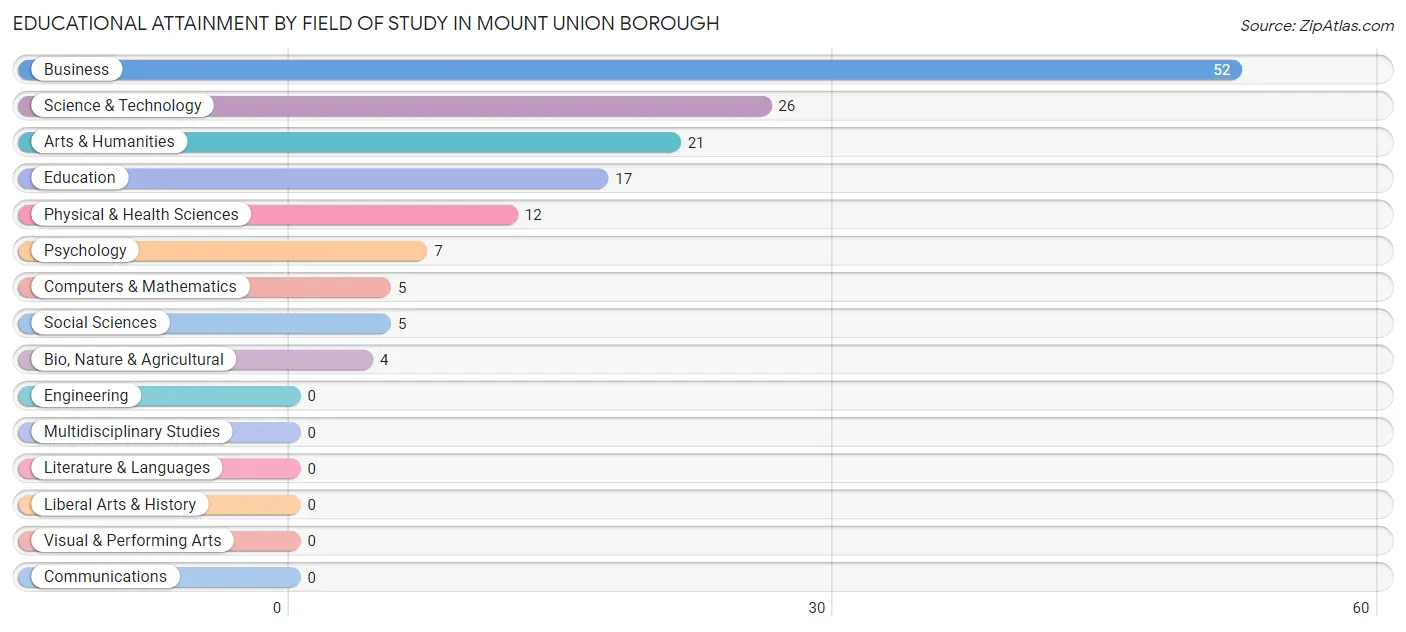
| Field of Study | # Graduates | % Graduates |
| Computers & Mathematics | 5 | 3.4% |
| Bio, Nature & Agricultural | 4 | 2.7% |
| Physical & Health Sciences | 12 | 8.1% |
| Psychology | 7 | 4.7% |
| Social Sciences | 5 | 3.4% |
| Engineering | 0 | 0.0% |
| Multidisciplinary Studies | 0 | 0.0% |
| Science & Technology | 26 | 17.4% |
| Business | 52 | 34.9% |
| Education | 17 | 11.4% |
| Literature & Languages | 0 | 0.0% |
| Liberal Arts & History | 0 | 0.0% |
| Visual & Performing Arts | 0 | 0.0% |
| Communications | 0 | 0.0% |
| Arts & Humanities | 21 | 14.1% |
| Total | 149 | 100.0% |
Transportation & Commute in Mount Union borough
Vehicle Availability by Sex in Mount Union borough
The most prevalent vehicle ownership categories in Mount Union borough are males with 2 vehicles (202, accounting for 42.7%) and females with 2 vehicles (139, making up 58.9%).
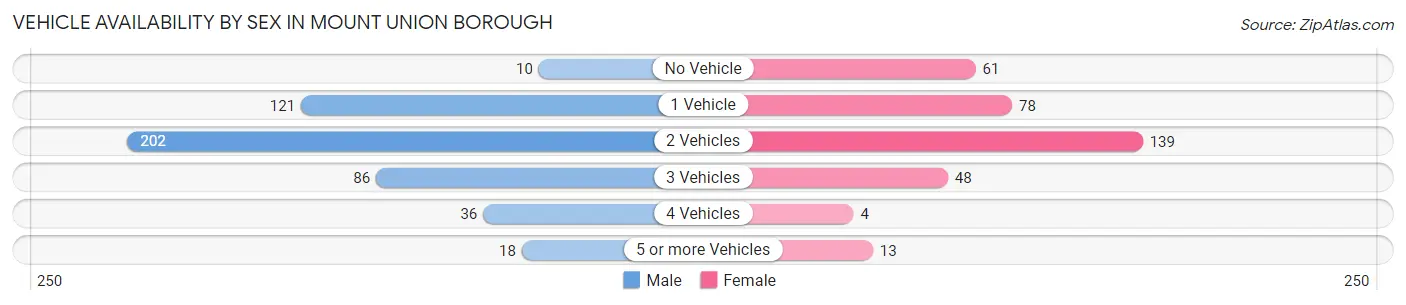
| Vehicles Available | Male | Female |
| No Vehicle | 10 (2.1%) | 61 (17.8%) |
| 1 Vehicle | 121 (25.6%) | 78 (22.7%) |
| 2 Vehicles | 202 (42.7%) | 139 (40.5%) |
| 3 Vehicles | 86 (18.2%) | 48 (14.0%) |
| 4 Vehicles | 36 (7.6%) | 4 (1.2%) |
| 5 or more Vehicles | 18 (3.8%) | 13 (3.8%) |
| Total | 473 (100.0%) | 343 (100.0%) |
Commute Time in Mount Union borough
The most frequently occuring commute durations in Mount Union borough are 45 to 59 minutes (136 commuters, 16.8%), 20 to 24 minutes (100 commuters, 12.3%), and 5 to 9 minutes (86 commuters, 10.6%).
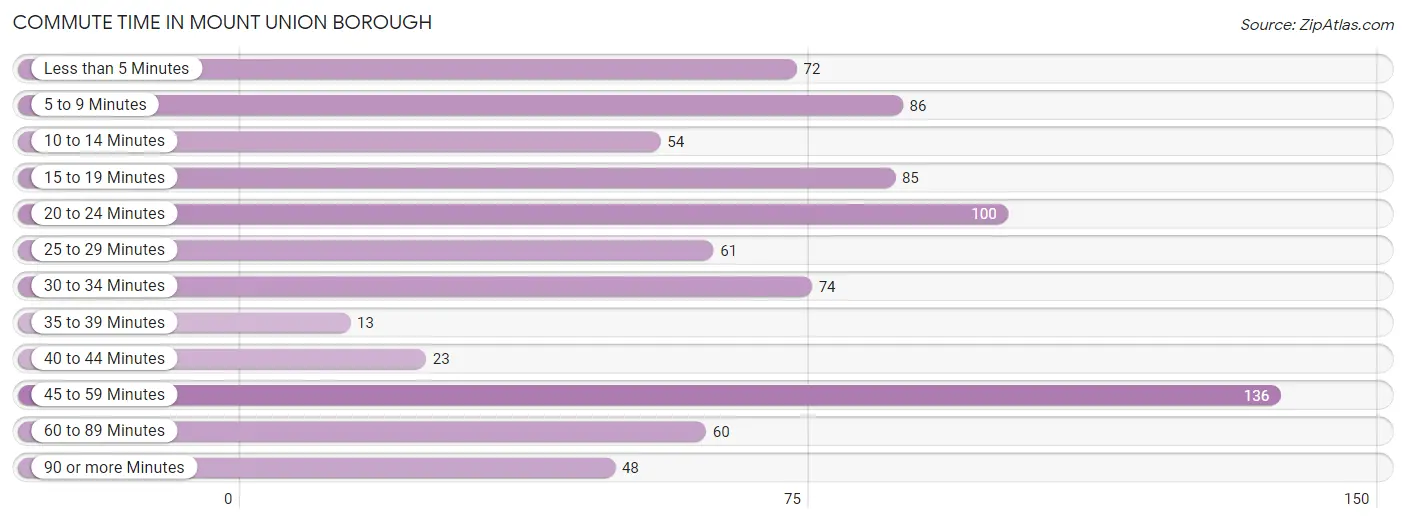
| Commute Time | # Commuters | % Commuters |
| Less than 5 Minutes | 72 | 8.9% |
| 5 to 9 Minutes | 86 | 10.6% |
| 10 to 14 Minutes | 54 | 6.7% |
| 15 to 19 Minutes | 85 | 10.5% |
| 20 to 24 Minutes | 100 | 12.3% |
| 25 to 29 Minutes | 61 | 7.5% |
| 30 to 34 Minutes | 74 | 9.1% |
| 35 to 39 Minutes | 13 | 1.6% |
| 40 to 44 Minutes | 23 | 2.8% |
| 45 to 59 Minutes | 136 | 16.8% |
| 60 to 89 Minutes | 60 | 7.4% |
| 90 or more Minutes | 48 | 5.9% |
Commute Time by Sex in Mount Union borough
The most common commute times in Mount Union borough are 45 to 59 minutes (88 commuters, 18.2%) for males and 25 to 29 minutes (55 commuters, 16.7%) for females.
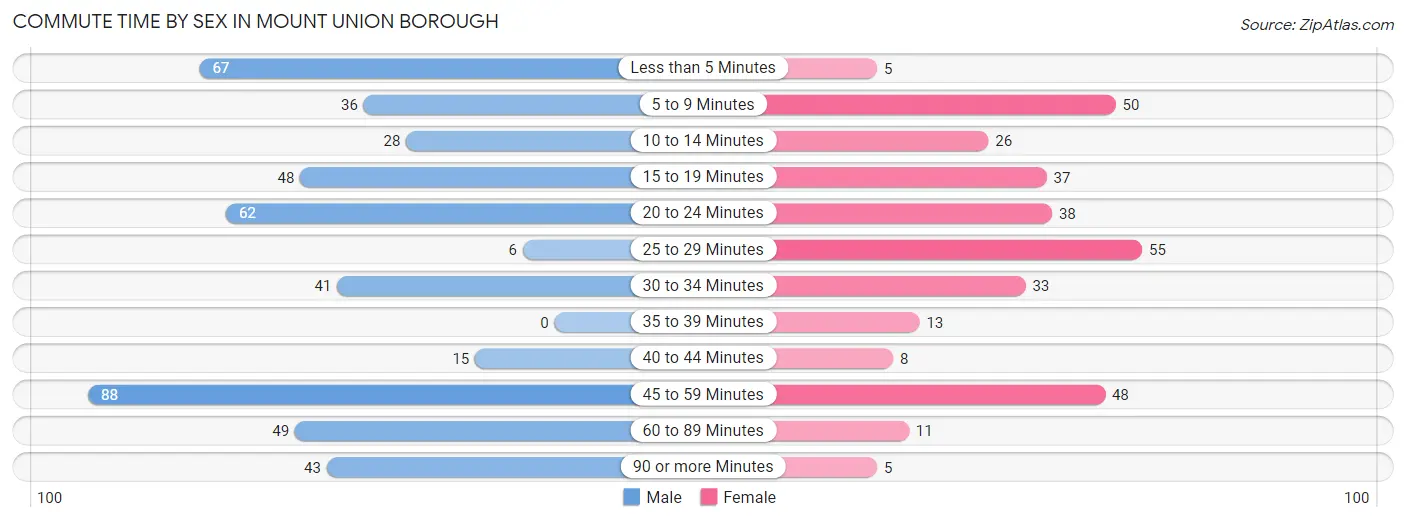
| Commute Time | Male | Female |
| Less than 5 Minutes | 67 (13.9%) | 5 (1.5%) |
| 5 to 9 Minutes | 36 (7.4%) | 50 (15.2%) |
| 10 to 14 Minutes | 28 (5.8%) | 26 (7.9%) |
| 15 to 19 Minutes | 48 (9.9%) | 37 (11.3%) |
| 20 to 24 Minutes | 62 (12.8%) | 38 (11.6%) |
| 25 to 29 Minutes | 6 (1.2%) | 55 (16.7%) |
| 30 to 34 Minutes | 41 (8.5%) | 33 (10.0%) |
| 35 to 39 Minutes | 0 (0.0%) | 13 (4.0%) |
| 40 to 44 Minutes | 15 (3.1%) | 8 (2.4%) |
| 45 to 59 Minutes | 88 (18.2%) | 48 (14.6%) |
| 60 to 89 Minutes | 49 (10.1%) | 11 (3.3%) |
| 90 or more Minutes | 43 (8.9%) | 5 (1.5%) |
Time of Departure to Work by Sex in Mount Union borough
The most frequent times of departure to work in Mount Union borough are 4:00 PM to 11:59 PM (110, 22.8%) for males and 6:00 AM to 6:29 AM (62, 18.8%) for females.
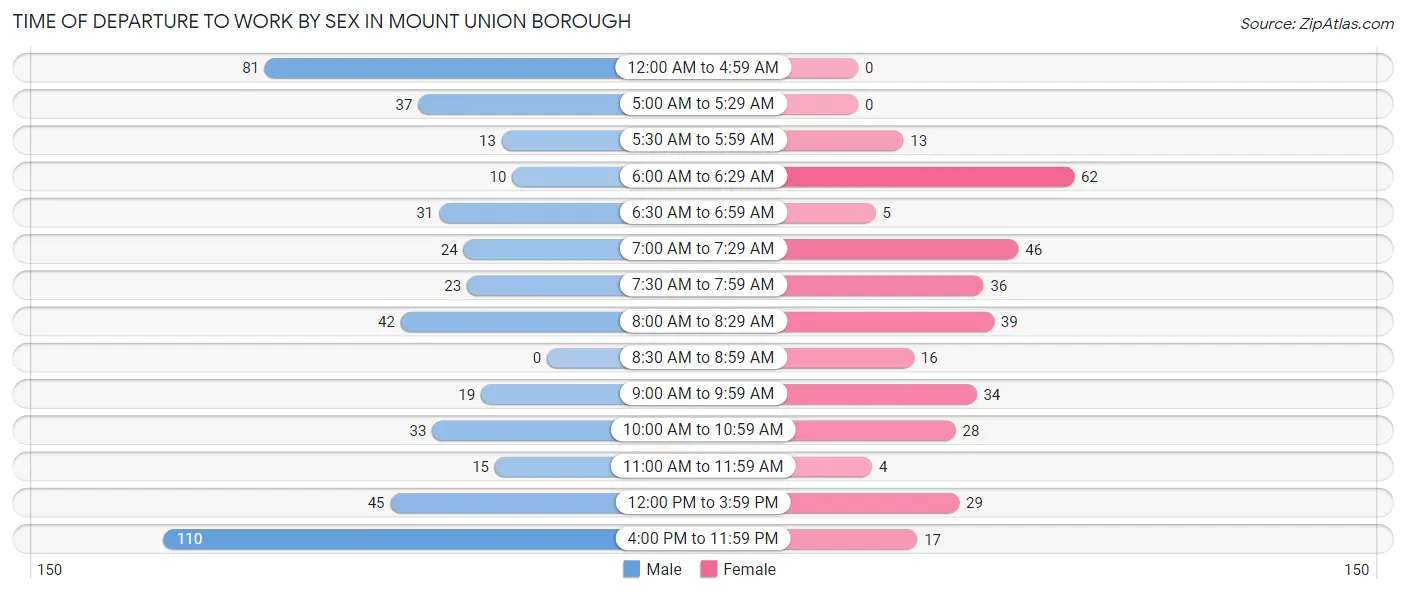
| Time of Departure | Male | Female |
| 12:00 AM to 4:59 AM | 81 (16.8%) | 0 (0.0%) |
| 5:00 AM to 5:29 AM | 37 (7.7%) | 0 (0.0%) |
| 5:30 AM to 5:59 AM | 13 (2.7%) | 13 (4.0%) |
| 6:00 AM to 6:29 AM | 10 (2.1%) | 62 (18.8%) |
| 6:30 AM to 6:59 AM | 31 (6.4%) | 5 (1.5%) |
| 7:00 AM to 7:29 AM | 24 (5.0%) | 46 (14.0%) |
| 7:30 AM to 7:59 AM | 23 (4.8%) | 36 (10.9%) |
| 8:00 AM to 8:29 AM | 42 (8.7%) | 39 (11.8%) |
| 8:30 AM to 8:59 AM | 0 (0.0%) | 16 (4.9%) |
| 9:00 AM to 9:59 AM | 19 (3.9%) | 34 (10.3%) |
| 10:00 AM to 10:59 AM | 33 (6.8%) | 28 (8.5%) |
| 11:00 AM to 11:59 AM | 15 (3.1%) | 4 (1.2%) |
| 12:00 PM to 3:59 PM | 45 (9.3%) | 29 (8.8%) |
| 4:00 PM to 11:59 PM | 110 (22.8%) | 17 (5.2%) |
| Total | 483 (100.0%) | 329 (100.0%) |
Housing Occupancy in Mount Union borough
Occupancy by Ownership in Mount Union borough
Of the total 896 dwellings in Mount Union borough, owner-occupied units account for 446 (49.8%), while renter-occupied units make up 450 (50.2%).
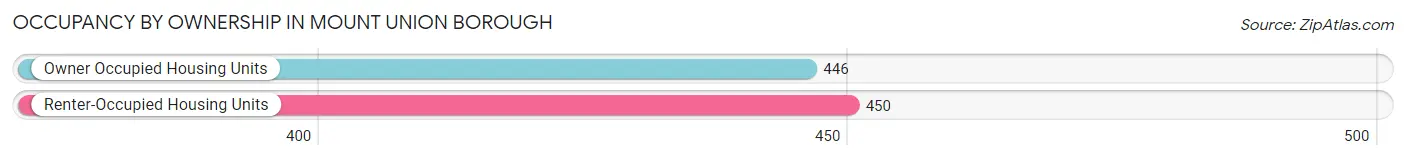
| Occupancy | # Housing Units | % Housing Units |
| Owner Occupied Housing Units | 446 | 49.8% |
| Renter-Occupied Housing Units | 450 | 50.2% |
| Total Occupied Housing Units | 896 | 100.0% |
Occupancy by Household Size in Mount Union borough
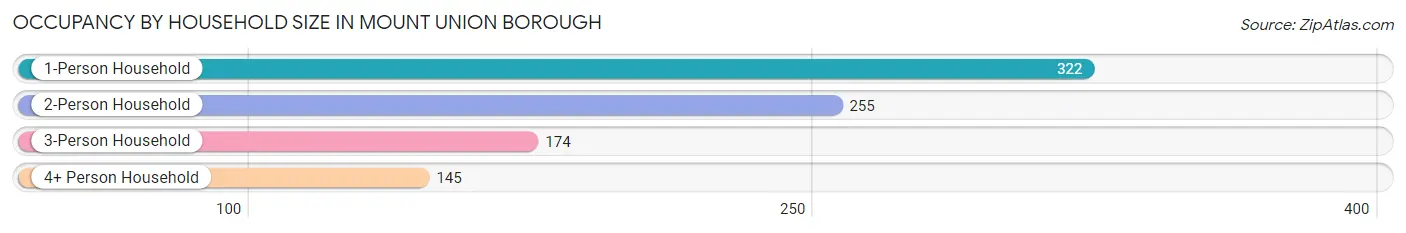
| Household Size | # Housing Units | % Housing Units |
| 1-Person Household | 322 | 35.9% |
| 2-Person Household | 255 | 28.5% |
| 3-Person Household | 174 | 19.4% |
| 4+ Person Household | 145 | 16.2% |
| Total Housing Units | 896 | 100.0% |
Occupancy by Ownership by Household Size in Mount Union borough
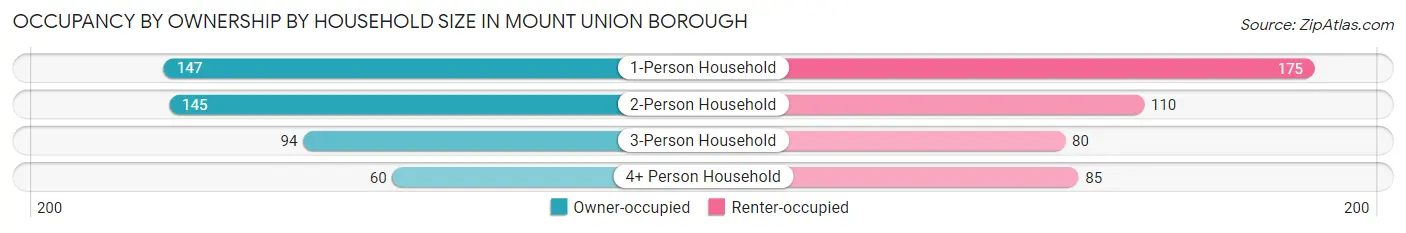
| Household Size | Owner-occupied | Renter-occupied |
| 1-Person Household | 147 (45.7%) | 175 (54.3%) |
| 2-Person Household | 145 (56.9%) | 110 (43.1%) |
| 3-Person Household | 94 (54.0%) | 80 (46.0%) |
| 4+ Person Household | 60 (41.4%) | 85 (58.6%) |
| Total Housing Units | 446 (49.8%) | 450 (50.2%) |
Occupancy by Educational Attainment in Mount Union borough
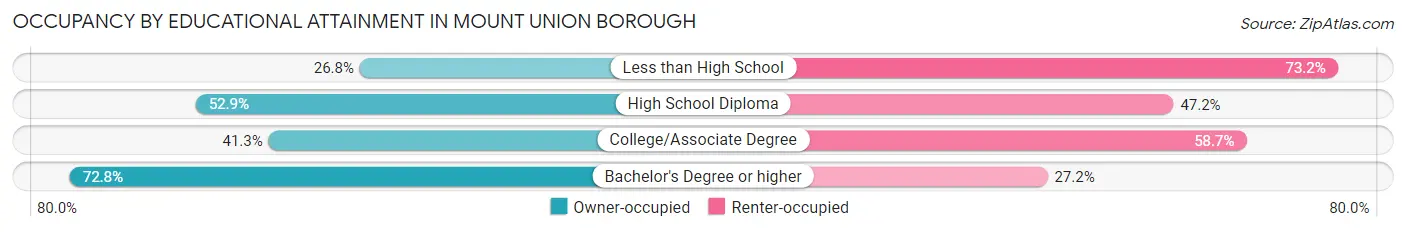
| Household Size | Owner-occupied | Renter-occupied |
| Less than High School | 22 (26.8%) | 60 (73.2%) |
| High School Diploma | 269 (52.8%) | 240 (47.1%) |
| College/Associate Degree | 88 (41.3%) | 125 (58.7%) |
| Bachelor's Degree or higher | 67 (72.8%) | 25 (27.2%) |
Occupancy by Age of Householder in Mount Union borough
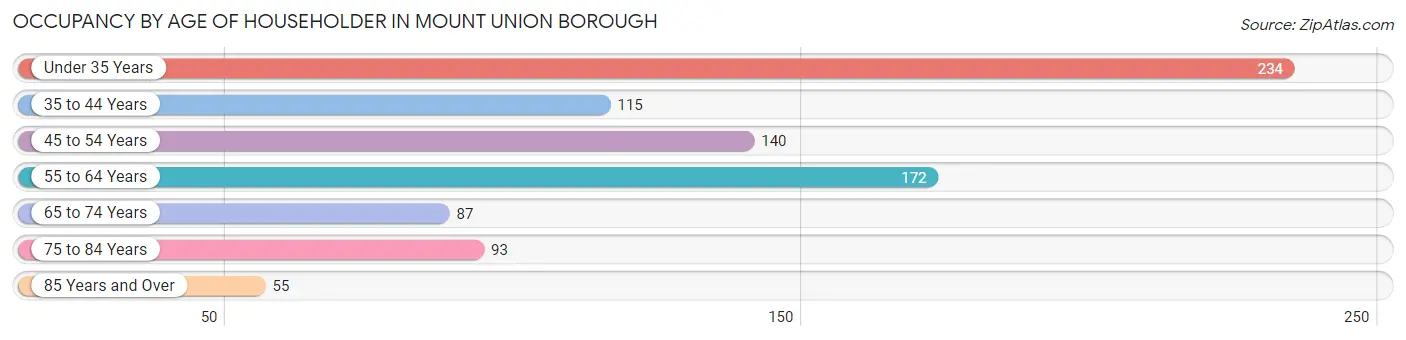
| Age Bracket | # Households | % Households |
| Under 35 Years | 234 | 26.1% |
| 35 to 44 Years | 115 | 12.8% |
| 45 to 54 Years | 140 | 15.6% |
| 55 to 64 Years | 172 | 19.2% |
| 65 to 74 Years | 87 | 9.7% |
| 75 to 84 Years | 93 | 10.4% |
| 85 Years and Over | 55 | 6.1% |
| Total | 896 | 100.0% |
Housing Finances in Mount Union borough
Median Income by Occupancy in Mount Union borough
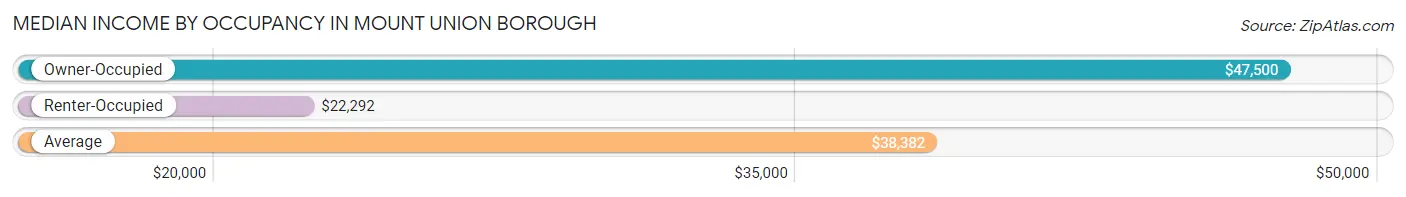
| Occupancy Type | # Households | Median Income |
| Owner-Occupied | 446 (49.8%) | $47,500 |
| Renter-Occupied | 450 (50.2%) | $22,292 |
| Average | 896 (100.0%) | $38,382 |
Occupancy by Householder Income Bracket in Mount Union borough
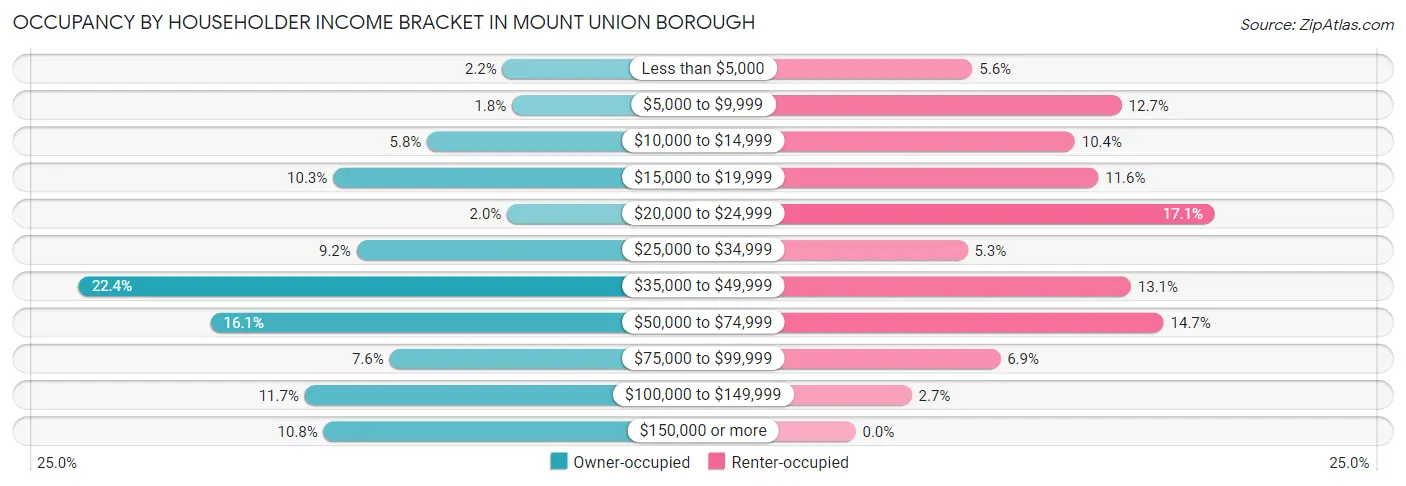
| Income Bracket | Owner-occupied | Renter-occupied |
| Less than $5,000 | 10 (2.2%) | 25 (5.6%) |
| $5,000 to $9,999 | 8 (1.8%) | 57 (12.7%) |
| $10,000 to $14,999 | 26 (5.8%) | 47 (10.4%) |
| $15,000 to $19,999 | 46 (10.3%) | 52 (11.6%) |
| $20,000 to $24,999 | 9 (2.0%) | 77 (17.1%) |
| $25,000 to $34,999 | 41 (9.2%) | 24 (5.3%) |
| $35,000 to $49,999 | 100 (22.4%) | 59 (13.1%) |
| $50,000 to $74,999 | 72 (16.1%) | 66 (14.7%) |
| $75,000 to $99,999 | 34 (7.6%) | 31 (6.9%) |
| $100,000 to $149,999 | 52 (11.7%) | 12 (2.7%) |
| $150,000 or more | 48 (10.8%) | 0 (0.0%) |
| Total | 446 (100.0%) | 450 (100.0%) |
Monthly Housing Cost Tiers in Mount Union borough
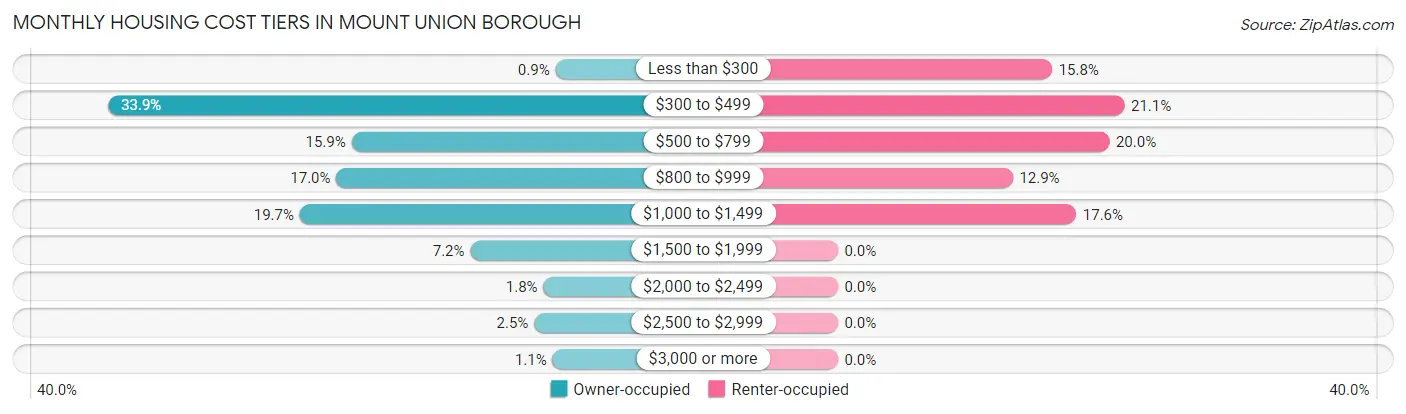
| Monthly Cost | Owner-occupied | Renter-occupied |
| Less than $300 | 4 (0.9%) | 71 (15.8%) |
| $300 to $499 | 151 (33.9%) | 95 (21.1%) |
| $500 to $799 | 71 (15.9%) | 90 (20.0%) |
| $800 to $999 | 76 (17.0%) | 58 (12.9%) |
| $1,000 to $1,499 | 88 (19.7%) | 79 (17.6%) |
| $1,500 to $1,999 | 32 (7.2%) | 0 (0.0%) |
| $2,000 to $2,499 | 8 (1.8%) | 0 (0.0%) |
| $2,500 to $2,999 | 11 (2.5%) | 0 (0.0%) |
| $3,000 or more | 5 (1.1%) | 0 (0.0%) |
| Total | 446 (100.0%) | 450 (100.0%) |
Physical Housing Characteristics in Mount Union borough
Housing Structures in Mount Union borough
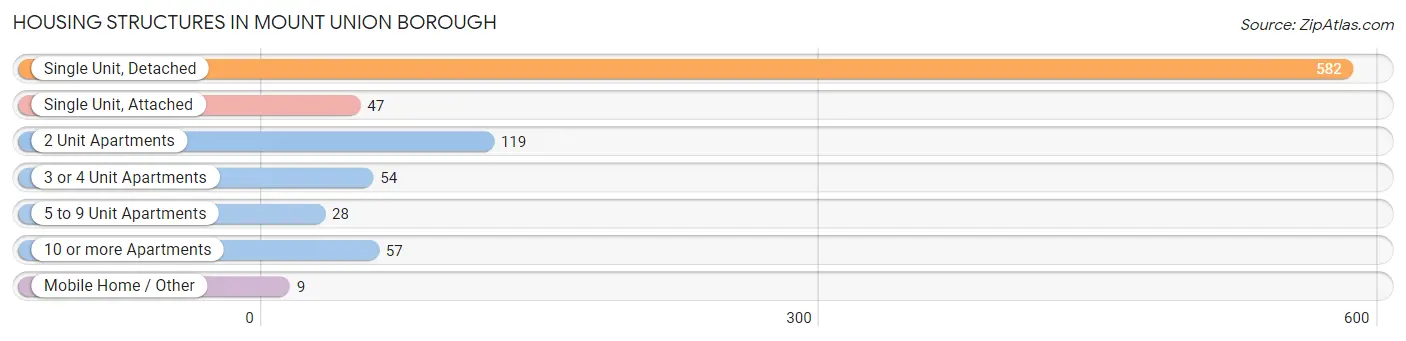
| Structure Type | # Housing Units | % Housing Units |
| Single Unit, Detached | 582 | 65.0% |
| Single Unit, Attached | 47 | 5.2% |
| 2 Unit Apartments | 119 | 13.3% |
| 3 or 4 Unit Apartments | 54 | 6.0% |
| 5 to 9 Unit Apartments | 28 | 3.1% |
| 10 or more Apartments | 57 | 6.4% |
| Mobile Home / Other | 9 | 1.0% |
| Total | 896 | 100.0% |
Housing Structures by Occupancy in Mount Union borough
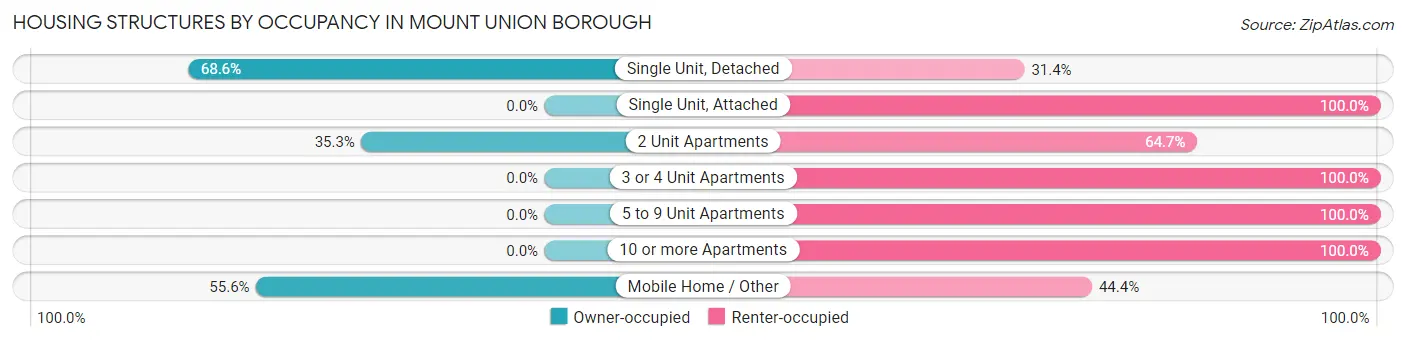
| Structure Type | Owner-occupied | Renter-occupied |
| Single Unit, Detached | 399 (68.6%) | 183 (31.4%) |
| Single Unit, Attached | 0 (0.0%) | 47 (100.0%) |
| 2 Unit Apartments | 42 (35.3%) | 77 (64.7%) |
| 3 or 4 Unit Apartments | 0 (0.0%) | 54 (100.0%) |
| 5 to 9 Unit Apartments | 0 (0.0%) | 28 (100.0%) |
| 10 or more Apartments | 0 (0.0%) | 57 (100.0%) |
| Mobile Home / Other | 5 (55.6%) | 4 (44.4%) |
| Total | 446 (49.8%) | 450 (50.2%) |
Housing Structures by Number of Rooms in Mount Union borough
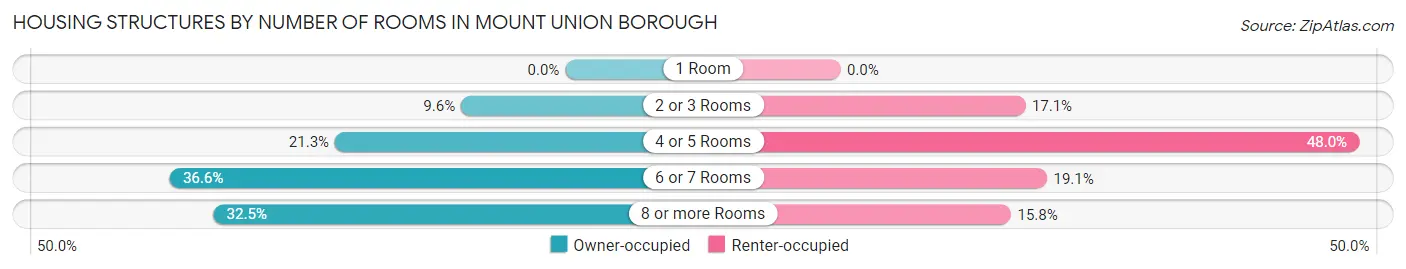
| Number of Rooms | Owner-occupied | Renter-occupied |
| 1 Room | 0 (0.0%) | 0 (0.0%) |
| 2 or 3 Rooms | 43 (9.6%) | 77 (17.1%) |
| 4 or 5 Rooms | 95 (21.3%) | 216 (48.0%) |
| 6 or 7 Rooms | 163 (36.5%) | 86 (19.1%) |
| 8 or more Rooms | 145 (32.5%) | 71 (15.8%) |
| Total | 446 (100.0%) | 450 (100.0%) |
Housing Structure by Heating Type in Mount Union borough
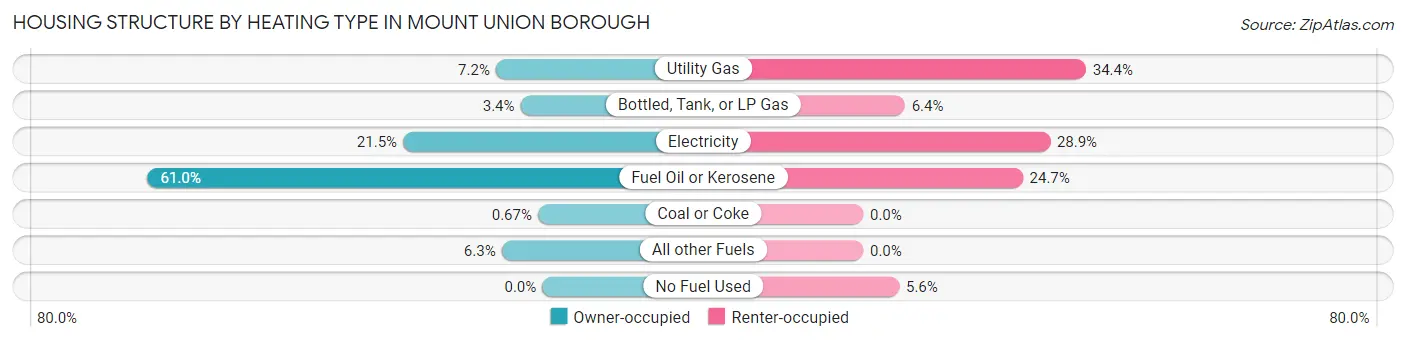
| Heating Type | Owner-occupied | Renter-occupied |
| Utility Gas | 32 (7.2%) | 155 (34.4%) |
| Bottled, Tank, or LP Gas | 15 (3.4%) | 29 (6.4%) |
| Electricity | 96 (21.5%) | 130 (28.9%) |
| Fuel Oil or Kerosene | 272 (61.0%) | 111 (24.7%) |
| Coal or Coke | 3 (0.7%) | 0 (0.0%) |
| All other Fuels | 28 (6.3%) | 0 (0.0%) |
| No Fuel Used | 0 (0.0%) | 25 (5.6%) |
| Total | 446 (100.0%) | 450 (100.0%) |
Household Vehicle Usage in Mount Union borough
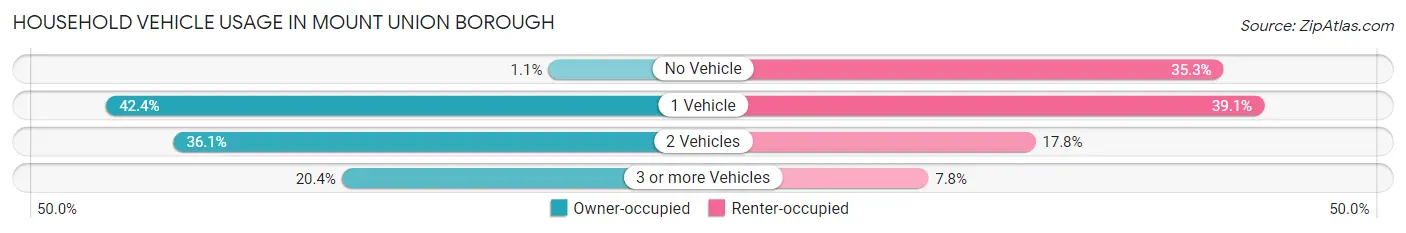
| Vehicles per Household | Owner-occupied | Renter-occupied |
| No Vehicle | 5 (1.1%) | 159 (35.3%) |
| 1 Vehicle | 189 (42.4%) | 176 (39.1%) |
| 2 Vehicles | 161 (36.1%) | 80 (17.8%) |
| 3 or more Vehicles | 91 (20.4%) | 35 (7.8%) |
| Total | 446 (100.0%) | 450 (100.0%) |
Real Estate & Mortgages in Mount Union borough
Real Estate and Mortgage Overview in Mount Union borough
| Characteristic | Without Mortgage | With Mortgage |
| Housing Units | 198 | 248 |
| Median Property Value | $104,300 | $89,600 |
| Median Household Income | $28,462 | $43 |
| Monthly Housing Costs | $383 | $0 |
| Real Estate Taxes | $1,164 | $0 |
Property Value by Mortgage Status in Mount Union borough
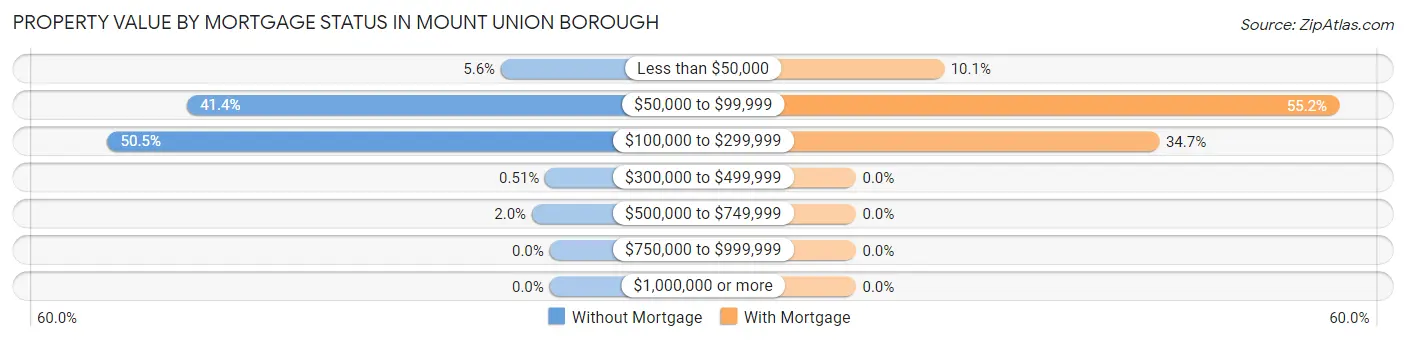
| Property Value | Without Mortgage | With Mortgage |
| Less than $50,000 | 11 (5.6%) | 25 (10.1%) |
| $50,000 to $99,999 | 82 (41.4%) | 137 (55.2%) |
| $100,000 to $299,999 | 100 (50.5%) | 86 (34.7%) |
| $300,000 to $499,999 | 1 (0.5%) | 0 (0.0%) |
| $500,000 to $749,999 | 4 (2.0%) | 0 (0.0%) |
| $750,000 to $999,999 | 0 (0.0%) | 0 (0.0%) |
| $1,000,000 or more | 0 (0.0%) | 0 (0.0%) |
| Total | 198 (100.0%) | 248 (100.0%) |
Household Income by Mortgage Status in Mount Union borough
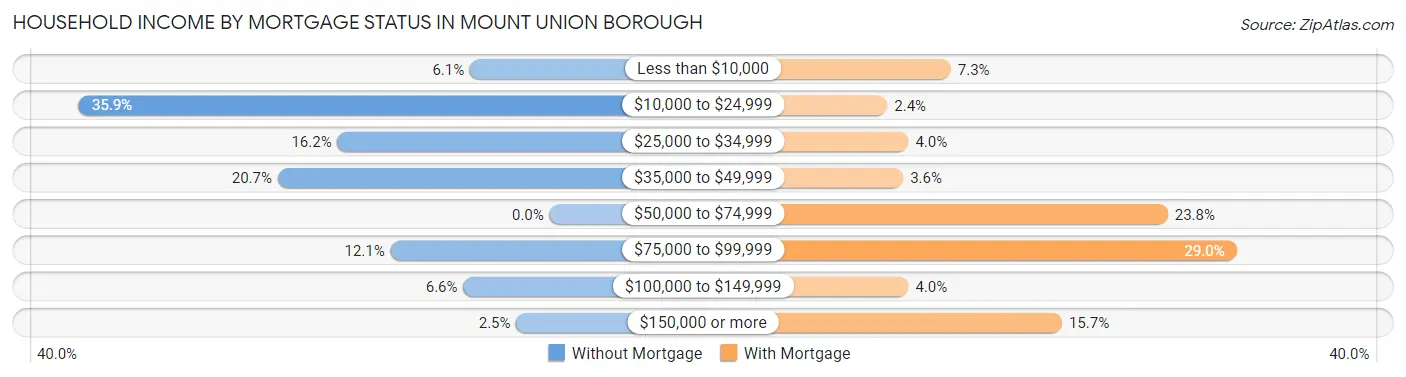
| Household Income | Without Mortgage | With Mortgage |
| Less than $10,000 | 12 (6.1%) | 18 (7.3%) |
| $10,000 to $24,999 | 71 (35.9%) | 6 (2.4%) |
| $25,000 to $34,999 | 32 (16.2%) | 10 (4.0%) |
| $35,000 to $49,999 | 41 (20.7%) | 9 (3.6%) |
| $50,000 to $74,999 | 0 (0.0%) | 59 (23.8%) |
| $75,000 to $99,999 | 24 (12.1%) | 72 (29.0%) |
| $100,000 to $149,999 | 13 (6.6%) | 10 (4.0%) |
| $150,000 or more | 5 (2.5%) | 39 (15.7%) |
| Total | 198 (100.0%) | 248 (100.0%) |
Property Value to Household Income Ratio in Mount Union borough
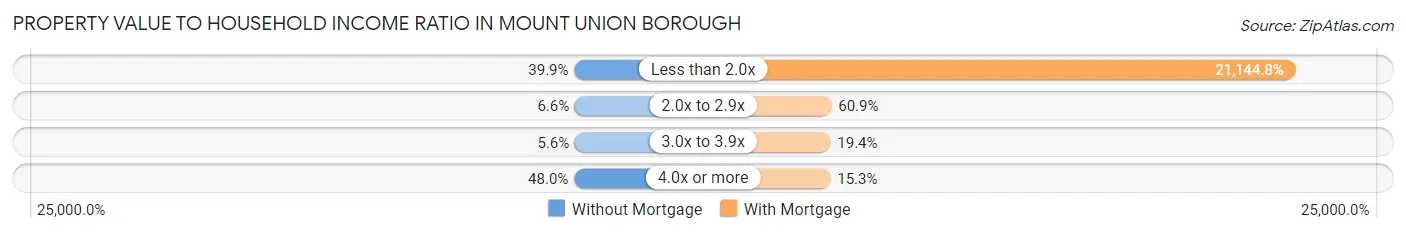
| Value-to-Income Ratio | Without Mortgage | With Mortgage |
| Less than 2.0x | 79 (39.9%) | 52,439 (21,144.8%) |
| 2.0x to 2.9x | 13 (6.6%) | 151 (60.9%) |
| 3.0x to 3.9x | 11 (5.6%) | 48 (19.4%) |
| 4.0x or more | 95 (48.0%) | 38 (15.3%) |
| Total | 198 (100.0%) | 248 (100.0%) |
Real Estate Taxes by Mortgage Status in Mount Union borough
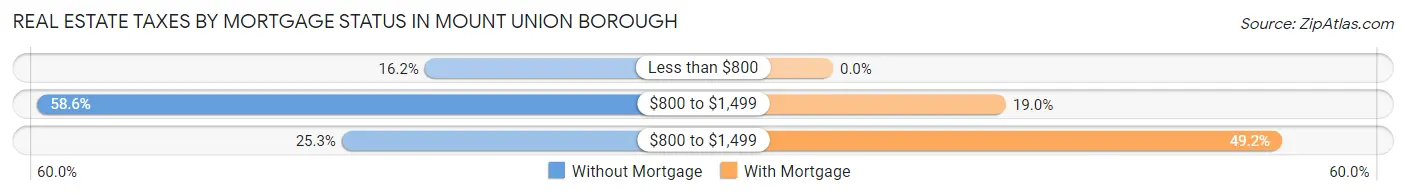
| Property Taxes | Without Mortgage | With Mortgage |
| Less than $800 | 32 (16.2%) | 0 (0.0%) |
| $800 to $1,499 | 116 (58.6%) | 47 (19.0%) |
| $800 to $1,499 | 50 (25.3%) | 122 (49.2%) |
| Total | 198 (100.0%) | 248 (100.0%) |
Health & Disability in Mount Union borough
Health Insurance Coverage by Age in Mount Union borough
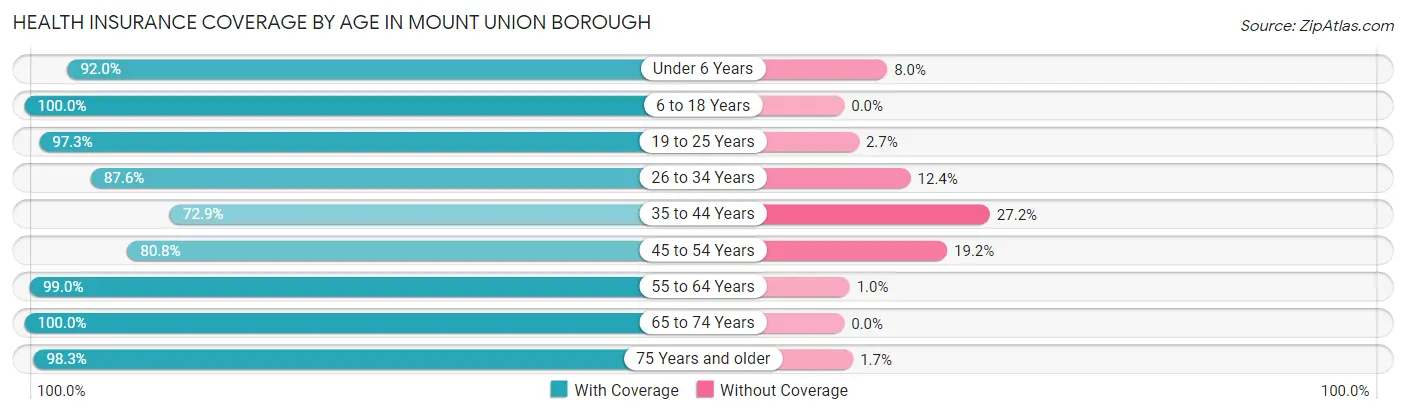
| Age Bracket | With Coverage | Without Coverage |
| Under 6 Years | 161 (92.0%) | 14 (8.0%) |
| 6 to 18 Years | 361 (100.0%) | 0 (0.0%) |
| 19 to 25 Years | 142 (97.3%) | 4 (2.7%) |
| 26 to 34 Years | 347 (87.6%) | 49 (12.4%) |
| 35 to 44 Years | 110 (72.9%) | 41 (27.2%) |
| 45 to 54 Years | 194 (80.8%) | 46 (19.2%) |
| 55 to 64 Years | 293 (99.0%) | 3 (1.0%) |
| 65 to 74 Years | 184 (100.0%) | 0 (0.0%) |
| 75 Years and older | 178 (98.3%) | 3 (1.7%) |
| Total | 1,970 (92.5%) | 160 (7.5%) |
Health Insurance Coverage by Citizenship Status in Mount Union borough
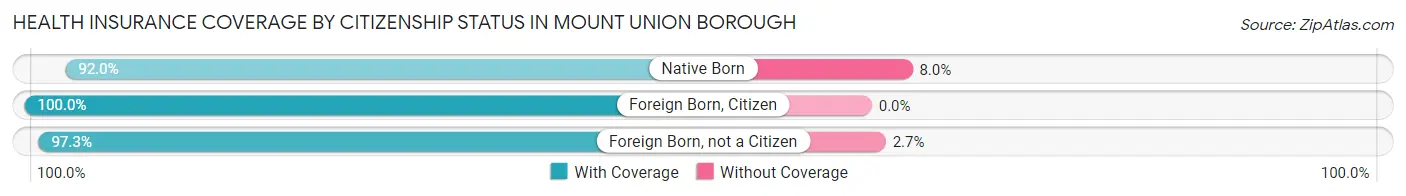
| Citizenship Status | With Coverage | Without Coverage |
| Native Born | 161 (92.0%) | 14 (8.0%) |
| Foreign Born, Citizen | 361 (100.0%) | 0 (0.0%) |
| Foreign Born, not a Citizen | 142 (97.3%) | 4 (2.7%) |
Health Insurance Coverage by Household Income in Mount Union borough
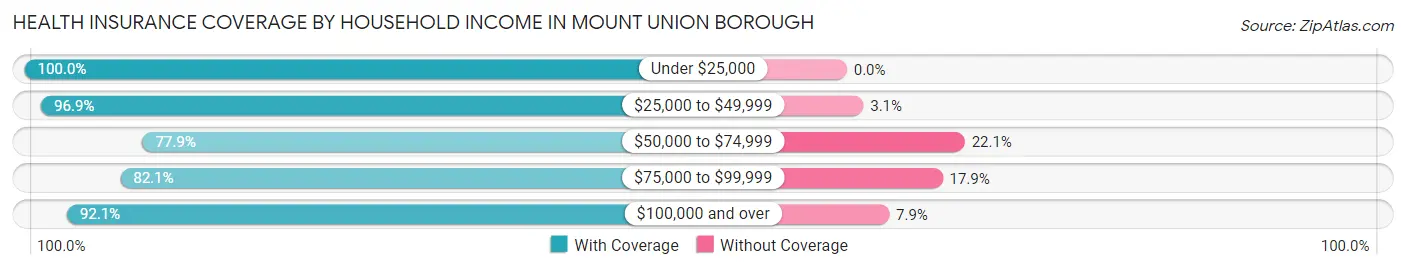
| Household Income | With Coverage | Without Coverage |
| Under $25,000 | 664 (100.0%) | 0 (0.0%) |
| $25,000 to $49,999 | 501 (96.9%) | 16 (3.1%) |
| $50,000 to $74,999 | 268 (77.9%) | 76 (22.1%) |
| $75,000 to $99,999 | 183 (82.1%) | 40 (17.9%) |
| $100,000 and over | 325 (92.1%) | 28 (7.9%) |
Public vs Private Health Insurance Coverage by Age in Mount Union borough
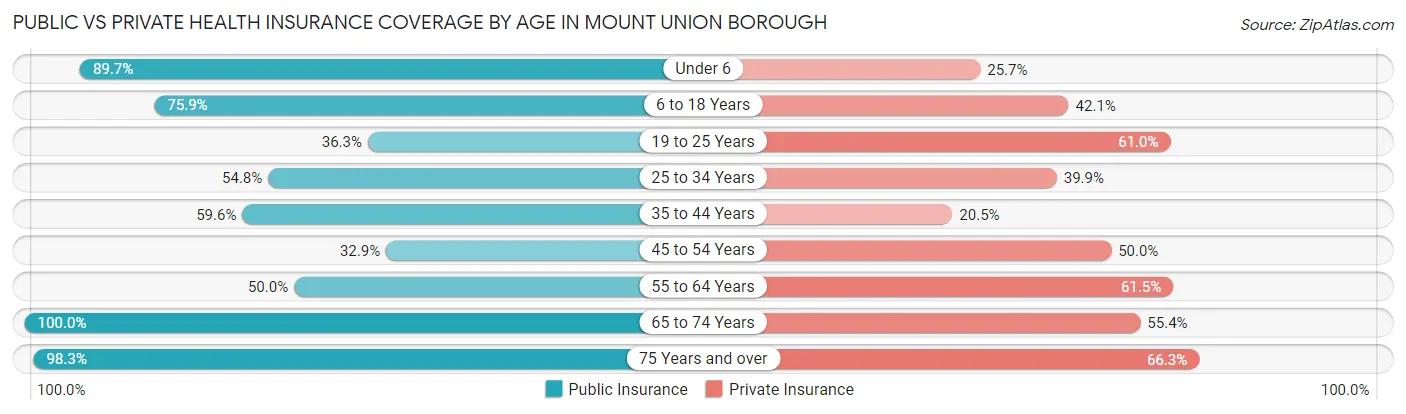
| Age Bracket | Public Insurance | Private Insurance |
| Under 6 | 157 (89.7%) | 45 (25.7%) |
| 6 to 18 Years | 274 (75.9%) | 152 (42.1%) |
| 19 to 25 Years | 53 (36.3%) | 89 (61.0%) |
| 25 to 34 Years | 217 (54.8%) | 158 (39.9%) |
| 35 to 44 Years | 90 (59.6%) | 31 (20.5%) |
| 45 to 54 Years | 79 (32.9%) | 120 (50.0%) |
| 55 to 64 Years | 148 (50.0%) | 182 (61.5%) |
| 65 to 74 Years | 184 (100.0%) | 102 (55.4%) |
| 75 Years and over | 178 (98.3%) | 120 (66.3%) |
| Total | 1,380 (64.8%) | 999 (46.9%) |
Disability Status by Sex by Age in Mount Union borough
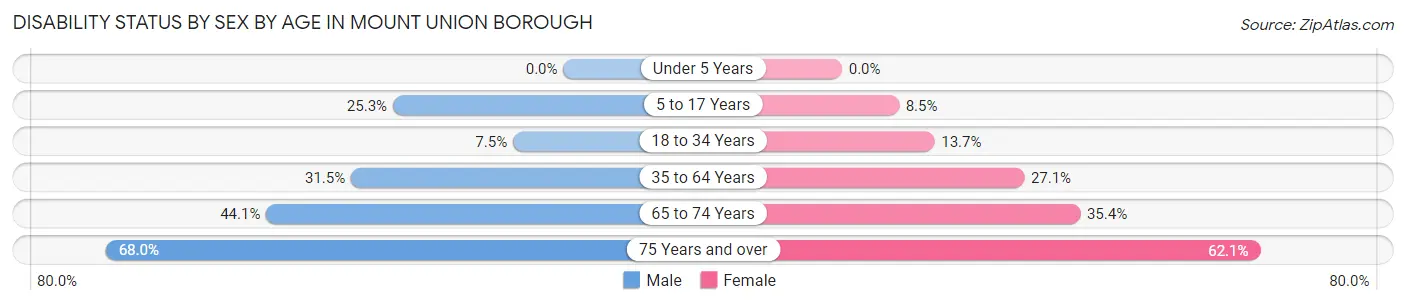
| Age Bracket | Male | Female |
| Under 5 Years | 0 (0.0%) | 0 (0.0%) |
| 5 to 17 Years | 62 (25.3%) | 12 (8.5%) |
| 18 to 34 Years | 22 (7.5%) | 36 (13.7%) |
| 35 to 64 Years | 128 (31.5%) | 76 (27.1%) |
| 65 to 74 Years | 45 (44.1%) | 29 (35.4%) |
| 75 Years and over | 53 (67.9%) | 64 (62.1%) |
Disability Class by Sex by Age in Mount Union borough
Disability Class: Hearing Difficulty
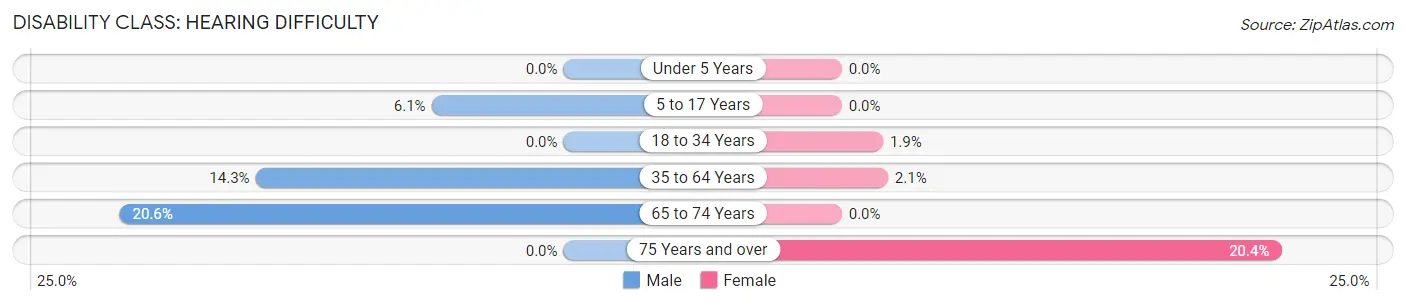
| Age Bracket | Male | Female |
| Under 5 Years | 0 (0.0%) | 0 (0.0%) |
| 5 to 17 Years | 15 (6.1%) | 0 (0.0%) |
| 18 to 34 Years | 0 (0.0%) | 5 (1.9%) |
| 35 to 64 Years | 58 (14.3%) | 6 (2.1%) |
| 65 to 74 Years | 21 (20.6%) | 0 (0.0%) |
| 75 Years and over | 0 (0.0%) | 21 (20.4%) |
Disability Class: Vision Difficulty
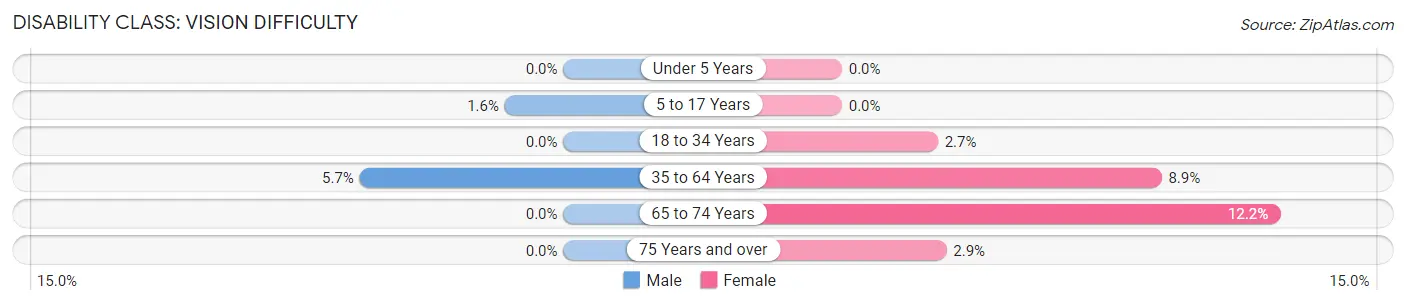
| Age Bracket | Male | Female |
| Under 5 Years | 0 (0.0%) | 0 (0.0%) |
| 5 to 17 Years | 4 (1.6%) | 0 (0.0%) |
| 18 to 34 Years | 0 (0.0%) | 7 (2.7%) |
| 35 to 64 Years | 23 (5.7%) | 25 (8.9%) |
| 65 to 74 Years | 0 (0.0%) | 10 (12.2%) |
| 75 Years and over | 0 (0.0%) | 3 (2.9%) |
Disability Class: Cognitive Difficulty
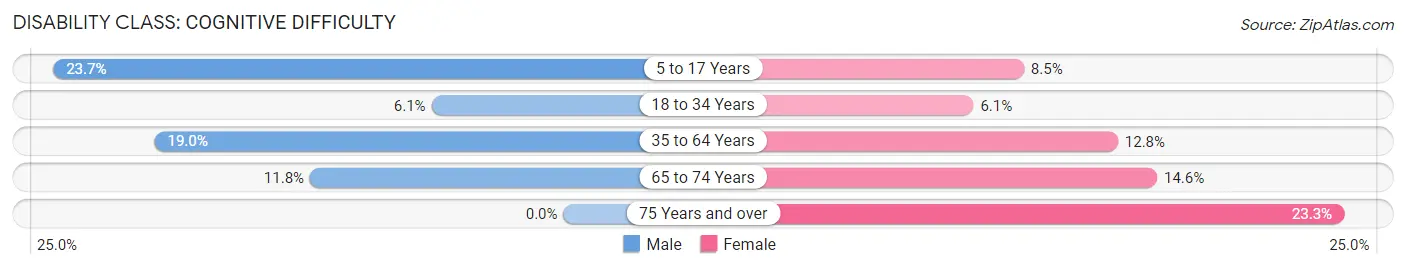
| Age Bracket | Male | Female |
| 5 to 17 Years | 58 (23.7%) | 12 (8.5%) |
| 18 to 34 Years | 18 (6.1%) | 16 (6.1%) |
| 35 to 64 Years | 77 (19.0%) | 36 (12.8%) |
| 65 to 74 Years | 12 (11.8%) | 12 (14.6%) |
| 75 Years and over | 0 (0.0%) | 24 (23.3%) |
Disability Class: Ambulatory Difficulty
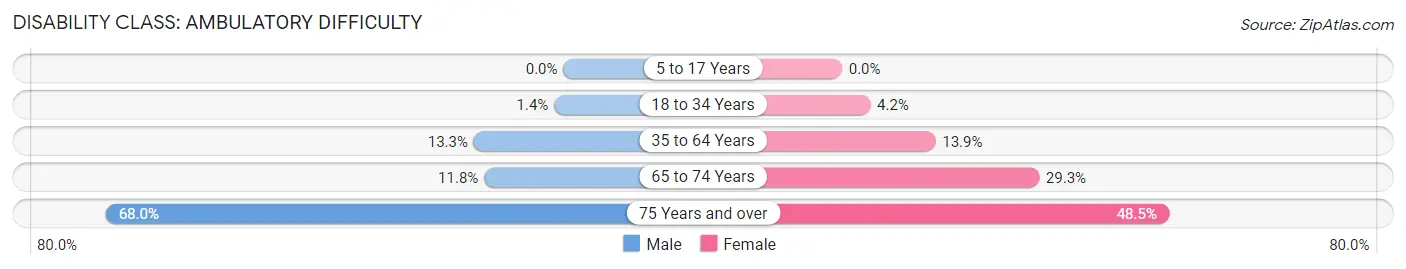
| Age Bracket | Male | Female |
| 5 to 17 Years | 0 (0.0%) | 0 (0.0%) |
| 18 to 34 Years | 4 (1.4%) | 11 (4.2%) |
| 35 to 64 Years | 54 (13.3%) | 39 (13.9%) |
| 65 to 74 Years | 12 (11.8%) | 24 (29.3%) |
| 75 Years and over | 53 (67.9%) | 50 (48.5%) |
Disability Class: Self-Care Difficulty
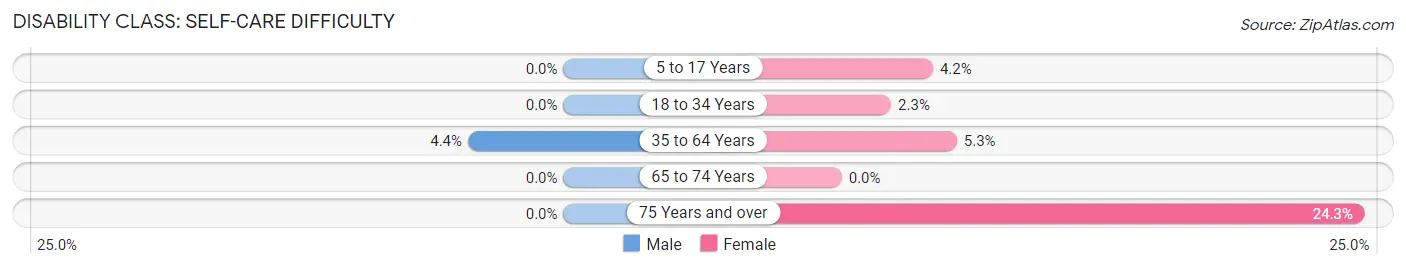
| Age Bracket | Male | Female |
| 5 to 17 Years | 0 (0.0%) | 6 (4.2%) |
| 18 to 34 Years | 0 (0.0%) | 6 (2.3%) |
| 35 to 64 Years | 18 (4.4%) | 15 (5.3%) |
| 65 to 74 Years | 0 (0.0%) | 0 (0.0%) |
| 75 Years and over | 0 (0.0%) | 25 (24.3%) |
Technology Access in Mount Union borough
Computing Device Access in Mount Union borough
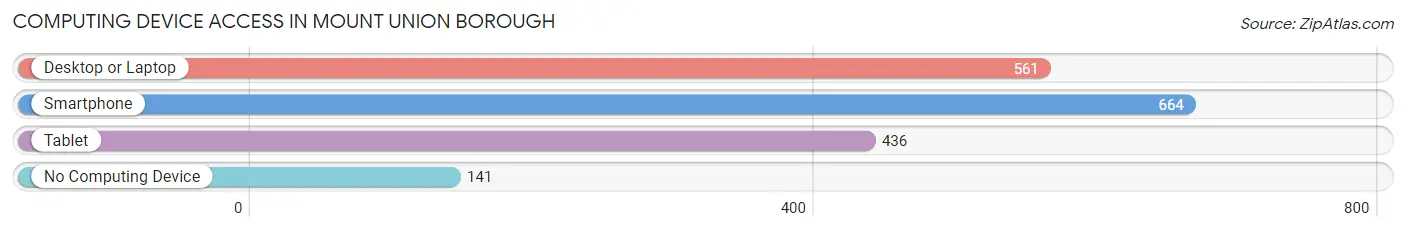
| Device Type | # Households | % Households |
| Desktop or Laptop | 561 | 62.6% |
| Smartphone | 664 | 74.1% |
| Tablet | 436 | 48.7% |
| No Computing Device | 141 | 15.7% |
| Total | 896 | 100.0% |
Internet Access in Mount Union borough
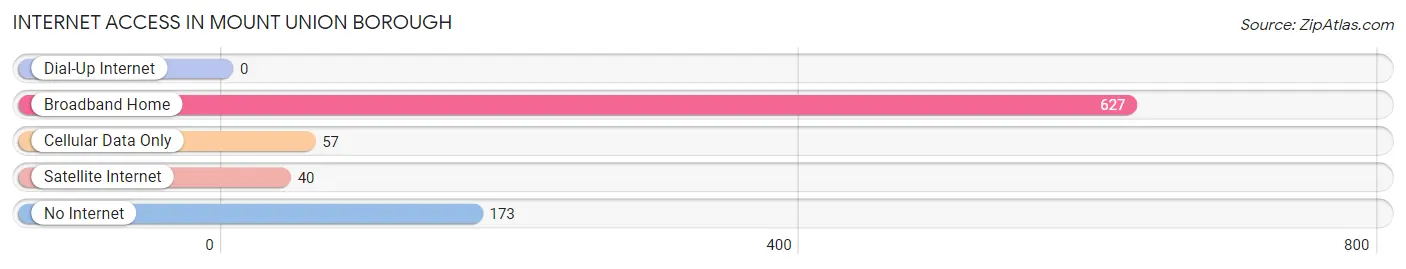
| Internet Type | # Households | % Households |
| Dial-Up Internet | 0 | 0.0% |
| Broadband Home | 627 | 70.0% |
| Cellular Data Only | 57 | 6.4% |
| Satellite Internet | 40 | 4.5% |
| No Internet | 173 | 19.3% |
| Total | 896 | 100.0% |
Mount Union borough Summary
Introduction
Mount Union Borough is a small borough located in Huntingdon County, Pennsylvania. It is situated in the south-central part of the state, approximately 90 miles east of Pittsburgh. The borough is home to a population of approximately 1,500 people and is part of the Huntingdon Valley region. The borough is known for its rich history, beautiful scenery, and vibrant economy.
History
Mount Union Borough was founded in 1817 by a group of settlers from the nearby town of Huntingdon. The borough was named after the nearby mountain, Mount Union, which was named after the Union Church that was built on its summit in 1790. The borough was originally a farming community, but it soon developed into a thriving industrial center. The borough was home to several factories, including a paper mill, a tannery, and a woolen mill.
The borough was also home to a number of churches, including the Union Church, which was the first church in the borough. The borough was also home to a number of schools, including the Mount Union Academy, which was founded in 1837.
The borough was also home to a number of businesses, including a hotel, a bank, and a number of stores. The borough was also home to a number of fraternal organizations, including the Odd Fellows and the Masons.
The borough was also home to a number of notable people, including the famous abolitionist and author, Harriet Beecher Stowe, who lived in the borough for a time.
Geography
Mount Union Borough is located in the south-central part of Huntingdon County, Pennsylvania. The borough is situated in the foothills of the Allegheny Mountains and is surrounded by rolling hills and valleys. The borough is located approximately 90 miles east of Pittsburgh and is part of the Huntingdon Valley region.
The borough is home to a number of parks and recreational areas, including the Mount Union Borough Park, which is located in the center of the borough. The park features a playground, a basketball court, and a picnic area. The borough is also home to a number of trails, including the Allegheny Trail, which runs through the borough.
Economy
The economy of Mount Union Borough is largely based on agriculture and manufacturing. The borough is home to a number of farms, which produce a variety of crops, including corn, soybeans, and hay. The borough is also home to a number of factories, including a paper mill, a tannery, and a woolen mill.
The borough is also home to a number of businesses, including a hotel, a bank, and a number of stores. The borough is also home to a number of fraternal organizations, including the Odd Fellows and the Masons.
Demographics
As of the 2010 census, the population of Mount Union Borough was 1,500. The racial makeup of the borough was 97.3% White, 0.7% African American, 0.3% Native American, 0.3% Asian, and 1.3% from other races. The median household income in the borough was $37,500.
Conclusion
Mount Union Borough is a small borough located in Huntingdon County, Pennsylvania. It is situated in the south-central part of the state, approximately 90 miles east of Pittsburgh. The borough is home to a population of approximately 1,500 people and is part of the Huntingdon Valley region. The borough is known for its rich history, beautiful scenery, and vibrant economy. The economy of the borough is largely based on agriculture and manufacturing, and the borough is home to a number of businesses, including a hotel, a bank, and a number of stores. The borough is also home to a number of parks and recreational areas, including the Mount Union Borough Park. The borough is also home to a number of fraternal organizations, including the Odd Fellows and the Masons.
Common Questions
What is Per Capita Income in Mount Union borough?
Per Capita income in Mount Union borough is $22,687.
What is the Median Family Income in Mount Union borough?
Median Family Income in Mount Union borough is $46,500.
What is the Median Household income in Mount Union borough?
Median Household Income in Mount Union borough is $38,382.
What is Income or Wage Gap in Mount Union borough?
Income or Wage Gap in Mount Union borough is 37.7%.
Women in Mount Union borough earn 62.3 cents for every dollar earned by a man.
What is Inequality or Gini Index in Mount Union borough?
Inequality or Gini Index in Mount Union borough is 0.45.
What is the Total Population of Mount Union borough?
Total Population of Mount Union borough is 2,130.
What is the Total Male Population of Mount Union borough?
Total Male Population of Mount Union borough is 1,194.
What is the Total Female Population of Mount Union borough?
Total Female Population of Mount Union borough is 936.
What is the Ratio of Males per 100 Females in Mount Union borough?
There are 127.56 Males per 100 Females in Mount Union borough.
What is the Ratio of Females per 100 Males in Mount Union borough?
There are 78.39 Females per 100 Males in Mount Union borough.
What is the Median Population Age in Mount Union borough?
Median Population Age in Mount Union borough is 34.8 Years.
What is the Average Family Size in Mount Union borough
Average Family Size in Mount Union borough is 2.9 People.
What is the Average Household Size in Mount Union borough
Average Household Size in Mount Union borough is 2.3 People.
How Large is the Labor Force in Mount Union borough?
There are 977 People in the Labor Forcein in Mount Union borough.
What is the Percentage of People in the Labor Force in Mount Union borough?
59.5% of People are in the Labor Force in Mount Union borough.
What is the Unemployment Rate in Mount Union borough?
Unemployment Rate in Mount Union borough is 14.0%.