Dawson borough, PA Map & Demographics
Dawson borough Overview
$23,740
PER CAPITA INCOME
$76,250
AVG FAMILY INCOME
$41,094
AVG HOUSEHOLD INCOME
55.5%
WAGE / INCOME GAP [ % ]
44.5¢/ $1
WAGE / INCOME GAP [ $ ]
0.40
INEQUALITY / GINI INDEX
388
TOTAL POPULATION
197
MALE POPULATION
191
FEMALE POPULATION
103.14
MALES / 100 FEMALES
96.95
FEMALES / 100 MALES
36.4
MEDIAN AGE
3.2
AVG FAMILY SIZE
2.4
AVG HOUSEHOLD SIZE
176
LABOR FORCE [ PEOPLE ]
58.7%
PERCENT IN LABOR FORCE
8.5%
UNEMPLOYMENT RATE
Income in Dawson borough
Income Overview in Dawson borough
Per Capita Income in Dawson borough is $23,740, while median incomes of families and households are $76,250 and $41,094 respectively.
| Characteristic | Number | Measure |
| Per Capita Income | 388 | $23,740 |
| Median Family Income | 95 | $76,250 |
| Mean Family Income | 95 | $72,169 |
| Median Household Income | 159 | $41,094 |
| Mean Household Income | 159 | $57,001 |
| Income Deficit | 95 | $0 |
| Wage / Income Gap (%) | 388 | 55.52% |
| Wage / Income Gap ($) | 388 | 44.48¢ per $1 |
| Gini / Inequality Index | 388 | 0.40 |
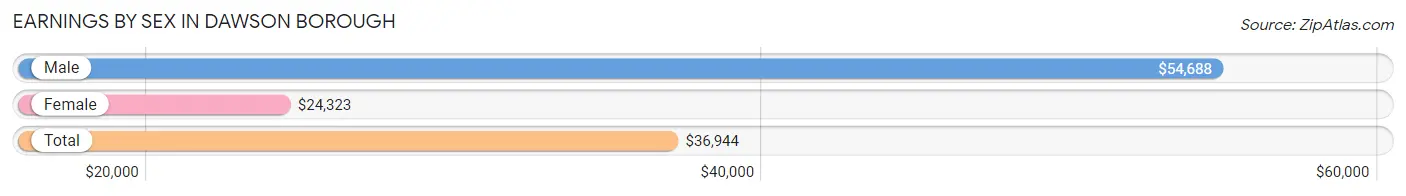
Earnings by Sex in Dawson borough
Average Earnings in Dawson borough are $36,944, $54,688 for men and $24,323 for women, a difference of 55.5%.
| Sex | Number | Average Earnings |
| Male | 69 (41.6%) | $54,688 |
| Female | 97 (58.4%) | $24,323 |
| Total | 166 (100.0%) | $36,944 |
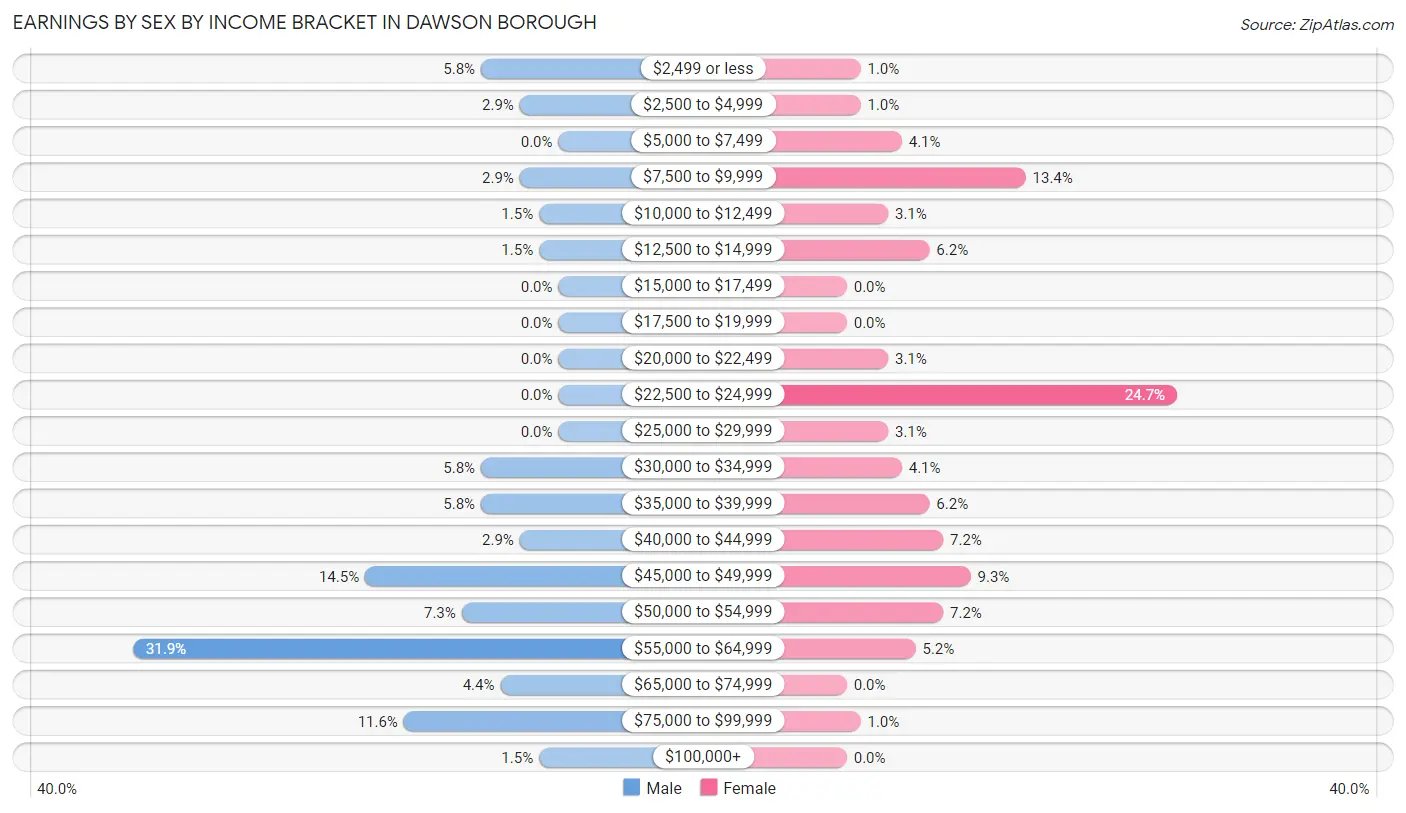
Earnings by Sex by Income Bracket in Dawson borough
The most common earnings brackets in Dawson borough are $55,000 to $64,999 for men (22 | 31.9%) and $22,500 to $24,999 for women (24 | 24.7%).
| Income | Male | Female |
| $2,499 or less | 4 (5.8%) | 1 (1.0%) |
| $2,500 to $4,999 | 2 (2.9%) | 1 (1.0%) |
| $5,000 to $7,499 | 0 (0.0%) | 4 (4.1%) |
| $7,500 to $9,999 | 2 (2.9%) | 13 (13.4%) |
| $10,000 to $12,499 | 1 (1.5%) | 3 (3.1%) |
| $12,500 to $14,999 | 1 (1.5%) | 6 (6.2%) |
| $15,000 to $17,499 | 0 (0.0%) | 0 (0.0%) |
| $17,500 to $19,999 | 0 (0.0%) | 0 (0.0%) |
| $20,000 to $22,499 | 0 (0.0%) | 3 (3.1%) |
| $22,500 to $24,999 | 0 (0.0%) | 24 (24.7%) |
| $25,000 to $29,999 | 0 (0.0%) | 3 (3.1%) |
| $30,000 to $34,999 | 4 (5.8%) | 4 (4.1%) |
| $35,000 to $39,999 | 4 (5.8%) | 6 (6.2%) |
| $40,000 to $44,999 | 2 (2.9%) | 7 (7.2%) |
| $45,000 to $49,999 | 10 (14.5%) | 9 (9.3%) |
| $50,000 to $54,999 | 5 (7.2%) | 7 (7.2%) |
| $55,000 to $64,999 | 22 (31.9%) | 5 (5.1%) |
| $65,000 to $74,999 | 3 (4.3%) | 0 (0.0%) |
| $75,000 to $99,999 | 8 (11.6%) | 1 (1.0%) |
| $100,000+ | 1 (1.5%) | 0 (0.0%) |
| Total | 69 (100.0%) | 97 (100.0%) |
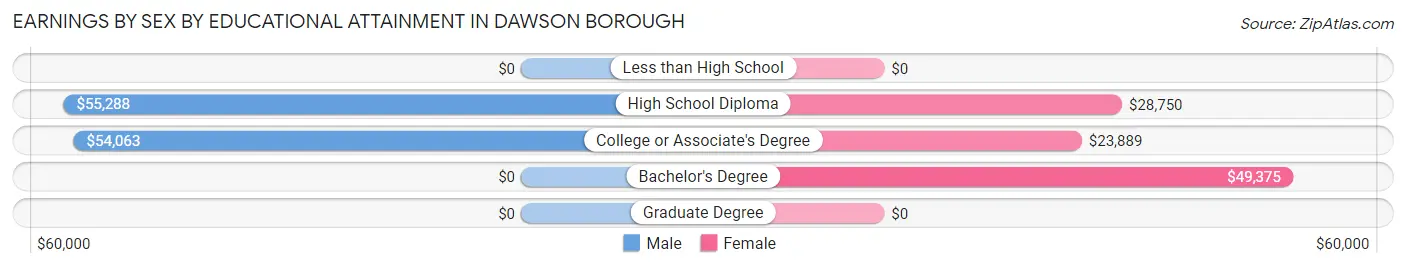
Earnings by Sex by Educational Attainment in Dawson borough
Average earnings in Dawson borough are $55,139 for men and $24,375 for women, a difference of 55.8%. Men with an educational attainment of high school diploma enjoy the highest average annual earnings of $55,288, while those with college or associate's degree education earn the least with $54,063. Women with an educational attainment of bachelor's degree earn the most with the average annual earnings of $49,375, while those with college or associate's degree education have the smallest earnings of $23,889.
| Educational Attainment | Male Income | Female Income |
| Less than High School | - | - |
| High School Diploma | $55,288 | $28,750 |
| College or Associate's Degree | $54,063 | $23,889 |
| Bachelor's Degree | - | - |
| Graduate Degree | - | - |
| Total | $55,139 | $24,375 |
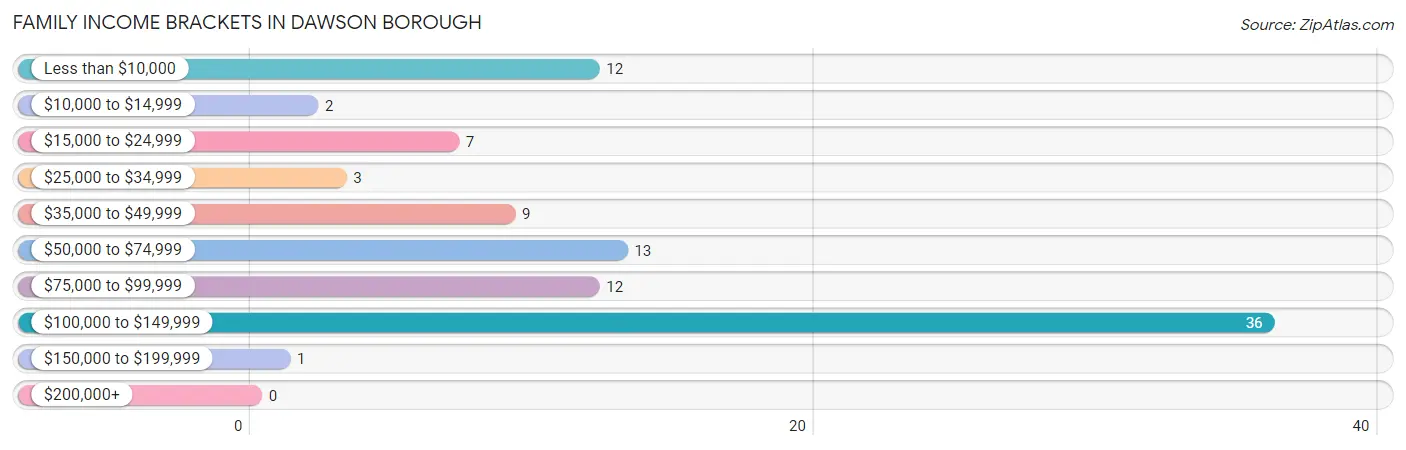
Family Income in Dawson borough
Family Income Brackets in Dawson borough
According to the Dawson borough family income data, there are 36 families falling into the $100,000 to $149,999 income range, which is the most common income bracket and makes up 37.9% of all families.
| Income Bracket | # Families | % Families |
| Less than $10,000 | 12 | 12.6% |
| $10,000 to $14,999 | 2 | 2.1% |
| $15,000 to $24,999 | 7 | 7.4% |
| $25,000 to $34,999 | 3 | 3.2% |
| $35,000 to $49,999 | 9 | 9.5% |
| $50,000 to $74,999 | 13 | 13.7% |
| $75,000 to $99,999 | 12 | 12.6% |
| $100,000 to $149,999 | 36 | 37.9% |
| $150,000 to $199,999 | 1 | 1.1% |
| $200,000+ | 0 | 0.0% |
Family Income by Famaliy Size in Dawson borough
3-person families (18 | 19.0%) account for the highest median family income in Dawson borough with $115,000 per family, while 3-person families (18 | 19.0%) have the highest median income of $38,333 per family member.
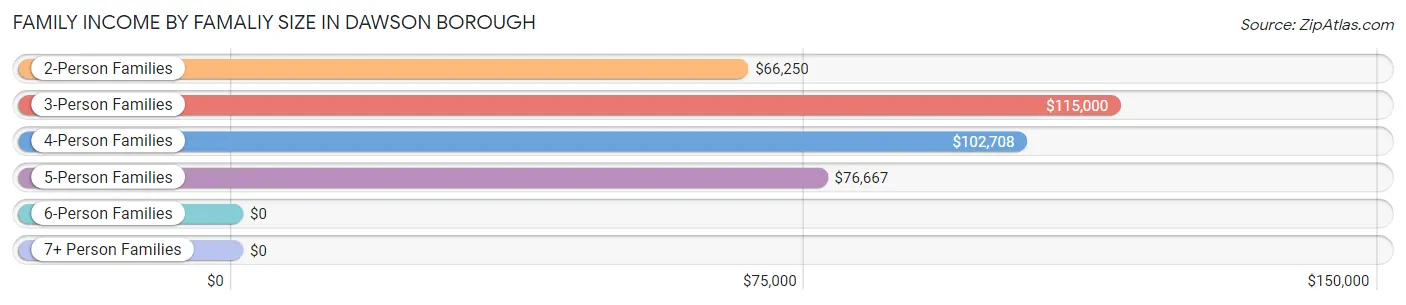
| Income Bracket | # Families | Median Income |
| 2-Person Families | 33 (34.7%) | $66,250 |
| 3-Person Families | 18 (19.0%) | $115,000 |
| 4-Person Families | 24 (25.3%) | $102,708 |
| 5-Person Families | 6 (6.3%) | $76,667 |
| 6-Person Families | 14 (14.7%) | $0 |
| 7+ Person Families | 0 (0.0%) | $0 |
| Total | 95 (100.0%) | $76,250 |
Family Income by Number of Earners in Dawson borough
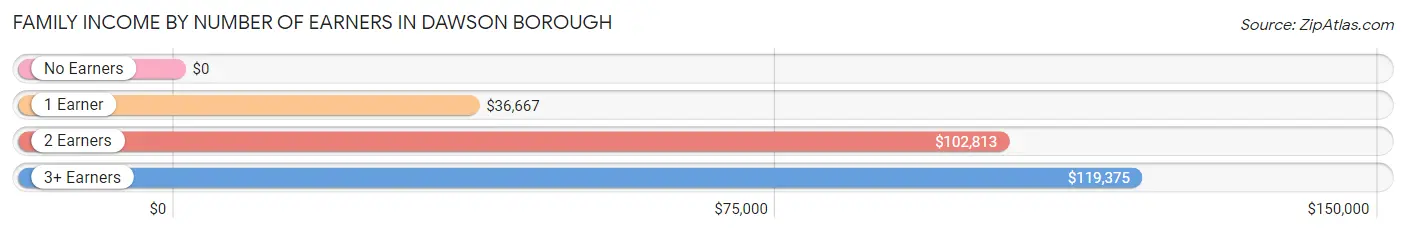
| Number of Earners | # Families | Median Income |
| No Earners | 9 (9.5%) | $0 |
| 1 Earner | 38 (40.0%) | $36,667 |
| 2 Earners | 39 (41.0%) | $102,813 |
| 3+ Earners | 9 (9.5%) | $119,375 |
| Total | 95 (100.0%) | $76,250 |
Household Income in Dawson borough
Household Income Brackets in Dawson borough
With 38 households falling in the category, the $15,000 to $24,999 income range is the most frequent in Dawson borough, accounting for 23.9% of all households.
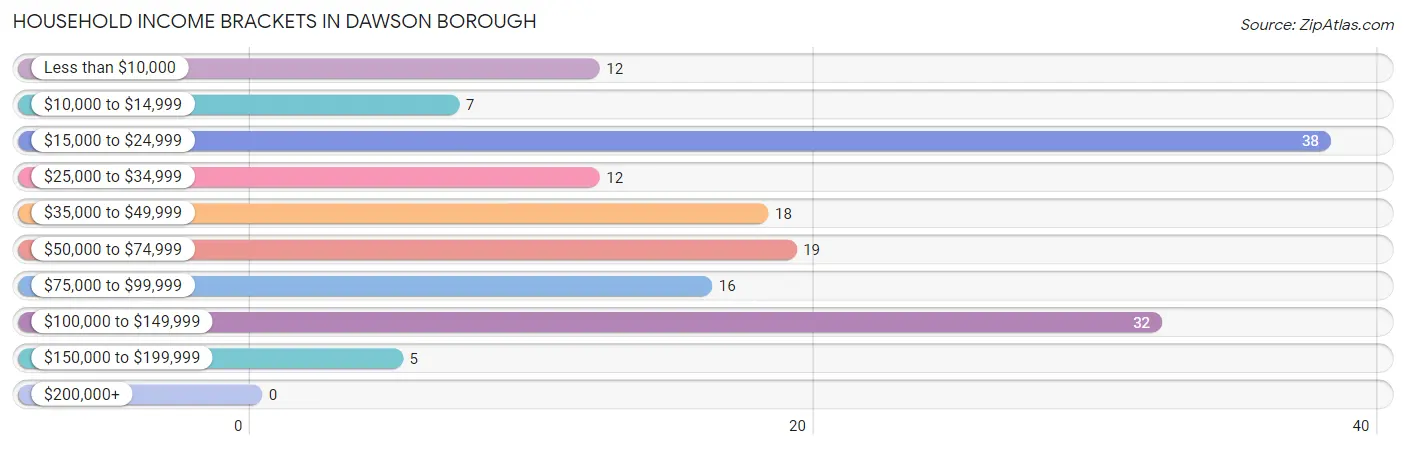
| Income Bracket | # Households | % Households |
| Less than $10,000 | 12 | 7.5% |
| $10,000 to $14,999 | 7 | 4.4% |
| $15,000 to $24,999 | 38 | 23.9% |
| $25,000 to $34,999 | 12 | 7.5% |
| $35,000 to $49,999 | 18 | 11.3% |
| $50,000 to $74,999 | 19 | 11.9% |
| $75,000 to $99,999 | 16 | 10.1% |
| $100,000 to $149,999 | 32 | 20.1% |
| $150,000 to $199,999 | 5 | 3.1% |
| $200,000+ | 0 | 0.0% |
Household Income by Householder Age in Dawson borough
The median household income in Dawson borough is $41,094, with the highest median household income of $37,917 found in the 65+ years age bracket for the primary householder. A total of 49 households (30.8%) fall into this category.
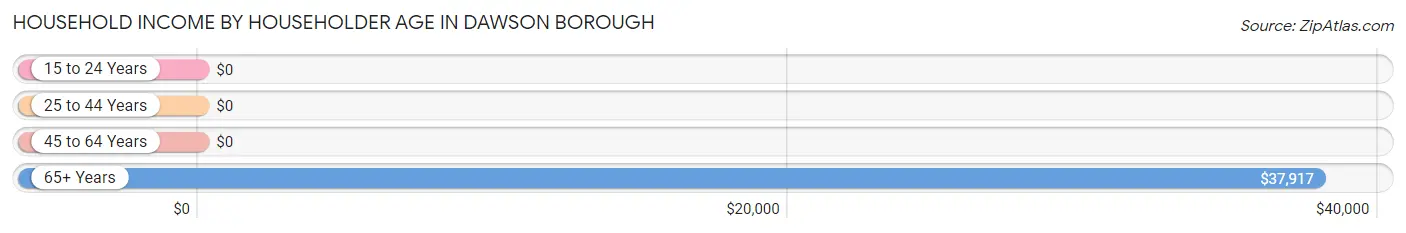
| Income Bracket | # Households | Median Income |
| 15 to 24 Years | 0 (0.0%) | $0 |
| 25 to 44 Years | 49 (30.8%) | $0 |
| 45 to 64 Years | 61 (38.4%) | $0 |
| 65+ Years | 49 (30.8%) | $37,917 |
| Total | 159 (100.0%) | $41,094 |
Poverty in Dawson borough
Income Below Poverty by Sex and Age in Dawson borough
With 19.3% poverty level for males and 30.4% for females among the residents of Dawson borough, 35 to 44 year old males and 16 and 17 year old females are the most vulnerable to poverty, with 16 males (53.3%) and 6 females (100.0%) in their respective age groups living below the poverty level.
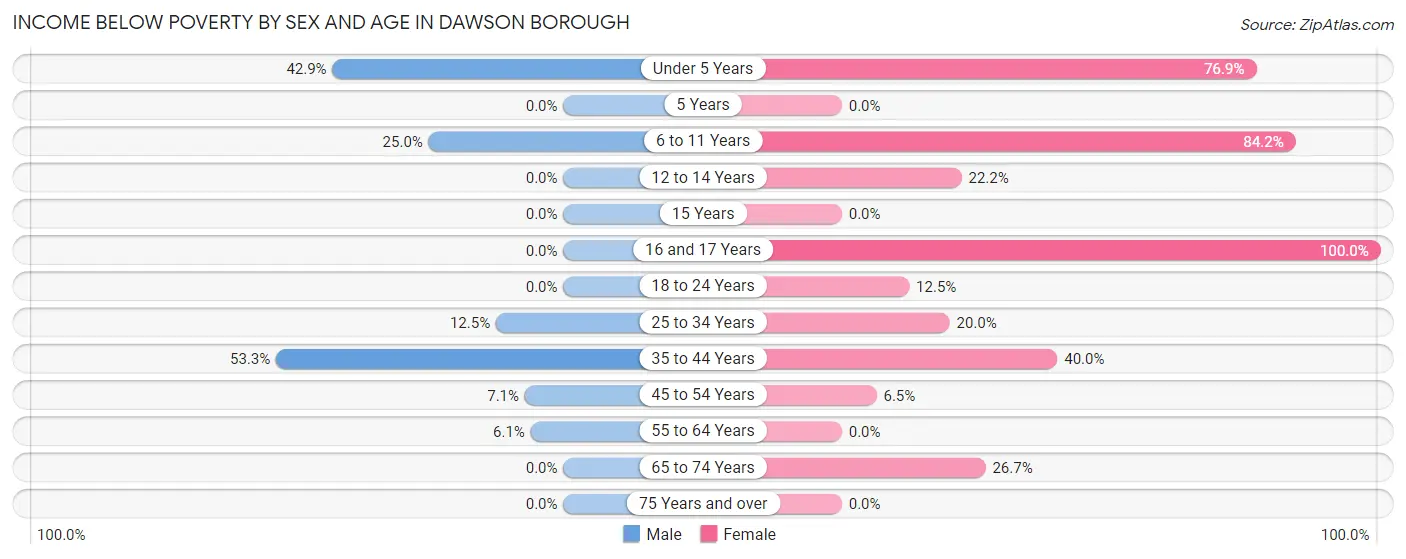
| Age Bracket | Male | Female |
| Under 5 Years | 12 (42.9%) | 10 (76.9%) |
| 5 Years | 0 (0.0%) | 0 (0.0%) |
| 6 to 11 Years | 3 (25.0%) | 16 (84.2%) |
| 12 to 14 Years | 0 (0.0%) | 2 (22.2%) |
| 15 Years | 0 (0.0%) | 0 (0.0%) |
| 16 and 17 Years | 0 (0.0%) | 6 (100.0%) |
| 18 to 24 Years | 0 (0.0%) | 2 (12.5%) |
| 25 to 34 Years | 3 (12.5%) | 4 (20.0%) |
| 35 to 44 Years | 16 (53.3%) | 12 (40.0%) |
| 45 to 54 Years | 2 (7.1%) | 2 (6.5%) |
| 55 to 64 Years | 2 (6.1%) | 0 (0.0%) |
| 65 to 74 Years | 0 (0.0%) | 4 (26.7%) |
| 75 Years and over | 0 (0.0%) | 0 (0.0%) |
| Total | 38 (19.3%) | 58 (30.4%) |
Income Above Poverty by Sex and Age in Dawson borough
According to the poverty statistics in Dawson borough, males aged 5 years and females aged 15 years are the age groups that are most secure financially, with 100.0% of males and 100.0% of females in these age groups living above the poverty line.
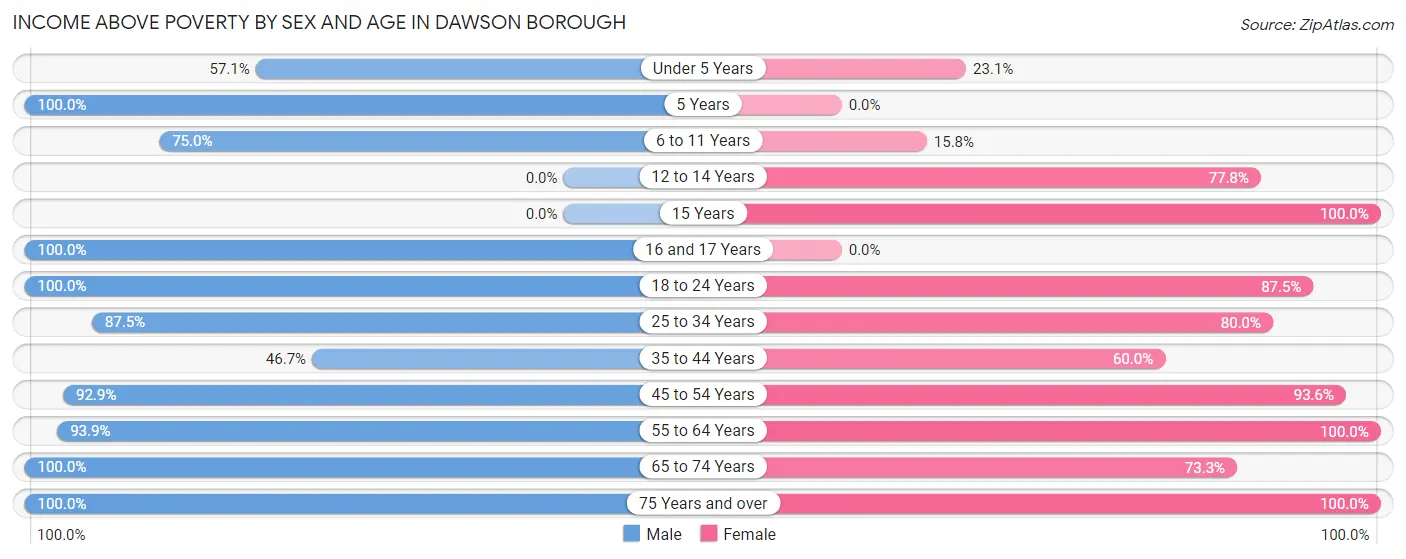
| Age Bracket | Male | Female |
| Under 5 Years | 16 (57.1%) | 3 (23.1%) |
| 5 Years | 3 (100.0%) | 0 (0.0%) |
| 6 to 11 Years | 9 (75.0%) | 3 (15.8%) |
| 12 to 14 Years | 0 (0.0%) | 7 (77.8%) |
| 15 Years | 0 (0.0%) | 4 (100.0%) |
| 16 and 17 Years | 5 (100.0%) | 0 (0.0%) |
| 18 to 24 Years | 1 (100.0%) | 14 (87.5%) |
| 25 to 34 Years | 21 (87.5%) | 16 (80.0%) |
| 35 to 44 Years | 14 (46.7%) | 18 (60.0%) |
| 45 to 54 Years | 26 (92.9%) | 29 (93.5%) |
| 55 to 64 Years | 31 (93.9%) | 15 (100.0%) |
| 65 to 74 Years | 17 (100.0%) | 11 (73.3%) |
| 75 Years and over | 16 (100.0%) | 13 (100.0%) |
| Total | 159 (80.7%) | 133 (69.6%) |
Income Below Poverty Among Married-Couple Families in Dawson borough
The poverty statistics for married-couple families in Dawson borough show that 17.3% or 13 of the total 75 families live below the poverty line. Families with 3 or 4 children have the highest poverty rate of 76.5%, comprising of 13 families. On the other hand, families with no children have the lowest poverty rate of 0.0%, which includes 0 families.
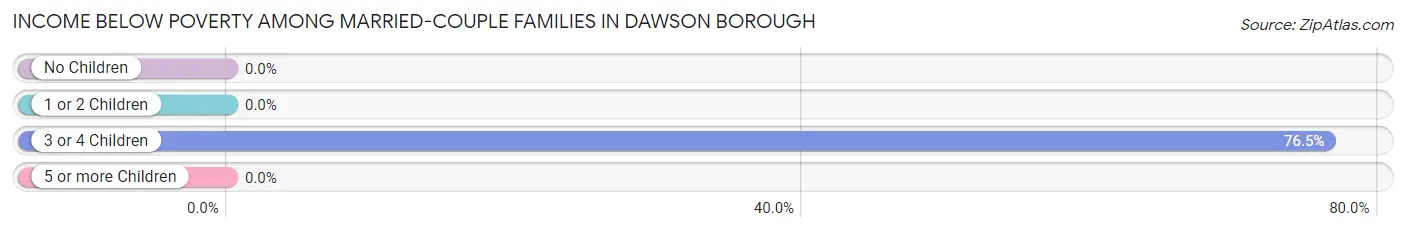
| Children | Above Poverty | Below Poverty |
| No Children | 44 (100.0%) | 0 (0.0%) |
| 1 or 2 Children | 14 (100.0%) | 0 (0.0%) |
| 3 or 4 Children | 4 (23.5%) | 13 (76.5%) |
| 5 or more Children | 0 (0.0%) | 0 (0.0%) |
| Total | 62 (82.7%) | 13 (17.3%) |
Income Below Poverty Among Single-Parent Households in Dawson borough
According to the poverty data in Dawson borough, 44.4% or 4 single-father households and 18.2% or 2 single-mother households are living below the poverty line. Among single-father households, those with 1 or 2 children have the highest poverty rate, with 4 households (57.1%) experiencing poverty. Likewise, among single-mother households, those with 1 or 2 children have the highest poverty rate, with 2 households (40.0%) falling below the poverty line.
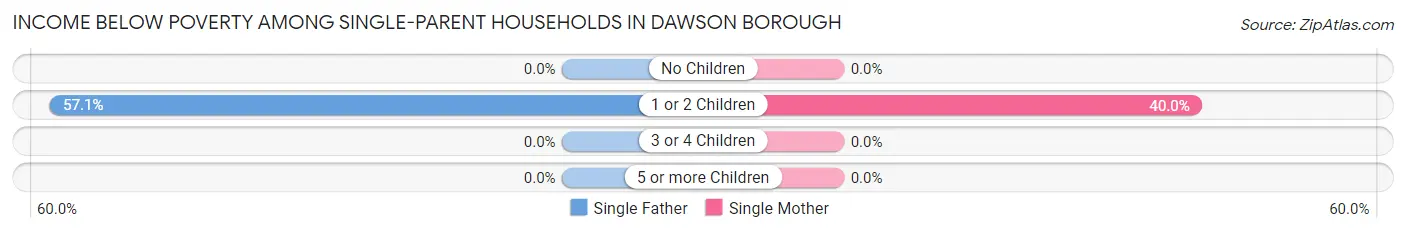
| Children | Single Father | Single Mother |
| No Children | 0 (0.0%) | 0 (0.0%) |
| 1 or 2 Children | 4 (57.1%) | 2 (40.0%) |
| 3 or 4 Children | 0 (0.0%) | 0 (0.0%) |
| 5 or more Children | 0 (0.0%) | 0 (0.0%) |
| Total | 4 (44.4%) | 2 (18.2%) |
Income Below Poverty Among Married-Couple vs Single-Parent Households in Dawson borough
The poverty data for Dawson borough shows that 13 of the married-couple family households (17.3%) and 6 of the single-parent households (30.0%) are living below the poverty level. Within the married-couple family households, those with 3 or 4 children have the highest poverty rate, with 13 households (76.5%) falling below the poverty line. Among the single-parent households, those with 1 or 2 children have the highest poverty rate, with 6 household (50.0%) living below poverty.
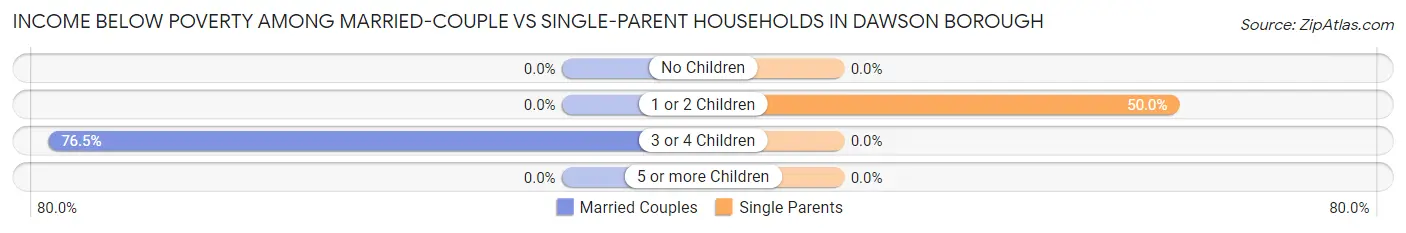
| Children | Married-Couple Families | Single-Parent Households |
| No Children | 0 (0.0%) | 0 (0.0%) |
| 1 or 2 Children | 0 (0.0%) | 6 (50.0%) |
| 3 or 4 Children | 13 (76.5%) | 0 (0.0%) |
| 5 or more Children | 0 (0.0%) | 0 (0.0%) |
| Total | 13 (17.3%) | 6 (30.0%) |
Race in Dawson borough
The most populous races in Dawson borough are White / Caucasian (382 | 98.5%), Two or more Races (5 | 1.3%), and Native / Alaskan (1 | 0.3%).
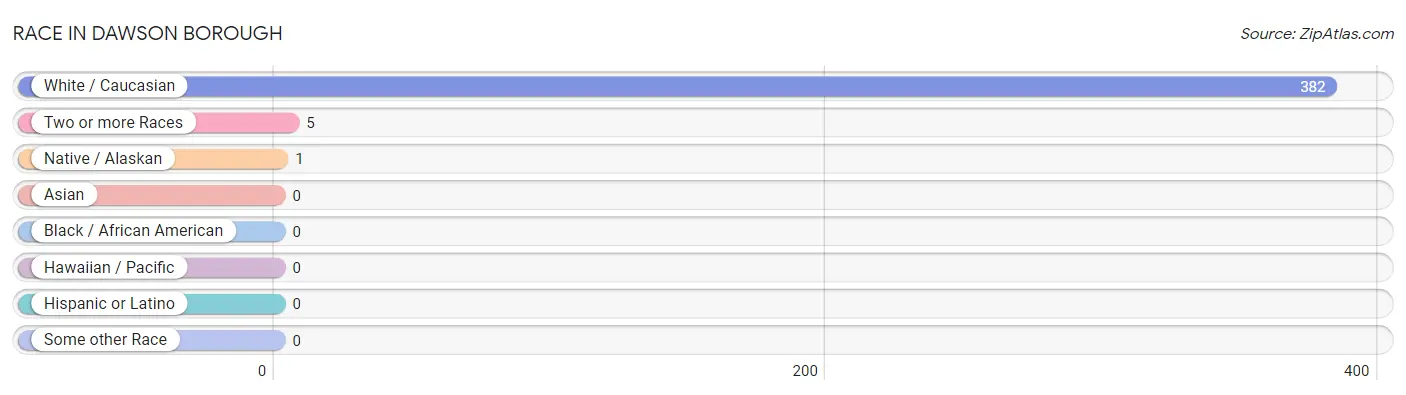
| Race | # Population | % Population |
| Asian | 0 | 0.0% |
| Black / African American | 0 | 0.0% |
| Hawaiian / Pacific | 0 | 0.0% |
| Hispanic or Latino | 0 | 0.0% |
| Native / Alaskan | 1 | 0.3% |
| White / Caucasian | 382 | 98.5% |
| Two or more Races | 5 | 1.3% |
| Some other Race | 0 | 0.0% |
| Total | 388 | 100.0% |
Ancestry in Dawson borough
The most populous ancestries reported in Dawson borough are German (103 | 26.6%), English (93 | 24.0%), Italian (43 | 11.1%), Irish (30 | 7.7%), and American (24 | 6.2%), together accounting for 75.5% of all Dawson borough residents.
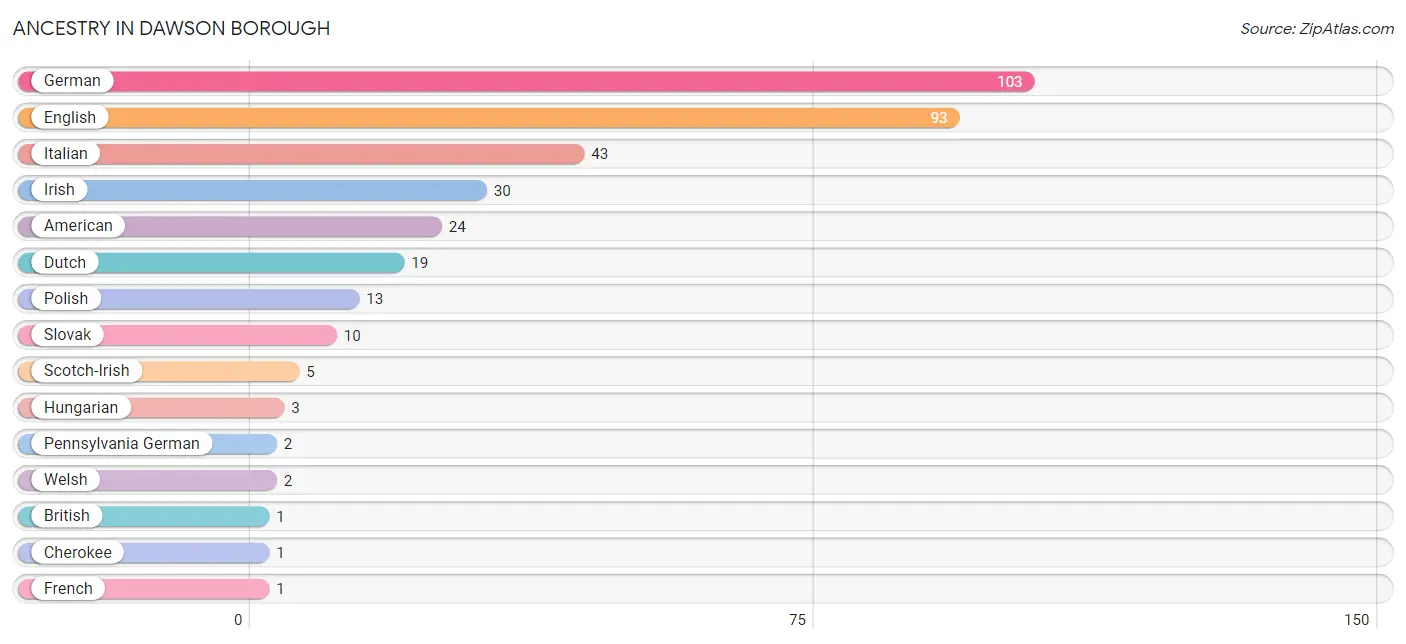
| Ancestry | # Population | % Population |
| American | 24 | 6.2% |
| British | 1 | 0.3% |
| Cherokee | 1 | 0.3% |
| Dutch | 19 | 4.9% |
| English | 93 | 24.0% |
| French | 1 | 0.3% |
| German | 103 | 26.6% |
| Hungarian | 3 | 0.8% |
| Irish | 30 | 7.7% |
| Italian | 43 | 11.1% |
| Pennsylvania German | 2 | 0.5% |
| Polish | 13 | 3.4% |
| Scotch-Irish | 5 | 1.3% |
| Slovak | 10 | 2.6% |
| Swedish | 1 | 0.3% |
| Welsh | 2 | 0.5% | View All 16 Rows |
Immigrants in Dawson borough

| Immigration Origin | # Population | % Population | View All 0 Rows |
Sex and Age in Dawson borough
Sex and Age in Dawson borough
The most populous age groups in Dawson borough are Under 5 Years (28 | 14.2%) for men and 35 to 39 Years (26 | 13.6%) for women.
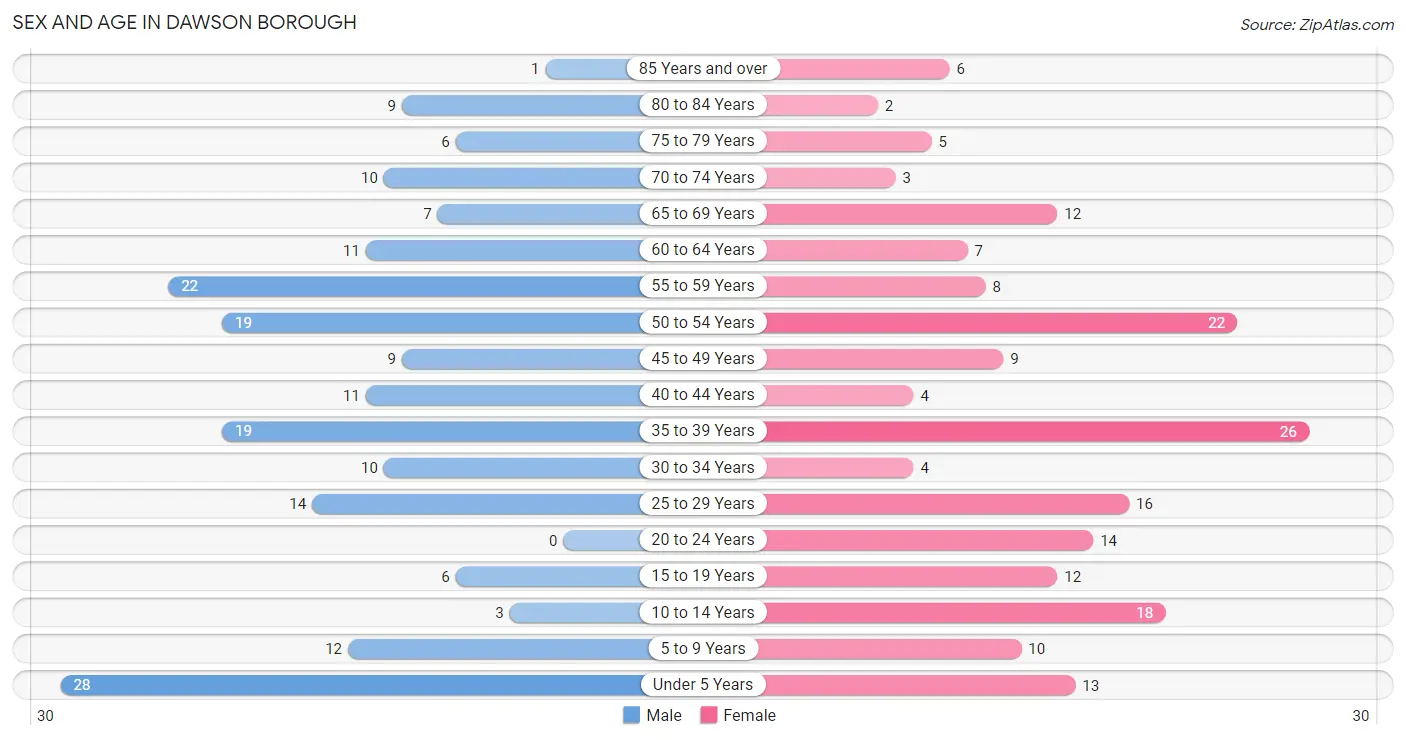
| Age Bracket | Male | Female |
| Under 5 Years | 28 (14.2%) | 13 (6.8%) |
| 5 to 9 Years | 12 (6.1%) | 10 (5.2%) |
| 10 to 14 Years | 3 (1.5%) | 18 (9.4%) |
| 15 to 19 Years | 6 (3.0%) | 12 (6.3%) |
| 20 to 24 Years | 0 (0.0%) | 14 (7.3%) |
| 25 to 29 Years | 14 (7.1%) | 16 (8.4%) |
| 30 to 34 Years | 10 (5.1%) | 4 (2.1%) |
| 35 to 39 Years | 19 (9.6%) | 26 (13.6%) |
| 40 to 44 Years | 11 (5.6%) | 4 (2.1%) |
| 45 to 49 Years | 9 (4.6%) | 9 (4.7%) |
| 50 to 54 Years | 19 (9.6%) | 22 (11.5%) |
| 55 to 59 Years | 22 (11.2%) | 8 (4.2%) |
| 60 to 64 Years | 11 (5.6%) | 7 (3.7%) |
| 65 to 69 Years | 7 (3.5%) | 12 (6.3%) |
| 70 to 74 Years | 10 (5.1%) | 3 (1.6%) |
| 75 to 79 Years | 6 (3.0%) | 5 (2.6%) |
| 80 to 84 Years | 9 (4.6%) | 2 (1.1%) |
| 85 Years and over | 1 (0.5%) | 6 (3.1%) |
| Total | 197 (100.0%) | 191 (100.0%) |
Families and Households in Dawson borough
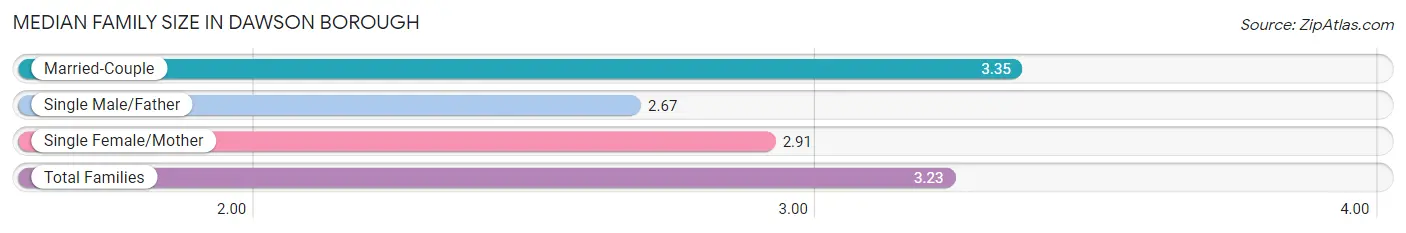
Median Family Size in Dawson borough
The median family size in Dawson borough is 3.23 persons per family, with married-couple families (75 | 78.9%) accounting for the largest median family size of 3.35 persons per family. On the other hand, single male/father families (9 | 9.5%) represent the smallest median family size with 2.67 persons per family.
| Family Type | # Families | Family Size |
| Married-Couple | 75 (78.9%) | 3.35 |
| Single Male/Father | 9 (9.5%) | 2.67 |
| Single Female/Mother | 11 (11.6%) | 2.91 |
| Total Families | 95 (100.0%) | 3.23 |
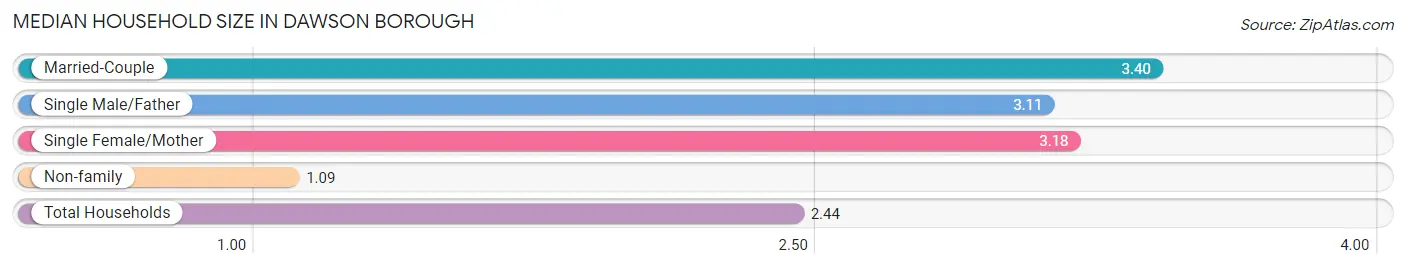
Median Household Size in Dawson borough
The median household size in Dawson borough is 2.44 persons per household, with married-couple households (75 | 47.2%) accounting for the largest median household size of 3.4 persons per household. non-family households (64 | 40.3%) represent the smallest median household size with 1.09 persons per household.
| Household Type | # Households | Household Size |
| Married-Couple | 75 (47.2%) | 3.40 |
| Single Male/Father | 9 (5.7%) | 3.11 |
| Single Female/Mother | 11 (6.9%) | 3.18 |
| Non-family | 64 (40.3%) | 1.09 |
| Total Households | 159 (100.0%) | 2.44 |
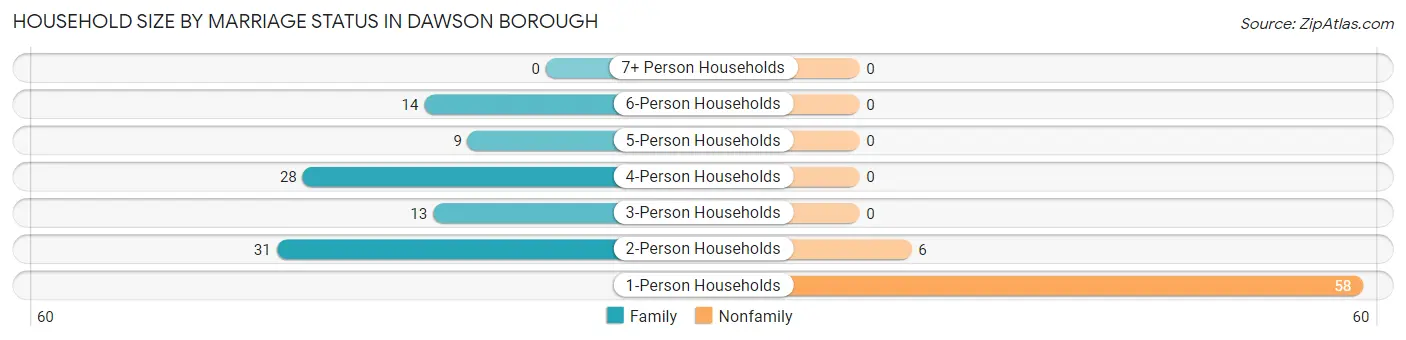
Household Size by Marriage Status in Dawson borough
Out of a total of 159 households in Dawson borough, 95 (59.8%) are family households, while 64 (40.3%) are nonfamily households. The most numerous type of family households are 2-person households, comprising 31, and the most common type of nonfamily households are 1-person households, comprising 58.
| Household Size | Family Households | Nonfamily Households |
| 1-Person Households | - | 58 (36.5%) |
| 2-Person Households | 31 (19.5%) | 6 (3.8%) |
| 3-Person Households | 13 (8.2%) | 0 (0.0%) |
| 4-Person Households | 28 (17.6%) | 0 (0.0%) |
| 5-Person Households | 9 (5.7%) | 0 (0.0%) |
| 6-Person Households | 14 (8.8%) | 0 (0.0%) |
| 7+ Person Households | 0 (0.0%) | 0 (0.0%) |
| Total | 95 (59.8%) | 64 (40.3%) |
Female Fertility in Dawson borough
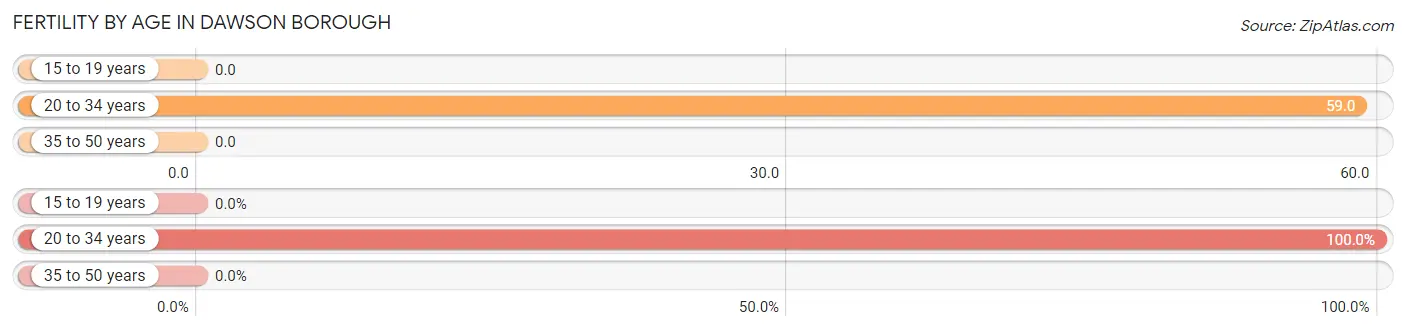
Fertility by Age in Dawson borough
Average fertility rate in Dawson borough is 24.0 births per 1,000 women. Women in the age bracket of 20 to 34 years have the highest fertility rate with 59.0 births per 1,000 women. Women in the age bracket of 20 to 34 years acount for 100.0% of all women with births.
| Age Bracket | Women with Births | Births / 1,000 Women |
| 15 to 19 years | 0 (0.0%) | 0.0 |
| 20 to 34 years | 2 (100.0%) | 59.0 |
| 35 to 50 years | 0 (0.0%) | 0.0 |
| Total | 2 (100.0%) | 24.0 |
Fertility by Age by Marriage Status in Dawson borough
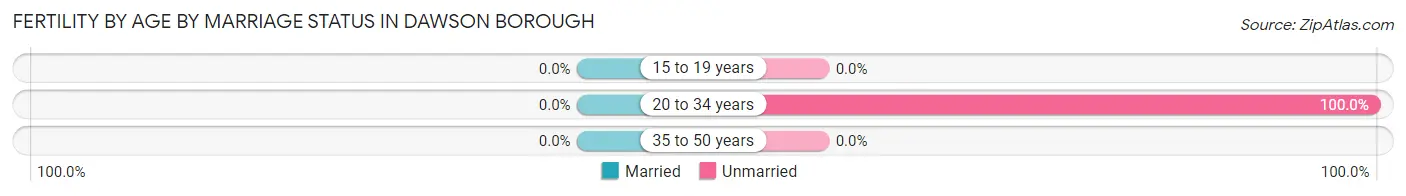
| Age Bracket | Married | Unmarried |
| 15 to 19 years | 0 (0.0%) | 0 (0.0%) |
| 20 to 34 years | 0 (0.0%) | 2 (100.0%) |
| 35 to 50 years | 0 (0.0%) | 0 (0.0%) |
| Total | 0 (0.0%) | 2 (100.0%) |
Fertility by Education in Dawson borough
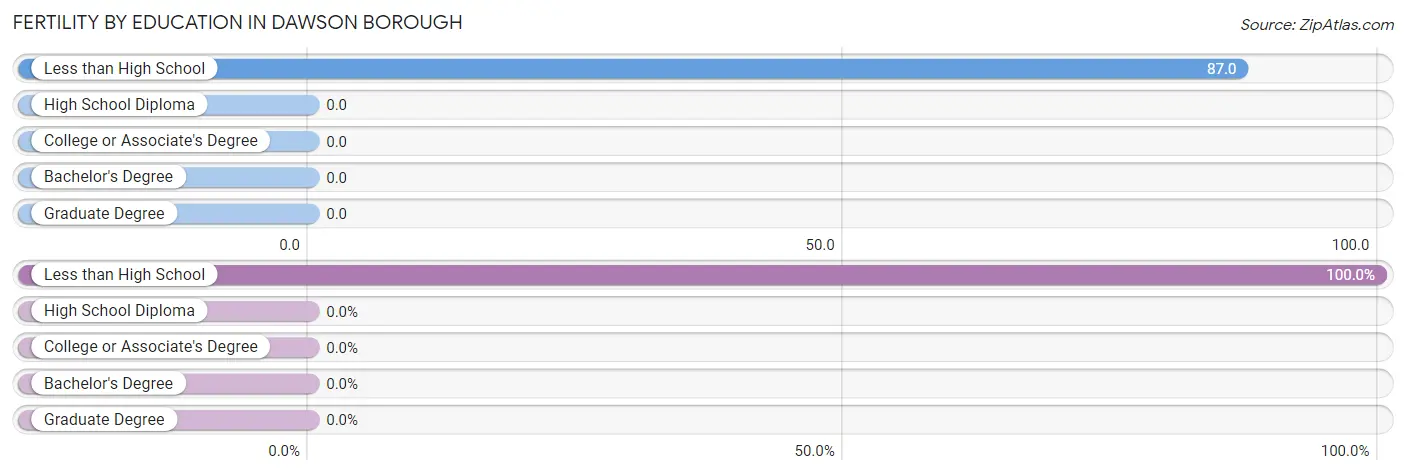
| Educational Attainment | Women with Births | Births / 1,000 Women |
| Less than High School | 2 (100.0%) | 87.0 |
| High School Diploma | 0 (0.0%) | 0.0 |
| College or Associate's Degree | 0 (0.0%) | 0.0 |
| Bachelor's Degree | 0 (0.0%) | 0.0 |
| Graduate Degree | 0 (0.0%) | 0.0 |
| Total | 2 (100.0%) | 24.0 |
Fertility by Education by Marriage Status in Dawson borough
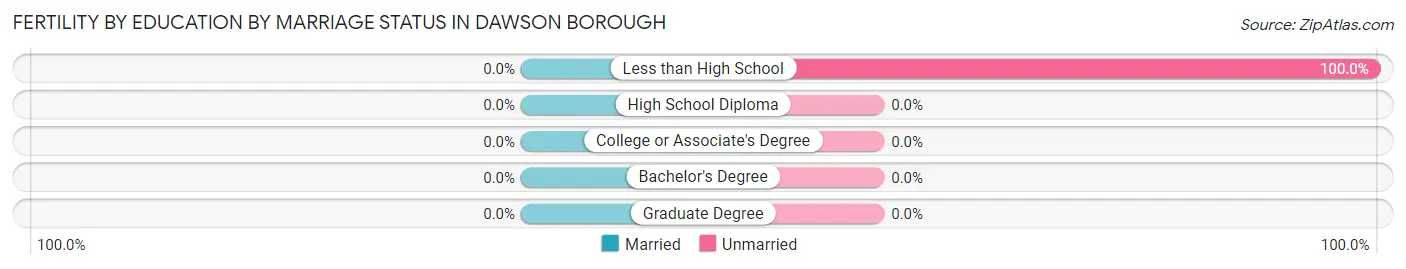
| Educational Attainment | Married | Unmarried |
| Less than High School | 0 (0.0%) | 2 (100.0%) |
| High School Diploma | 0 (0.0%) | 0 (0.0%) |
| College or Associate's Degree | 0 (0.0%) | 0 (0.0%) |
| Bachelor's Degree | 0 (0.0%) | 0 (0.0%) |
| Graduate Degree | 0 (0.0%) | 0 (0.0%) |
| Total | 0 (0.0%) | 2 (100.0%) |
Employment Characteristics in Dawson borough
Employment by Class of Employer in Dawson borough
Among the 155 employed individuals in Dawson borough, private company employees (130 | 83.9%), local government employees (9 | 5.8%), and not-for-profit organizations (7 | 4.5%) make up the most common classes of employment.
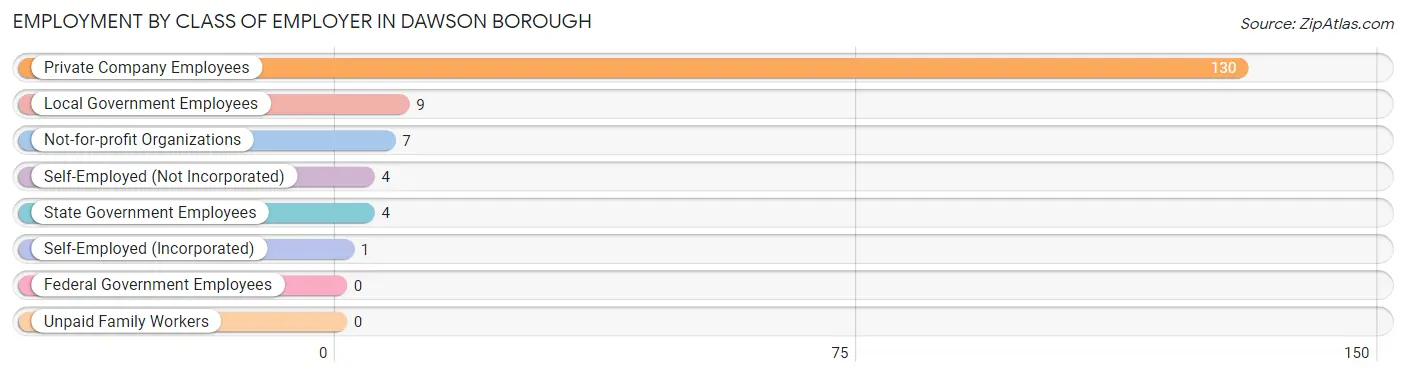
| Employer Class | # Employees | % Employees |
| Private Company Employees | 130 | 83.9% |
| Self-Employed (Incorporated) | 1 | 0.6% |
| Self-Employed (Not Incorporated) | 4 | 2.6% |
| Not-for-profit Organizations | 7 | 4.5% |
| Local Government Employees | 9 | 5.8% |
| State Government Employees | 4 | 2.6% |
| Federal Government Employees | 0 | 0.0% |
| Unpaid Family Workers | 0 | 0.0% |
| Total | 155 | 100.0% |
Employment Status by Age in Dawson borough
According to the labor force statistics for Dawson borough, out of the total population over 16 years of age (300), 58.7% or 176 individuals are in the labor force, with 8.5% or 15 of them unemployed. The age group with the highest labor force participation rate is 35 to 44 years, with 93.3% or 56 individuals in the labor force. Within the labor force, the 35 to 44 years age range has the highest percentage of unemployed individuals, with 21.4% or 12 of them being unemployed.
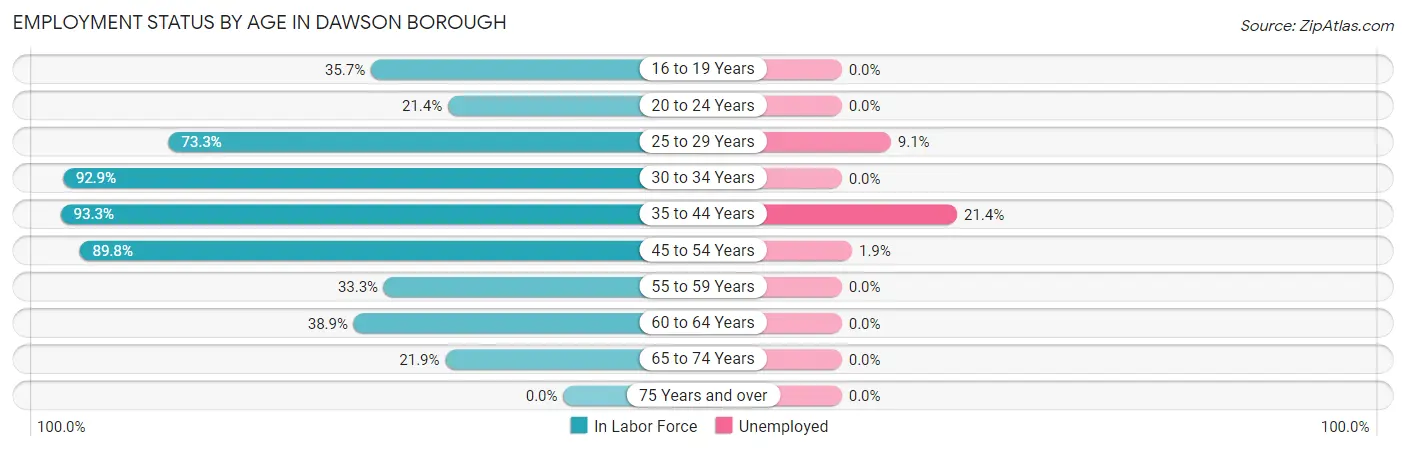
| Age Bracket | In Labor Force | Unemployed |
| 16 to 19 Years | 5 (35.7%) | 0 (0.0%) |
| 20 to 24 Years | 3 (21.4%) | 0 (0.0%) |
| 25 to 29 Years | 22 (73.3%) | 2 (9.1%) |
| 30 to 34 Years | 13 (92.9%) | 0 (0.0%) |
| 35 to 44 Years | 56 (93.3%) | 12 (21.4%) |
| 45 to 54 Years | 53 (89.8%) | 1 (1.9%) |
| 55 to 59 Years | 10 (33.3%) | 0 (0.0%) |
| 60 to 64 Years | 7 (38.9%) | 0 (0.0%) |
| 65 to 74 Years | 7 (21.9%) | 0 (0.0%) |
| 75 Years and over | 0 (0.0%) | 0 (0.0%) |
| Total | 176 (58.7%) | 15 (8.5%) |
Employment Status by Educational Attainment in Dawson borough
According to labor force statistics for Dawson borough, 76.3% of individuals (161) out of the total population between 25 and 64 years of age (211) are in the labor force, with 9.3% or 15 of them being unemployed. The group with the highest labor force participation rate are those with the educational attainment of college / associate degree, with 98.3% or 58 individuals in the labor force. Within the labor force, individuals with high school diploma education have the highest percentage of unemployment, with 16.9% or 14 of them being unemployed.
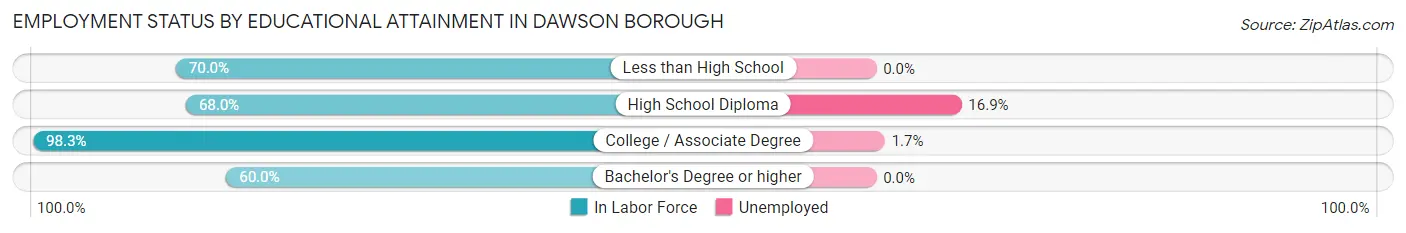
| Educational Attainment | In Labor Force | Unemployed |
| Less than High School | 14 (70.0%) | 0 (0.0%) |
| High School Diploma | 83 (68.0%) | 21 (16.9%) |
| College / Associate Degree | 58 (98.3%) | 1 (1.7%) |
| Bachelor's Degree or higher | 6 (60.0%) | 0 (0.0%) |
| Total | 161 (76.3%) | 20 (9.3%) |
Employment Occupations by Sex in Dawson borough
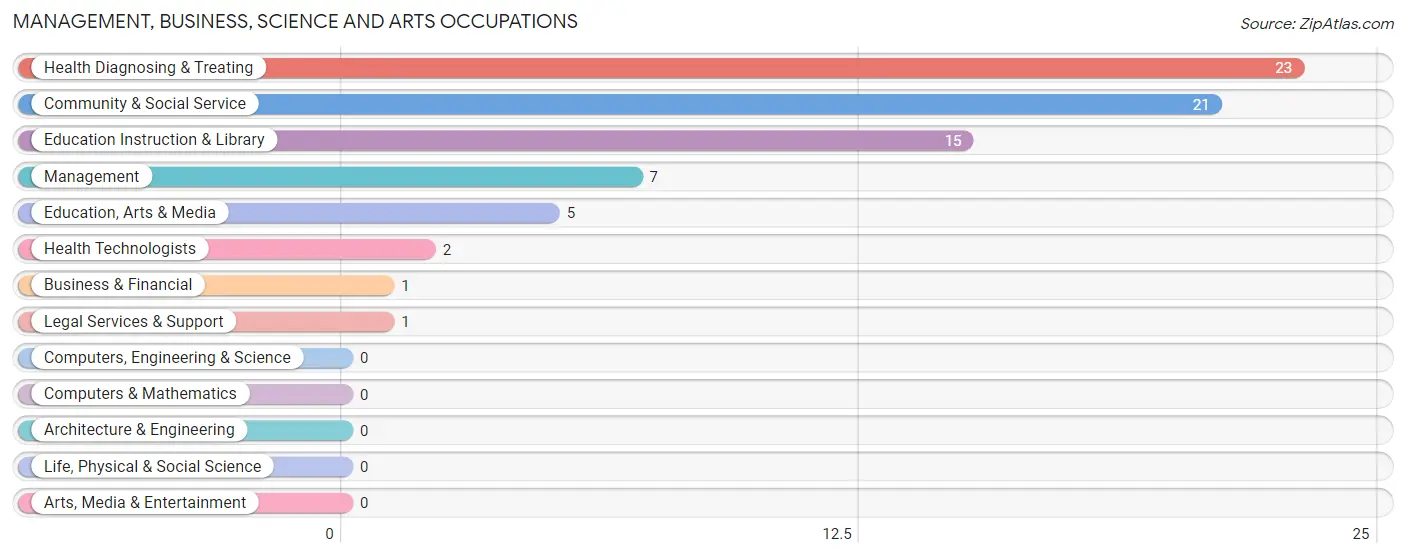
Management, Business, Science and Arts Occupations
The most common Management, Business, Science and Arts occupations in Dawson borough are Health Diagnosing & Treating (23 | 14.3%), Community & Social Service (21 | 13.0%), Education Instruction & Library (15 | 9.3%), Management (7 | 4.3%), and Education, Arts & Media (5 | 3.1%).
Management, Business, Science and Arts Occupations by Sex
Within the Management, Business, Science and Arts occupations in Dawson borough, the most male-oriented occupations are Legal Services & Support (100.0%), Management (57.1%), and Health Diagnosing & Treating (21.7%), while the most female-oriented occupations are Business & Financial (100.0%), Education, Arts & Media (100.0%), and Health Technologists (100.0%).
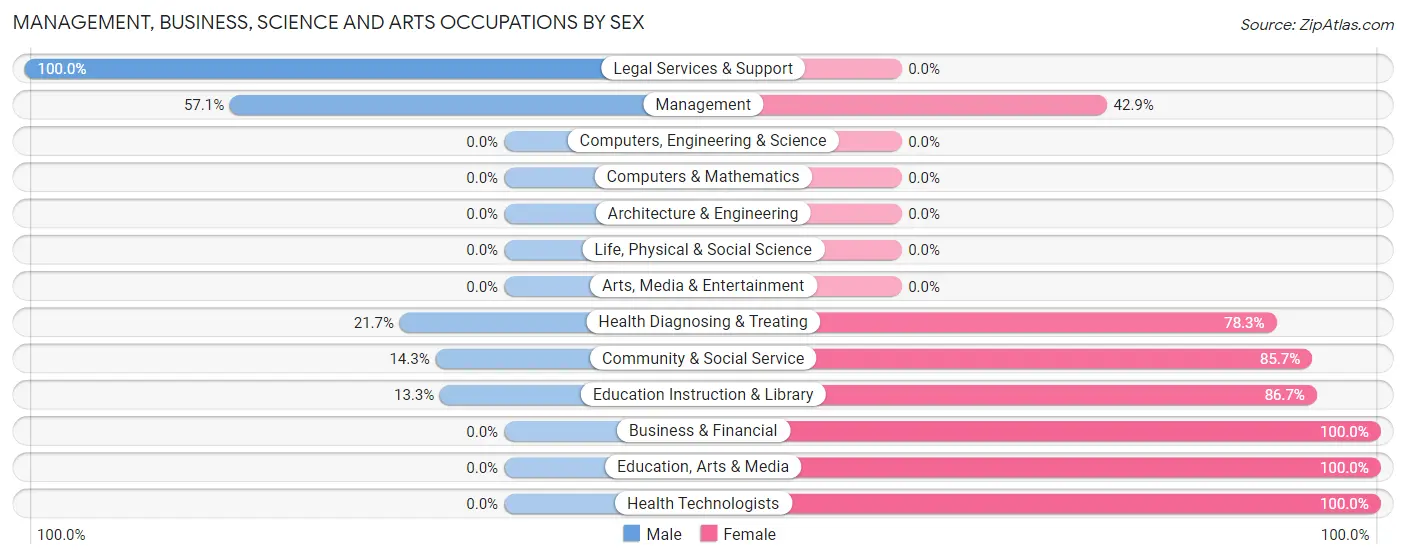
| Occupation | Male | Female |
| Management | 4 (57.1%) | 3 (42.9%) |
| Business & Financial | 0 (0.0%) | 1 (100.0%) |
| Computers, Engineering & Science | 0 (0.0%) | 0 (0.0%) |
| Computers & Mathematics | 0 (0.0%) | 0 (0.0%) |
| Architecture & Engineering | 0 (0.0%) | 0 (0.0%) |
| Life, Physical & Social Science | 0 (0.0%) | 0 (0.0%) |
| Community & Social Service | 3 (14.3%) | 18 (85.7%) |
| Education, Arts & Media | 0 (0.0%) | 5 (100.0%) |
| Legal Services & Support | 1 (100.0%) | 0 (0.0%) |
| Education Instruction & Library | 2 (13.3%) | 13 (86.7%) |
| Arts, Media & Entertainment | 0 (0.0%) | 0 (0.0%) |
| Health Diagnosing & Treating | 5 (21.7%) | 18 (78.3%) |
| Health Technologists | 0 (0.0%) | 2 (100.0%) |
| Total (Category) | 12 (23.1%) | 40 (76.9%) |
| Total (Overall) | 66 (41.0%) | 95 (59.0%) |
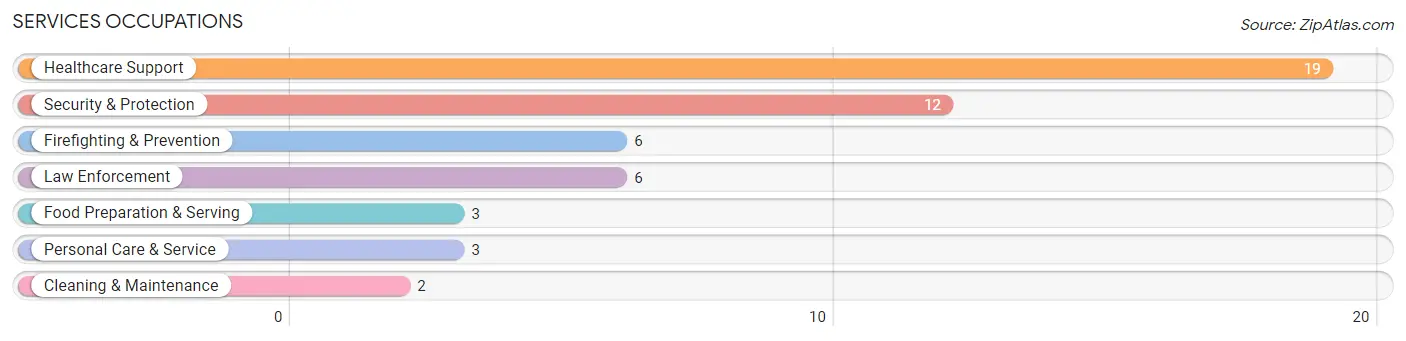
Services Occupations
The most common Services occupations in Dawson borough are Healthcare Support (19 | 11.8%), Security & Protection (12 | 7.4%), Firefighting & Prevention (6 | 3.7%), Law Enforcement (6 | 3.7%), and Food Preparation & Serving (3 | 1.9%).
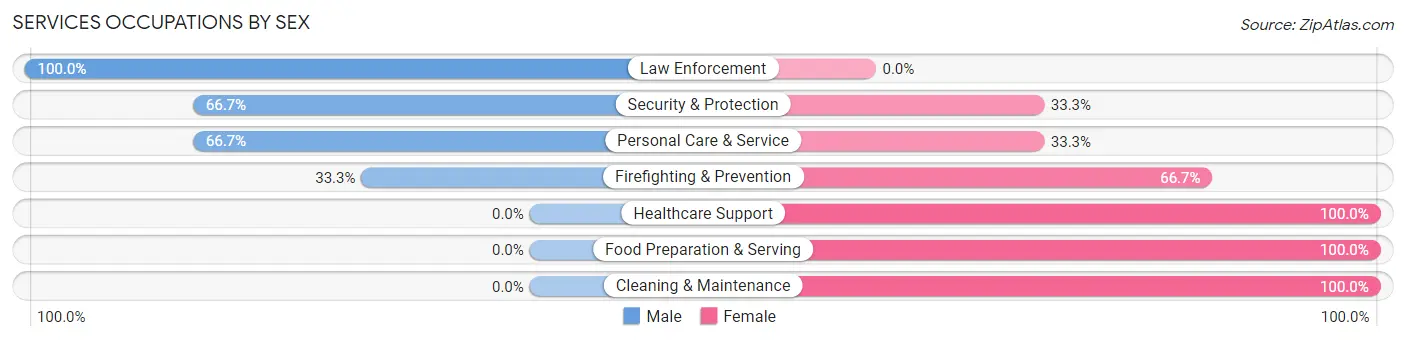
Services Occupations by Sex
Within the Services occupations in Dawson borough, the most male-oriented occupations are Law Enforcement (100.0%), Security & Protection (66.7%), and Personal Care & Service (66.7%), while the most female-oriented occupations are Healthcare Support (100.0%), Food Preparation & Serving (100.0%), and Cleaning & Maintenance (100.0%).
| Occupation | Male | Female |
| Healthcare Support | 0 (0.0%) | 19 (100.0%) |
| Security & Protection | 8 (66.7%) | 4 (33.3%) |
| Firefighting & Prevention | 2 (33.3%) | 4 (66.7%) |
| Law Enforcement | 6 (100.0%) | 0 (0.0%) |
| Food Preparation & Serving | 0 (0.0%) | 3 (100.0%) |
| Cleaning & Maintenance | 0 (0.0%) | 2 (100.0%) |
| Personal Care & Service | 2 (66.7%) | 1 (33.3%) |
| Total (Category) | 10 (25.6%) | 29 (74.4%) |
| Total (Overall) | 66 (41.0%) | 95 (59.0%) |
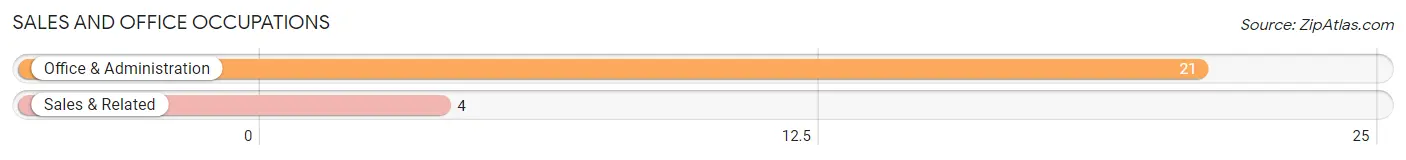
Sales and Office Occupations
The most common Sales and Office occupations in Dawson borough are Office & Administration (21 | 13.0%), and Sales & Related (4 | 2.5%).
Sales and Office Occupations by Sex
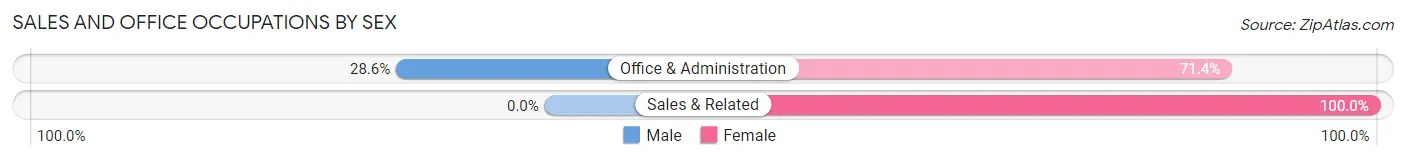
| Occupation | Male | Female |
| Sales & Related | 0 (0.0%) | 4 (100.0%) |
| Office & Administration | 6 (28.6%) | 15 (71.4%) |
| Total (Category) | 6 (24.0%) | 19 (76.0%) |
| Total (Overall) | 66 (41.0%) | 95 (59.0%) |
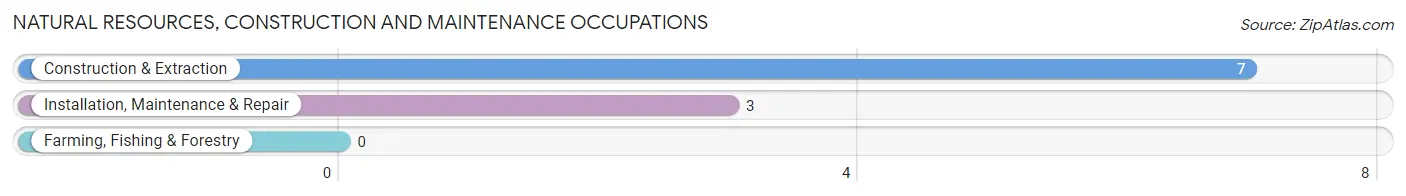
Natural Resources, Construction and Maintenance Occupations
The most common Natural Resources, Construction and Maintenance occupations in Dawson borough are Construction & Extraction (7 | 4.3%), and Installation, Maintenance & Repair (3 | 1.9%).
Natural Resources, Construction and Maintenance Occupations by Sex
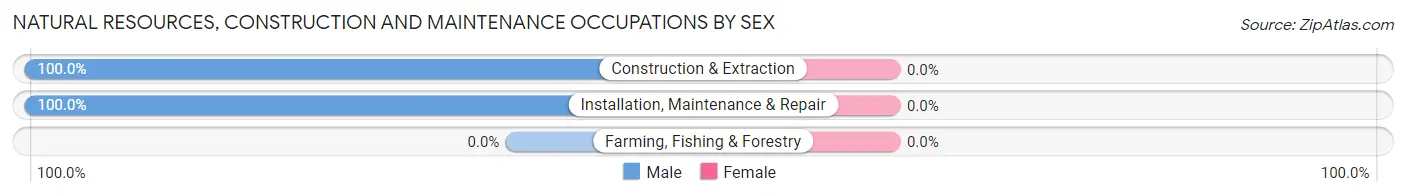
| Occupation | Male | Female |
| Farming, Fishing & Forestry | 0 (0.0%) | 0 (0.0%) |
| Construction & Extraction | 7 (100.0%) | 0 (0.0%) |
| Installation, Maintenance & Repair | 3 (100.0%) | 0 (0.0%) |
| Total (Category) | 10 (100.0%) | 0 (0.0%) |
| Total (Overall) | 66 (41.0%) | 95 (59.0%) |
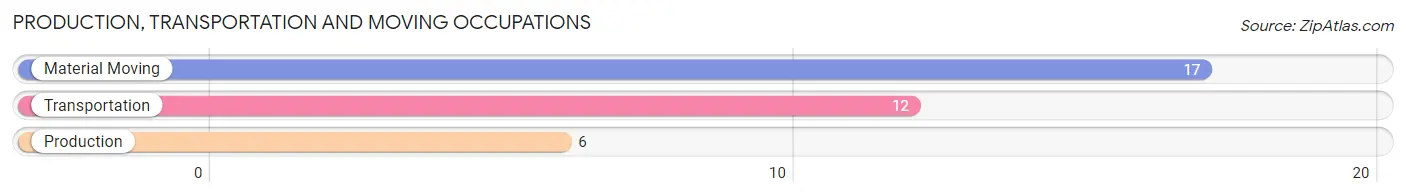
Production, Transportation and Moving Occupations
The most common Production, Transportation and Moving occupations in Dawson borough are Material Moving (17 | 10.6%), Transportation (12 | 7.4%), and Production (6 | 3.7%).
Production, Transportation and Moving Occupations by Sex
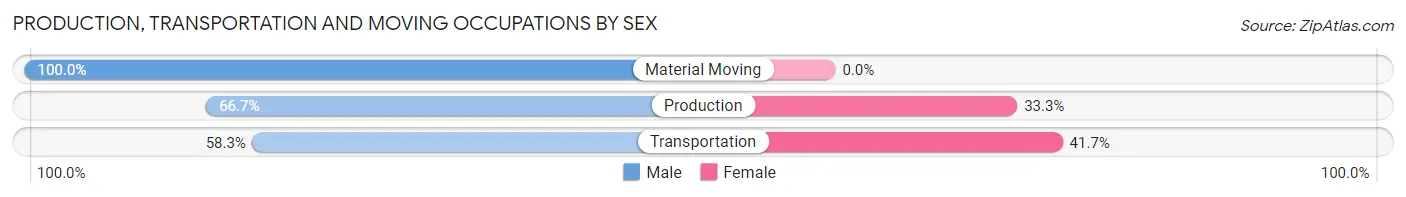
| Occupation | Male | Female |
| Production | 4 (66.7%) | 2 (33.3%) |
| Transportation | 7 (58.3%) | 5 (41.7%) |
| Material Moving | 17 (100.0%) | 0 (0.0%) |
| Total (Category) | 28 (80.0%) | 7 (20.0%) |
| Total (Overall) | 66 (41.0%) | 95 (59.0%) |
Employment Industries by Sex in Dawson borough
Employment Industries in Dawson borough
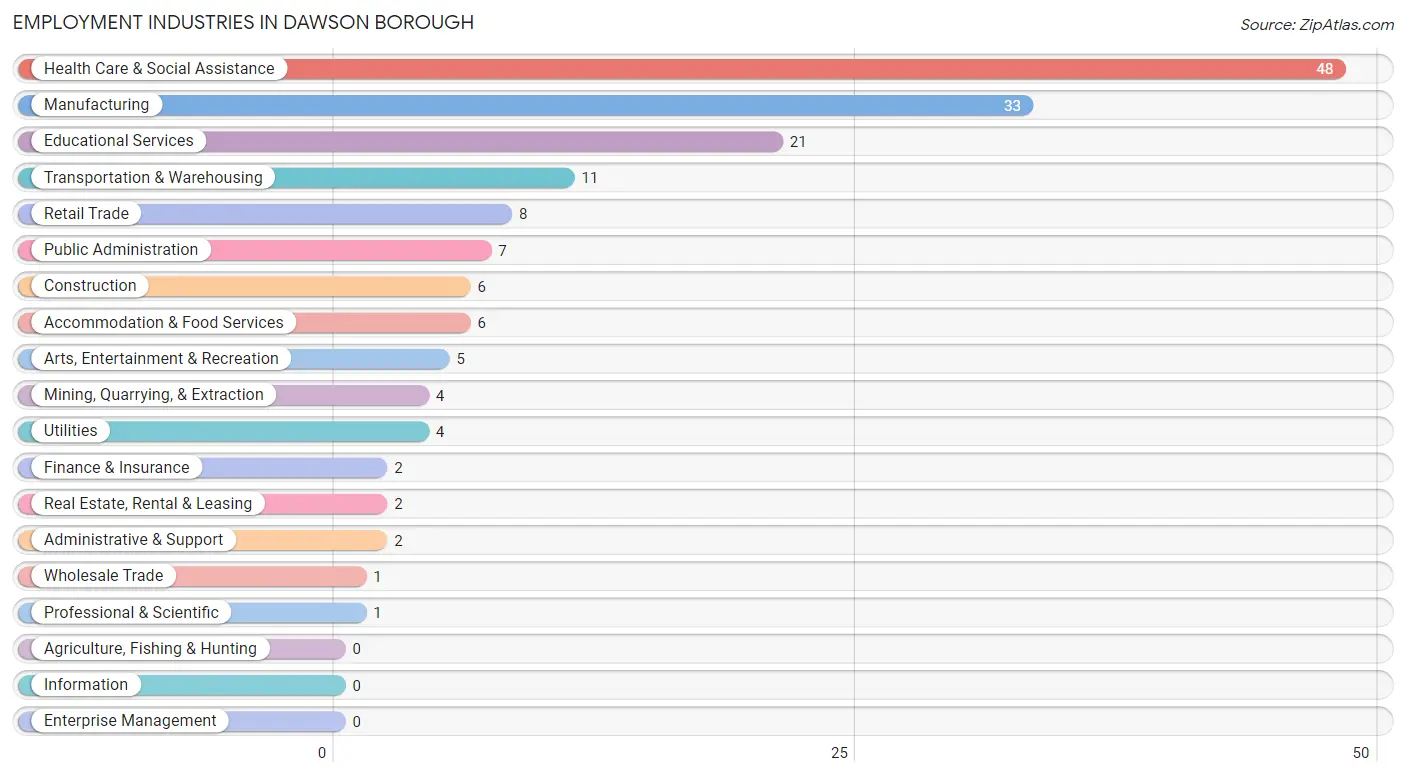
The major employment industries in Dawson borough include Health Care & Social Assistance (48 | 29.8%), Manufacturing (33 | 20.5%), Educational Services (21 | 13.0%), Transportation & Warehousing (11 | 6.8%), and Retail Trade (8 | 5.0%).
Employment Industries by Sex in Dawson borough
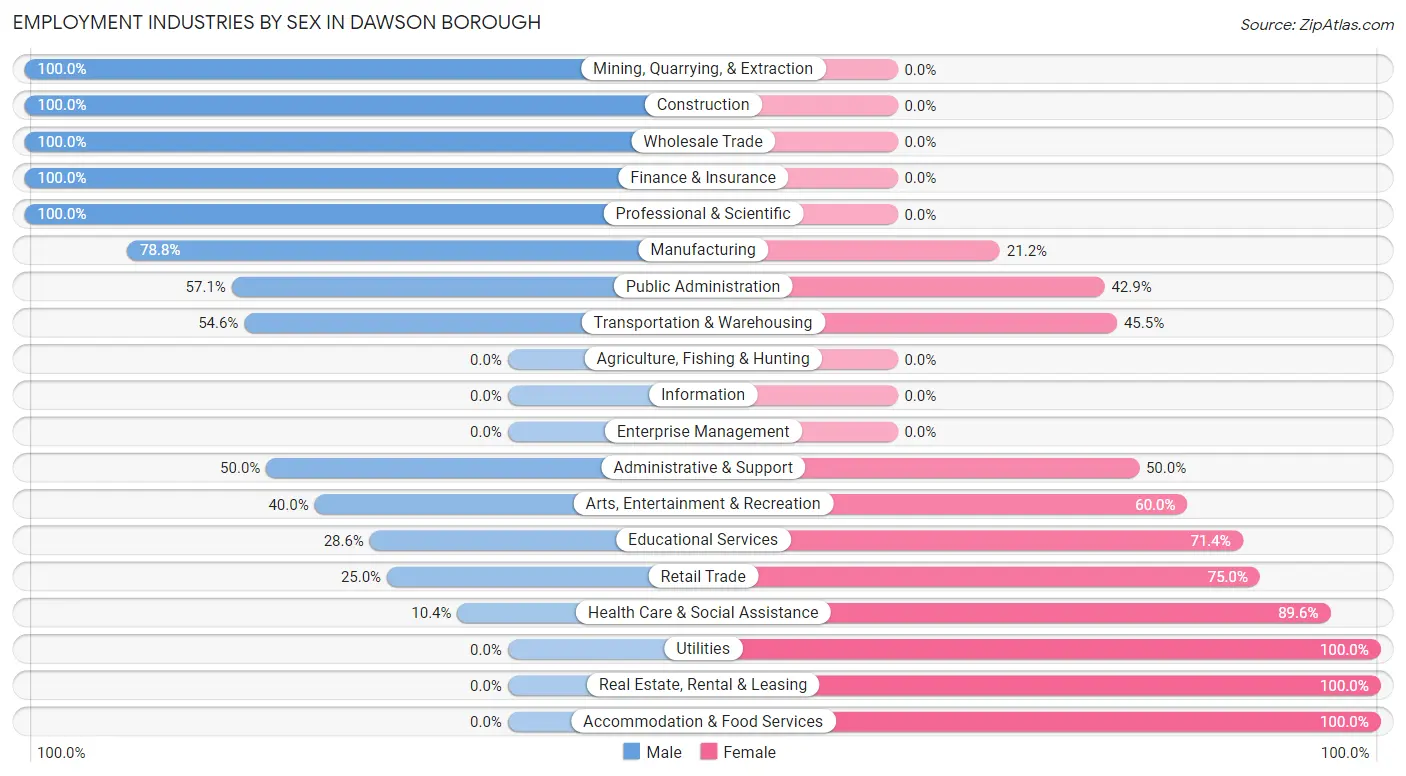
The Dawson borough industries that see more men than women are Mining, Quarrying, & Extraction (100.0%), Construction (100.0%), and Wholesale Trade (100.0%), whereas the industries that tend to have a higher number of women are Utilities (100.0%), Real Estate, Rental & Leasing (100.0%), and Accommodation & Food Services (100.0%).
| Industry | Male | Female |
| Agriculture, Fishing & Hunting | 0 (0.0%) | 0 (0.0%) |
| Mining, Quarrying, & Extraction | 4 (100.0%) | 0 (0.0%) |
| Construction | 6 (100.0%) | 0 (0.0%) |
| Manufacturing | 26 (78.8%) | 7 (21.2%) |
| Wholesale Trade | 1 (100.0%) | 0 (0.0%) |
| Retail Trade | 2 (25.0%) | 6 (75.0%) |
| Transportation & Warehousing | 6 (54.5%) | 5 (45.5%) |
| Utilities | 0 (0.0%) | 4 (100.0%) |
| Information | 0 (0.0%) | 0 (0.0%) |
| Finance & Insurance | 2 (100.0%) | 0 (0.0%) |
| Real Estate, Rental & Leasing | 0 (0.0%) | 2 (100.0%) |
| Professional & Scientific | 1 (100.0%) | 0 (0.0%) |
| Enterprise Management | 0 (0.0%) | 0 (0.0%) |
| Administrative & Support | 1 (50.0%) | 1 (50.0%) |
| Educational Services | 6 (28.6%) | 15 (71.4%) |
| Health Care & Social Assistance | 5 (10.4%) | 43 (89.6%) |
| Arts, Entertainment & Recreation | 2 (40.0%) | 3 (60.0%) |
| Accommodation & Food Services | 0 (0.0%) | 6 (100.0%) |
| Public Administration | 4 (57.1%) | 3 (42.9%) |
| Total | 66 (41.0%) | 95 (59.0%) |
Education in Dawson borough
School Enrollment in Dawson borough
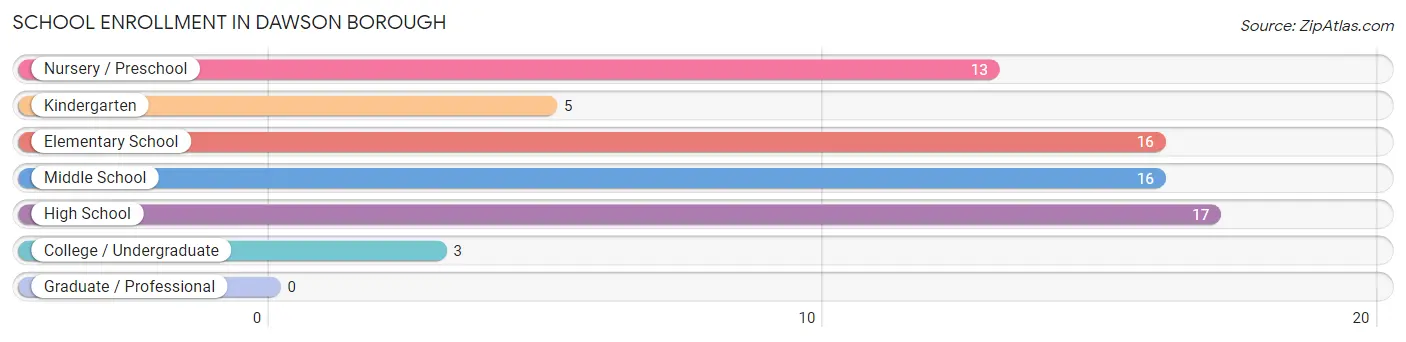
The most common levels of schooling among the 70 students in Dawson borough are high school (17 | 24.3%), elementary school (16 | 22.9%), and middle school (16 | 22.9%).
| School Level | # Students | % Students |
| Nursery / Preschool | 13 | 18.6% |
| Kindergarten | 5 | 7.1% |
| Elementary School | 16 | 22.9% |
| Middle School | 16 | 22.9% |
| High School | 17 | 24.3% |
| College / Undergraduate | 3 | 4.3% |
| Graduate / Professional | 0 | 0.0% |
| Total | 70 | 100.0% |
School Enrollment by Age by Funding Source in Dawson borough
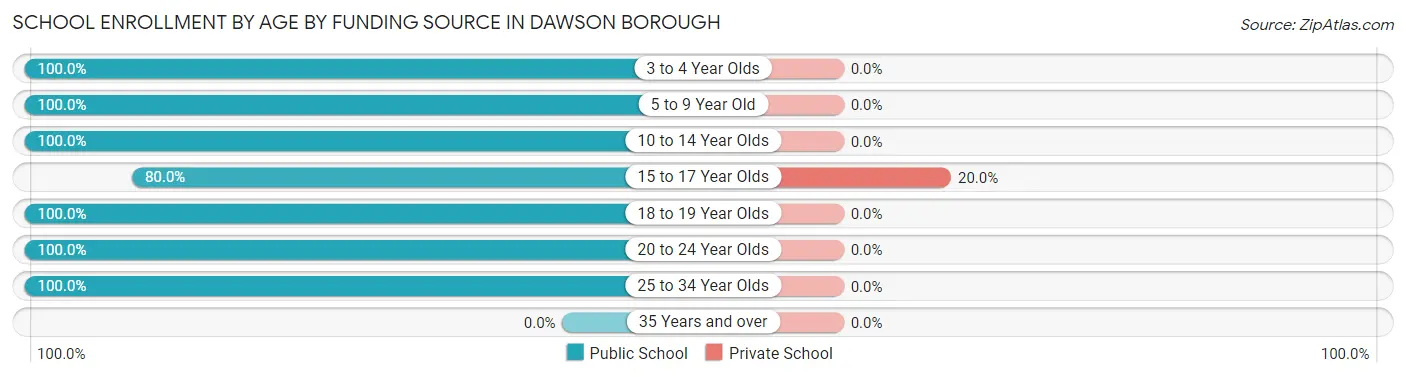
Out of a total of 70 students who are enrolled in schools in Dawson borough, 3 (4.3%) attend a private institution, while the remaining 67 (95.7%) are enrolled in public schools. The age group of 15 to 17 year olds has the highest likelihood of being enrolled in private schools, with 3 (20.0% in the age bracket) enrolled. Conversely, the age group of 3 to 4 year olds has the lowest likelihood of being enrolled in a private school, with 12 (100.0% in the age bracket) attending a public institution.
| Age Bracket | Public School | Private School |
| 3 to 4 Year Olds | 12 (100.0%) | 0 (0.0%) |
| 5 to 9 Year Old | 21 (100.0%) | 0 (0.0%) |
| 10 to 14 Year Olds | 17 (100.0%) | 0 (0.0%) |
| 15 to 17 Year Olds | 12 (80.0%) | 3 (20.0%) |
| 18 to 19 Year Olds | 3 (100.0%) | 0 (0.0%) |
| 20 to 24 Year Olds | 1 (100.0%) | 0 (0.0%) |
| 25 to 34 Year Olds | 1 (100.0%) | 0 (0.0%) |
| 35 Years and over | 0 (0.0%) | 0 (0.0%) |
| Total | 67 (95.7%) | 3 (4.3%) |
Educational Attainment by Field of Study in Dawson borough
Visual & performing arts (4 | 25.0%), education (3 | 18.8%), arts & humanities (3 | 18.8%), psychology (2 | 12.5%), and liberal arts & history (2 | 12.5%) are the most common fields of study among 16 individuals in Dawson borough who have obtained a bachelor's degree or higher.
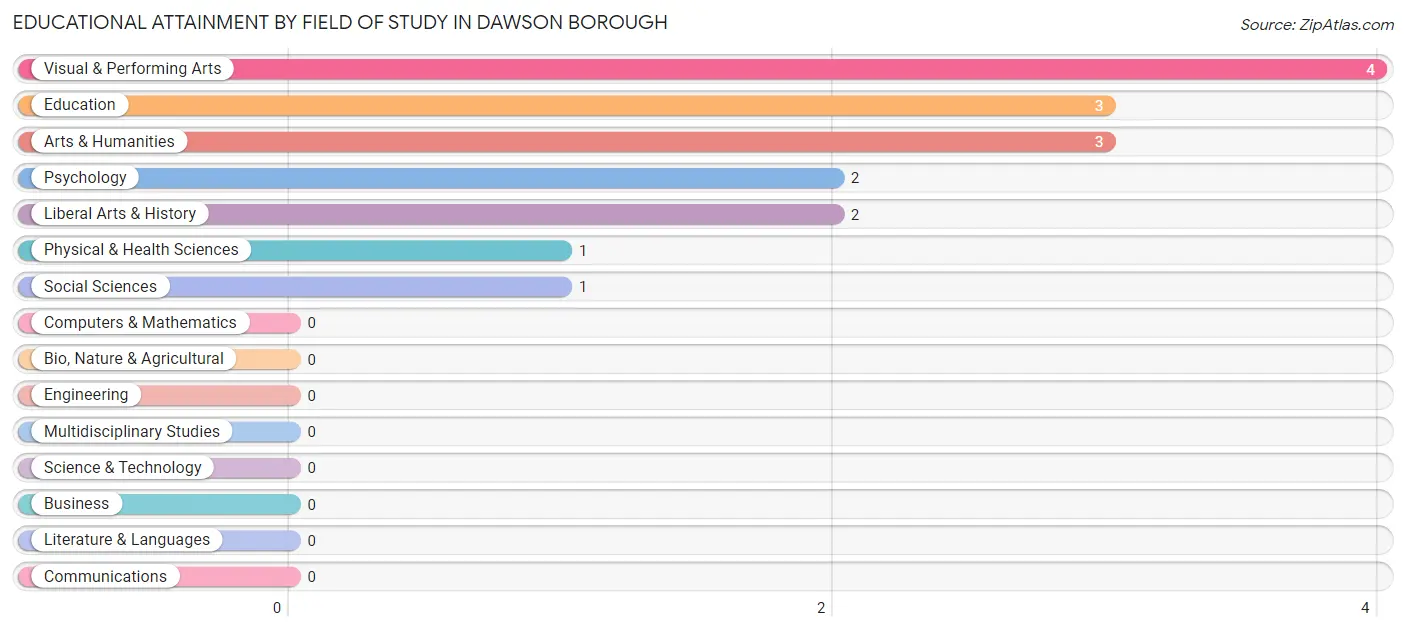
| Field of Study | # Graduates | % Graduates |
| Computers & Mathematics | 0 | 0.0% |
| Bio, Nature & Agricultural | 0 | 0.0% |
| Physical & Health Sciences | 1 | 6.2% |
| Psychology | 2 | 12.5% |
| Social Sciences | 1 | 6.2% |
| Engineering | 0 | 0.0% |
| Multidisciplinary Studies | 0 | 0.0% |
| Science & Technology | 0 | 0.0% |
| Business | 0 | 0.0% |
| Education | 3 | 18.8% |
| Literature & Languages | 0 | 0.0% |
| Liberal Arts & History | 2 | 12.5% |
| Visual & Performing Arts | 4 | 25.0% |
| Communications | 0 | 0.0% |
| Arts & Humanities | 3 | 18.8% |
| Total | 16 | 100.0% |
Transportation & Commute in Dawson borough
Vehicle Availability by Sex in Dawson borough
The most prevalent vehicle ownership categories in Dawson borough are males with 2 vehicles (21, accounting for 31.8%) and females with 2 vehicles (46, making up 23.6%).
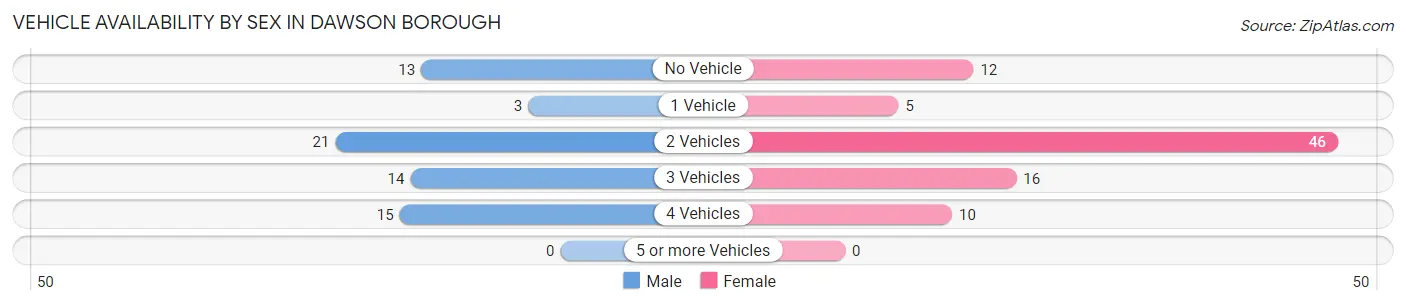
| Vehicles Available | Male | Female |
| No Vehicle | 13 (19.7%) | 12 (13.5%) |
| 1 Vehicle | 3 (4.5%) | 5 (5.6%) |
| 2 Vehicles | 21 (31.8%) | 46 (51.7%) |
| 3 Vehicles | 14 (21.2%) | 16 (18.0%) |
| 4 Vehicles | 15 (22.7%) | 10 (11.2%) |
| 5 or more Vehicles | 0 (0.0%) | 0 (0.0%) |
| Total | 66 (100.0%) | 89 (100.0%) |
Commute Time in Dawson borough
The most frequently occuring commute durations in Dawson borough are 15 to 19 minutes (35 commuters, 24.6%), 10 to 14 minutes (25 commuters, 17.6%), and 30 to 34 minutes (16 commuters, 11.3%).
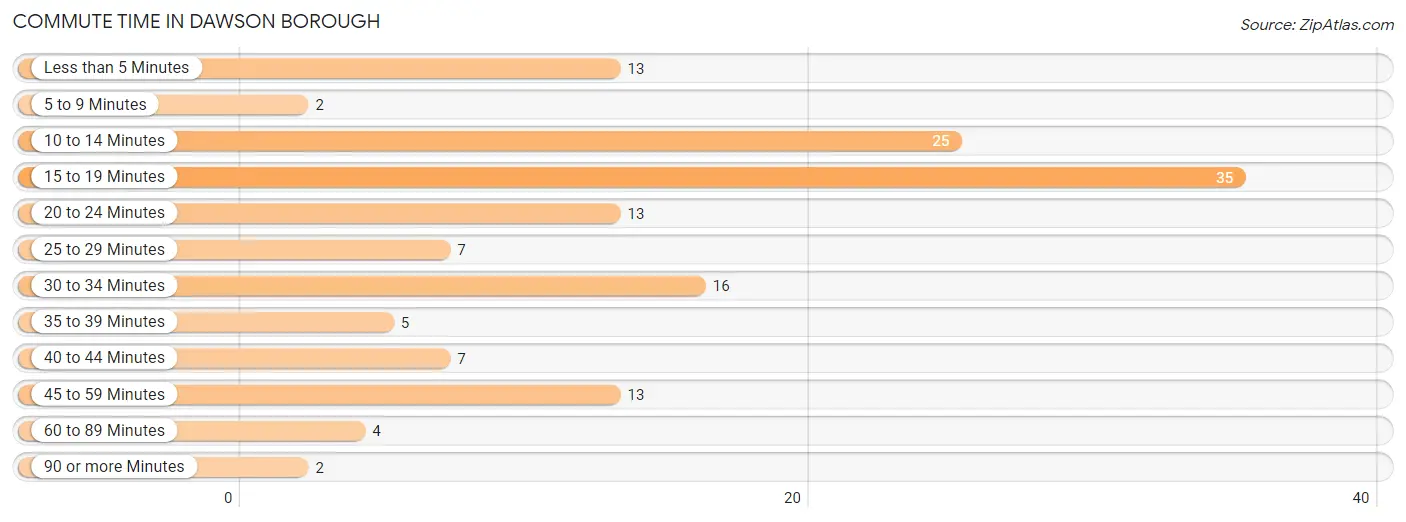
| Commute Time | # Commuters | % Commuters |
| Less than 5 Minutes | 13 | 9.1% |
| 5 to 9 Minutes | 2 | 1.4% |
| 10 to 14 Minutes | 25 | 17.6% |
| 15 to 19 Minutes | 35 | 24.6% |
| 20 to 24 Minutes | 13 | 9.1% |
| 25 to 29 Minutes | 7 | 4.9% |
| 30 to 34 Minutes | 16 | 11.3% |
| 35 to 39 Minutes | 5 | 3.5% |
| 40 to 44 Minutes | 7 | 4.9% |
| 45 to 59 Minutes | 13 | 9.1% |
| 60 to 89 Minutes | 4 | 2.8% |
| 90 or more Minutes | 2 | 1.4% |
Commute Time by Sex in Dawson borough
The most common commute times in Dawson borough are 15 to 19 minutes (18 commuters, 27.3%) for males and 10 to 14 minutes (18 commuters, 23.7%) for females.
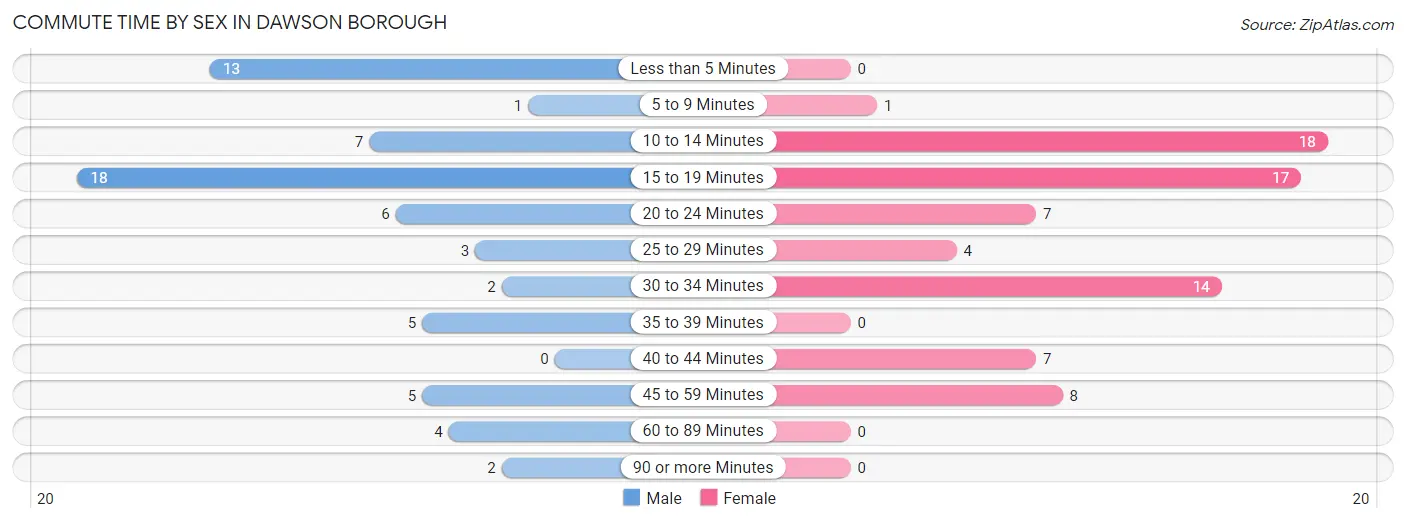
| Commute Time | Male | Female |
| Less than 5 Minutes | 13 (19.7%) | 0 (0.0%) |
| 5 to 9 Minutes | 1 (1.5%) | 1 (1.3%) |
| 10 to 14 Minutes | 7 (10.6%) | 18 (23.7%) |
| 15 to 19 Minutes | 18 (27.3%) | 17 (22.4%) |
| 20 to 24 Minutes | 6 (9.1%) | 7 (9.2%) |
| 25 to 29 Minutes | 3 (4.5%) | 4 (5.3%) |
| 30 to 34 Minutes | 2 (3.0%) | 14 (18.4%) |
| 35 to 39 Minutes | 5 (7.6%) | 0 (0.0%) |
| 40 to 44 Minutes | 0 (0.0%) | 7 (9.2%) |
| 45 to 59 Minutes | 5 (7.6%) | 8 (10.5%) |
| 60 to 89 Minutes | 4 (6.1%) | 0 (0.0%) |
| 90 or more Minutes | 2 (3.0%) | 0 (0.0%) |
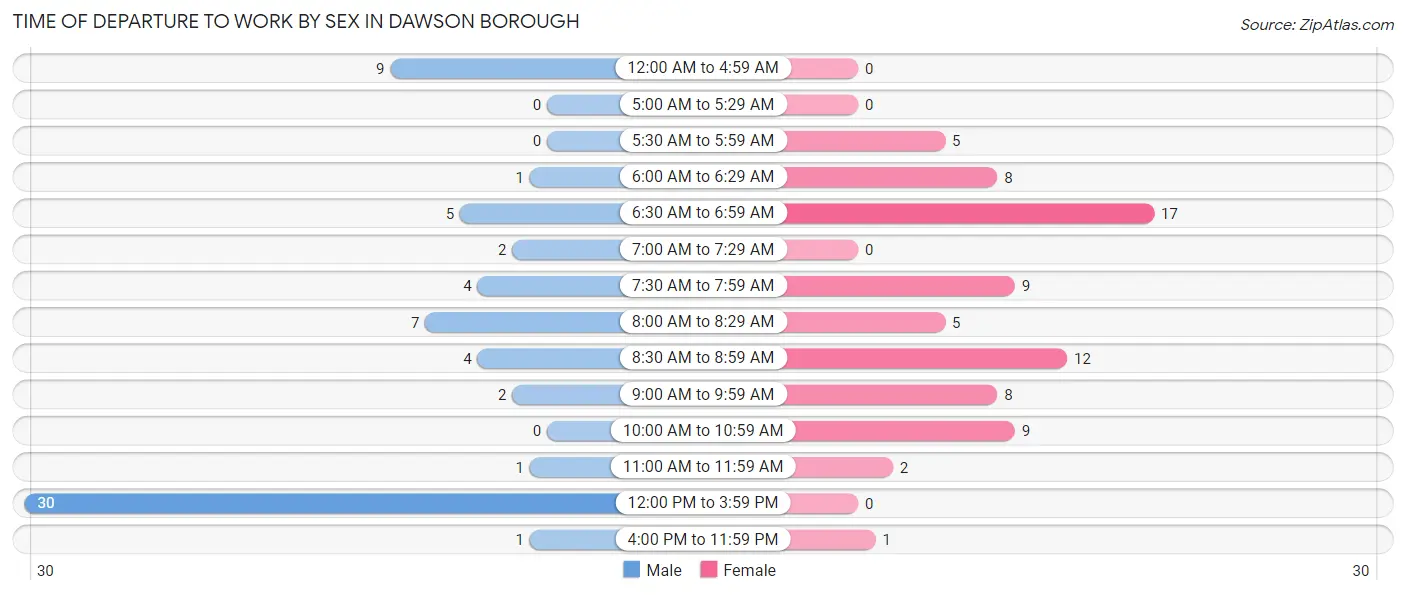
Time of Departure to Work by Sex in Dawson borough
The most frequent times of departure to work in Dawson borough are 12:00 PM to 3:59 PM (30, 45.5%) for males and 6:30 AM to 6:59 AM (17, 22.4%) for females.
| Time of Departure | Male | Female |
| 12:00 AM to 4:59 AM | 9 (13.6%) | 0 (0.0%) |
| 5:00 AM to 5:29 AM | 0 (0.0%) | 0 (0.0%) |
| 5:30 AM to 5:59 AM | 0 (0.0%) | 5 (6.6%) |
| 6:00 AM to 6:29 AM | 1 (1.5%) | 8 (10.5%) |
| 6:30 AM to 6:59 AM | 5 (7.6%) | 17 (22.4%) |
| 7:00 AM to 7:29 AM | 2 (3.0%) | 0 (0.0%) |
| 7:30 AM to 7:59 AM | 4 (6.1%) | 9 (11.8%) |
| 8:00 AM to 8:29 AM | 7 (10.6%) | 5 (6.6%) |
| 8:30 AM to 8:59 AM | 4 (6.1%) | 12 (15.8%) |
| 9:00 AM to 9:59 AM | 2 (3.0%) | 8 (10.5%) |
| 10:00 AM to 10:59 AM | 0 (0.0%) | 9 (11.8%) |
| 11:00 AM to 11:59 AM | 1 (1.5%) | 2 (2.6%) |
| 12:00 PM to 3:59 PM | 30 (45.5%) | 0 (0.0%) |
| 4:00 PM to 11:59 PM | 1 (1.5%) | 1 (1.3%) |
| Total | 66 (100.0%) | 76 (100.0%) |
Housing Occupancy in Dawson borough
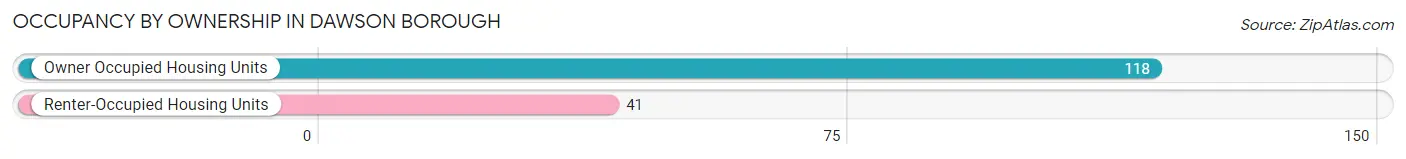
Occupancy by Ownership in Dawson borough
Of the total 159 dwellings in Dawson borough, owner-occupied units account for 118 (74.2%), while renter-occupied units make up 41 (25.8%).
| Occupancy | # Housing Units | % Housing Units |
| Owner Occupied Housing Units | 118 | 74.2% |
| Renter-Occupied Housing Units | 41 | 25.8% |
| Total Occupied Housing Units | 159 | 100.0% |
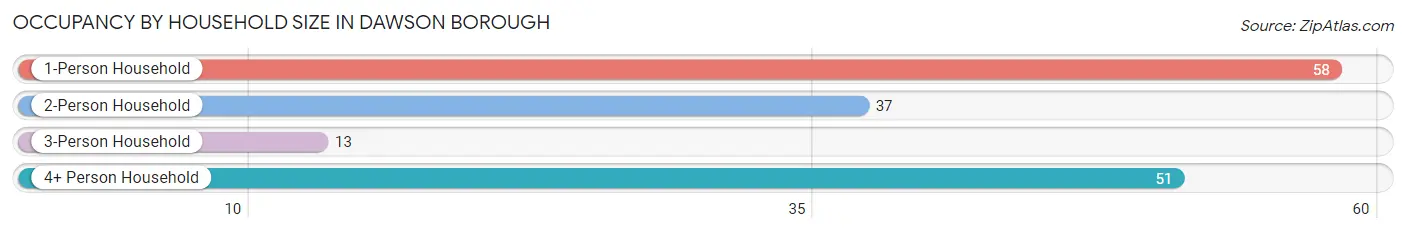
Occupancy by Household Size in Dawson borough
| Household Size | # Housing Units | % Housing Units |
| 1-Person Household | 58 | 36.5% |
| 2-Person Household | 37 | 23.3% |
| 3-Person Household | 13 | 8.2% |
| 4+ Person Household | 51 | 32.1% |
| Total Housing Units | 159 | 100.0% |
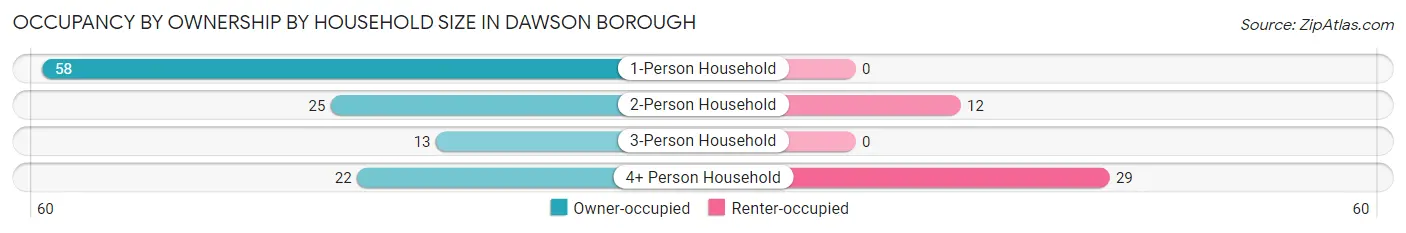
Occupancy by Ownership by Household Size in Dawson borough
| Household Size | Owner-occupied | Renter-occupied |
| 1-Person Household | 58 (100.0%) | 0 (0.0%) |
| 2-Person Household | 25 (67.6%) | 12 (32.4%) |
| 3-Person Household | 13 (100.0%) | 0 (0.0%) |
| 4+ Person Household | 22 (43.1%) | 29 (56.9%) |
| Total Housing Units | 118 (74.2%) | 41 (25.8%) |
Occupancy by Educational Attainment in Dawson borough
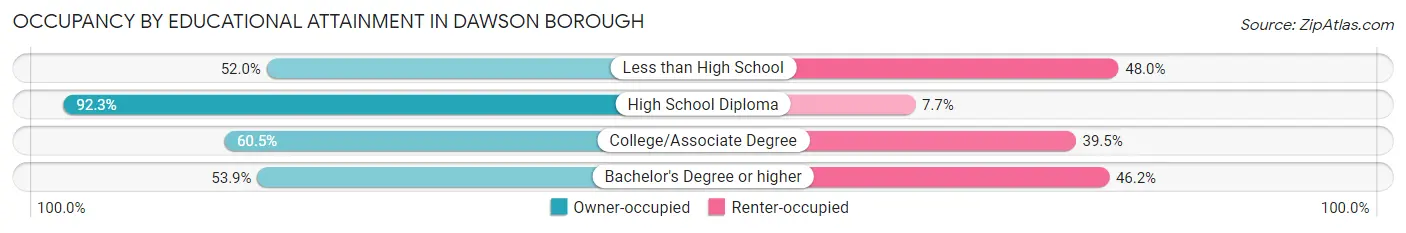
| Household Size | Owner-occupied | Renter-occupied |
| Less than High School | 13 (52.0%) | 12 (48.0%) |
| High School Diploma | 72 (92.3%) | 6 (7.7%) |
| College/Associate Degree | 26 (60.5%) | 17 (39.5%) |
| Bachelor's Degree or higher | 7 (53.8%) | 6 (46.2%) |
Occupancy by Age of Householder in Dawson borough
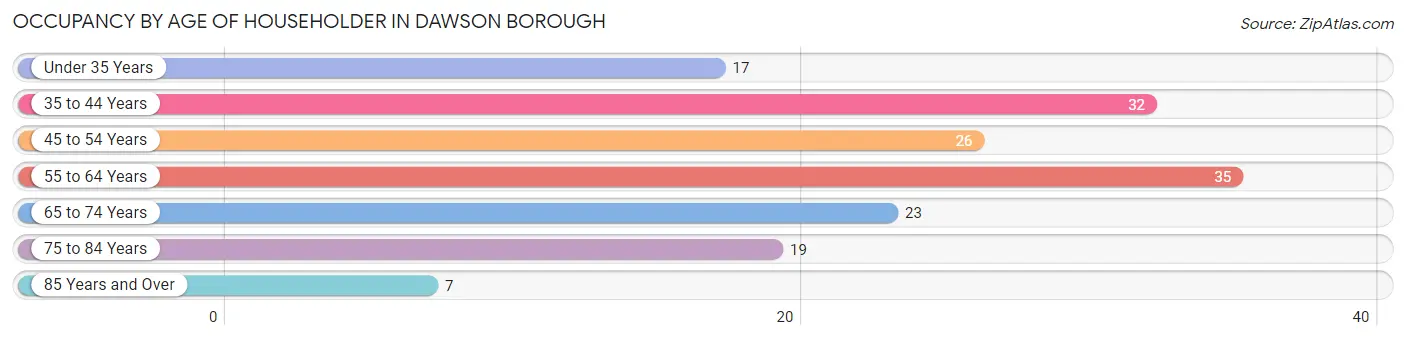
| Age Bracket | # Households | % Households |
| Under 35 Years | 17 | 10.7% |
| 35 to 44 Years | 32 | 20.1% |
| 45 to 54 Years | 26 | 16.4% |
| 55 to 64 Years | 35 | 22.0% |
| 65 to 74 Years | 23 | 14.5% |
| 75 to 84 Years | 19 | 11.9% |
| 85 Years and Over | 7 | 4.4% |
| Total | 159 | 100.0% |
Housing Finances in Dawson borough
Median Income by Occupancy in Dawson borough
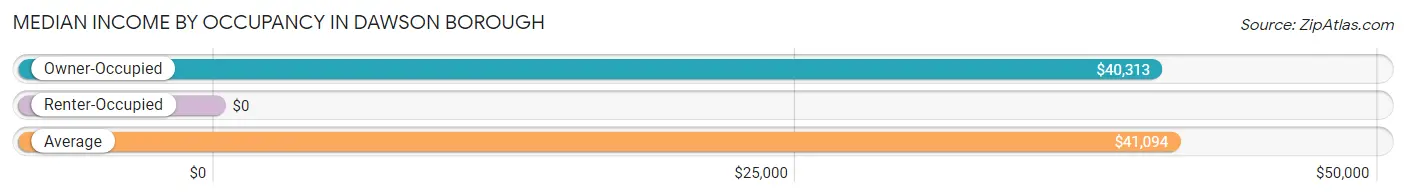
| Occupancy Type | # Households | Median Income |
| Owner-Occupied | 118 (74.2%) | $40,313 |
| Renter-Occupied | 41 (25.8%) | $0 |
| Average | 159 (100.0%) | $41,094 |
Occupancy by Householder Income Bracket in Dawson borough
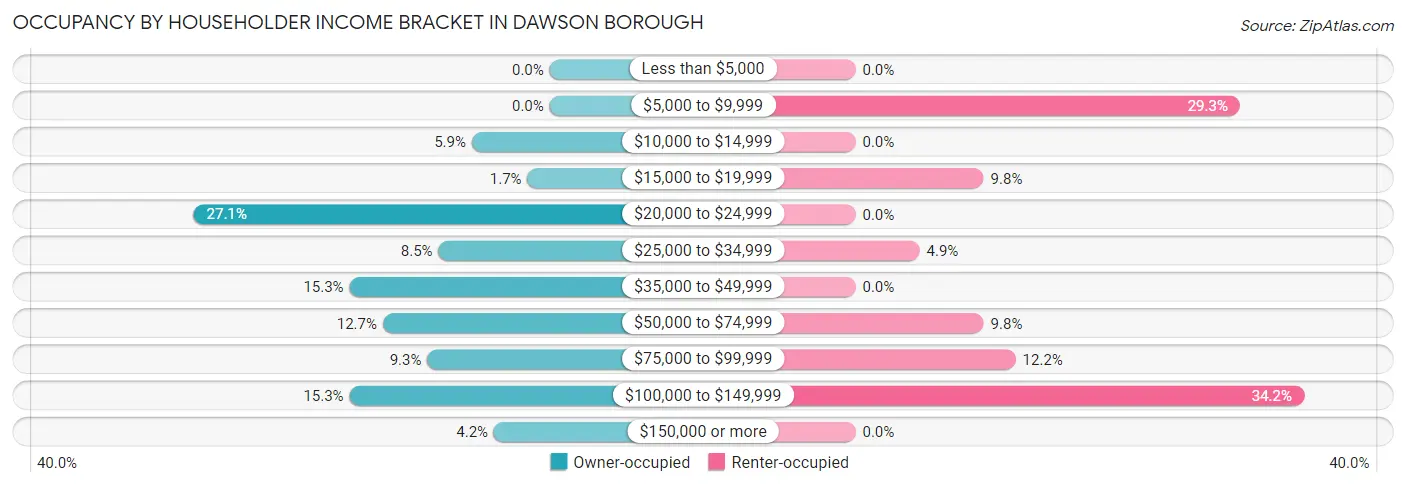
| Income Bracket | Owner-occupied | Renter-occupied |
| Less than $5,000 | 0 (0.0%) | 0 (0.0%) |
| $5,000 to $9,999 | 0 (0.0%) | 12 (29.3%) |
| $10,000 to $14,999 | 7 (5.9%) | 0 (0.0%) |
| $15,000 to $19,999 | 2 (1.7%) | 4 (9.8%) |
| $20,000 to $24,999 | 32 (27.1%) | 0 (0.0%) |
| $25,000 to $34,999 | 10 (8.5%) | 2 (4.9%) |
| $35,000 to $49,999 | 18 (15.2%) | 0 (0.0%) |
| $50,000 to $74,999 | 15 (12.7%) | 4 (9.8%) |
| $75,000 to $99,999 | 11 (9.3%) | 5 (12.2%) |
| $100,000 to $149,999 | 18 (15.2%) | 14 (34.2%) |
| $150,000 or more | 5 (4.2%) | 0 (0.0%) |
| Total | 118 (100.0%) | 41 (100.0%) |
Monthly Housing Cost Tiers in Dawson borough
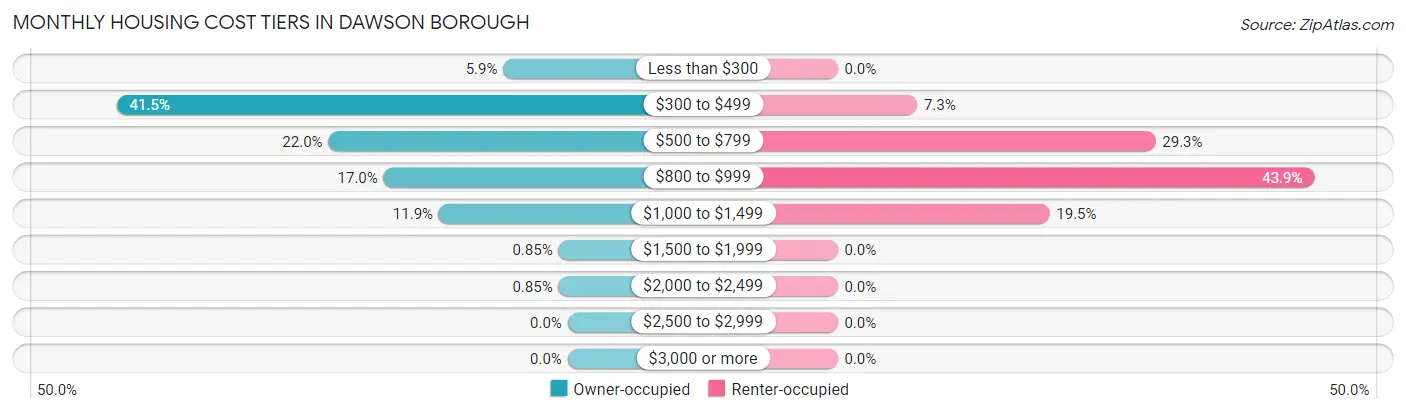
| Monthly Cost | Owner-occupied | Renter-occupied |
| Less than $300 | 7 (5.9%) | 0 (0.0%) |
| $300 to $499 | 49 (41.5%) | 3 (7.3%) |
| $500 to $799 | 26 (22.0%) | 12 (29.3%) |
| $800 to $999 | 20 (17.0%) | 18 (43.9%) |
| $1,000 to $1,499 | 14 (11.9%) | 8 (19.5%) |
| $1,500 to $1,999 | 1 (0.9%) | 0 (0.0%) |
| $2,000 to $2,499 | 1 (0.9%) | 0 (0.0%) |
| $2,500 to $2,999 | 0 (0.0%) | 0 (0.0%) |
| $3,000 or more | 0 (0.0%) | 0 (0.0%) |
| Total | 118 (100.0%) | 41 (100.0%) |
Physical Housing Characteristics in Dawson borough
Housing Structures in Dawson borough
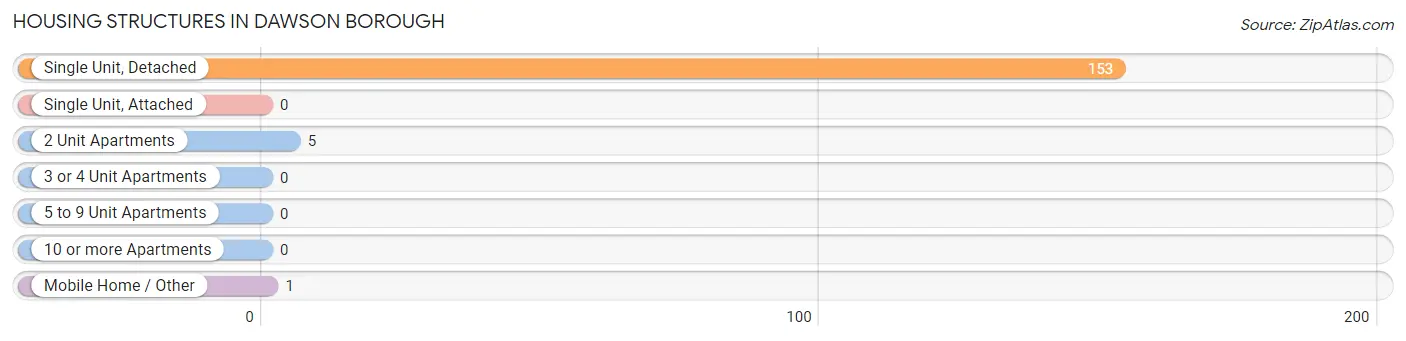
| Structure Type | # Housing Units | % Housing Units |
| Single Unit, Detached | 153 | 96.2% |
| Single Unit, Attached | 0 | 0.0% |
| 2 Unit Apartments | 5 | 3.1% |
| 3 or 4 Unit Apartments | 0 | 0.0% |
| 5 to 9 Unit Apartments | 0 | 0.0% |
| 10 or more Apartments | 0 | 0.0% |
| Mobile Home / Other | 1 | 0.6% |
| Total | 159 | 100.0% |
Housing Structures by Occupancy in Dawson borough
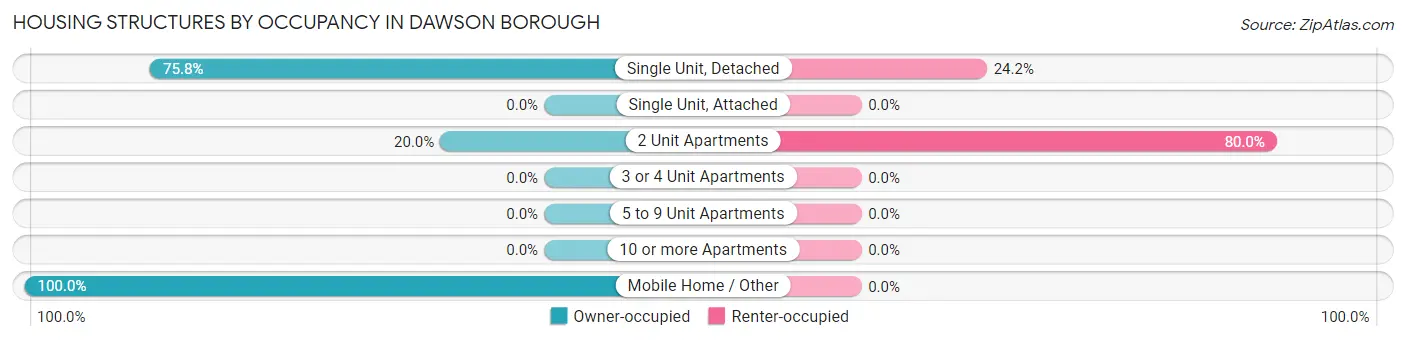
| Structure Type | Owner-occupied | Renter-occupied |
| Single Unit, Detached | 116 (75.8%) | 37 (24.2%) |
| Single Unit, Attached | 0 (0.0%) | 0 (0.0%) |
| 2 Unit Apartments | 1 (20.0%) | 4 (80.0%) |
| 3 or 4 Unit Apartments | 0 (0.0%) | 0 (0.0%) |
| 5 to 9 Unit Apartments | 0 (0.0%) | 0 (0.0%) |
| 10 or more Apartments | 0 (0.0%) | 0 (0.0%) |
| Mobile Home / Other | 1 (100.0%) | 0 (0.0%) |
| Total | 118 (74.2%) | 41 (25.8%) |
Housing Structures by Number of Rooms in Dawson borough
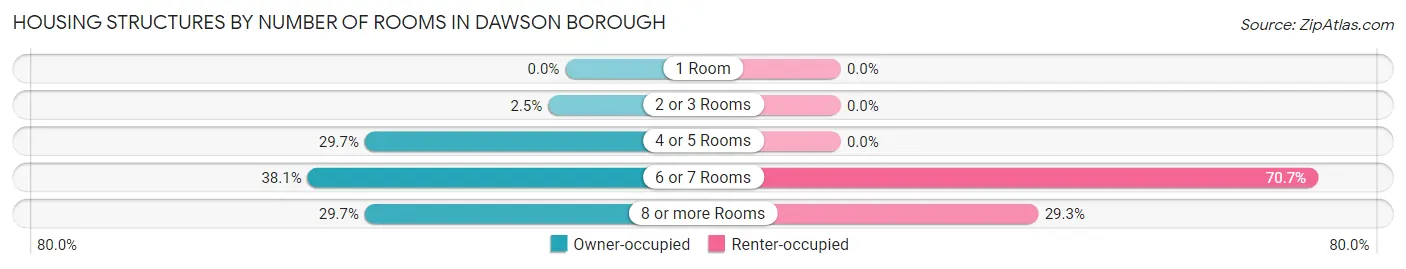
| Number of Rooms | Owner-occupied | Renter-occupied |
| 1 Room | 0 (0.0%) | 0 (0.0%) |
| 2 or 3 Rooms | 3 (2.5%) | 0 (0.0%) |
| 4 or 5 Rooms | 35 (29.7%) | 0 (0.0%) |
| 6 or 7 Rooms | 45 (38.1%) | 29 (70.7%) |
| 8 or more Rooms | 35 (29.7%) | 12 (29.3%) |
| Total | 118 (100.0%) | 41 (100.0%) |
Housing Structure by Heating Type in Dawson borough
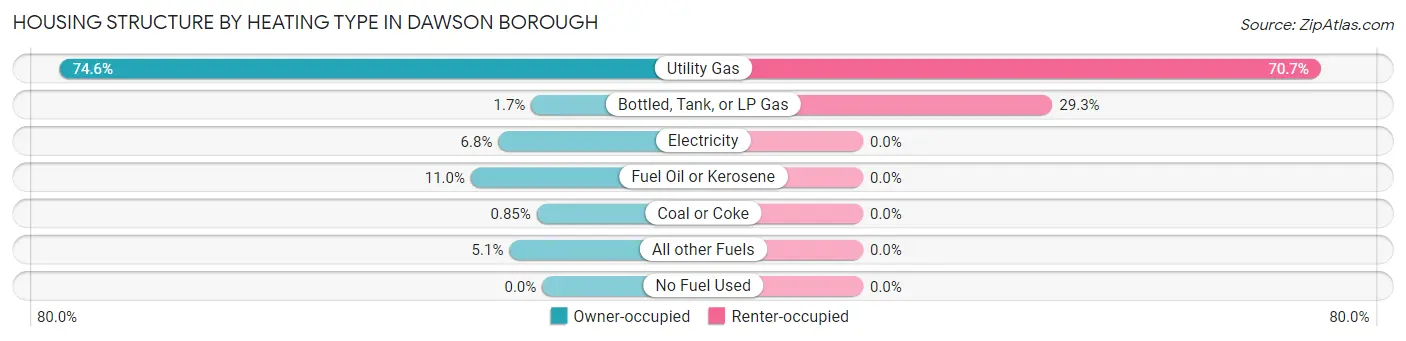
| Heating Type | Owner-occupied | Renter-occupied |
| Utility Gas | 88 (74.6%) | 29 (70.7%) |
| Bottled, Tank, or LP Gas | 2 (1.7%) | 12 (29.3%) |
| Electricity | 8 (6.8%) | 0 (0.0%) |
| Fuel Oil or Kerosene | 13 (11.0%) | 0 (0.0%) |
| Coal or Coke | 1 (0.9%) | 0 (0.0%) |
| All other Fuels | 6 (5.1%) | 0 (0.0%) |
| No Fuel Used | 0 (0.0%) | 0 (0.0%) |
| Total | 118 (100.0%) | 41 (100.0%) |
Household Vehicle Usage in Dawson borough
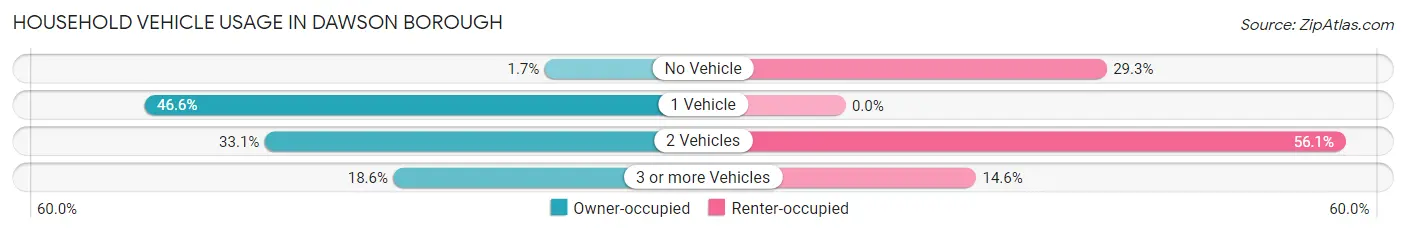
| Vehicles per Household | Owner-occupied | Renter-occupied |
| No Vehicle | 2 (1.7%) | 12 (29.3%) |
| 1 Vehicle | 55 (46.6%) | 0 (0.0%) |
| 2 Vehicles | 39 (33.1%) | 23 (56.1%) |
| 3 or more Vehicles | 22 (18.6%) | 6 (14.6%) |
| Total | 118 (100.0%) | 41 (100.0%) |
Real Estate & Mortgages in Dawson borough
Real Estate and Mortgage Overview in Dawson borough
| Characteristic | Without Mortgage | With Mortgage |
| Housing Units | 78 | 40 |
| Median Property Value | $96,900 | $67,800 |
| Median Household Income | $30,000 | $5 |
| Monthly Housing Costs | $421 | $0 |
| Real Estate Taxes | $1,128 | $2 |
Property Value by Mortgage Status in Dawson borough
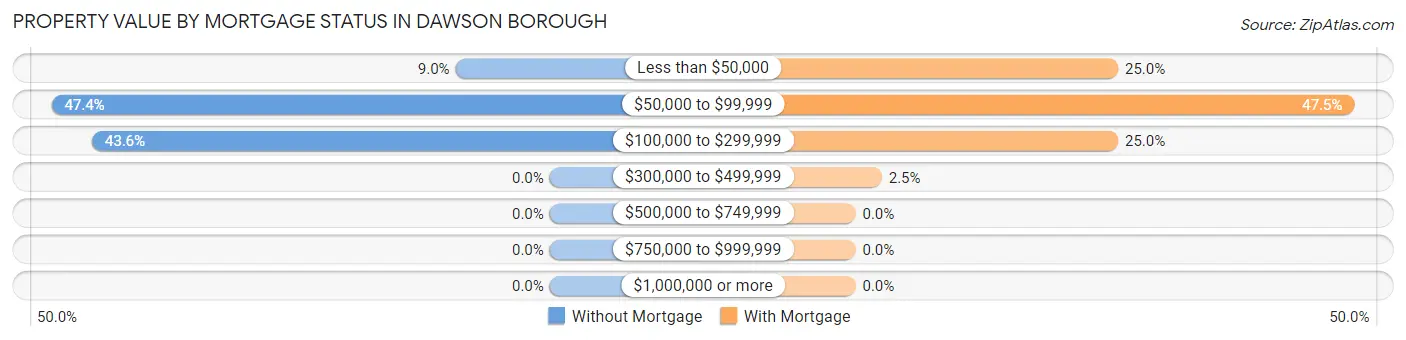
| Property Value | Without Mortgage | With Mortgage |
| Less than $50,000 | 7 (9.0%) | 10 (25.0%) |
| $50,000 to $99,999 | 37 (47.4%) | 19 (47.5%) |
| $100,000 to $299,999 | 34 (43.6%) | 10 (25.0%) |
| $300,000 to $499,999 | 0 (0.0%) | 1 (2.5%) |
| $500,000 to $749,999 | 0 (0.0%) | 0 (0.0%) |
| $750,000 to $999,999 | 0 (0.0%) | 0 (0.0%) |
| $1,000,000 or more | 0 (0.0%) | 0 (0.0%) |
| Total | 78 (100.0%) | 40 (100.0%) |
Household Income by Mortgage Status in Dawson borough
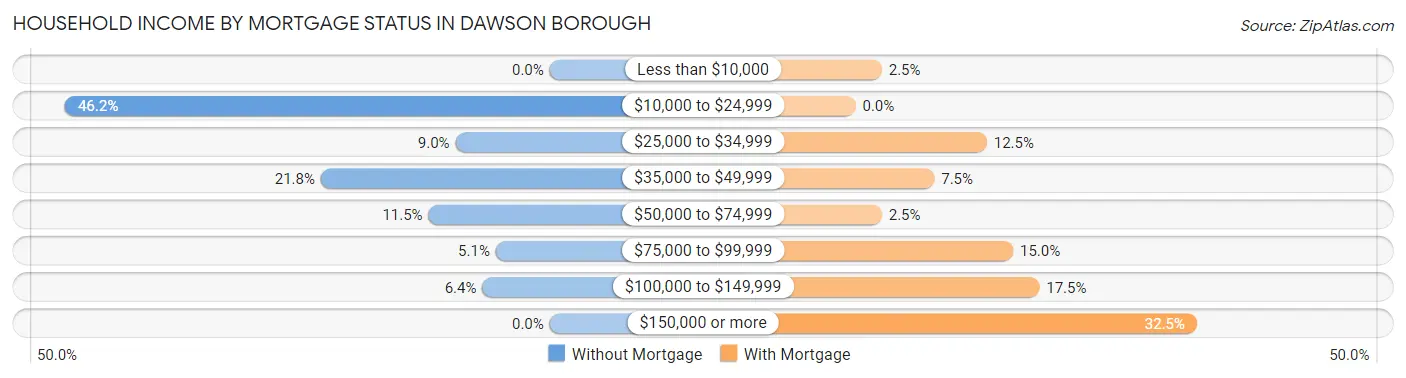
| Household Income | Without Mortgage | With Mortgage |
| Less than $10,000 | 0 (0.0%) | 1 (2.5%) |
| $10,000 to $24,999 | 36 (46.2%) | 0 (0.0%) |
| $25,000 to $34,999 | 7 (9.0%) | 5 (12.5%) |
| $35,000 to $49,999 | 17 (21.8%) | 3 (7.5%) |
| $50,000 to $74,999 | 9 (11.5%) | 1 (2.5%) |
| $75,000 to $99,999 | 4 (5.1%) | 6 (15.0%) |
| $100,000 to $149,999 | 5 (6.4%) | 7 (17.5%) |
| $150,000 or more | 0 (0.0%) | 13 (32.5%) |
| Total | 78 (100.0%) | 40 (100.0%) |
Property Value to Household Income Ratio in Dawson borough
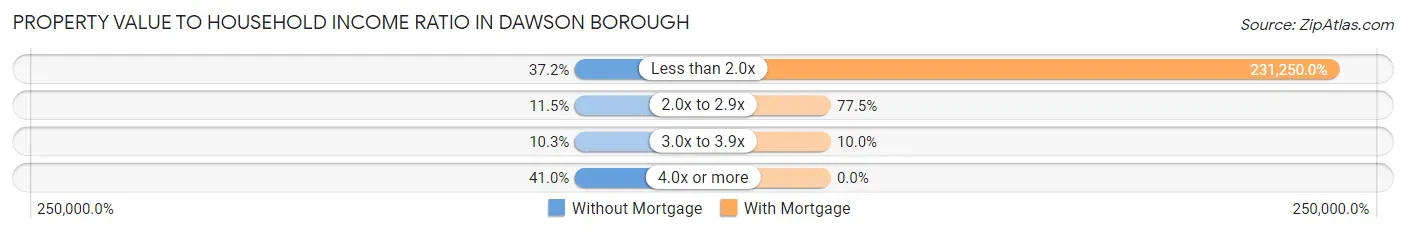
| Value-to-Income Ratio | Without Mortgage | With Mortgage |
| Less than 2.0x | 29 (37.2%) | 92,500 (231,250.0%) |
| 2.0x to 2.9x | 9 (11.5%) | 31 (77.5%) |
| 3.0x to 3.9x | 8 (10.3%) | 4 (10.0%) |
| 4.0x or more | 32 (41.0%) | 0 (0.0%) |
| Total | 78 (100.0%) | 40 (100.0%) |
Real Estate Taxes by Mortgage Status in Dawson borough
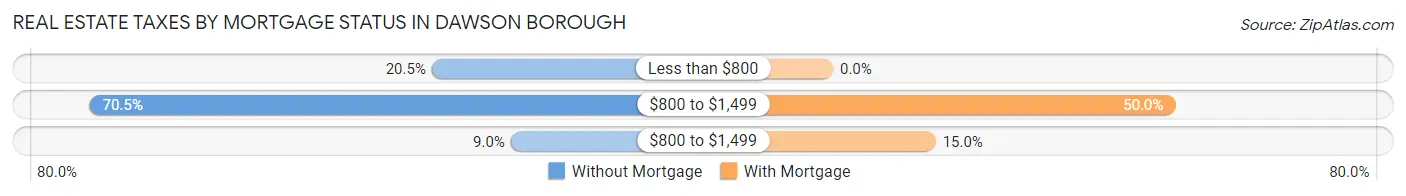
| Property Taxes | Without Mortgage | With Mortgage |
| Less than $800 | 16 (20.5%) | 0 (0.0%) |
| $800 to $1,499 | 55 (70.5%) | 20 (50.0%) |
| $800 to $1,499 | 7 (9.0%) | 6 (15.0%) |
| Total | 78 (100.0%) | 40 (100.0%) |
Health & Disability in Dawson borough
Health Insurance Coverage by Age in Dawson borough
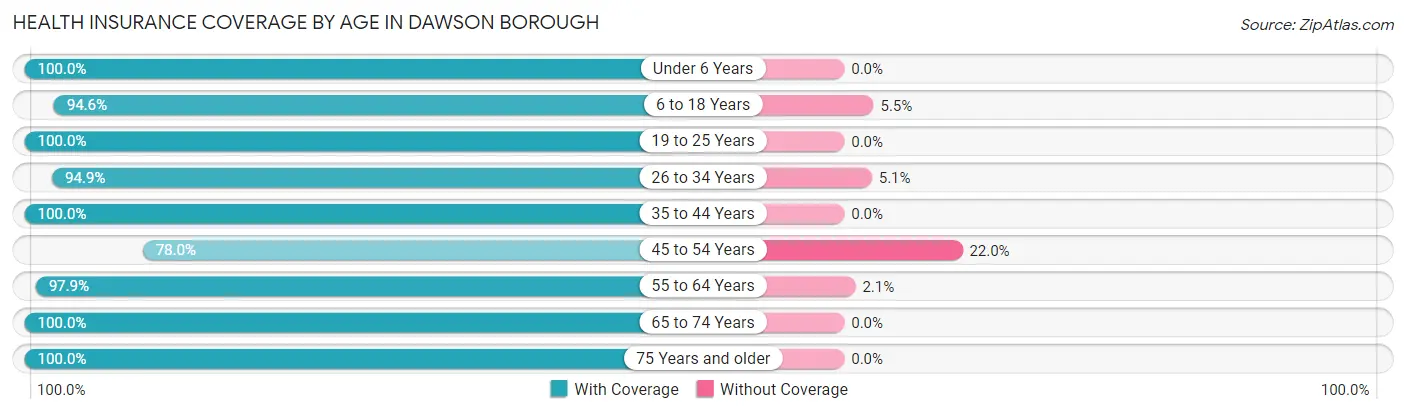
| Age Bracket | With Coverage | Without Coverage |
| Under 6 Years | 44 (100.0%) | 0 (0.0%) |
| 6 to 18 Years | 52 (94.6%) | 3 (5.4%) |
| 19 to 25 Years | 22 (100.0%) | 0 (0.0%) |
| 26 to 34 Years | 37 (94.9%) | 2 (5.1%) |
| 35 to 44 Years | 60 (100.0%) | 0 (0.0%) |
| 45 to 54 Years | 46 (78.0%) | 13 (22.0%) |
| 55 to 64 Years | 47 (97.9%) | 1 (2.1%) |
| 65 to 74 Years | 32 (100.0%) | 0 (0.0%) |
| 75 Years and older | 29 (100.0%) | 0 (0.0%) |
| Total | 369 (95.1%) | 19 (4.9%) |
Health Insurance Coverage by Citizenship Status in Dawson borough
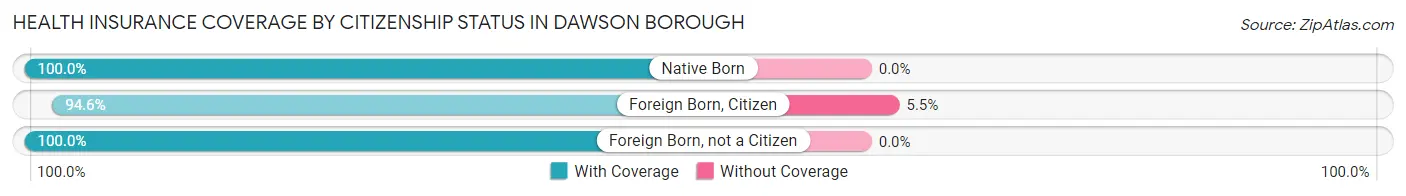
| Citizenship Status | With Coverage | Without Coverage |
| Native Born | 44 (100.0%) | 0 (0.0%) |
| Foreign Born, Citizen | 52 (94.6%) | 3 (5.4%) |
| Foreign Born, not a Citizen | 22 (100.0%) | 0 (0.0%) |
Health Insurance Coverage by Household Income in Dawson borough
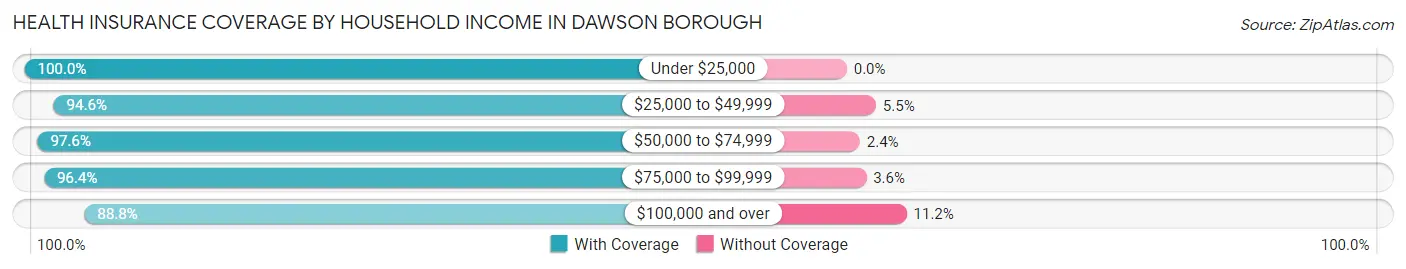
| Household Income | With Coverage | Without Coverage |
| Under $25,000 | 121 (100.0%) | 0 (0.0%) |
| $25,000 to $49,999 | 52 (94.6%) | 3 (5.4%) |
| $50,000 to $74,999 | 40 (97.6%) | 1 (2.4%) |
| $75,000 to $99,999 | 53 (96.4%) | 2 (3.6%) |
| $100,000 and over | 103 (88.8%) | 13 (11.2%) |
Public vs Private Health Insurance Coverage by Age in Dawson borough
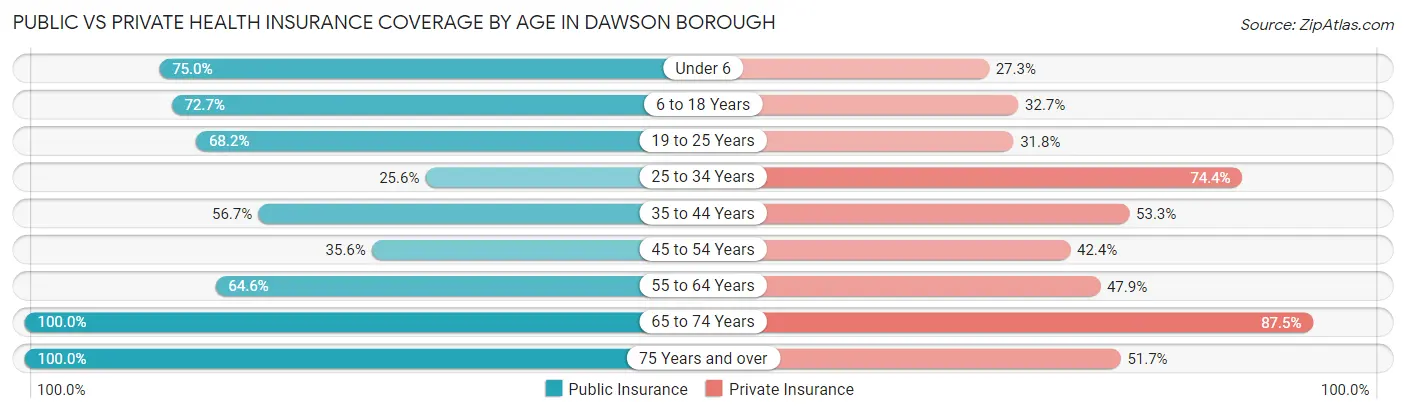
| Age Bracket | Public Insurance | Private Insurance |
| Under 6 | 33 (75.0%) | 12 (27.3%) |
| 6 to 18 Years | 40 (72.7%) | 18 (32.7%) |
| 19 to 25 Years | 15 (68.2%) | 7 (31.8%) |
| 25 to 34 Years | 10 (25.6%) | 29 (74.4%) |
| 35 to 44 Years | 34 (56.7%) | 32 (53.3%) |
| 45 to 54 Years | 21 (35.6%) | 25 (42.4%) |
| 55 to 64 Years | 31 (64.6%) | 23 (47.9%) |
| 65 to 74 Years | 32 (100.0%) | 28 (87.5%) |
| 75 Years and over | 29 (100.0%) | 15 (51.7%) |
| Total | 245 (63.1%) | 189 (48.7%) |
Disability Status by Sex by Age in Dawson borough
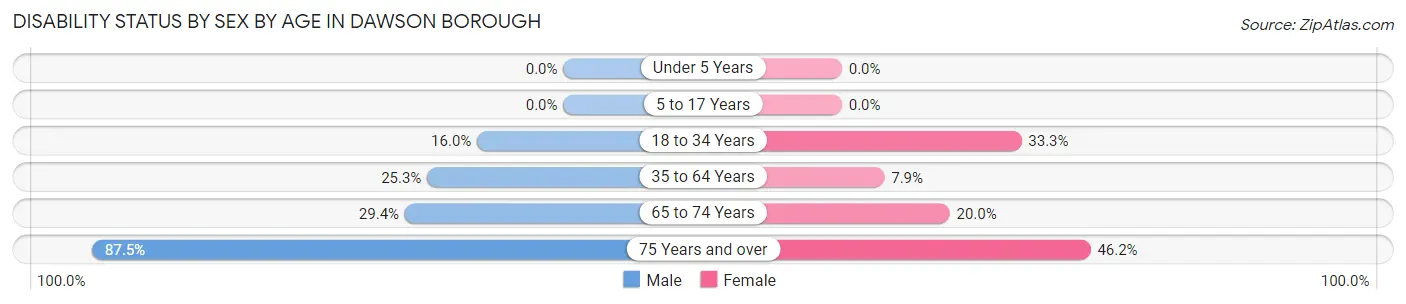
| Age Bracket | Male | Female |
| Under 5 Years | 0 (0.0%) | 0 (0.0%) |
| 5 to 17 Years | 0 (0.0%) | 0 (0.0%) |
| 18 to 34 Years | 4 (16.0%) | 12 (33.3%) |
| 35 to 64 Years | 23 (25.3%) | 6 (7.9%) |
| 65 to 74 Years | 5 (29.4%) | 3 (20.0%) |
| 75 Years and over | 14 (87.5%) | 6 (46.2%) |
Disability Class by Sex by Age in Dawson borough
Disability Class: Hearing Difficulty
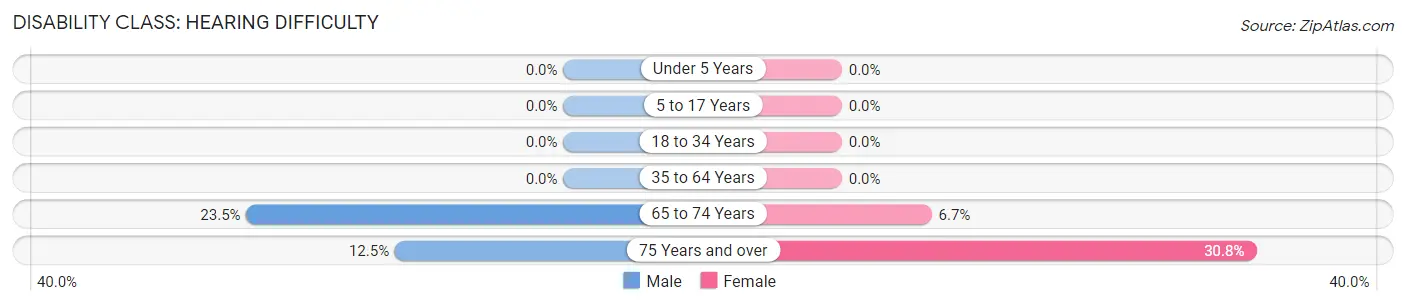
| Age Bracket | Male | Female |
| Under 5 Years | 0 (0.0%) | 0 (0.0%) |
| 5 to 17 Years | 0 (0.0%) | 0 (0.0%) |
| 18 to 34 Years | 0 (0.0%) | 0 (0.0%) |
| 35 to 64 Years | 0 (0.0%) | 0 (0.0%) |
| 65 to 74 Years | 4 (23.5%) | 1 (6.7%) |
| 75 Years and over | 2 (12.5%) | 4 (30.8%) |
Disability Class: Vision Difficulty
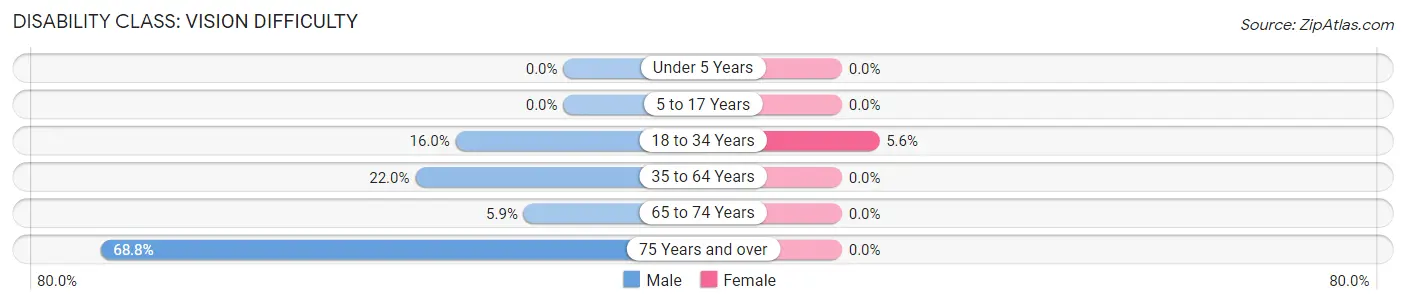
| Age Bracket | Male | Female |
| Under 5 Years | 0 (0.0%) | 0 (0.0%) |
| 5 to 17 Years | 0 (0.0%) | 0 (0.0%) |
| 18 to 34 Years | 4 (16.0%) | 2 (5.6%) |
| 35 to 64 Years | 20 (22.0%) | 0 (0.0%) |
| 65 to 74 Years | 1 (5.9%) | 0 (0.0%) |
| 75 Years and over | 11 (68.8%) | 0 (0.0%) |
Disability Class: Cognitive Difficulty
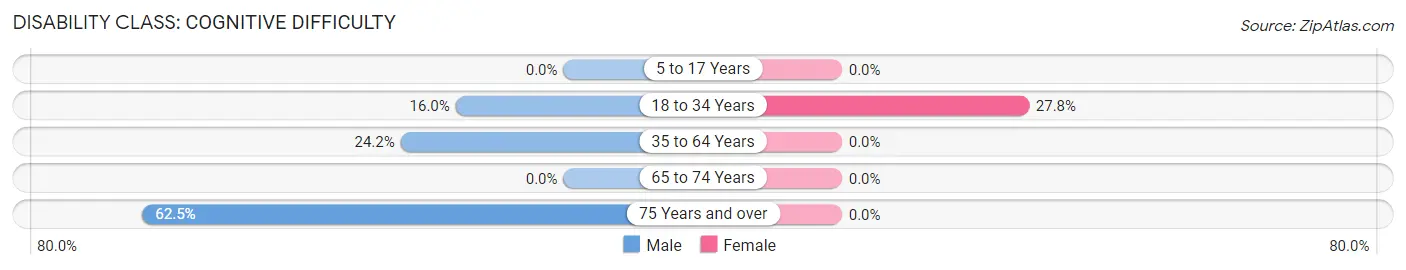
| Age Bracket | Male | Female |
| 5 to 17 Years | 0 (0.0%) | 0 (0.0%) |
| 18 to 34 Years | 4 (16.0%) | 10 (27.8%) |
| 35 to 64 Years | 22 (24.2%) | 0 (0.0%) |
| 65 to 74 Years | 0 (0.0%) | 0 (0.0%) |
| 75 Years and over | 10 (62.5%) | 0 (0.0%) |
Disability Class: Ambulatory Difficulty
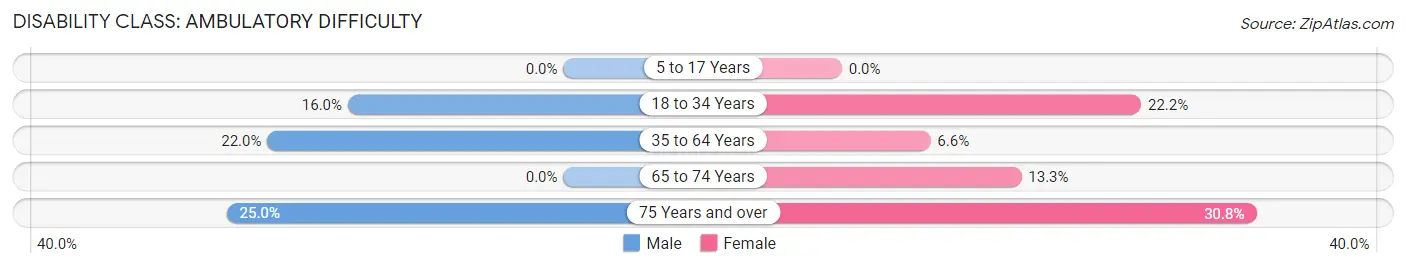
| Age Bracket | Male | Female |
| 5 to 17 Years | 0 (0.0%) | 0 (0.0%) |
| 18 to 34 Years | 4 (16.0%) | 8 (22.2%) |
| 35 to 64 Years | 20 (22.0%) | 5 (6.6%) |
| 65 to 74 Years | 0 (0.0%) | 2 (13.3%) |
| 75 Years and over | 4 (25.0%) | 4 (30.8%) |
Disability Class: Self-Care Difficulty
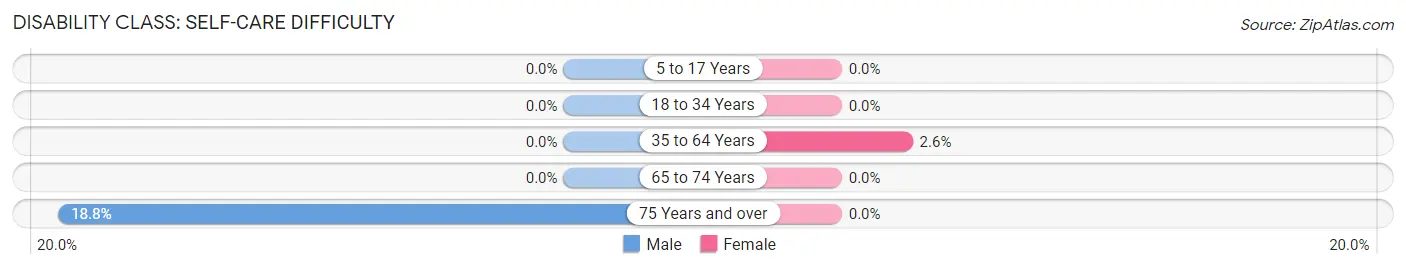
| Age Bracket | Male | Female |
| 5 to 17 Years | 0 (0.0%) | 0 (0.0%) |
| 18 to 34 Years | 0 (0.0%) | 0 (0.0%) |
| 35 to 64 Years | 0 (0.0%) | 2 (2.6%) |
| 65 to 74 Years | 0 (0.0%) | 0 (0.0%) |
| 75 Years and over | 3 (18.8%) | 0 (0.0%) |
Technology Access in Dawson borough
Computing Device Access in Dawson borough
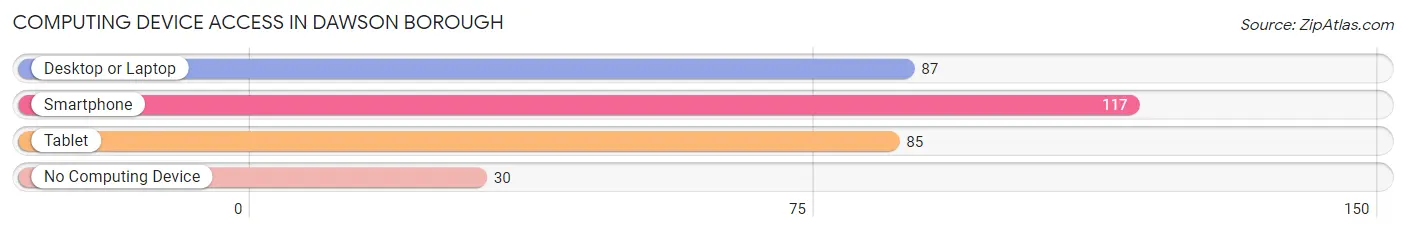
| Device Type | # Households | % Households |
| Desktop or Laptop | 87 | 54.7% |
| Smartphone | 117 | 73.6% |
| Tablet | 85 | 53.5% |
| No Computing Device | 30 | 18.9% |
| Total | 159 | 100.0% |
Internet Access in Dawson borough
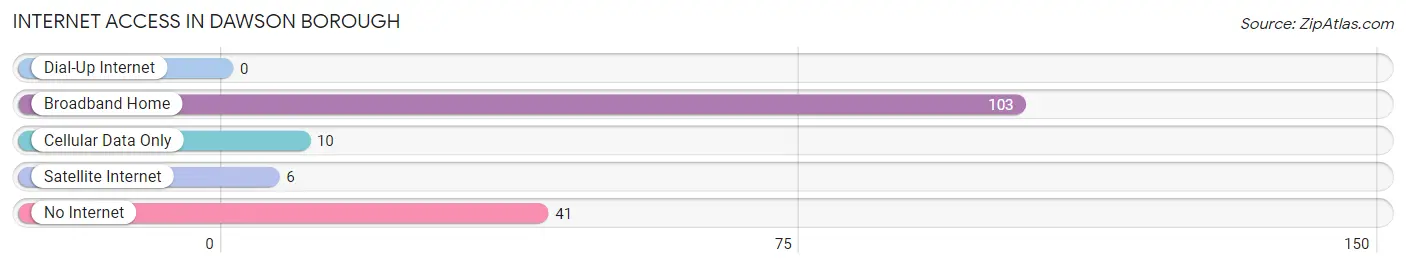
| Internet Type | # Households | % Households |
| Dial-Up Internet | 0 | 0.0% |
| Broadband Home | 103 | 64.8% |
| Cellular Data Only | 10 | 6.3% |
| Satellite Internet | 6 | 3.8% |
| No Internet | 41 | 25.8% |
| Total | 159 | 100.0% |
Dawson borough Summary
Dawson Borough is a small borough located in Fayette County, Pennsylvania. It is situated in the southwestern corner of the county, approximately 25 miles south of Pittsburgh. The borough was incorporated in 1891 and has a population of approximately 1,000 people.
History
The area that is now Dawson Borough was first settled in the late 1700s by a group of German immigrants. The town was originally known as “Dawson’s Crossroads” and was named after the family that owned the land. The town was officially incorporated in 1891 and was named after the family that owned the land.
The town was primarily an agricultural community until the early 1900s when the coal industry began to boom in the area. The coal industry brought a large influx of people to the area and the population of the borough grew rapidly. The town was also home to several small businesses, including a general store, a blacksmith shop, and a hotel.
In the 1950s, the coal industry began to decline and the population of the borough began to decline as well. The town was also affected by the decline of the steel industry in the area. In the late 1970s, the town began to experience a resurgence as people began to move back to the area.
Geography
Dawson Borough is located in the southwestern corner of Fayette County, Pennsylvania. It is situated in the foothills of the Allegheny Mountains and is approximately 25 miles south of Pittsburgh. The borough is bordered by the towns of Perryopolis, Smithfield, and Uniontown.
The borough is located in a valley and is surrounded by hills and mountains. The terrain is mostly hilly and the elevation ranges from 1,000 to 1,500 feet above sea level. The borough is located in a humid continental climate zone and experiences hot summers and cold winters.
Economy
The economy of Dawson Borough is primarily based on agriculture and tourism. The town is home to several small farms that produce a variety of crops, including corn, soybeans, and hay. The town is also home to several small businesses, including a general store, a blacksmith shop, and a hotel.
The town is also home to several tourist attractions, including the Dawson Historical Society Museum, the Dawson Railroad Museum, and the Dawson Covered Bridge. The town is also home to several wineries and breweries, which attract visitors from all over the region.
Demographics
As of the 2010 census, the population of Dawson Borough was 1,000 people. The racial makeup of the borough was 97.2% White, 0.7% African American, 0.2% Native American, 0.2% Asian, and 1.7% from other races. The median household income was $37,500 and the median family income was $45,000.
The town is home to several churches, including the First United Methodist Church, the First Presbyterian Church, and the St. John’s Lutheran Church. The town is also home to several schools, including the Dawson Elementary School, the Dawson Middle School, and the Dawson High School.
Conclusion
Dawson Borough is a small borough located in Fayette County, Pennsylvania. It is situated in the southwestern corner of the county, approximately 25 miles south of Pittsburgh. The borough was incorporated in 1891 and has a population of approximately 1,000 people. The economy of the borough is primarily based on agriculture and tourism. The town is home to several small businesses, churches, and schools. The town is also home to several tourist attractions, including the Dawson Historical Society Museum, the Dawson Railroad Museum, and the Dawson Covered Bridge.
Common Questions
What is Per Capita Income in Dawson borough?
Per Capita income in Dawson borough is $23,740.
What is the Median Family Income in Dawson borough?
Median Family Income in Dawson borough is $76,250.
What is the Median Household income in Dawson borough?
Median Household Income in Dawson borough is $41,094.
What is Income or Wage Gap in Dawson borough?
Income or Wage Gap in Dawson borough is 55.5%.
Women in Dawson borough earn 44.5 cents for every dollar earned by a man.
What is Inequality or Gini Index in Dawson borough?
Inequality or Gini Index in Dawson borough is 0.40.
What is the Total Population of Dawson borough?
Total Population of Dawson borough is 388.
What is the Total Male Population of Dawson borough?
Total Male Population of Dawson borough is 197.
What is the Total Female Population of Dawson borough?
Total Female Population of Dawson borough is 191.
What is the Ratio of Males per 100 Females in Dawson borough?
There are 103.14 Males per 100 Females in Dawson borough.
What is the Ratio of Females per 100 Males in Dawson borough?
There are 96.95 Females per 100 Males in Dawson borough.
What is the Median Population Age in Dawson borough?
Median Population Age in Dawson borough is 36.4 Years.
What is the Average Family Size in Dawson borough
Average Family Size in Dawson borough is 3.2 People.
What is the Average Household Size in Dawson borough
Average Household Size in Dawson borough is 2.4 People.
How Large is the Labor Force in Dawson borough?
There are 176 People in the Labor Forcein in Dawson borough.
What is the Percentage of People in the Labor Force in Dawson borough?
58.7% of People are in the Labor Force in Dawson borough.
What is the Unemployment Rate in Dawson borough?
Unemployment Rate in Dawson borough is 8.5%.