Wilburton Number One, PA Map & Demographics
Wilburton Number One Map
Wilburton Number One Overview
$24,969
PER CAPITA INCOME
$50,313
AVG HOUSEHOLD INCOME
43.5%
WAGE / INCOME GAP [ % ]
56.5¢/ $1
WAGE / INCOME GAP [ $ ]
0.45
INEQUALITY / GINI INDEX
379
TOTAL POPULATION
174
MALE POPULATION
205
FEMALE POPULATION
84.88
MALES / 100 FEMALES
117.82
FEMALES / 100 MALES
31.7
MEDIAN AGE
3.8
AVG FAMILY SIZE
2.9
AVG HOUSEHOLD SIZE
176
LABOR FORCE [ PEOPLE ]
60.3%
PERCENT IN LABOR FORCE
10.2%
UNEMPLOYMENT RATE
Income in Wilburton Number One
Income Overview in Wilburton Number One
| Characteristic | Number | Measure |
| Per Capita Income | 379 | $24,969 |
| Median Family Income | 89 | $0 |
| Mean Family Income | 89 | $81,958 |
| Median Household Income | 129 | $50,313 |
| Mean Household Income | 129 | $68,213 |
| Income Deficit | 89 | $0 |
| Wage / Income Gap (%) | 379 | 43.52% |
| Wage / Income Gap ($) | 379 | 56.48¢ per $1 |
| Gini / Inequality Index | 379 | 0.45 |
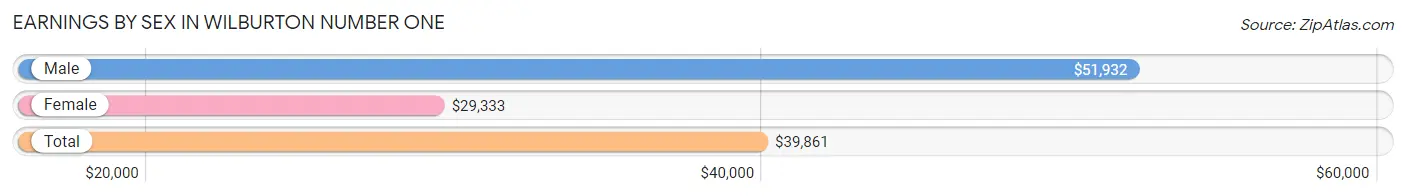
Earnings by Sex in Wilburton Number One
Average Earnings in Wilburton Number One are $39,861, $51,932 for men and $29,333 for women, a difference of 43.5%.
| Sex | Number | Average Earnings |
| Male | 63 (38.2%) | $51,932 |
| Female | 102 (61.8%) | $29,333 |
| Total | 165 (100.0%) | $39,861 |
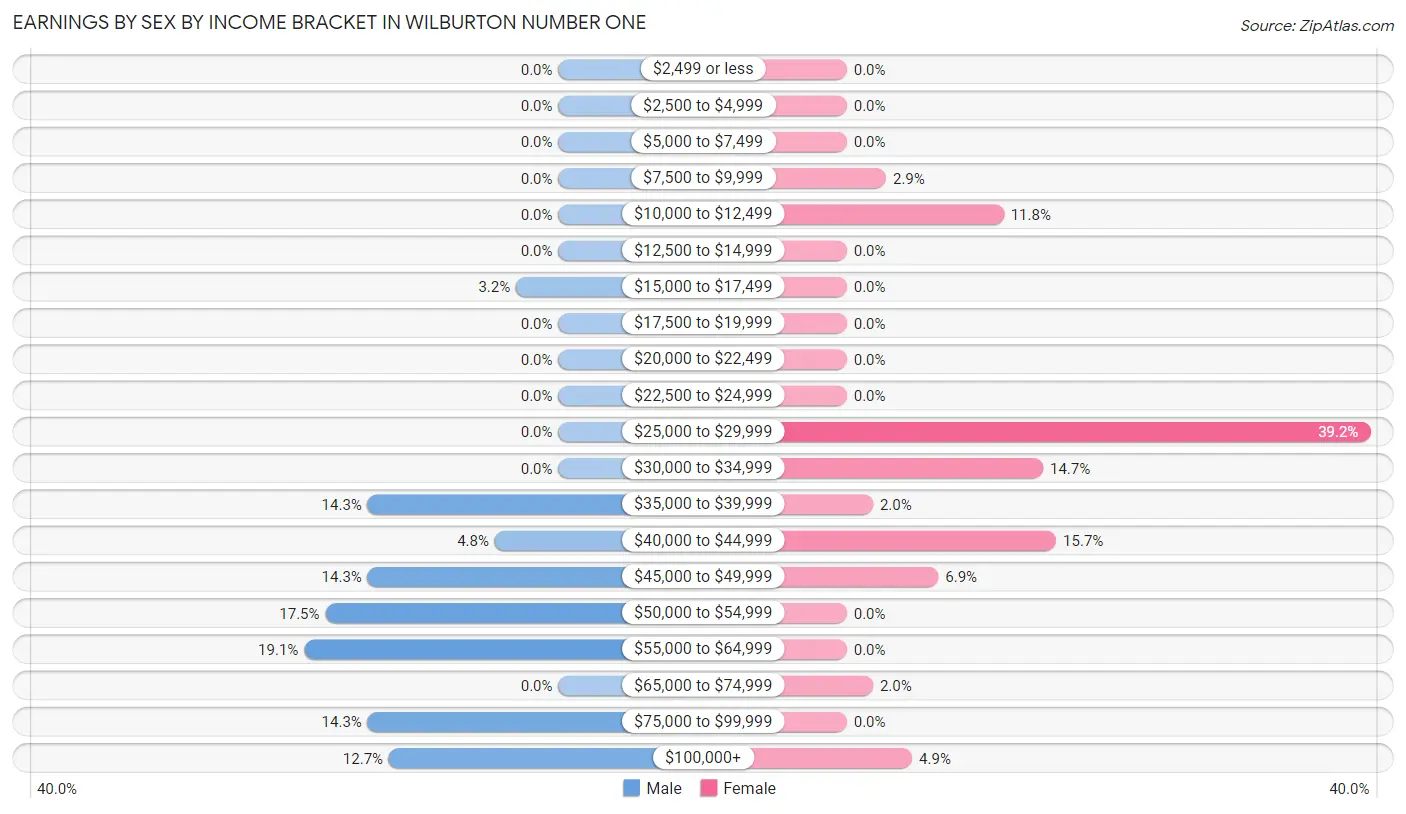
Earnings by Sex by Income Bracket in Wilburton Number One
The most common earnings brackets in Wilburton Number One are $55,000 to $64,999 for men (12 | 19.1%) and $25,000 to $29,999 for women (40 | 39.2%).
| Income | Male | Female |
| $2,499 or less | 0 (0.0%) | 0 (0.0%) |
| $2,500 to $4,999 | 0 (0.0%) | 0 (0.0%) |
| $5,000 to $7,499 | 0 (0.0%) | 0 (0.0%) |
| $7,500 to $9,999 | 0 (0.0%) | 3 (2.9%) |
| $10,000 to $12,499 | 0 (0.0%) | 12 (11.8%) |
| $12,500 to $14,999 | 0 (0.0%) | 0 (0.0%) |
| $15,000 to $17,499 | 2 (3.2%) | 0 (0.0%) |
| $17,500 to $19,999 | 0 (0.0%) | 0 (0.0%) |
| $20,000 to $22,499 | 0 (0.0%) | 0 (0.0%) |
| $22,500 to $24,999 | 0 (0.0%) | 0 (0.0%) |
| $25,000 to $29,999 | 0 (0.0%) | 40 (39.2%) |
| $30,000 to $34,999 | 0 (0.0%) | 15 (14.7%) |
| $35,000 to $39,999 | 9 (14.3%) | 2 (2.0%) |
| $40,000 to $44,999 | 3 (4.8%) | 16 (15.7%) |
| $45,000 to $49,999 | 9 (14.3%) | 7 (6.9%) |
| $50,000 to $54,999 | 11 (17.5%) | 0 (0.0%) |
| $55,000 to $64,999 | 12 (19.1%) | 0 (0.0%) |
| $65,000 to $74,999 | 0 (0.0%) | 2 (2.0%) |
| $75,000 to $99,999 | 9 (14.3%) | 0 (0.0%) |
| $100,000+ | 8 (12.7%) | 5 (4.9%) |
| Total | 63 (100.0%) | 102 (100.0%) |
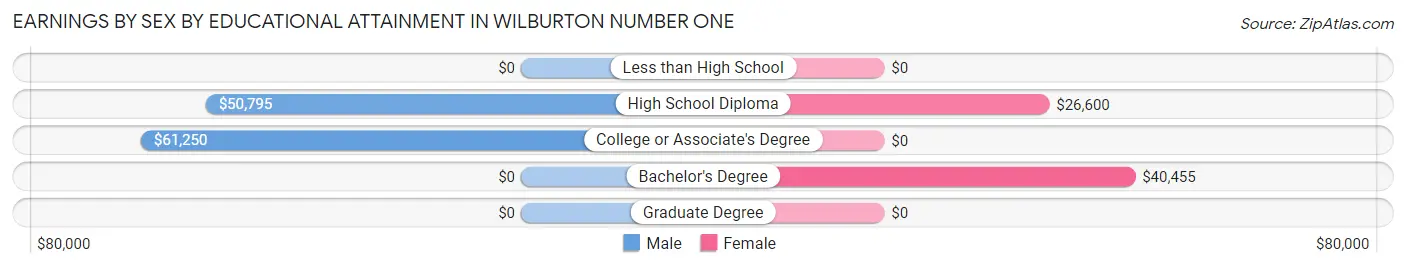
Earnings by Sex by Educational Attainment in Wilburton Number One
Average earnings in Wilburton Number One are $52,273 for men and $31,042 for women, a difference of 40.6%. Men with an educational attainment of college or associate's degree enjoy the highest average annual earnings of $61,250, while those with high school diploma education earn the least with $50,795. Women with an educational attainment of bachelor's degree earn the most with the average annual earnings of $40,455, while those with high school diploma education have the smallest earnings of $26,600.
| Educational Attainment | Male Income | Female Income |
| Less than High School | - | - |
| High School Diploma | $50,795 | $26,600 |
| College or Associate's Degree | $61,250 | $0 |
| Bachelor's Degree | - | - |
| Graduate Degree | - | - |
| Total | $52,273 | $31,042 |
Family Income in Wilburton Number One
Family Income Brackets in Wilburton Number One
According to the Wilburton Number One family income data, there are 22 families falling into the $100,000 to $149,999 income range, which is the most common income bracket and makes up 24.7% of all families.
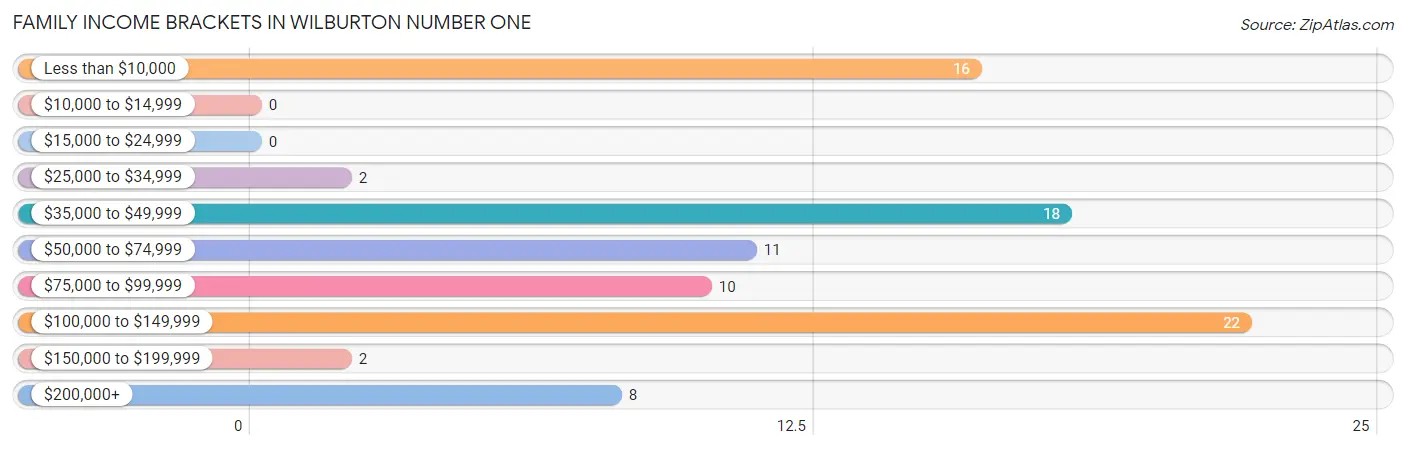
| Income Bracket | # Families | % Families |
| Less than $10,000 | 16 | 18.0% |
| $10,000 to $14,999 | 0 | 0.0% |
| $15,000 to $24,999 | 0 | 0.0% |
| $25,000 to $34,999 | 2 | 2.2% |
| $35,000 to $49,999 | 18 | 20.2% |
| $50,000 to $74,999 | 11 | 12.4% |
| $75,000 to $99,999 | 10 | 11.2% |
| $100,000 to $149,999 | 22 | 24.7% |
| $150,000 to $199,999 | 2 | 2.2% |
| $200,000+ | 8 | 9.0% |
Family Income by Famaliy Size in Wilburton Number One
3-person families (17 | 19.1%) account for the highest median family income in Wilburton Number One with $96,250 per family, while 2-person families (31 | 34.8%) have the highest median income of $45,938 per family member.
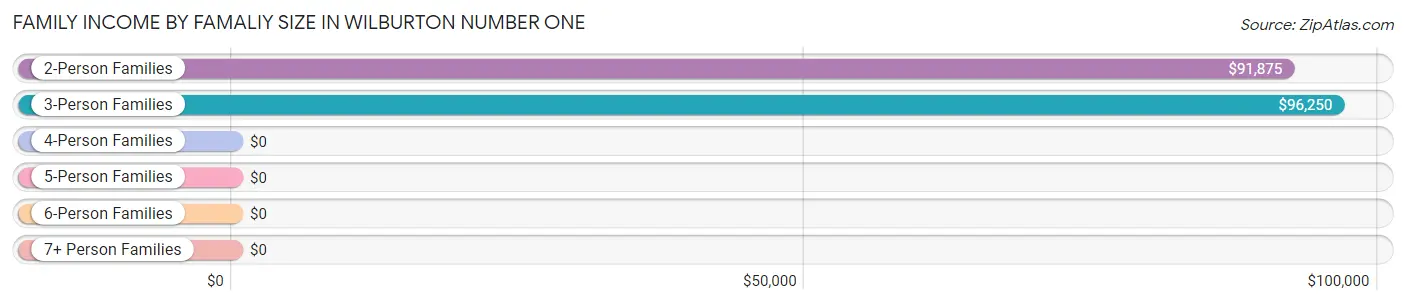
| Income Bracket | # Families | Median Income |
| 2-Person Families | 31 (34.8%) | $91,875 |
| 3-Person Families | 17 (19.1%) | $96,250 |
| 4-Person Families | 15 (16.9%) | $0 |
| 5-Person Families | 26 (29.2%) | $0 |
| 6-Person Families | 0 (0.0%) | $0 |
| 7+ Person Families | 0 (0.0%) | $0 |
| Total | 89 (100.0%) | $0 |
Family Income by Number of Earners in Wilburton Number One
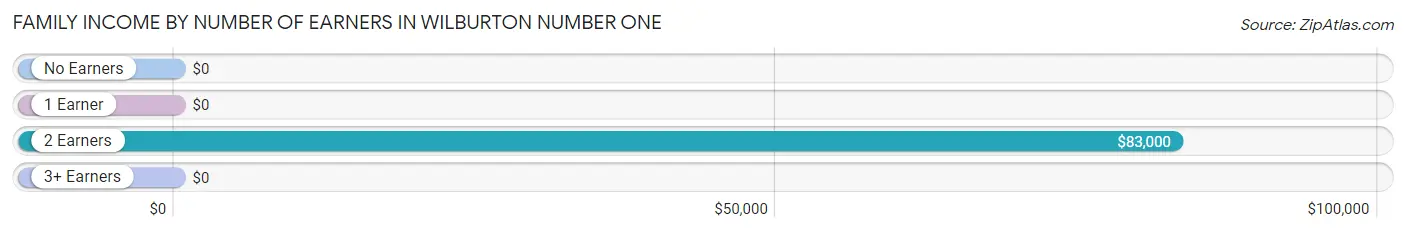
| Number of Earners | # Families | Median Income |
| No Earners | 16 (18.0%) | $0 |
| 1 Earner | 31 (34.8%) | $0 |
| 2 Earners | 32 (36.0%) | $83,000 |
| 3+ Earners | 10 (11.2%) | $0 |
| Total | 89 (100.0%) | $0 |
Household Income in Wilburton Number One
Household Income Brackets in Wilburton Number One
With 26 households falling in the category, the $100,000 to $149,999 income range is the most frequent in Wilburton Number One, accounting for 20.2% of all households. In contrast, only 2 households (1.5%) fall into the $10,000 to $14,999 income bracket, making it the least populous group.
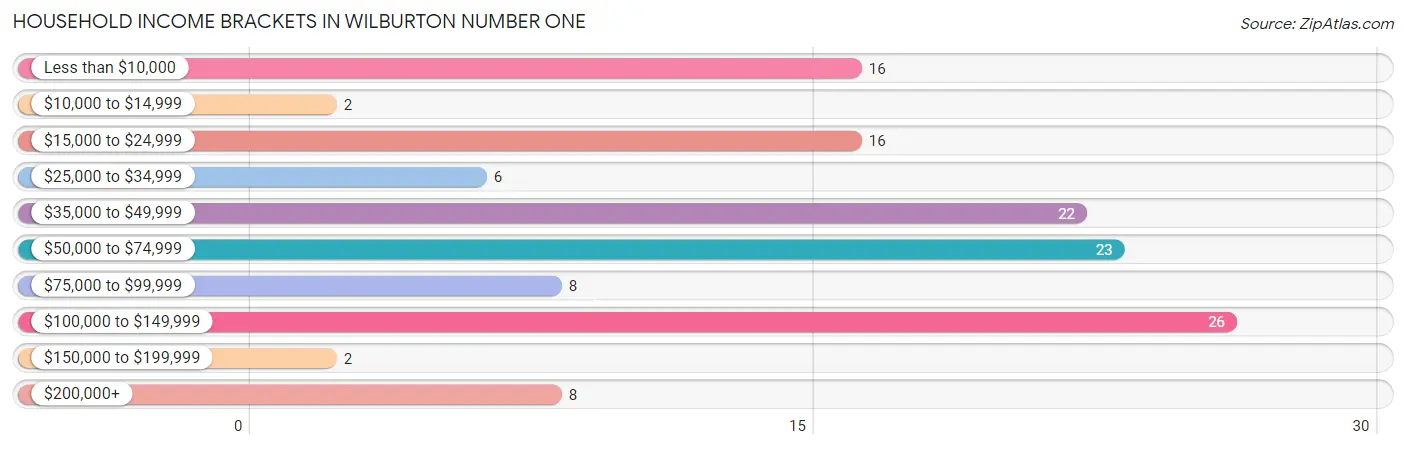
| Income Bracket | # Households | % Households |
| Less than $10,000 | 16 | 12.4% |
| $10,000 to $14,999 | 2 | 1.6% |
| $15,000 to $24,999 | 16 | 12.4% |
| $25,000 to $34,999 | 6 | 4.7% |
| $35,000 to $49,999 | 22 | 17.1% |
| $50,000 to $74,999 | 23 | 17.8% |
| $75,000 to $99,999 | 8 | 6.2% |
| $100,000 to $149,999 | 26 | 20.2% |
| $150,000 to $199,999 | 2 | 1.6% |
| $200,000+ | 8 | 6.2% |
Household Income by Householder Age in Wilburton Number One
The median household income in Wilburton Number One is $50,313, with the highest median household income of $51,136 found in the 25 to 44 years age bracket for the primary householder. A total of 38 households (29.5%) fall into this category.
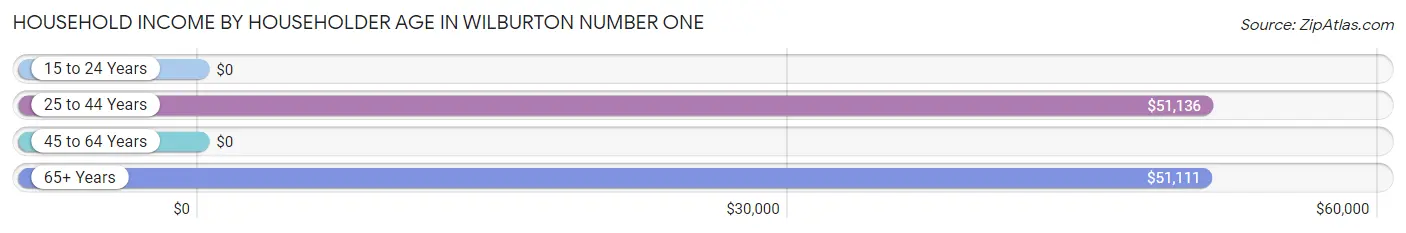
| Income Bracket | # Households | Median Income |
| 15 to 24 Years | 0 (0.0%) | $0 |
| 25 to 44 Years | 38 (29.5%) | $51,136 |
| 45 to 64 Years | 59 (45.7%) | $0 |
| 65+ Years | 32 (24.8%) | $51,111 |
| Total | 129 (100.0%) | $50,313 |
Poverty in Wilburton Number One
Income Below Poverty by Sex and Age in Wilburton Number One
With 20.1% poverty level for males and 13.7% for females among the residents of Wilburton Number One, under 5 year old males and 12 to 14 year old females are the most vulnerable to poverty, with 18 males (100.0%) and 10 females (83.3%) in their respective age groups living below the poverty level.
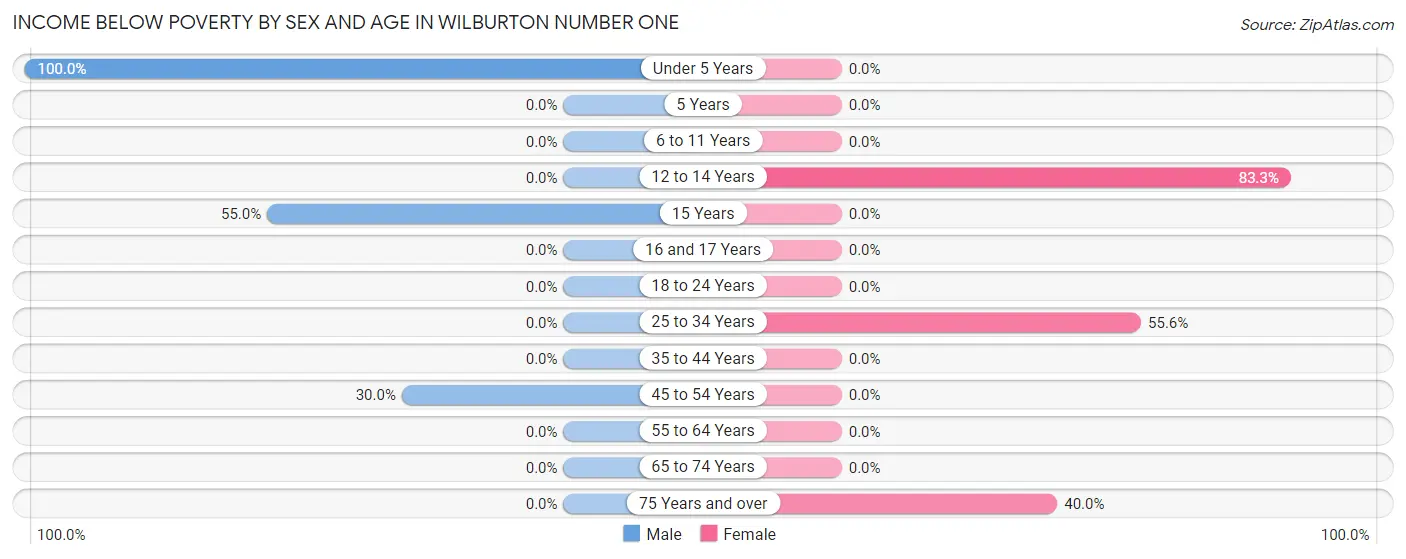
| Age Bracket | Male | Female |
| Under 5 Years | 18 (100.0%) | 0 (0.0%) |
| 5 Years | 0 (0.0%) | 0 (0.0%) |
| 6 to 11 Years | 0 (0.0%) | 0 (0.0%) |
| 12 to 14 Years | 0 (0.0%) | 10 (83.3%) |
| 15 Years | 11 (55.0%) | 0 (0.0%) |
| 16 and 17 Years | 0 (0.0%) | 0 (0.0%) |
| 18 to 24 Years | 0 (0.0%) | 0 (0.0%) |
| 25 to 34 Years | 0 (0.0%) | 10 (55.6%) |
| 35 to 44 Years | 0 (0.0%) | 0 (0.0%) |
| 45 to 54 Years | 6 (30.0%) | 0 (0.0%) |
| 55 to 64 Years | 0 (0.0%) | 0 (0.0%) |
| 65 to 74 Years | 0 (0.0%) | 0 (0.0%) |
| 75 Years and over | 0 (0.0%) | 8 (40.0%) |
| Total | 35 (20.1%) | 28 (13.7%) |
Income Above Poverty by Sex and Age in Wilburton Number One
According to the poverty statistics in Wilburton Number One, males aged 5 years and females aged under 5 years are the age groups that are most secure financially, with 100.0% of males and 100.0% of females in these age groups living above the poverty line.
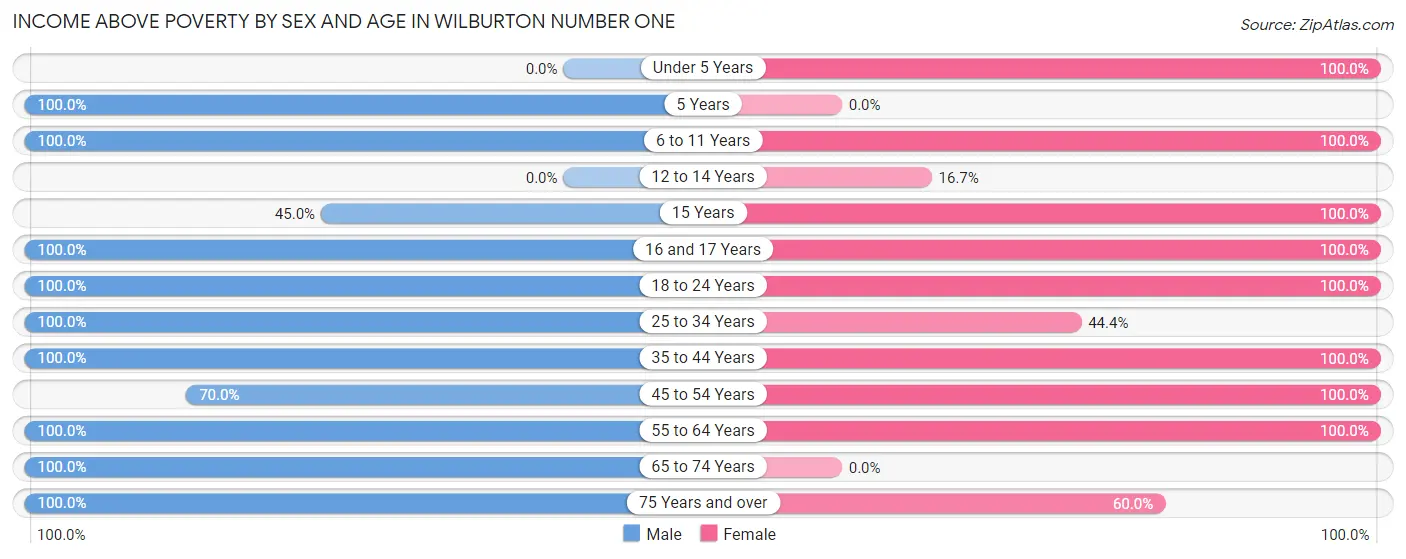
| Age Bracket | Male | Female |
| Under 5 Years | 0 (0.0%) | 6 (100.0%) |
| 5 Years | 3 (100.0%) | 0 (0.0%) |
| 6 to 11 Years | 2 (100.0%) | 14 (100.0%) |
| 12 to 14 Years | 0 (0.0%) | 2 (16.7%) |
| 15 Years | 9 (45.0%) | 12 (100.0%) |
| 16 and 17 Years | 3 (100.0%) | 2 (100.0%) |
| 18 to 24 Years | 44 (100.0%) | 32 (100.0%) |
| 25 to 34 Years | 18 (100.0%) | 8 (44.4%) |
| 35 to 44 Years | 7 (100.0%) | 13 (100.0%) |
| 45 to 54 Years | 14 (70.0%) | 38 (100.0%) |
| 55 to 64 Years | 19 (100.0%) | 38 (100.0%) |
| 65 to 74 Years | 11 (100.0%) | 0 (0.0%) |
| 75 Years and over | 9 (100.0%) | 12 (60.0%) |
| Total | 139 (79.9%) | 177 (86.3%) |
Income Below Poverty Among Married-Couple Families in Wilburton Number One
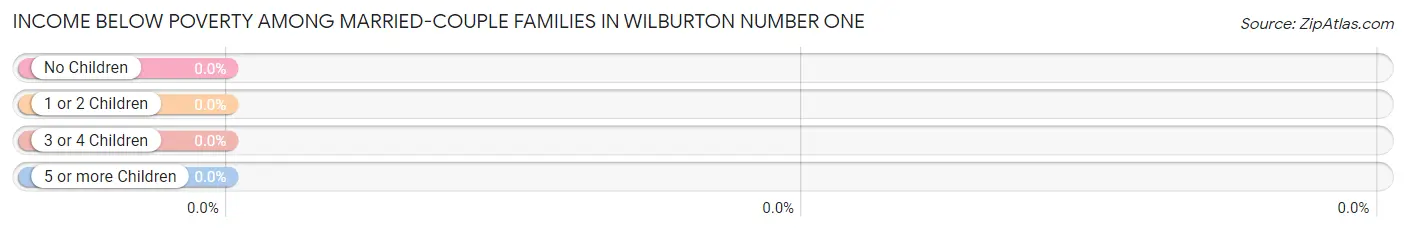
| Children | Above Poverty | Below Poverty |
| No Children | 30 (100.0%) | 0 (0.0%) |
| 1 or 2 Children | 22 (100.0%) | 0 (0.0%) |
| 3 or 4 Children | 0 (0.0%) | 0 (0.0%) |
| 5 or more Children | 0 (0.0%) | 0 (0.0%) |
| Total | 52 (100.0%) | 0 (0.0%) |
Income Below Poverty Among Single-Parent Households in Wilburton Number One
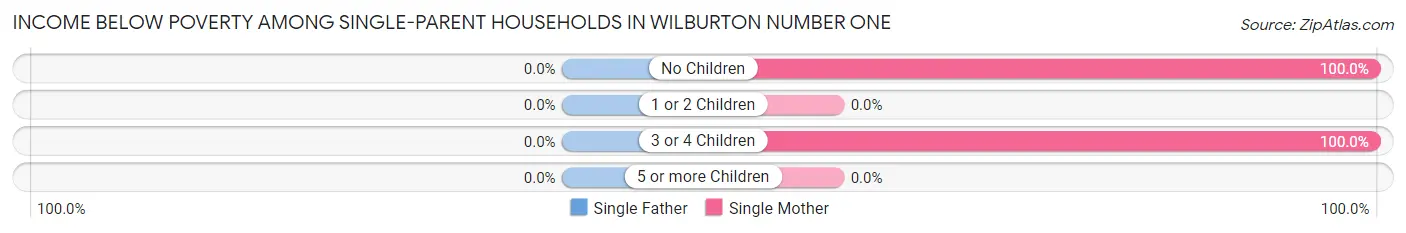
| Children | Single Father | Single Mother |
| No Children | 0 (0.0%) | 6 (100.0%) |
| 1 or 2 Children | 0 (0.0%) | 0 (0.0%) |
| 3 or 4 Children | 0 (0.0%) | 10 (100.0%) |
| 5 or more Children | 0 (0.0%) | 0 (0.0%) |
| Total | 0 (0.0%) | 16 (48.5%) |
Income Below Poverty Among Married-Couple vs Single-Parent Households in Wilburton Number One
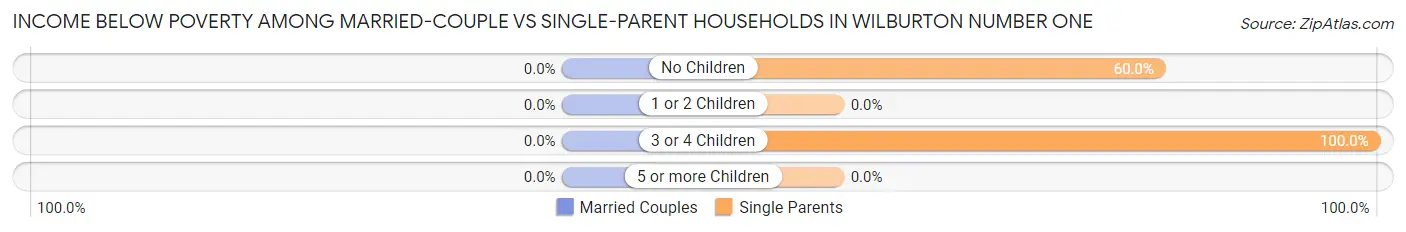
| Children | Married-Couple Families | Single-Parent Households |
| No Children | 0 (0.0%) | 6 (60.0%) |
| 1 or 2 Children | 0 (0.0%) | 0 (0.0%) |
| 3 or 4 Children | 0 (0.0%) | 10 (100.0%) |
| 5 or more Children | 0 (0.0%) | 0 (0.0%) |
| Total | 0 (0.0%) | 16 (43.2%) |
Race in Wilburton Number One
The most populous races in Wilburton Number One are White / Caucasian (371 | 97.9%), Two or more Races (6 | 1.6%), and Asian (2 | 0.5%).
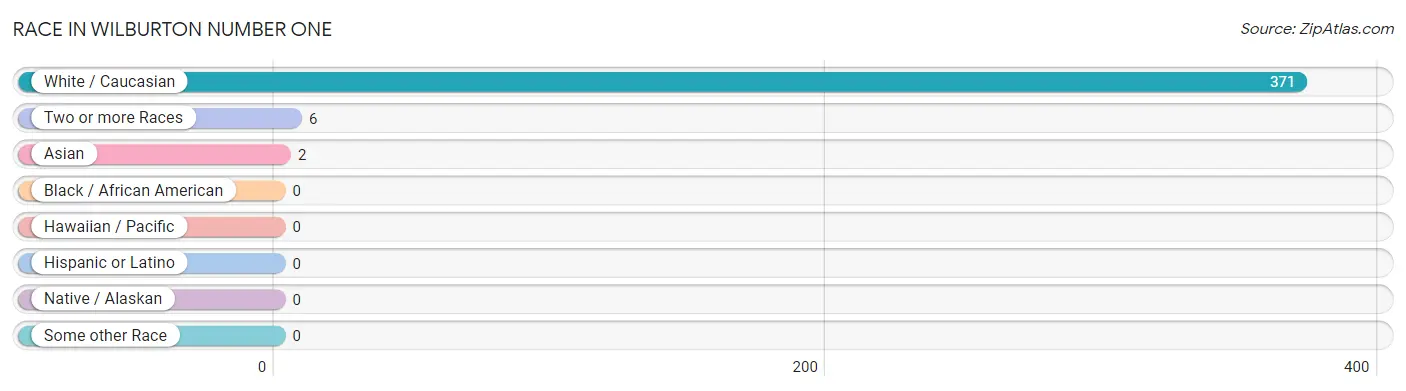
| Race | # Population | % Population |
| Asian | 2 | 0.5% |
| Black / African American | 0 | 0.0% |
| Hawaiian / Pacific | 0 | 0.0% |
| Hispanic or Latino | 0 | 0.0% |
| Native / Alaskan | 0 | 0.0% |
| White / Caucasian | 371 | 97.9% |
| Two or more Races | 6 | 1.6% |
| Some other Race | 0 | 0.0% |
| Total | 379 | 100.0% |
Ancestry in Wilburton Number One
The most populous ancestries reported in Wilburton Number One are French (59 | 15.6%), Polish (42 | 11.1%), Irish (38 | 10.0%), German (32 | 8.4%), and European (16 | 4.2%), together accounting for 49.3% of all Wilburton Number One residents.
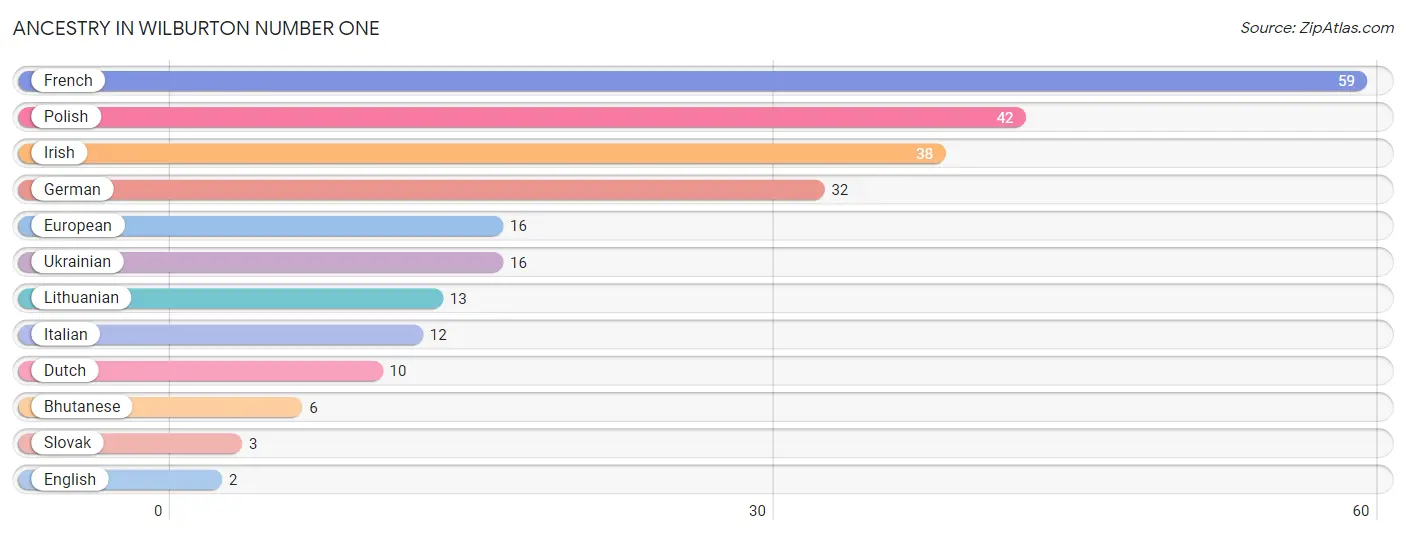
| Ancestry | # Population | % Population |
| Bhutanese | 6 | 1.6% |
| Dutch | 10 | 2.6% |
| English | 2 | 0.5% |
| European | 16 | 4.2% |
| French | 59 | 15.6% |
| German | 32 | 8.4% |
| Irish | 38 | 10.0% |
| Italian | 12 | 3.2% |
| Lithuanian | 13 | 3.4% |
| Polish | 42 | 11.1% |
| Slovak | 3 | 0.8% |
| Ukrainian | 16 | 4.2% | View All 12 Rows |
Immigrants in Wilburton Number One

| Immigration Origin | # Population | % Population | View All 0 Rows |
Sex and Age in Wilburton Number One
Sex and Age in Wilburton Number One
The most populous age groups in Wilburton Number One are 20 to 24 Years (36 | 20.7%) for men and 45 to 49 Years (36 | 17.6%) for women.
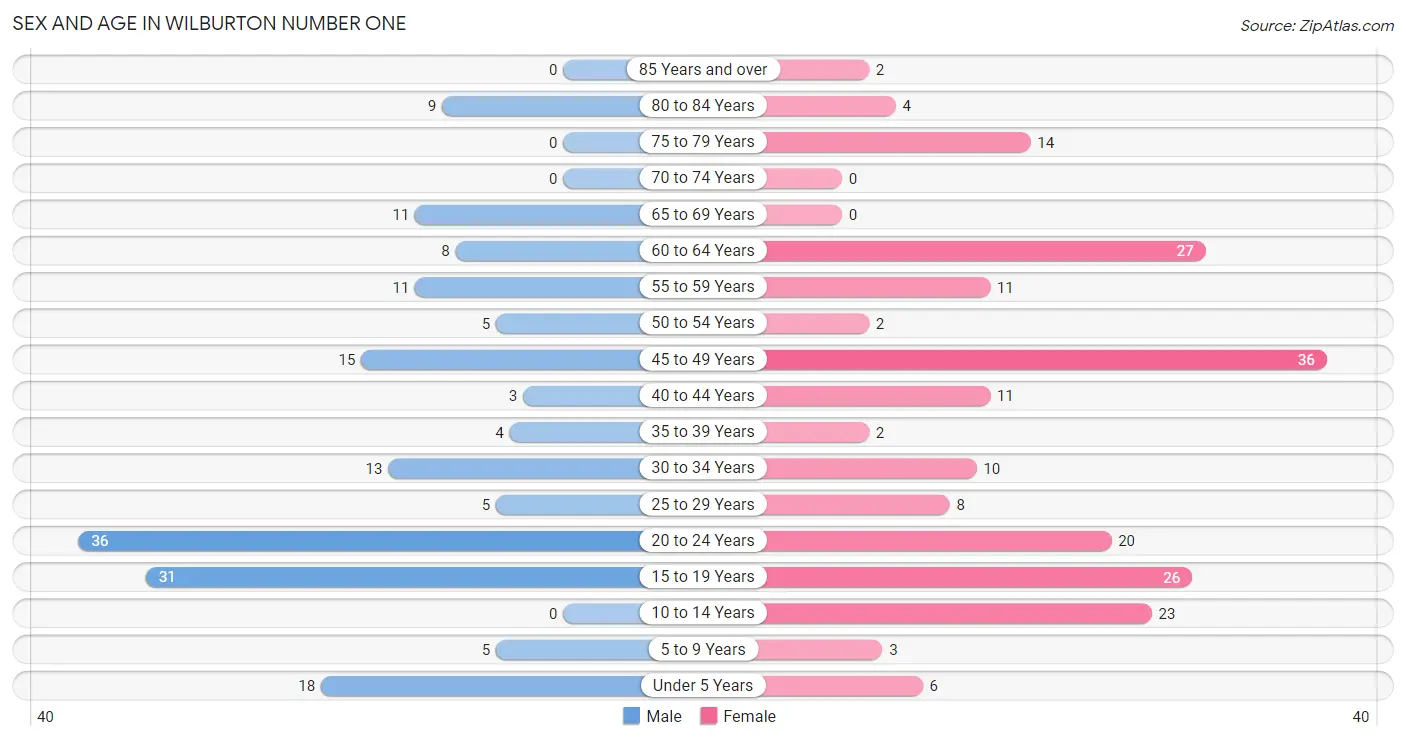
| Age Bracket | Male | Female |
| Under 5 Years | 18 (10.3%) | 6 (2.9%) |
| 5 to 9 Years | 5 (2.9%) | 3 (1.5%) |
| 10 to 14 Years | 0 (0.0%) | 23 (11.2%) |
| 15 to 19 Years | 31 (17.8%) | 26 (12.7%) |
| 20 to 24 Years | 36 (20.7%) | 20 (9.8%) |
| 25 to 29 Years | 5 (2.9%) | 8 (3.9%) |
| 30 to 34 Years | 13 (7.5%) | 10 (4.9%) |
| 35 to 39 Years | 4 (2.3%) | 2 (1.0%) |
| 40 to 44 Years | 3 (1.7%) | 11 (5.4%) |
| 45 to 49 Years | 15 (8.6%) | 36 (17.6%) |
| 50 to 54 Years | 5 (2.9%) | 2 (1.0%) |
| 55 to 59 Years | 11 (6.3%) | 11 (5.4%) |
| 60 to 64 Years | 8 (4.6%) | 27 (13.2%) |
| 65 to 69 Years | 11 (6.3%) | 0 (0.0%) |
| 70 to 74 Years | 0 (0.0%) | 0 (0.0%) |
| 75 to 79 Years | 0 (0.0%) | 14 (6.8%) |
| 80 to 84 Years | 9 (5.2%) | 4 (1.9%) |
| 85 Years and over | 0 (0.0%) | 2 (1.0%) |
| Total | 174 (100.0%) | 205 (100.0%) |
Families and Households in Wilburton Number One
Median Family Size in Wilburton Number One
The median family size in Wilburton Number One is 3.76 persons per family, with married-couple families (52 | 58.4%) accounting for the largest median family size of 3.98 persons per family. On the other hand, single male/father families (4 | 4.5%) represent the smallest median family size with 2.25 persons per family.
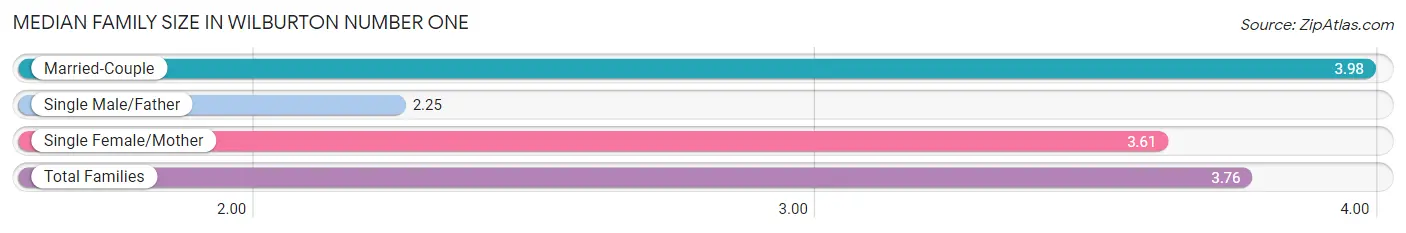
| Family Type | # Families | Family Size |
| Married-Couple | 52 (58.4%) | 3.98 |
| Single Male/Father | 4 (4.5%) | 2.25 |
| Single Female/Mother | 33 (37.1%) | 3.61 |
| Total Families | 89 (100.0%) | 3.76 |
Median Household Size in Wilburton Number One
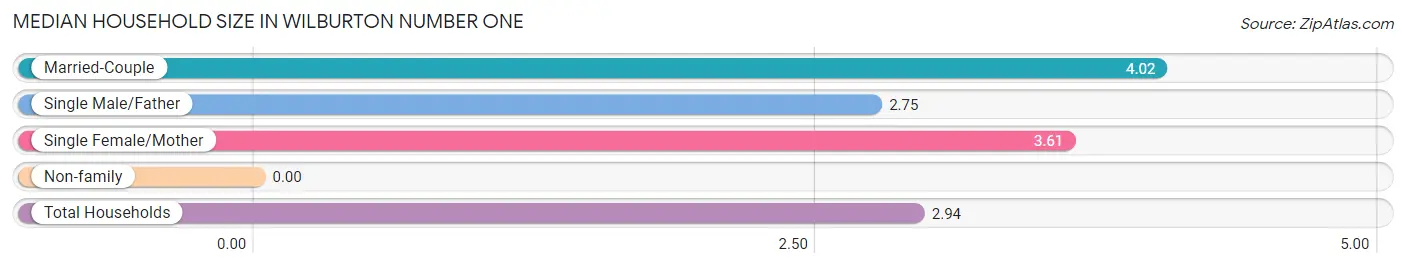
| Household Type | # Households | Household Size |
| Married-Couple | 52 (40.3%) | 4.02 |
| Single Male/Father | 4 (3.1%) | 2.75 |
| Single Female/Mother | 33 (25.6%) | 3.61 |
| Non-family | 40 (31.0%) | - |
| Total Households | 129 (100.0%) | 2.94 |
Household Size by Marriage Status in Wilburton Number One
Out of a total of 129 households in Wilburton Number One, 89 (69.0%) are family households, while 40 (31.0%) are nonfamily households. The most numerous type of family households are 2-person households, comprising 29, and the most common type of nonfamily households are 1-person households, comprising 40.
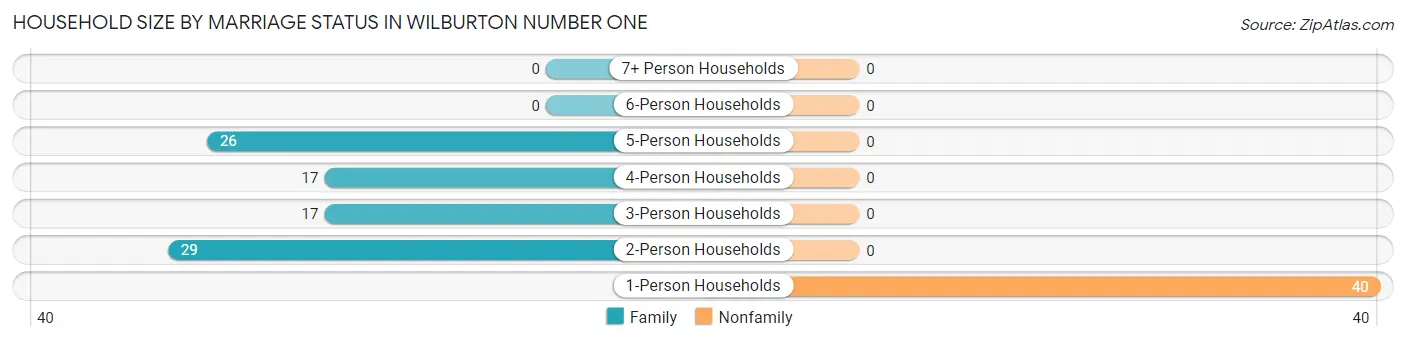
| Household Size | Family Households | Nonfamily Households |
| 1-Person Households | - | 40 (31.0%) |
| 2-Person Households | 29 (22.5%) | 0 (0.0%) |
| 3-Person Households | 17 (13.2%) | 0 (0.0%) |
| 4-Person Households | 17 (13.2%) | 0 (0.0%) |
| 5-Person Households | 26 (20.2%) | 0 (0.0%) |
| 6-Person Households | 0 (0.0%) | 0 (0.0%) |
| 7+ Person Households | 0 (0.0%) | 0 (0.0%) |
| Total | 89 (69.0%) | 40 (31.0%) |
Female Fertility in Wilburton Number One
Fertility by Age in Wilburton Number One
Average fertility rate in Wilburton Number One is 18.0 births per 1,000 women. Women in the age bracket of 35 to 50 years have the highest fertility rate with 41.0 births per 1,000 women. Women in the age bracket of 35 to 50 years acount for 100.0% of all women with births.
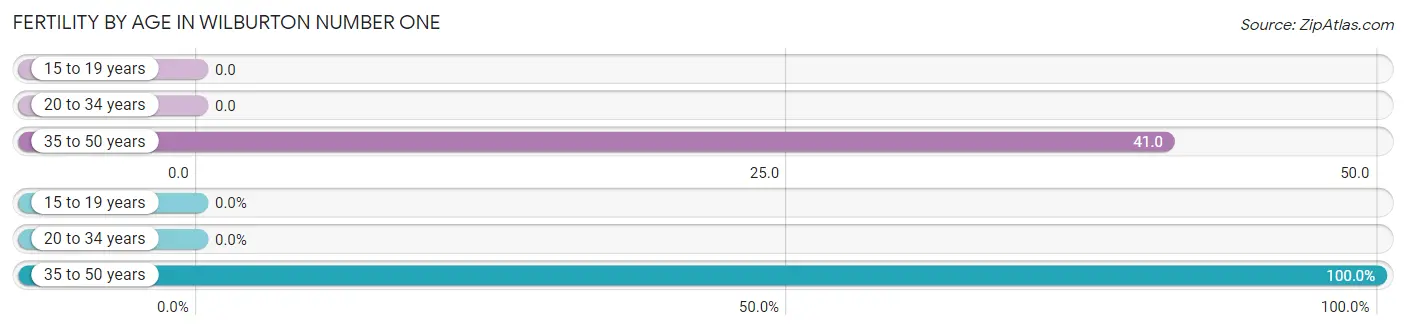
| Age Bracket | Women with Births | Births / 1,000 Women |
| 15 to 19 years | 0 (0.0%) | 0.0 |
| 20 to 34 years | 0 (0.0%) | 0.0 |
| 35 to 50 years | 2 (100.0%) | 41.0 |
| Total | 2 (100.0%) | 18.0 |
Fertility by Age by Marriage Status in Wilburton Number One
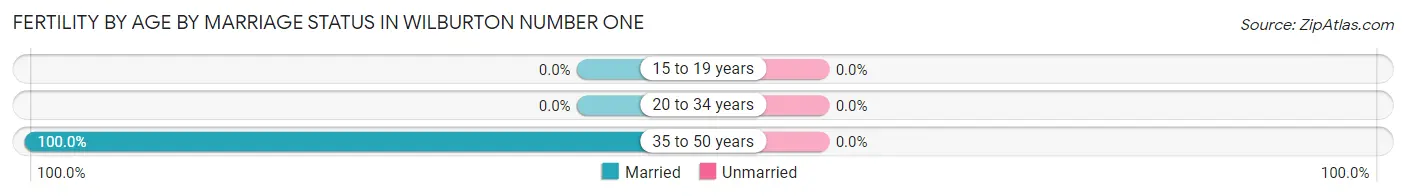
| Age Bracket | Married | Unmarried |
| 15 to 19 years | 0 (0.0%) | 0 (0.0%) |
| 20 to 34 years | 0 (0.0%) | 0 (0.0%) |
| 35 to 50 years | 2 (100.0%) | 0 (0.0%) |
| Total | 2 (100.0%) | 0 (0.0%) |
Fertility by Education in Wilburton Number One
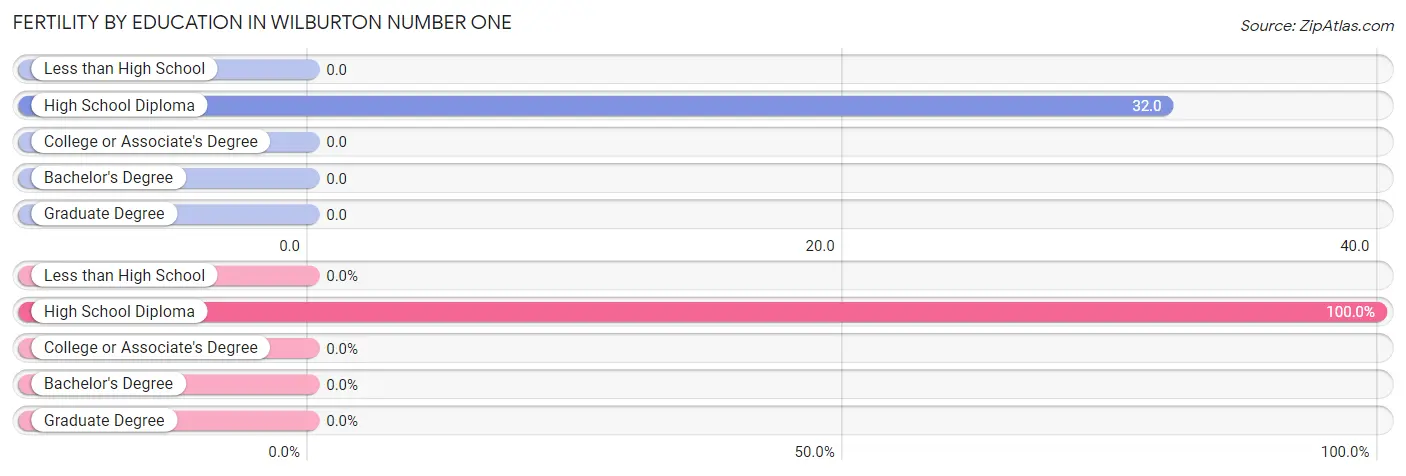
| Educational Attainment | Women with Births | Births / 1,000 Women |
| Less than High School | 0 (0.0%) | 0.0 |
| High School Diploma | 2 (100.0%) | 32.0 |
| College or Associate's Degree | 0 (0.0%) | 0.0 |
| Bachelor's Degree | 0 (0.0%) | 0.0 |
| Graduate Degree | 0 (0.0%) | 0.0 |
| Total | 2 (100.0%) | 18.0 |
Fertility by Education by Marriage Status in Wilburton Number One
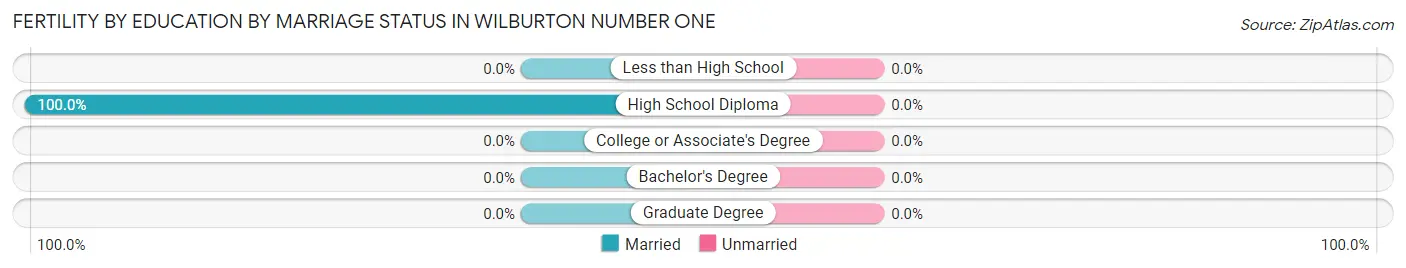
| Educational Attainment | Married | Unmarried |
| Less than High School | 0 (0.0%) | 0 (0.0%) |
| High School Diploma | 2 (100.0%) | 0 (0.0%) |
| College or Associate's Degree | 0 (0.0%) | 0 (0.0%) |
| Bachelor's Degree | 0 (0.0%) | 0 (0.0%) |
| Graduate Degree | 0 (0.0%) | 0 (0.0%) |
| Total | 2 (100.0%) | 0 (0.0%) |
Employment Characteristics in Wilburton Number One
Employment by Class of Employer in Wilburton Number One
Among the 158 employed individuals in Wilburton Number One, private company employees (113 | 71.5%), not-for-profit organizations (19 | 12.0%), and federal government employees (9 | 5.7%) make up the most common classes of employment.
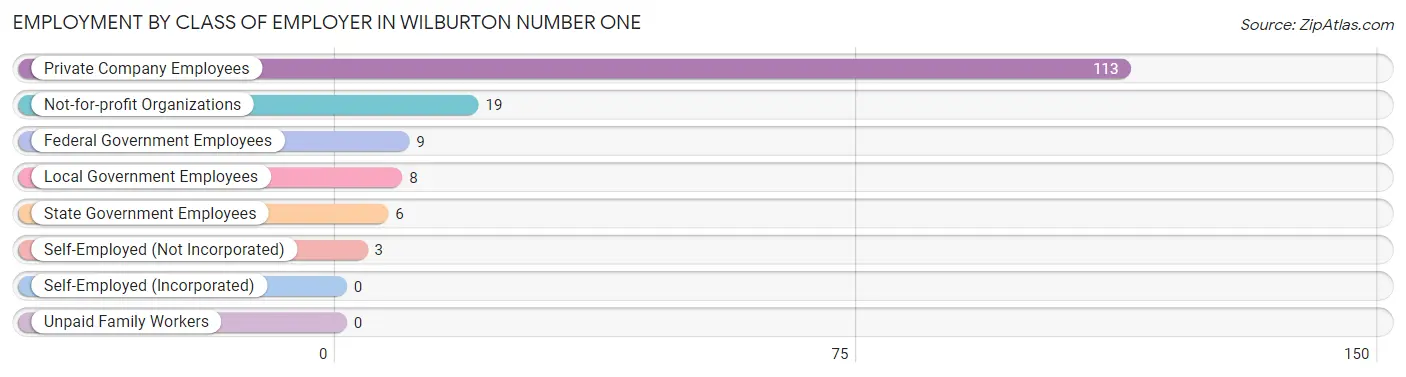
| Employer Class | # Employees | % Employees |
| Private Company Employees | 113 | 71.5% |
| Self-Employed (Incorporated) | 0 | 0.0% |
| Self-Employed (Not Incorporated) | 3 | 1.9% |
| Not-for-profit Organizations | 19 | 12.0% |
| Local Government Employees | 8 | 5.1% |
| State Government Employees | 6 | 3.8% |
| Federal Government Employees | 9 | 5.7% |
| Unpaid Family Workers | 0 | 0.0% |
| Total | 158 | 100.0% |
Employment Status by Age in Wilburton Number One
According to the labor force statistics for Wilburton Number One, out of the total population over 16 years of age (292), 60.3% or 176 individuals are in the labor force, with 10.2% or 18 of them unemployed. The age group with the highest labor force participation rate is 25 to 29 years, with 100.0% or 13 individuals in the labor force. Within the labor force, the 20 to 24 years age range has the highest percentage of unemployed individuals, with 52.9% or 18 of them being unemployed.
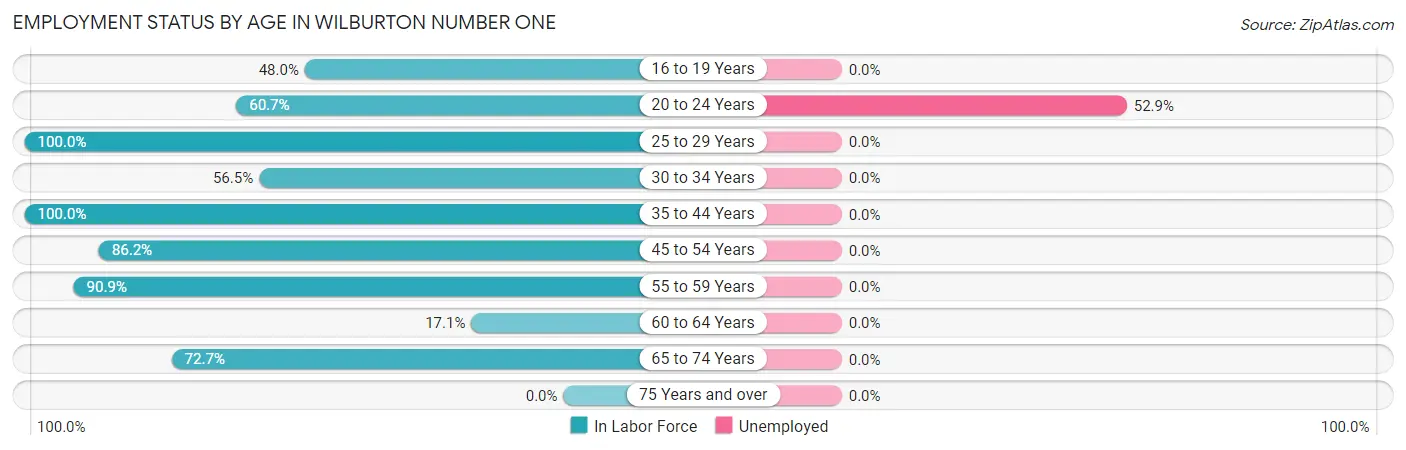
| Age Bracket | In Labor Force | Unemployed |
| 16 to 19 Years | 12 (48.0%) | 0 (0.0%) |
| 20 to 24 Years | 34 (60.7%) | 18 (52.9%) |
| 25 to 29 Years | 13 (100.0%) | 0 (0.0%) |
| 30 to 34 Years | 13 (56.5%) | 0 (0.0%) |
| 35 to 44 Years | 20 (100.0%) | 0 (0.0%) |
| 45 to 54 Years | 50 (86.2%) | 0 (0.0%) |
| 55 to 59 Years | 20 (90.9%) | 0 (0.0%) |
| 60 to 64 Years | 6 (17.1%) | 0 (0.0%) |
| 65 to 74 Years | 8 (72.7%) | 0 (0.0%) |
| 75 Years and over | 0 (0.0%) | 0 (0.0%) |
| Total | 176 (60.3%) | 18 (10.2%) |
Employment Status by Educational Attainment in Wilburton Number One
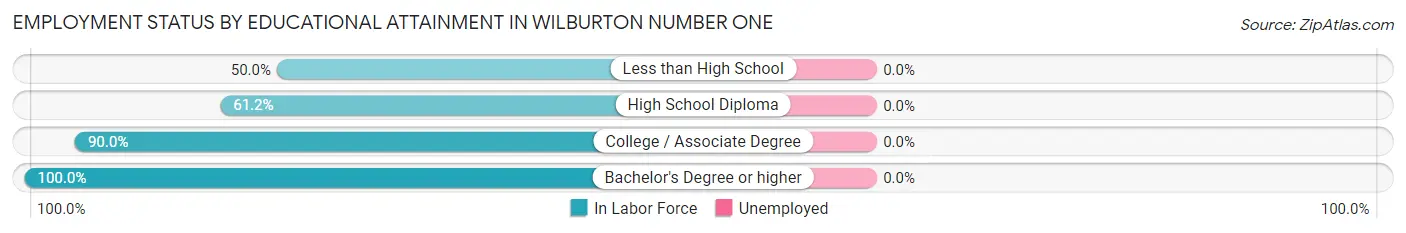
| Educational Attainment | In Labor Force | Unemployed |
| Less than High School | 2 (50.0%) | 0 (0.0%) |
| High School Diploma | 71 (61.2%) | 0 (0.0%) |
| College / Associate Degree | 18 (90.0%) | 0 (0.0%) |
| Bachelor's Degree or higher | 31 (100.0%) | 0 (0.0%) |
| Total | 122 (71.3%) | 0 (0.0%) |
Employment Occupations by Sex in Wilburton Number One
Management, Business, Science and Arts Occupations
The most common Management, Business, Science and Arts occupations in Wilburton Number One are Health Diagnosing & Treating (23 | 14.6%), Community & Social Service (11 | 7.0%), Business & Financial (8 | 5.1%), Legal Services & Support (8 | 5.1%), and Health Technologists (5 | 3.2%).

Management, Business, Science and Arts Occupations by Sex
Within the Management, Business, Science and Arts occupations in Wilburton Number One, the most male-oriented occupations are Computers, Engineering & Science (100.0%), Architecture & Engineering (100.0%), and Community & Social Service (100.0%), while the most female-oriented occupations are Management (100.0%), Business & Financial (100.0%), and Health Technologists (100.0%).
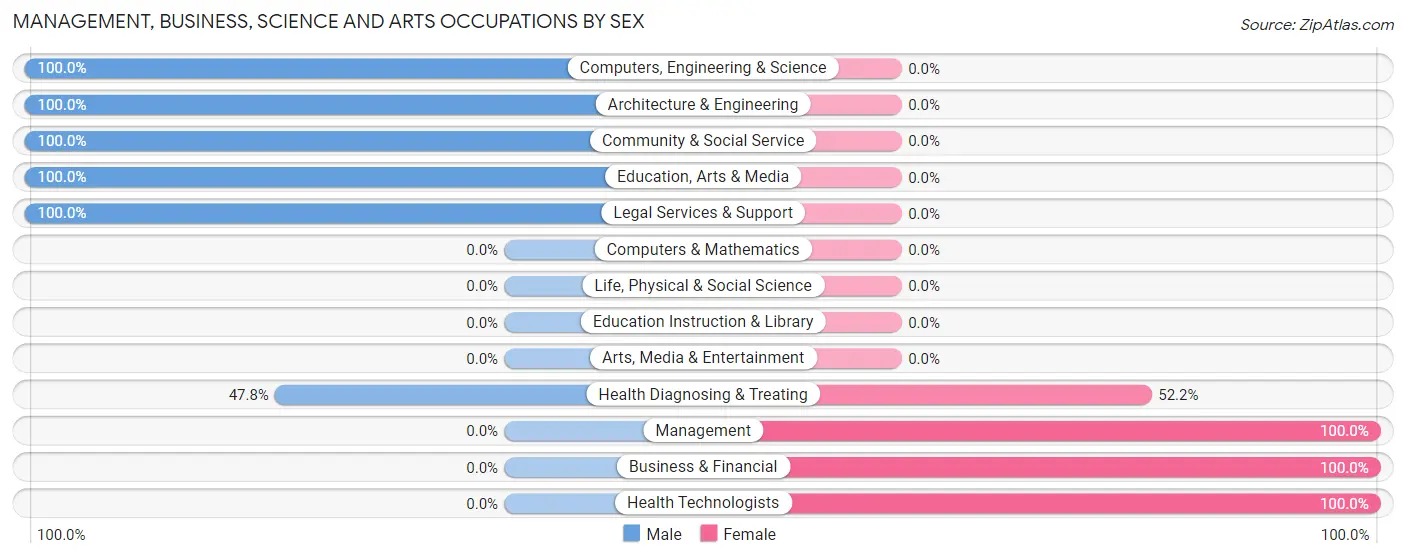
| Occupation | Male | Female |
| Management | 0 (0.0%) | 3 (100.0%) |
| Business & Financial | 0 (0.0%) | 8 (100.0%) |
| Computers, Engineering & Science | 3 (100.0%) | 0 (0.0%) |
| Computers & Mathematics | 0 (0.0%) | 0 (0.0%) |
| Architecture & Engineering | 3 (100.0%) | 0 (0.0%) |
| Life, Physical & Social Science | 0 (0.0%) | 0 (0.0%) |
| Community & Social Service | 11 (100.0%) | 0 (0.0%) |
| Education, Arts & Media | 3 (100.0%) | 0 (0.0%) |
| Legal Services & Support | 8 (100.0%) | 0 (0.0%) |
| Education Instruction & Library | 0 (0.0%) | 0 (0.0%) |
| Arts, Media & Entertainment | 0 (0.0%) | 0 (0.0%) |
| Health Diagnosing & Treating | 11 (47.8%) | 12 (52.2%) |
| Health Technologists | 0 (0.0%) | 5 (100.0%) |
| Total (Category) | 25 (52.1%) | 23 (47.9%) |
| Total (Overall) | 63 (39.9%) | 95 (60.1%) |
Services Occupations
The most common Services occupations in Wilburton Number One are Cleaning & Maintenance (14 | 8.9%), Personal Care & Service (3 | 1.9%), Security & Protection (2 | 1.3%), and Law Enforcement (2 | 1.3%).
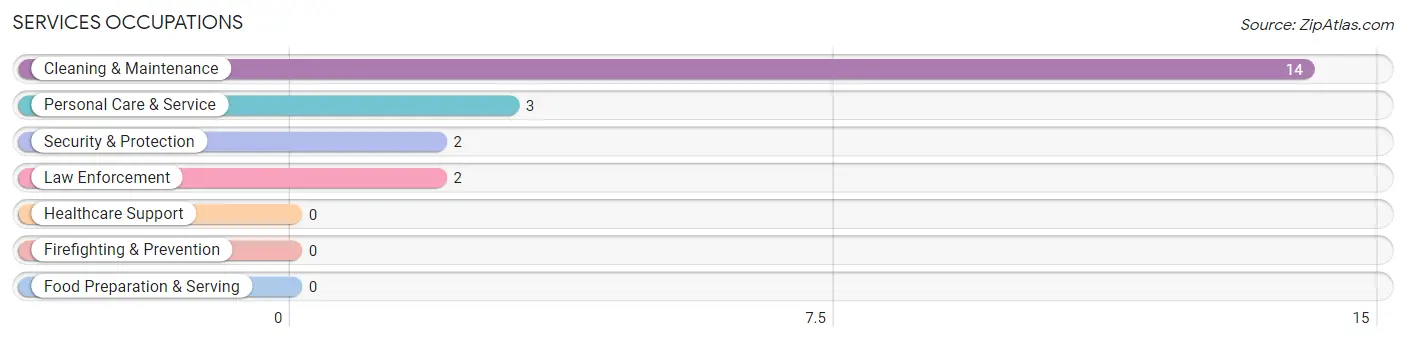
Services Occupations by Sex
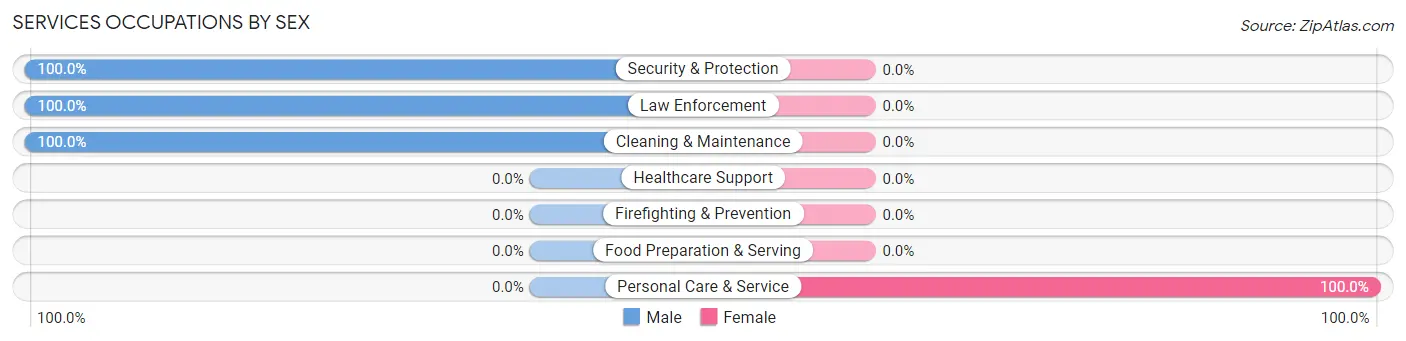
| Occupation | Male | Female |
| Healthcare Support | 0 (0.0%) | 0 (0.0%) |
| Security & Protection | 2 (100.0%) | 0 (0.0%) |
| Firefighting & Prevention | 0 (0.0%) | 0 (0.0%) |
| Law Enforcement | 2 (100.0%) | 0 (0.0%) |
| Food Preparation & Serving | 0 (0.0%) | 0 (0.0%) |
| Cleaning & Maintenance | 14 (100.0%) | 0 (0.0%) |
| Personal Care & Service | 0 (0.0%) | 3 (100.0%) |
| Total (Category) | 16 (84.2%) | 3 (15.8%) |
| Total (Overall) | 63 (39.9%) | 95 (60.1%) |
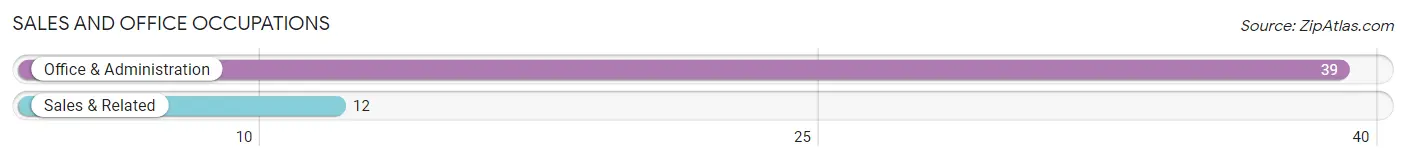
Sales and Office Occupations
The most common Sales and Office occupations in Wilburton Number One are Office & Administration (39 | 24.7%), and Sales & Related (12 | 7.6%).
Sales and Office Occupations by Sex
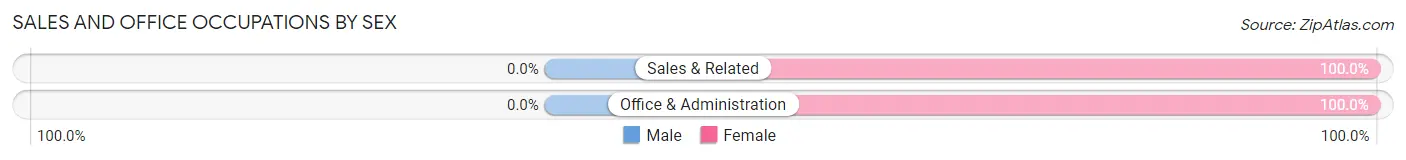
| Occupation | Male | Female |
| Sales & Related | 0 (0.0%) | 12 (100.0%) |
| Office & Administration | 0 (0.0%) | 39 (100.0%) |
| Total (Category) | 0 (0.0%) | 51 (100.0%) |
| Total (Overall) | 63 (39.9%) | 95 (60.1%) |
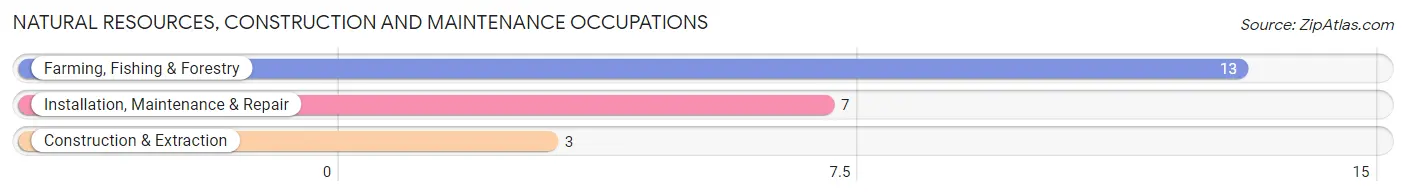
Natural Resources, Construction and Maintenance Occupations
The most common Natural Resources, Construction and Maintenance occupations in Wilburton Number One are Farming, Fishing & Forestry (13 | 8.2%), Installation, Maintenance & Repair (7 | 4.4%), and Construction & Extraction (3 | 1.9%).
Natural Resources, Construction and Maintenance Occupations by Sex
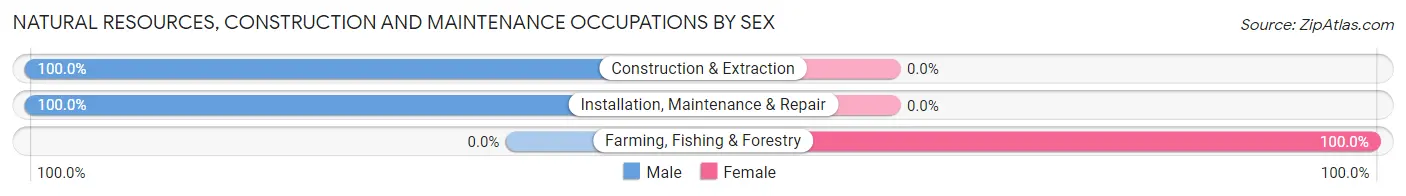
| Occupation | Male | Female |
| Farming, Fishing & Forestry | 0 (0.0%) | 13 (100.0%) |
| Construction & Extraction | 3 (100.0%) | 0 (0.0%) |
| Installation, Maintenance & Repair | 7 (100.0%) | 0 (0.0%) |
| Total (Category) | 10 (43.5%) | 13 (56.5%) |
| Total (Overall) | 63 (39.9%) | 95 (60.1%) |
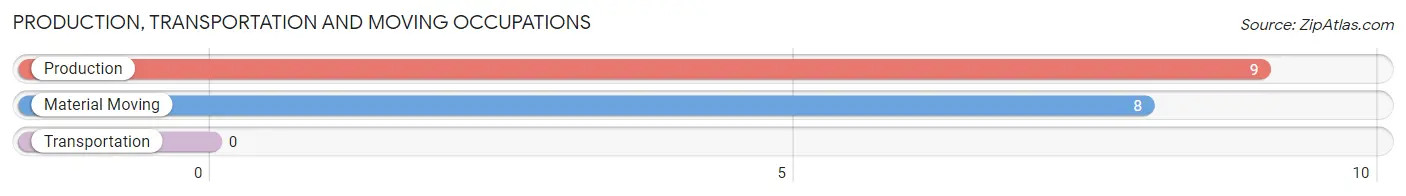
Production, Transportation and Moving Occupations
The most common Production, Transportation and Moving occupations in Wilburton Number One are Production (9 | 5.7%), and Material Moving (8 | 5.1%).
Production, Transportation and Moving Occupations by Sex
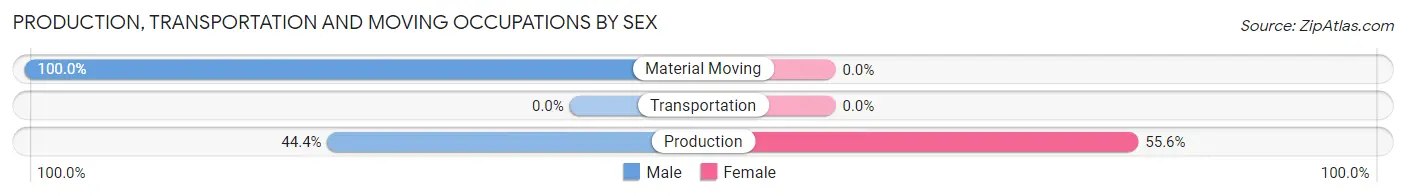
| Occupation | Male | Female |
| Production | 4 (44.4%) | 5 (55.6%) |
| Transportation | 0 (0.0%) | 0 (0.0%) |
| Material Moving | 8 (100.0%) | 0 (0.0%) |
| Total (Category) | 12 (70.6%) | 5 (29.4%) |
| Total (Overall) | 63 (39.9%) | 95 (60.1%) |
Employment Industries by Sex in Wilburton Number One
Employment Industries in Wilburton Number One
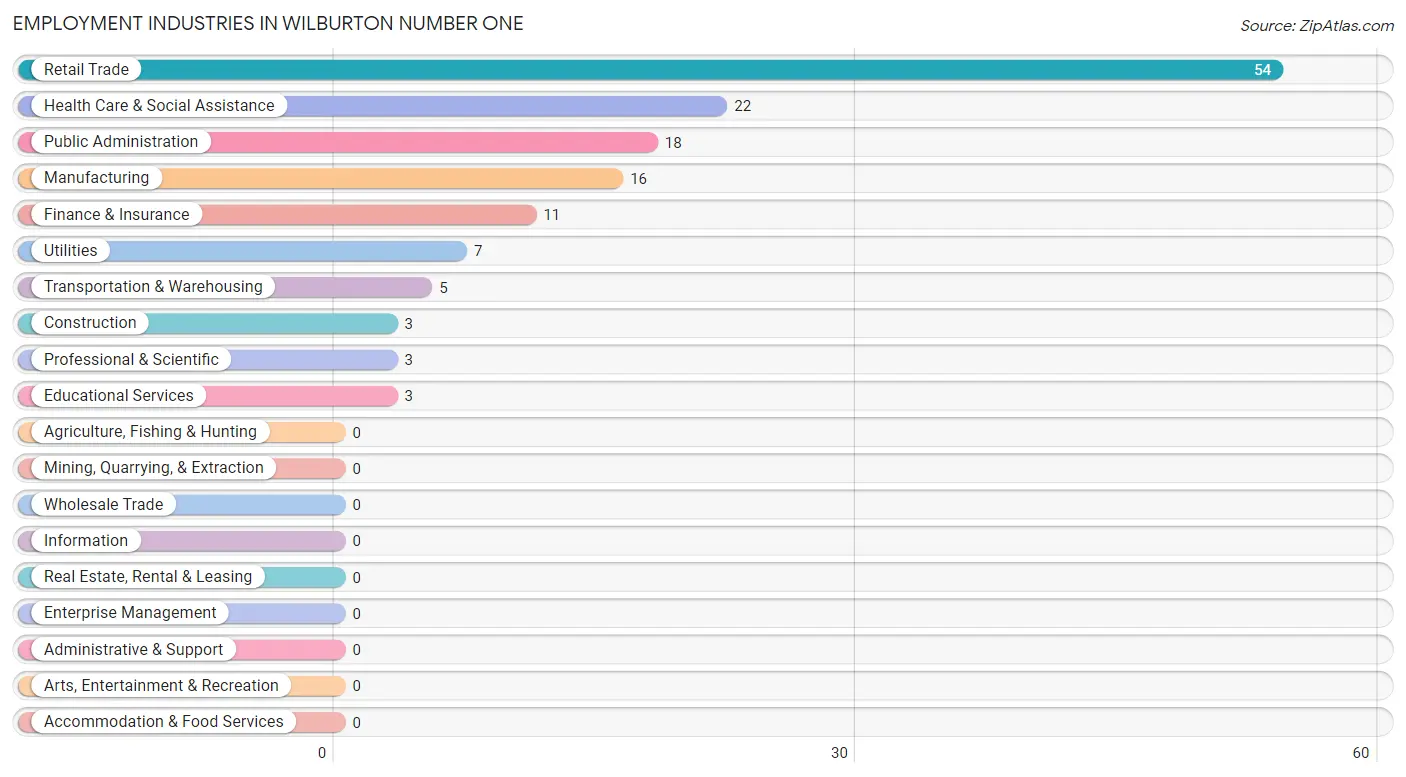
The major employment industries in Wilburton Number One include Retail Trade (54 | 34.2%), Health Care & Social Assistance (22 | 13.9%), Public Administration (18 | 11.4%), Manufacturing (16 | 10.1%), and Finance & Insurance (11 | 7.0%).
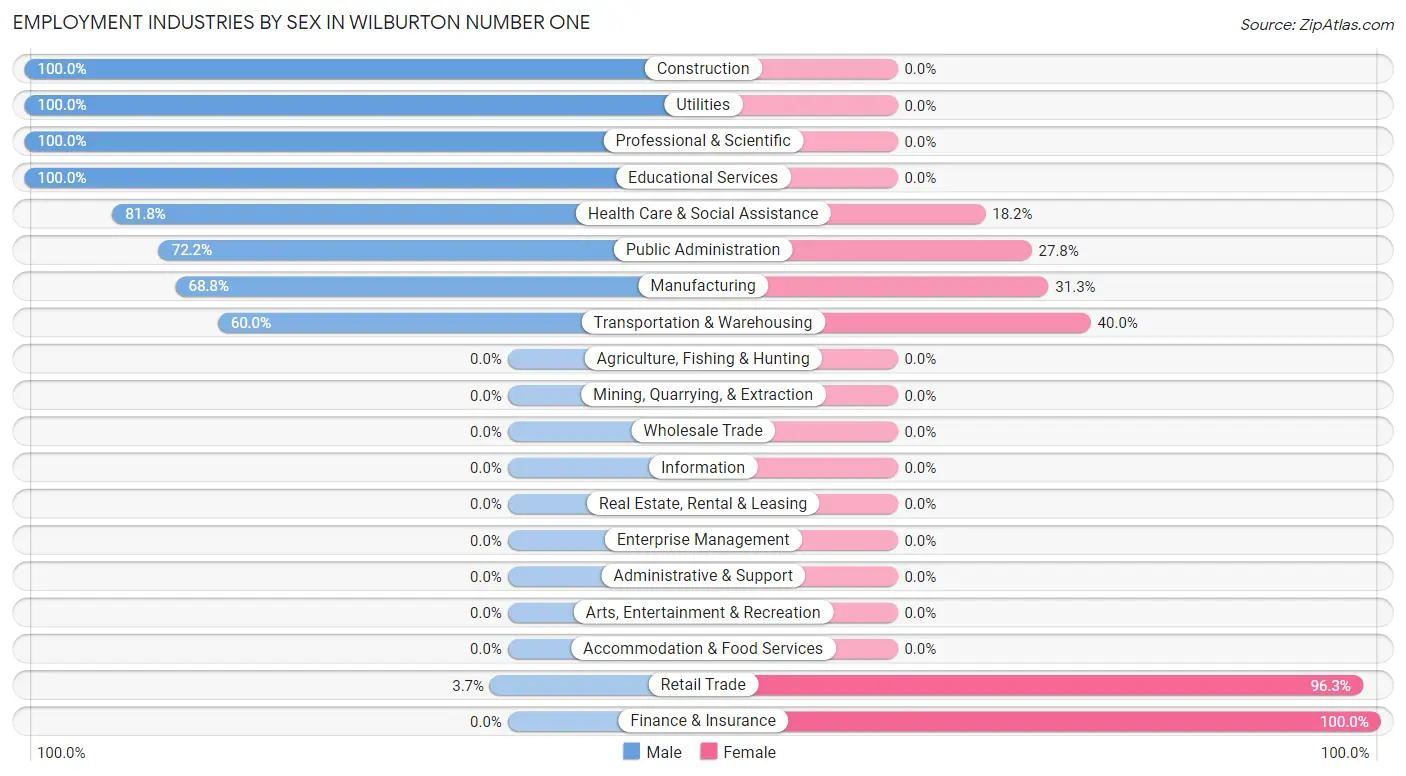
Employment Industries by Sex in Wilburton Number One
The Wilburton Number One industries that see more men than women are Construction (100.0%), Utilities (100.0%), and Professional & Scientific (100.0%), whereas the industries that tend to have a higher number of women are Finance & Insurance (100.0%), Retail Trade (96.3%), and Transportation & Warehousing (40.0%).
| Industry | Male | Female |
| Agriculture, Fishing & Hunting | 0 (0.0%) | 0 (0.0%) |
| Mining, Quarrying, & Extraction | 0 (0.0%) | 0 (0.0%) |
| Construction | 3 (100.0%) | 0 (0.0%) |
| Manufacturing | 11 (68.8%) | 5 (31.2%) |
| Wholesale Trade | 0 (0.0%) | 0 (0.0%) |
| Retail Trade | 2 (3.7%) | 52 (96.3%) |
| Transportation & Warehousing | 3 (60.0%) | 2 (40.0%) |
| Utilities | 7 (100.0%) | 0 (0.0%) |
| Information | 0 (0.0%) | 0 (0.0%) |
| Finance & Insurance | 0 (0.0%) | 11 (100.0%) |
| Real Estate, Rental & Leasing | 0 (0.0%) | 0 (0.0%) |
| Professional & Scientific | 3 (100.0%) | 0 (0.0%) |
| Enterprise Management | 0 (0.0%) | 0 (0.0%) |
| Administrative & Support | 0 (0.0%) | 0 (0.0%) |
| Educational Services | 3 (100.0%) | 0 (0.0%) |
| Health Care & Social Assistance | 18 (81.8%) | 4 (18.2%) |
| Arts, Entertainment & Recreation | 0 (0.0%) | 0 (0.0%) |
| Accommodation & Food Services | 0 (0.0%) | 0 (0.0%) |
| Public Administration | 13 (72.2%) | 5 (27.8%) |
| Total | 63 (39.9%) | 95 (60.1%) |
Education in Wilburton Number One
School Enrollment in Wilburton Number One
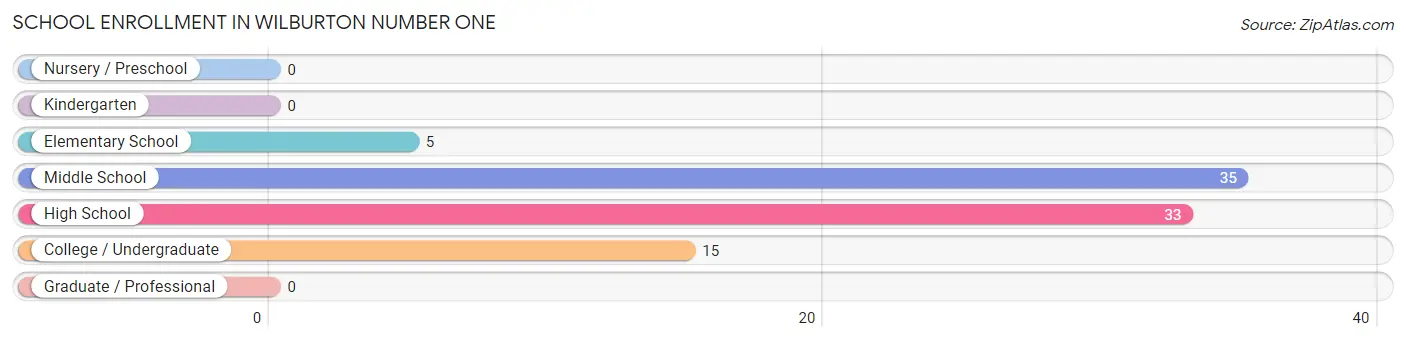
The most common levels of schooling among the 88 students in Wilburton Number One are middle school (35 | 39.8%), high school (33 | 37.5%), and college / undergraduate (15 | 17.1%).
| School Level | # Students | % Students |
| Nursery / Preschool | 0 | 0.0% |
| Kindergarten | 0 | 0.0% |
| Elementary School | 5 | 5.7% |
| Middle School | 35 | 39.8% |
| High School | 33 | 37.5% |
| College / Undergraduate | 15 | 17.1% |
| Graduate / Professional | 0 | 0.0% |
| Total | 88 | 100.0% |
School Enrollment by Age by Funding Source in Wilburton Number One
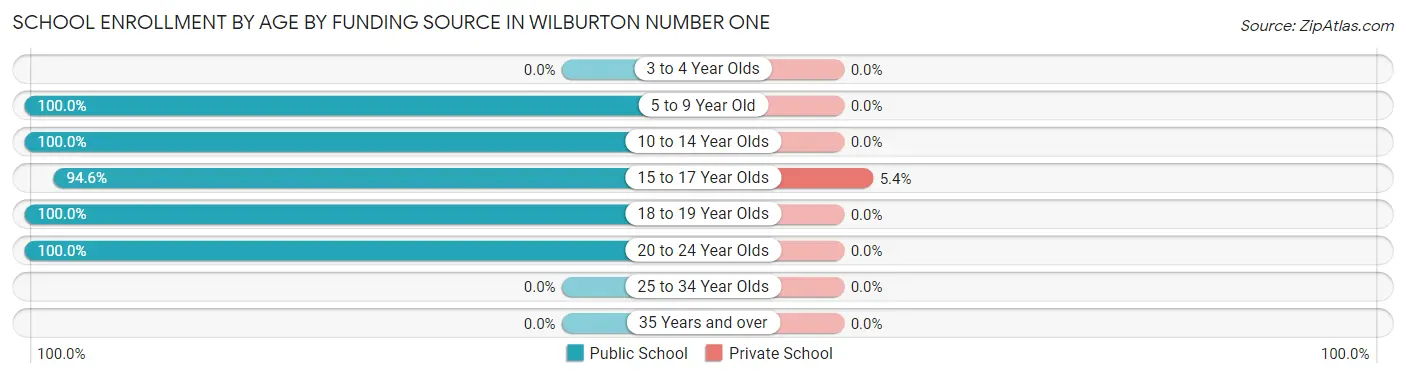
Out of a total of 88 students who are enrolled in schools in Wilburton Number One, 2 (2.3%) attend a private institution, while the remaining 86 (97.7%) are enrolled in public schools. The age group of 15 to 17 year olds has the highest likelihood of being enrolled in private schools, with 2 (5.4% in the age bracket) enrolled. Conversely, the age group of 5 to 9 year old has the lowest likelihood of being enrolled in a private school, with 5 (100.0% in the age bracket) attending a public institution.
| Age Bracket | Public School | Private School |
| 3 to 4 Year Olds | 0 (0.0%) | 0 (0.0%) |
| 5 to 9 Year Old | 5 (100.0%) | 0 (0.0%) |
| 10 to 14 Year Olds | 23 (100.0%) | 0 (0.0%) |
| 15 to 17 Year Olds | 35 (94.6%) | 2 (5.4%) |
| 18 to 19 Year Olds | 8 (100.0%) | 0 (0.0%) |
| 20 to 24 Year Olds | 15 (100.0%) | 0 (0.0%) |
| 25 to 34 Year Olds | 0 (0.0%) | 0 (0.0%) |
| 35 Years and over | 0 (0.0%) | 0 (0.0%) |
| Total | 86 (97.7%) | 2 (2.3%) |
Educational Attainment by Field of Study in Wilburton Number One
Arts & humanities (12 | 28.6%), literature & languages (11 | 26.2%), science & technology (8 | 19.1%), communications (8 | 19.1%), and engineering (3 | 7.1%) are the most common fields of study among 42 individuals in Wilburton Number One who have obtained a bachelor's degree or higher.
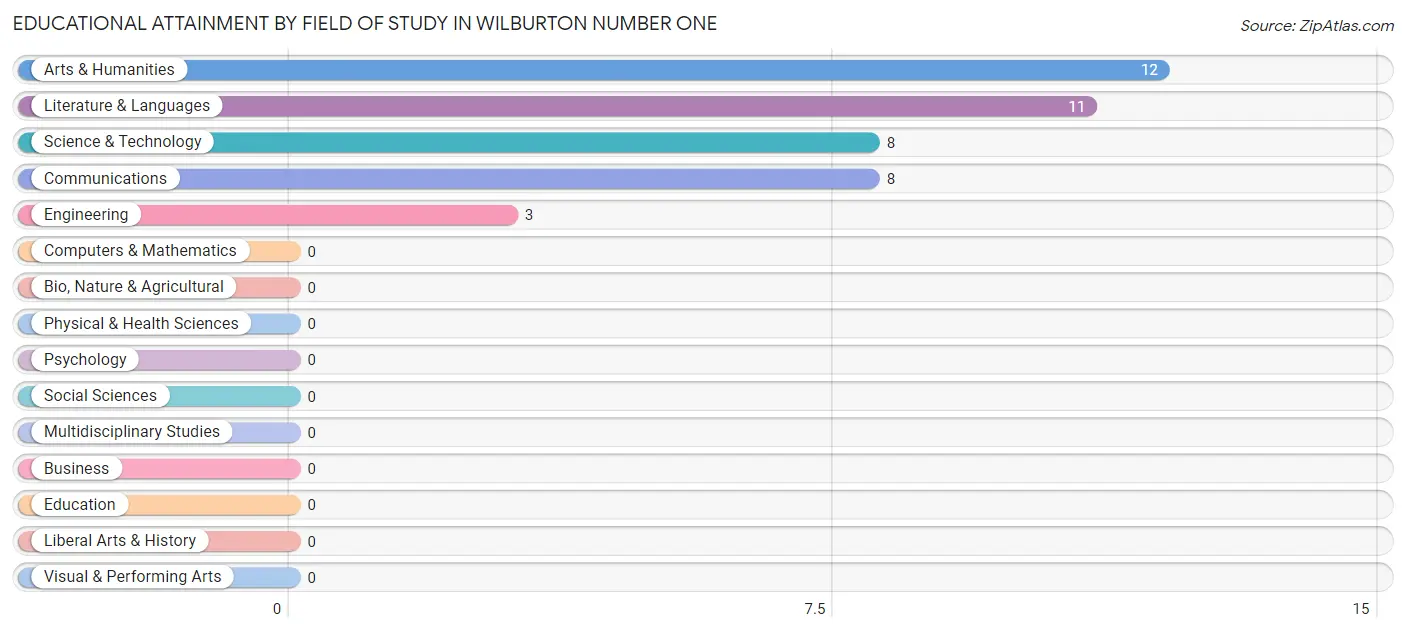
| Field of Study | # Graduates | % Graduates |
| Computers & Mathematics | 0 | 0.0% |
| Bio, Nature & Agricultural | 0 | 0.0% |
| Physical & Health Sciences | 0 | 0.0% |
| Psychology | 0 | 0.0% |
| Social Sciences | 0 | 0.0% |
| Engineering | 3 | 7.1% |
| Multidisciplinary Studies | 0 | 0.0% |
| Science & Technology | 8 | 19.1% |
| Business | 0 | 0.0% |
| Education | 0 | 0.0% |
| Literature & Languages | 11 | 26.2% |
| Liberal Arts & History | 0 | 0.0% |
| Visual & Performing Arts | 0 | 0.0% |
| Communications | 8 | 19.1% |
| Arts & Humanities | 12 | 28.6% |
| Total | 42 | 100.0% |
Transportation & Commute in Wilburton Number One
Vehicle Availability by Sex in Wilburton Number One
The most prevalent vehicle ownership categories in Wilburton Number One are males with 2 vehicles (29, accounting for 46.0%) and females with 2 vehicles (24, making up 30.5%).
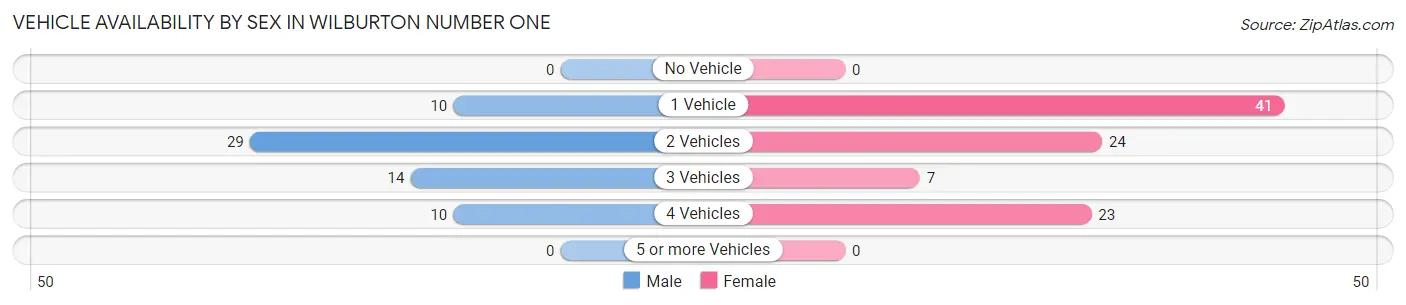
| Vehicles Available | Male | Female |
| No Vehicle | 0 (0.0%) | 0 (0.0%) |
| 1 Vehicle | 10 (15.9%) | 41 (43.2%) |
| 2 Vehicles | 29 (46.0%) | 24 (25.3%) |
| 3 Vehicles | 14 (22.2%) | 7 (7.4%) |
| 4 Vehicles | 10 (15.9%) | 23 (24.2%) |
| 5 or more Vehicles | 0 (0.0%) | 0 (0.0%) |
| Total | 63 (100.0%) | 95 (100.0%) |
Commute Time in Wilburton Number One
The most frequently occuring commute durations in Wilburton Number One are 15 to 19 minutes (65 commuters, 42.8%), 5 to 9 minutes (16 commuters, 10.5%), and 25 to 29 minutes (16 commuters, 10.5%).
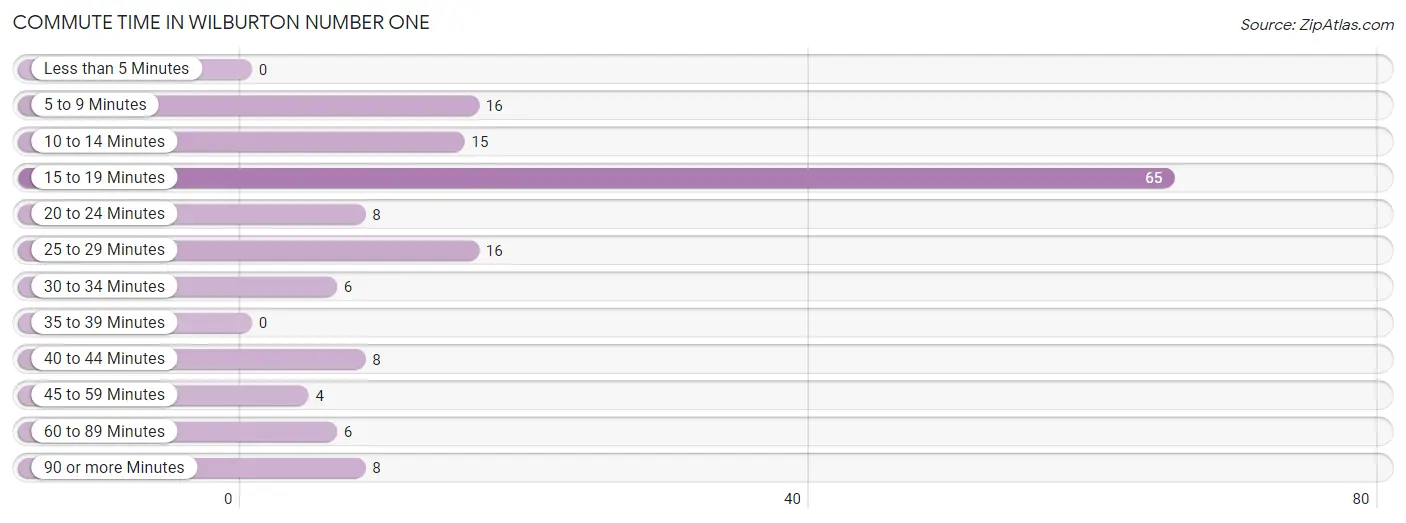
| Commute Time | # Commuters | % Commuters |
| Less than 5 Minutes | 0 | 0.0% |
| 5 to 9 Minutes | 16 | 10.5% |
| 10 to 14 Minutes | 15 | 9.9% |
| 15 to 19 Minutes | 65 | 42.8% |
| 20 to 24 Minutes | 8 | 5.3% |
| 25 to 29 Minutes | 16 | 10.5% |
| 30 to 34 Minutes | 6 | 4.0% |
| 35 to 39 Minutes | 0 | 0.0% |
| 40 to 44 Minutes | 8 | 5.3% |
| 45 to 59 Minutes | 4 | 2.6% |
| 60 to 89 Minutes | 6 | 4.0% |
| 90 or more Minutes | 8 | 5.3% |
Commute Time by Sex in Wilburton Number One
The most common commute times in Wilburton Number One are 15 to 19 minutes (19 commuters, 31.7%) for males and 15 to 19 minutes (46 commuters, 50.0%) for females.
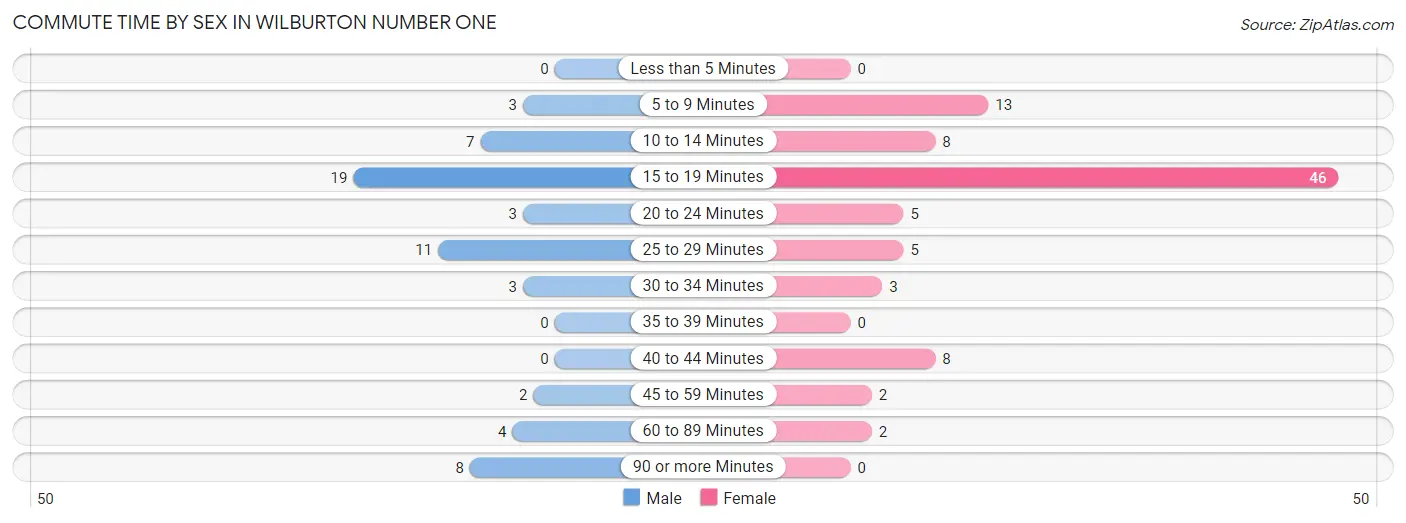
| Commute Time | Male | Female |
| Less than 5 Minutes | 0 (0.0%) | 0 (0.0%) |
| 5 to 9 Minutes | 3 (5.0%) | 13 (14.1%) |
| 10 to 14 Minutes | 7 (11.7%) | 8 (8.7%) |
| 15 to 19 Minutes | 19 (31.7%) | 46 (50.0%) |
| 20 to 24 Minutes | 3 (5.0%) | 5 (5.4%) |
| 25 to 29 Minutes | 11 (18.3%) | 5 (5.4%) |
| 30 to 34 Minutes | 3 (5.0%) | 3 (3.3%) |
| 35 to 39 Minutes | 0 (0.0%) | 0 (0.0%) |
| 40 to 44 Minutes | 0 (0.0%) | 8 (8.7%) |
| 45 to 59 Minutes | 2 (3.3%) | 2 (2.2%) |
| 60 to 89 Minutes | 4 (6.7%) | 2 (2.2%) |
| 90 or more Minutes | 8 (13.3%) | 0 (0.0%) |
Time of Departure to Work by Sex in Wilburton Number One
The most frequent times of departure to work in Wilburton Number One are 7:00 AM to 7:29 AM (28, 46.7%) for males and 7:00 AM to 7:29 AM (24, 26.1%) for females.
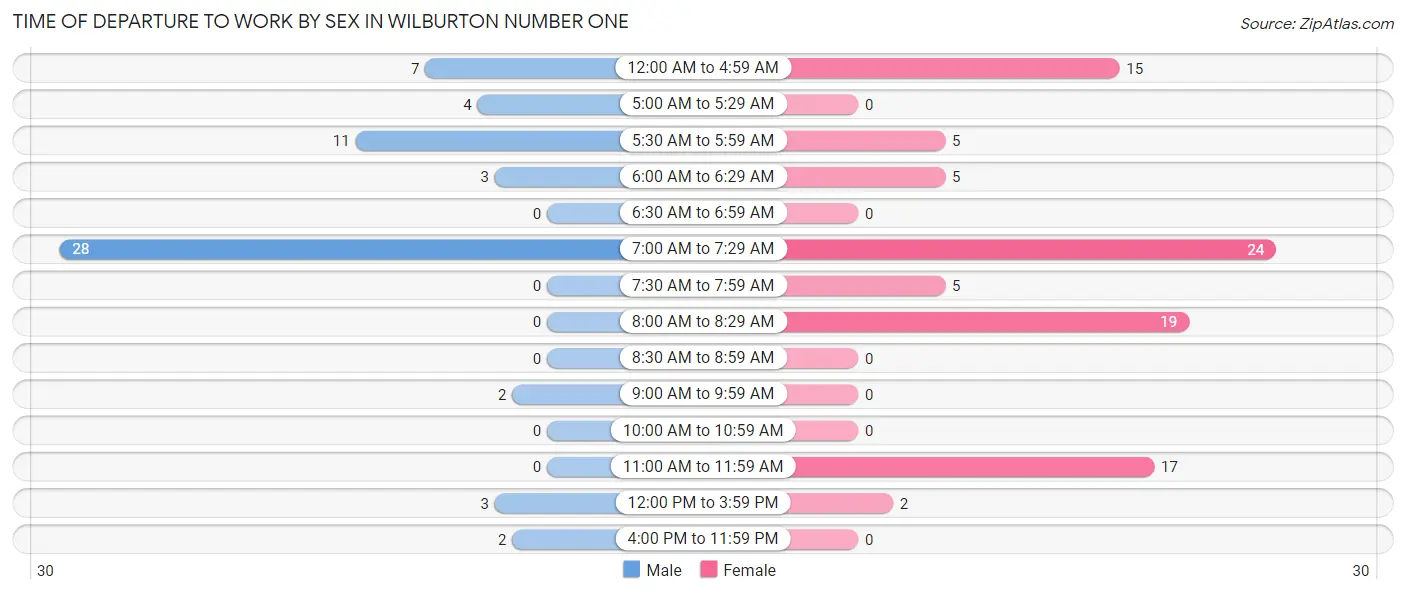
| Time of Departure | Male | Female |
| 12:00 AM to 4:59 AM | 7 (11.7%) | 15 (16.3%) |
| 5:00 AM to 5:29 AM | 4 (6.7%) | 0 (0.0%) |
| 5:30 AM to 5:59 AM | 11 (18.3%) | 5 (5.4%) |
| 6:00 AM to 6:29 AM | 3 (5.0%) | 5 (5.4%) |
| 6:30 AM to 6:59 AM | 0 (0.0%) | 0 (0.0%) |
| 7:00 AM to 7:29 AM | 28 (46.7%) | 24 (26.1%) |
| 7:30 AM to 7:59 AM | 0 (0.0%) | 5 (5.4%) |
| 8:00 AM to 8:29 AM | 0 (0.0%) | 19 (20.6%) |
| 8:30 AM to 8:59 AM | 0 (0.0%) | 0 (0.0%) |
| 9:00 AM to 9:59 AM | 2 (3.3%) | 0 (0.0%) |
| 10:00 AM to 10:59 AM | 0 (0.0%) | 0 (0.0%) |
| 11:00 AM to 11:59 AM | 0 (0.0%) | 17 (18.5%) |
| 12:00 PM to 3:59 PM | 3 (5.0%) | 2 (2.2%) |
| 4:00 PM to 11:59 PM | 2 (3.3%) | 0 (0.0%) |
| Total | 60 (100.0%) | 92 (100.0%) |
Housing Occupancy in Wilburton Number One
Occupancy by Ownership in Wilburton Number One
Of the total 129 dwellings in Wilburton Number One, owner-occupied units account for 115 (89.1%), while renter-occupied units make up 14 (10.8%).
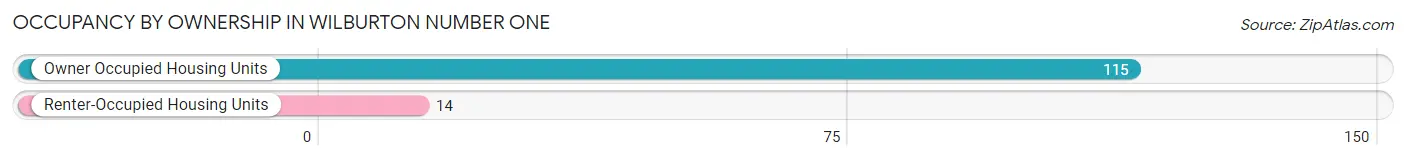
| Occupancy | # Housing Units | % Housing Units |
| Owner Occupied Housing Units | 115 | 89.1% |
| Renter-Occupied Housing Units | 14 | 10.8% |
| Total Occupied Housing Units | 129 | 100.0% |
Occupancy by Household Size in Wilburton Number One
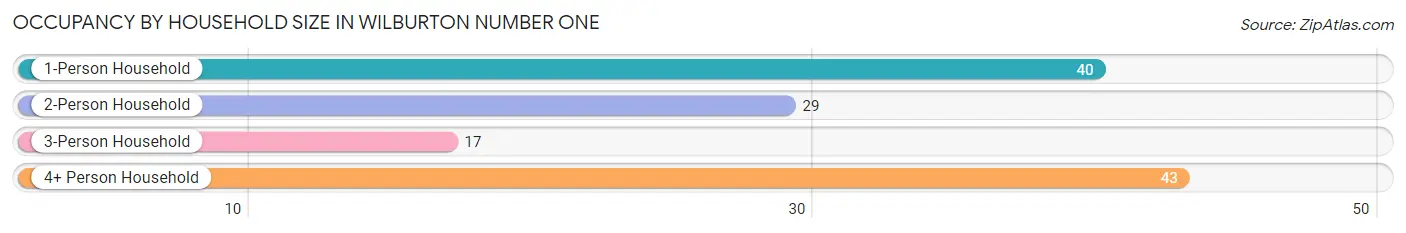
| Household Size | # Housing Units | % Housing Units |
| 1-Person Household | 40 | 31.0% |
| 2-Person Household | 29 | 22.5% |
| 3-Person Household | 17 | 13.2% |
| 4+ Person Household | 43 | 33.3% |
| Total Housing Units | 129 | 100.0% |
Occupancy by Ownership by Household Size in Wilburton Number One
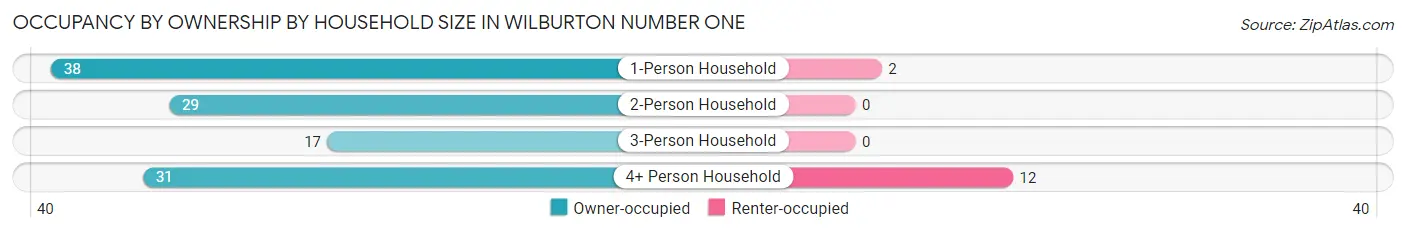
| Household Size | Owner-occupied | Renter-occupied |
| 1-Person Household | 38 (95.0%) | 2 (5.0%) |
| 2-Person Household | 29 (100.0%) | 0 (0.0%) |
| 3-Person Household | 17 (100.0%) | 0 (0.0%) |
| 4+ Person Household | 31 (72.1%) | 12 (27.9%) |
| Total Housing Units | 115 (89.1%) | 14 (10.8%) |
Occupancy by Educational Attainment in Wilburton Number One
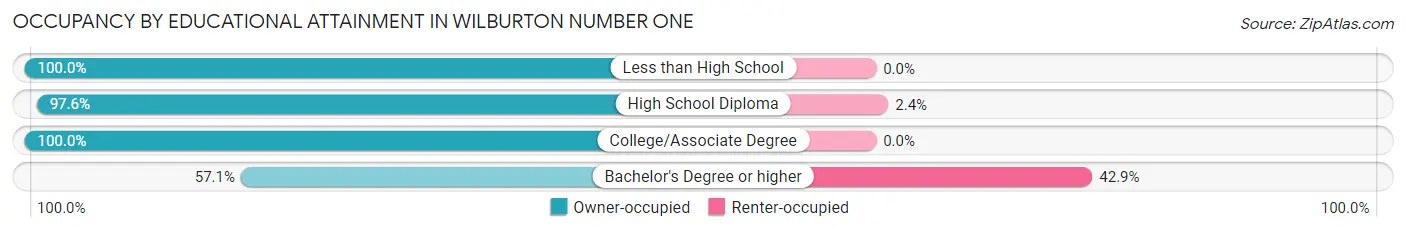
| Household Size | Owner-occupied | Renter-occupied |
| Less than High School | 4 (100.0%) | 0 (0.0%) |
| High School Diploma | 81 (97.6%) | 2 (2.4%) |
| College/Associate Degree | 14 (100.0%) | 0 (0.0%) |
| Bachelor's Degree or higher | 16 (57.1%) | 12 (42.9%) |
Occupancy by Age of Householder in Wilburton Number One
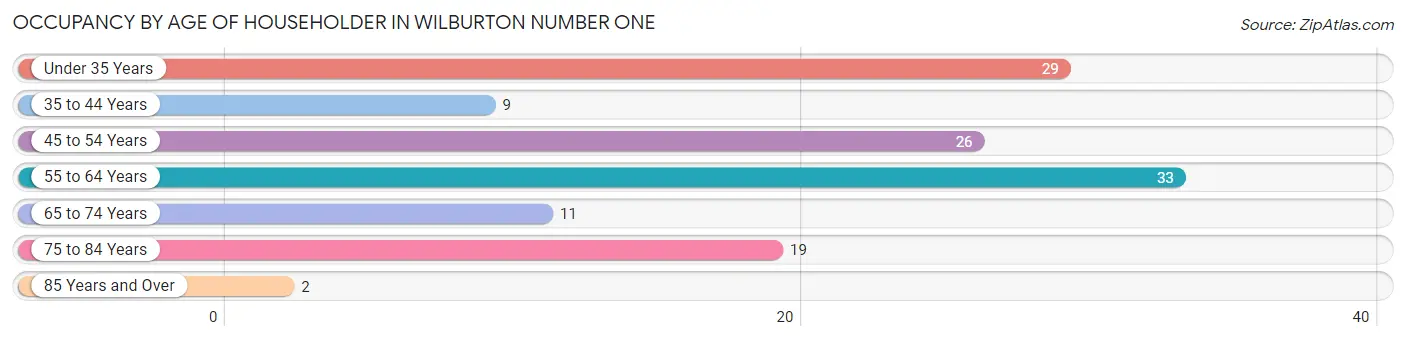
| Age Bracket | # Households | % Households |
| Under 35 Years | 29 | 22.5% |
| 35 to 44 Years | 9 | 7.0% |
| 45 to 54 Years | 26 | 20.2% |
| 55 to 64 Years | 33 | 25.6% |
| 65 to 74 Years | 11 | 8.5% |
| 75 to 84 Years | 19 | 14.7% |
| 85 Years and Over | 2 | 1.5% |
| Total | 129 | 100.0% |
Housing Finances in Wilburton Number One
Median Income by Occupancy in Wilburton Number One
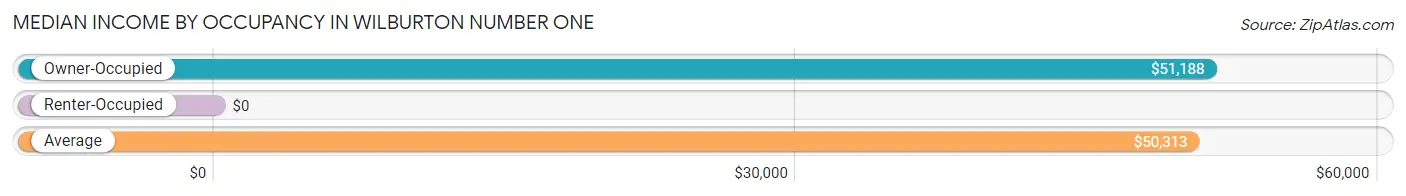
| Occupancy Type | # Households | Median Income |
| Owner-Occupied | 115 (89.1%) | $51,188 |
| Renter-Occupied | 14 (10.8%) | $0 |
| Average | 129 (100.0%) | $50,313 |
Occupancy by Householder Income Bracket in Wilburton Number One
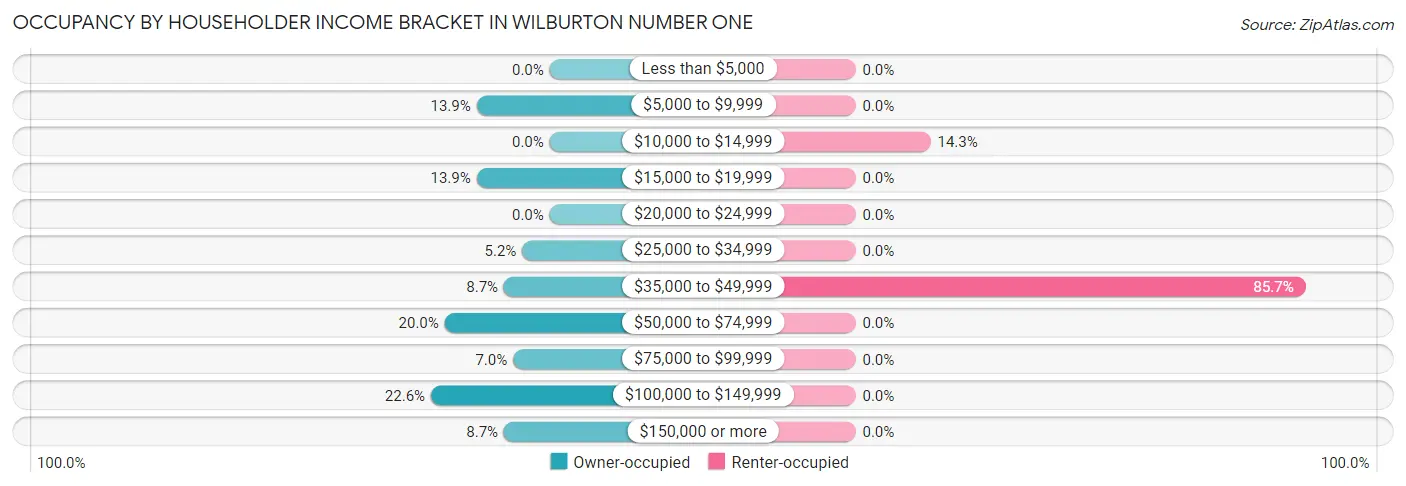
| Income Bracket | Owner-occupied | Renter-occupied |
| Less than $5,000 | 0 (0.0%) | 0 (0.0%) |
| $5,000 to $9,999 | 16 (13.9%) | 0 (0.0%) |
| $10,000 to $14,999 | 0 (0.0%) | 2 (14.3%) |
| $15,000 to $19,999 | 16 (13.9%) | 0 (0.0%) |
| $20,000 to $24,999 | 0 (0.0%) | 0 (0.0%) |
| $25,000 to $34,999 | 6 (5.2%) | 0 (0.0%) |
| $35,000 to $49,999 | 10 (8.7%) | 12 (85.7%) |
| $50,000 to $74,999 | 23 (20.0%) | 0 (0.0%) |
| $75,000 to $99,999 | 8 (7.0%) | 0 (0.0%) |
| $100,000 to $149,999 | 26 (22.6%) | 0 (0.0%) |
| $150,000 or more | 10 (8.7%) | 0 (0.0%) |
| Total | 115 (100.0%) | 14 (100.0%) |
Monthly Housing Cost Tiers in Wilburton Number One
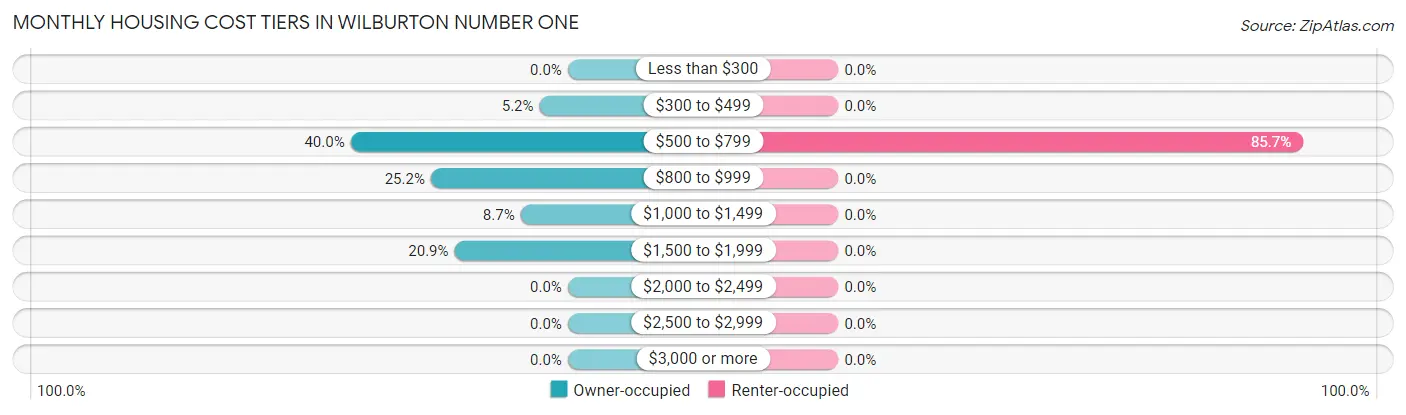
| Monthly Cost | Owner-occupied | Renter-occupied |
| Less than $300 | 0 (0.0%) | 0 (0.0%) |
| $300 to $499 | 6 (5.2%) | 0 (0.0%) |
| $500 to $799 | 46 (40.0%) | 12 (85.7%) |
| $800 to $999 | 29 (25.2%) | 0 (0.0%) |
| $1,000 to $1,499 | 10 (8.7%) | 0 (0.0%) |
| $1,500 to $1,999 | 24 (20.9%) | 0 (0.0%) |
| $2,000 to $2,499 | 0 (0.0%) | 0 (0.0%) |
| $2,500 to $2,999 | 0 (0.0%) | 0 (0.0%) |
| $3,000 or more | 0 (0.0%) | 0 (0.0%) |
| Total | 115 (100.0%) | 14 (100.0%) |
Physical Housing Characteristics in Wilburton Number One
Housing Structures in Wilburton Number One
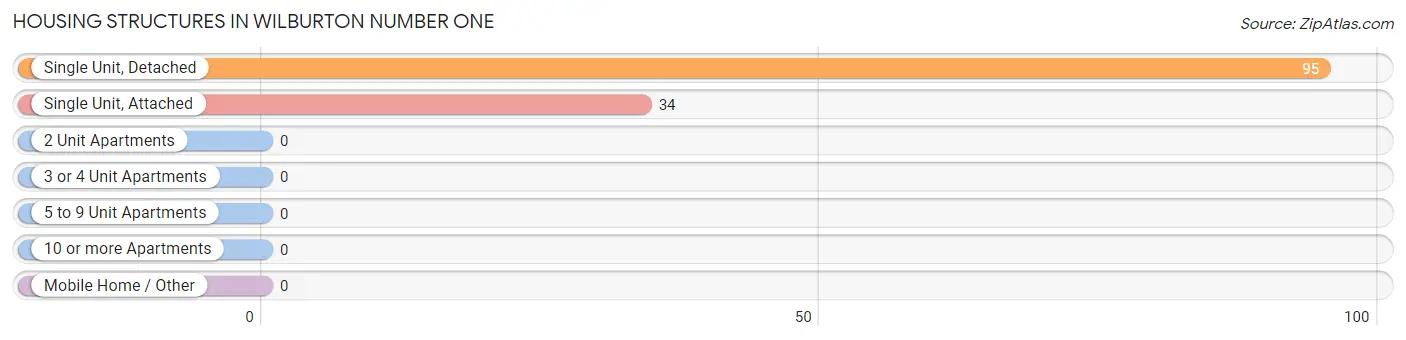
| Structure Type | # Housing Units | % Housing Units |
| Single Unit, Detached | 95 | 73.6% |
| Single Unit, Attached | 34 | 26.4% |
| 2 Unit Apartments | 0 | 0.0% |
| 3 or 4 Unit Apartments | 0 | 0.0% |
| 5 to 9 Unit Apartments | 0 | 0.0% |
| 10 or more Apartments | 0 | 0.0% |
| Mobile Home / Other | 0 | 0.0% |
| Total | 129 | 100.0% |
Housing Structures by Occupancy in Wilburton Number One
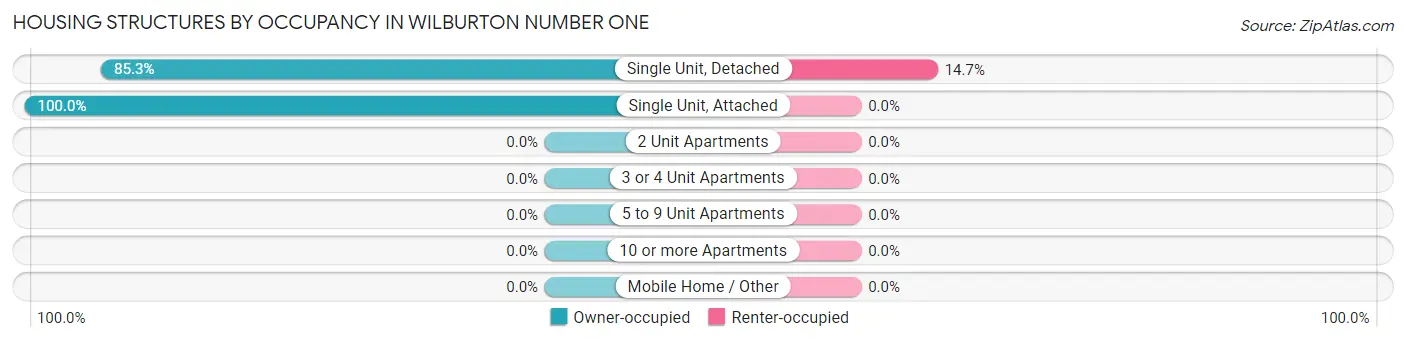
| Structure Type | Owner-occupied | Renter-occupied |
| Single Unit, Detached | 81 (85.3%) | 14 (14.7%) |
| Single Unit, Attached | 34 (100.0%) | 0 (0.0%) |
| 2 Unit Apartments | 0 (0.0%) | 0 (0.0%) |
| 3 or 4 Unit Apartments | 0 (0.0%) | 0 (0.0%) |
| 5 to 9 Unit Apartments | 0 (0.0%) | 0 (0.0%) |
| 10 or more Apartments | 0 (0.0%) | 0 (0.0%) |
| Mobile Home / Other | 0 (0.0%) | 0 (0.0%) |
| Total | 115 (89.1%) | 14 (10.8%) |
Housing Structures by Number of Rooms in Wilburton Number One
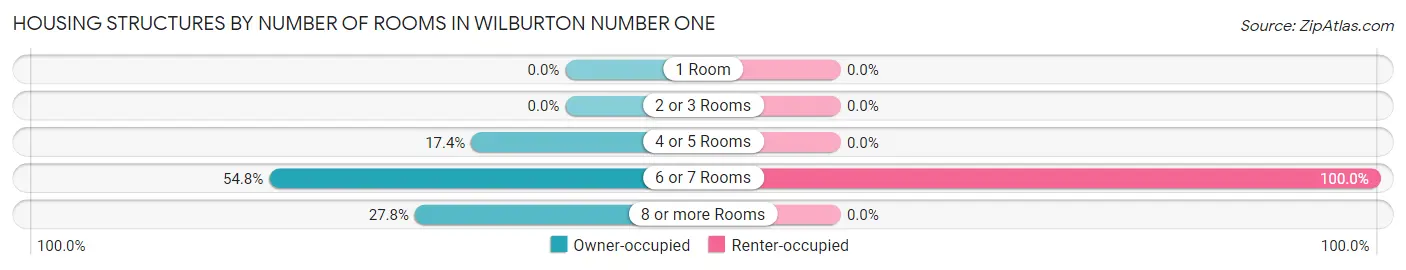
| Number of Rooms | Owner-occupied | Renter-occupied |
| 1 Room | 0 (0.0%) | 0 (0.0%) |
| 2 or 3 Rooms | 0 (0.0%) | 0 (0.0%) |
| 4 or 5 Rooms | 20 (17.4%) | 0 (0.0%) |
| 6 or 7 Rooms | 63 (54.8%) | 14 (100.0%) |
| 8 or more Rooms | 32 (27.8%) | 0 (0.0%) |
| Total | 115 (100.0%) | 14 (100.0%) |
Housing Structure by Heating Type in Wilburton Number One
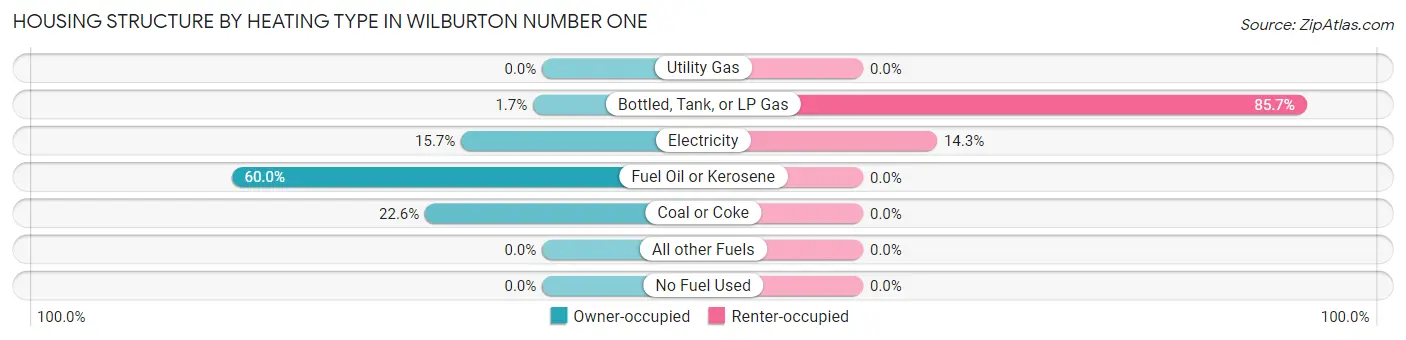
| Heating Type | Owner-occupied | Renter-occupied |
| Utility Gas | 0 (0.0%) | 0 (0.0%) |
| Bottled, Tank, or LP Gas | 2 (1.7%) | 12 (85.7%) |
| Electricity | 18 (15.7%) | 2 (14.3%) |
| Fuel Oil or Kerosene | 69 (60.0%) | 0 (0.0%) |
| Coal or Coke | 26 (22.6%) | 0 (0.0%) |
| All other Fuels | 0 (0.0%) | 0 (0.0%) |
| No Fuel Used | 0 (0.0%) | 0 (0.0%) |
| Total | 115 (100.0%) | 14 (100.0%) |
Household Vehicle Usage in Wilburton Number One
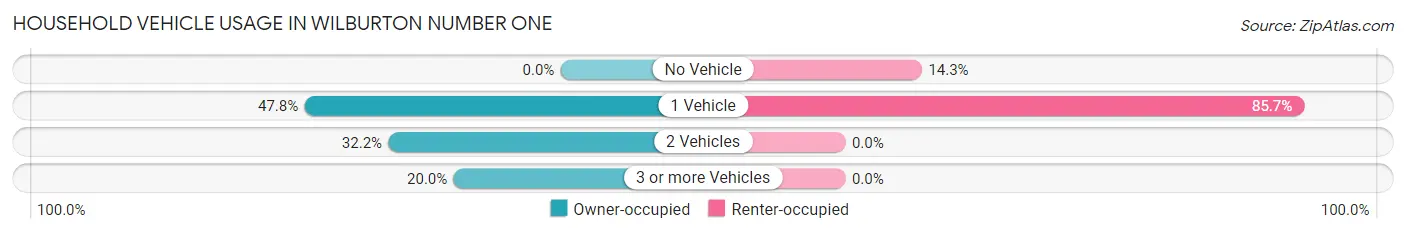
| Vehicles per Household | Owner-occupied | Renter-occupied |
| No Vehicle | 0 (0.0%) | 2 (14.3%) |
| 1 Vehicle | 55 (47.8%) | 12 (85.7%) |
| 2 Vehicles | 37 (32.2%) | 0 (0.0%) |
| 3 or more Vehicles | 23 (20.0%) | 0 (0.0%) |
| Total | 115 (100.0%) | 14 (100.0%) |
Real Estate & Mortgages in Wilburton Number One
Real Estate and Mortgage Overview in Wilburton Number One
| Characteristic | Without Mortgage | With Mortgage |
| Housing Units | 54 | 61 |
| Median Property Value | $84,400 | $0 |
| Median Household Income | $45,833 | $2 |
| Monthly Housing Costs | $581 | $0 |
| Real Estate Taxes | $1,848 | $0 |
Property Value by Mortgage Status in Wilburton Number One
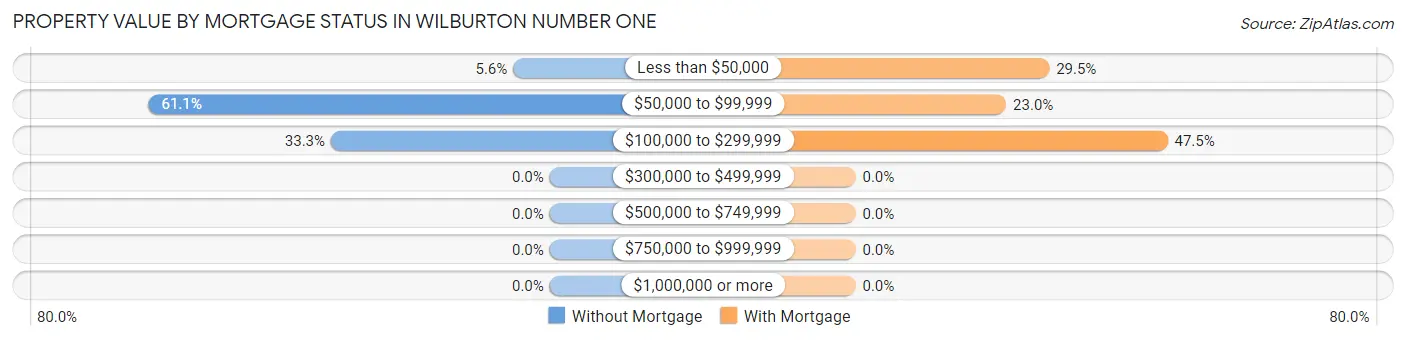
| Property Value | Without Mortgage | With Mortgage |
| Less than $50,000 | 3 (5.6%) | 18 (29.5%) |
| $50,000 to $99,999 | 33 (61.1%) | 14 (23.0%) |
| $100,000 to $299,999 | 18 (33.3%) | 29 (47.5%) |
| $300,000 to $499,999 | 0 (0.0%) | 0 (0.0%) |
| $500,000 to $749,999 | 0 (0.0%) | 0 (0.0%) |
| $750,000 to $999,999 | 0 (0.0%) | 0 (0.0%) |
| $1,000,000 or more | 0 (0.0%) | 0 (0.0%) |
| Total | 54 (100.0%) | 61 (100.0%) |
Household Income by Mortgage Status in Wilburton Number One
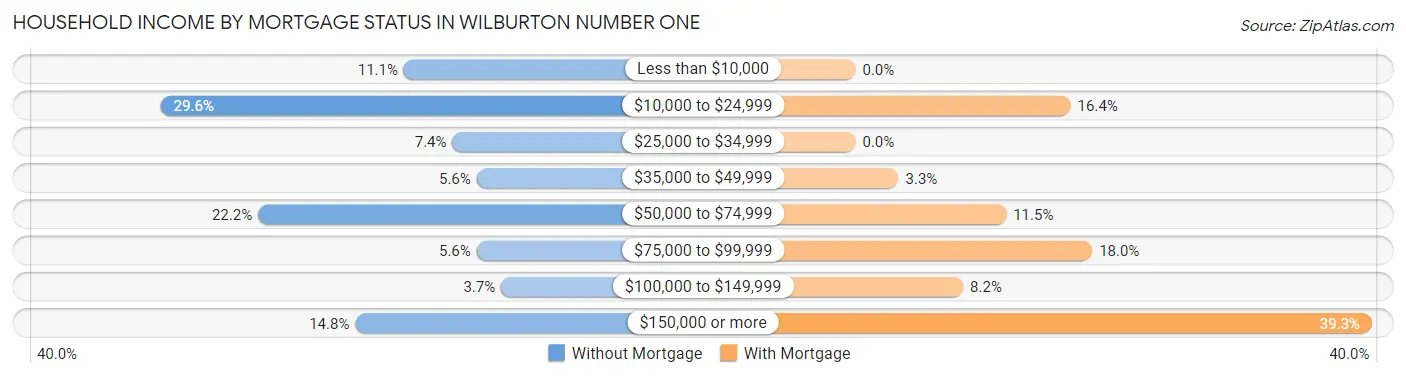
| Household Income | Without Mortgage | With Mortgage |
| Less than $10,000 | 6 (11.1%) | 0 (0.0%) |
| $10,000 to $24,999 | 16 (29.6%) | 10 (16.4%) |
| $25,000 to $34,999 | 4 (7.4%) | 0 (0.0%) |
| $35,000 to $49,999 | 3 (5.6%) | 2 (3.3%) |
| $50,000 to $74,999 | 12 (22.2%) | 7 (11.5%) |
| $75,000 to $99,999 | 3 (5.6%) | 11 (18.0%) |
| $100,000 to $149,999 | 2 (3.7%) | 5 (8.2%) |
| $150,000 or more | 8 (14.8%) | 24 (39.3%) |
| Total | 54 (100.0%) | 61 (100.0%) |
Property Value to Household Income Ratio in Wilburton Number One
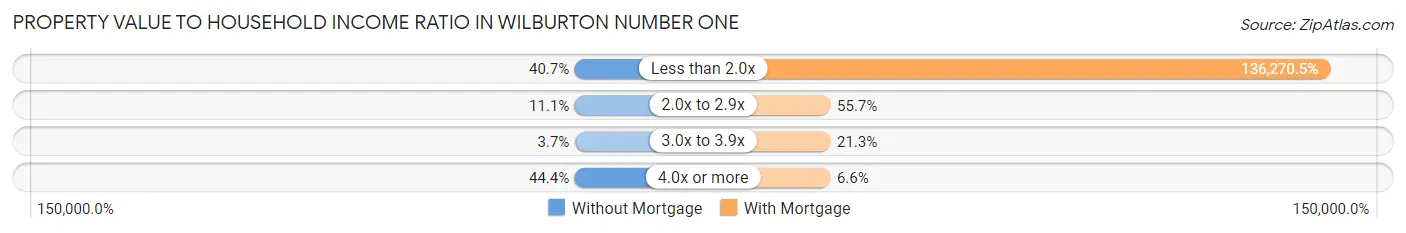
| Value-to-Income Ratio | Without Mortgage | With Mortgage |
| Less than 2.0x | 22 (40.7%) | 83,125 (136,270.5%) |
| 2.0x to 2.9x | 6 (11.1%) | 34 (55.7%) |
| 3.0x to 3.9x | 2 (3.7%) | 13 (21.3%) |
| 4.0x or more | 24 (44.4%) | 4 (6.6%) |
| Total | 54 (100.0%) | 61 (100.0%) |
Real Estate Taxes by Mortgage Status in Wilburton Number One
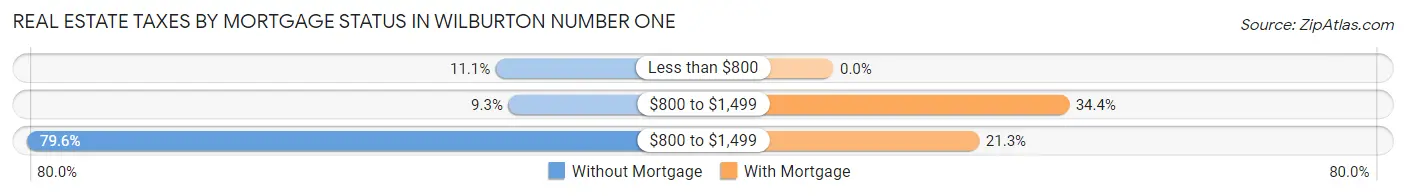
| Property Taxes | Without Mortgage | With Mortgage |
| Less than $800 | 6 (11.1%) | 0 (0.0%) |
| $800 to $1,499 | 5 (9.3%) | 21 (34.4%) |
| $800 to $1,499 | 43 (79.6%) | 13 (21.3%) |
| Total | 54 (100.0%) | 61 (100.0%) |
Health & Disability in Wilburton Number One
Health Insurance Coverage by Age in Wilburton Number One
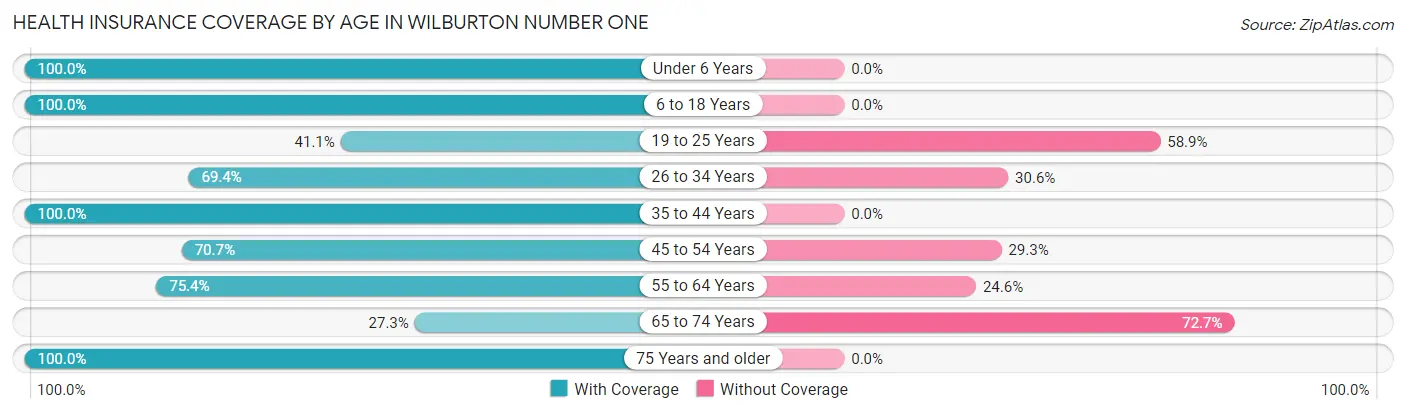
| Age Bracket | With Coverage | Without Coverage |
| Under 6 Years | 27 (100.0%) | 0 (0.0%) |
| 6 to 18 Years | 85 (100.0%) | 0 (0.0%) |
| 19 to 25 Years | 23 (41.1%) | 33 (58.9%) |
| 26 to 34 Years | 25 (69.4%) | 11 (30.6%) |
| 35 to 44 Years | 20 (100.0%) | 0 (0.0%) |
| 45 to 54 Years | 41 (70.7%) | 17 (29.3%) |
| 55 to 64 Years | 43 (75.4%) | 14 (24.6%) |
| 65 to 74 Years | 3 (27.3%) | 8 (72.7%) |
| 75 Years and older | 29 (100.0%) | 0 (0.0%) |
| Total | 296 (78.1%) | 83 (21.9%) |
Health Insurance Coverage by Citizenship Status in Wilburton Number One
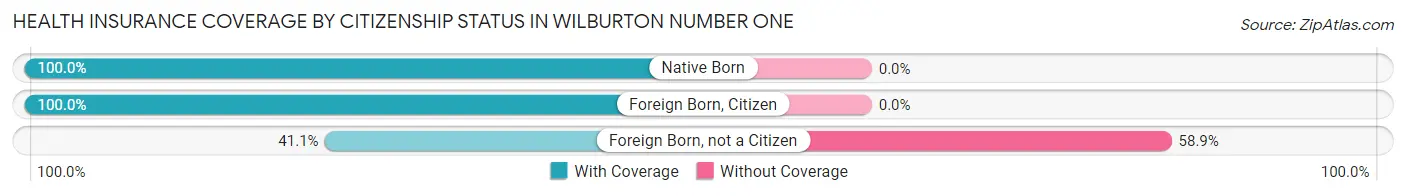
| Citizenship Status | With Coverage | Without Coverage |
| Native Born | 27 (100.0%) | 0 (0.0%) |
| Foreign Born, Citizen | 85 (100.0%) | 0 (0.0%) |
| Foreign Born, not a Citizen | 23 (41.1%) | 33 (58.9%) |
Health Insurance Coverage by Household Income in Wilburton Number One
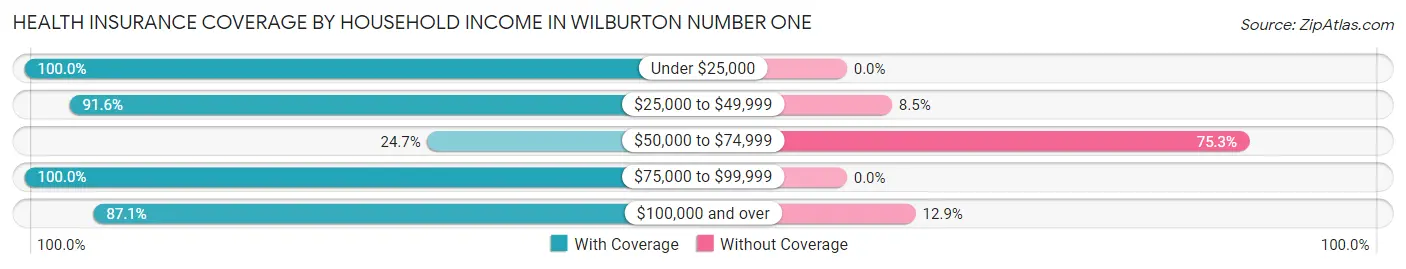
| Household Income | With Coverage | Without Coverage |
| Under $25,000 | 79 (100.0%) | 0 (0.0%) |
| $25,000 to $49,999 | 65 (91.5%) | 6 (8.5%) |
| $50,000 to $74,999 | 20 (24.7%) | 61 (75.3%) |
| $75,000 to $99,999 | 24 (100.0%) | 0 (0.0%) |
| $100,000 and over | 108 (87.1%) | 16 (12.9%) |
Public vs Private Health Insurance Coverage by Age in Wilburton Number One
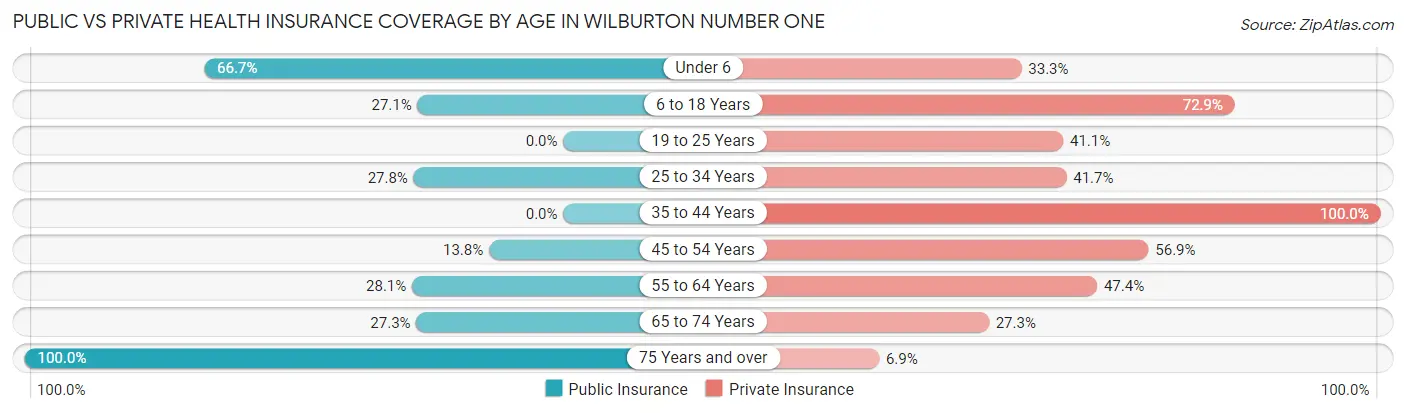
| Age Bracket | Public Insurance | Private Insurance |
| Under 6 | 18 (66.7%) | 9 (33.3%) |
| 6 to 18 Years | 23 (27.1%) | 62 (72.9%) |
| 19 to 25 Years | 0 (0.0%) | 23 (41.1%) |
| 25 to 34 Years | 10 (27.8%) | 15 (41.7%) |
| 35 to 44 Years | 0 (0.0%) | 20 (100.0%) |
| 45 to 54 Years | 8 (13.8%) | 33 (56.9%) |
| 55 to 64 Years | 16 (28.1%) | 27 (47.4%) |
| 65 to 74 Years | 3 (27.3%) | 3 (27.3%) |
| 75 Years and over | 29 (100.0%) | 2 (6.9%) |
| Total | 107 (28.2%) | 194 (51.2%) |
Disability Status by Sex by Age in Wilburton Number One
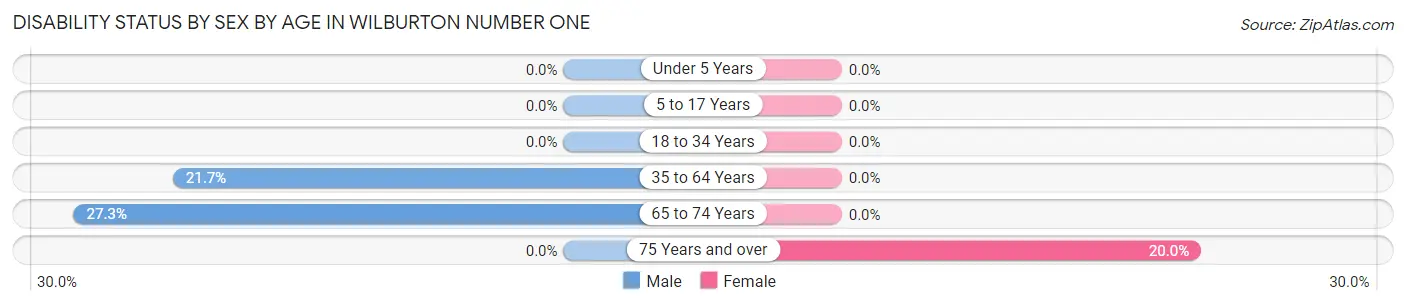
| Age Bracket | Male | Female |
| Under 5 Years | 0 (0.0%) | 0 (0.0%) |
| 5 to 17 Years | 0 (0.0%) | 0 (0.0%) |
| 18 to 34 Years | 0 (0.0%) | 0 (0.0%) |
| 35 to 64 Years | 10 (21.7%) | 0 (0.0%) |
| 65 to 74 Years | 3 (27.3%) | 0 (0.0%) |
| 75 Years and over | 0 (0.0%) | 4 (20.0%) |
Disability Class by Sex by Age in Wilburton Number One
Disability Class: Hearing Difficulty
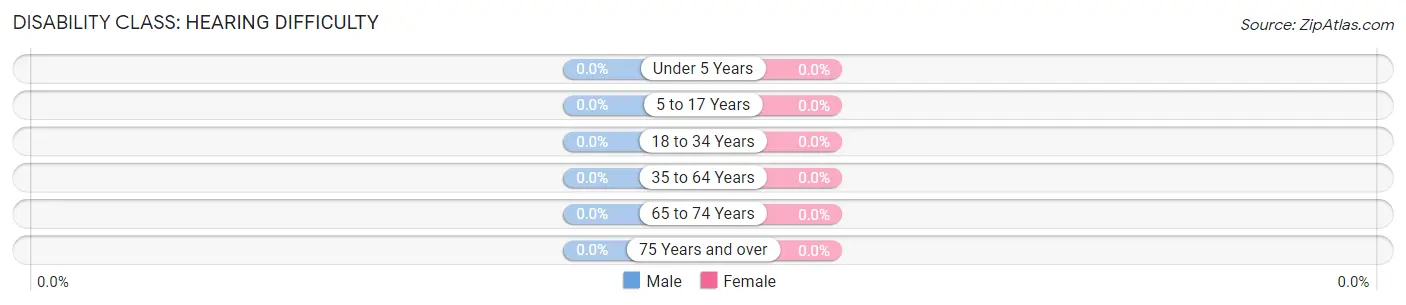
| Age Bracket | Male | Female |
| Under 5 Years | 0 (0.0%) | 0 (0.0%) |
| 5 to 17 Years | 0 (0.0%) | 0 (0.0%) |
| 18 to 34 Years | 0 (0.0%) | 0 (0.0%) |
| 35 to 64 Years | 0 (0.0%) | 0 (0.0%) |
| 65 to 74 Years | 0 (0.0%) | 0 (0.0%) |
| 75 Years and over | 0 (0.0%) | 0 (0.0%) |
Disability Class: Vision Difficulty
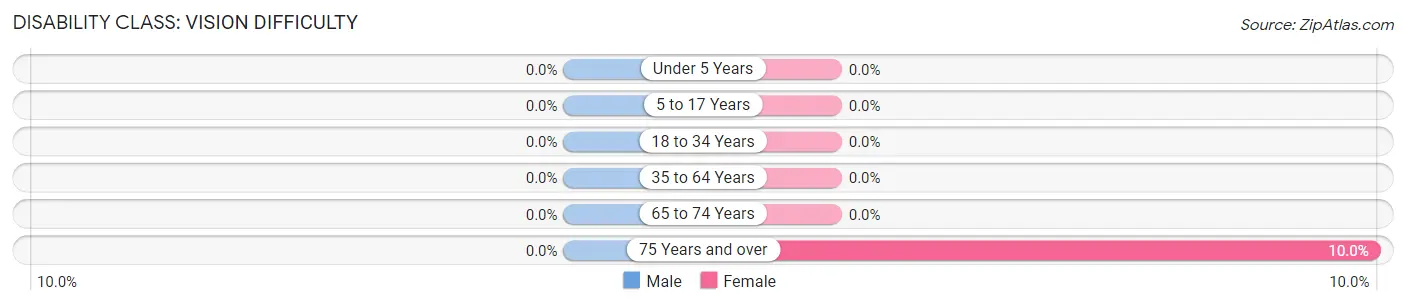
| Age Bracket | Male | Female |
| Under 5 Years | 0 (0.0%) | 0 (0.0%) |
| 5 to 17 Years | 0 (0.0%) | 0 (0.0%) |
| 18 to 34 Years | 0 (0.0%) | 0 (0.0%) |
| 35 to 64 Years | 0 (0.0%) | 0 (0.0%) |
| 65 to 74 Years | 0 (0.0%) | 0 (0.0%) |
| 75 Years and over | 0 (0.0%) | 2 (10.0%) |
Disability Class: Cognitive Difficulty
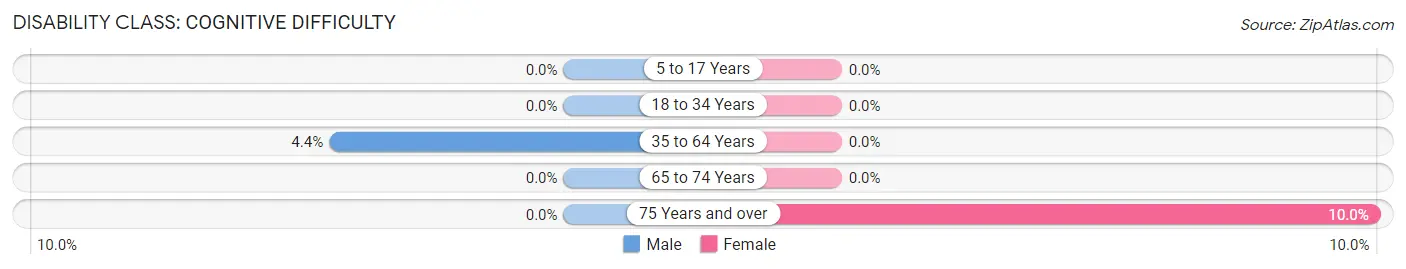
| Age Bracket | Male | Female |
| 5 to 17 Years | 0 (0.0%) | 0 (0.0%) |
| 18 to 34 Years | 0 (0.0%) | 0 (0.0%) |
| 35 to 64 Years | 2 (4.3%) | 0 (0.0%) |
| 65 to 74 Years | 0 (0.0%) | 0 (0.0%) |
| 75 Years and over | 0 (0.0%) | 2 (10.0%) |
Disability Class: Ambulatory Difficulty
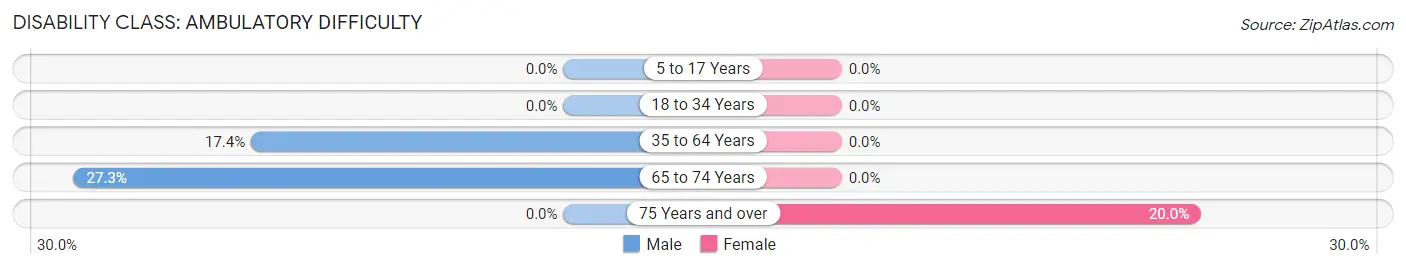
| Age Bracket | Male | Female |
| 5 to 17 Years | 0 (0.0%) | 0 (0.0%) |
| 18 to 34 Years | 0 (0.0%) | 0 (0.0%) |
| 35 to 64 Years | 8 (17.4%) | 0 (0.0%) |
| 65 to 74 Years | 3 (27.3%) | 0 (0.0%) |
| 75 Years and over | 0 (0.0%) | 4 (20.0%) |
Disability Class: Self-Care Difficulty
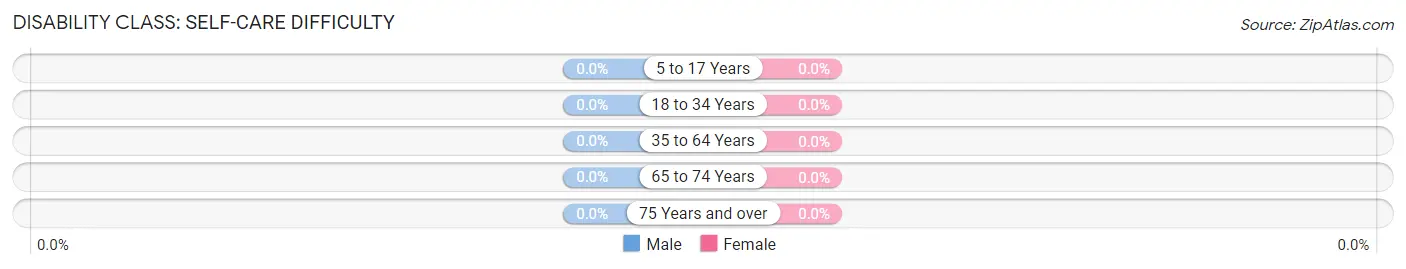
| Age Bracket | Male | Female |
| 5 to 17 Years | 0 (0.0%) | 0 (0.0%) |
| 18 to 34 Years | 0 (0.0%) | 0 (0.0%) |
| 35 to 64 Years | 0 (0.0%) | 0 (0.0%) |
| 65 to 74 Years | 0 (0.0%) | 0 (0.0%) |
| 75 Years and over | 0 (0.0%) | 0 (0.0%) |
Technology Access in Wilburton Number One
Computing Device Access in Wilburton Number One
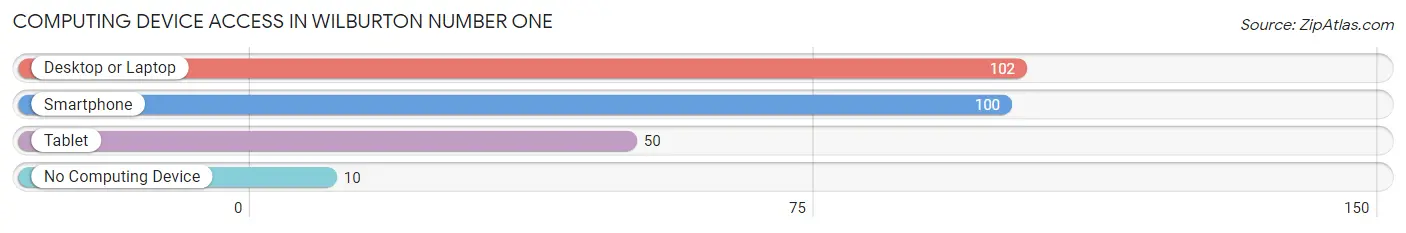
| Device Type | # Households | % Households |
| Desktop or Laptop | 102 | 79.1% |
| Smartphone | 100 | 77.5% |
| Tablet | 50 | 38.8% |
| No Computing Device | 10 | 7.7% |
| Total | 129 | 100.0% |
Internet Access in Wilburton Number One
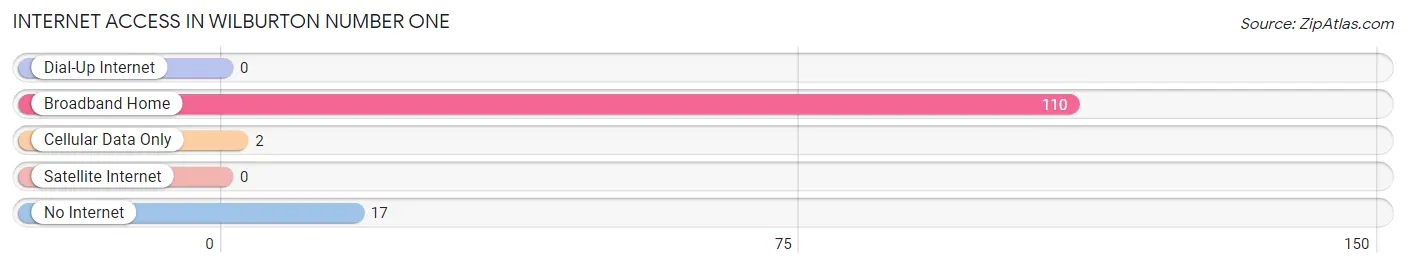
| Internet Type | # Households | % Households |
| Dial-Up Internet | 0 | 0.0% |
| Broadband Home | 110 | 85.3% |
| Cellular Data Only | 2 | 1.5% |
| Satellite Internet | 0 | 0.0% |
| No Internet | 17 | 13.2% |
| Total | 129 | 100.0% |
Wilburton Number One Summary
Wilburton Number One is a small unincorporated community located in the western part of Luzerne County, Pennsylvania. It is situated in the foothills of the Pocono Mountains, approximately 10 miles south of Wilkes-Barre. The community is home to a population of approximately 500 people, and is part of the Hazleton Metropolitan Statistical Area.
History
The area that is now Wilburton Number One was first settled in the late 1700s by a group of German immigrants. The community was originally known as “Wilburton”, after the Wilbur family who owned the land. In the early 1800s, the area was divided into two separate communities, Wilburton Number One and Wilburton Number Two. The two communities were separated by a creek, and the two sides of the creek were known as “Number One” and “Number Two”.
The community of Wilburton Number One was officially incorporated in 1845. The town was named after the Wilbur family, who were prominent landowners in the area. The town was home to a variety of businesses, including a general store, a blacksmith shop, a sawmill, and a gristmill.
Geography
Wilburton Number One is located in the western part of Luzerne County, Pennsylvania. It is situated in the foothills of the Pocono Mountains, approximately 10 miles south of Wilkes-Barre. The community is located along the banks of the Susquehanna River, and is surrounded by rolling hills and forests. The climate in Wilburton Number One is generally mild, with temperatures ranging from the low 30s in the winter to the mid-80s in the summer.
Economy
The economy of Wilburton Number One is largely based on agriculture and tourism. The area is home to several farms, which produce a variety of crops, including corn, soybeans, and hay. The community is also home to several small businesses, including a general store, a gas station, and a restaurant.
Tourism is an important part of the local economy, as the area is home to several popular attractions, including the Wilburton Number One Historical Society Museum, the Wilburton Number One Covered Bridge, and the Wilburton Number One Nature Preserve.
Demographics
As of the 2010 census, the population of Wilburton Number One was 498. The racial makeup of the community was 97.2% White, 0.6% African American, 0.2% Native American, 0.4% Asian, and 1.6% from other races. The median household income was $45,000, and the median age was 44.
Wilburton Number One is a small, close-knit community with a strong sense of community and pride. The community is home to a variety of churches, including the Wilburton Number One United Methodist Church, the Wilburton Number One Presbyterian Church, and the Wilburton Number One Baptist Church. The community also hosts a variety of events throughout the year, including the Wilburton Number One Summer Festival and the Wilburton Number One Fall Festival.
Common Questions
What is Per Capita Income in Wilburton Number One?
Per Capita income in Wilburton Number One is $24,969.
What is the Median Household income in Wilburton Number One?
Median Household Income in Wilburton Number One is $50,313.
What is Income or Wage Gap in Wilburton Number One?
Income or Wage Gap in Wilburton Number One is 43.5%.
Women in Wilburton Number One earn 56.5 cents for every dollar earned by a man.
What is Inequality or Gini Index in Wilburton Number One?
Inequality or Gini Index in Wilburton Number One is 0.45.
What is the Total Population of Wilburton Number One?
Total Population of Wilburton Number One is 379.
What is the Total Male Population of Wilburton Number One?
Total Male Population of Wilburton Number One is 174.
What is the Total Female Population of Wilburton Number One?
Total Female Population of Wilburton Number One is 205.
What is the Ratio of Males per 100 Females in Wilburton Number One?
There are 84.88 Males per 100 Females in Wilburton Number One.
What is the Ratio of Females per 100 Males in Wilburton Number One?
There are 117.82 Females per 100 Males in Wilburton Number One.
What is the Median Population Age in Wilburton Number One?
Median Population Age in Wilburton Number One is 31.7 Years.
What is the Average Family Size in Wilburton Number One
Average Family Size in Wilburton Number One is 3.8 People.
What is the Average Household Size in Wilburton Number One
Average Household Size in Wilburton Number One is 2.9 People.
How Large is the Labor Force in Wilburton Number One?
There are 176 People in the Labor Forcein in Wilburton Number One.
What is the Percentage of People in the Labor Force in Wilburton Number One?
60.3% of People are in the Labor Force in Wilburton Number One.
What is the Unemployment Rate in Wilburton Number One?
Unemployment Rate in Wilburton Number One is 10.2%.