Williamsport, PA Map & Demographics
Williamsport Map
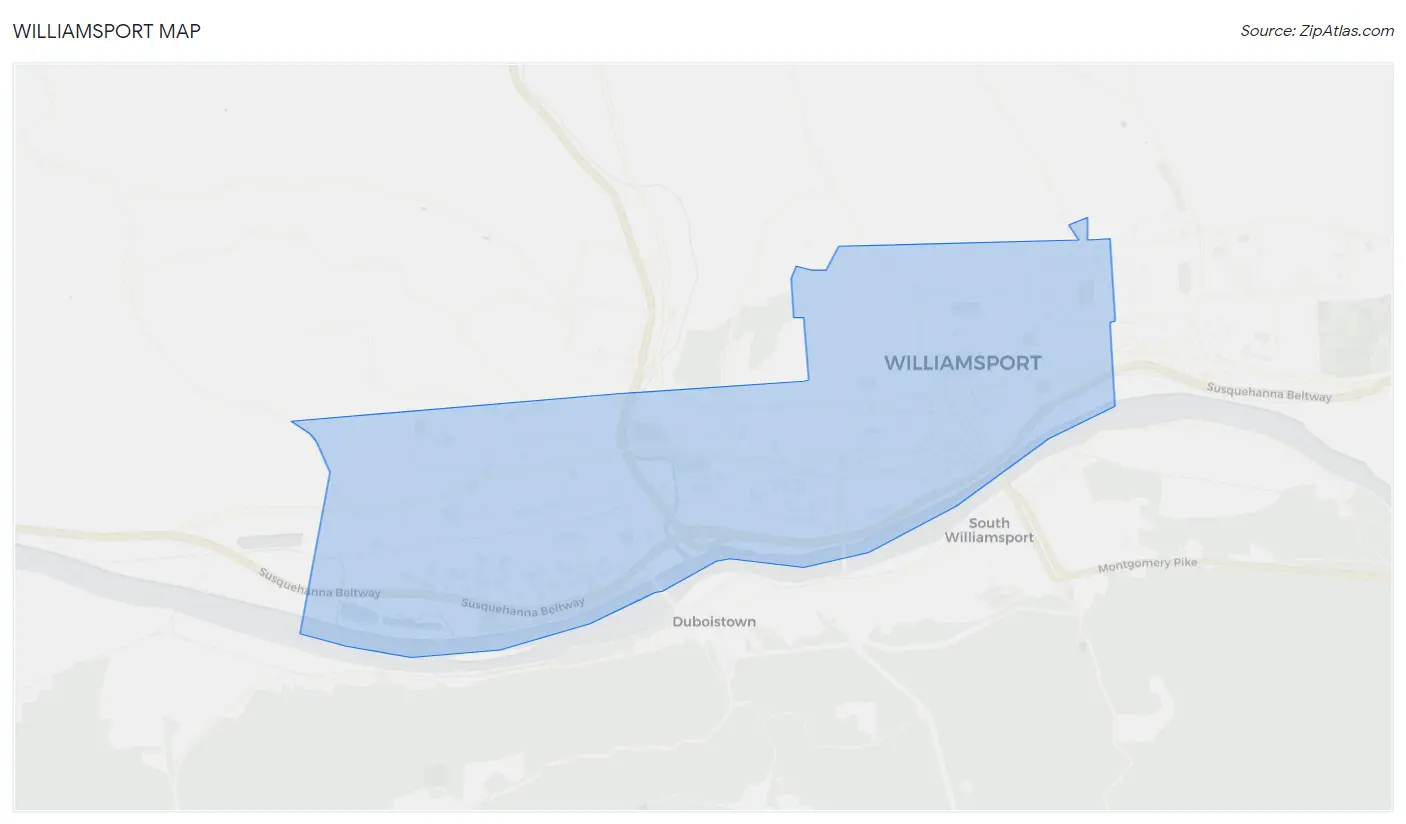
Williamsport Overview
$25,962
PER CAPITA INCOME
$62,214
AVG FAMILY INCOME
$48,388
AVG HOUSEHOLD INCOME
13.0%
WAGE / INCOME GAP [ % ]
87.0¢/ $1
WAGE / INCOME GAP [ $ ]
$12,373
FAMILY INCOME DEFICIT
0.47
INEQUALITY / GINI INDEX
27,755
TOTAL POPULATION
13,938
MALE POPULATION
13,817
FEMALE POPULATION
100.88
MALES / 100 FEMALES
99.13
FEMALES / 100 MALES
30.3
MEDIAN AGE
3.0
AVG FAMILY SIZE
2.2
AVG HOUSEHOLD SIZE
13,471
LABOR FORCE [ PEOPLE ]
59.3%
PERCENT IN LABOR FORCE
6.5%
UNEMPLOYMENT RATE
Williamsport Area Codes
Income in Williamsport
Income Overview in Williamsport
Per Capita Income in Williamsport is $25,962, while median incomes of families and households are $62,214 and $48,388 respectively.
| Characteristic | Number | Measure |
| Per Capita Income | 27,755 | $25,962 |
| Median Family Income | 5,560 | $62,214 |
| Mean Family Income | 5,560 | $76,958 |
| Median Household Income | 10,866 | $48,388 |
| Mean Household Income | 10,866 | $63,779 |
| Income Deficit | 5,560 | $12,373 |
| Wage / Income Gap (%) | 27,755 | 13.03% |
| Wage / Income Gap ($) | 27,755 | 86.97¢ per $1 |
| Gini / Inequality Index | 27,755 | 0.47 |
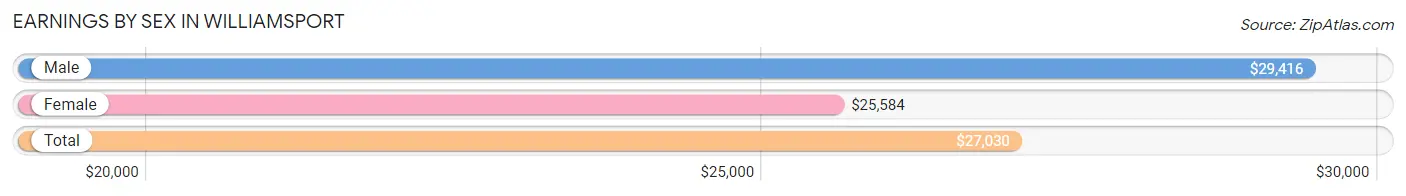
Earnings by Sex in Williamsport
Average Earnings in Williamsport are $27,030, $29,416 for men and $25,584 for women, a difference of 13.0%.
| Sex | Number | Average Earnings |
| Male | 8,031 (52.0%) | $29,416 |
| Female | 7,412 (48.0%) | $25,584 |
| Total | 15,443 (100.0%) | $27,030 |
Earnings by Sex by Income Bracket in Williamsport
The most common earnings brackets in Williamsport are $2,499 or less for men (772 | 9.6%) and $2,499 or less for women (734 | 9.9%).
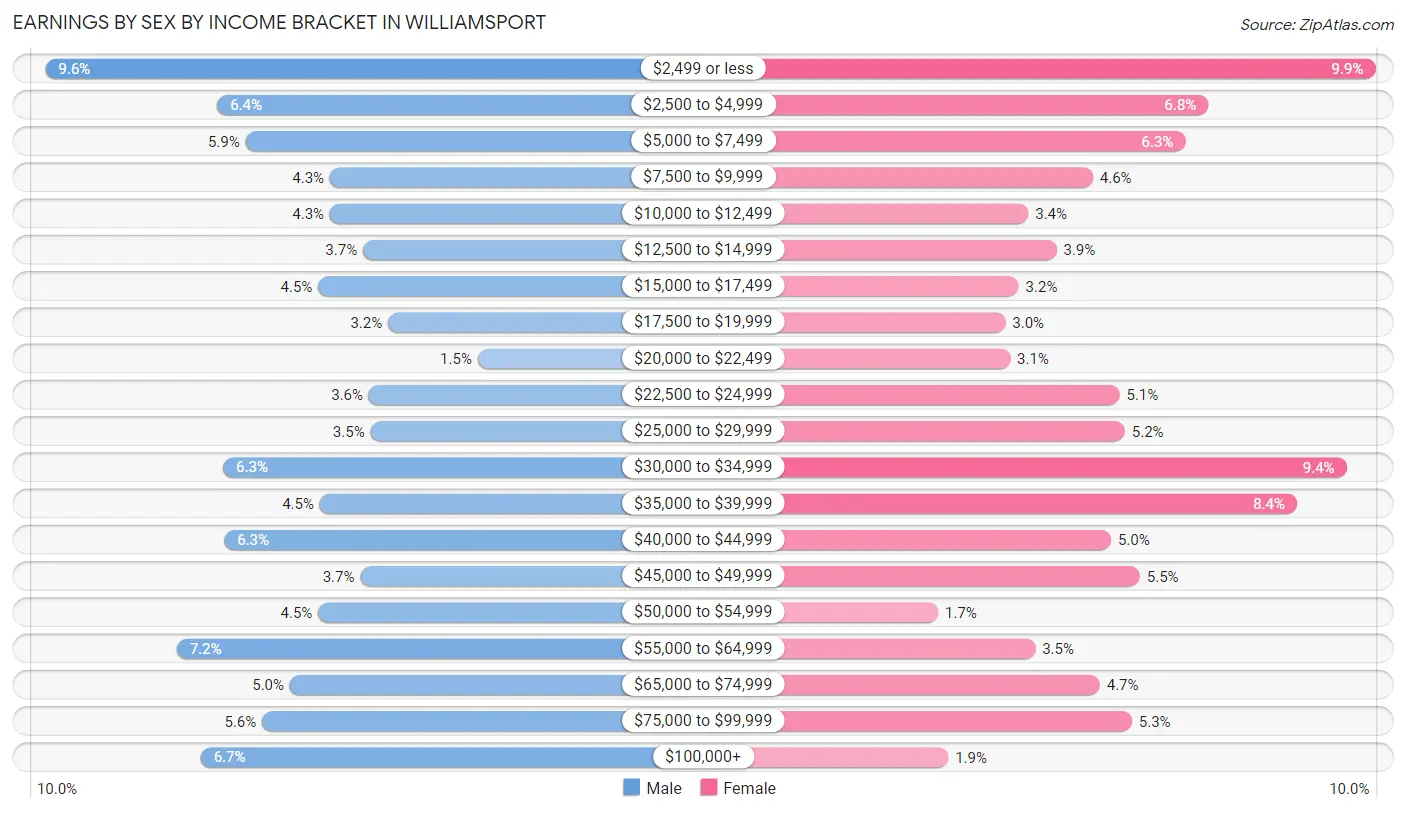
| Income | Male | Female |
| $2,499 or less | 772 (9.6%) | 734 (9.9%) |
| $2,500 to $4,999 | 513 (6.4%) | 502 (6.8%) |
| $5,000 to $7,499 | 471 (5.9%) | 470 (6.3%) |
| $7,500 to $9,999 | 344 (4.3%) | 342 (4.6%) |
| $10,000 to $12,499 | 344 (4.3%) | 252 (3.4%) |
| $12,500 to $14,999 | 294 (3.7%) | 291 (3.9%) |
| $15,000 to $17,499 | 361 (4.5%) | 239 (3.2%) |
| $17,500 to $19,999 | 256 (3.2%) | 220 (3.0%) |
| $20,000 to $22,499 | 121 (1.5%) | 227 (3.1%) |
| $22,500 to $24,999 | 285 (3.5%) | 379 (5.1%) |
| $25,000 to $29,999 | 283 (3.5%) | 386 (5.2%) |
| $30,000 to $34,999 | 504 (6.3%) | 694 (9.4%) |
| $35,000 to $39,999 | 359 (4.5%) | 625 (8.4%) |
| $40,000 to $44,999 | 503 (6.3%) | 367 (5.0%) |
| $45,000 to $49,999 | 298 (3.7%) | 407 (5.5%) |
| $50,000 to $54,999 | 361 (4.5%) | 127 (1.7%) |
| $55,000 to $64,999 | 574 (7.1%) | 262 (3.5%) |
| $65,000 to $74,999 | 404 (5.0%) | 351 (4.7%) |
| $75,000 to $99,999 | 446 (5.6%) | 396 (5.3%) |
| $100,000+ | 538 (6.7%) | 141 (1.9%) |
| Total | 8,031 (100.0%) | 7,412 (100.0%) |
Earnings by Sex by Educational Attainment in Williamsport
Average earnings in Williamsport are $42,952 for men and $33,373 for women, a difference of 22.3%. Men with an educational attainment of graduate degree enjoy the highest average annual earnings of $96,676, while those with high school diploma education earn the least with $29,542. Women with an educational attainment of graduate degree earn the most with the average annual earnings of $71,024, while those with less than high school education have the smallest earnings of $12,833.
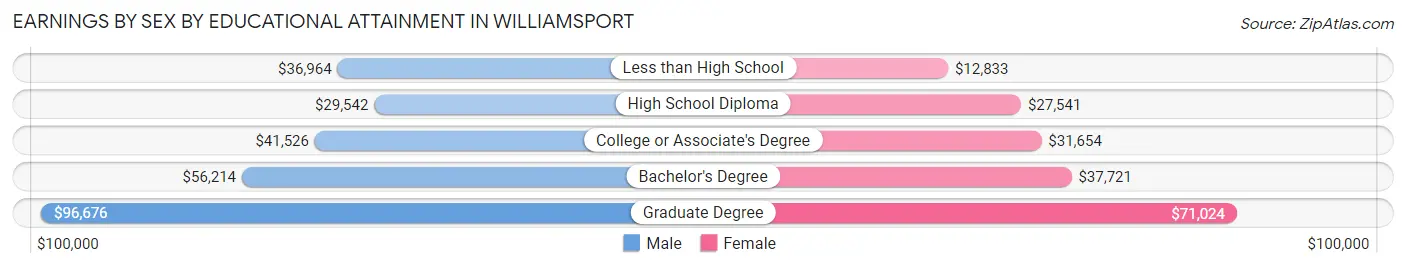
| Educational Attainment | Male Income | Female Income |
| Less than High School | $36,964 | $12,833 |
| High School Diploma | $29,542 | $27,541 |
| College or Associate's Degree | $41,526 | $31,654 |
| Bachelor's Degree | $56,214 | $37,721 |
| Graduate Degree | $96,676 | $71,024 |
| Total | $42,952 | $33,373 |
Family Income in Williamsport
Family Income Brackets in Williamsport
According to the Williamsport family income data, there are 1,106 families falling into the $50,000 to $74,999 income range, which is the most common income bracket and makes up 19.9% of all families. Conversely, the $10,000 to $14,999 income bracket is the least frequent group with only 178 families (3.2%) belonging to this category.
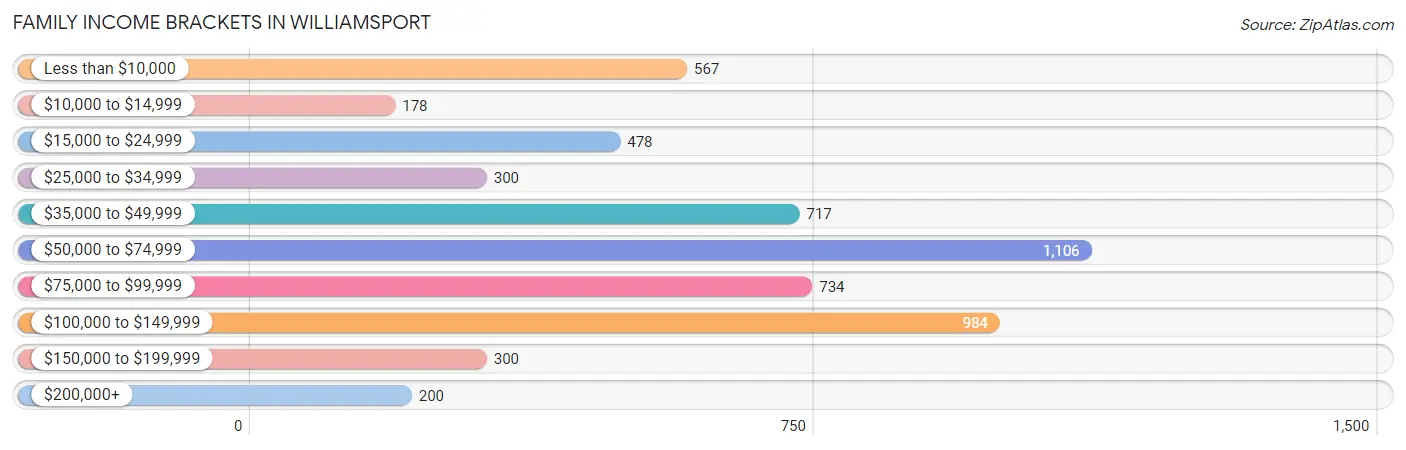
| Income Bracket | # Families | % Families |
| Less than $10,000 | 567 | 10.2% |
| $10,000 to $14,999 | 178 | 3.2% |
| $15,000 to $24,999 | 478 | 8.6% |
| $25,000 to $34,999 | 300 | 5.4% |
| $35,000 to $49,999 | 717 | 12.9% |
| $50,000 to $74,999 | 1,106 | 19.9% |
| $75,000 to $99,999 | 734 | 13.2% |
| $100,000 to $149,999 | 984 | 17.7% |
| $150,000 to $199,999 | 300 | 5.4% |
| $200,000+ | 200 | 3.6% |
Family Income by Famaliy Size in Williamsport
7+ person families (70 | 1.3%) account for the highest median family income in Williamsport with $111,563 per family, while 2-person families (3,011 | 54.1%) have the highest median income of $28,818 per family member.
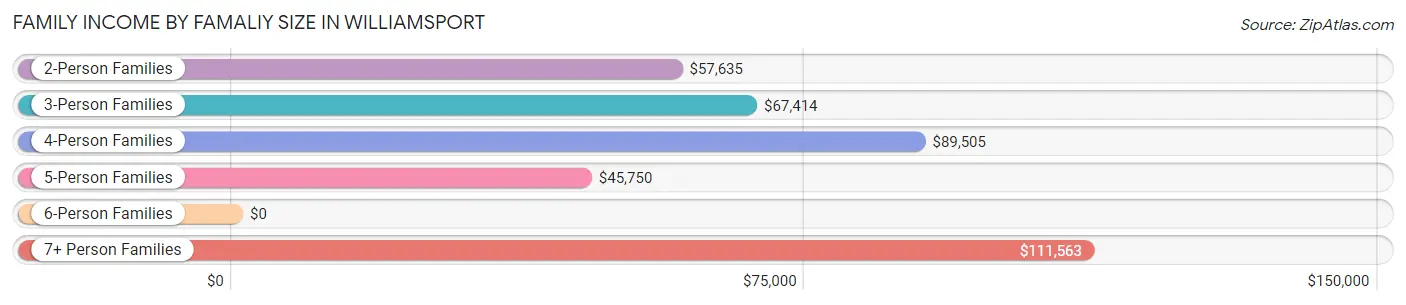
| Income Bracket | # Families | Median Income |
| 2-Person Families | 3,011 (54.1%) | $57,635 |
| 3-Person Families | 1,016 (18.3%) | $67,414 |
| 4-Person Families | 1,005 (18.1%) | $89,505 |
| 5-Person Families | 254 (4.6%) | $45,750 |
| 6-Person Families | 204 (3.7%) | $0 |
| 7+ Person Families | 70 (1.3%) | $111,563 |
| Total | 5,560 (100.0%) | $62,214 |
Family Income by Number of Earners in Williamsport
The median family income in Williamsport is $62,214, with families comprising 3+ earners (439) having the highest median family income of $118,580, while families with no earners (818) have the lowest median family income of $35,156, accounting for 7.9% and 14.7% of families, respectively.
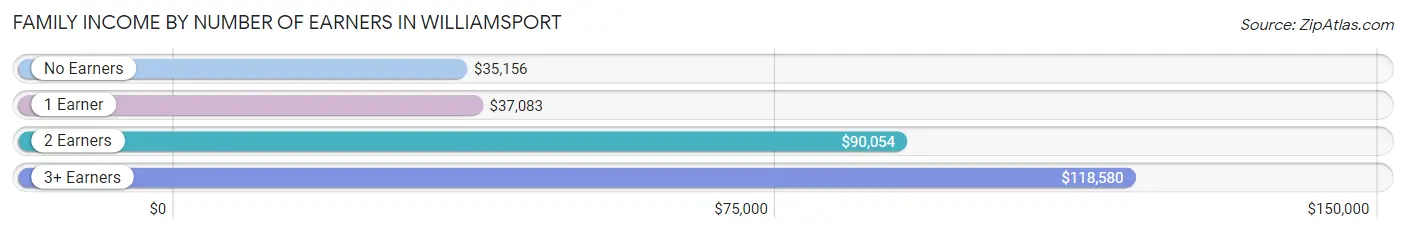
| Number of Earners | # Families | Median Income |
| No Earners | 818 (14.7%) | $35,156 |
| 1 Earner | 2,180 (39.2%) | $37,083 |
| 2 Earners | 2,123 (38.2%) | $90,054 |
| 3+ Earners | 439 (7.9%) | $118,580 |
| Total | 5,560 (100.0%) | $62,214 |
Household Income in Williamsport
Household Income Brackets in Williamsport
With 1,934 households falling in the category, the $50,000 to $74,999 income range is the most frequent in Williamsport, accounting for 17.8% of all households. In contrast, only 293 households (2.7%) fall into the $200,000+ income bracket, making it the least populous group.
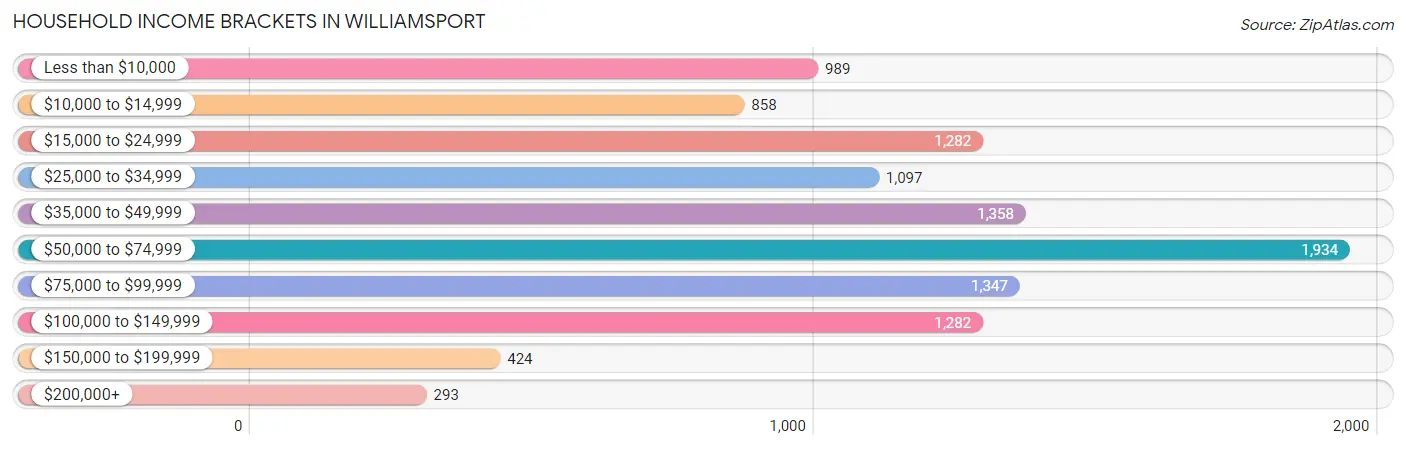
| Income Bracket | # Households | % Households |
| Less than $10,000 | 989 | 9.1% |
| $10,000 to $14,999 | 858 | 7.9% |
| $15,000 to $24,999 | 1,282 | 11.8% |
| $25,000 to $34,999 | 1,097 | 10.1% |
| $35,000 to $49,999 | 1,358 | 12.5% |
| $50,000 to $74,999 | 1,934 | 17.8% |
| $75,000 to $99,999 | 1,347 | 12.4% |
| $100,000 to $149,999 | 1,282 | 11.8% |
| $150,000 to $199,999 | 424 | 3.9% |
| $200,000+ | 293 | 2.7% |
Household Income by Householder Age in Williamsport
The median household income in Williamsport is $48,388, with the highest median household income of $60,303 found in the 25 to 44 years age bracket for the primary householder. A total of 3,573 households (32.9%) fall into this category. Meanwhile, the 15 to 24 years age bracket for the primary householder has the lowest median household income of $30,746, with 1,080 households (9.9%) in this group.
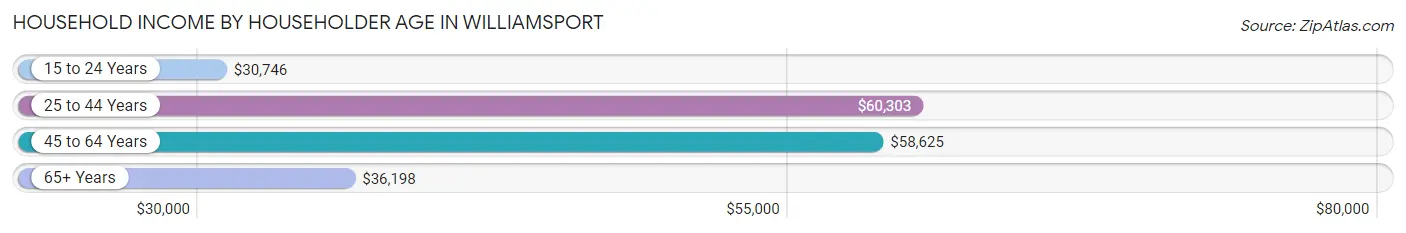
| Income Bracket | # Households | Median Income |
| 15 to 24 Years | 1,080 (9.9%) | $30,746 |
| 25 to 44 Years | 3,573 (32.9%) | $60,303 |
| 45 to 64 Years | 3,704 (34.1%) | $58,625 |
| 65+ Years | 2,509 (23.1%) | $36,198 |
| Total | 10,866 (100.0%) | $48,388 |
Poverty in Williamsport
Income Below Poverty by Sex and Age in Williamsport
With 24.2% poverty level for males and 26.6% for females among the residents of Williamsport, 18 to 24 year old males and under 5 year old females are the most vulnerable to poverty, with 729 males (48.5%) and 490 females (55.7%) in their respective age groups living below the poverty level.
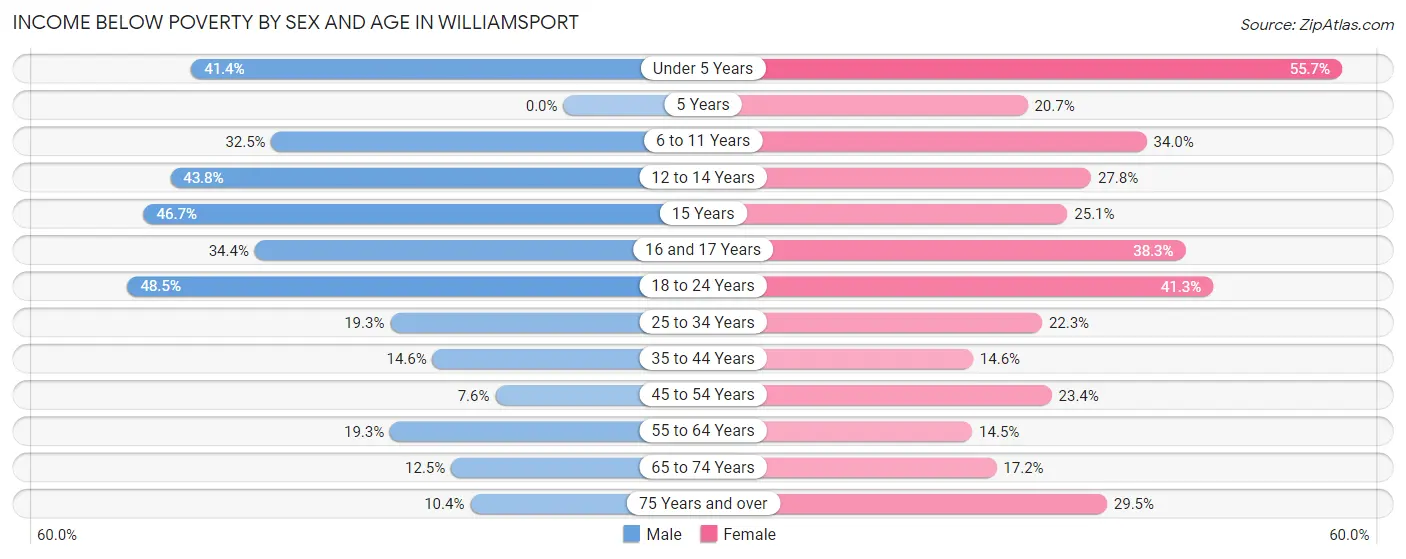
| Age Bracket | Male | Female |
| Under 5 Years | 336 (41.4%) | 490 (55.7%) |
| 5 Years | 0 (0.0%) | 49 (20.7%) |
| 6 to 11 Years | 314 (32.5%) | 351 (34.0%) |
| 12 to 14 Years | 151 (43.8%) | 73 (27.8%) |
| 15 Years | 43 (46.7%) | 53 (25.1%) |
| 16 and 17 Years | 155 (34.4%) | 88 (38.3%) |
| 18 to 24 Years | 729 (48.5%) | 525 (41.3%) |
| 25 to 34 Years | 402 (19.3%) | 490 (22.3%) |
| 35 to 44 Years | 166 (14.6%) | 161 (14.6%) |
| 45 to 54 Years | 103 (7.6%) | 354 (23.4%) |
| 55 to 64 Years | 287 (19.3%) | 204 (14.5%) |
| 65 to 74 Years | 140 (12.5%) | 208 (17.2%) |
| 75 Years and over | 39 (10.4%) | 271 (29.5%) |
| Total | 2,865 (24.2%) | 3,317 (26.6%) |
Income Above Poverty by Sex and Age in Williamsport
According to the poverty statistics in Williamsport, males aged 5 years and females aged 55 to 64 years are the age groups that are most secure financially, with 100.0% of males and 85.5% of females in these age groups living above the poverty line.
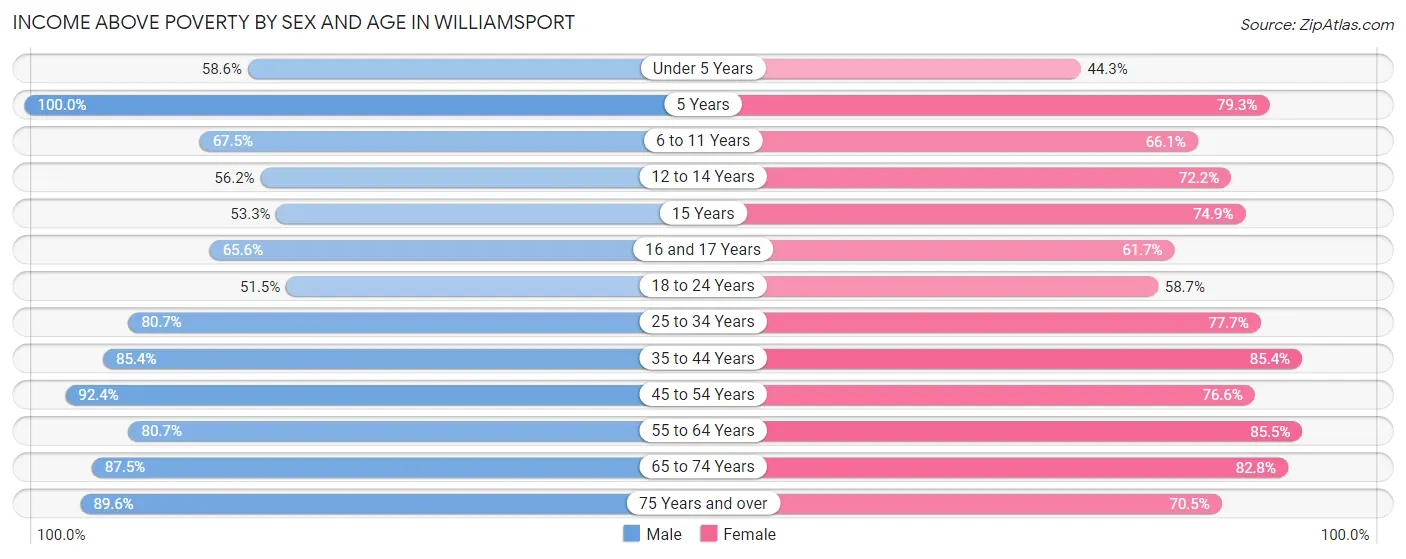
| Age Bracket | Male | Female |
| Under 5 Years | 475 (58.6%) | 390 (44.3%) |
| 5 Years | 119 (100.0%) | 188 (79.3%) |
| 6 to 11 Years | 652 (67.5%) | 683 (66.0%) |
| 12 to 14 Years | 194 (56.2%) | 190 (72.2%) |
| 15 Years | 49 (53.3%) | 158 (74.9%) |
| 16 and 17 Years | 296 (65.6%) | 142 (61.7%) |
| 18 to 24 Years | 773 (51.5%) | 745 (58.7%) |
| 25 to 34 Years | 1,683 (80.7%) | 1,708 (77.7%) |
| 35 to 44 Years | 973 (85.4%) | 942 (85.4%) |
| 45 to 54 Years | 1,256 (92.4%) | 1,161 (76.6%) |
| 55 to 64 Years | 1,200 (80.7%) | 1,201 (85.5%) |
| 65 to 74 Years | 980 (87.5%) | 1,000 (82.8%) |
| 75 Years and over | 337 (89.6%) | 647 (70.5%) |
| Total | 8,987 (75.8%) | 9,155 (73.4%) |
Income Below Poverty Among Married-Couple Families in Williamsport
The poverty statistics for married-couple families in Williamsport show that 3.5% or 107 of the total 3,071 families live below the poverty line. Families with 3 or 4 children have the highest poverty rate of 9.8%, comprising of 20 families. On the other hand, families with 5 or more children have the lowest poverty rate of 0.0%, which includes 0 families.
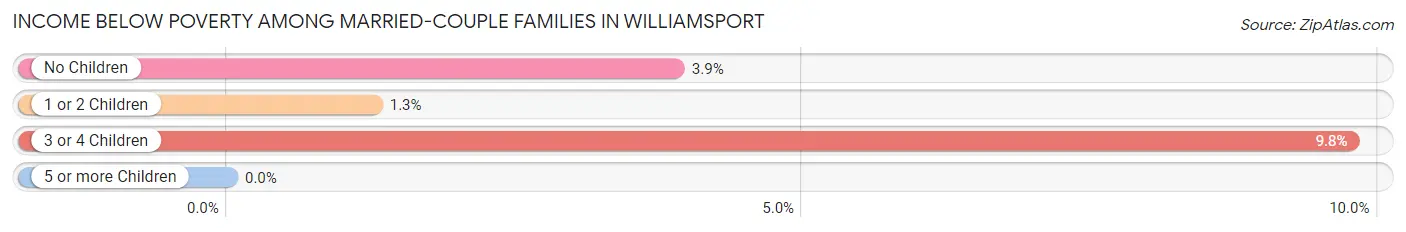
| Children | Above Poverty | Below Poverty |
| No Children | 1,876 (96.1%) | 76 (3.9%) |
| 1 or 2 Children | 859 (98.7%) | 11 (1.3%) |
| 3 or 4 Children | 185 (90.2%) | 20 (9.8%) |
| 5 or more Children | 44 (100.0%) | 0 (0.0%) |
| Total | 2,964 (96.5%) | 107 (3.5%) |
Income Below Poverty Among Single-Parent Households in Williamsport
According to the poverty data in Williamsport, 22.5% or 127 single-father households and 44.3% or 852 single-mother households are living below the poverty line. Among single-father households, those with 1 or 2 children have the highest poverty rate, with 80 households (28.2%) experiencing poverty. Likewise, among single-mother households, those with 5 or more children have the highest poverty rate, with 69 households (100.0%) falling below the poverty line.
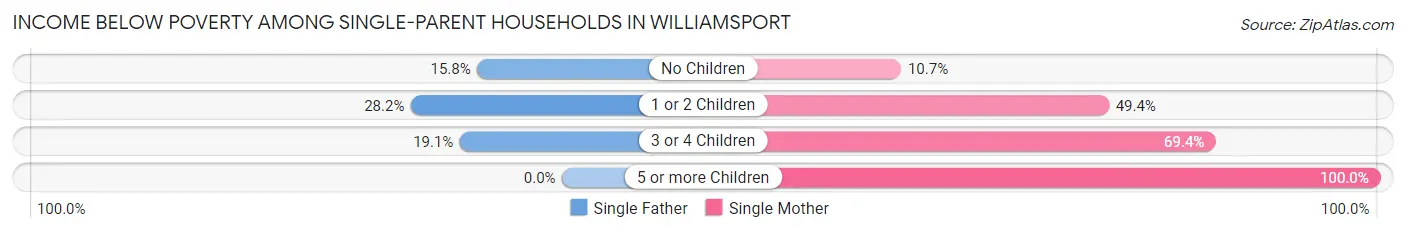
| Children | Single Father | Single Mother |
| No Children | 31 (15.8%) | 49 (10.7%) |
| 1 or 2 Children | 80 (28.2%) | 580 (49.4%) |
| 3 or 4 Children | 16 (19.1%) | 154 (69.4%) |
| 5 or more Children | 0 (0.0%) | 69 (100.0%) |
| Total | 127 (22.5%) | 852 (44.3%) |
Income Below Poverty Among Married-Couple vs Single-Parent Households in Williamsport
The poverty data for Williamsport shows that 107 of the married-couple family households (3.5%) and 979 of the single-parent households (39.3%) are living below the poverty level. Within the married-couple family households, those with 3 or 4 children have the highest poverty rate, with 20 households (9.8%) falling below the poverty line. Among the single-parent households, those with 5 or more children have the highest poverty rate, with 69 household (100.0%) living below poverty.
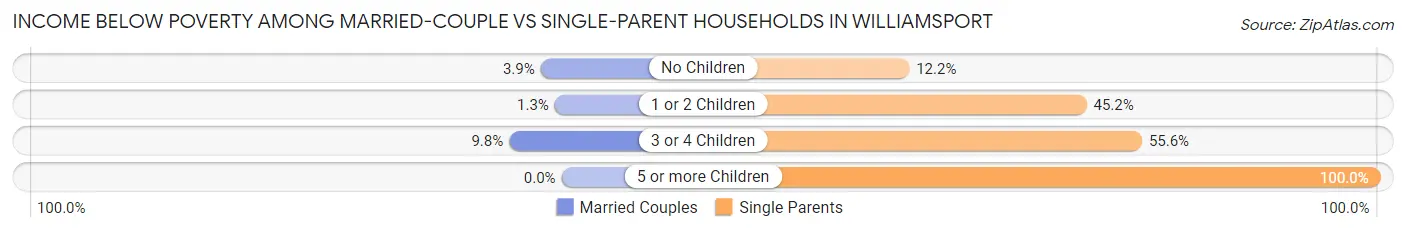
| Children | Married-Couple Families | Single-Parent Households |
| No Children | 76 (3.9%) | 80 (12.2%) |
| 1 or 2 Children | 11 (1.3%) | 660 (45.2%) |
| 3 or 4 Children | 20 (9.8%) | 170 (55.6%) |
| 5 or more Children | 0 (0.0%) | 69 (100.0%) |
| Total | 107 (3.5%) | 979 (39.3%) |
Race in Williamsport
The most populous races in Williamsport are White / Caucasian (21,542 | 77.6%), Black / African American (3,712 | 13.4%), and Two or more Races (1,734 | 6.2%).
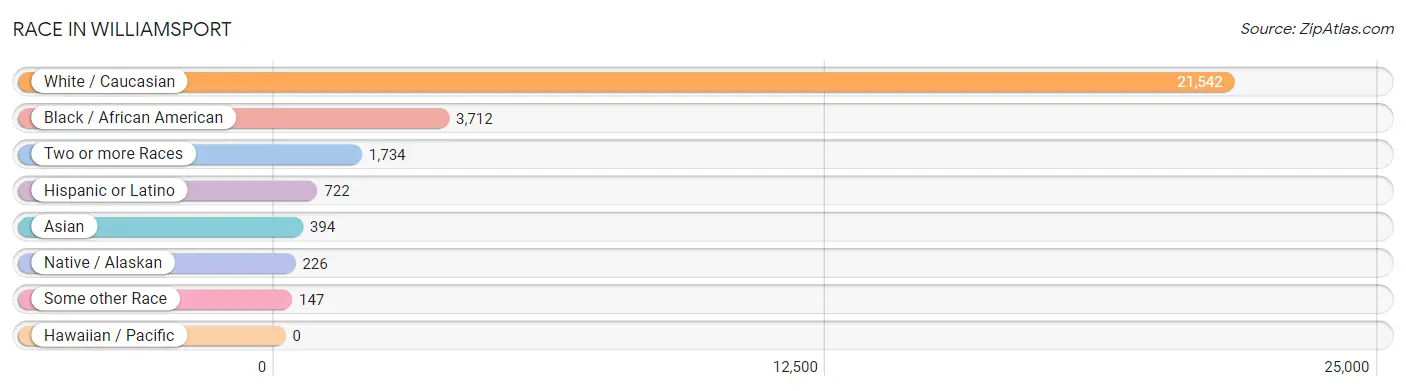
| Race | # Population | % Population |
| Asian | 394 | 1.4% |
| Black / African American | 3,712 | 13.4% |
| Hawaiian / Pacific | 0 | 0.0% |
| Hispanic or Latino | 722 | 2.6% |
| Native / Alaskan | 226 | 0.8% |
| White / Caucasian | 21,542 | 77.6% |
| Two or more Races | 1,734 | 6.2% |
| Some other Race | 147 | 0.5% |
| Total | 27,755 | 100.0% |
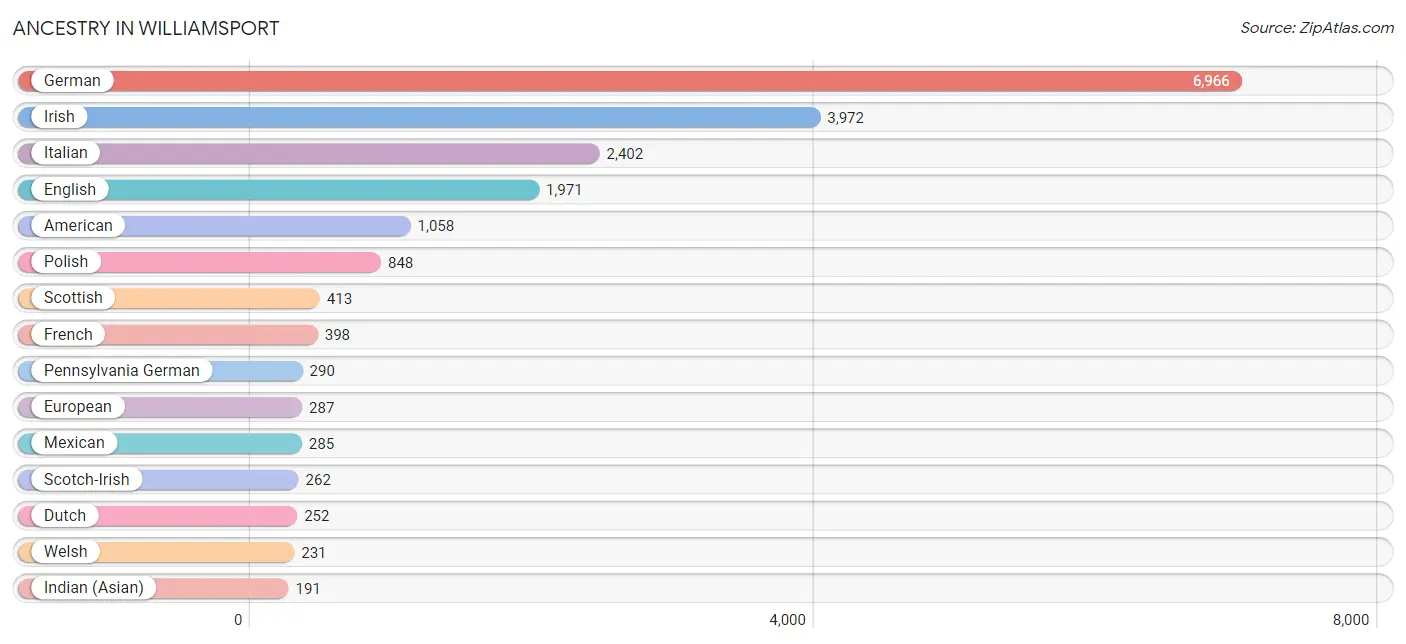
Ancestry in Williamsport
The most populous ancestries reported in Williamsport are German (6,966 | 25.1%), Irish (3,972 | 14.3%), Italian (2,402 | 8.6%), English (1,971 | 7.1%), and American (1,058 | 3.8%), together accounting for 59.0% of all Williamsport residents.
| Ancestry | # Population | % Population |
| African | 51 | 0.2% |
| American | 1,058 | 3.8% |
| Arab | 38 | 0.1% |
| Argentinean | 56 | 0.2% |
| Austrian | 13 | 0.1% |
| Bahamian | 15 | 0.1% |
| Belizean | 67 | 0.2% |
| Blackfeet | 75 | 0.3% |
| British | 36 | 0.1% |
| British West Indian | 9 | 0.0% |
| Burmese | 17 | 0.1% |
| Canadian | 59 | 0.2% |
| Central American | 24 | 0.1% |
| Central American Indian | 7 | 0.0% |
| Cherokee | 188 | 0.7% |
| Chippewa | 27 | 0.1% |
| Colombian | 4 | 0.0% |
| Cuban | 37 | 0.1% |
| Czech | 39 | 0.1% |
| Czechoslovakian | 8 | 0.0% |
| Danish | 13 | 0.1% |
| Dominican | 13 | 0.1% |
| Dutch | 252 | 0.9% |
| Eastern European | 54 | 0.2% |
| English | 1,971 | 7.1% |
| European | 287 | 1.0% |
| Finnish | 8 | 0.0% |
| French | 398 | 1.4% |
| French Canadian | 132 | 0.5% |
| German | 6,966 | 25.1% |
| Greek | 50 | 0.2% |
| Guatemalan | 1 | 0.0% |
| Haitian | 185 | 0.7% |
| Hungarian | 87 | 0.3% |
| Indian (Asian) | 191 | 0.7% |
| Indonesian | 37 | 0.1% |
| Inupiat | 14 | 0.1% |
| Irish | 3,972 | 14.3% |
| Iroquois | 37 | 0.1% |
| Italian | 2,402 | 8.6% |
| Jamaican | 9 | 0.0% |
| Kenyan | 4 | 0.0% |
| Korean | 186 | 0.7% |
| Latvian | 26 | 0.1% |
| Lebanese | 30 | 0.1% |
| Liberian | 28 | 0.1% |
| Lithuanian | 45 | 0.2% |
| Lumbee | 4 | 0.0% |
| Mexican | 285 | 1.0% |
| Mexican American Indian | 135 | 0.5% |
| Native Hawaiian | 10 | 0.0% |
| Nigerian | 61 | 0.2% |
| Northern European | 116 | 0.4% |
| Norwegian | 38 | 0.1% |
| Pennsylvania German | 290 | 1.0% |
| Polish | 848 | 3.1% |
| Portuguese | 18 | 0.1% |
| Puerto Rican | 179 | 0.6% |
| Romanian | 35 | 0.1% |
| Russian | 132 | 0.5% |
| Salvadoran | 23 | 0.1% |
| Scandinavian | 5 | 0.0% |
| Scotch-Irish | 262 | 0.9% |
| Scottish | 413 | 1.5% |
| Shoshone | 38 | 0.1% |
| Sioux | 4 | 0.0% |
| Slavic | 24 | 0.1% |
| Slovak | 139 | 0.5% |
| South American | 60 | 0.2% |
| Spaniard | 97 | 0.4% |
| Spanish | 17 | 0.1% |
| Sri Lankan | 107 | 0.4% |
| Subsaharan African | 144 | 0.5% |
| Swedish | 154 | 0.5% |
| Swiss | 161 | 0.6% |
| Syrian | 8 | 0.0% |
| Thai | 13 | 0.1% |
| Trinidadian and Tobagonian | 8 | 0.0% |
| Ukrainian | 18 | 0.1% |
| Welsh | 231 | 0.8% |
| West Indian | 94 | 0.3% |
| Yugoslavian | 10 | 0.0% | View All 82 Rows |
Immigrants in Williamsport
The most numerous immigrant groups reported in Williamsport came from Latin America (240 | 0.9%), Asia (239 | 0.9%), Caribbean (203 | 0.7%), Europe (155 | 0.6%), and Haiti (155 | 0.6%), together accounting for 3.6% of all Williamsport residents.
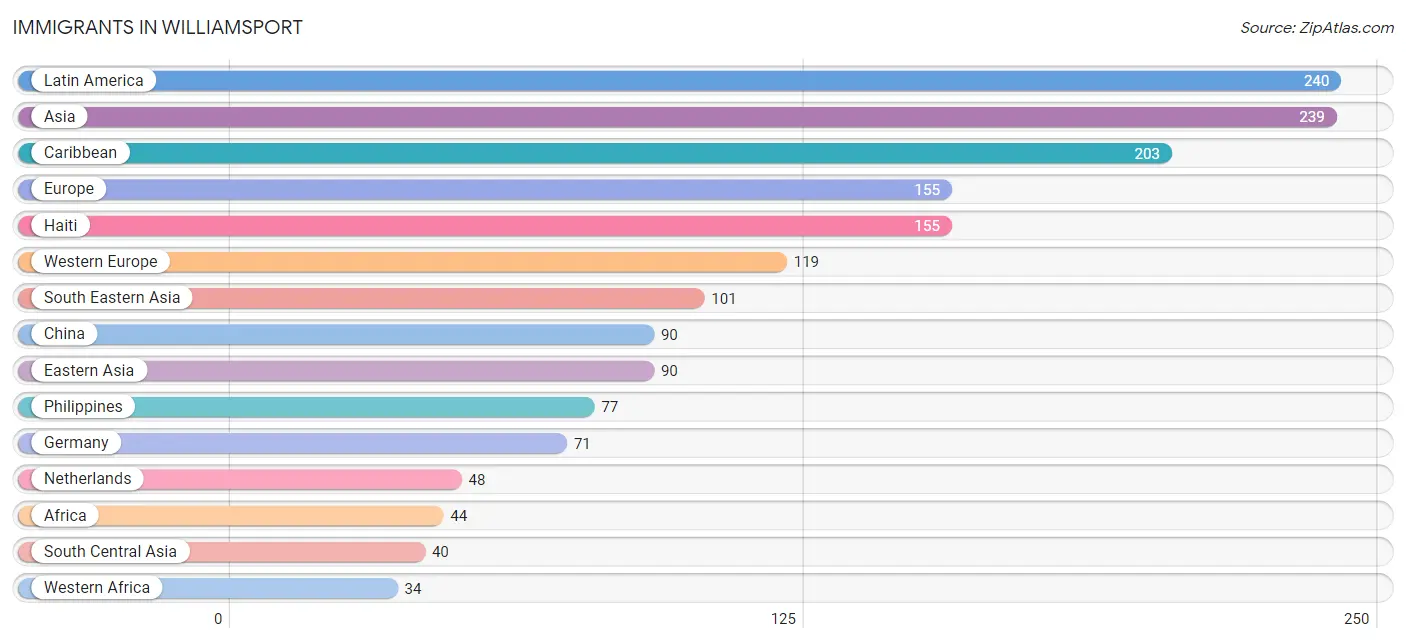
| Immigration Origin | # Population | % Population |
| Africa | 44 | 0.2% |
| Argentina | 26 | 0.1% |
| Asia | 239 | 0.9% |
| Bahamas | 15 | 0.1% |
| Caribbean | 203 | 0.7% |
| Central America | 7 | 0.0% |
| China | 90 | 0.3% |
| Colombia | 4 | 0.0% |
| Eastern Africa | 10 | 0.0% |
| Eastern Asia | 90 | 0.3% |
| Eastern Europe | 17 | 0.1% |
| El Salvador | 6 | 0.0% |
| Europe | 155 | 0.6% |
| Germany | 71 | 0.3% |
| Guatemala | 1 | 0.0% |
| Haiti | 155 | 0.6% |
| India | 7 | 0.0% |
| Italy | 9 | 0.0% |
| Jamaica | 9 | 0.0% |
| Kenya | 4 | 0.0% |
| Latin America | 240 | 0.9% |
| Liberia | 28 | 0.1% |
| Netherlands | 48 | 0.2% |
| Nigeria | 6 | 0.0% |
| Northern Europe | 10 | 0.0% |
| Pakistan | 33 | 0.1% |
| Philippines | 77 | 0.3% |
| Poland | 11 | 0.0% |
| South America | 30 | 0.1% |
| South Central Asia | 40 | 0.1% |
| South Eastern Asia | 101 | 0.4% |
| Southern Europe | 9 | 0.0% |
| Syria | 8 | 0.0% |
| Trinidad and Tobago | 24 | 0.1% |
| Ukraine | 6 | 0.0% |
| Vietnam | 8 | 0.0% |
| Western Africa | 34 | 0.1% |
| Western Asia | 8 | 0.0% |
| Western Europe | 119 | 0.4% | View All 39 Rows |
Sex and Age in Williamsport
Sex and Age in Williamsport
The most populous age groups in Williamsport are 15 to 19 Years (2,002 | 14.4%) for men and 20 to 24 Years (1,475 | 10.7%) for women.
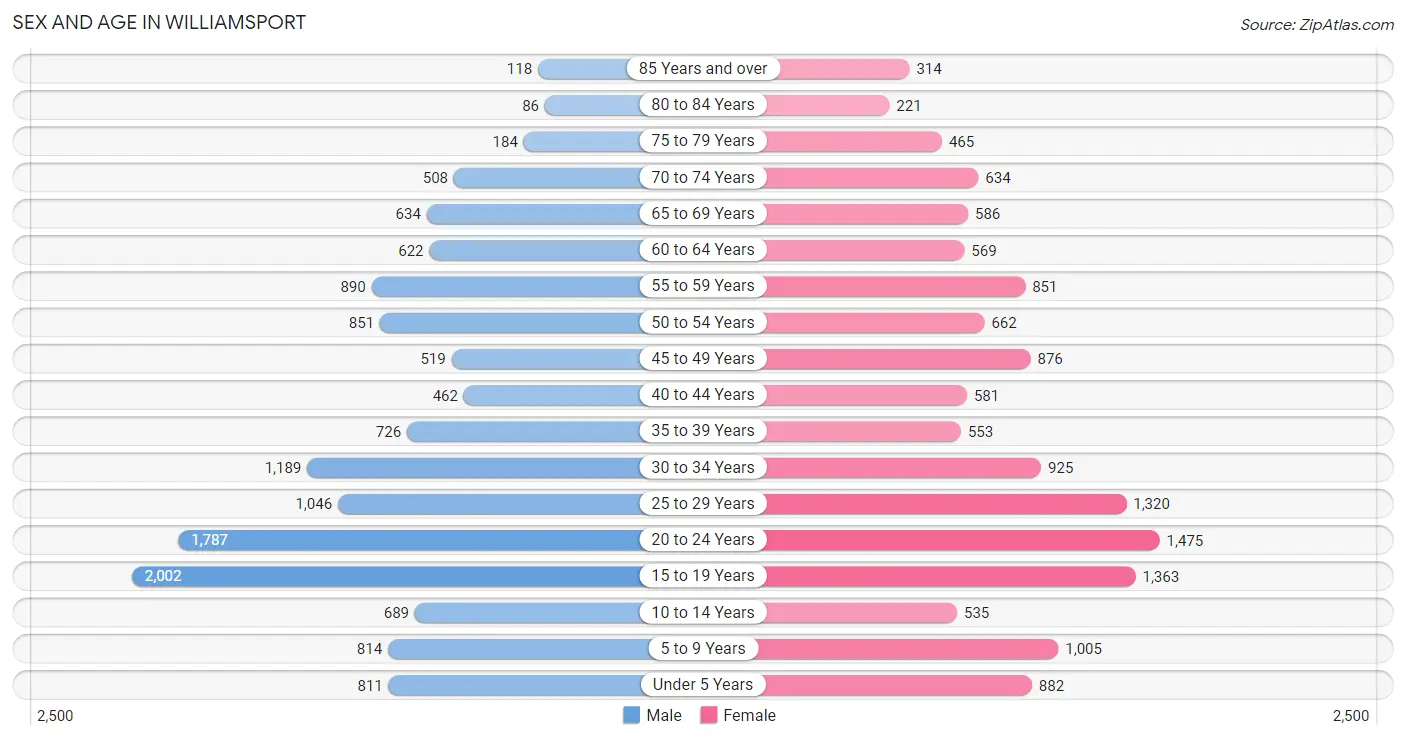
| Age Bracket | Male | Female |
| Under 5 Years | 811 (5.8%) | 882 (6.4%) |
| 5 to 9 Years | 814 (5.8%) | 1,005 (7.3%) |
| 10 to 14 Years | 689 (4.9%) | 535 (3.9%) |
| 15 to 19 Years | 2,002 (14.4%) | 1,363 (9.9%) |
| 20 to 24 Years | 1,787 (12.8%) | 1,475 (10.7%) |
| 25 to 29 Years | 1,046 (7.5%) | 1,320 (9.6%) |
| 30 to 34 Years | 1,189 (8.5%) | 925 (6.7%) |
| 35 to 39 Years | 726 (5.2%) | 553 (4.0%) |
| 40 to 44 Years | 462 (3.3%) | 581 (4.2%) |
| 45 to 49 Years | 519 (3.7%) | 876 (6.3%) |
| 50 to 54 Years | 851 (6.1%) | 662 (4.8%) |
| 55 to 59 Years | 890 (6.4%) | 851 (6.2%) |
| 60 to 64 Years | 622 (4.5%) | 569 (4.1%) |
| 65 to 69 Years | 634 (4.5%) | 586 (4.2%) |
| 70 to 74 Years | 508 (3.6%) | 634 (4.6%) |
| 75 to 79 Years | 184 (1.3%) | 465 (3.4%) |
| 80 to 84 Years | 86 (0.6%) | 221 (1.6%) |
| 85 Years and over | 118 (0.9%) | 314 (2.3%) |
| Total | 13,938 (100.0%) | 13,817 (100.0%) |
Families and Households in Williamsport
Median Family Size in Williamsport
The median family size in Williamsport is 2.97 persons per family, with married-couple families (3,071 | 55.2%) accounting for the largest median family size of 3.04 persons per family. On the other hand, single female/mother families (1,925 | 34.6%) represent the smallest median family size with 2.88 persons per family.
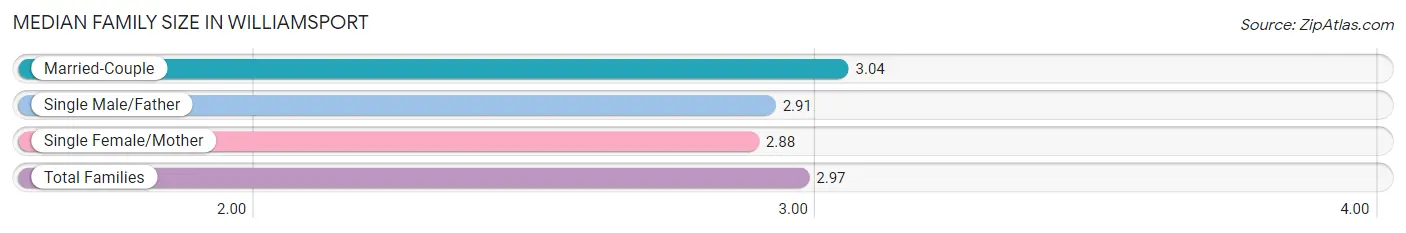
| Family Type | # Families | Family Size |
| Married-Couple | 3,071 (55.2%) | 3.04 |
| Single Male/Father | 564 (10.1%) | 2.91 |
| Single Female/Mother | 1,925 (34.6%) | 2.88 |
| Total Families | 5,560 (100.0%) | 2.97 |
Median Household Size in Williamsport
The median household size in Williamsport is 2.23 persons per household, with single male/father households (564 | 5.2%) accounting for the largest median household size of 3.37 persons per household. non-family households (5,306 | 48.8%) represent the smallest median household size with 1.31 persons per household.
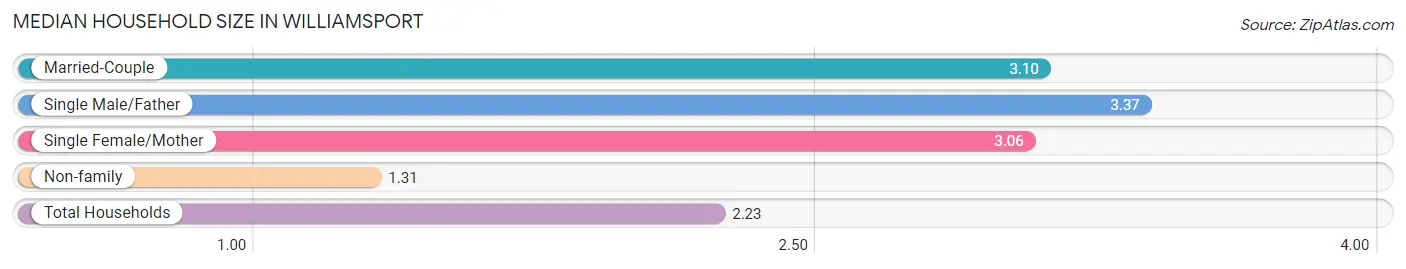
| Household Type | # Households | Household Size |
| Married-Couple | 3,071 (28.3%) | 3.10 |
| Single Male/Father | 564 (5.2%) | 3.37 |
| Single Female/Mother | 1,925 (17.7%) | 3.06 |
| Non-family | 5,306 (48.8%) | 1.31 |
| Total Households | 10,866 (100.0%) | 2.23 |
Household Size by Marriage Status in Williamsport
Out of a total of 10,866 households in Williamsport, 5,560 (51.2%) are family households, while 5,306 (48.8%) are nonfamily households. The most numerous type of family households are 2-person households, comprising 2,517, and the most common type of nonfamily households are 1-person households, comprising 4,081.
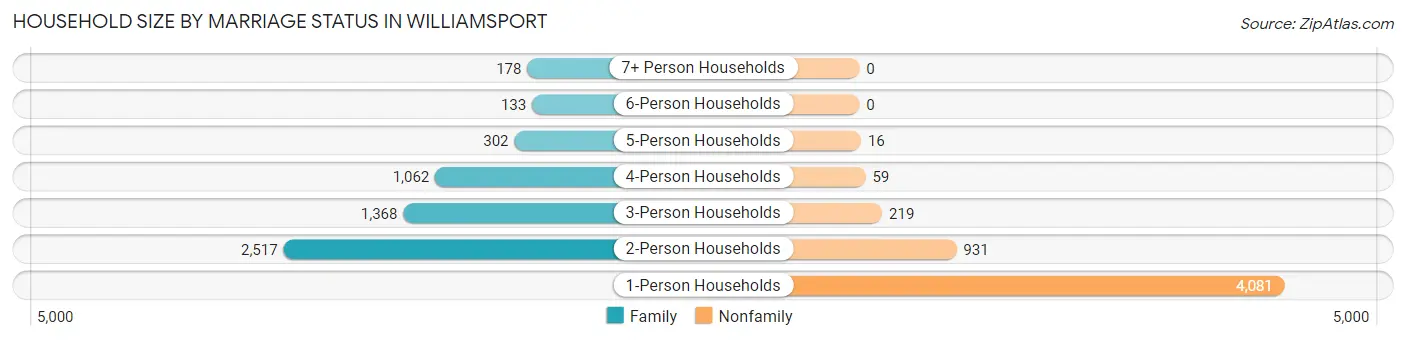
| Household Size | Family Households | Nonfamily Households |
| 1-Person Households | - | 4,081 (37.6%) |
| 2-Person Households | 2,517 (23.2%) | 931 (8.6%) |
| 3-Person Households | 1,368 (12.6%) | 219 (2.0%) |
| 4-Person Households | 1,062 (9.8%) | 59 (0.5%) |
| 5-Person Households | 302 (2.8%) | 16 (0.2%) |
| 6-Person Households | 133 (1.2%) | 0 (0.0%) |
| 7+ Person Households | 178 (1.6%) | 0 (0.0%) |
| Total | 5,560 (51.2%) | 5,306 (48.8%) |
Female Fertility in Williamsport
Fertility by Age in Williamsport
Average fertility rate in Williamsport is 61.0 births per 1,000 women. Women in the age bracket of 20 to 34 years have the highest fertility rate with 85.0 births per 1,000 women. Women in the age bracket of 20 to 34 years acount for 72.0% of all women with births.
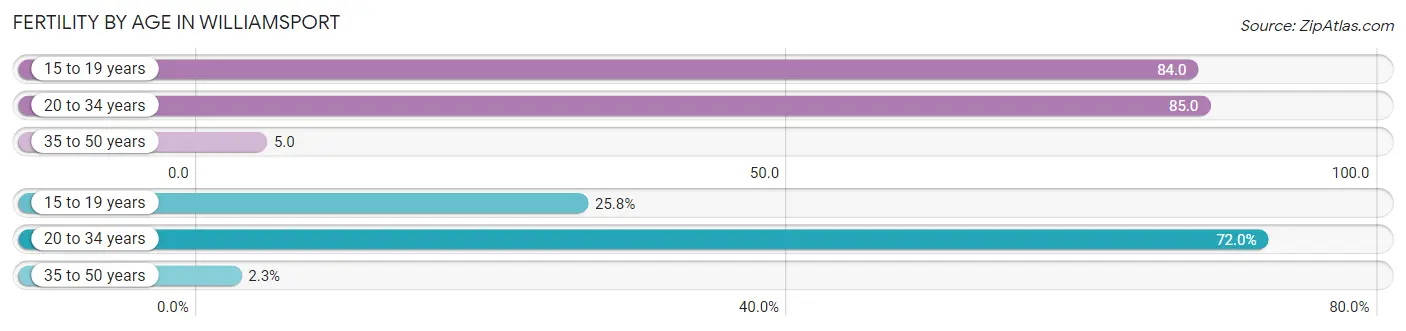
| Age Bracket | Women with Births | Births / 1,000 Women |
| 15 to 19 years | 114 (25.8%) | 84.0 |
| 20 to 34 years | 318 (72.0%) | 85.0 |
| 35 to 50 years | 10 (2.3%) | 5.0 |
| Total | 442 (100.0%) | 61.0 |
Fertility by Age by Marriage Status in Williamsport
29.4% of women with births (442) in Williamsport are married. The highest percentage of unmarried women with births falls into 15 to 19 years age bracket with 100.0% of them unmarried at the time of birth, while the lowest percentage of unmarried women with births belong to 35 to 50 years age bracket with 0.0% of them unmarried.
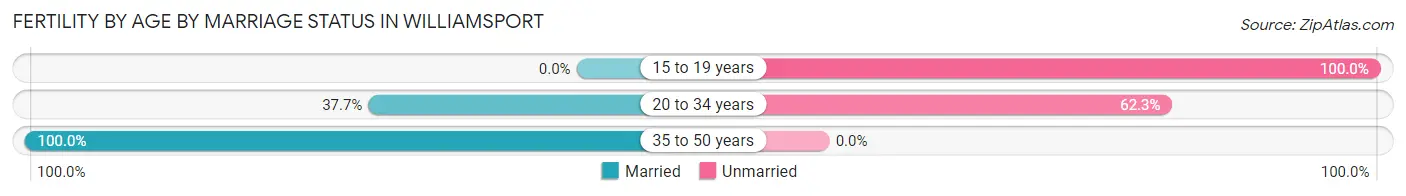
| Age Bracket | Married | Unmarried |
| 15 to 19 years | 0 (0.0%) | 114 (100.0%) |
| 20 to 34 years | 120 (37.7%) | 198 (62.3%) |
| 35 to 50 years | 10 (100.0%) | 0 (0.0%) |
| Total | 130 (29.4%) | 312 (70.6%) |
Fertility by Education in Williamsport
Average fertility rate in Williamsport is 61.0 births per 1,000 women. Women with the education attainment of high school diploma have the highest fertility rate of 113.0 births per 1,000 women, while women with the education attainment of college or associate's degree have the lowest fertility at 24.0 births per 1,000 women. Women with the education attainment of high school diploma represent 55.2% of all women with births.
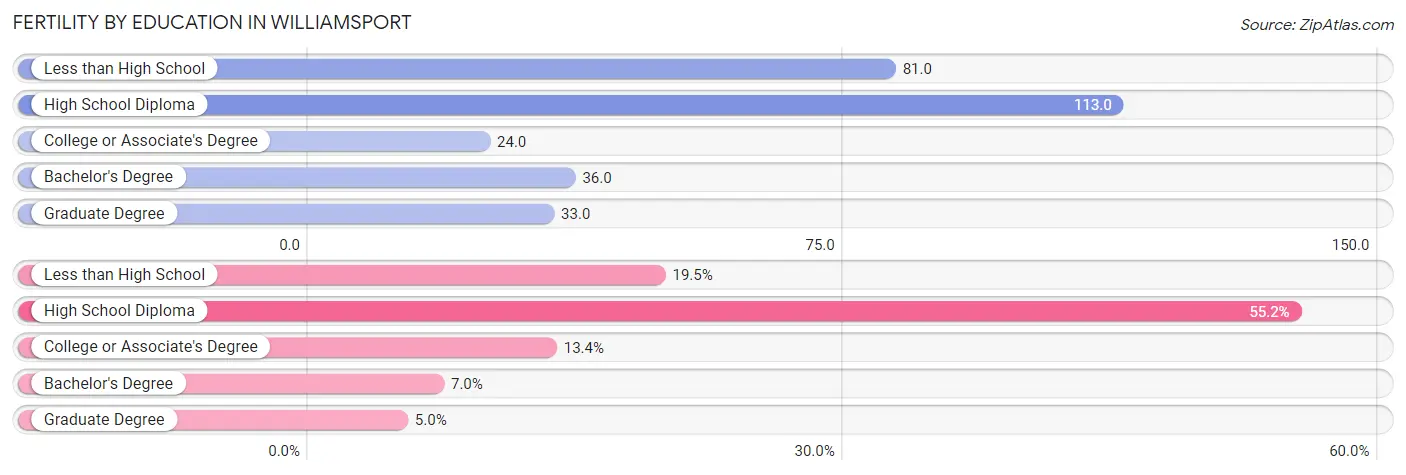
| Educational Attainment | Women with Births | Births / 1,000 Women |
| Less than High School | 86 (19.5%) | 81.0 |
| High School Diploma | 244 (55.2%) | 113.0 |
| College or Associate's Degree | 59 (13.4%) | 24.0 |
| Bachelor's Degree | 31 (7.0%) | 36.0 |
| Graduate Degree | 22 (5.0%) | 33.0 |
| Total | 442 (100.0%) | 61.0 |
Fertility by Education by Marriage Status in Williamsport
70.6% of women with births in Williamsport are unmarried. Women with the educational attainment of bachelor's degree are most likely to be married with 100.0% of them married at childbirth, while women with the educational attainment of high school diploma are least likely to be married with 95.9% of them unmarried at childbirth.
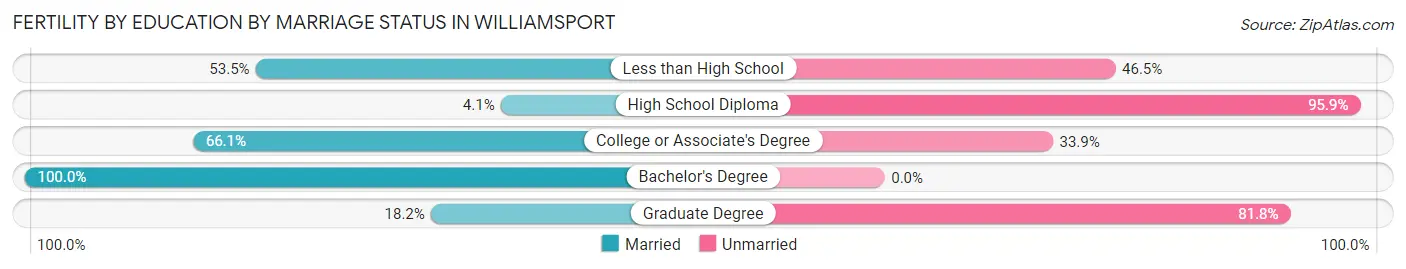
| Educational Attainment | Married | Unmarried |
| Less than High School | 46 (53.5%) | 40 (46.5%) |
| High School Diploma | 10 (4.1%) | 234 (95.9%) |
| College or Associate's Degree | 39 (66.1%) | 20 (33.9%) |
| Bachelor's Degree | 31 (100.0%) | 0 (0.0%) |
| Graduate Degree | 4 (18.2%) | 18 (81.8%) |
| Total | 130 (29.4%) | 312 (70.6%) |
Employment Characteristics in Williamsport
Employment by Class of Employer in Williamsport
Among the 12,435 employed individuals in Williamsport, private company employees (8,644 | 69.5%), not-for-profit organizations (1,757 | 14.1%), and state government employees (774 | 6.2%) make up the most common classes of employment.
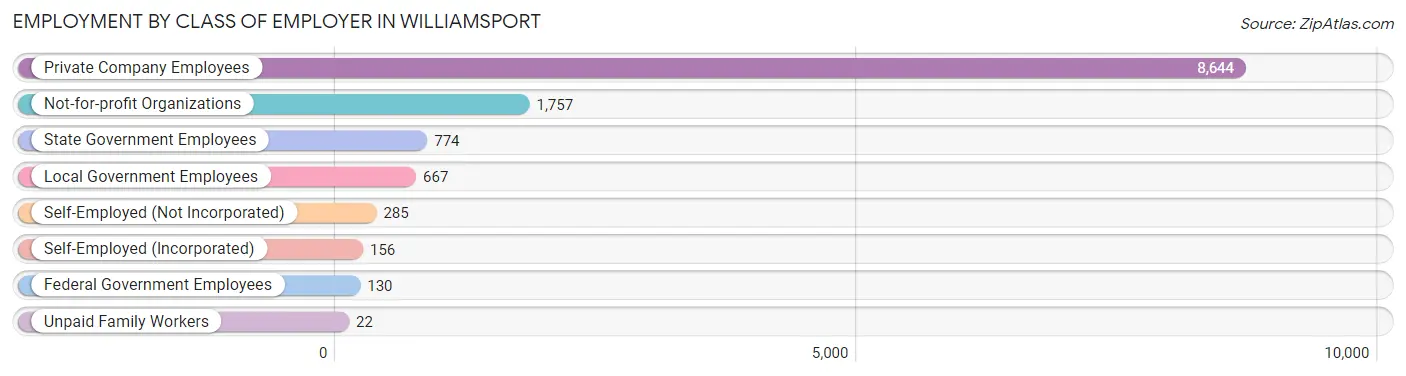
| Employer Class | # Employees | % Employees |
| Private Company Employees | 8,644 | 69.5% |
| Self-Employed (Incorporated) | 156 | 1.3% |
| Self-Employed (Not Incorporated) | 285 | 2.3% |
| Not-for-profit Organizations | 1,757 | 14.1% |
| Local Government Employees | 667 | 5.4% |
| State Government Employees | 774 | 6.2% |
| Federal Government Employees | 130 | 1.1% |
| Unpaid Family Workers | 22 | 0.2% |
| Total | 12,435 | 100.0% |
Employment Status by Age in Williamsport
According to the labor force statistics for Williamsport, out of the total population over 16 years of age (22,716), 59.3% or 13,471 individuals are in the labor force, with 6.5% or 876 of them unemployed. The age group with the highest labor force participation rate is 25 to 29 years, with 84.6% or 2,002 individuals in the labor force. Within the labor force, the 16 to 19 years age range has the highest percentage of unemployed individuals, with 26.8% or 247 of them being unemployed.
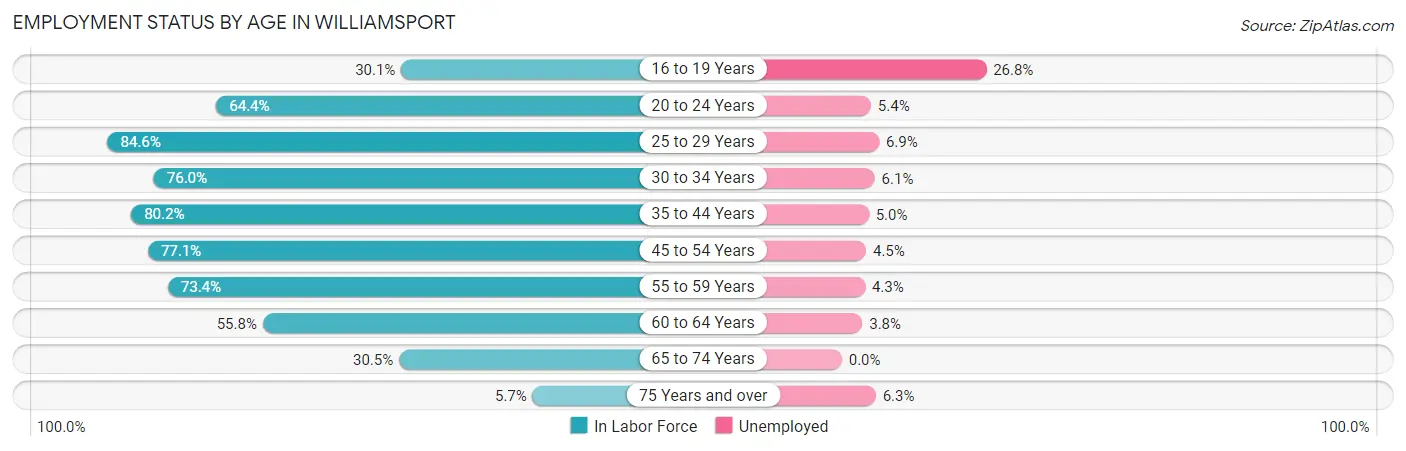
| Age Bracket | In Labor Force | Unemployed |
| 16 to 19 Years | 922 (30.1%) | 247 (26.8%) |
| 20 to 24 Years | 2,101 (64.4%) | 113 (5.4%) |
| 25 to 29 Years | 2,002 (84.6%) | 138 (6.9%) |
| 30 to 34 Years | 1,607 (76.0%) | 98 (6.1%) |
| 35 to 44 Years | 1,862 (80.2%) | 93 (5.0%) |
| 45 to 54 Years | 2,242 (77.1%) | 101 (4.5%) |
| 55 to 59 Years | 1,278 (73.4%) | 55 (4.3%) |
| 60 to 64 Years | 665 (55.8%) | 25 (3.8%) |
| 65 to 74 Years | 720 (30.5%) | 0 (0.0%) |
| 75 Years and over | 79 (5.7%) | 5 (6.3%) |
| Total | 13,471 (59.3%) | 876 (6.5%) |
Employment Status by Educational Attainment in Williamsport
According to labor force statistics for Williamsport, 76.4% of individuals (9,658) out of the total population between 25 and 64 years of age (12,642) are in the labor force, with 5.3% or 512 of them being unemployed. The group with the highest labor force participation rate are those with the educational attainment of bachelor's degree or higher, with 89.1% or 3,210 individuals in the labor force. Within the labor force, individuals with less than high school education have the highest percentage of unemployment, with 15.1% or 98 of them being unemployed.
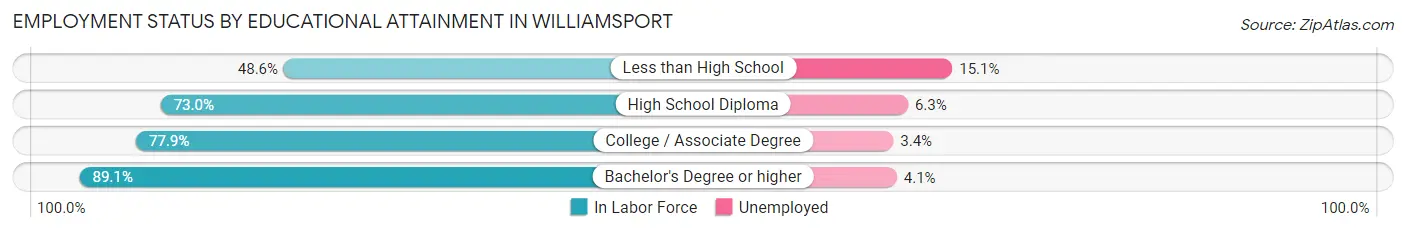
| Educational Attainment | In Labor Force | Unemployed |
| Less than High School | 649 (48.6%) | 202 (15.1%) |
| High School Diploma | 3,054 (73.0%) | 264 (6.3%) |
| College / Associate Degree | 2,741 (77.9%) | 120 (3.4%) |
| Bachelor's Degree or higher | 3,210 (89.1%) | 148 (4.1%) |
| Total | 9,658 (76.4%) | 670 (5.3%) |
Employment Occupations by Sex in Williamsport
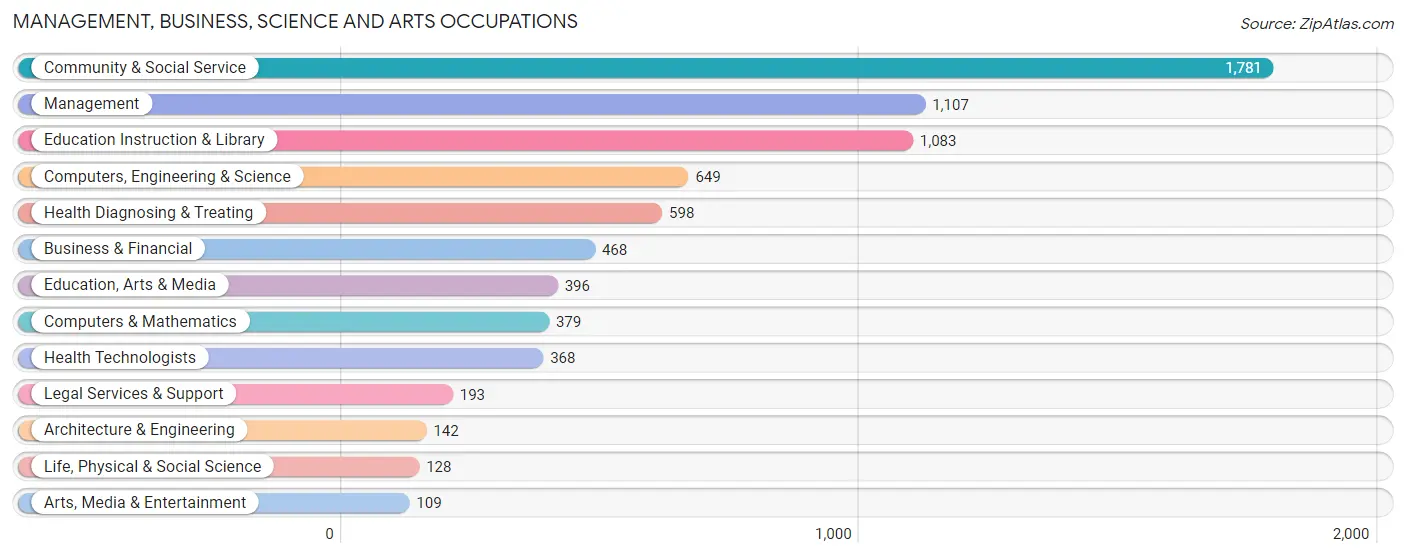
Management, Business, Science and Arts Occupations
The most common Management, Business, Science and Arts occupations in Williamsport are Community & Social Service (1,781 | 14.1%), Management (1,107 | 8.8%), Education Instruction & Library (1,083 | 8.6%), Computers, Engineering & Science (649 | 5.2%), and Health Diagnosing & Treating (598 | 4.8%).
Management, Business, Science and Arts Occupations by Sex
Within the Management, Business, Science and Arts occupations in Williamsport, the most male-oriented occupations are Architecture & Engineering (100.0%), Computers & Mathematics (94.2%), and Computers, Engineering & Science (80.7%), while the most female-oriented occupations are Health Diagnosing & Treating (80.9%), Education, Arts & Media (80.6%), and Life, Physical & Social Science (80.5%).
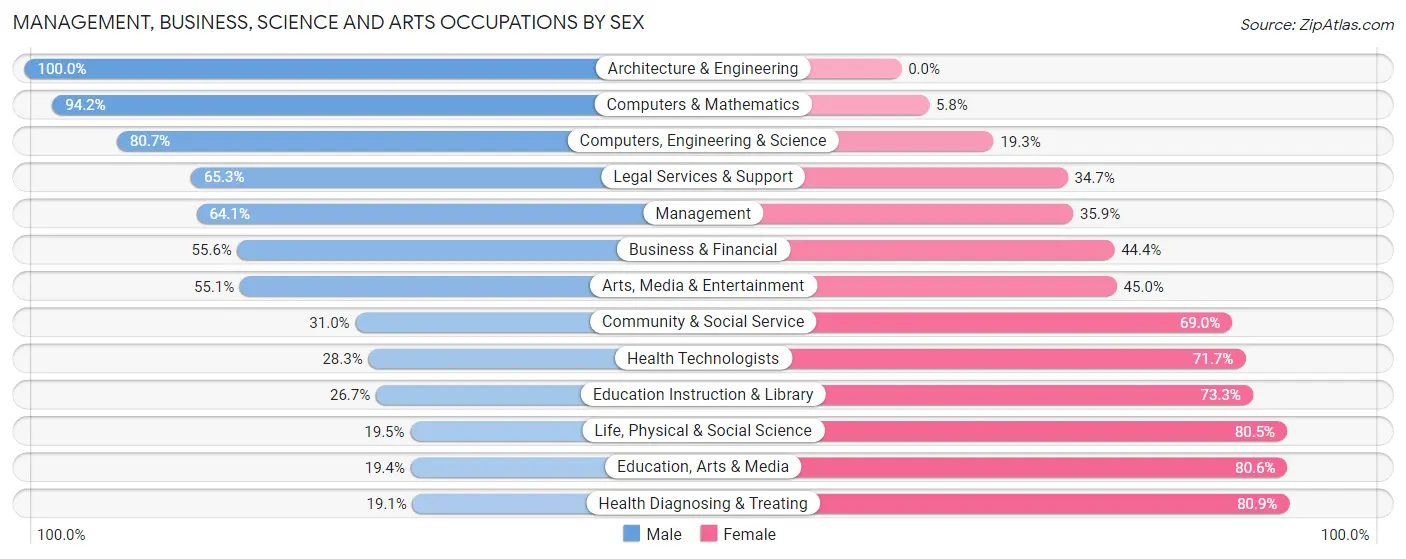
| Occupation | Male | Female |
| Management | 710 (64.1%) | 397 (35.9%) |
| Business & Financial | 260 (55.6%) | 208 (44.4%) |
| Computers, Engineering & Science | 524 (80.7%) | 125 (19.3%) |
| Computers & Mathematics | 357 (94.2%) | 22 (5.8%) |
| Architecture & Engineering | 142 (100.0%) | 0 (0.0%) |
| Life, Physical & Social Science | 25 (19.5%) | 103 (80.5%) |
| Community & Social Service | 552 (31.0%) | 1,229 (69.0%) |
| Education, Arts & Media | 77 (19.4%) | 319 (80.6%) |
| Legal Services & Support | 126 (65.3%) | 67 (34.7%) |
| Education Instruction & Library | 289 (26.7%) | 794 (73.3%) |
| Arts, Media & Entertainment | 60 (55.0%) | 49 (45.0%) |
| Health Diagnosing & Treating | 114 (19.1%) | 484 (80.9%) |
| Health Technologists | 104 (28.3%) | 264 (71.7%) |
| Total (Category) | 2,160 (46.9%) | 2,443 (53.1%) |
| Total (Overall) | 6,246 (49.6%) | 6,339 (50.4%) |
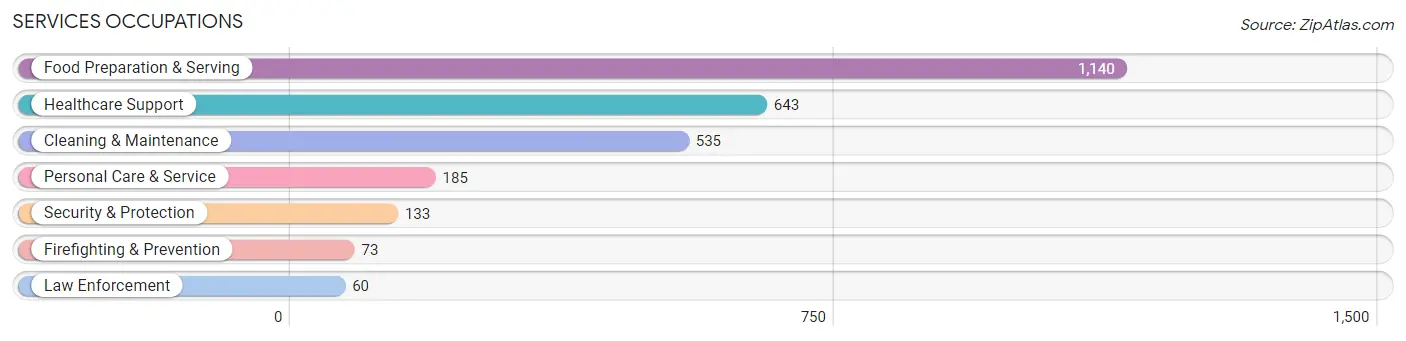
Services Occupations
The most common Services occupations in Williamsport are Food Preparation & Serving (1,140 | 9.1%), Healthcare Support (643 | 5.1%), Cleaning & Maintenance (535 | 4.3%), Personal Care & Service (185 | 1.5%), and Security & Protection (133 | 1.1%).
Services Occupations by Sex
Within the Services occupations in Williamsport, the most male-oriented occupations are Law Enforcement (100.0%), Security & Protection (66.9%), and Cleaning & Maintenance (63.9%), while the most female-oriented occupations are Healthcare Support (97.2%), Personal Care & Service (75.7%), and Firefighting & Prevention (60.3%).
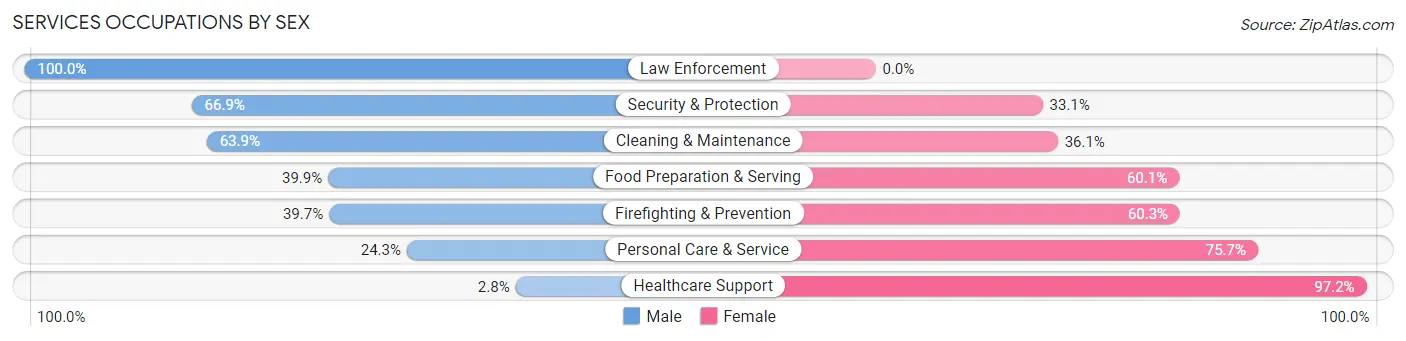
| Occupation | Male | Female |
| Healthcare Support | 18 (2.8%) | 625 (97.2%) |
| Security & Protection | 89 (66.9%) | 44 (33.1%) |
| Firefighting & Prevention | 29 (39.7%) | 44 (60.3%) |
| Law Enforcement | 60 (100.0%) | 0 (0.0%) |
| Food Preparation & Serving | 455 (39.9%) | 685 (60.1%) |
| Cleaning & Maintenance | 342 (63.9%) | 193 (36.1%) |
| Personal Care & Service | 45 (24.3%) | 140 (75.7%) |
| Total (Category) | 949 (36.0%) | 1,687 (64.0%) |
| Total (Overall) | 6,246 (49.6%) | 6,339 (50.4%) |
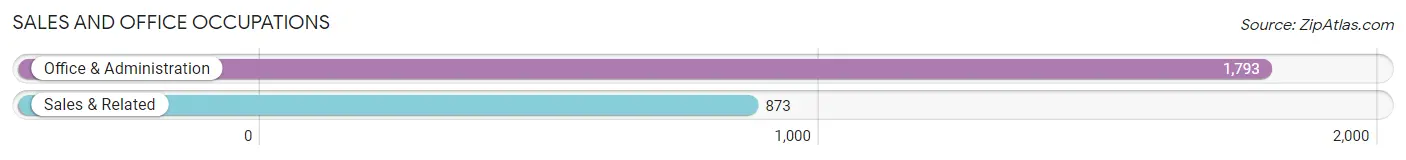
Sales and Office Occupations
The most common Sales and Office occupations in Williamsport are Office & Administration (1,793 | 14.2%), and Sales & Related (873 | 6.9%).
Sales and Office Occupations by Sex
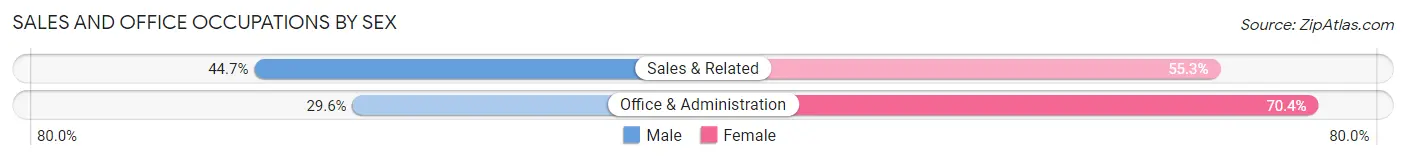
| Occupation | Male | Female |
| Sales & Related | 390 (44.7%) | 483 (55.3%) |
| Office & Administration | 530 (29.6%) | 1,263 (70.4%) |
| Total (Category) | 920 (34.5%) | 1,746 (65.5%) |
| Total (Overall) | 6,246 (49.6%) | 6,339 (50.4%) |
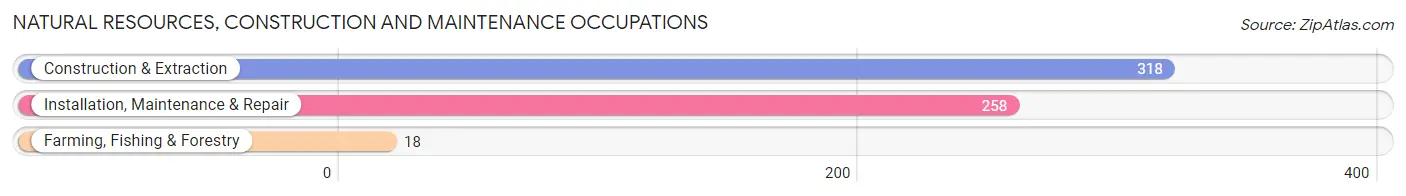
Natural Resources, Construction and Maintenance Occupations
The most common Natural Resources, Construction and Maintenance occupations in Williamsport are Construction & Extraction (318 | 2.5%), Installation, Maintenance & Repair (258 | 2.1%), and Farming, Fishing & Forestry (18 | 0.1%).
Natural Resources, Construction and Maintenance Occupations by Sex
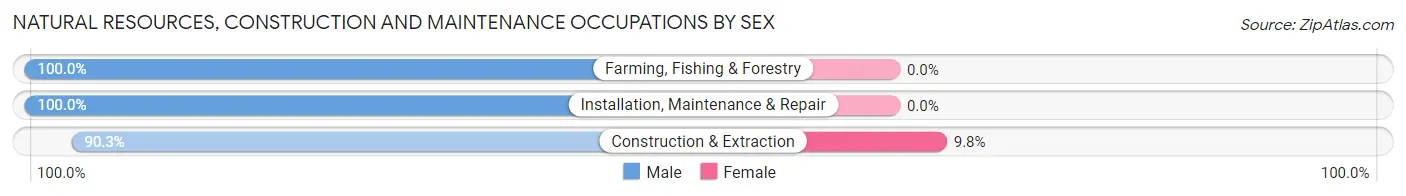
| Occupation | Male | Female |
| Farming, Fishing & Forestry | 18 (100.0%) | 0 (0.0%) |
| Construction & Extraction | 287 (90.2%) | 31 (9.8%) |
| Installation, Maintenance & Repair | 258 (100.0%) | 0 (0.0%) |
| Total (Category) | 563 (94.8%) | 31 (5.2%) |
| Total (Overall) | 6,246 (49.6%) | 6,339 (50.4%) |
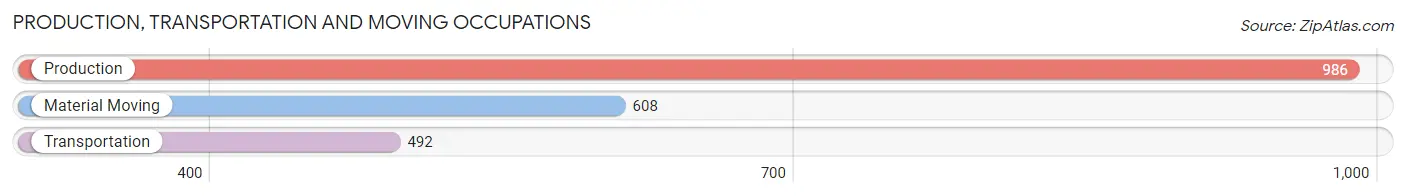
Production, Transportation and Moving Occupations
The most common Production, Transportation and Moving occupations in Williamsport are Production (986 | 7.8%), Material Moving (608 | 4.8%), and Transportation (492 | 3.9%).
Production, Transportation and Moving Occupations by Sex
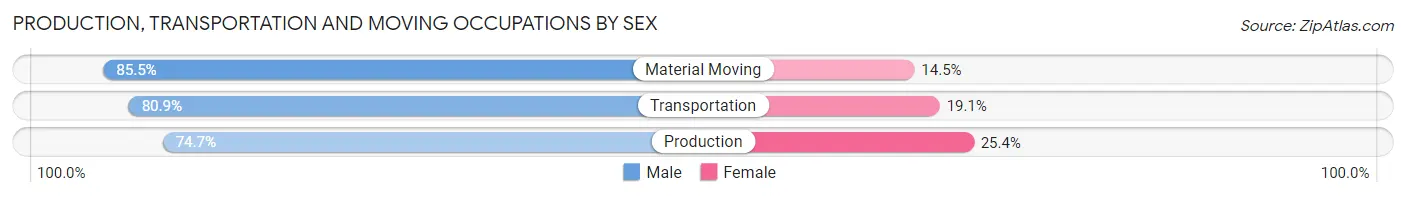
| Occupation | Male | Female |
| Production | 736 (74.7%) | 250 (25.4%) |
| Transportation | 398 (80.9%) | 94 (19.1%) |
| Material Moving | 520 (85.5%) | 88 (14.5%) |
| Total (Category) | 1,654 (79.3%) | 432 (20.7%) |
| Total (Overall) | 6,246 (49.6%) | 6,339 (50.4%) |
Employment Industries by Sex in Williamsport
Employment Industries in Williamsport
The major employment industries in Williamsport include Health Care & Social Assistance (2,099 | 16.7%), Manufacturing (1,717 | 13.6%), Educational Services (1,426 | 11.3%), Retail Trade (1,323 | 10.5%), and Accommodation & Food Services (1,212 | 9.6%).
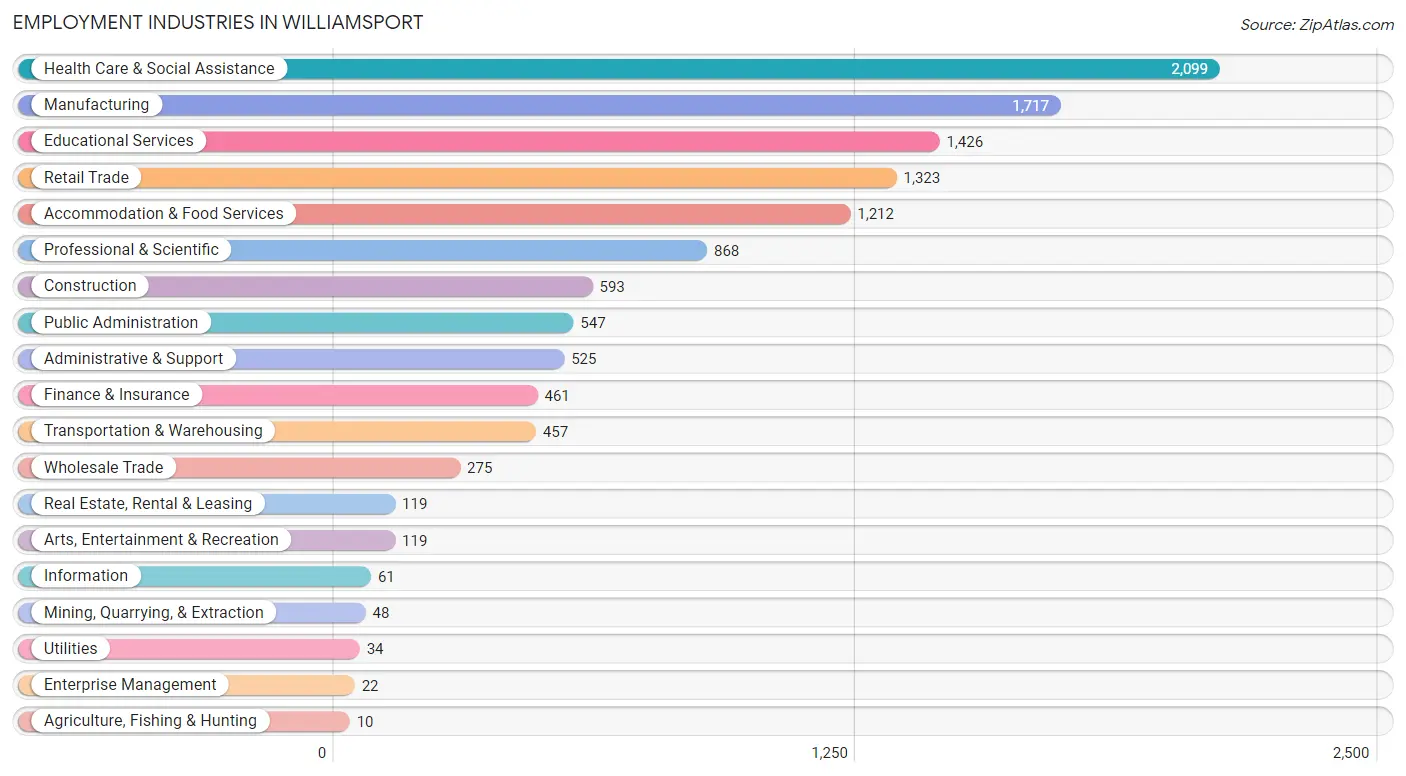
Employment Industries by Sex in Williamsport
The Williamsport industries that see more men than women are Mining, Quarrying, & Extraction (100.0%), Construction (96.1%), and Utilities (85.3%), whereas the industries that tend to have a higher number of women are Enterprise Management (100.0%), Health Care & Social Assistance (85.9%), and Finance & Insurance (70.3%).
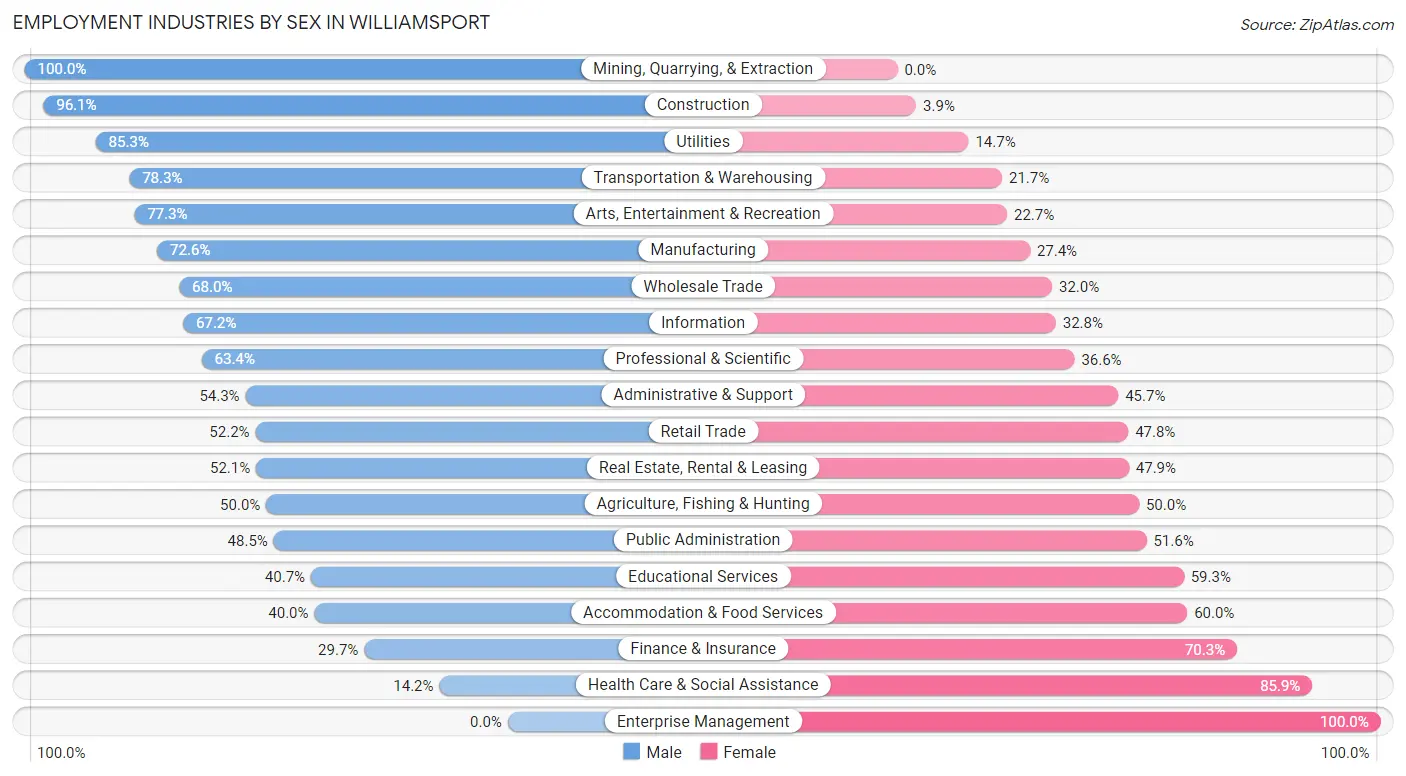
| Industry | Male | Female |
| Agriculture, Fishing & Hunting | 5 (50.0%) | 5 (50.0%) |
| Mining, Quarrying, & Extraction | 48 (100.0%) | 0 (0.0%) |
| Construction | 570 (96.1%) | 23 (3.9%) |
| Manufacturing | 1,246 (72.6%) | 471 (27.4%) |
| Wholesale Trade | 187 (68.0%) | 88 (32.0%) |
| Retail Trade | 691 (52.2%) | 632 (47.8%) |
| Transportation & Warehousing | 358 (78.3%) | 99 (21.7%) |
| Utilities | 29 (85.3%) | 5 (14.7%) |
| Information | 41 (67.2%) | 20 (32.8%) |
| Finance & Insurance | 137 (29.7%) | 324 (70.3%) |
| Real Estate, Rental & Leasing | 62 (52.1%) | 57 (47.9%) |
| Professional & Scientific | 550 (63.4%) | 318 (36.6%) |
| Enterprise Management | 0 (0.0%) | 22 (100.0%) |
| Administrative & Support | 285 (54.3%) | 240 (45.7%) |
| Educational Services | 581 (40.7%) | 845 (59.3%) |
| Health Care & Social Assistance | 297 (14.1%) | 1,802 (85.9%) |
| Arts, Entertainment & Recreation | 92 (77.3%) | 27 (22.7%) |
| Accommodation & Food Services | 485 (40.0%) | 727 (60.0%) |
| Public Administration | 265 (48.4%) | 282 (51.5%) |
| Total | 6,246 (49.6%) | 6,339 (50.4%) |
Education in Williamsport
School Enrollment in Williamsport
The most common levels of schooling among the 8,542 students in Williamsport are college / undergraduate (4,324 | 50.6%), elementary school (1,316 | 15.4%), and high school (1,226 | 14.3%).
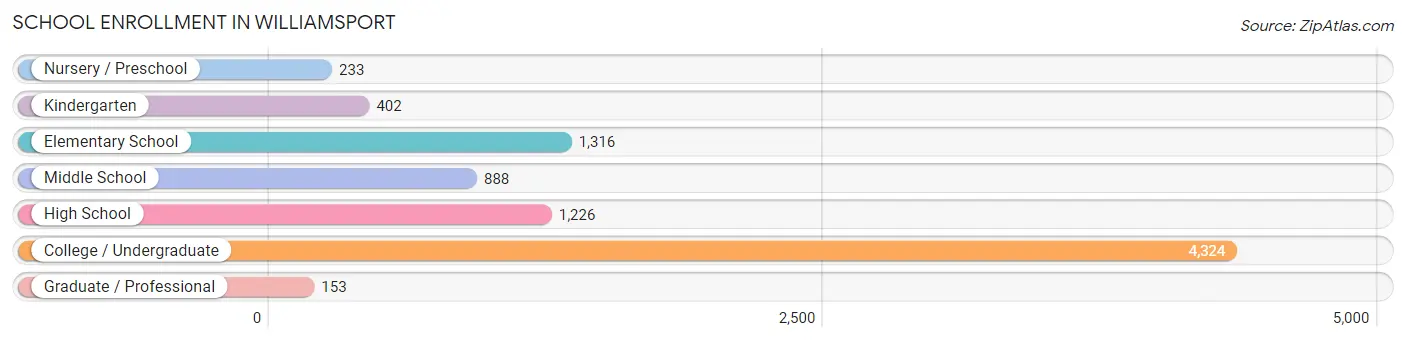
| School Level | # Students | % Students |
| Nursery / Preschool | 233 | 2.7% |
| Kindergarten | 402 | 4.7% |
| Elementary School | 1,316 | 15.4% |
| Middle School | 888 | 10.4% |
| High School | 1,226 | 14.3% |
| College / Undergraduate | 4,324 | 50.6% |
| Graduate / Professional | 153 | 1.8% |
| Total | 8,542 | 100.0% |
School Enrollment by Age by Funding Source in Williamsport
Out of a total of 8,542 students who are enrolled in schools in Williamsport, 1,854 (21.7%) attend a private institution, while the remaining 6,688 (78.3%) are enrolled in public schools. The age group of 3 to 4 year olds has the highest likelihood of being enrolled in private schools, with 75 (42.9% in the age bracket) enrolled. Conversely, the age group of 15 to 17 year olds has the lowest likelihood of being enrolled in a private school, with 905 (97.7% in the age bracket) attending a public institution.
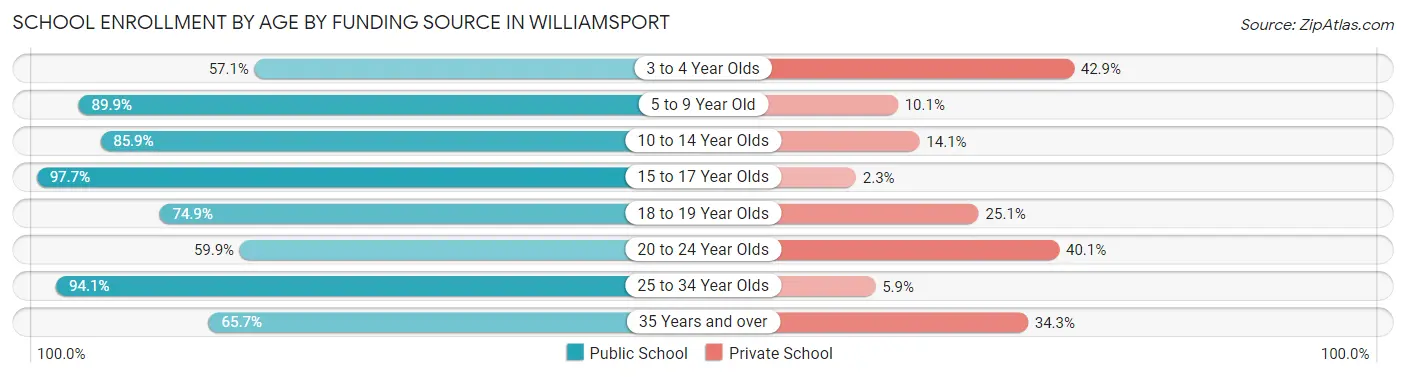
| Age Bracket | Public School | Private School |
| 3 to 4 Year Olds | 100 (57.1%) | 75 (42.9%) |
| 5 to 9 Year Old | 1,464 (89.9%) | 164 (10.1%) |
| 10 to 14 Year Olds | 980 (85.9%) | 161 (14.1%) |
| 15 to 17 Year Olds | 905 (97.7%) | 21 (2.3%) |
| 18 to 19 Year Olds | 1,495 (74.9%) | 502 (25.1%) |
| 20 to 24 Year Olds | 1,284 (59.9%) | 860 (40.1%) |
| 25 to 34 Year Olds | 368 (94.1%) | 23 (5.9%) |
| 35 Years and over | 92 (65.7%) | 48 (34.3%) |
| Total | 6,688 (78.3%) | 1,854 (21.7%) |
Educational Attainment by Field of Study in Williamsport
Arts & humanities (804 | 16.4%), business (599 | 12.2%), education (552 | 11.3%), bio, nature & agricultural (534 | 10.9%), and science & technology (415 | 8.5%) are the most common fields of study among 4,905 individuals in Williamsport who have obtained a bachelor's degree or higher.
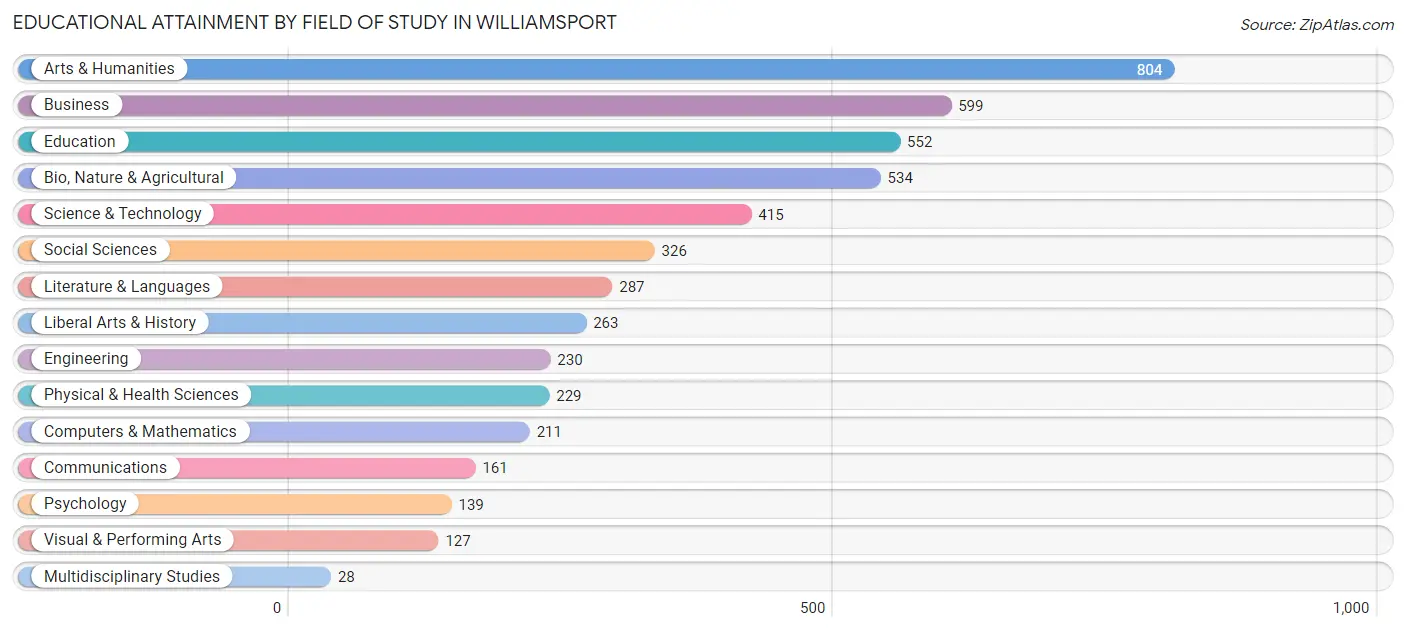
| Field of Study | # Graduates | % Graduates |
| Computers & Mathematics | 211 | 4.3% |
| Bio, Nature & Agricultural | 534 | 10.9% |
| Physical & Health Sciences | 229 | 4.7% |
| Psychology | 139 | 2.8% |
| Social Sciences | 326 | 6.7% |
| Engineering | 230 | 4.7% |
| Multidisciplinary Studies | 28 | 0.6% |
| Science & Technology | 415 | 8.5% |
| Business | 599 | 12.2% |
| Education | 552 | 11.3% |
| Literature & Languages | 287 | 5.9% |
| Liberal Arts & History | 263 | 5.4% |
| Visual & Performing Arts | 127 | 2.6% |
| Communications | 161 | 3.3% |
| Arts & Humanities | 804 | 16.4% |
| Total | 4,905 | 100.0% |
Transportation & Commute in Williamsport
Vehicle Availability by Sex in Williamsport
The most prevalent vehicle ownership categories in Williamsport are males with 2 vehicles (2,295, accounting for 39.7%) and females with 2 vehicles (2,413, making up 41.0%).
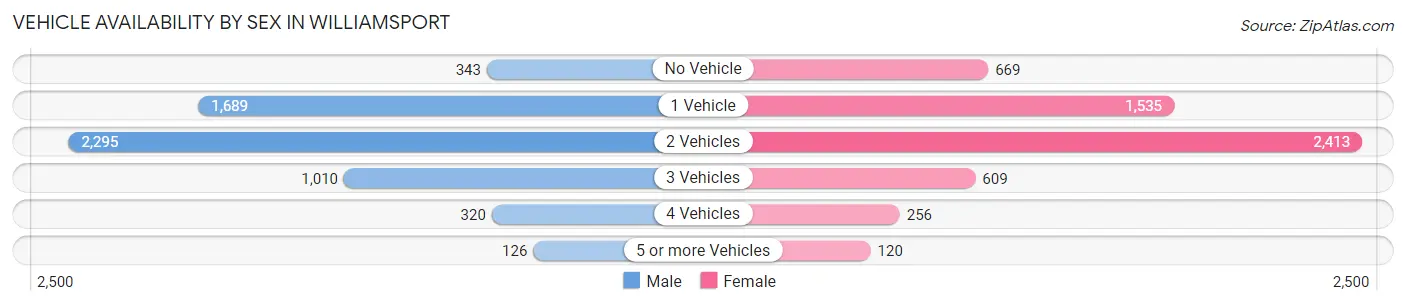
| Vehicles Available | Male | Female |
| No Vehicle | 343 (5.9%) | 669 (11.9%) |
| 1 Vehicle | 1,689 (29.2%) | 1,535 (27.4%) |
| 2 Vehicles | 2,295 (39.7%) | 2,413 (43.1%) |
| 3 Vehicles | 1,010 (17.5%) | 609 (10.9%) |
| 4 Vehicles | 320 (5.5%) | 256 (4.6%) |
| 5 or more Vehicles | 126 (2.2%) | 120 (2.1%) |
| Total | 5,783 (100.0%) | 5,602 (100.0%) |
Commute Time in Williamsport
The most frequently occuring commute durations in Williamsport are 10 to 14 minutes (2,953 commuters, 25.8%), 5 to 9 minutes (2,843 commuters, 24.8%), and 15 to 19 minutes (1,764 commuters, 15.4%).
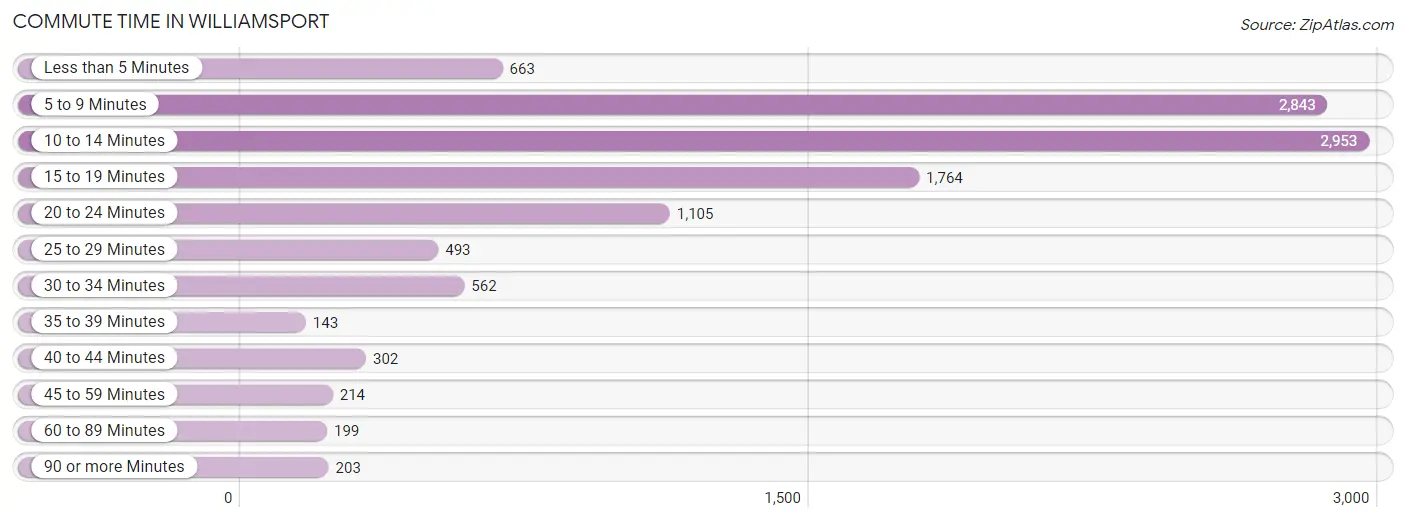
| Commute Time | # Commuters | % Commuters |
| Less than 5 Minutes | 663 | 5.8% |
| 5 to 9 Minutes | 2,843 | 24.8% |
| 10 to 14 Minutes | 2,953 | 25.8% |
| 15 to 19 Minutes | 1,764 | 15.4% |
| 20 to 24 Minutes | 1,105 | 9.7% |
| 25 to 29 Minutes | 493 | 4.3% |
| 30 to 34 Minutes | 562 | 4.9% |
| 35 to 39 Minutes | 143 | 1.3% |
| 40 to 44 Minutes | 302 | 2.6% |
| 45 to 59 Minutes | 214 | 1.9% |
| 60 to 89 Minutes | 199 | 1.7% |
| 90 or more Minutes | 203 | 1.8% |
Commute Time by Sex in Williamsport
The most common commute times in Williamsport are 10 to 14 minutes (1,381 commuters, 23.9%) for males and 5 to 9 minutes (1,620 commuters, 28.5%) for females.
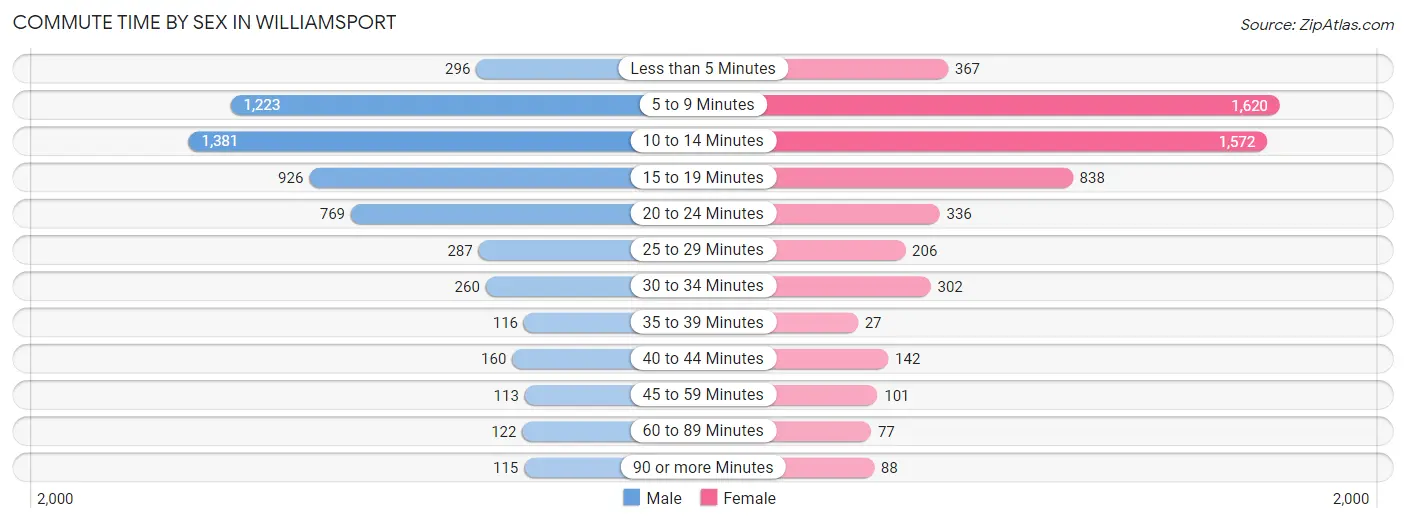
| Commute Time | Male | Female |
| Less than 5 Minutes | 296 (5.1%) | 367 (6.5%) |
| 5 to 9 Minutes | 1,223 (21.2%) | 1,620 (28.5%) |
| 10 to 14 Minutes | 1,381 (23.9%) | 1,572 (27.7%) |
| 15 to 19 Minutes | 926 (16.1%) | 838 (14.8%) |
| 20 to 24 Minutes | 769 (13.3%) | 336 (5.9%) |
| 25 to 29 Minutes | 287 (5.0%) | 206 (3.6%) |
| 30 to 34 Minutes | 260 (4.5%) | 302 (5.3%) |
| 35 to 39 Minutes | 116 (2.0%) | 27 (0.5%) |
| 40 to 44 Minutes | 160 (2.8%) | 142 (2.5%) |
| 45 to 59 Minutes | 113 (2.0%) | 101 (1.8%) |
| 60 to 89 Minutes | 122 (2.1%) | 77 (1.4%) |
| 90 or more Minutes | 115 (2.0%) | 88 (1.5%) |
Time of Departure to Work by Sex in Williamsport
The most frequent times of departure to work in Williamsport are 12:00 PM to 3:59 PM (813, 14.1%) for males and 7:30 AM to 7:59 AM (892, 15.7%) for females.
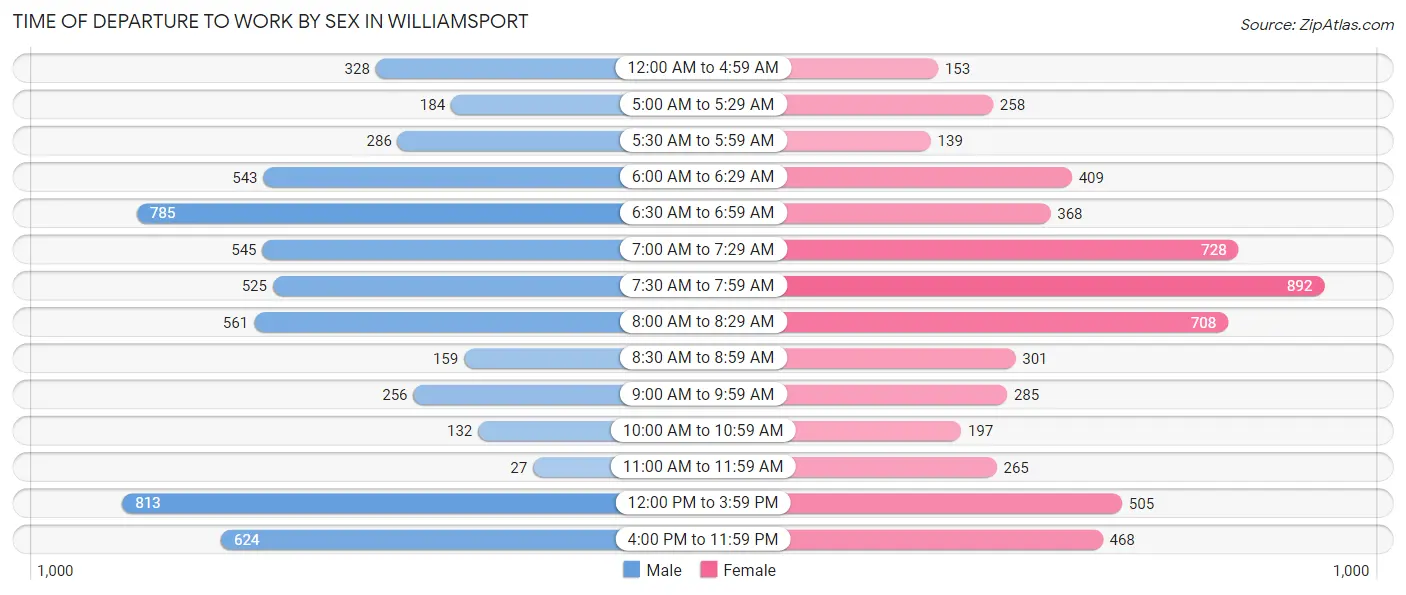
| Time of Departure | Male | Female |
| 12:00 AM to 4:59 AM | 328 (5.7%) | 153 (2.7%) |
| 5:00 AM to 5:29 AM | 184 (3.2%) | 258 (4.5%) |
| 5:30 AM to 5:59 AM | 286 (5.0%) | 139 (2.5%) |
| 6:00 AM to 6:29 AM | 543 (9.4%) | 409 (7.2%) |
| 6:30 AM to 6:59 AM | 785 (13.6%) | 368 (6.5%) |
| 7:00 AM to 7:29 AM | 545 (9.5%) | 728 (12.8%) |
| 7:30 AM to 7:59 AM | 525 (9.1%) | 892 (15.7%) |
| 8:00 AM to 8:29 AM | 561 (9.7%) | 708 (12.5%) |
| 8:30 AM to 8:59 AM | 159 (2.8%) | 301 (5.3%) |
| 9:00 AM to 9:59 AM | 256 (4.4%) | 285 (5.0%) |
| 10:00 AM to 10:59 AM | 132 (2.3%) | 197 (3.5%) |
| 11:00 AM to 11:59 AM | 27 (0.5%) | 265 (4.7%) |
| 12:00 PM to 3:59 PM | 813 (14.1%) | 505 (8.9%) |
| 4:00 PM to 11:59 PM | 624 (10.8%) | 468 (8.3%) |
| Total | 5,768 (100.0%) | 5,676 (100.0%) |
Housing Occupancy in Williamsport
Occupancy by Ownership in Williamsport
Of the total 10,866 dwellings in Williamsport, owner-occupied units account for 4,744 (43.7%), while renter-occupied units make up 6,122 (56.3%).
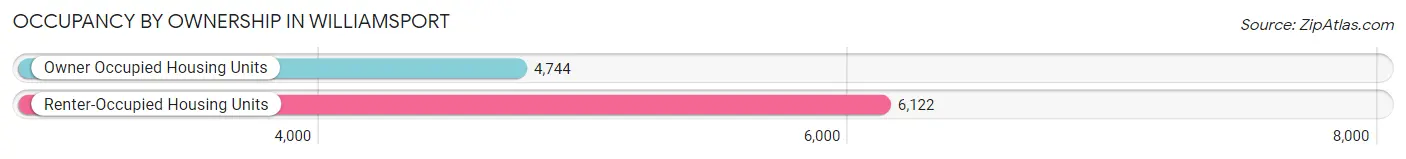
| Occupancy | # Housing Units | % Housing Units |
| Owner Occupied Housing Units | 4,744 | 43.7% |
| Renter-Occupied Housing Units | 6,122 | 56.3% |
| Total Occupied Housing Units | 10,866 | 100.0% |
Occupancy by Household Size in Williamsport
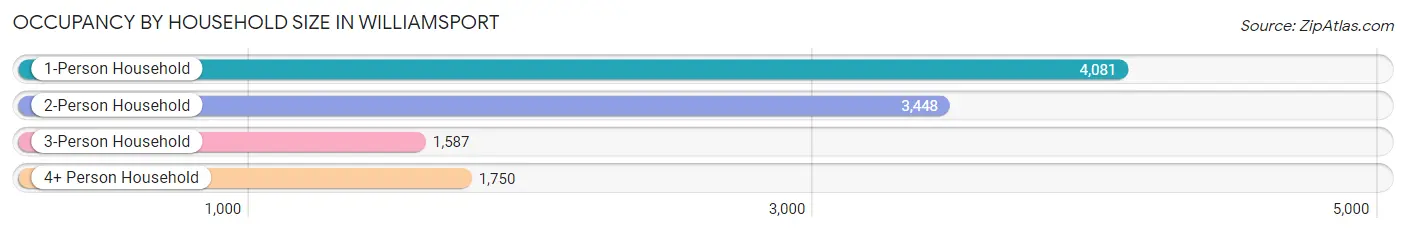
| Household Size | # Housing Units | % Housing Units |
| 1-Person Household | 4,081 | 37.6% |
| 2-Person Household | 3,448 | 31.7% |
| 3-Person Household | 1,587 | 14.6% |
| 4+ Person Household | 1,750 | 16.1% |
| Total Housing Units | 10,866 | 100.0% |
Occupancy by Ownership by Household Size in Williamsport
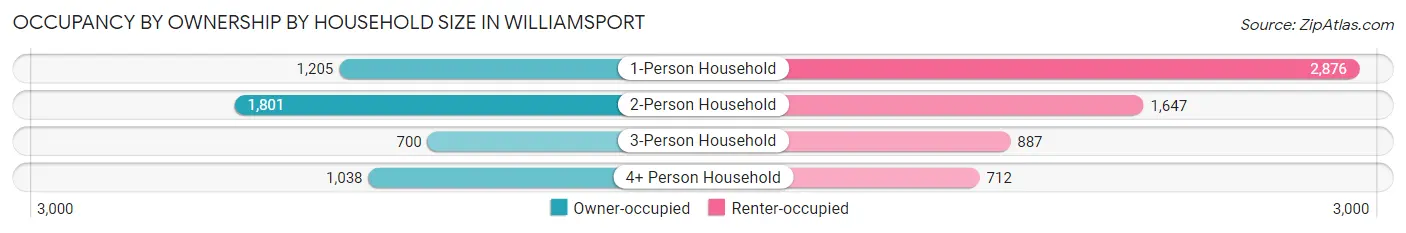
| Household Size | Owner-occupied | Renter-occupied |
| 1-Person Household | 1,205 (29.5%) | 2,876 (70.5%) |
| 2-Person Household | 1,801 (52.2%) | 1,647 (47.8%) |
| 3-Person Household | 700 (44.1%) | 887 (55.9%) |
| 4+ Person Household | 1,038 (59.3%) | 712 (40.7%) |
| Total Housing Units | 4,744 (43.7%) | 6,122 (56.3%) |
Occupancy by Educational Attainment in Williamsport
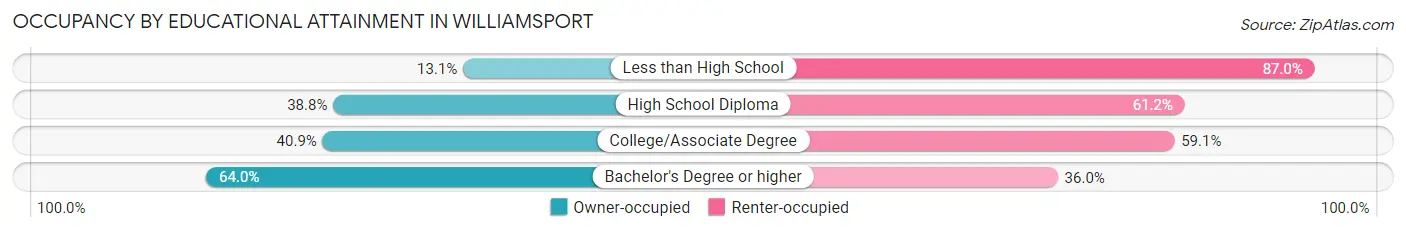
| Household Size | Owner-occupied | Renter-occupied |
| Less than High School | 159 (13.1%) | 1,059 (87.0%) |
| High School Diploma | 1,300 (38.8%) | 2,050 (61.2%) |
| College/Associate Degree | 1,321 (40.9%) | 1,909 (59.1%) |
| Bachelor's Degree or higher | 1,964 (64.0%) | 1,104 (36.0%) |
Occupancy by Age of Householder in Williamsport
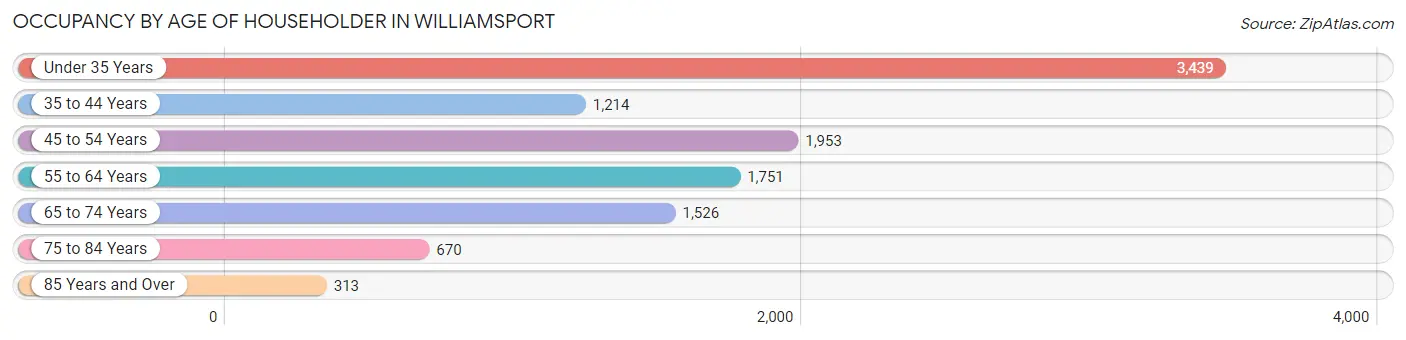
| Age Bracket | # Households | % Households |
| Under 35 Years | 3,439 | 31.7% |
| 35 to 44 Years | 1,214 | 11.2% |
| 45 to 54 Years | 1,953 | 18.0% |
| 55 to 64 Years | 1,751 | 16.1% |
| 65 to 74 Years | 1,526 | 14.0% |
| 75 to 84 Years | 670 | 6.2% |
| 85 Years and Over | 313 | 2.9% |
| Total | 10,866 | 100.0% |
Housing Finances in Williamsport
Median Income by Occupancy in Williamsport
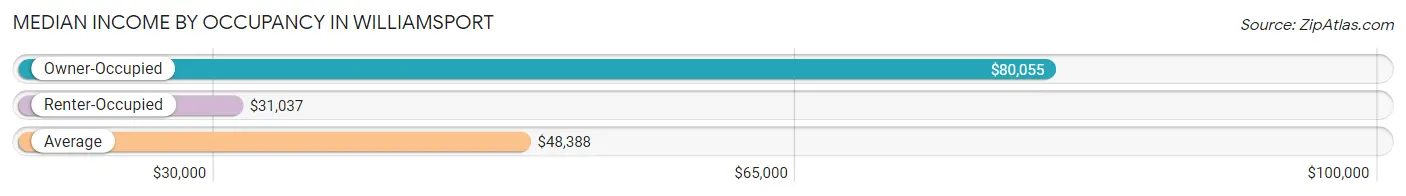
| Occupancy Type | # Households | Median Income |
| Owner-Occupied | 4,744 (43.7%) | $80,055 |
| Renter-Occupied | 6,122 (56.3%) | $31,037 |
| Average | 10,866 (100.0%) | $48,388 |
Occupancy by Householder Income Bracket in Williamsport
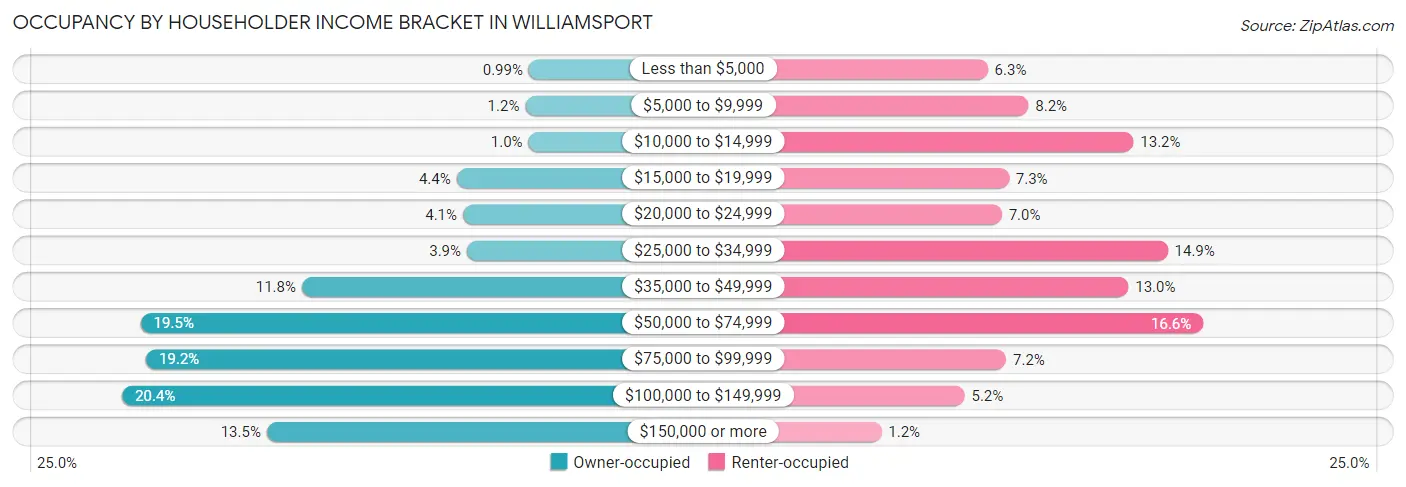
| Income Bracket | Owner-occupied | Renter-occupied |
| Less than $5,000 | 47 (1.0%) | 385 (6.3%) |
| $5,000 to $9,999 | 55 (1.2%) | 504 (8.2%) |
| $10,000 to $14,999 | 48 (1.0%) | 810 (13.2%) |
| $15,000 to $19,999 | 210 (4.4%) | 447 (7.3%) |
| $20,000 to $24,999 | 196 (4.1%) | 426 (7.0%) |
| $25,000 to $34,999 | 187 (3.9%) | 910 (14.9%) |
| $35,000 to $49,999 | 560 (11.8%) | 795 (13.0%) |
| $50,000 to $74,999 | 924 (19.5%) | 1,013 (16.6%) |
| $75,000 to $99,999 | 912 (19.2%) | 439 (7.2%) |
| $100,000 to $149,999 | 966 (20.4%) | 318 (5.2%) |
| $150,000 or more | 639 (13.5%) | 75 (1.2%) |
| Total | 4,744 (100.0%) | 6,122 (100.0%) |
Monthly Housing Cost Tiers in Williamsport
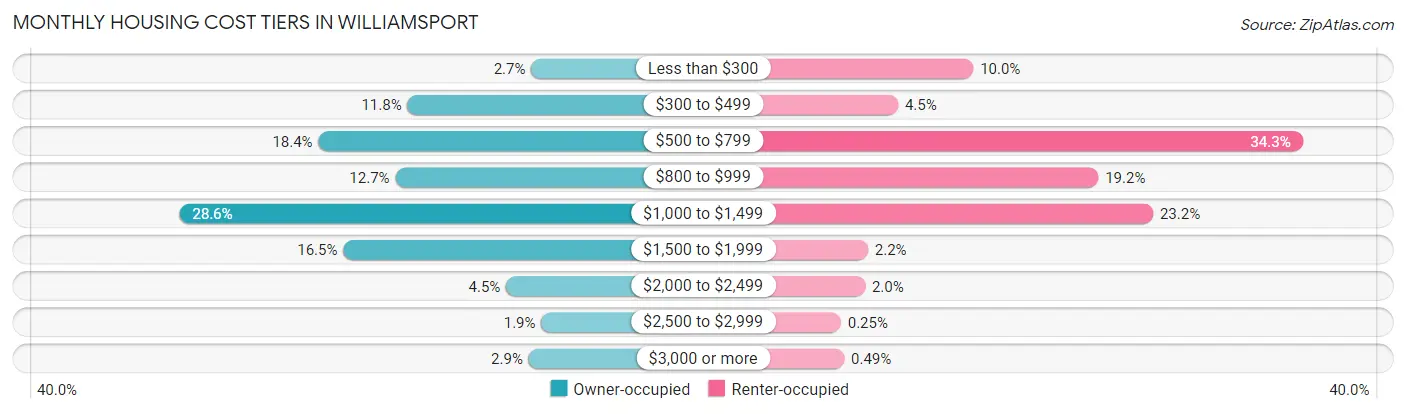
| Monthly Cost | Owner-occupied | Renter-occupied |
| Less than $300 | 127 (2.7%) | 612 (10.0%) |
| $300 to $499 | 560 (11.8%) | 273 (4.5%) |
| $500 to $799 | 871 (18.4%) | 2,097 (34.3%) |
| $800 to $999 | 602 (12.7%) | 1,176 (19.2%) |
| $1,000 to $1,499 | 1,357 (28.6%) | 1,423 (23.2%) |
| $1,500 to $1,999 | 784 (16.5%) | 137 (2.2%) |
| $2,000 to $2,499 | 215 (4.5%) | 124 (2.0%) |
| $2,500 to $2,999 | 92 (1.9%) | 15 (0.3%) |
| $3,000 or more | 136 (2.9%) | 30 (0.5%) |
| Total | 4,744 (100.0%) | 6,122 (100.0%) |
Physical Housing Characteristics in Williamsport
Housing Structures in Williamsport
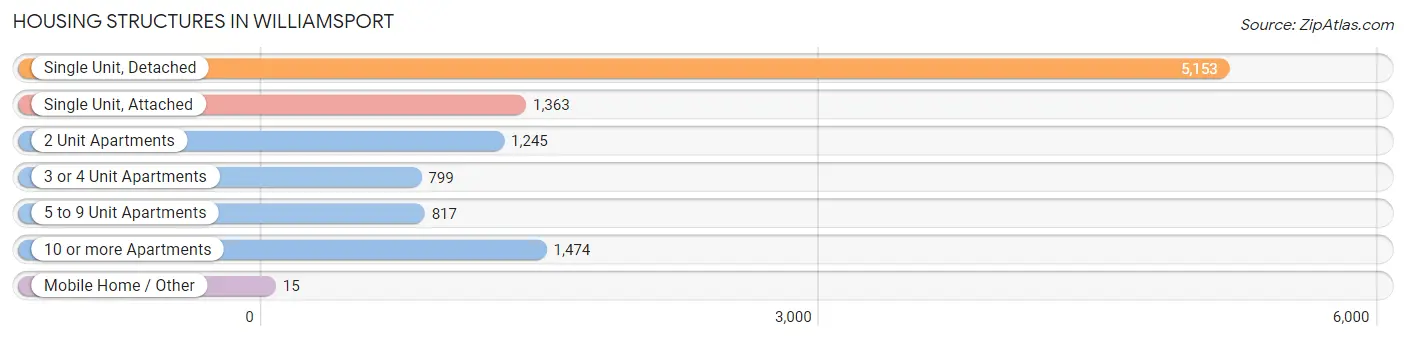
| Structure Type | # Housing Units | % Housing Units |
| Single Unit, Detached | 5,153 | 47.4% |
| Single Unit, Attached | 1,363 | 12.5% |
| 2 Unit Apartments | 1,245 | 11.5% |
| 3 or 4 Unit Apartments | 799 | 7.3% |
| 5 to 9 Unit Apartments | 817 | 7.5% |
| 10 or more Apartments | 1,474 | 13.6% |
| Mobile Home / Other | 15 | 0.1% |
| Total | 10,866 | 100.0% |
Housing Structures by Occupancy in Williamsport
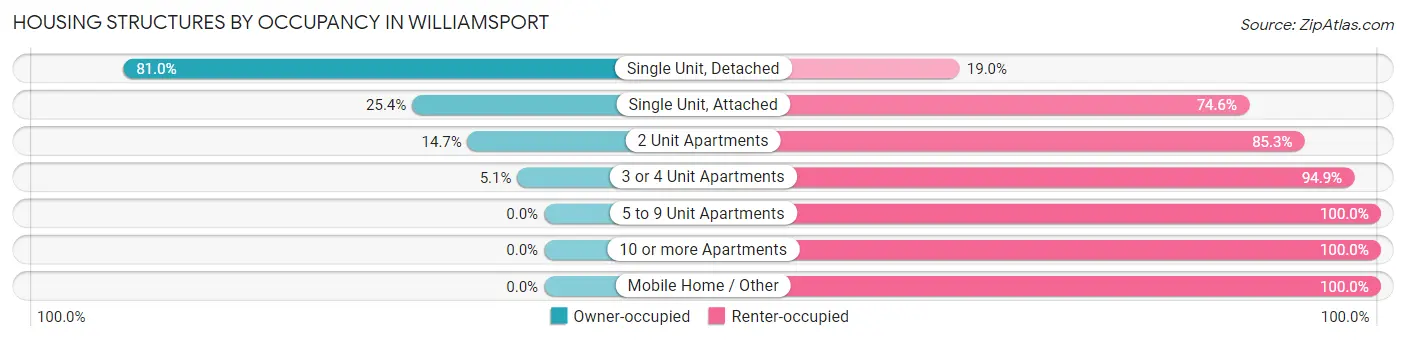
| Structure Type | Owner-occupied | Renter-occupied |
| Single Unit, Detached | 4,174 (81.0%) | 979 (19.0%) |
| Single Unit, Attached | 346 (25.4%) | 1,017 (74.6%) |
| 2 Unit Apartments | 183 (14.7%) | 1,062 (85.3%) |
| 3 or 4 Unit Apartments | 41 (5.1%) | 758 (94.9%) |
| 5 to 9 Unit Apartments | 0 (0.0%) | 817 (100.0%) |
| 10 or more Apartments | 0 (0.0%) | 1,474 (100.0%) |
| Mobile Home / Other | 0 (0.0%) | 15 (100.0%) |
| Total | 4,744 (43.7%) | 6,122 (56.3%) |
Housing Structures by Number of Rooms in Williamsport
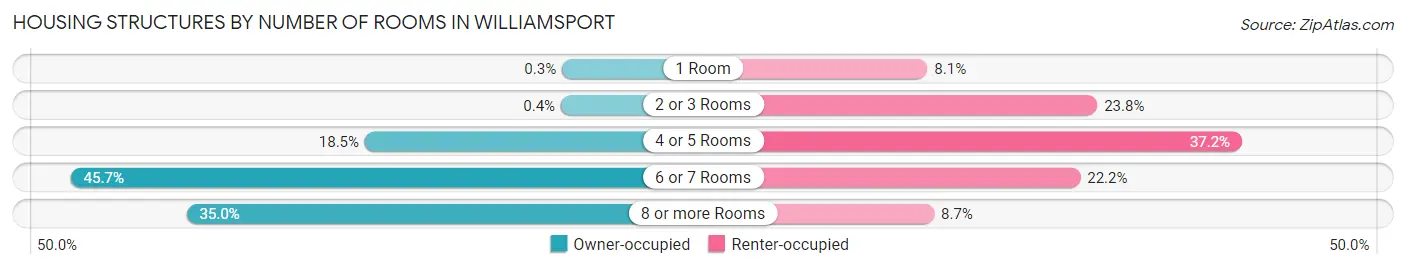
| Number of Rooms | Owner-occupied | Renter-occupied |
| 1 Room | 14 (0.3%) | 495 (8.1%) |
| 2 or 3 Rooms | 19 (0.4%) | 1,457 (23.8%) |
| 4 or 5 Rooms | 879 (18.5%) | 2,276 (37.2%) |
| 6 or 7 Rooms | 2,170 (45.7%) | 1,361 (22.2%) |
| 8 or more Rooms | 1,662 (35.0%) | 533 (8.7%) |
| Total | 4,744 (100.0%) | 6,122 (100.0%) |
Housing Structure by Heating Type in Williamsport
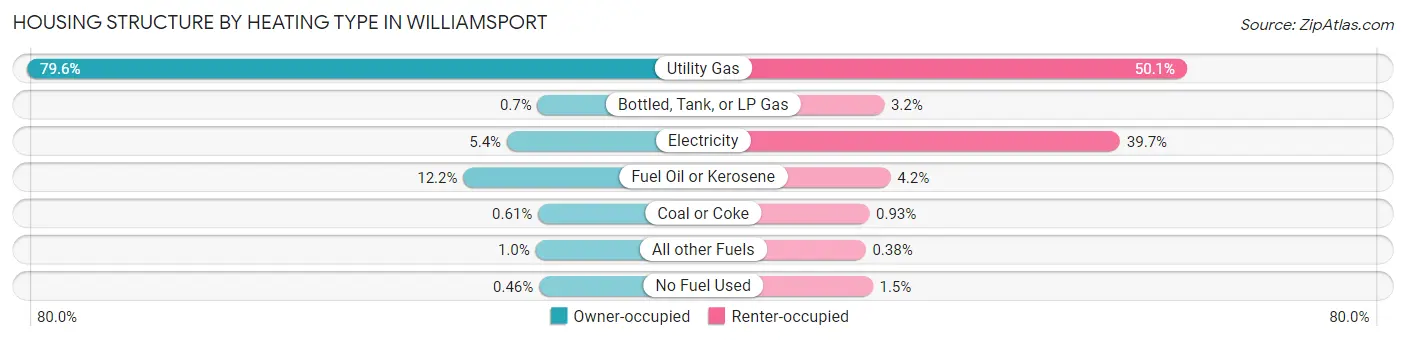
| Heating Type | Owner-occupied | Renter-occupied |
| Utility Gas | 3,776 (79.6%) | 3,064 (50.0%) |
| Bottled, Tank, or LP Gas | 33 (0.7%) | 198 (3.2%) |
| Electricity | 258 (5.4%) | 2,431 (39.7%) |
| Fuel Oil or Kerosene | 578 (12.2%) | 259 (4.2%) |
| Coal or Coke | 29 (0.6%) | 57 (0.9%) |
| All other Fuels | 48 (1.0%) | 23 (0.4%) |
| No Fuel Used | 22 (0.5%) | 90 (1.5%) |
| Total | 4,744 (100.0%) | 6,122 (100.0%) |
Household Vehicle Usage in Williamsport
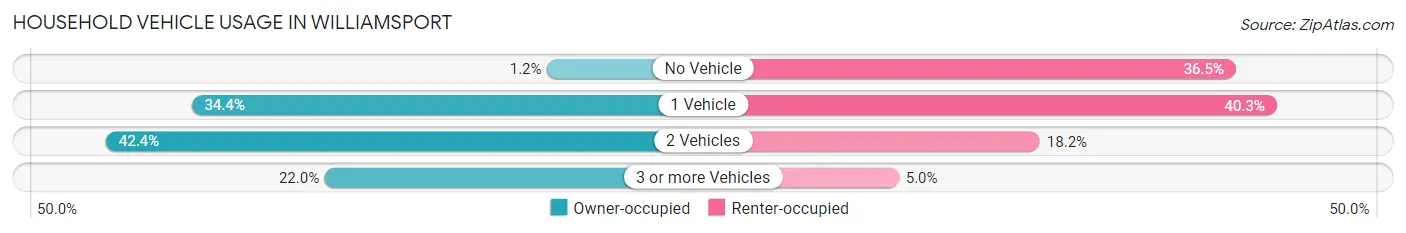
| Vehicles per Household | Owner-occupied | Renter-occupied |
| No Vehicle | 57 (1.2%) | 2,233 (36.5%) |
| 1 Vehicle | 1,633 (34.4%) | 2,467 (40.3%) |
| 2 Vehicles | 2,012 (42.4%) | 1,114 (18.2%) |
| 3 or more Vehicles | 1,042 (22.0%) | 308 (5.0%) |
| Total | 4,744 (100.0%) | 6,122 (100.0%) |
Real Estate & Mortgages in Williamsport
Real Estate and Mortgage Overview in Williamsport
| Characteristic | Without Mortgage | With Mortgage |
| Housing Units | 1,581 | 3,163 |
| Median Property Value | $136,800 | $136,000 |
| Median Household Income | $62,594 | $449 |
| Monthly Housing Costs | $537 | $136 |
| Real Estate Taxes | $2,640 | $50 |
Property Value by Mortgage Status in Williamsport
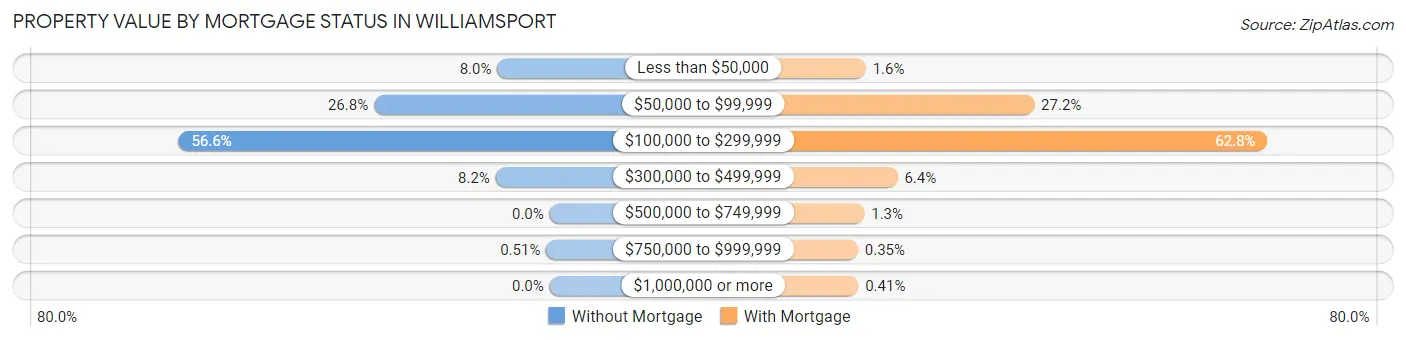
| Property Value | Without Mortgage | With Mortgage |
| Less than $50,000 | 126 (8.0%) | 49 (1.5%) |
| $50,000 to $99,999 | 423 (26.8%) | 861 (27.2%) |
| $100,000 to $299,999 | 894 (56.6%) | 1,985 (62.8%) |
| $300,000 to $499,999 | 130 (8.2%) | 202 (6.4%) |
| $500,000 to $749,999 | 0 (0.0%) | 42 (1.3%) |
| $750,000 to $999,999 | 8 (0.5%) | 11 (0.4%) |
| $1,000,000 or more | 0 (0.0%) | 13 (0.4%) |
| Total | 1,581 (100.0%) | 3,163 (100.0%) |
Household Income by Mortgage Status in Williamsport
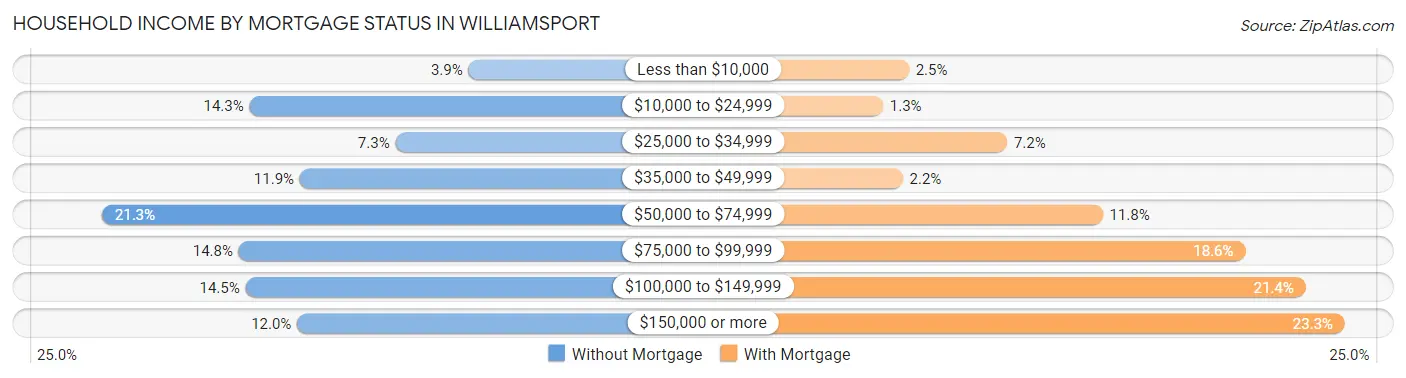
| Household Income | Without Mortgage | With Mortgage |
| Less than $10,000 | 61 (3.9%) | 80 (2.5%) |
| $10,000 to $24,999 | 226 (14.3%) | 41 (1.3%) |
| $25,000 to $34,999 | 116 (7.3%) | 228 (7.2%) |
| $35,000 to $49,999 | 188 (11.9%) | 71 (2.2%) |
| $50,000 to $74,999 | 337 (21.3%) | 372 (11.8%) |
| $75,000 to $99,999 | 234 (14.8%) | 587 (18.6%) |
| $100,000 to $149,999 | 229 (14.5%) | 678 (21.4%) |
| $150,000 or more | 190 (12.0%) | 737 (23.3%) |
| Total | 1,581 (100.0%) | 3,163 (100.0%) |
Property Value to Household Income Ratio in Williamsport
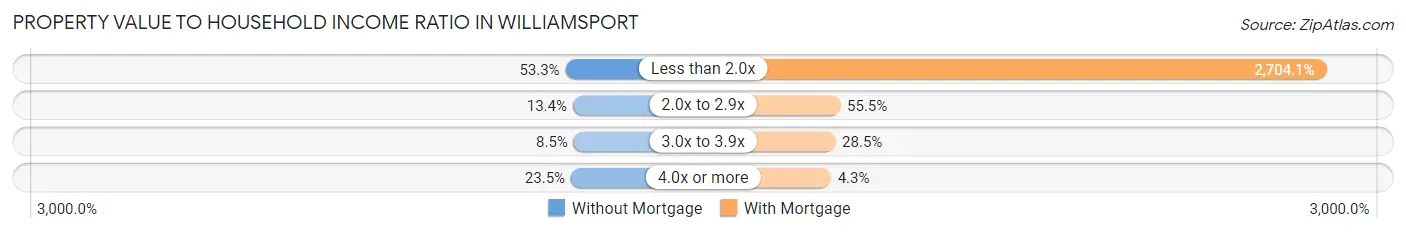
| Value-to-Income Ratio | Without Mortgage | With Mortgage |
| Less than 2.0x | 842 (53.3%) | 85,531 (2,704.1%) |
| 2.0x to 2.9x | 211 (13.4%) | 1,756 (55.5%) |
| 3.0x to 3.9x | 134 (8.5%) | 902 (28.5%) |
| 4.0x or more | 371 (23.5%) | 137 (4.3%) |
| Total | 1,581 (100.0%) | 3,163 (100.0%) |
Real Estate Taxes by Mortgage Status in Williamsport
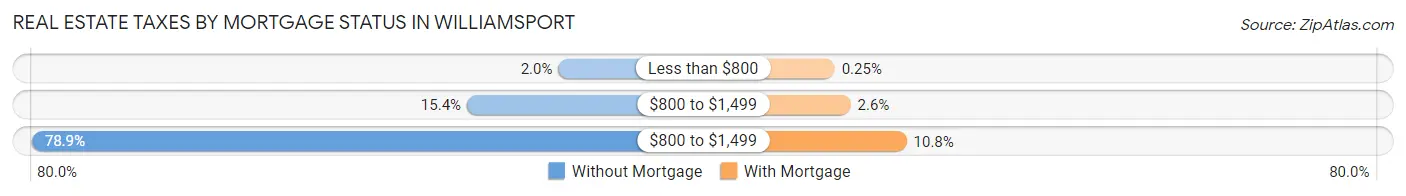
| Property Taxes | Without Mortgage | With Mortgage |
| Less than $800 | 32 (2.0%) | 8 (0.3%) |
| $800 to $1,499 | 243 (15.4%) | 81 (2.6%) |
| $800 to $1,499 | 1,248 (78.9%) | 340 (10.7%) |
| Total | 1,581 (100.0%) | 3,163 (100.0%) |
Health & Disability in Williamsport
Health Insurance Coverage by Age in Williamsport
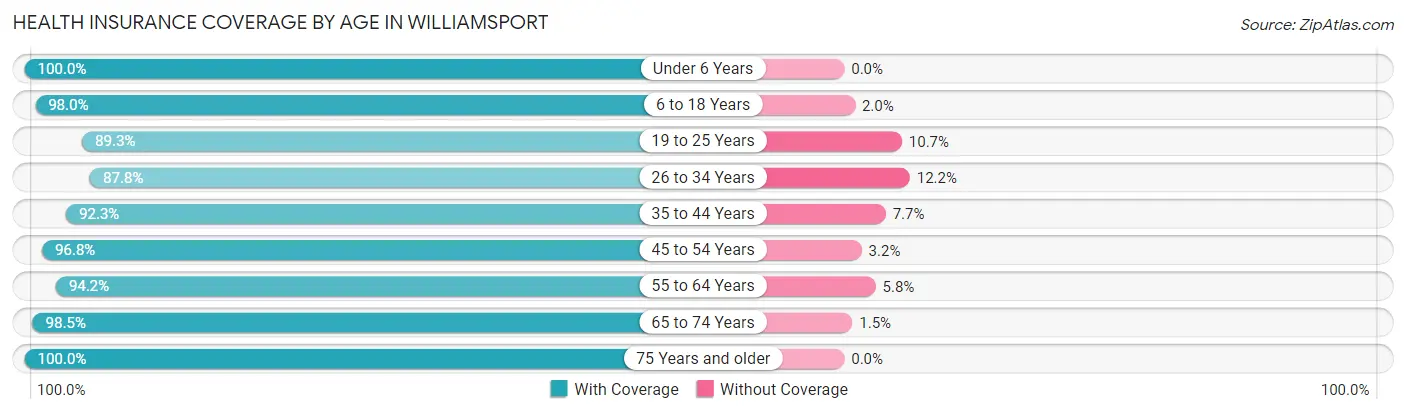
| Age Bracket | With Coverage | Without Coverage |
| Under 6 Years | 2,049 (100.0%) | 0 (0.0%) |
| 6 to 18 Years | 4,684 (98.0%) | 95 (2.0%) |
| 19 to 25 Years | 4,282 (89.3%) | 515 (10.7%) |
| 26 to 34 Years | 3,560 (87.8%) | 495 (12.2%) |
| 35 to 44 Years | 2,069 (92.3%) | 173 (7.7%) |
| 45 to 54 Years | 2,781 (96.8%) | 93 (3.2%) |
| 55 to 64 Years | 2,723 (94.2%) | 169 (5.8%) |
| 65 to 74 Years | 2,293 (98.5%) | 35 (1.5%) |
| 75 Years and older | 1,294 (100.0%) | 0 (0.0%) |
| Total | 25,735 (94.2%) | 1,575 (5.8%) |
Health Insurance Coverage by Citizenship Status in Williamsport
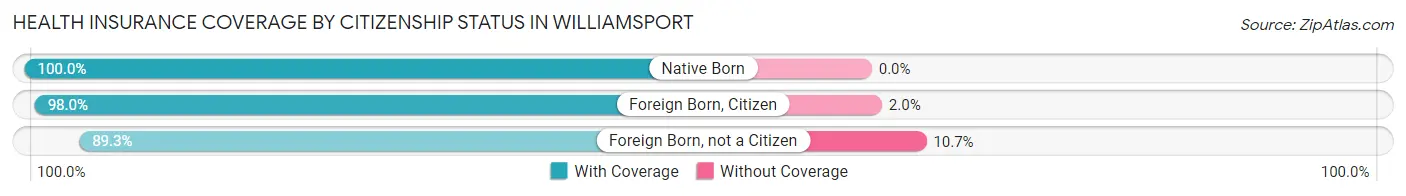
| Citizenship Status | With Coverage | Without Coverage |
| Native Born | 2,049 (100.0%) | 0 (0.0%) |
| Foreign Born, Citizen | 4,684 (98.0%) | 95 (2.0%) |
| Foreign Born, not a Citizen | 4,282 (89.3%) | 515 (10.7%) |
Health Insurance Coverage by Household Income in Williamsport
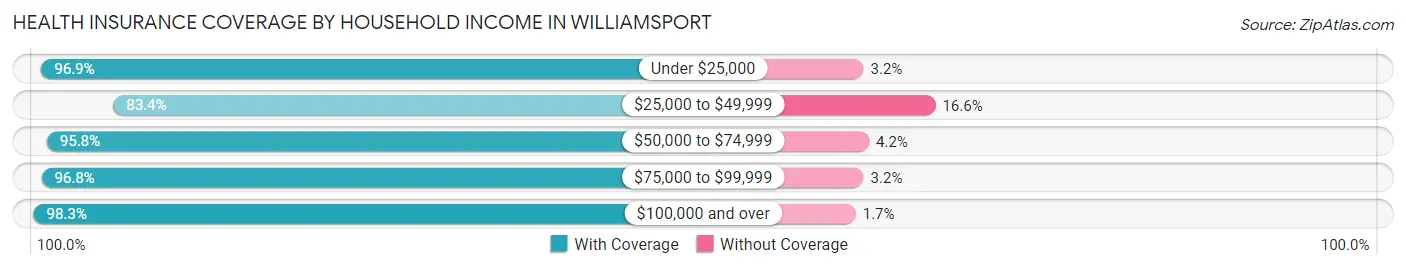
| Household Income | With Coverage | Without Coverage |
| Under $25,000 | 5,323 (96.9%) | 173 (3.2%) |
| $25,000 to $49,999 | 4,044 (83.4%) | 806 (16.6%) |
| $50,000 to $74,999 | 4,398 (95.8%) | 192 (4.2%) |
| $75,000 to $99,999 | 3,158 (96.8%) | 103 (3.2%) |
| $100,000 and over | 5,953 (98.3%) | 102 (1.7%) |
Public vs Private Health Insurance Coverage by Age in Williamsport
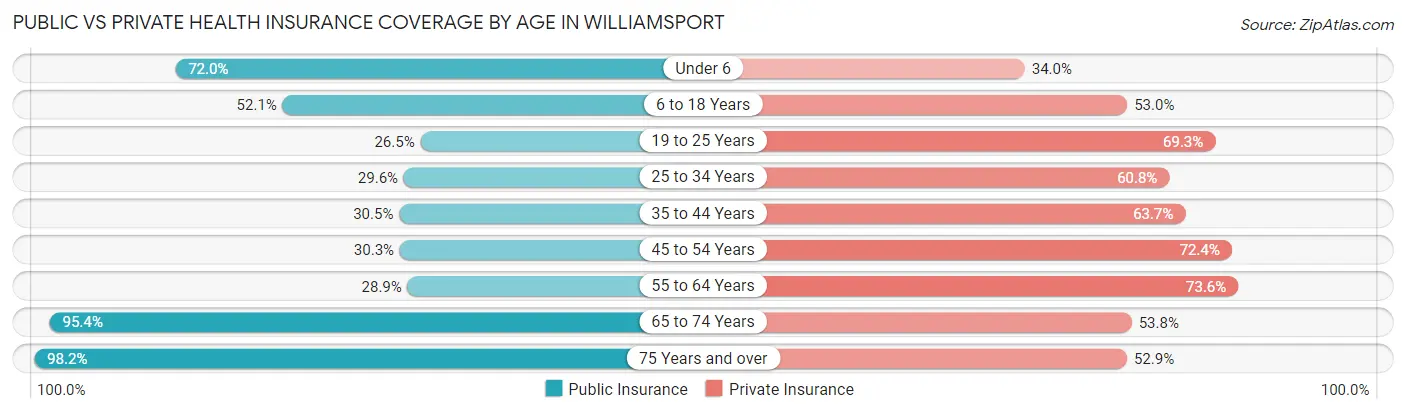
| Age Bracket | Public Insurance | Private Insurance |
| Under 6 | 1,476 (72.0%) | 696 (34.0%) |
| 6 to 18 Years | 2,490 (52.1%) | 2,532 (53.0%) |
| 19 to 25 Years | 1,272 (26.5%) | 3,324 (69.3%) |
| 25 to 34 Years | 1,200 (29.6%) | 2,464 (60.8%) |
| 35 to 44 Years | 683 (30.5%) | 1,429 (63.7%) |
| 45 to 54 Years | 872 (30.3%) | 2,080 (72.4%) |
| 55 to 64 Years | 836 (28.9%) | 2,127 (73.6%) |
| 65 to 74 Years | 2,220 (95.4%) | 1,253 (53.8%) |
| 75 Years and over | 1,271 (98.2%) | 685 (52.9%) |
| Total | 12,320 (45.1%) | 16,590 (60.8%) |
Disability Status by Sex by Age in Williamsport
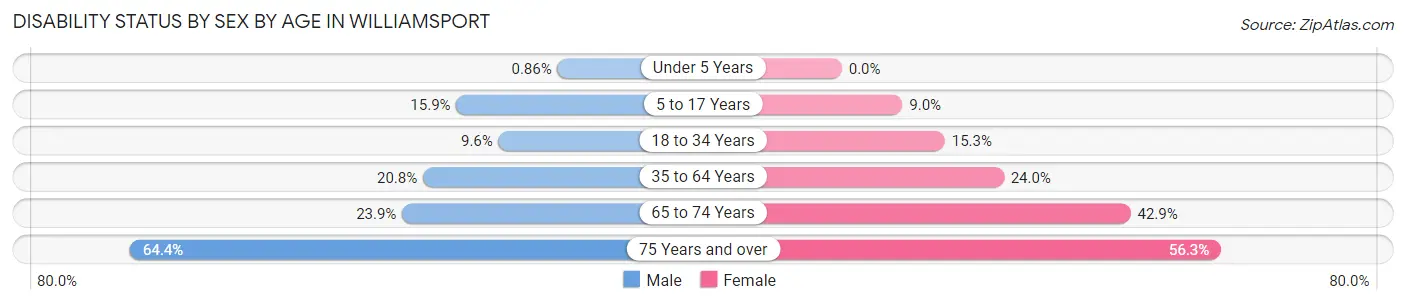
| Age Bracket | Male | Female |
| Under 5 Years | 7 (0.9%) | 0 (0.0%) |
| 5 to 17 Years | 327 (15.9%) | 178 (9.0%) |
| 18 to 34 Years | 513 (9.6%) | 705 (15.3%) |
| 35 to 64 Years | 830 (20.8%) | 967 (24.0%) |
| 65 to 74 Years | 268 (23.9%) | 518 (42.9%) |
| 75 Years and over | 242 (64.4%) | 517 (56.3%) |
Disability Class by Sex by Age in Williamsport
Disability Class: Hearing Difficulty
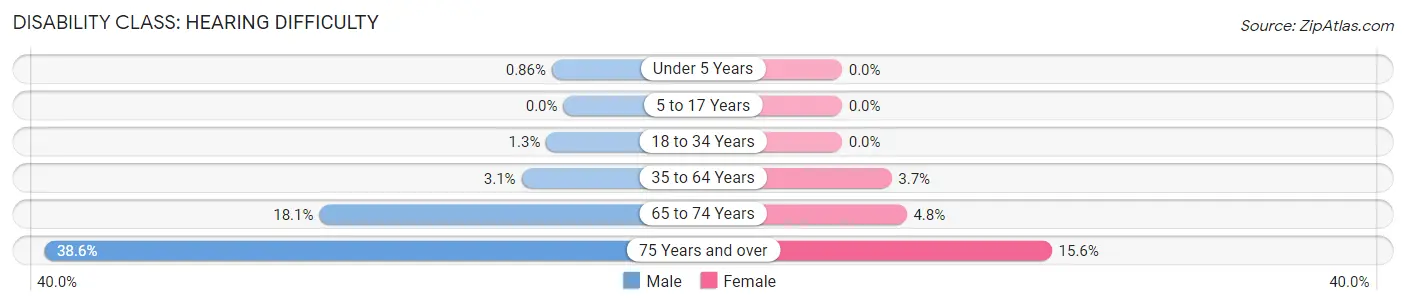
| Age Bracket | Male | Female |
| Under 5 Years | 7 (0.9%) | 0 (0.0%) |
| 5 to 17 Years | 0 (0.0%) | 0 (0.0%) |
| 18 to 34 Years | 68 (1.3%) | 0 (0.0%) |
| 35 to 64 Years | 124 (3.1%) | 148 (3.7%) |
| 65 to 74 Years | 203 (18.1%) | 58 (4.8%) |
| 75 Years and over | 145 (38.6%) | 143 (15.6%) |
Disability Class: Vision Difficulty
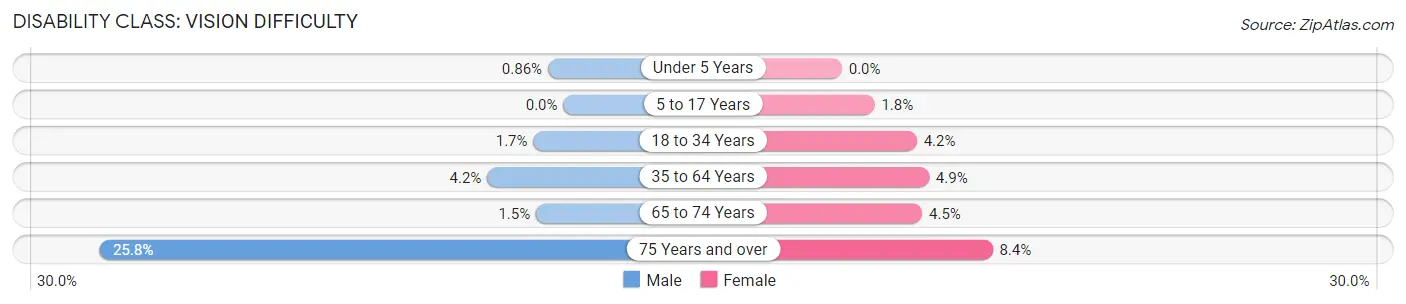
| Age Bracket | Male | Female |
| Under 5 Years | 7 (0.9%) | 0 (0.0%) |
| 5 to 17 Years | 0 (0.0%) | 36 (1.8%) |
| 18 to 34 Years | 89 (1.7%) | 192 (4.2%) |
| 35 to 64 Years | 169 (4.2%) | 195 (4.9%) |
| 65 to 74 Years | 17 (1.5%) | 54 (4.5%) |
| 75 Years and over | 97 (25.8%) | 77 (8.4%) |
Disability Class: Cognitive Difficulty
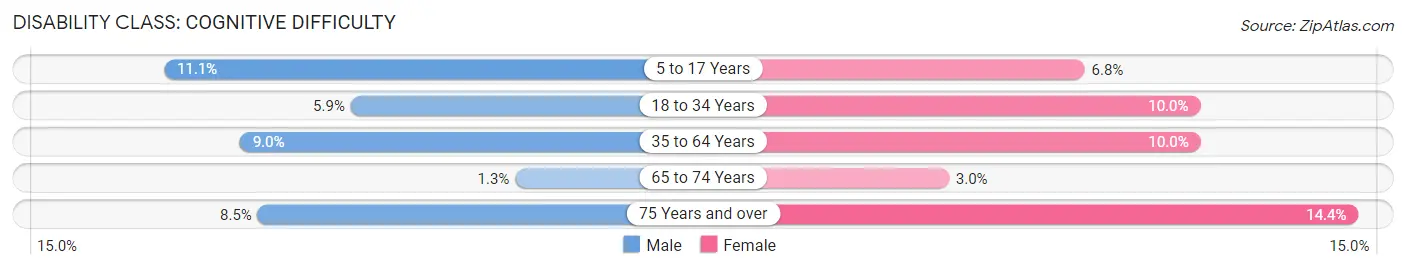
| Age Bracket | Male | Female |
| 5 to 17 Years | 229 (11.1%) | 134 (6.8%) |
| 18 to 34 Years | 316 (5.9%) | 460 (10.0%) |
| 35 to 64 Years | 359 (9.0%) | 402 (10.0%) |
| 65 to 74 Years | 15 (1.3%) | 36 (3.0%) |
| 75 Years and over | 32 (8.5%) | 132 (14.4%) |
Disability Class: Ambulatory Difficulty
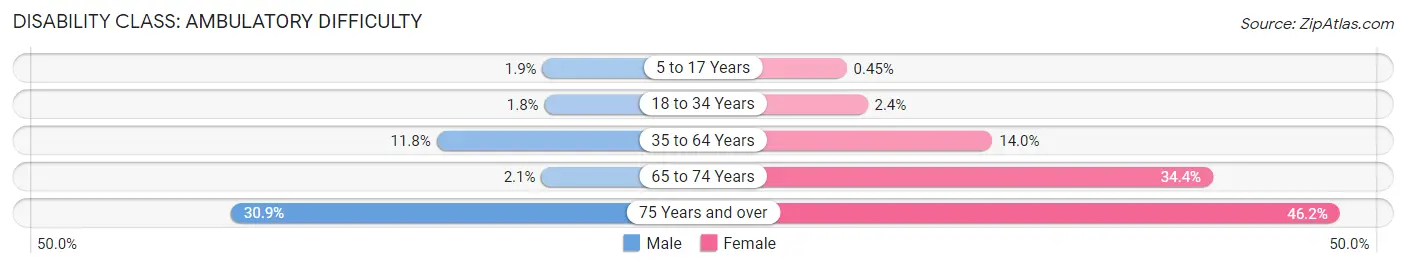
| Age Bracket | Male | Female |
| 5 to 17 Years | 40 (1.9%) | 9 (0.4%) |
| 18 to 34 Years | 94 (1.8%) | 110 (2.4%) |
| 35 to 64 Years | 469 (11.8%) | 562 (14.0%) |
| 65 to 74 Years | 23 (2.1%) | 416 (34.4%) |
| 75 Years and over | 116 (30.8%) | 424 (46.2%) |
Disability Class: Self-Care Difficulty
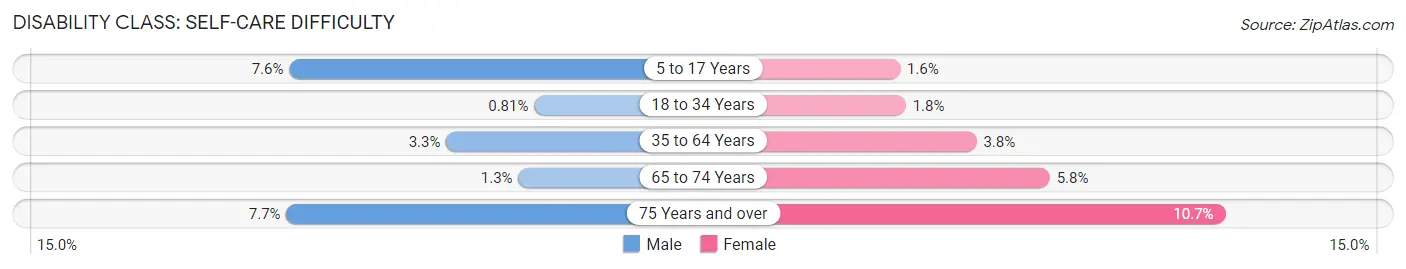
| Age Bracket | Male | Female |
| 5 to 17 Years | 157 (7.6%) | 32 (1.6%) |
| 18 to 34 Years | 43 (0.8%) | 82 (1.8%) |
| 35 to 64 Years | 130 (3.3%) | 151 (3.7%) |
| 65 to 74 Years | 14 (1.3%) | 70 (5.8%) |
| 75 Years and over | 29 (7.7%) | 98 (10.7%) |
Technology Access in Williamsport
Computing Device Access in Williamsport
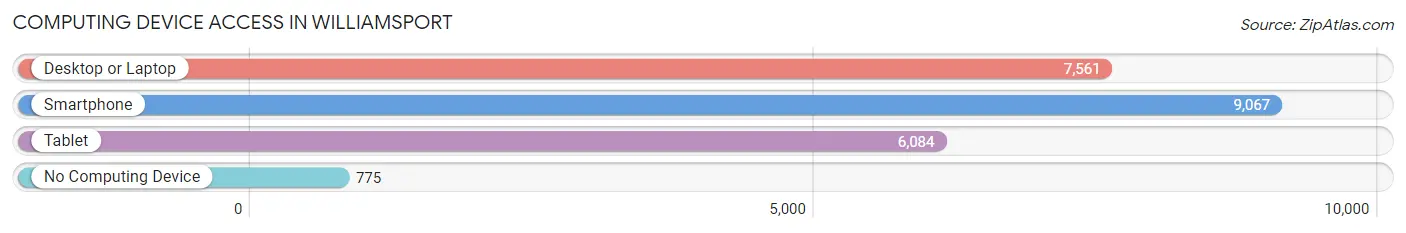
| Device Type | # Households | % Households |
| Desktop or Laptop | 7,561 | 69.6% |
| Smartphone | 9,067 | 83.4% |
| Tablet | 6,084 | 56.0% |
| No Computing Device | 775 | 7.1% |
| Total | 10,866 | 100.0% |
Internet Access in Williamsport
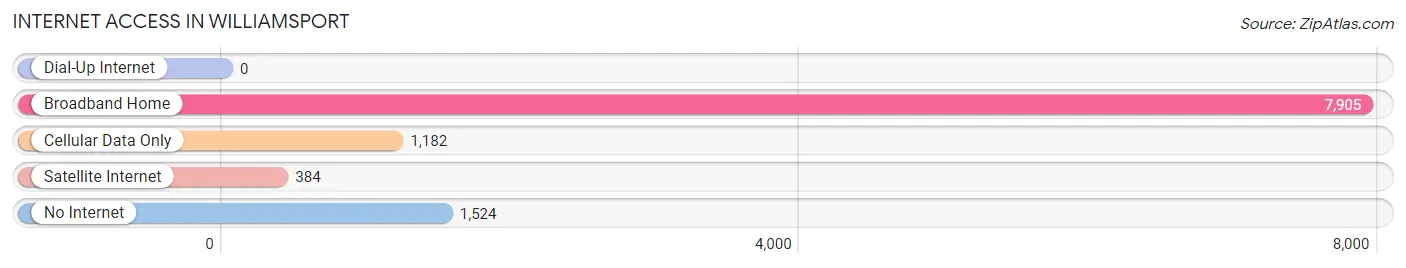
| Internet Type | # Households | % Households |
| Dial-Up Internet | 0 | 0.0% |
| Broadband Home | 7,905 | 72.8% |
| Cellular Data Only | 1,182 | 10.9% |
| Satellite Internet | 384 | 3.5% |
| No Internet | 1,524 | 14.0% |
| Total | 10,866 | 100.0% |
Williamsport Summary
Williamsport, Pennsylvania is a city located in Lycoming County in the state of Pennsylvania. It is the county seat of Lycoming County and is the principal city of the Williamsport, Pennsylvania Metropolitan Statistical Area. The city is located in the Susquehanna River Valley, approximately 78 miles northwest of Philadelphia and 165 miles east of Pittsburgh. As of the 2010 census, the city had a population of 29,381.
History
The area that is now Williamsport was originally inhabited by the Iroquois and Susquehannock Native American tribes. The first European settlers arrived in the area in 1795, and the town was officially founded in 1796. The town was named after William Hepburn, an early settler.
In 1806, Williamsport was incorporated as a borough, and in 1866 it was incorporated as a city. During the 19th century, Williamsport was an important lumber town, and it was the site of the first commercial oil well in the United States. The city was also an important center for the iron and steel industry.
Geography
Williamsport is located at 41°14'N 77°00'W (41.23, -77.00). According to the United States Census Bureau, the city has a total area of 5.7 square miles (14.8 km2), of which 5.6 square miles (14.6 km2) is land and 0.1 square miles (0.2 km2) is water.
The city is located in the Susquehanna River Valley, and the river forms the northern and western boundaries of the city. The city is located in the Appalachian Mountains, and the terrain is generally hilly.
Economy
Williamsport is the economic center of Lycoming County. The city is home to a variety of industries, including manufacturing, healthcare, education, and retail. The largest employers in the city are UPMC Susquehanna, Geisinger Health System, and the Williamsport Area School District.
The city is also home to a variety of small businesses, including restaurants, shops, and galleries. The city is also home to the Little League World Series, which is held annually in August.
Demographics
As of the 2010 census, there were 29,381 people, 11,945 households, and 6,945 families residing in the city. The population density was 5,213.3 people per square mile (2,006.2/km2). There were 13,068 housing units at an average density of 2,310.3 per square mile (894.2/km2). The racial makeup of the city was 90.2% White, 4.9% African American, 0.3% Native American, 1.2% Asian, 0.1% Pacific Islander, 1.3% from other races, and 2.0% from two or more races. Hispanic or Latino of any race were 3.7% of the population.
There were 11,945 households, out of which 25.7% had children under the age of 18 living with them, 38.2% were married couples living together, 14.7% had a female householder with no husband present, and 42.3% were non-families. 35.2% of all households were made up of individuals, and 14.3% had someone living alone who was 65 years of age or older. The average household size was 2.27 and the average family size was 2.94.
In the city, the population was spread out, with 21.7% under the age of 18, 10.2% from 18 to 24, 26.2% from 25 to 44, 22.3% from 45 to 64, and 19.6% who were 65 years of age or older. The median age was 38 years. For every 100 females, there were 87.2 males. For every 100 females age 18 and over, there were 83.2 males.
The median income for a household in the city was $30,817, and the median income for a family was $39,817. Males had a median income of $30,817 versus $22,817 for females. The per capita income for the city was $17,817. About 11.7% of families and 15.2% of the population were below the poverty line, including 22.2% of those under age 18 and 9.2% of those age 65 or over.
Common Questions
What is Per Capita Income in Williamsport?
Per Capita income in Williamsport is $25,962.
What is the Median Family Income in Williamsport?
Median Family Income in Williamsport is $62,214.
What is the Median Household income in Williamsport?
Median Household Income in Williamsport is $48,388.
What is Income or Wage Gap in Williamsport?
Income or Wage Gap in Williamsport is 13.0%.
Women in Williamsport earn 87.0 cents for every dollar earned by a man.
What is Family Income Deficit in Williamsport?
Family Income Deficit in Williamsport is $12,373.
Families that are below poverty line in Williamsport earn $12,373 less on average than the poverty threshold level.
What is Inequality or Gini Index in Williamsport?
Inequality or Gini Index in Williamsport is 0.47.
What is the Total Population of Williamsport?
Total Population of Williamsport is 27,755.
What is the Total Male Population of Williamsport?
Total Male Population of Williamsport is 13,938.
What is the Total Female Population of Williamsport?
Total Female Population of Williamsport is 13,817.
What is the Ratio of Males per 100 Females in Williamsport?
There are 100.88 Males per 100 Females in Williamsport.
What is the Ratio of Females per 100 Males in Williamsport?
There are 99.13 Females per 100 Males in Williamsport.
What is the Median Population Age in Williamsport?
Median Population Age in Williamsport is 30.3 Years.
What is the Average Family Size in Williamsport
Average Family Size in Williamsport is 3.0 People.
What is the Average Household Size in Williamsport
Average Household Size in Williamsport is 2.2 People.
How Large is the Labor Force in Williamsport?
There are 13,471 People in the Labor Forcein in Williamsport.
What is the Percentage of People in the Labor Force in Williamsport?
59.3% of People are in the Labor Force in Williamsport.
What is the Unemployment Rate in Williamsport?
Unemployment Rate in Williamsport is 6.5%.