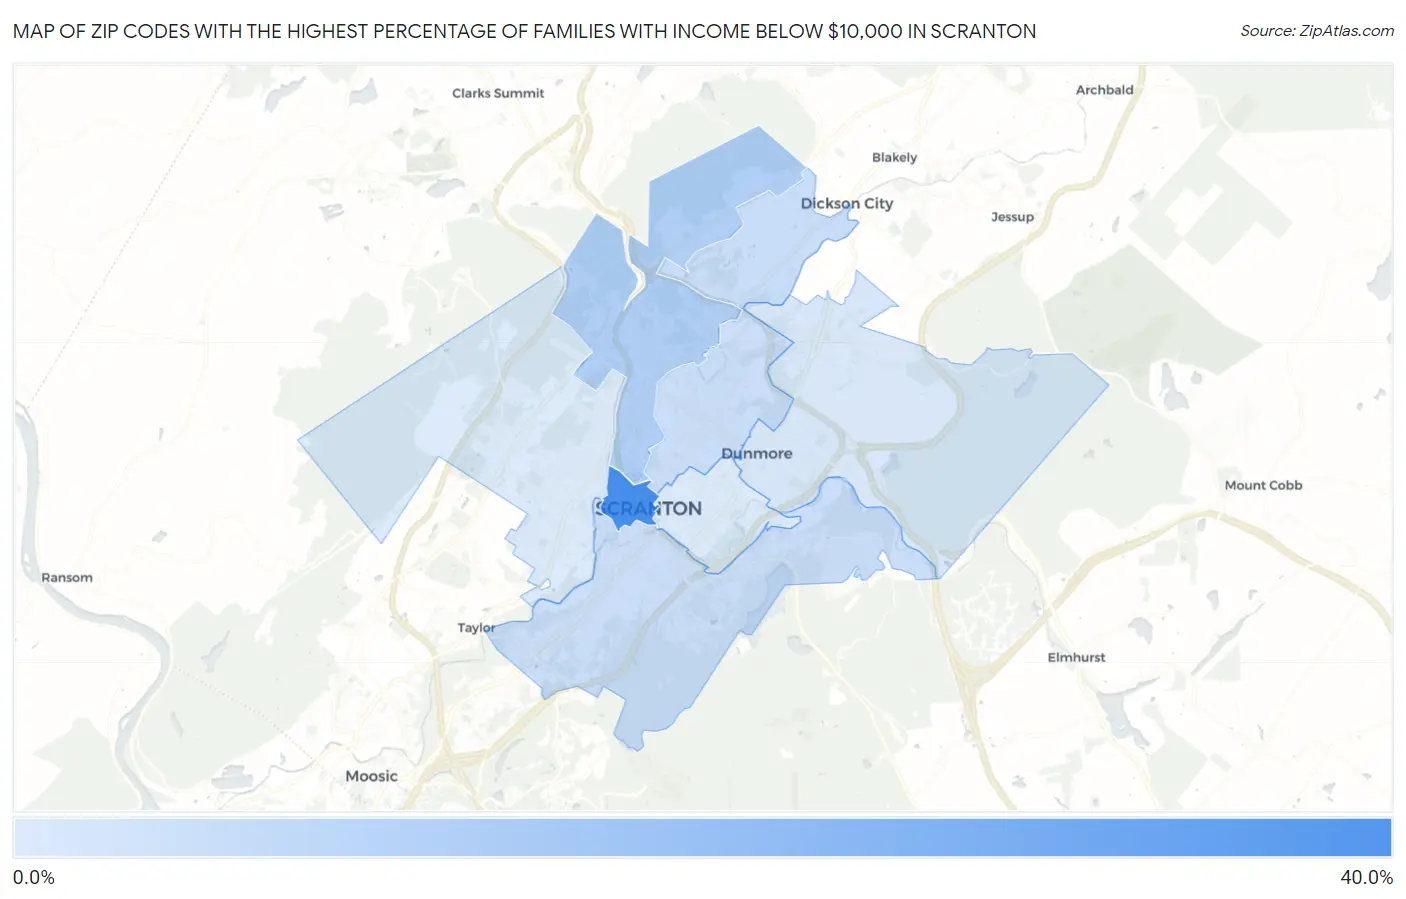
Zip Codes with the Highest Percentage of Families with Income Below $10,000 in Scranton, PA
RELATED REPORTS & OPTIONS
Family Income | $0-10k
Scranton
Compare Zip Codes
Map of Zip Codes with the Highest Percentage of Families with Income Below $10,000 in Scranton
1.8%
32.4%
Zip Codes with the Highest Percentage of Families with Income Below $10,000 in Scranton, PA
| Zip Code | Families with Income < $10k | vs State | vs National | |
| 1. | 18503 | 32.4% | 2.9%(+29.5)#10 | 3.1%(+29.3)#167 |
| 2. | 18508 | 10.1% | 2.9%(+7.20)#68 | 3.1%(+7.00)#1,870 |
| 3. | 18519 | 5.6% | 2.9%(+2.70)#199 | 3.1%(+2.50)#5,214 |
| 4. | 18505 | 5.1% | 2.9%(+2.20)#240 | 3.1%(+2.00)#5,951 |
| 5. | 18509 | 5.1% | 2.9%(+2.20)#241 | 3.1%(+2.00)#5,968 |
| 6. | 18512 | 2.8% | 2.9%(-0.100)#533 | 3.1%(-0.300)#11,954 |
| 7. | 18510 | 1.9% | 2.9%(-1.000)#729 | 3.1%(-1.20)#15,880 |
| 8. | 18504 | 1.8% | 2.9%(-1.10)#759 | 3.1%(-1.30)#16,347 |
1
Common Questions
What are the Top 5 Zip Codes with the Highest Percentage of Families with Income Below $10,000 in Scranton, PA?
Top 5 Zip Codes with the Highest Percentage of Families with Income Below $10,000 in Scranton, PA are:
What zip code has the Highest Percentage of Families with Income Below $10,000 in Scranton, PA?
18503 has the Highest Percentage of Families with Income Below $10,000 in Scranton, PA with 32.4%.
What is the Percentage of Families with Income Below $10,000 in Scranton, PA?
Percentage of Families with Income Below $10,000 in Scranton is 4.8%.
What is the Percentage of Families with Income Below $10,000 in Pennsylvania?
Percentage of Families with Income Below $10,000 in Pennsylvania is 2.9%.
What is the Percentage of Families with Income Below $10,000 in the United States?
Percentage of Families with Income Below $10,000 in the United States is 3.1%.